Embed Size (px)
Citation preview

Leading intimate healthcareRoadshow presentation
FY 2019/20
Making life easier
Ostomy Care, Continence Care, Wound & Skin Care and Interventional Urology
Sustainable growth leadership

Page 2
The forward-looking statements contained in this presentation, including forecasts of sales and earnings performance, are not guarantees of future results and are subject to risks, uncertainties and assumptions that are difficult to predict. The forward-looking statements are based on Coloplast’s current expectations, estimates and assumptions and based on the information available to Coloplast at this time.
Heavy fluctuations in the exchange rates of important currencies, significant changes in the healthcare sector or major changes in the world economy may impact Coloplast's possibilities of achieving the long-term objectives set as well as for fulfilling expectations and may affect the company’s financial outcomes.
Forward-looking statements

31 31
FY 18/19
5,556
FY 19/20
5,854
Back to organic growth in Q4. Solid results for FY 2019/20 despite challenging year due to COVID-19 pandemic
Page 3
• Organic growth of 4% and 3% reported growth in DKK
• FY organic growth negatively impacted by COVID-19, particularly the cancellation of elective procedures in Interventional Urology, WC in China and UK Chronic Care
• Chronic Care business in the US and Emerging markets delivered largely stable underlying growth throughout the year
• Q4 was negatively impacted by flat growth in several countries in Europe due to limited growth in new patients, in particular in the UK Chronic business. Weak quarter in EM due to baseline.
• EBIT before special items grew 5% to DKK 5,854m, corresponding to an EBIT margin of 32% against 31% last year. This reflects strong cost control but also sustained investments in growth opportunities and innovation.
• ROIC after tax before special items1 of 46%2
• Year-end dividend of DKK 13.0 per share proposed bringing total dividend for the year to DKK 18.0 per share
• New “Strive25” strategy presented in September with unchanged long-term financial guidance of 7-9% organic growth p.a and >30% EBIT margin
• Financial guidance for 2020/21:
• Organic revenue growth of 7-8% and 4-5% reported growth in DKK
• Reported EBIT margin of 31-32% in DKK
• Capex of around DKK 1.1bn, effective tax rate of around 23%
2019/20 Highlights
Revenue growth
EBIT1
Reported revenue (DKKm)
Organic growth
FY 19/20Q4 18/19 Q4 19/20 FY 18/19
4618 4,590
17,939 18,544
-1%
+3%
+4%
Reported growth
32
Q4 18/19
32
Q4 19/20
1,479 1,472
EBIT (DKKm)
Reported EBIT margin (%)
EBIT margin in constant currencies (%)
(1) Special items refers to balance sheet items related to the provision in connection with settlements in lawsuits in the USA alleging injury resulting from the use of trans-vaginal surgical mesh products. In Q4 2018/19 special items of DKK 400m included.
(2) Excluding the impact from IFRS 16, ROIC after tax before special items would have been 48% - on par with last year.
+2%
32

Coloplast acquires Nine Continents Medical Inc, an early stage company in the large over-active bladder segment
Page 4
Over-active bladder market Company and product description
• Over-active bladder (OAB) is a condition that causes a frequent and sudden urge to urinate
• +80 million people globally suffer from OAB symptoms
• ~40% of the OAB patient population seek treatment and of those about 3 million patients globally are candidates for 3rd line therapies
• 3rd line therapies include Botox, Percutaneous Tibial Nerve Stimulation (PTNS), and Sacral Nerve Stimulation (SNS)
• Today, the market for 3rd line therapies is approx. USD 1bn in size growing mid-single digits
• ITNS (Implantable Tibial Nerve Stimulator) is an innovative 3rd therapy that provides neurostimulation for the treatment of OAB but is not in the market yet
• ITNS builds on the clinically proven mode of action of PTNS
• Nine Continents Medical Inc is an early stage company pioneering an implantable tibial nerve stimulation treatment for over-active bladder
• The device is an implantable tibial nerve stimulator (ITNS), a miniaturized, self-powered unit placed in the lower leg under local anesthesia during a short, minimally invasive procedure
• The device automatically stimulates the tibial nerve, with no patient activation or recharging or doctor visits
• Coloplast expects to begin pivotal studies in 2021, with the ambition to obtain pre-market approval for a Class III device in the US and EU market approvals in the 2024-2025 timeframe
• The acquisition price consists of a USD 145 million upfront cash payment and an additional contingent future milestone payment
• The acquisition is debt financed using existing credit facilities and has no impact on Coloplast’s dividend policy or long-term financial guidance
Source: Coloplast, clinical publications, industry reports
Transaction

All business areas adversely impacted by COVID-19 in 2019/20 in particular Interventional Urology
Page 5
Other developed markets
Emerging markets
Coloplast Group
European markets
Reported revenueDKKm
FY 19/20 revenue by geography
Organic growthGeographicarea
2%
5%
8%
4%
Continence Care
Interventional Urology
Wound & Skin Care
Ostomy Care
ColoplastGroup
FY 19/20 revenue by business area
6%
6%
-7%
1%
4%
Business area
Reported revenueDKKm
Organic growth
1,835
2,352
7,538
6,819
3,080
10,820
4,644
18,544
Share of organic growth
31%
33%
36%
100%18,544

Ostomy Care grew 6% organically in FY 2019/20, adversely impacted by lower growth in new patients in Europe
Page 6
Ostomy Care performance• Full year organic growth of 6% (reported growth 5%). Q4 organic
growth of 3% (reported growth 0%)
• In Q4, growth was driven by China and the US but negatively impacted by the decline in new patients across Europe and in particular in the UK
• Growth in Emerging markets in Q4 was negatively impacted by timing of tenders in Russia, due to a tough comparison period
• Growth in new patients has been negatively impacted as only the most acute ostomy surgeries have taken place due to COVID-19 with the largest negative impact in Europe and the UK
• Growth in 2019/20 was driven by the SenSura® Mio portfolio, and in particular SenSura® Mio Convex
• Coloplast is the global market leader in Ostomy Care with 35-40% share of a DKK 18-19bn market, growing 4-5% annually
• The ostomy supporting products market is DKK 3bn in size growing 6-8% annually. Coloplast has increased its market share since last year from 30-35% to 35-40%
9
10 10
2
0
7
9
10
4
3
1,907
Q4 19/20Q3 19/20Q4 18/19 Q1 19/20 Q2 19/20
1,849 1,920 1,870 1,841
Reported growth (%) Organic growth (%) Revenues (DKKm)
Comments

Ostomy Care grew 6% organically in 2019/20, adversely impacted by lower growth in new patients across Europe
Page 7
• FY 2019/20 organic growth of 6% (reported growth 6%). Q4 organic growth of 4% (reported growth 2%)
• In Q4, growth was driven by the US, Argentina, Germany and Italy but negatively impacted by lower growth in Europe and mainly the UK due to lower growth in new patients due to COVID-19
• Across the Continence Care business, growth in new patients has been negatively impacted due to the COVID-19 outbreak as only the most acute patient groups such as spinal cord injuries have been treated whereas other patient groups including MS and BPH patients have postponed their treatment
• Growth in 2019/20 was driven by the SpeediCath® intermittent catheters in particular compact and flexible catheters and Peristeen®
• Coloplast is the global market leader in Continence Care and has increased its market share since last year from around 40% to 40-45% share of a DKK 14-15bn market, growing 5-6% annually
CommentsContinence Care performance
9
7
12
2 2
7
6
12
4 4
Q4 18/19 Q3 19/20Q1 19/20 Q2 19/20
1,6491,776
Q4 19/20
1,686 1,680 1,677
Reported growth (%) Organic growth (%) Revenues (DKKm)

Interventional Urology declined 7% organically in 2019/20 due to COVID-19, but almost returned to growth in Q4
Page 8
• FY 2019/20 negative organic growth of -7% (-7% reported growth). Q4 flat organic growth (-3% reported growth)
• Similar to Q3 but to a much lesser extent, Q4 saw a negative impact on growth due to the impact of COVID-19 on elective procedures
• Men’s Health (Titan® penile implants) contributed positively to growth in Q4 as elective procedures recovered in the US. Sales of implantable devices in Women’s Health contributed negatively to growth
• As elective procedures gradually resumed, performance improved during H2 2019/20 with April being the low point down 70% and September ending almost back to growth. Endourology portfolio launched in US starting Q4
• USD 4m equity investment in Francis Medical, an early stage company pioneering urological cancer treatments starting with prostate cancer
• Acquisition of Nine Continents Medical, an early stage company pioneering urological over-active bladder treatment with tibial nerve stimulation (acquisition price consists of USD 145 million upfront cash payment and an additional contingent future milestone payment)
• Global #4 position with ~15% share of a DKK 11-12bn market, growing 3-5% annually
CommentsInterventional Urology performance
493535 507
313
480
1412
5
-3
0
Q4 18/19 Q1 19/20 Q2 19/20
-40-39
Q3 19/20 Q4 19/20
3
119
Reported growth (%) Revenues (DKKm)Organic growth (%)

8
11
5
-6
6
10
4
-6-3
78
-2
-7
1
Q1 19/20Q4 18/19 Q2 19/20 Q4 19/20Q3 19/20
627 584 620556 592
Wound Care delivered 1% organic growth in 2019/20 due to low hospital activity in particular in China due to COVID-19
Page 9
• FY 2019/20 organic growth of 1% in Wound & Skin Care (0% reported growth). Q4 negative organic growth of -3% in Wound & Skin Care (-6% reported growth)
• Q4 organic growth was 1% for Wound Care due to COVID-19 impact on hospital activity in China and EM. Performance improved in Europe in Q4 vs Q3 in part driven by contribution from recently launched Biatain® Fiber
• Growth in 2019/20 was driven by the Biatain Silicone® portfolio
• Skin Care reported satisfactory FY growth despite decline in demand in Q3 due to COVID-19. Growth in Q4 was double-digit
• Contract manufacturing contributed to FY growth, but was impacted by lower demand due to COVID-19. Growth in Q4 was negative
• Global #5 position with a market share of 5-10% in an DKK 22-24bn advanced wound care market with an annual market growth of 2-4%
• The skin care market is an estimated DKK 4-5bn market with an annual market growth of 2-4%. Coloplast holds a market share of 10-15%
CommentsWound & Skin Care performance
Reported growth (%)
Organic growth (%)
Revenues (DKKm)
WC Organic growth (%)

• FY 2019/20 reported revenue increased by DKK 605m or 3% compared to FY 2018/19
• The majority of growth was driven by organic growth contributing DKK 737m or 4% to reported revenue
• Negative drivers related to the COVID-19 pandemic
÷ Negative impact from Interventional Urology
÷ Negative impact from Wound Care in China
÷ Negative impact from lower growth in new patients in Chronic Care in Europe, particularly in the UK
• Foreign exchange rates had a negative impact of DKK
132m or -1% on reported revenue primarily due to the depreciation of the ARS and BRL against DKK partly offset by a positive development in USD and GBP against DKK in the beginning of the fiscal year
FY 2019/20 revenue growth adversely impacted by COVID-19 and depreciation of emerging market currencies
Page 10
CommentsRevenue development(DKKm)
73718,544
17,939
-132
Revenue FY 2018/19 Organic growth Currency effect Revenue FY 2019/20
Growth 3.4%-0.7%4.1%

Currency effect
Reported EBIT
margin FY 18/19
∆ Gross margin
∆ Distribution-
to-sales
EBIT margin FY
19/20 (Constant
Currencies)
31.6
∆ R&D-to-sales
0.00.1
Reported EBIT
margin FY 19/20
31.0
0.4
31.4
-0.2
∆ Other operating
items
-0.2
∆ Admin-to-sales
0.3
• FY 19/20 gross margin of 68% in DKK on par with last year
• Positive impact from GOP4 and the closure of the Thisted factory in June 2019
• Negative impact from product mix due to decline in sales in Interventional Urology in H2, salary inflation and labour shortages in Hungary and extraordinary costs due to COVID-19
• No restructuring costs vs. DKK 43m in restructuring costs in FY 18/19 related to reduction of production employees in DK
• Positive impact of 30 bps from FX on gross margin
• Distribution-to-sales of 29% vs. 29% last year
• In absolute terms, distribution costs increased by only DKK 111m or 2% against last year due to reduced commercial activities and expenses during the COVID-19 outbreak
• The increase reflects further Investments in sales and marketing activities across business areas including digital efforts
• R&D costs were on par with last year in absolute terms
• Other operating income amounted to DKK 29m, against DKK 58m last
year due to a DKK 16m gain on the sale of former production facilities last year
• EBIT increased 5% to DKK 5,854m with a reported margin of 32%, 60bps higher than last year (positive impact of 20 bps from FX)
EBIT margin of 32% in 2019/20 driven by prudent cost management and lower travel & marketing spend
Page 11
CommentsEBIT margin development (%)

FCF driven by solid underlying development in earnings
Page 12
• Free cash flow in FY 2019/20 was DKK 3,858m, up 2% compared to DKK 3,766 in FY 2018/19 not adjusting for mesh payments
• Adjusted for the positive impact of DKK 197m related to the reclassification of lease payments following the adoption of IFRS 16, the free cash flow was down 3%
• Operating cash flow was up 9% to DKK 4,759m compared to DKK 4,357m last year including the abovementioned DKK 197m positive IFRS 16 adjustment. Apart from the adjustment, the positive development was mainly due to an increase in operating profit (EBIT)
• Reported EBIT DKK 298m higher than in FY 2018/19
• NWC-to-sales of 23%, slightly lower than last year of 24%. Inventories increased by DKK 294m due to increased inventory of strategic products. Trade receivables decreased by DKK 219m due to focus on payment terms in particular in Emerging Markets
• CAPEX-to-sales of 5% vs. 4% in 2018/19. The increase was mainly linked to investments in automation, IT and the new factory in Costa Rica
FCF development
1) FCF in 2014/15, 2015/16 and 2018/19 adjusted for Mesh payments. FCF in 2016/17 and 2017/18 adjusted for Mesh payments and acquisitions. Adjustment for Mesh payments includes DKK 500m insurance coverage in 2014/15.2) Cash Conversion calculated as FCF ex. Mesh payments, interest payments, tax payments, M&A and marketable securities relative to EBIT before special items. 3) Cash Conversion is trailing twelve months4) FCF-to-Sales YTD 2018/19: 12%
2027 26 25 23
92 9398 99 98
90
15/1614/15
2,786
16/17 17/18 19/20(3)18/19
21
4,023 4,079 4,058 4,0863,853
FCF (DKKm)(1)FCF-to-Sales (%) Cash Conversion(2)
Comments

Financial guidance for FY 2020/21
Page 13
Tax rate
CAPEX (DKKm)
EBIT margin
Sales growth
Guidance 2020/21 Guidance 2020/21 (DKK)*
7-8%(organic)
4-5%
31-32%
~1.1bn
~23%
Key assumptions
• Phasing of growth expected to be back-end loaded with low single-digit growth in H1 and double-digit growth in H2
• Interventional Urology positively impacted by comparison period in 2019/20• Uncertainty around growth in new patients across Chronic Care in the UK
and other markets particularly in Europe• Uncertainty on resumption of hospital activity in Wound & Skin Care• No current knowledge of significant health care reforms
• Leverage effect on fixed costs e.g. distribution, admin and R&D costs• Global Operations Plan 4 (savings of 50bps) and GOP5 partly offset by
negative impact from wage inflation and labour shortages in Hungary and transfer costs related to transfer of machines to Costa Rica
• Incremental investments of up to 2% of revenue in Interventional Urology, Asia, digital initiatives and sustainability investments
• Prudent approach to costs and lower travel & marketing spend due to COVID-19 situation
• Investments in automation initiatives at volume sites in Hungary in China as part of GOP5
• Establishment of new volume site in Costa Rica• Investments in new machines for existing and new products• IT and Sustainability investments
*DKK guidance is based on spot rates as of November 2nd 2020

Making it easierto be yourself
Stina
Leading intimate healthcareIntroduction to Coloplast
Making life easier
Ostomy Care, Continence Care, Wound & Skin Care and Interventional Urology

Ostomy Care40%
Continence Care37%
Interventional Urology
10%
Wound & Skin Care13%
= Coloplast’s global market position
Group revenue 2019/20 by geography
Coloplast has four business areas all with global sales presence
Page 15
European markets
58%
Other developed markets
25%
Emerging markets
17%
#1
#4
#1
X
DKK18.5bn
DKK 18.5bn
#5
Group revenue 2019/20 by segment

Coloplast specializes in intimate healthcare needs
Page 16
People who have had their intestine redirected to an opening in the abdominal wall
People in need of bladder or bowel management
People with dysfunctional urinary and reproductive systems
Who are our typical users How do we help them?
SenSura® MioOstomy bag
SpeediCath®Flexible male urinary catheter
Titan® OTRPenile implant
Biatain® SiliconeFoam wound dressing
Ostomy Care
Continence Care
Interventional Urology
Wound Care
People with difficult-to-heal wounds

The Chronic Care model secures a predictable revenue stream and stable revenue growth
Page 17
New user Installed base of users
One new patient per year… … secures ~10-30 years of predictable revenue stream
The chronic care user flowChronic Care condition
Stable flow of loyal users
Solid reimbursement
Coloplast group revenues
Organic growth (%)Revenue (DKKbn)
03/04 19/20
10
8 8
10
76
76 6
7
9
7 7 78 8
4
6.1
18.5

Intimate healthcare is characterized by stable industry trends
Page 18
Drivers Limiters
Growing elderly population increases customer base for Coloplast products
Expanding healthcare coverage for populations in emerging markets increases addressable market
Demographics1
2 Emerging markets
1
2
Surgical and medical trends
Healthcare reforms
Earlier detection and cure, eventually reduces addressable market for Coloplasttreatment products
Economic restraints drive reimbursement reforms, introduction of tenders, and lower treatment cost
Coloplast addressable market growth is 4-5%

Coloplast has strong market positions in Europe and great commercial potential outside Europe
Page 19
Ostomy Continence Urology Wound Care
Addressablemarket
Size in DKKGrowth in %
Coloplast regional market shares
Coloplast total market share
Key competitors
Key drivers and limiters
18-19n4-5%
14-15bn5-6%
11-12bn3-5%
22-24bn2-4%
40 - 50%15 - 25%45 - 55%
45 - 55%25 - 35%35 - 45%
20 - 25%15 - 20%5 - 10%
5 - 10%0 - 5%
5 - 10%
35-40% 40-45% ~15% 5-10%
• Ageing population• Increasing access to
healthcare• Health care reforms• Re-use of products outside
Europe
• Ageing population• IC penetration potential• Up-selling• Health care reforms• Commoditization
• Ageing, obesity• Underpenetration• Cost consciousness• Clinical requirements• Less invasive/office
procedures
• Ageing, obesity, diabetes• New technologies• Healthcare reforms• Competition• Community treatment
EuropeDevelopedEmerging

We are building the consumer healthcare company of the future
Page 20
Chronic Care
Commercial modelMacro Trends Impact
Consumer preference
Superior, clinicallydifferentiated
products
Clinicalpreference
Payer preference
Data anddigital tools
Ageing population
Channel consolidation
Healthcare consumerism
Digital transformation
Price pressure

Page 21
Our new strategy will drive continued long-term value creation through revenue and earnings growth
Chronic Care
Interventional Urology
Wound & Skin Care
Talent, Leadership &
Culture
SustainabilityUnparalleled efficiency
Innovation
7-9% organic growth p.a.
more than 30% EBIT margin1
1) Constant currencies, based on FX rate as of September 29, 2020

Supporting sustainable development with a strong emphasis on improving our environmental performance
Our on-going commitment
Responsible operations
Our mission
Making life easier for people with intimate healthcare needs
Our 2025 priority
Improving products and packaging
Our 2025 priority
Reducing emissions
0 emissions from scope 1&2100% renewable energy
80% packaging made from renewable materials50% production waste recycled
DKK 250m1 in investments allocated to sustainability efforts during Strive25
period
1) of which DKK 100m in capex and DKK 150m in operating expenses
We will continue to support organic growth by yearly incremental investments of up to 2% of revenue
Page 23
Key Investment AreasKey Investment Decision Drivers
Economics & Government
MarketAttractiveness
Leadership & Organization
CaseFinancials
✓
✓
✓
✓
We expect to invest up to 2%of revenue in incremental OPEX investments
Innovation
Consumer & Digital
Interventional Urology
Sustainability
Chronic Care USA
Emerging markets incl. China
Time horizon ✓

We will actively pursue M&A opportunities as a lever for long-term growth
Page 24
Portfolio expansion & adjacencies
Early stage technologies
Channel expansion
Large plays
Opportunity based Systematic screening

Page 25
Consumerpreference
Superior, clinicallydifferentiated
products
Clinicalpreference
Payer preference
Data and digital tools
Key enablers
Direct to Consumer
Direct Businesses
Coloplast Consumer Care
We have built key enablers to support the commercial model in our Chronic Care businessesCommercial model
Data & Digital tools

Direct business in Chronic Care serving consumers drives improved outcomes and is a vital component of our growth
Page 26
.MO/TMall
~70%
~30% MS ~10% MS ~5% MS
~15% MS
Direct presence in top 5 markets and strategic rationale
Control and continuity of product supply
1
2
3
4
Improve patient outcomes
Direct access to consumers
Direct relationship with payers
5
Protect patient pathway
Target the full value pool
6
Coloplast Care presence
Size of database 1.8M
# of calls per year 3M
# of samples sent, ‘000 ~750
+30 countrieswith a consumer setup
High single digit growth
rates

We have initiated a very ambitious Clinical Performance Program to tackle the biggest issues users face
Page 27
What really matters to people using catheters? What really matters to people living with a stoma?
93worry about leakage2
%
30of users experience skin irritation at least weekly3
%2 . 7UTIs per user on average every year1
45of users describe UTIs are their greatest challenge in life1
%*
* People answering ‘not being able to walk: 22%’, ‘not be able to travel: 9% ‘
1) Source: Coloplast IC user survey, January 2016 (n=2,942), (Data-on-file) VV-0122794 2) Source: Ostomy Life Study 2016, ECET Coloplast Pre-Event (n=4,235), (Data-on-file) VV-01916193) Source: OC Usage Pattern Study 2015, (Data-on-file) VV-0147638

We have made significant progress across the Clinical Performance Program
Page 28
Pilot studies conducted with successful results
Initial pilot studies indicated positive outcomes
Pivotal study showed non-significant results
Pilot studies conducted with successful results
Additional pilot study to further test the technology in broader setup
Payer pilots to be conducted for reimbursement processes in key markets
Product device design to be optimised
New pilot study to be completed
Pivotal study to be completed
Further pilot studies in progress
Pivotal study to be completed
Digital ostomy solution
New ostomy platform
New catheter platform
Strive25 strategy period ends in 2025Progress as of today
✓
✓
✓
Product launch expected in first half of strategy
period
Product launch expected in first half of strategy
period
Product launch expected in
second half of strategy period
Simultaneously, continue our launch cadence into existing categories within ostomy care and continence care

67.3
17/1815/16 16/17 18/19
68.3
19/20 Long-term
68.1 67.7 68.0
- 0.3%-points
Profitability supported by scalability and efficiency gains enabling additional investments within distribution and R&D
Page 29
Gross margin development, in % of revenue Cost item
Distribution
Admin
R&D
Development, in % of revenue
28-3028.728.1 28.1 29.0 28.7
0.6%-points
3.8 4.0 4.0 4.2 4.1 ~4
0.3%-points
15/16 16/17 17/18 19/2018/19 Long-term
3.93.5 3.7 3.9 3.8 ~4
0.3%-points

Automation, procurement and scale are key to bringingGlobal Operations to the next level
1. Automation to mitigate growth in blue-collar FTE
2. Continuously work with procurement costs and supply risk mitigation
3. Efficiency and scale on global functions
1) FY 2019/20 Cost of goods sold, DKK 5,932m
Page 30
10%
52%
100%
Salary1
(Direct labour)
Materials1(RM & SFG)
Production costs1
• Expand supplier base• Reduce risk of supply
disruptions• Increase competitive pressure
• Implement new materials• Run sourcing tenders
~500
19/20
>1,000
20/21 21/22
~200
22/23
~800# of FTE releasethrough automation
DKK ~450mCAPEX investment over four years (19/20 – 22/23)
• Keeping FTEs stable, while increasing production output
0%
Global functions
Volume output
Costs levels to remain at current levels
Like–for-like material costs
DKK
time
0%

A global Business Support and IT landscape enables Coloplast to scale faster and more efficiently
Page 31
Global Business Services
Source: Coloplast
Global business services handle the majority of all global support
Examples of current implementation casesGlobal IT
landscape (ERP, CRM etc.)
Global IT infrastructure
Global Business Support Centre
IT infrastructure & support
Sales order taking/management
Finance/accounting
Master Data
Lead handling(DTC/Coloplast Care)
HR support
~90%
100%
100%
100%~70%
100%
Sales subsidiary(Portugal)
New manufacturing(Costa Rica)
M&A/Direct
% of group processes

EBIT margin development continues to be a function of growth, scalability, cost discipline and investment activity
Page 32
EBIT margin (%) Future drivers of EBIT margin
1) Constant exchange rates
~31%
Reported EBIT margin FY 19/20
∆ Gross margin Leverage effect/scale
on fixed costs
Incremental investments
EBIT margin FY 24/251
EBIT will be positively impacted by:
+ Leverage effect on fixed costs e.g. distribution, admin and R&D costs especially driven by Europe
EBIT will be negatively impacted by:
÷ Investments in P/L (Commercial & R&D)
Incremental investment of up to 2% of revenue per year
ILLUSTRATIVE
>30%

Continued strong development in free cash flow during the Strive25 strategy period
Page 33
CAPEX DKKm
CAPEX in % of revenue
Depreciation in % of revenueNet working capital in % revenue
Net working capital CAPEX(2)
Reported tax rate
Taxation
1) Impacted by provision for Mesh litigation2) Gross investments in PPE & intangibles
23% 23% 23% 23% 23% ~23%
15/161 17/1816/17 19/2018/191 Long term
16/17
23%
15/16 17/18
23% 24%23%
18/19
23%
19/20
~24%
Long term
649 685 669 636
931
6%
19/20
4%
Long term
4%
17/18
4%
18/19
4%
4%
15/16 16/17
4%4%
4%
4% 5%
5%
• DK statutory corporate tax rate lowered to 22% in 2016
• Coloplast tax rate expected to be ~23% going forward
• Net working capital expected to be stable, impacted by:
• Growth in mature markets
• Growth in Emerging markets which have long credit times
• Increasing inventory levels on strategic products and raw materials
• Continued investment in machines and capacity expansion
• Widen factory footprint – 2 factories planned in Costa Rica
• GOP5 investments – focus on Automation
• IT investments
• Sustainability investments

• Coloplast returns excess liquidity to shareholders in the form of dividends and share buy-backs
• Dividend is paid twice a year – after the half-year and full-year financial reporting
• Total dividend of DKK 18 per share for 2019/20 compared to DKK 17 per share for 2018/19
• Interim dividend of DKK 5.0 per share for a total interim dividend of DKK 1,064m
• Dividend of DKK 13.0 per share to be proposed at 2020 AGM
• Share buy-back program of DKK 500m was launched in Q2 19/20 and completed in Q4 19/20
We will continue to provide attractive cash returns despite large investments in commercial and expansion activities
Page 34
500 500 500 500 500
77
8488 86
80
91
100
015/16 16/17
3,898
18/1917/18 19/20 Long-term
3,1503,364
3,7884,112
Share buy-back (DKKm)Dividends paid out in the year (mDKK) (1) Pay-out ratio (%) (2)
Coloplast cash distribution to investors
1) Dividends paid out in the year are the actual cash payments of which the majority relates to dividend proposed in the previous financial year. 2) Pay-out ratio calculated as dividend proposed in the financial year/Net profit for the financial year. Pay-out ratio for 2018/19, 2015/16, 2014/15 and 2013/14 is before special items related to Mesh litigation.
Comments

In sum, we believe Coloplast can continue to deliver stable shareholder returns through ...
Page 35
• Stable market trends in our Chronic Care business
• Strong Coloplast Care retention program and innovative DtC
activities
• Increased focus on growing the business outside Europe
• Additional improvements in manufacturing by leveraging on
global operations footprint
• European leverage will provide funds for further investments in
sales initiatives
• Resulting in strong free cash flow generation and high return on
invested capital
Comments
10/11
10%
9%
06/07 16/1708/09 14/15
32%
12/13 18/19
4%
19/20
Organic growth EBIT Margin²
12/13 18/1910/1106/07
5%
6%
16/1708/09 14/15
21%
46%
19/20
FCF to sales(1) ROIC after tax (2)
1) FCF adjusted for Mesh payments in 2013/14, 2014/15, 2015/16, 2016/17, 2017/18, 2018/19 and acquisitions in 2016/17 and 2017/18. Adjustment for Mesh payments includes DKK 500m insurance coverage in 2013/14 and 2014/15 combined. 2) Before special items. Special items 2013/14 include DKK 1bn net provision. Special items 2014/15 include DKK 3bn provision. Special items 2015/16 include DKK 0.75bn provision. Special items 2018/19 include DKK 0.4bn provision

Leading intimate healthcareAppendices

The Coloplast share (COLO-B.CO)
Coloplast share listed on Nasdaq Copenhagen since 1983
~200 billion DKK (~33 billion USD) market cap @ ~931 DKK per share (incl. A shares)
Two share classes:
• 18m A shares carry 10 votes (family)
• 198m B shares carry 1 vote (freely traded)
• Free float approx. 54% (B shares)
Page 37
Note: Share capital ownership as per June 20201) Holders of A shares and family hold 69% of the votes in Coloplast
Share Capital Ownership
46%
37%
4%
11%
2%
Holders of A shares and family1
Foreign institutionals Other shareholders
Danish institutionals
Coloplast A/S

Capital structure
• Overall policy is that excess liquidity is returned to shareholders through a combination of dividends and share buy-backs
• Interest bearing debt will be raised in connection with a major acquisition or other special purposes
• Share buy-backs of DKK 500m per year
expected
• Bi-annual dividends
• Interest-bearing net debt of DKK 1,162m at 30 September 2020
Page 38
Comments Net interest bearing debt
1) Before special items. Special items Q2 2013/14 includes DKK 1bn net provision. Special items Q4 2014/15 includes DKK 3bn provision. Special items Q4 2015/16 includes 0.75bn provision. Special items Q4 2018/19 includes 0.4bn provision.
-813
826 754539
16/17
-0.2x
15/16
0.1x
17/18
0.1x 0.1x
18/19 19/20
0.2x
1,162
NIBD/EBITDA(1) NIBD (DKKm)

Q4 returned to growth but all business areas and regions are still negatively impacted by COVID-19
Page 39
Other developed markets
Emerging markets
Coloplast Group
European markets
Reported revenueDKKm
Q4 19/20 revenue by geography
Organic growthGeographicarea
0%
8%
1%
2%
Continence Care
Interventional Urology
Wound & Skin Care
Ostomy Care
ColoplastGroup
Q4 19/20 revenue by business area
3%
4%
0%
-3%
2%
Business area
Reported revenueDKKm
Organic growth
480
592
1,841
1,677
728
2,652
1,210
4,590
Share of organic growth
8%
85%
7%
100%4,590

• Q4 2019/20 reported revenue decline by DKK 28m or -1% compared to Q4 2018/19
• Q4 organic growth of 2% or DKK 104m
• Drivers related to the COVID-19 pandemic
÷ Flat growth in Interventional Urology
÷ Negative impact from Wound Care in China and wider EM region & Contract manufacturing
÷ Negative impact from flat growth in several countries in Europe due to limited growth in new patients, in particular in the UK Chronic business
• Foreign exchange rates had a negative impact of DKK
132m or -3% on reported revenue primarily due to the depreciation of the USD and BRL against the Danish kroner
Q4 2019/20 reported revenue declined -1% due to significant depreciation in USD and Emerging market currencies
Page 40
CommentsRevenue development(DKKm)
104
Revenue Q4 2018/19 Organic growth
-132
Currency effect Revenue Q4 2019/20
4,6184,590
Growth -0.6%-2.9%2.3%

∆ R&D-to-sales
32.1
∆ Other operating
items
Currency effect
EBIT margin Q4
19/20 (Constant
Currencies)
0.2
32.0
-0.2
-0.20.1
0.2
∆ Admin-to-sales
∆ Distribution-
to-sales
32.3
Reported EBIT
margin Q4 19/20
0.2
∆ Gross margin
Reported EBIT
margin Q4 18/191
• Q4 gross margin of 69% in DKK compared to 69% last year
• Positive impact from savings from the Global Operations Plan 4
• Negative impact from product mix due to decline in sales in
Interventional Urology, salary inflation and labour shortages in Hungary
• Extraordinary costs related to COVID-19 outbreak
• Negative impact of 20 bps from FX
• Distribution-to-sales of 29% on par with last year
• In absolute terms, distribution costs declined by DKK 17m or -1% against Q4 last year due to reduced commercial activities and travel and marketing expenses during the COVID-19 outbreak
• Admin expenses declined DKK 7m or 4% against Q4 last year due to phasing of expenditures
• R&D expenses grew DKK 10m or 6% against Q4 last year
• EBIT before special items declined DKK 7m to DKK 1,472m with a reported margin of 32%, 10bps higher than last year (negative impact of 20 bps from FX)
EBIT in Q4 was on par with last year due to lower revenues but continued prudent cost control
Page 41
CommentsEBIT margin development (%)
1) Before special items. Special items Q4 2018/19 includes 0.4bn provision
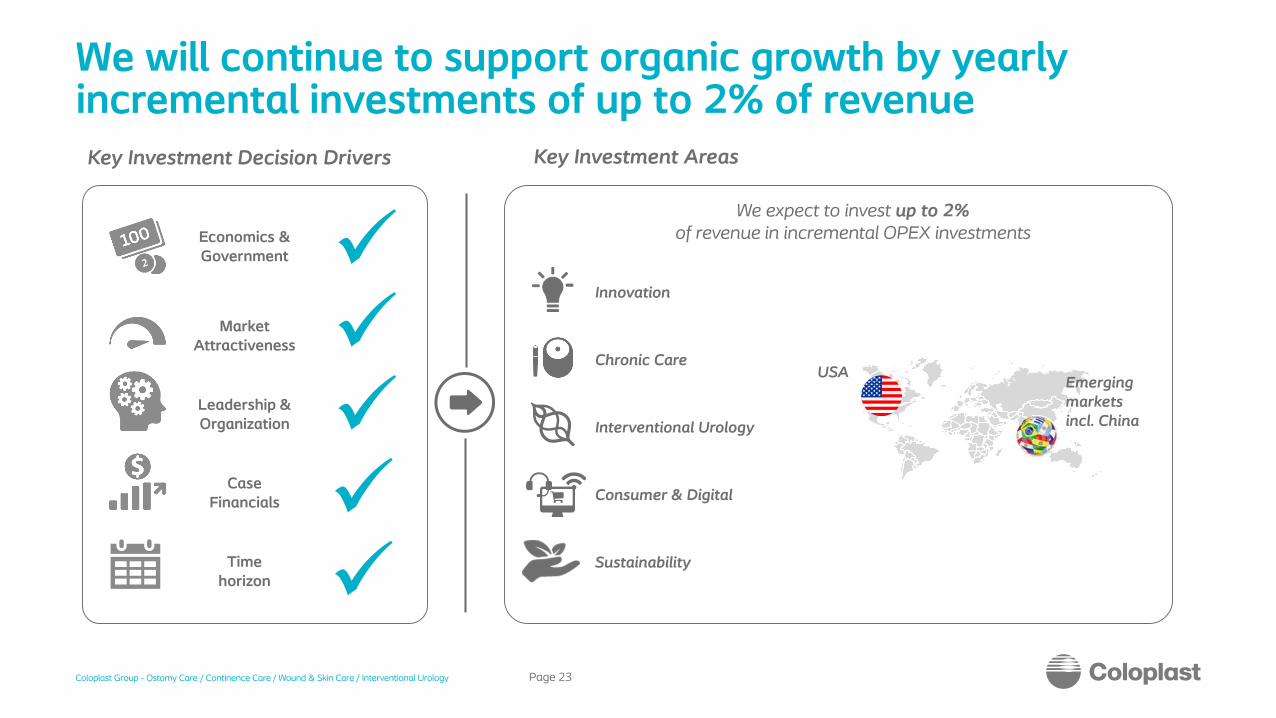
Key Value Ratios
Page 42
Free Cash Flow driversProfitability drivers
1) Before special items. Special items Q4 2014/15 includes DKK 3bn provision. Special items Q4 2015/16 includes 0.75bn provision. Special items Q4 2018/19 includes 0.4bn provision 2) Gross CAPEX including investment in intangible assets
15/16
31.9
28.7
31.7
3.8 4.0
3.5
28.1
3.7
28.1
16/17
4.0
32.7
3.93.9
28.7
17/18
4.2
32.3
29.0
18/19
4.1
32.0
3.8
19/20
Admin-to-Sales (%)
Dist-to-Sales (%)COGS-to-Sales (%)
R&D-to-Sales (%)
25.2
34.6
16/17
23.8
4.4
36.6
5.0
15/16
4.4
36.3
23.4
4.1
34.7
17/18
23.6
3.5
18/19
23.4
36.2
19/20
CAPEX-to-Sales (%)(2)
NWC-to-Sales (%) EBITDA margin (%) (1)

Coloplast revenue development by business area
Page 43
Ostomy Care
Continence Care
Interventional Urology
Wound & Skin Care
8
5
9
67
5 8
6
3
7 7
6,8199
16/17(1)15/16 19/20
8
17/18 18/19
5,182
6,459
5,5435,926
9 10
10
-7
10 10
6
13
-7
1,641
17/18
1,497
15/16 18/1916/17 19/20
101,740 1,970 1,835
6
38
1
4
0
10
0
17/1816/17
5
15/16 18/19 19/20
2,067 2,143 2,140 2,344 2,352
Organic growth (%)Reported growth (%)Revenue (DKKm)
1) Excluding one-off revenue adjustment related to incorrect management of a contract with U.S Veterans Affairs
9
7
9
76
76
6
8
5
15/16 16/17 18/1917/18
5,935
19/20
6,291 6,6437,5387,166

Coloplast group
Other Developed Markets
Coloplast revenue development by geography and total
Page 44
Europe
Emerging Markets
4 2
6 6
2
6 5
5 6
16/17
9,394
18/1915/16 17/18 19/20
9,213 9,941 10,573 10,820
8
15
4
16
6
6
811
5
19/20
114,644
16/17(1)15/16 17/18 18/19
3,177 3,642 3,791 4,380
8
13
5
3
14 1412
810
13
18/19
2,986
15/16 16/17 19/2017/18
2,291 2,582 2,717
3,080
6 66
9
3
7 7 8
84
15/16 16/17 19/2017/18 18/19
15,52814,68116,449
17,939 18,544
Organic growth (%)Reported growth (%)Revenue (DKKm)
1) Excluding one-off revenue adjustment related to incorrect management of a contract with U.S Veterans Affairs

Segment operating profit (Excludes shared/non-allocated costs)
Page 45
Chronic CareOstomy and Continence Care
Wound & Skin CareInterventional Urology
1) Includes DKK 90m one-off revenue adjustment related to incorrect management of a contract with U.S. Veterans Affairs
6057 59 59 57
2,0472,083
Q4 18/19 Q1 19/20 Q2 19/20 Q3 19/20
2,168 2,092
Q4 19/20
2,011
Segment Operating Profit Margin (%)Segment Operating Profit DKKm
170
79
19934
37 35
25
41
179
Q4 19/20Q1 19/20
197
Q4 18/19 Q2 19/20 Q3 19/20
250225
248230 238
40 39 40 41 40
Q1 19/20Q4 18/19 Q4 19/20Q2 19/20 Q3 19/20
60 60 58 57 58
7,344
FY 18/19FY 17/18FY 15/16 FY 16/17
6,716 6,9917,798
FY 19/20
8,318
533624 653
728654
3638 38 37 36
FY 18/19FY 15/16 FY 16/17 FY 19/20FY 17/18
790 822 826914 941
38 38 39 39 40
FY 17/18 FY 18/19FY 15/16 FY 19/20FY 16/17(1)
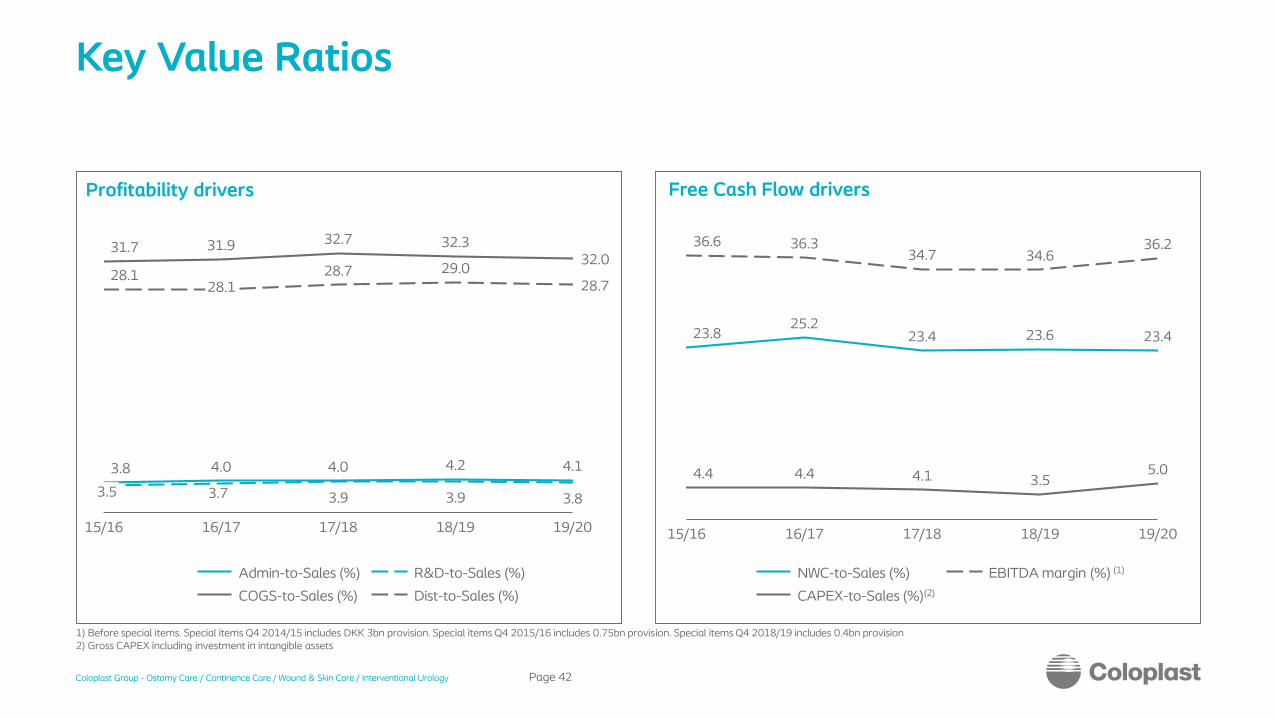
Exchange rate exposure FY 2020/21 and hedging policy
Page 46
Foreign exchange rate guidance for 2020/21
-410
-280
-170
-190
1000
GBP
USD
HUF
Revenue (DKKm) EBIT (DKKm)
12 months exposure from 10% initial exchange rate drop(1)
36%
20%
14%
13%
17%
CNY, JPY, AUD, BRL & ARS
EUR
USD
GBP
Other
Revenue FX exposure 2020/21(1)
To achieve the objective of a stabile income statement we hedge:
• Key currencies e.g., USD, GBP, HUF using forward contacts and options. Not EUR.
• On average 10-12 months• Selected balance sheet items in
foreign currency and part of the expected rolling 12-month cash flows
• Taking risk. vs. cost of hedging into consideration
Hedging Policy
1) Average exchange rate from 1 October 2019 to 30 September 2020.2) The exchange rates for ARS are the exchange rates are closing rates for the period. The hyperinflationary economy in Argentina entails that revenue denominated in Argentinian Peso must be adjusted for inflation
and be translated at the exchange rate of the balance sheet day (closing rate).
CurrencyAverage exchange rate
2019/20(1)
Spot rate, 2 November
2020
Change in estimated
average exchange rate
compared with last
year
Average exchange rate
for 2018/19
Average exchange rate
for 2019/20
Change in average
exchange rates for
compared with same
period last year
Key currencies:
USD 667 640 -4% 662 667 1%
GBP 850 826 -3% 844 850 1%
HUF 2.17 2.03 -6% 2.31 2.17 -6%
Other selected currencies:
CNY 95 96 0% 96 95 -1%
JPY 6.18 6.11 -1% 6.01 6.18 3%
AUD 452 449 -1% 466 452 -3%
BRL 141 112 -21% 171 141 -18%
ARS(2) 8 8 -2% 12 8 -30%
US Mesh litigation – Overview of financial impact
Page 47
P&L Balance Cash flowAssets
Liabilities
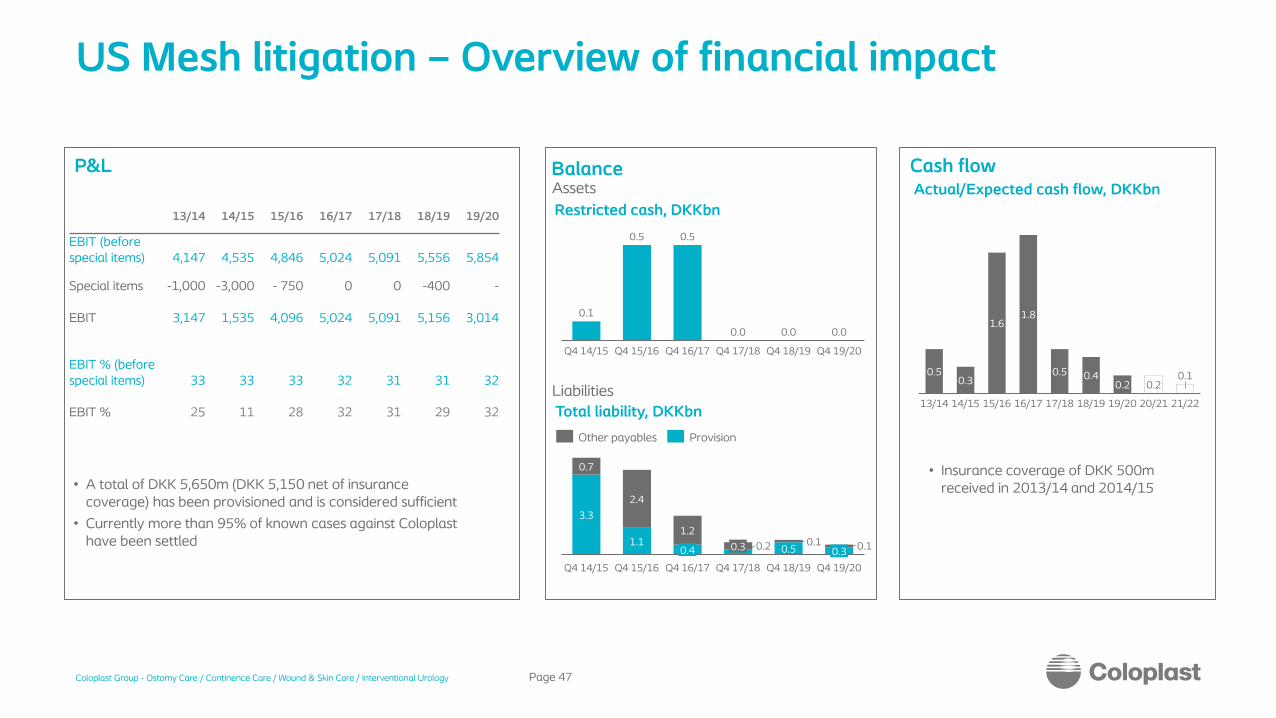
• Insurance coverage of DKK 500m received in 2013/14 and 2014/15
Restricted cash, DKKbn
Total liability, DKKbn
Actual/Expected cash flow, DKKbn
1.2
Q4 15/16Q4 14/15 Q4 19/20
0.7
3.3
2.4
1.10.4
Q4 16/17
0.3 0.2 0.1
Q4 17/18
0.10.5
Q4 18/19
0.3
Other payables Provision
Q4 15/16
0.0
Q4 14/15 Q4 16/17 Q4 17/18
0.1
Q4 19/20Q4 18/19
0.5 0.5
0.0 0.01.6
20/21
0.30.5
0.2
13/14 14/15 16/17 21/2218/1915/16
1.8
0.5
17/18
0.4 0.10.2
19/20
• A total of DKK 5,650m (DKK 5,150 net of insurance coverage) has been provisioned and is considered sufficient
• Currently more than 95% of known cases against Coloplast have been settled
13/14 14/15 15/16 16/17 17/18 18/19 19/20
EBIT (before special items) 4,147 4,535 4,846 5,024 5,091 5,556 5,854
Special items -1,000 -3,000 - 750 0 0 -400 -
EBIT 3,147 1,535 4,096 5,024 5,091 5,156 3,014
EBIT % (before special items) 33 33 33 32 31 31 32
EBIT % 25 11 28 32 31 29 32

Page 48
Health reform landscape
• U.S.: Reimbursement pressure on OC and CC (Managed Care)
• Brazil: Macroeconomic and political challenges
• Russia: Macroeconomic and political challenges
Stable reform environment
Intensifying reform pressure
Europe
• Greece: Reimbursement pressure on all BAs
• Germany: Reimbursement pressure on WC
• Netherlands: Reimbursement pressure on OC and CC
Rest of World

CARE helps us increase retention and improve product compliance
Website with reliable advice and useful self assessment tools 24/7
Page 49
- ERP
- CRM
- CMS
Clinically validated content and call protocol
Data shared with clinicians
Self-assessments to identify struggling users
News, tips and inspiration directly in email or mailbox
Advisors available on phone
Free product and supporting products
samples
We co-develop CARE content with local clinicians
CARE is a personal and “high-touch” program
Global program with shared infrastructure

With our DtC marketing program we reach into the community
Page 50
…and with the reach we get several benefits We operate in numerous channels to expose our service and product offering…
Ensureproduct accessibility
Ensure successful experience
Exposeinnovative products

The generic model for distribution and reimbursement of our products
Page 51
ConsumerDistributionPayer
Product
Prescription & Insurance
Prescription & Insurance
Reimbursement price
Product$
.

Interventional Urology at a GlanceFY 18/19
Interventional Urology
Rest of Coloplast business
11%of Coloplast sales
~2billion DKKannual sales
Endourology
Women’s Health
North America Europe
Rest of World
Revenue by Business AreaDKKm, FY 18/19
Revenue by regionDKKm, FY 18/19
Men’s Health
Bladder Health
Organic revenue growth vs. market growth by business areaOrganic growth, % 18/19
Endourology Bladder Women’s HealthMen’s Health
~15% market share in global market of DKK 12-13bn market
growing 3-5% annually
Market1 Coloplast
Men’s Health Women’s HealthEndourology Bladder Health
#2 #3#2
In EU#2
In EU
Market size, DKKbn~5
~3~2 ~3
Coloplast position, FY 18/19
Interventional Urology’s revenue is balanced geographically and across the four business areas
Page 52

• Bladder Drainage
• Benign prostatic hyperplasia (BPH) management
• Laparoscopic Procedures
• Stress Urinary Incontinence (SUI)
• Pelvic Organ Prolapse (POP)
• Erectile Dysfunction
• Male Incontinence
• Testicular Replacement
• Peyronie's Repair
• Stone Management
• Transurethral
• Percutaneous
SPECIALTY INTERVENTIONS
WOMEN’SHEALTH
MEN’SHEALTH
ENDOUROLOGY
Coloplast Interventional Urology is split into four business areas
Page 53
Inflatable Penile Prosthesis
Testicular Prosthesis
Male Slings Slings Biologic grafts
Single Use Cystoscope
No-Tip for stone retrieval device
Double Loop Ureteral Stent
Prostate and bladder chips evacuator
Disposable suction / irrigation device
Foley catheter – Folysil
Surpapubic drainage –Cystodrain, Supraflow, Uristil
Se
lect
pro
du
cts
Source: Company information
Pericardium allograft tissue
Meshes
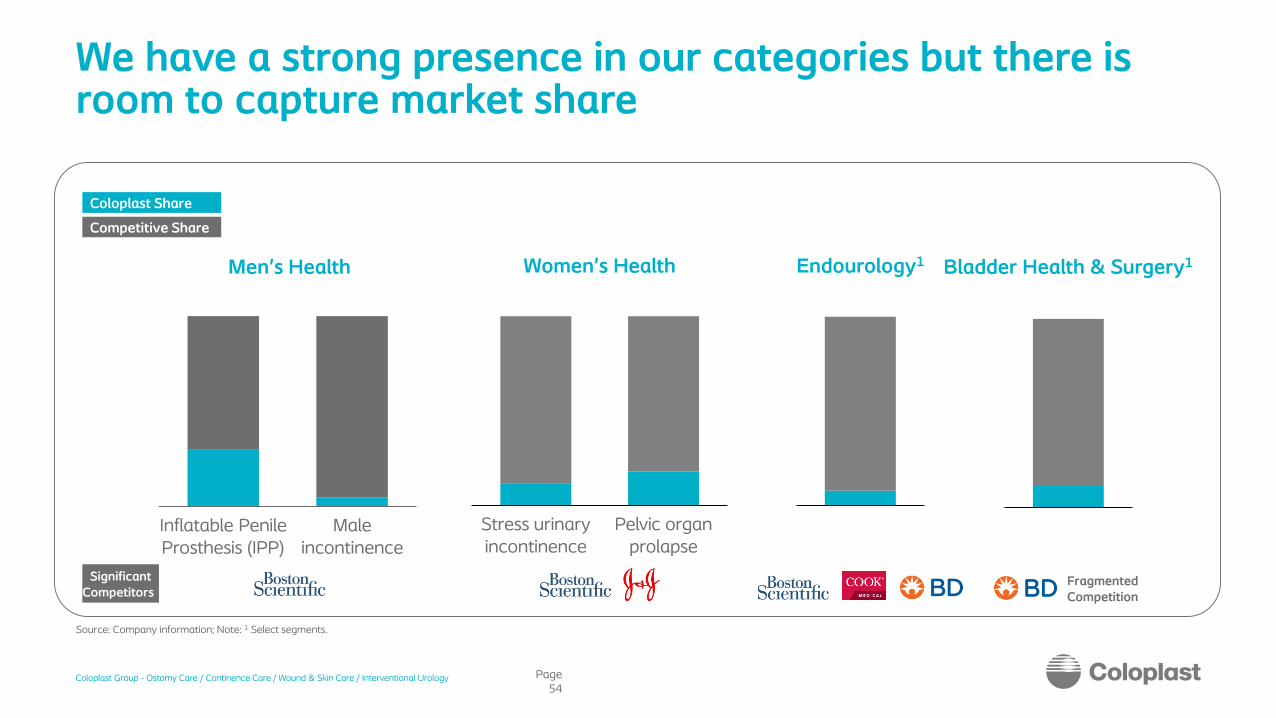
Inflatable Penile Prosthesis (IPP)
Male incontinence
35-45%
10-15%
35-45%
30-35%
15-20%
<5%
<5%
Men’s Health
Source: Company information; Note: 1 Select segments.
Stress urinary incontinence
Pelvic organ prolapse
We have a strong presence in our categories but there is room to capture market share
Page 54
Women’s Health
Competitive Share
Coloplast Share
SignificantCompetitors
Endourology1 Bladder Health & Surgery1
Fragmented Competition

The global Advanced Wound Care market remains large and growing despite a challenging 19/20
1) In 19/20, the AWC market declined by -0,5% and has an expected growth rate of 1-3% for 20/212) Includes Alginates & Gelling Fibers
Page 55
Europe
US
RoW
The Advanced Wound Care market remains a significant value pool and is expected to grow despite the pandemic
Source: SmartTRAK, GHX and Cosa
22-24 DKKbngrowing 1-3%1
Silicone Foams and Gelling Fibers are the two biggest categories and grow faster than the market
~45% of the market
Silicone Foams and Gelling Fibers hold
6-8(4-6%)
Silicone Foams
2-4(2-4%)
Gelling Fibers 2
10-12(0-1%)
Others
Market size in DKKbn
22-24 DKKbngrowing 1-3%1
Period analysed: MAT Q3 19/20

The Wound & Skin Care 2025 strategic plan
Page 56
Scale our China businessby strengthening our commercial foundation and accelerate in silicone with 3DFit Technology
Scale our US businessin Acute channel with 3DFit Technology and maximise potential Wound & Skin Care portfolio
Lead with 3DFit Technologythrough new marketing and portfolio initiatives
Launch new pipelineIncluding Biatain Fiber to close portfolio gaps and ensure strong lifecycle management
Build on positive momentum in EU in silicone and 3DFit Technology and increase share of voice in selected markets
Accelerate growth in key EM marketsby investing in specific local opportunities
Seek for accelerationby exploring inorganic opportunities
Margin upliftOptimise sales mix and product profitability
SUSTAINABLE
GROWTH
LEADERSHIP
In US Ostomy Care, innovation is the biggest growth driver and we continue to win across patient pathway
Page 57
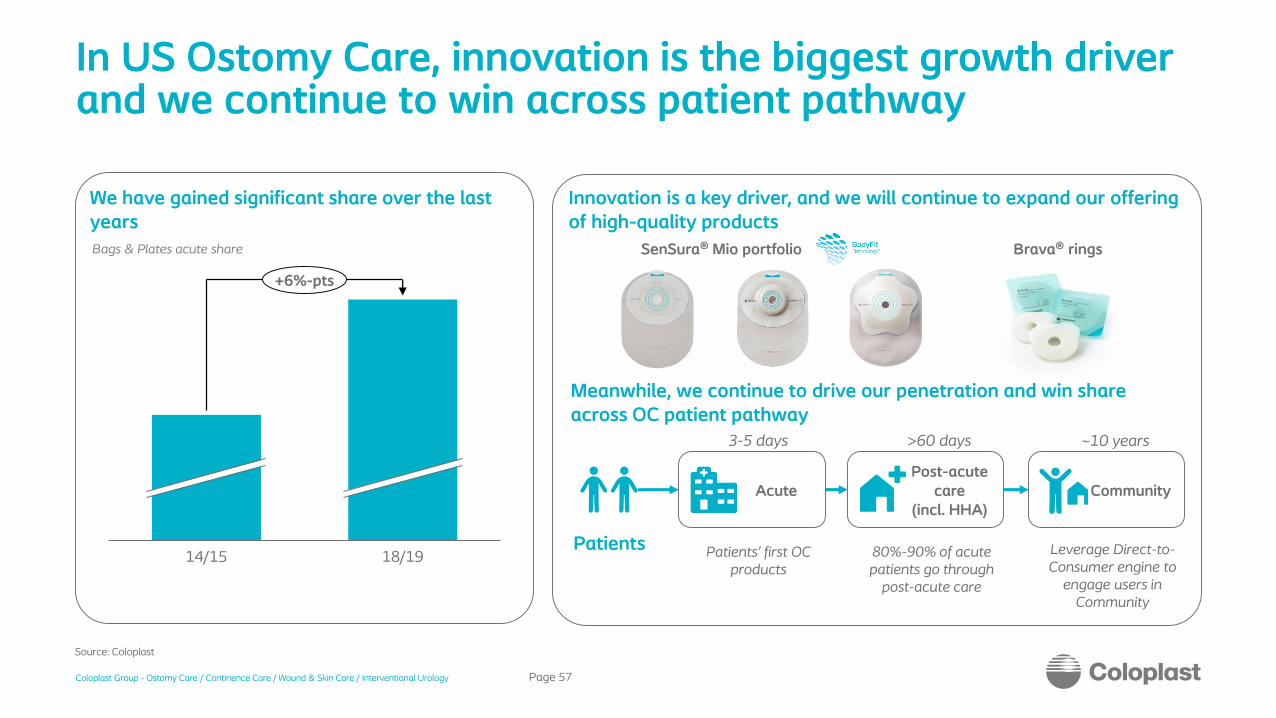
We have gained significant share over the last years
Innovation is a key driver, and we will continue to expand our offering of high-quality products
Source: Coloplast
Meanwhile, we continue to drive our penetration and win share across OC patient pathway
Acute
3-5 days
Post-acute care
(incl. HHA)
>60 days
Patients
Community
~10 years
SenSura® Mio portfolio
Patients’ first OC products
80%-90% of acute patients go through
post-acute care
Leverage Direct-to-Consumer engine to
engage users in Community
Bags & Plates acute share
18/1914/15
+6%-pts
Brava® rings

We are investing up to DKK 250m1 over the next 5 years to support sustainable environmental development
1) Approximate split: DKK 150m in OPEX and DKK 100m in CAPEX2) % of Coloplast’s total greenhouse gas emissions 3) Coloplast wants to reduce emissions from company air travels by 10% compared to 18/19-levels. Due to Covid-19, the use of air travel has been reduced by 45% in 19/20 and well beyond the 10% target. However, once the situation
normalises, Coloplast remains committed to limit air travel to 10% less than 18/19 levels and then to freeze that level.4) Renewable materials are defined as either recycled or bio-based
Page 58
Reducing emissions
while being a growth company
Key Sustainability Targets 2025
100%
19/20 2025
67%
202519/20
1%
50%
19/20 2025
-10%
Renewable energy Company cars are electrical
Reduce business travel3Scope 1+2 emissions2
0%
6%
19/20 2025
Improving products
and packaging
by addressing material use202519/20
75%90%
19/20 2025
70%80%
19/20
50%
2025
41%
Making packaging recyclable
Packaging consisting of renewable materials 4
Production waste recycled
-45%

64%10%
13%
6%
7%
Raw material Business travels Transport of goods Energy Other
We are committed to reducing emissions while growing 7-9% organically
Page 59
2025 target
• Reductions dependent on how much the
impact of product and packaging is reduced
• We will develop targets to reduce emissions
among suppliers during 2021
2025 target
50%of company cars
are electric
2025 target
10%Reduction in air
travels compared to
18/19 levels
2025 target
100%Renewable energy
2025 target
0Emissions from scope
1 +2
2025 target
5%Limit on goods
transported by air
Our greenhouse gas emissions in
19/20*
* 19/20 Scope 1 + 2 emissions: 11,100 tonnes, Scope 3 emissions: 159,700 tonnes

We continue our strong commitment to responsible operations
Page 60
Responsible
operations
is our core values
Key Sustainability Targets 2025
White-collars trained in Code of Conduct
Loss-time injury rate*
30%
Female representation at VP+ levels
75%
of teams (Director and above) meet diverse team targets
criteria**
2.0
* Number of injuries resulting in absence from work of more than eight hours per one million working hours
** A diverse team consists of a max. 75% of one gender + either max. 75% of one generation or one nationality
100%

Introducing Ostomy Care
Page 61
• Colorectal cancer (est. 45%)• Bladder cancer (est. 10%)• Diverticulitis (est. 15%)• Inflammatory bowel disease (est. 10%)• Other (est. 20%)
• Nurses, mainly stoma care nurses
• People with a stoma• Wholesalers/distribution• Hospital purchasers and GPOs• Surgeons
• Hospital & community nurses
• Hospital buyers• Distributors• Dealers• Wholesalers• Homecare companies
Distribution of revenues*
*Excluding baseplates and supporting products
Key products
Assura® new generation Launched in 1998
Alterna® original Launched in 1991
SenSura®Launched in 2006-2008
SenSura® Mio Launched in 2014
Disease areas
Customer groups
Call points
SenSura® Mio ConvexLaunched in 2015
Urostomy
Ileostomy
Colostomy
SenSura® Mio ConcaveTo be launched in 2018-2019

Introducing Ostomy Care Supporting Products
Page 62
• Nurses, mainly stoma care nurses• People with a stoma• Wholesalers/distributors• Hospital purchasers and GPOs• Surgeons
• Market size of DKK ~3bn• Market growth of 6-8%• Market share 35-40%• Main competitors include: Hollister
Adapt, ConvaTec, 3M Cavilon, Eakin
Market fundamentals
Customer groups & call points
Market value by geography
Brava® is a range of ostomy supporting products
designed to reduce leakage or care for skin, to make
our end-users feel secure. The Brava® portfolio was
launched in 2012.
Brava® Elastic Tape• Elastic so it follows the
body and movements
Brava® Adhesive Remover• Sting free and skin friendly
Brava® Protective Seal• Designed for leakage
and skin protection
Brava® Skin Barrier• Reducing skin problems
without affecting adhesion
Brava® Lubricating Deodorant• Neutralizing odour
Key products
European markets
Other developed markets
Emerging markets

Introducing Continence Care
Page 63
• Spinal Cord Injured, SCI• Spina Bifida, SB• Multiple Sclerosis, MS• Benign prostatic hyperplasia,
BPH & prostatectomy patients• Elderly
• Continence or home care nurses• Wholesalers/distributors• Hospital purchasers and GPOs
• Rehabilitation centers• Urology wards• Distributors, dealers & wholesalers
Distribution of revenues
Key productsDisease areas
Customer groups
Main call points
SpeediCath® Compact Male intermittent catheterLaunched in 2011
Conveen® Optima External catheterLaunched in 05/06
Conveen® Security+Launched in 2013
SpeediCath® Compact Eve Intermittent catheterLaunched in 2014
CC Other
Urine bags
Intermittent catheters
Male ext. catheters
Bowel management
SpeediCath® FlexIntermittent catheterLaunched in 2016
SpeediCath® NaviIntermittent catheterLaunched in 2019 - 2020

Introducing Bowel Management
Page 64
Faecal incontinence (management products only)
• Spinal Cord Injured, SCI• Spina Bifida, SB• Multiple Sclerosis, MS
• Rehab centers• Pediatric clinics• Urology wards
Distribution of revenues
Peristeen® Anal IrrigationLaunched in 2003 Updated in 2011
Anal plugLaunched in 1995
Disease areas Market dynamics
Customer groups
Call points
+ Growing awareness
+ Huge underpenetrated and
unserved population
+ New devices addressing the many
unmet needs
÷ Still taboo area and non-focus for
professionals (doctors)
÷ Very little patient awareness
÷ Training required (nurses, patients)
÷ Lack of reimbursement
Peristeen® Anal Irrigation
Anal plug

Introducing Interventional UrologyTreatment (surgical) of urological disorders
Page 65
• Urinary incontinence• Pelvic organ prolapse• Erectile dysfunction• Enlarged prostate• Kidney and urinary stones
• Surgeons• Purchasing
departments and organizations
• End customers
• Urologists• Uro-gynaecologists• Gynaecologists • Purchasing
departments and organizations
Distribution of revenues
Isiris® cystoscopeLaunched in 2015 Single use devices
JJ stentsLaunched in 1998Single use devices
Titan® OTR penile implantLaunched in 2008 Men’s health – Surgical Urology
Altis® single incision slingLaunched in 2012Women’s health – Surgical Urology
Disease areas
Customer groups
Call points
Key products
Men’s health
Single use devices
Women’s health
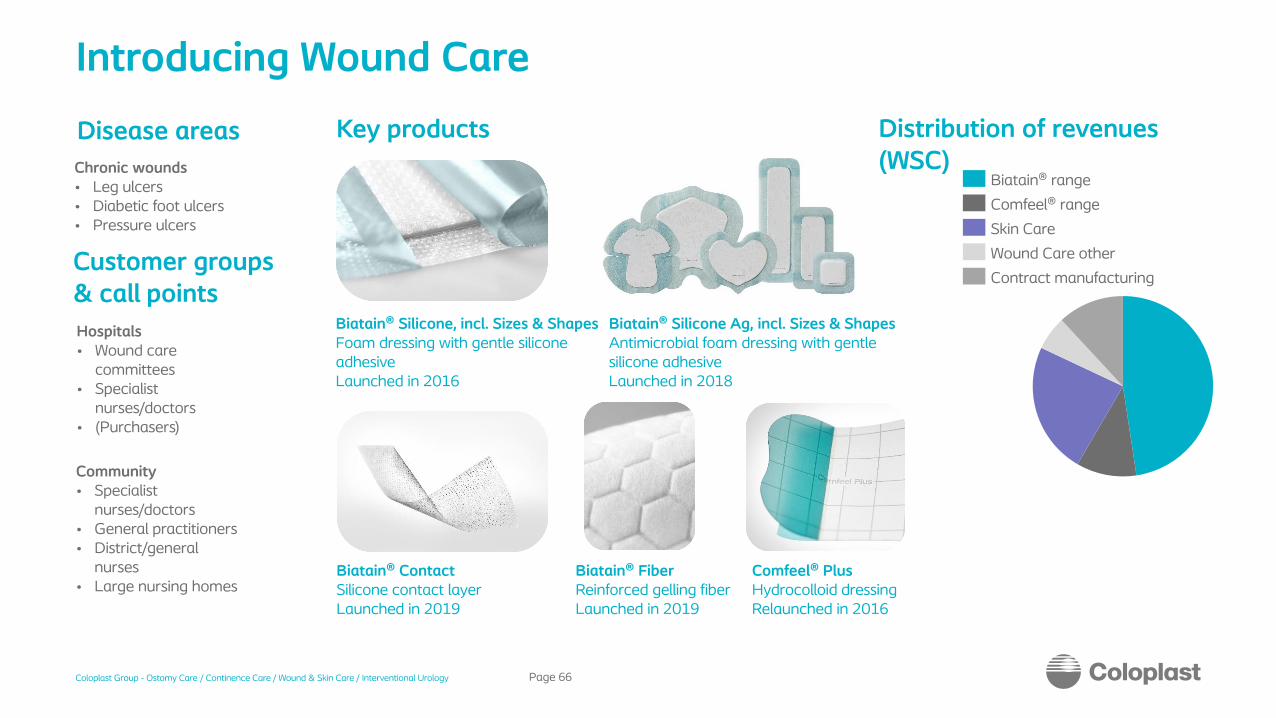
Distribution of revenues (WSC)
Introducing Wound Care
Page 66
Chronic wounds• Leg ulcers• Diabetic foot ulcers• Pressure ulcers
Hospitals• Wound care
committees• Specialist
nurses/doctors• (Purchasers)
Community• Specialist
nurses/doctors • General practitioners• District/general
nurses • Large nursing homes
Key products
Biatain® Silicone, incl. Sizes & ShapesFoam dressing with gentle silicone adhesiveLaunched in 2016
Disease areas
Customer groups& call points
Biatain® range
Comfeel® range
Skin Care
Wound Care other
Contract manufacturing
Comfeel® PlusHydrocolloid dressingRelaunched in 2016
Biatain® Silicone Ag, incl. Sizes & ShapesAntimicrobial foam dressing with gentle silicone adhesiveLaunched in 2018
Biatain® ContactSilicone contact layerLaunched in 2019
Biatain® FiberReinforced gelling fiberLaunched in 2019

Introducing Skin Care
Page 67
InterDry® AgTextile with antimicrobial silvercomplexUnique solution for skin on skin issues
Sween®Broad line of skin care productsDesigned to increase consistency of care
• Moisture associated skin damage• Incontinence• Skin folds & obesity • Prevention of skin impairments
Hospitals• Clinical Specialists • Supply Chain• Value Analysis Committee
Critic-Aid® Clear / AF Skin ProtectantSuitable for neonate to geriatric patients
EasiCleanse Bath® Disposable Bathing Wipes Improves Patient Experience
Key products
Community• Wound Clinics• Long Term Care• Home Health Agencies• Distribution
Disease areas
Customer groups& call points
Product mix
Protectants & Antifungals
SC Other
Cleansing/Bathing
Moisturizers
Textile

Product market for US Skin Care
Page 68
Market trends• Increasing size and vertical integration
of health systems
• Increasing importance of prevention
• Increasing importance of utilization management
• Increasing scale and vertical integration of market leaders
• US market size estimated at DKK
4-5bn with 2-4% growth
• Market share: 10-15%
• Main competitors include:
• Medline Industries
• Sage Products
US Skin Care at a glance
+ Aging and obese population
+ CMS Value Based Purchasing
+ Increased focus on prevention
+ Increased importance of utilization management
Market drivers/limiters
÷ Consolidation of Providers
÷ Increased competition from both Channel and Manufacturers

The Coloplast organisation
Page 69
Strategic Business UnitsChronic Care
Wound & Skin Care Interventional Urology
Global Operations
Ostomy Care Continence Care
Global Business Support Functions
Sales Regions
Coloplast Group
R&D
Strategic Business UnitsChronic Care
MarketingSales R&DOperationsMarketing Marketing
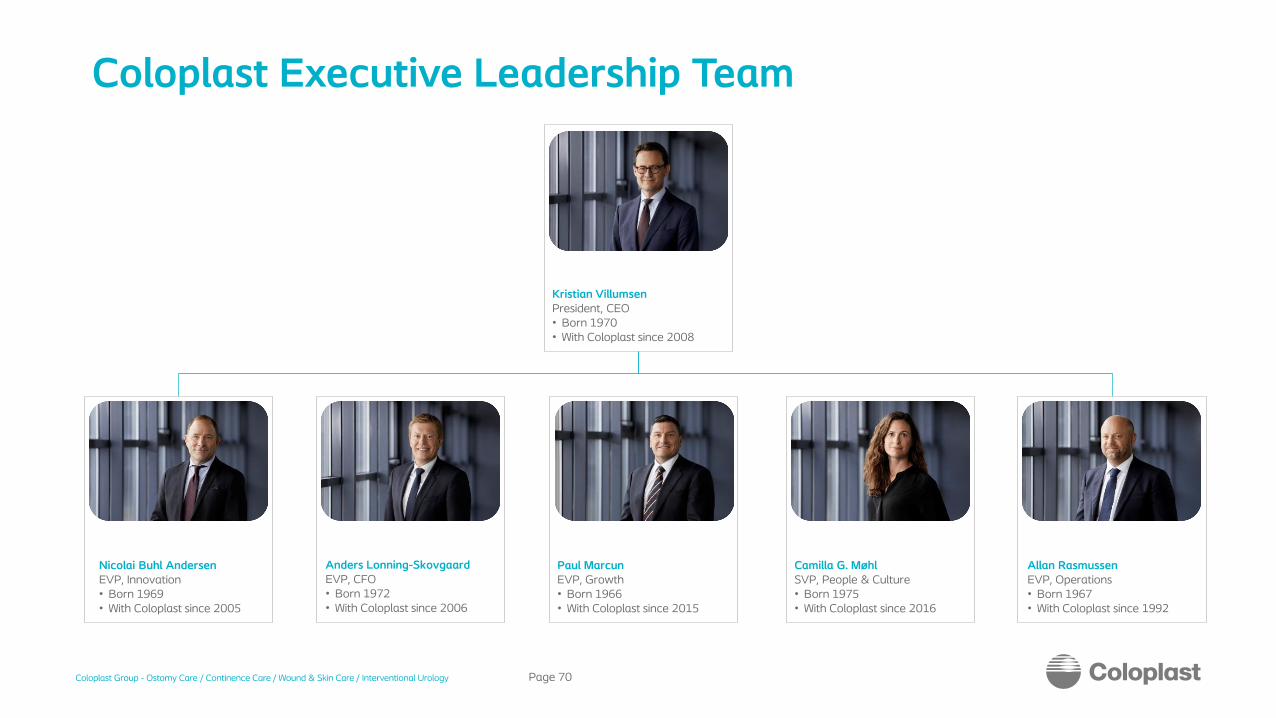
Kristian VillumsenPresident, CEO• Born 1970• With Coloplast since 2008
Page 70
Allan RasmussenEVP, Operations• Born 1967• With Coloplast since 1992
Anders Lonning-SkovgaardEVP, CFO• Born 1972• With Coloplast since 2006
Paul MarcunEVP, Growth• Born 1966• With Coloplast since 2015
Camilla G. MøhlSVP, People & Culture• Born 1975• With Coloplast since 2016
Nicolai Buhl AndersenEVP, Innovation• Born 1969• With Coloplast since 2005
Coloplast Executive Leadership Team

Income statement
Page 71
Revenue 17,939 18,544 3%
Gross profit 12,153 12,612 4%
SG&A costs -5,963 -6,079 2%R&D costs -692 -708 2%Other operating income/expenses 58 29 -50%
Special items -400 - nm
Operating profit (EBIT) 5,156 5,854 14%
Net financial items -128 -388 nmTax -1,155 -1,269 10%
3,873 4,197 8%
Gross margin 68% 68%EBIT margin before special items 31% 32%
29% 32%
Earnings per Share (EPS) before special items, diluted 19.64 19.67 0%
Earnings per Share (EPS), diluted 18.18 19.67 8%
Operating profit (EBIT) before special items 5,556 5,854 5%
DKKm FY 2018/19 FY 2019/20 Change
Net profit
Key ratios
EBIT margin

Balance sheet
Page 72
Non-current assets 6,373 7,010 10%
Current assets 6,359 6,489 2%of which:Inventories 1,933 2,227 15%Trade receivables 3,153 2,934 -7%Restricted cash 13 - nmMarketable securities, cash, and cash equivalents 669 585 -13%
Total equity 6,913 7,406 7%Non-current liabilities 877 1,114 27%Current liabilities 4,942 4,979 1%of which:Trade payables 859 814 -5%
Return on average invested capital before tax (ROIC)1) 62% 59%48% 46%
Net asset value per share, DKK 33 35 6%
1) This item is before Special items. After Special items, ROIC before tax is 61% (2018/19: 60%), and ROIC after tax is 47% (2018/19: 46%)
Return on average invested capital after tax (ROIC)1)
Key ratios
Equity ratio 54% 55%
Invested capital 8,748 9,864 13%
Balance, total 12,732 13,499 6%
Assets
Equity and liabilities
DKKm 30 Sep 2019 30 Sep 2020 Change

Cash flow
Page 73
1) Net CAPEX including divestment of PPE and excluding finance leases
EBIT 5,156 5,854 14%
Depreciation and amortisation 651 851 31%
Change in working capital -291 -352 21%
Net interest payments -187 -182 -3%
Paid tax -1,185 -1,277 8%
213 -135 nm
Investments in intangibles -73 -85 16%
CAPEX1) -516 -867 68%
Acquisitions - - nm
Securities -2 51 nm
Cash flow from investments -591 -901 52%
Dividends -3,398 -3,612 6%
-120 -93 -23%
-196 -152 -22%
Net cash flow for the year 52 1 nm
Free cash flow 3,766 3,858 2%
Net aquisition of treasury shares and exercise of share options
DKKm FY 2018/19 FY 2019/20 Change
Cash flow from operations 4,357 4,759 9%
Adjustment for other non-cash operating items
Drawdown on credit facilities

Zhuhai
TatabányaNyirbátorSarlat
Mørdrup
Minneapolis
Mankato
Costa Rica
Manufacturing setup
Page 74
Production by country (Volume)¹
COGS by cost type²
1) Produced quantity of finished goods2) FY 2019/20 Cost of goods sold, DKK 5,932m3) Transport, utility, IT, repair & maintenance costs, etc.
83%
11%
4%0%2%
US/France
Hungary
Costa Rica
China
Denmark
10%
12%
52%
8%
18%Salary - Direct
Salary - Indirect
Depreciations & amortisations
Materials (RM &SFG)
Other3
Innovation & Pilot Centre
High Volume Production
Specialised Production
High Volume Production under construction

Production sites
Page 75
• Continence care products• Ostomy care products• Machine building• Number of employees in production: ~1,000
Hungary
Tatabánya
Tatabánya PDC
• Continence care products• Wound care products • Consumer products• Number of employees in production: ~2,500
• Ostomy care products • Adhesives • Continence care products• Interventional Urology products• Number of employees in production: ~1,950
• Postponement & packaging• Cross docking• Warehousing• Distribution & shipping• Number of employees: ~550
Nyírbátor
Zhuhai
China
Costa Rica
Cartago• Land purchased in 2018• Production initiated in rented facilities in
2019• Initial scope is for Ostomy Care products• Global high volume facility to be
operational in 2020Illustrative

Production sites
Page 76
• Pilot development work Ostomy care, Continence care and Wound care
• Adhesives production• Number of employees in production: ~150
Sarlat• Disposable surgical urology products• Number of employees in production: ~175
Minneapolis
Mankato
• Skin care products• Ostomy care supporting products• Number of employees in production: ~100
• Interventional Urology products• Number of employees in production: ~100
Mørdrup
Denmark
France
US
Coloplast Sponsored Level 1 ADR programme
Page 77
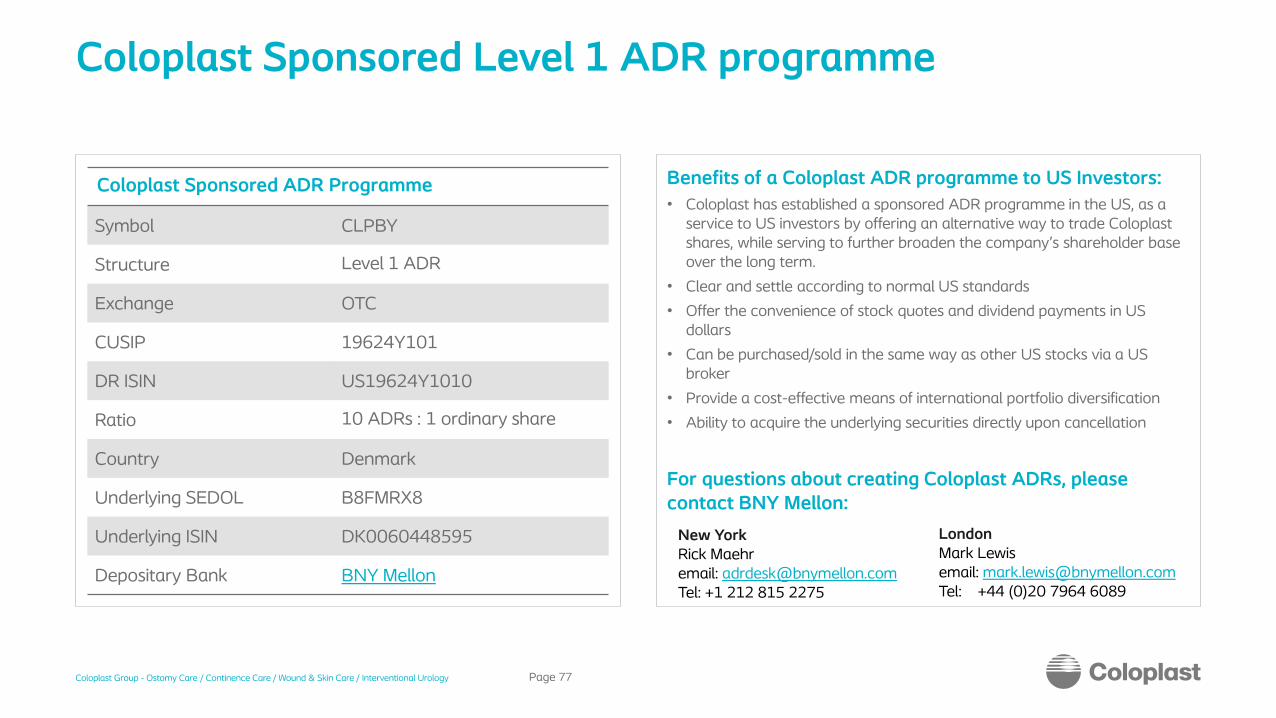
Benefits of a Coloplast ADR programme to US Investors:
• Coloplast has established a sponsored ADR programme in the US, as a service to US investors by offering an alternative way to trade Coloplast shares, while serving to further broaden the company’s shareholder base over the long term.
• Clear and settle according to normal US standards
• Offer the convenience of stock quotes and dividend payments in US dollars
• Can be purchased/sold in the same way as other US stocks via a US broker
• Provide a cost-effective means of international portfolio diversification
• Ability to acquire the underlying securities directly upon cancellation
For questions about creating Coloplast ADRs, please contact BNY Mellon:
Coloplast Sponsored ADR Programme
Symbol CLPBY
Structure Level 1 ADR
Exchange OTC
CUSIP 19624Y101
DR ISIN US19624Y1010
Ratio 10 ADRs : 1 ordinary share
Country Denmark
Underlying SEDOL B8FMRX8
Underlying ISIN DK0060448595
Depositary Bank BNY Mellon
New YorkRick Maehremail: [email protected]: +1 212 815 2275
LondonMark Lewisemail: [email protected]: +44 (0)20 7964 6089

Contact Investor Relations
Page 78
Holtedam 1DK-3050 HumlebækDenmark
Ellen Bjurgert
Vice President, Investor RelationsTel. direct: +45 4911 3376 Office: +45 4911 1800 [email protected]
Rasmus Sørensen
Senior Manager, Investor RelationsTel. direct: +45 4911 1786 Office: +45 4911 1800 [email protected]
Hannah Katrine Larsen
Investor Relations Coordinator & PATel. direct: +45 4911 3616 Office: +45 4911 [email protected]
Sophia MastrellStudent Assistant, Investor RelationsTel. direct: +45 4911 2010
Office: +45 4911 [email protected]

Page 79