Embed Size (px)
Citation preview

1
Shinsei Bank:Institutional Banking Group Evolution
Merrill Lynch Japan ConferenceSeptember 9, 2005
Sustained Performanceand Opportunity
Thierry PortéPresident & CEO
12th CLSA Investors’ Forum 2005September 14-15, 2005

2
The following materials contain statements that constitute forward-looking statements, plans for the future, management targets, etc. relating to the Company and its subsidiaries. These forward-looking statements are based on current assumptions of future events and trends, which may be incorrect. Actual results may differ materially from those in the statements as a result of various factors.
Unless otherwise noted, the financial data contained in these materials are presented under Japanese GAAP. The Company disclaims any obligation to update or to announce any revision to forward-looking statements to reflect future events or developments. Unless otherwise specified, all the financials are shown on a consolidated basis.
Information concerning financial institutions other than the Company and its subsidiaries are based on publicly available information.
These materials do not constitute an invitation or solicitation of an offer to subscribe for or purchase any securities and neither this document nor anything contained herein shall form the basis for any contract or commitment whatsoever.
Forward Looking Statement

3
InstitutionalBanking
Retail BankingConsumer &Commercial
Finance
Common IT Strong Capital CentralInfrastructure Base Risk Management
CUSTOMER & PARTNER
REFERRALS
JOINT CUSTOMER SOLUTIONS
Three Pillar Strategy

4
Institutional Banking:Strong Growth with Varied Revenue Mix
Strong Revenue in FY2004:Non-recourse loans:
Balance grew to JPY 577 billion 143 new deals were closed in FY2004
Credit trading: Healthy results both for domestic and international businesses
Securitization:Major player in the securitization marketConcluded 14 new deals with JPY 440 billion total issuance
– Securitization of Mizuho Bank HQ(August) – IFR Japanese Securitisation of the Year 2004
(First CDO repackage securitization of CMBS arranged by a Japanese Bank)
– Deal of the Year 2004 Thomson DealWatch– #3 in ABS League table
(Bloomberg, Nikkei Bonds and Financial Weekly)
Forex, derivatives and equity related businesses in capital market
14.318.9
15.516.7
8.7
15.820.0
14.6
16.612.6
5.27.85.5
7.7
0
10
20
30
40
50
60
70
80
90
100
FY2003 FY2004
Revenue BreakdownFY2003 vs FY2004 JPY Bn
89.1
97.0
Non-recourse loans
Forex, Derivatives, Equity related
Credit Trading
Corporate Loans*2
Principal Investment
Other Capital Markets*1
Securitization
Note: Management accounting basis
*1: Significant portion of this growth relates to business activities in ShinseiSecurities and Shinsei Trust.
*2: Include balance sheet loans and specialty finance

5
Institutional Banking:Customer-Centric Solutions
Business ReorganizationM&A AdvisoryLeveraged FinanceCorporate RevitalizationPrivate Equity
Asset Management Investment TrustStructured DepositsDebentures
Cost Effective FundingLoansSecuritization (receivables, loans, etc)LeasingNon-Recourse LoansLoan Syndication
Balance Sheet ImprovementCredit Trading
Risk ManagementDerivatives (Interest rate, Forex)Credit DerivativesForeign Exchange
Deliver customer-centric best products, services, solutions to diversified institutional customers
Products
Services
Solutions
Customers Needs

6
Institutional Banking:Product Diversification
Further Product DiversificationStructured Notes
Shinsei Securities(1), Shinsei International Limited(2), building out product offering to include Credit/Equity linked and international products for domestic client base
Structured DepositsWhite Label business through our financial institution clients
SecuritizationFocusing on new asset classes -hotels and hospital receivables as a focus
Services to High Net Worth (HNW)Seamless service between retail and corporate for HNW clients
Real estate financeOrigination and profit taking opportunities continue to increase
(1) #3 in Japan ABS League Table (Bloomberg, Nikkei Bonds and Financial Weekly)
(2) In May, 2005, Shinsei International Limited received an official approval to operate securities business from the Financial Services Authority in U.K. Shinsei International will commence Securitization Business, Structured Finance Business and Investment Advisory Business.

7
Institutional Banking: Driving Client Profitability
STEP 1
SegmentCustomer
Base
Focusing on Our Most Active and Profitable Corporate Clients
Precise measurement through comprehensive analysis and measurement
Aimed at increasing the number of products/client
STEP 2
ChangeOrganization
STEP 3
ImplementCRM
STEP 4
Measure &MonitorResults

8
Institutional Banking:German NPL Joint Venture
Established German NPL acquisition and servicing joint venture
Teamed with strategic partners, NORD/LB and WestLB, two of Germany’s leading financial institutions
Leverage our expertise and capital in exclusive agreement
Provide follow-on business opportunities – financing of NPL, securitization -
Allow Shinsei to access the German Public Sector Banks’ NPL assets
Diversify revenue sources geographically
• Overall German NPL market volume is estimated as between EUR 160 and 300 billion• German NPL market in public sector is estimated as between EUR 60 and 100 billion

9
Retail Banking:Continued Success
Strong growth in revenues, new customers, deposits, housing loans and AUM volume
Total deposits volume grew by JPY 700 billion
2/3 of balance: time or structured deposits1/3 of balance: savings deposits
Retail’s non-interest income represents 59% of total retail revenue
18% increase from the previous year
AUM for mutual funds and variable annuity are reaching close to JPY 400 billion
41% increase from the previous year
Total loan balance increased by 75% reaching JPY 308 billionRetail banking revenue: JPY 37.5 billion – an increase of JPY 15.9 billion or 74%
Revenue Breakdown JPY Bn
Note: Management accounting basis
3.3
16.55.4
6.0
12.9
11.8
0.0
5.0
10.0
15.0
20.0
25.0
30.0
35.0
40.0
FY2003 FY2004
Interest Income(59%→41%)
・Net Funds Transfer Revenue (1)
・Loans
Non-Interest Income
(41%→59%)
・Asset Management
・Deposit Related and Forex Fees
21.5
37.5
(1) Related to customer deposits and debentures

10
Retail Banking: FY2004 Business Highlight
Exceeded 1.3 million retail accounts
Strong customer demand for products, especially Yen deposits, Housing Loans and Annuities
Continued product range expansion (Agreement with Rakuten Securities to offer Securities Brokerage Services)(1)
Successful launch of “Shinsei BankSpot”
Ranked #1 Financial Services Website 2004(2)
Ranked #1 in customer satisfaction of the Nikkei survey of financial institutions(3)
Best Retail Bank in Japan 2004(4)
(1) Launched on June 15, 2005(2) Research by Japan Brand Strategy (3) Survey by The Nihon Keizai Shimbun,
October 2004(4) The Asian Banker, May 2005

11
Retail Banking: Enhanced Channel Network
Successful launch of Shinsei BankSpot reinforces our strategy to develop a highly efficient multiple channel network while enhancing our physical presence and visibility
• Uninterrupted access to financial transactions (structured deposits, Forex, Mutual Fund, etc)
• Ranked #1 Financial Services Website 2004(Japan Brand Strategy)
• Over 3.5 million visitors per month
• Stock trading tie-up with Rakuten Securities
PlatinumCenter
Financial CenterHousing Loan Center
BankSpotATMsPowerCall(Telephone Banking)
PowerDirect(InternetBanking)
Remote Channels (24x7 coverage) Physical Channels
• Broad product and service offering supported by a highly skilled and trained operator team
• Convenient access to various financial transactions
• Access to over 60,000 ATMs throughout Japan
• Over 250 own ATMs installed in Tokyo Metro, Keikyu Railway, Kintetsu Railway, Roppongi Hills, Government Offices, etc
• Available for foreign issued bank cards and credit cards
• New type of mini-branch launched in Dec 2004
• High-traffic areas: (Tokyo) Ginza, Kyobashi, Shinjuku-minami (Osaka/Kobe) Ashiya, Umeda, Shinsaibashi, (Nagoya) Chikusa,
• 30-50 m2, 2-3 staff (If the BankSpot is the type with staffs)
(as of Sep 12, 2005)
• 30 Shinsei Financial Center and 4 Housing Loan Center
• Present in major Japanese cities
• Appeal to mass affluent
• Two centers: Tokyo, Osaka,
• Relaxed and personal environment
• Focused on providing specialized advisory and consulting services

12
Retail Banking:Initiatives
More precise customer segmentationAsset status and investment experienceEfficient sales utilizing calls, e-mails and mini-leaflets Active transactions, increasing AUM and increasing profitability
Expanding products / businesses focused on customer needsStream of new products– PowerYokin (March 2005) – Powered One Plus (May 2005)
Enhance services to High Net Worth– Deliver seamless services between retail and corporate for HNW
clientsConsider offering consumer loans and credit cards
Expansion of Bankspot and ATMs at selective areasBrand Building: Color your life

13
Retail Banking: New Branding ConceptAimed at New Customers
Launched a new branding concept “Color your life” (in June 2005)
Lifestyle-oriented campaign focused on highlighting our products and services that deliver real value
32 brand new color cash cards for PowerFlex accountEach design has been named according to the image portrayed
Well received by new customers as well as within our existing customer base
Strong customer acquisition of more than 50,000 in June compared with current trend of 35,000 – 40,000 customers acquisition per month

14
#1 in Customer Satisfaction SurveyNikkei ranked Shinsei as #1 in customer satisfaction in two consecutive years (Nikkei customer satisfaction survey in 2004 and 2005)
Source: The Nihon Keizai Shimbun, October 2004, August 2005
Customer serviceOperation hours
Products / servicesofferings
SoundnessReliability
Futureusage
2005
1 Shinsei Bank
2 Jonan Shinkin
3 Citibank
4 Japan Net
5 eBank
6 Ogaki Kyoritsu
7 Post Office
8 Tokyo Star
9 Juroku
10 BOTM
2004
1 Shinsei Bank
2 Sony Bank
3 Ogaki Kyoritsu
4 Japan Net
5 eBank
6 BOTM
7 Jonan Shinkin
8 IY Bank
9 Bank of IKEDA
10 Sumitomo Trust 21.3 28.0 20.0 9.9
23.6 26.2 19.5 11.0
25.5 25.4 19.0 10.7
21.0 27.4 22.5 10.8
22.0 27.7 20.8 11.2
24.8 27.7 18.2 11.5
25.7 27.3 18.4 10.8
25.7 28.0 19.2 11.1
24.5 32.6 20.4 12.0
26.7 32.6 20.7 11.9
0 20 40 60 80 100

15
Bringing Shinsei Strengths to Consumer and Commercial Finance
ConsumerSolutions
Small & Medium Business Solutions
Specialty Property Solutions
Customer
Perspective
RiskManagement
InnovativeTechnology
Financial Stability
New Ideas & History of Execution
Shinsei Brand
ConsumerSolutions
Small & Medium Business Solutions
Specialty Property Solutions
Customer
Perspective
RiskManagement
InnovativeTechnology
Financial Stability
New Ideas & History of Execution
Shinsei Brand

16
Consumer and Commercial Finance:Significant Growth Contributor
36.2
5.5
7.0
0
10
20
30
40
50
FY2003 FY2004
OthersAPLUS
43.2Consumer and Commercial Finance represents 24% of Shinsei total revenue
APLUS contributed JPY 36.2 billion, 84% of total consumer and commercial finance revenue (2nd Half results only)
Others also showed improvementsLife Housing loan: 34% increase to JPY 2.1 billion
Shinsei Sales Finance: 31% increase to JPY 1.6 billion
APLUS acquisition positions Consumer and Commercial Finance as a significant revenue contributor
Note: Management accounting basis
*1 Only APLUS’ 2nd half results are included as the transition took place at the end of September 2004.
Showa Leasing results for FY2004 are not included because the transaction took place at the end of March 2005.
*1
Growth from enhanced marketing, diversified channels and sales force effectiveness
Further penetration into existing customer base through cross-selling within Shinsei Group
Targeted M&A where necessary
2004 Results
Future Prospects
Revenue Breakdown JPY Bn

17
What is the APLUS Vision ?
APLUS is a market-leading merchant-based consumer finance company with high-margin direct cross sell where possible
Build upon strong customer and business franchiseMore than 4.2 million card holdersOver 700 co-branded card partnerships, including TSUTAYA
Significant growth potential
Near-term growth• Expand & enhance sales force effectiveness
via training, measurement & reward systems• Cross-sell existing customer base with direct
consumer solutions• Revisit low/no profit merchant relationships
for revision/termination
Long-term growth• Renegotiate key merchant tie-ups
for long-term profitability• Tie-up with Shinsei retail banking for
delivery of card & credit line solutions
• Examine consumer auto lease market together with Showa Leasing

18
Revenues
Expenses
Key sales leadership hire (10+ Yrs)In depth profitability analysis underwayRenegotiating key merchant alliances with view to long-term profitabilityFocused effort to improve sales force training & effectiveness
Credit rating upgrade (BBB+)ST/LT borrowing rates down (114 bp)Successful fixed dividend preferred offeringCommercial paper program being launched
Improving the APLUS Business Model
Cost of Funding
New mindset by Shinsei to use scale & leverage for lower costsLong-term planning to migrate IT-intensive back office to flexible, low-cost, open systems
SG&A
Leverage fresh start after non-core asset dispositionApply better science to underwritingRemain disciplined – particularly regarding diversification
Cost of Credit

19
Showa Leasing is Shinsei’s commercial finance platform providing leasing, lending and other solutions to small and mid-size companies
What is the Showa Leasing Vision?
Build upon existing origination partnersPreserve & expand Resona relationship where possibleAdd Shinsei relationship banker referral networkNew alliance partners (e.g. Norin Chukin / Kyodo Leasing)
Near-term growth• Renewed management focus
on domestic commercial customers after non-core disposition
• Introduction of Shinsei relationships as customers and origination partners
Long-term growth• Introduce new products and
solutions to expanding customer base
• Develop long-term origination partnerships and alliances
(Showa Leasing)

20
Revenues
Expenses
Key sales leadership Hire (25+ Yrs)Preserve existing Resona relationshipIntroduce Shinsei referral networkIn depth profitability analysis underwayExplore new alliances for growth (e.g. Norin Chukin discussions)
Credit rating upgrade (A-, J1)ST/LT borrowing rates down (40 bp)Commercial paper program being launched
Cost of Funding
Mostly stable SG&A other than basic cost managementKey to SG&A will be leverage/scale
SG&A
New Shinsei-experience CROLeverage fresh start after non-core asset dispositionMonitor risk closelyUse capital markets where needed
Cost of Credit
Improving Showa’s Business Model

21
Revenues
Expenses
Tax
Income
CCF Earnings Growth: Getting the Basics Right
Stabilize core revenue sourcesIn-depth profitability analysisOptimize product and channel mix
ST cost basicsLT infrastructure migrationST & LT dramatic COF improvementStabilize credit & ensure discipline
Fully utilize NOL position over near term
SG&A
Funding
Credit
Volume
Margin
Fees
Strategy to Deliver Sustained Earnings Growth by Stabilizing Revenues Over an Increasingly Lower Cost Business Model

22
ConsumerSolutions
Small & Medium Business Solutions
Sales Force Mgmt
Brand / PR
Underwriting
Risk Data Analytics
LT Migration To Flexible And Open
Architecture
People Development
Career Mobility
Platform Expansion
Major Alliances
Funding Expertise
Expense Control
Shinsei Delivers Value Through a Dedicated Team Aligned by Functional Expertise
Specialty Property Solutions
FINANCE RISKMARKETING IT/OPERS HR M&A
CONSUMER & COMMERCIAL FINANCE
(Shinsei Sales Finance)
(Shinki)(APLUS) (Showa Leasing)
(Shinsei Business Finance) (Life Housing Loan)
(Shinsei Property Finance)

23
Potential Synergies Within Consumer & Commercial Finance Business
Capital MarketsCross-Sell (credit card, personal loan, merchant introduction)IT
Consumer Auto LeaseConsumer/Commercial Vendor Programs
Property Lending
Joint Market Research
Operational Synergies
SHINSEI BANKSHOWA LEASING
SHINSEI PROPERTY FINANCELIFE HOUSING LOAN
SHINKI
SHINSEI SALES FINANCETreasury / Capital MarketsCross-SellIT
Consumer Auto LeaseConsumer/Commercial Vendor Programs
Real Estate Leasing
Insurance Tie-up
Unsecured SME LendingCross-Sell / Bundled Solutions
APLUSSHINSEI SALES FINANCE
SHINKI
SHINSEI PROPERTY FINANCELIFE HOUSING LOAN
SHINSEI BANK
SHINSEI BUSINESSFINANCE
Many Potential Revenue & Operating Synergies Identified within CCF
APLUS
Showa Leasing

24
Shinsei: Better Banking Realized
Innovative Business ModelThree pillars:Institutional Banking, Consumer and Commercial Finance and Retail BankingExceptional asset quality, financial strength, flexibility and discipline
Customer-first, solutions driven
Performance DrivenExpanding strength of Institutional Banking activities
Leveraging competitive advantages in Consumer and Commercial Finance
Becoming the “Bank of Choice” for Retail Banking customers
Winning market share
Building Sustainable Growth in Shareholder Value

25
Appendix

26
1QFY2005 Financial Highlights
Total revenue increased more than 90% to JPY 64.5 billion
Ordinary business profit up more than 100% to JPY 30.0 billion
Net income was JPY 17.4 billion, 1.0 billion or 6% lower than last year- due to inclusion of JPY 5.9 billion of intangibles amortization
Cash basis net income grew 27% to JPY 23.3 billion
NPL fell to 1.3% of total claims or JPY 47.6 billion
More than 60% of total customer funding from retail customers
Significant Progress in All Key Areas
*All figures, where applicable, compared to 1Q FY2004

27
1QFY2005 Ordinary Business Profit for Each Business Line
Note: Management accounting basis
(JPY Bn)
(*1) In 1QFY2005, income from the PoweredOne yen-denominated structured deposits was JPY 1.8 billion yen; declined by JPY 3.0 billion from the same period last year
(*2) APLUS contributed revenue of JPY 19.4 billion and Ordinary Business Profit (OBP) of JPY 8.3 billion; Showa Leasing contributed revenue of JPY 5.8 billion and OBP for of 3.2 billion
(*1)
(*2)
(*2)
Amount % of total Amount % of total Amount % Amount % of total
Institutional BankingRevenue 23.4 69% 25.5 40% 2.0 9% 97.0 55%
Expense 9.5 50% 9.7 28% 0.2 (3)% 37.8 39%
Ordinary Business Profit 13.9 95% 15.7 52% 1.7 13% 59.1 72%
Consumer and Commercial FinanceRevenue 1.4 4% 27.1 42% 25.7 n.m. 43.2 24%
Expense 1.4 7% 15.4 45% 14.0 n.m. 26.1 27%
Ordinary Business Profit 0.0 0% 11.6 39% 11.6 n.m. 17.1 21%
Retail BankingRevenue 9.4 28% 9.7 15% 0.2 3% 37.5 21%
Expense 7.7 40% 9.2 27% 1.5 (20)% 31.6 33%
Ordinary Business Profit (Loss) 1.7 12% 0.4 1% (1.2) n.m. 5.9 7%
ALM / Corporate / OtherRevenue (0.5) (1)% 2.1 3% 2.6 n.m. 0.1 0%
Expense 0.4 2% 0.0 0% 0.5 n.m. 0.4 0%
Ordinary Business Profit (Loss) (0.9) (6)% 2.1 7% 3.1 n.m. (0.2) 0%
TotalRevenue 33.8 100% 64.5 100% 30.6 91% 178.0 100%
Expense 19.1 100% 34.4 100% 15.3 (80)% 96.0 100%
Ordinary Business Profit 14.6 100% 30.0 100% 15.3 105% 81.9 100%
(Reference)Change vs 1QFY20041QFY2004 1QFY2005 FY2004

28
Strong Contribution from Each Business in 1QFY2005
Institutional Banking:Revenues grew 8.8% to JPY 25.5 billion Revenue to expense ratio ratio improved to 38.2% from 40.5% Non-recourse loans balance grew JPY 53 billion (+9%) to JPY 630 billion
- 45 new transactions during 1QCompleted 4 key securitization deals with total issuance amount of JPY 157 billion
Consumer and Commercial Finance (CCF):CCF business contributed JPY 27 billion in revenue– or 42% of totalAPLUS and Showa Leasing transformed this business line CCF lending grew JPY 24 billion or 9% to JPY296 billionOverall expense to revenue ratio improved to 57% from 60% in FY2004
Retail Banking:‘Color your life’ campaign spur customer acquisition of 126,000 in 1Q
- bringing total retail accounts to more than 1.4 millionGenerated total revenue of JPY 9.7 billion, up 3%Revenue diversification: structured deposits, asset management, housing loansForex fees have been growing steadily with growth in foreign currency deposits Deposits at JPY 2.6 trillion and retail funding now approaching 2/3rd of customer funding
*All figures, where applicable, compared to 1Q FY2004

29
FY2004 Ordinary Business Profit for Each Business Line
Note: Management accounting basis
(JPY Bn)
Amount % of total Amount % of total Amount %
Institutional BankingRevenue 89.1 72% 97.0 55% 7.9 9%Expense 37.7 55% 37.8 39% 0.1 0%Ordinary Business Profit 51.4 93% 59.1 72% 7.7 15%
Consumer and Commercial FinanceRevenue 5.5 4% 43.2 24% 37.6 n.mExpense 2.9 4% 26.1 27% 23.1 n.mOrdinary Business Profit 2.5 5% 17.1 21% 14.5 n.m
Retail BankingRevenue 21.5 17% 37.5 21% 15.9 74%Expense 26.6 39% 31.6 33% 5.0 (19%)Ordinary Business Profit (Loss) (5.0) (9%) 5.9 7% 10.9 n.m
ALM / Corporate / OtherRevenue 7.5 6% 0.1 0% (7.3) n.mExpense 1.4 2% 0.4 0% (1.0) n.mOrdinary Business Profit (Loss) 6.0 11% (0.2) 0% (6.3) n.m
TotalRevenue 123.8 100% 178.0 100% 54.2 44%Expense 68.7 100% 96.0 100% 27.2 (40%)Ordinary Business Profit 55.0 100% 81.9 100% 26.9 49%
Change vs FY2003FY2003 Actual FY2004 Actual

30
FY2005 Projection
【Consolidated】 (billions of yen)Actual of FY2004
1H FY2005 1H FY2004
55.0 120.0 34.3 81.9
28.0 62.0 28.5 54.4
28.0 63.0 40.7 67.4
Cash basis Net Income** 43.0 93.0 74.7* Management accounting basis**Excludes amortization of APLUS and Showa Leasing's identified intangibles, net of deferred tax liabilities and amortization of consolidation goodwill. (FY2004 actual, 7.2 billion yen, FY2005 forecast, 30 billion yen)
【Non-Consolidated】 (billions of yen)Actual of FY2004
1H FY2005 1H FY2004
30.0 62.0 29.2 54.9
30.0 62.0 24.6 46.6
32.0 68.0 37.2 68.0***~based on the Bank's "revitalization plan"
Forcast of FY2005
Forcast of FY2005
Net business profit (jisshitsu gyoumu jun-eki) ***
Ordinary business profit (jisshitsu gyoumu jun-eki) *
Net income
Net income
Net operating income
Net operating income

31
Summary of Performance (Consolidated)
Income Statement (Management Accounting basis) 2003 2004 2005 Balance Sheet 2003 2004 2005
Net Interest Income 66.1 56.3 66.8 Loan & Bills Discounted 3,502.3 3,047.0 3,430.4
Non-Interest Income 41.4 67.5 111.1 Reserve for Credit Losses (216.5) (177.9) (149.7)
Total Revenue 107.6 123.8 178.0 Securities 1,770.9 1,483.2 1,478.2
G&A Expense 67.3 68.7 96.0 Trading Assets 361.1 635.0 168.5
Ordinary business profit 40.2 55.0 81.9 Net deferred tax assets 18.4 22.8 4.3
Credit (recoveries) costs (8.7) (15.4) (0.9) Other 1,270.7 1,333.6 3,644.6
Income taxes & Other 4.0 (4.0) (15.4) Total Assets 6,706.9 6,343.7 8,576.3
Net Income 53.0 66.4 67.4 74.7 Debentures, Bonds 1,913.5 1,388.6 1,330.9
Deposits 2,576.9 2,734.4 3,452.8
Per Share Data Other 1,536.5 1,489.7 2,952.0
Fully diluted shareholders' equity 335.3 378.7 390.06 393.68 Total Liabilities 6,026.9 5,612.7 7,735.7
Diluted net income 26.2 32.7 34.98 38.76 Minority interests in subsidiaries 0.1 0.9 53.8
Shareholders' Equity 679.8 730.0 786.6
Financial Ratios
TierⅠCapital Ratio 14.3% 16.2% 7.0% <Non-Consolidated~Financial Revitalization Law>
Total capital adequacy ratio 20.1% 21.1% 11.8% Total Claims 4,088.2 3,501.2 3,621.1
Return on equity (fully diluted) 8.1% 9.4% 8.9% 9.8% Non-Performing Claims 233.2 97.3 51.8
Return on Assets 0.7% 1.0% 0.9% 1.0% Amounts of coverage for non-performing claims
Ratio of non-interest income to total revenues 38.5% 54.5% 62.4% 62.4% Reserve for loan losses provided
Overhead Ratio 62.6% 55.5% 53.9% 53.9%for non-performing claims (98.7) (57.4) (33.0)
Collateral and Guarantees (124.0) (38.8) (15.7)
Problem Claims <Non-Consolidated~Financial Revitalization Law>
5.7% 2.8% 1.4% ( billions of yen, except per share and percentages )
95.5% 99.0% 94.3% Coverage Ratio for Non-Performing Claims
As of or for the fiscal year endedMarch 31, As of March 31,
CashBasis
Ratio of non-performing claims to total claims
1) JPY 2.9 billion amortization relating to fair value adjustments for APLUS’ assets and liabilities has been reclassified, from the press release dated May 24, 2005, from total intangibles amortization to respective revenue and expense categories. There is no impact on the reported net income and the cash basis net income. However, ordinary business profit declined by JPY 2.9 billion and correspondingly, total intangibles amortization decreased by the same amount.
1)
1)

32
After the secondary offering, ownership of top 10 shareholders declined from 72.4% to 42.9%
Ownership of Foreign Entity declined from 74.0% to 57.2%
Ownership of Individual and others increased from 14.3% to 24.0%
Breakdown of Shareholders
(1) Assumed conversion price of Series B Preferred as JPY 610 based on stock price as of March 31st, 2005 (2) Foreign Entity includes New LTCB Partners and GGR Cayman(3) Others include securities firm and other institutions(4) Government represents Deposit Insurance Corporation and Resolution and Collection Corporation
Ordinary Shares
Fully Diluted(2)
(1)
(3)(4)
Breakdown of Ordinary Shareholders
9/2004 vs 3/2005
Breakdown of Shareholders on a fully diluted basis 3/2005
14.3%
24.0%
9.0%13.0%
74.0%
57.2%
0%
20%
40%
60%
80%
100%
9/2004 3/2005Foreign Entity Individuals and OthersFinancial Institutions Others
Top 10
42.9%
Top 10
72.4%Foreign Entity
Financial InstitutionsIndividuals and Others
Others
38%
16%9%
4%
33%
Foreign Entity Individulal and OthersFinancial Institutions OthersGovernment
9/2004 3/2005 9/2004 3/2005 9/2004 3/2005 9/2004 3/2005 9/2004 3/2005
Ordinary Shares 74.0% 57.2% 14.3% 24.0% 9.0% 13.0% 2.7% 5.8% - -(1,358 million shares)Fully Diluted 49.8% 38.4% 9.6% 16.1% 6.0% 8.8% 1.8% 3.9% 32.8% 32.8%(2,021 million shares)
Government ownedPreferred Shares
Foreign Entity Individual and Other Financial Institution Others
Foreign Entity
Individual, Others
Financial Institutions Others Government

33
Revenue Mix Continues to Diversify
Further progress in revenue diversificationNon-interest income grew significantly and interest income increased for the first time since FY2001
Note: FY2004 figure is management accounting basis
85.8 88.466.1 57.1 66.8
16.131.3
41.6 66.4
111.1
84.2%73.9%
61.4%
46.2% 37.6%
15.8%
26.1%
38.6%
53.8%
62.4%
0
50
100
150
200
250
FY2000 FY2001 FY2002 FY2003 FY20040.0%
20.0%
40.0%
60.0%
80.0%
100.0%
Net Interest Income Non Interest Income
Interest Income/Revenue Non Interest Income/Revenue
Revenue Composition
JPY bn %

34
Enhanced Funding Mix
Low-cost and diverse sources of fundingGreater contribution from retail deposits
74%63%
51% 46% 40%
19%
20%
16%16%
12%
7%17%
33% 39%48%
0.66%0.64%0.69%
0.88%
1.2%
0%
20%
40%
60%
80%
100%
3/2001 3/2002 3/2003 3/2004 3/20050.0%
0.3%
0.6%
0.9%
1.2%
1.5%
Institutional Deposits/Debentures Retail Debentures
Retail Deposits Average Cost of Interest Bearing Liabilities
Funding Composition and Average Cost of Interest Bearing Liabilities
35
Reduction of NPLs *1
JPY Bn %
Strong Balance Sheet
*1 Non-consolidated basis
Decreased NPLs by JPY 1.8 trillion (or 97%) over 5 yearsIndustry leading coverage ratioRemain conservatively reserved
NPL Coverage Ratio / NPL Ratio
As of 3/2005 %
1,864.6
1,296.01,113.6
233.297.3 51.8
22.0%19.0% 20.0%
5.7%2.8%
1.4%
0
500
1,000
1,500
2,000
2,500
Mar-00 Mar-01 Mar-02 Mar-03 Mar-04 Mar-050%
5%
10%
15%
20%
25%
NPL Amount NPL Ratio
73.4%76.6%90.5%
71.6%
94.3%
4.1%
2.2%3.3%
2.7%1.4%
0%
20%
40%
60%
80%
100%
Shinsei MTFG SMFG Mizuho UFJ0.0%
2.0%
4.0%
6.0%
8.0%
10.0%
12.0%
14.0%
16.0%
NPL Coveage Ratio NPL Ratio

36
High Quality Capital Base
Tier I ratio after APLUS and Showa Leasing acquisition: 7.0%Capital quality supports growth strategy
Net deferred tax asset portion remain at approximately 0.9% of Tier I
5.3%6.2%5.4%
7.6%7.0%
10.4%11.9%
9.9%
11.8%11.8%
0.0%
4.0%
8.0%
12.0%
Shinsei MTFG SMFG Mizuho UFJ
Tier I Ratio BIS Ratio
Regulatory Capital RatioAs of 3/2005 %
Tier I Capital QualityAs of 3/2005 %
52%
76%
53%
0.9%10%
48%
24%
47%
99.1%90%
0%
20%
40%
60%
80%
100%
Shinsei MTFG SMFG Mizuho UFJ
Core Capital Net DTAs

37
Institutional Banking:Revenue Composition by Customers
1) Include revenue from petrochemical industry, wholesale, construction, hotel, automobile, movie, metal industry, energy and others
Others33%
Financial37%
Real Estate17%
Public Sector5%
ManufacturingIndustry
3%
Retail1%
Transportation2%
Lease2%
Financial Real Estate Public SectorManufacturing Industry Lease TransportationRetail Others
Lease2%
Transportation4%
Retail2%
ManufacturingIndustry
3%
Public Sector6%
Real Estate13%
Financial37%
Others33%
Financial Real Estate Public SectorManufacturing Industry Lease TransportationRetail Others
1) 1)
Revenue Composition FY2003 Revenue Composition FY2004

38
Both Consumer & Commercial Finance Sectors Are In a Period of Consolidation
1995 2004 2015?
# Cons Fin Co’s 6,798 6,060 <5,000?
# Shinpan Co’s 139 105 <75?
# Leasing Co’s 218 158 <100?
# Shoko Co’s 4,839 3,003 <2,000?Source: Tapals Website
Shinsei’s Consumer & Commercial Platforms / Management Well Positioned within their Industries to Participate in Industry Consolidation
39
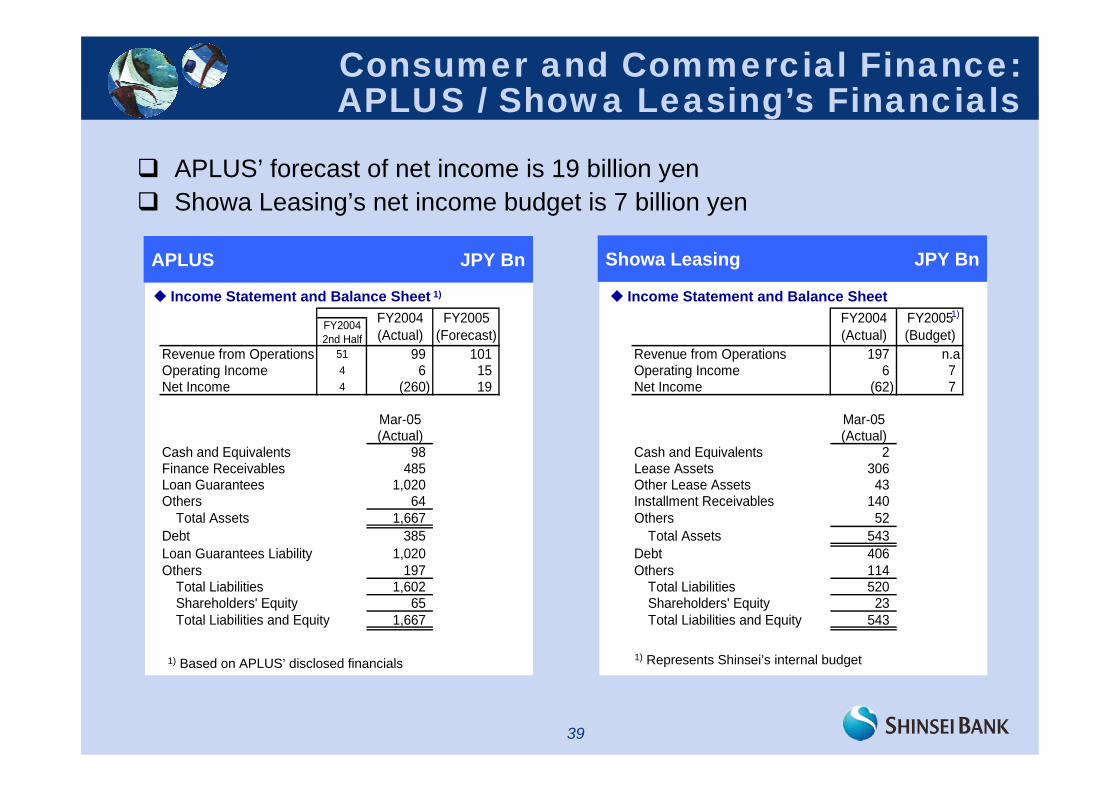
Income Statement and Balance Sheet 1)
Consumer and Commercial Finance: APLUS / Showa Leasing’s Financials
Income Statement and Balance Sheet
1) Based on APLUS’ disclosed financials 1) Represents Shinsei’s internal budget
APLUS’ forecast of net income is 19 billion yenShowa Leasing’s net income budget is 7 billion yen
1)FY20042nd Half
Revenue from Operations 51 99 101 Revenue from Operations 197 n.aOperating Income 4 6 15 Operating Income 6 7Net Income 4 (260) 19 Net Income (62) 7
Mar-05 Mar-05(Actual) (Actual)
Cash and Equivalents 98 Cash and Equivalents 2Finance Receivables 485 Lease Assets 306Loan Guarantees 1,020 Other Lease Assets 43Others 64 Installment Receivables 140
Total Assets 1,667 Others 52Debt 385 Total Assets 543Loan Guarantees Liability 1,020 Debt 406Others 197 Others 114
Total Liabilities 1,602 Total Liabilities 520Shareholders' Equity 65 Shareholders' Equity 23Total Liabilities and Equity 1,667 Total Liabilities and Equity 543
FY2004(Actual)
FY2005(Forecast)
FY2004(Actual)
FY2005(Budget)
APLUS JPY Bn Showa Leasing JPY Bn

40
Consumer and Commercial Finance: Acquisition Related Intangibles
Net asset book value 22.6Fair value adjustments to assets and liabilites (1.6)Identified intangible assets 10.1Associated deferred tax assets (5.4)
Net asset fair value 25.6Minority interest (0.9)
Net asset fair value attributable to Shinsei 24.7Shinsei's investment 75.9
Consolidation goodwill (as of Mar-05) 51.2
Net asset book value (180.9)Fair value adjustments to assets and liabilities 3.9Identified intangible assets 70.9Associated deferred tax liability (30.4)
Net asset fair value before capital injection (136.4)Capital injection 241.0
Net asset fair value after capital injection 104.5Minority interest (Class D and E Preferred Shares) (49.6)
Net asset attributable to Shinsei 54.8Shinsei's investment 253.5
Consolidation goodwill 198.6
Consolidation goodwill amortization (2004/10 - 2005/3) (4.9)Consolidation goodwill outstanding (as of Mar-05) 193.6
Identified Intangibles & Consolidation Goodwill Calculation
Identified Intangibles & Consolidation Goodwill Calculation
Amortization Method
Amortization Method
Amortization of APLUS and Showa Leasing’s identified intangibles, net of deferred tax liabilities and amortization of consolidation goodwill is budgeted as 30 billion yen in FY200550% of total intangibles are expected to be amortized in the first 5 years
Budgeted Total Intangible Amortization in FY2005 JPY Bn
1) Consolidation goodwill is amortized over 20 years using straight line depreciation
1)
1) UsefulLife
AmortizationMethod
Trade name 1.9 10 Years Straight LineExisting customer relationship 6.1 20 Years Sum of Year's DigitsMaintenance component contract 1.1Sublease contract 0.8Total identified intangible assets 10.1
Straight Line(remaining life of each contract)
FairValue
UsefulLife
AmortizationMethod
Trade name and trademarks 6.7 10 Years Straight LineCustomer relationships 12.3 10 Years Sum of Year's DigitsMerchant relationships 51.8 20 Years Sum of Year's DigitsTotal identified intangible assets 70.9
FairValue
Identified intangibles 8 1 9Related tax benefit (3) (1) (4)Consolidation goodwill 20 5 25Total intangible amortization 24 6 30
APLUS Showa Leasing Total
APLUS JPY Bn Showa Leasing JPY Bn

41
Retail Banking:Growth in AUM and Housing Loans
Total assets under management exceeded JPY 3.2 trillion“Powered One” deposit volume reached JPY 530 billion*1
“PowerSmart” loan balance reached JPY 260 billion*1
0.0
0.5
1.0
1.5
2.0
2.5
3.0
3.5
9/2001 3/2002 9/2002 3/2003 9/2003 3/2004 9/2004 3/2005
0
200
400
600
800
1,000
1,200
1,400
1,600
Total AUM # of accounts
0
50
100
150
200
250
300
3/2002 9/2002 3/2003 9/2003 3/2004 9/2004 3/2005
0
2
4
6
8
10
12
14
Balance Customers
*1 As of March 2005
Growth in AUM and # of Accounts
JPY Tn Accounts (Thousands)
Growth in PowerSmart Housing Loans
JPY Tn Customers (Thousands)