Embed Size (px)
Citation preview

SWP737
Sustaining World Economic Recovery
laE C O pyThe Challenges Ahead
FILE COPY Jean BanethEnzo Grilli
WORLD BANK STAFF WORKING PAPERSNumber 737
4FILE COPY
Pub
lic D
iscl
osur
e A
utho
rized
Pub
lic D
iscl
osur
e A
utho
rized
Pub
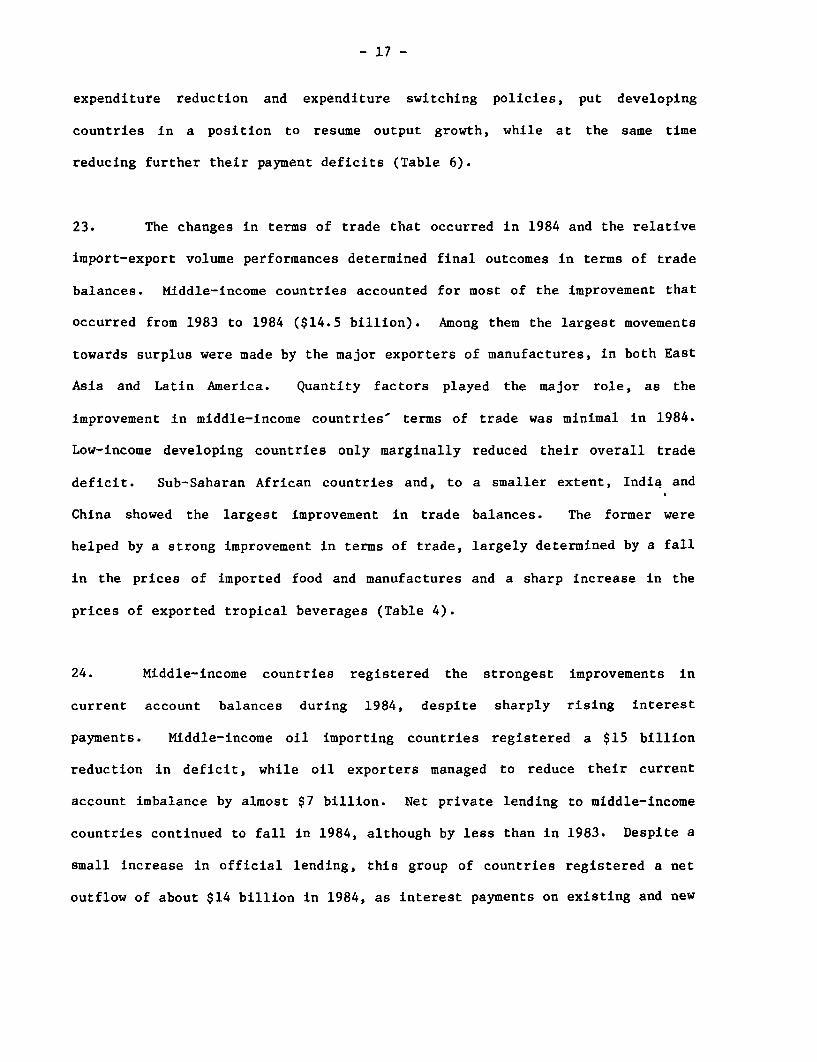
lic D
iscl
osur
e A
utho
rized
Pub
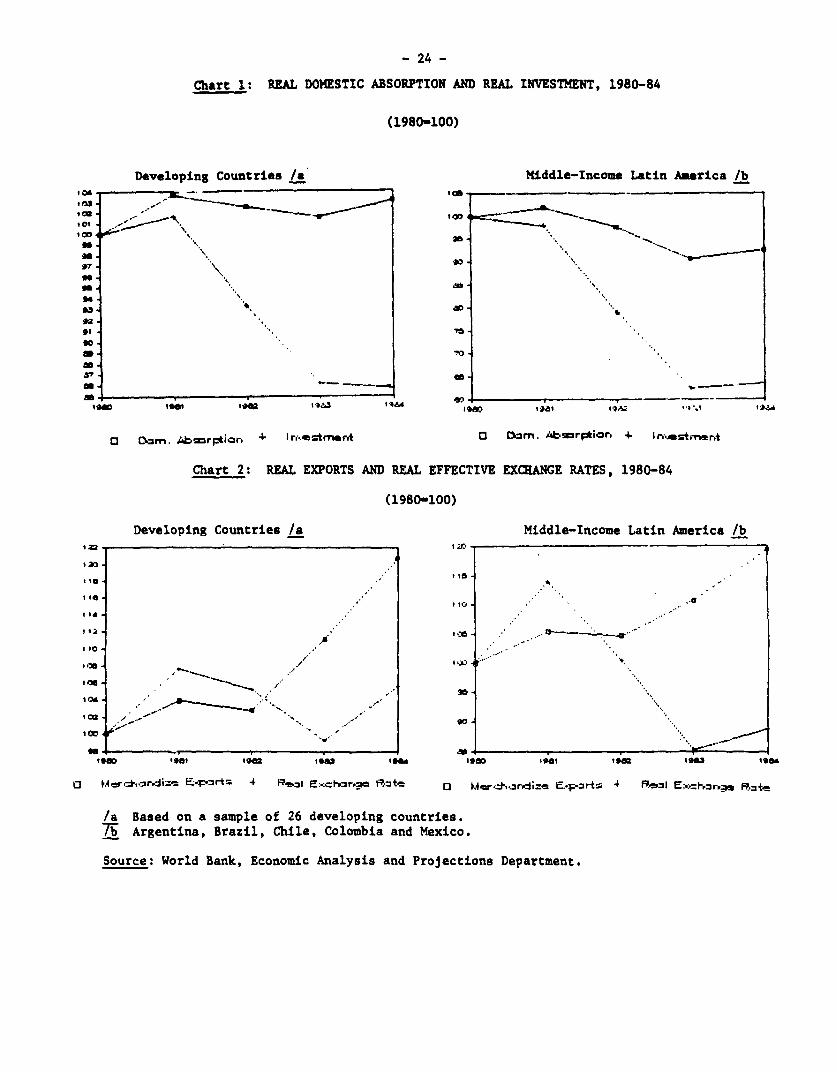
lic D
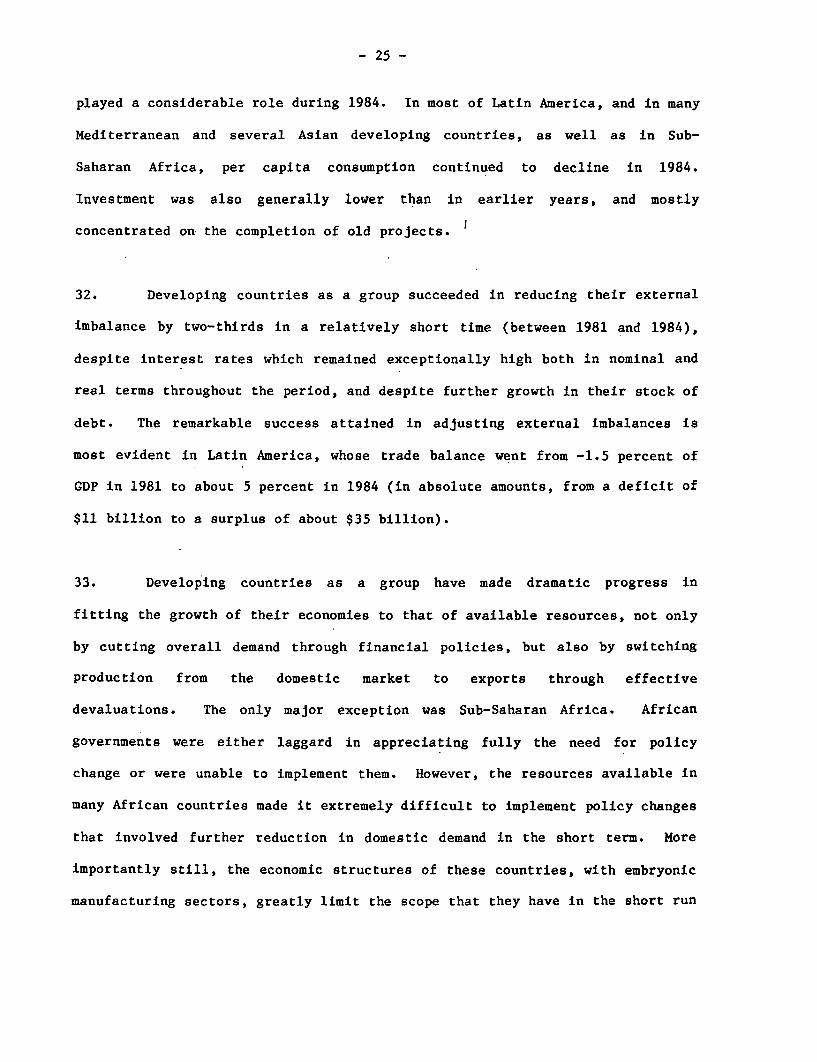
iscl
osur
e A
utho
rized


WORLD BANK STAFF WORKING PAPERS ,W7Number 737
Sustaining World Economic Recovery
The Challenges Ahead
Jean BanethEnzo Grilli
The World BankWashington, D.C., U.S.A.

Copyright (C 1985The International Bank for Reconstructionand Development/THE WORLD BANK
1818 H Street, N.W.Washington, D.C. 20433, U.S.A.
All rights reservedManufactured in the United States of AmericaFirst printing May 1985
This is a working document published informally by the World Bank. To present theresults of research with the least possible delay, the typescript has not been preparedin accordance with the procedures appropriate to formal printed texts, and the WorldBank accepts no responsibility for errors. The publication is supplied at a token chargeto defray part of the cost of manufacture and distribution.
The World Bank does not accept responsibility for the views expressed herein, whichare those of the authors and should not be attributed to the World Bank or to itsaffiliated organizations. The findings, interpretations, and conclusions are the resultsof research supported by the Bank; they do not necessarily represent official policy ofthe Bank. The designations employed, the presentation of material, and any maps usedin this document are solely for the convenience of the reader and do not imply theexpression of any opinion whatsoever on the part of the World Bank or its affiliatesconcerning the legal status of any country. territory, city, area, or of its authorities, orconcerning the delimitation of its boundaries, or national affiliation.
The most recent World Bank publications are described in the annual spring and falllists; the continuing research program is described in the annual Abstracts of CurrentStudies. The latest edition of each is available free of charge from the Publications SalesUnit, Department T, The World Bank, 1818 H Street, N.W., Washington, D.C. 20433,U.S.A., or from the European Office of the Bank, 66 avenue d'lena, 75116 Paris, France.
Jean Baneth is director of the Economic Analysis and Projections Department of theWorld Bank; Enzo Grilli is an assistant director.
Library of Congress Cataloging in Publication Data
Baneth, Jean, 1936-Sustaining world economic recovery.
(World Bank staff working papers ; no. 737)1. Developing countries--Economic conditions.
2. International economic relations. 3. Economichistory--1971- . I. Grilli, Enzo R. II. Title.III. Series.HC59.7.B327 1985 338.9'009172'4 85-9529ISBN 0-8213-0546-8
ABSTRACT
The paper analyzes the characteristics of the 1983-84 world economic
recovery and its effects on developing countries adjustment. It looks at the
conditions for medium-term non-inflationary growth in the world economy and at
the changes in policies necessary to cope with and redress over, time the real
and financial imbalances that threaten the sustainability of the current
recovery. It presents a scenario for medium-term growth, resulting from
moderate policy changes in industrial countr-ies, within which-the room for
growth and continued policy adjustment in developing countries is' examined in
some detail. The risks of failure inherent in a continuation -of present
policy trends are also examined.
ACKNOWLEDGEMENTS
This paper draws extensively on work done in the Global Analysis &
Projections Division of EPD. In addition, Messrs. Peter Miovic, Christian
Moran, Paul Armington, Denis Richard and Charles Larkum contributed in various
ways to the preparation of this paper. Their help is gratefully acknowledged.

RESUME
Cette note analyse les characteristiques de la reprise
economique mondiale en 1983-84, et ses effets sur l'ajustement des
pays en developpement. Elle examine les conditions d'une croissance
a moyen terme dans la stabilite des prix, et les modifications qu'il
faut apporter aux politiques economiques afin de corriger les
desequilibres, financiers et reels, qui risquent de compromettre la
poursuite de la reprise actuelle. Elle presente un scenario de
croissance a moyen terme qui serait le resultat d'adaptations modestes
des politiques economiques des pays industriels, et elle examine
l'impact de ce scenario sur la croissance economique des pays en
developpement, et sur leur capacite a mener a bien des politiques
d'ajustement. Finalement, la note examine aussi les risques que
presenterait une continuation des politiques actuelles.
REMERCIEMENTS
Cette note est en grande partie basee sur le travail de la
Division d'Analyse et Projections Globales du Departement d'Analyses
et de Projections Economiques. De plus, Messieurs Peter Miovic,
Christian Moran, Paul Armington, Denis Richard et Charles Larkum ont
beaucoup contribue a sa preparation. Les remercient vivement de leur
aide.

RESUMEN
El trabajo analiza las caracterfsticas de la recuperacio'n
economica mundial de los anios 1983-84 y sus efectos en el ajuste de los
pafses en vias de desarrollo. Describe las condiciones para un
crecimiento no-inflacionario a mediano plazo en la economfa mundial, y
los cambios en las polfticas necesarios para enfrentar y revertir los
desequilibrios reales y financieros que amenazan el sostenimiento de la
recuperaci6n actual. Presenta un escenario a mediano plazo que supone
un ajuste moderado en las polfticas econo'micas de los palses
industrializados, y que sirve para examinar en detalle las posibilidades
de crecimiento y ajuste en las poifticas de los pafses en desarollo.
Los riesgos inherentes a una continuacion de las polfticas econo'micas
actuales son tambien examinados.
AGREDECIMIENTOS
Este estudio descansa en gran parte en el trabajo efectuado en
la Division de Analisis Global y Proyeciones del Banco Mundial. Los
seniores Peter Miovic, Cristian Moran, Paul Armington, Denis Richard y
Charles Larkum contribuyeron en variadas formar a la preparacio'n de este
trabajo. Agradezco enormemente la colaboracion que ellos prestaron.


TABLE OF CONTENTS
Page No.
SUMMARY AND CONCLUSIONS ............................................ ix
I. INTRODUCTION ................................................. 1
II. THE ENVIRONMENT FOR THE DEVELOPING COUNTRIES: ECONOMICRECOVERY IN THE INDUSTRIAL COUNTRIES, 1983-84 .............. 3
III. FINANCIAL ADJUSTMENT IN DEVELOPING COUNTRIES: 1982-84 ... ..... 11
IV. THE CHALLENGES AHEAD: TRANSITION TOWARDS SUSTAINABLE LONG-TERM GROWTH ................................................ 28
V. MEDIUM TERM ALTERNATIVES FOR INDUSTRIAL AND DEVELOPINGCOUNTRIES ........ 34
A. A Medium-Term Scenario with Moderate PolicyAdjustments: 1985-90 ............................ 36
A.1. The Industrial Countries .... .......... 36A.2. The Developing Countries .... .......... 43
B. The Risks of Non-Adjustment and the Effects onDeveloping Countries ............................. 55


SUMMARY AND CONCLUSIONS
i. The world economy is now in a revival phase. In 1981-82 it suffered
its deepest and most widespread recession in half a century, and in 1982-83
the debt servicing problems of many developing countries imposed strains on
the international financial system that at times threatened it with breakdown.
ii. Real output increased by 2.6 percent in 1983 and by an estimated 4.2
percent in 1984. World trade has also recovered strongly. After declining in
both volume and value terms in 1982 and showing only a modest volume increase
in 1983, world exports are estimated to have grown by between 8 and 9 percent
in 1984. Despite the pace of this recovery, inflation in the industrialized
countries has continued to moderate. In 1984, expressed in terms of the GDP
deflator, it fell to its lowest level since the late 1960s, and a further
modest improvement is anticipated for 1985.
iii. This performance shows important gains from the policy changes
adopted by industrialized countries in response to the 1979-80 oil price
shock, when aggregate demand was adjusted downwards (in contrast to the demand
supporting policies widely pursued after the 1973-74 oil shock) and monetary
policies were tightened. It has also provided a vital respite for debtor
countries facing the need both to allocate a higher proportion of foreign
exchange earnings to debt service and to shift resources within their
economies to more productive sectors. The recovery in world trade, strongly
fuelled by US import demand, has encouraged exports, enabling adjustment--
- ix -

especially for the major Latin American debtor countries--to be undertaken in
an environment of positive economic growth. Internal policies, however, were
critical to the progress made by developing countries in financial adjustment
during the 1982-84 period.
iv. Progress in recovering from the economic and financial difficulties
of the years immediately following the second oil shock has thus been
tangible. Important imbalances and disequilibrium persist, however. This is
true of the progress in adjustment made by different groups of debtor
countries and of the economic stances of the developed countries. It is also
true of real interest rates, exchange rates, and, very importantly, of
attitudes towards trade and the reviving tendency of protectionism. Given the
scale of the problems that developed in the 1970s--quantitatively reflected in
such variables as the size of developing countries' debts and their debt
ratios, and the current account imbalances of key industrial countries--these
disequilibria will need to be addressed and progressively corrected over a
period of years for real stability to return as an inherent property of the
world economy.
v. For both developed and developing economies the necessary changes
will be more easily effected against a background of steady, reliable and
strong overall output growth. Indeed, without such a background it is
questionable whether rigidities in the developed economies could be
successfully removed, and whether--in circumstances of continuing high real
interest rates and uncertain access to export markets--developing countries
could maintain the momentum of adjustment needed to sustain creditor

confidence and, avoid a recurrence of widespread financial disruption. For
both groups of countries a failure of growth would involve high, social and
political, as well.-as economic, costs.
vi. This paper examines the issues involved in moving from the present
recovery phase in the economic cycle to a sustainable level of world output
growth adequate to permit a workable resolution of the problem of present debt
levels carried by the developing countries.
vii. Three factors precipitated the debt and-payments crisis-of the early
1980s: the deterioration in the debtors terms of trade, the sharp rise in
interest rates, and the weakness in export demand that resulted from recession
in the- industrialized countries. These undermined the basis on "which the
rapid growth of lending had previously been undertaken--namely, the relative
stability of debtor countries debt servicing ratios through the 1970s--and
precipitated a sudden loss of confidence by creditors.
viii. Underlying these visible causes were other, more fundamental
factors. Borrowing had been used by many countries to sustain policies that
delayed necessary adjustment and allocated investment inefficiently. Exchange
rates were -left to go out of balance reducing price competitiveness in export
markets that had become less assured because of growing -trade protectionism.,
ix. Both for internal and external reasons, therefore, all debtor
countries faced the need to reduce domestic consumption relative to output and
to achieve a new balance of resource allocation in their economies through

appropriate policy change. As the paper shows, the need for adjustment, in
nature and scale, was different in different groups of countries, and
structural flexibilities and policy capabilities were also different across
countries. Some countries, by timely action and as a result of long-
established patterns in the orientation of their economies, avoided the need
to reschedule their debts, thereby retaining some flexibility in their access
to external finance. Others responded early and vigorously and have achieved
substantial progress in adjusting their external payments position. Others
have scarcely begun the process. While still others, mainly among sub-Saharan
African countries, appear to have little prospect of restoring growth through
adjustment without considerable further financial assistance on concessional
terms.
x. Even among those major debtors, however, whose progress in improving
their payments position has been of vital importance in reducing financial
tensions, the balance and durability of adjustment so far achieved leave room
for uncertainties. Investment has borne the brunt of domestic demand
compression, falling by 40 percent between 1981 and 1983 in the four major
Latin American oil importing debtor countries. While the tempo of domestic
policy reform needs to be maintained and, for many debtor countries,
quickened, the emphasis must shift towards patterns sustainable in the longer-
term.
xi. The external environment in which this shift is undertaken is likely
to be crucial to its outcome. In this regard the role of economic policies in
the developed and developing economies is both critical and clear. Industrial

countries policies will largely determine the level of real interest rates,
the freedom of world trade movements and, through the aggregate current
account position maintained by the developed countries, the levels of
financing available to the developing countries. Developing countries
policies will determine to a significant extent where better external
conditions are translated into domestic growth.
xii. The paper focuses on the changes in policies that industrialized
countries will need to implement over the period 1985-90 in order to establish
the basis for sustainable growth in the world economy after 1990 and on the
scope that this will leave to developing countries trade, finance and
growth. The necessary adjustments to policy are moderate and should be
implemented gradually, but they cannot be long delayed. A key component is a
change in the current fiscal stance of the United States and a corresponding
realignment of US monetary policy, together with a sympathetic untightening of
monetary conditions in Europe and a reduction of the degree of restrictiveness
of fiscal policies in those countries where room for manouver exists from the
standpoint of inflation. Japan also falls in this category of countries.
xiii. The remainder of this decade could be either a period of transition
to renewed worldwide economic growth in a reasonably stable price environment,
or one of disorder and decline. This sombre scenario is easy to imagine.
Continued budget deficits in the United States at the level now assumed by the
Congressional Budget Office in case no policy is initiated to contain them,
would feed a continued and growing current account deficit. This would become
increasingly difficult to finance, putting upward pressure on interest

rates. In such an environment, a growing trade deficit in the U.S. and
continued slow growth in Europe would feed pressures which would easily lead
to increased trade protectionism. Growth in the industrial countries would
falter and reach an average of only 2.5 percent for the rest of the decade.
Exports of the developing countries would suffer both from a slow growth of
overall demand and protectionism, and would grow only at a rate of perhaps 3
percent. Overall GNP growth in developing countries would amount to only
about 4 percent; only about 3 percent excluding India and China whose relative
inward orientation and low debt would, for a time, somewhat protect them from
the implications of this scenario. Taking into account the decline in their
terms of trade, most developing countries would face stagnating or declining
per capita incomes.
xiv. But this picture might be overoptimistic. The financing crisis of
U.S. deficits might emerge suddenly and precipitate a sharp recession with
growth much below the average for a year or two. This would have obvious
implications for the developing countries' debt servicing ability. Even under
the scenario depicted above, the developing countries would have to generate
continuous large trade surpluses to service their debt, under conditions of
slow growth. Industrial countries would have to be willing to accept
corresponding trade deficits despite their unemployment. Commercial banks,
through involuntary lending or rescheduling would have to continue slowly
increasing their exposure in developing countries, despite the latters
impaired prospects.

xv. However, this scenario is not unavoidable. Timely, moderate, but
credible reduction in U.S. fiscal deficits could still bring about a much
better outcome. The US dollar could decline gradually, and allow gradual
decline in real dollar interest rates. If this is accompanied by some
relaxation of financial policies in other industrial countries (mostly
monetary in Europe, largely fiscal in Japan), and by adequate wage and other
factor cost restraints, industrial countries could grow at a rate of 3 percent
for the remainder of the decade and somewhat faster thereafter. Protectionism
could then be more easily contained and developing countries exports grow at a
rate of about 5 percent. Middle-income developing countries would then have
an environment which could allow them to rebuild their debt service capacity
and commercial banks gradually return towards modest, voluntary lending to
them. Under this scenario, overall developing countries GNP could grow at 5
percent allowing room for growth in per capita incomes. Only in Sub-Saharan
Africa would income growth not resume till the end of the period; but at least
declines would halt.
xvi. Of course, the international environment, determined by the
industrial countries policies, is only a necessary, not a sufficient
condition, for such an outcome. Developing country policies would also have
to continue to improve, both in moving towards reduction of internal and
external imbalances and in terms of greater factor movement flexibility and
improved pricing.
xvii. The acceptable outcome outlined above is not the best possible. One
can imagine better ones. They would require firmer correction of financial

imbalances in the industrial countries, roll back rather than containment of
protectionism, and more official capital flows. They would also require
bolder movement toward improved policies in the majority of developing
countries. While one cannot realistically count on this happening within the
transition period under consideration, it is perhaps not too much to fix such
improved policies and the faster growth they entail as a realistic and
attainable goal for the 1990s.

I. INTRODUCTION
1. In 1981 and 1982 the world economy suffered its deepest and most
widespread recession in half a century. By 1983, recovery was under way, and
it strengthened and spread further in 1984. It helped to relax payments
tensions, to ease the path of domestic adjustment policies in developing
countries and to contain the "debt crisis". Beyond these positive results,
however, causes for concerns remain. Not the least of which is that a major
driving force behind the recovery so far has been the emergence of new
disequilibria in domestic finances, external payments and factor employment
within industrial countries, which are themselves not sustainable in the
medium term.
2. The world economy has not yet returned to an even growth path. Aside
from the real and financial imbalances that still need to be corrected, trade
protectionism is still a major threat and the danger of financial insolvency
is still present for several countries. Furthermore, many industrial and
developing countries will continue to face serious structural adjustment
problems for several years, as adaptation to past price, demand and supply
changes necessary to ensure fuller employment of existing factor supplies,
especially labor, is still far from complete in many of them.
3. The present economic recovery presents both opportunities and
challenges to policy makers in industrial and developing countries. Its
continuation in the medium term, which is in their strong common interest,
requires that economic policies be consistent with this objective. Current

- 2 -
policies must therefore be continuously reassessed, to identify the changes
needed to achieve and maintain such consistency. Sustaining the current
recovery, moreover, both depends upon and is a precondition for a return to
durable trade and financial equilibria and for making steady progress in
redressing the structural imbalances that stand in the way towards sustainable
long-term non-inflationary growth.
4. Transition from the present cyclical recovery to steady long-term
growth will have to be managed during the remainder of this decade, and this
is the focus of this paper. The first part deals briefly with the overall
impact on developing countries of the 1983-84 economic recovery in industrial
countries. The second part examines in some detail the external adjustment
paths followed by developing countries. The third part sums up the policy
challenges that lie ahead. The last section deals specifically with the
medium term prospects for the world economy and for developing countries in
particular, in the event of moderate policy adjustments in industrial
countries, and also assuming continuation of present policy trends.

- 3 -
II. THE ENVIRONMENT OF THE DEVELOPING COUNTRIES: GLOBAL ECONOMIC
RECOVERY IN THE INDUSTRIAL COUNTRIES, 1983-84
5. The world economy now appears to be on the mend. In 1983-84 the
major industrial countries succeeded in setting their economies on a recovery
path, while also reducing inflation. In developing countries the growth of
output was less fast and domestic inflation rates were still on the rise, but
despite rising interest rates and associated debt service burdens, many of
them made substantial progress in dealing with the payment difficulties. they
faced. On the whole, financial tensions were eased and world output and trade
once again grew.
6. World real output increased by 2.4 percent in 1983 and by an
estimated 4.2 percent in 1984. World trade, which had declined in both volume
and value in 1982 and had returned to a positive, if modest, volume growth in
1983 registered a strong increase in 1984, pulled by the expansion in economic
activity in both industrial and developing countries. The growth of world
exports is estimated at about 9 percent in 1984 (Table 1).
7. Industrial countries- real output grew by 2.6 percent in 1983 and,
according to preliminary estimates, by 4.8 percent in 1984. Recovery in
industrial countries was still regionally unbalanced. Real growth was fastest
in the United States, whose economic expansion fueled the world recovery.
Japan followed, with the second highest rate of growth of real domestic
product for the whole year, and resumed its traditional place as the fastest
growing industrial economy in the second half of 1984. Europe's recovery was
at best tentative and slow, and unemployment there continued to increase.

- 4 -
Table 1: WORLD OUTPUT, TRADE AND PRICES
Actual Estimated Projected1981 1982 1983 1984 1985
(------------------% change…-----------------
REAL OUTPUT
Industrial Countries 1.9 -0.5 2.6 4.8 3.1Developing Countries 3.3 1.9 2.0 4.1 4.5High-Income Oil Exporting
Countries 0.1 -1.7 -7.0 0.4 3.6East European Countries 1.8 2.1 3.0 2.6 2.7
World 2.0 0.0 2.4 4.2 3.3
TRADE (EXPORT VOLUMES)
Industrial Countries 2.2 -1.6 2.0 9.0 6.0Developing Countries -1.3 3.1 5.8 8.9 6.8
World /a 1.5 -2.0 2.1 8.6 5.7
TRADE ($ PRICES)
Export Unit Values ofIndustrial Countries -3.8 -4.0 -3.5 -3.2 4.0
Export Unit Values ofDeveloping Countries -5.0 -6.7 -3.4 -2.5 -2.2
Manufactures' ExportPrices (MUV) -5.0 -1.9 -4.2 -2.8 5.0
Non-Fuel Primary CommodityPrices -18.5 -16.8 3.7 -2.1 1.1
Oil Prices 12.4 -3.2 -12.3 -2.4 0.0
DOMESTIC PRICES (LOCAL CURRENCIES) /b
Industrial Countries 10.5 7.8 5.3 5.0 4.5Developing Countries 30.0 30.5 41.5 47.5 44.0
/a Including estimates for high-income oil exporting countries and the EastEuropean economies.
/b Consumer prices (weighted averages).
Sources: OECD, IMF, World Bank.

- 5 -
8. Despite the pace of the recovery, inflation generally continued to
moderate in the industrial countries. Overall, the rate of increase of the
GDP deflator expressed in national currencies fell to its lowest level since
the late 1960s. Continued restraint in monetary policy, moderation in the
growth of wages and other industrial input costs were the key to this positive
performance. In the United States and in Japan price stability was bolstered
by rising exchange rates (Table 2). But the progress made against inflation
was equally solid in Europe, and given the cost-push impact of depreciating
exchange rates, this is perhaps even more remarkable.
9. The recovery of world demand did not exert any significant upward
pressure on traded good prices. The prices of manufactures exported by
industrial countries rose even less than their GDP deflators. Reductions in
domestic inflation rates, coupled with improvements in manufacturing
productivity, and strong competition in export markets helped contain the
increase in manufactured goods prices in terms of domestic currencies. In
dollar terms, their prices continued to fall in 1984 as the dollar continued
to appreciate. The prices of primary commodities also fell in 1984, under the
impact of dollar appreciation and of interest rate increases (Table 2).
10. That the cause of the continued appreciation of the US dollar are not
well understood is illustrated by most observers' having forecast that it
would decline in 1984. What is clear, however, is that the high value of the
dollar, coupled with the early and vigorous resumption of growth in the United
States contributed to a surge of imports. The Federal budget deficit

Table 2: SELECTED MONETARY INDICATORS FOR INDUSTRIAL COUNTRIES
1981 1982 1983 1983 1984iQ 2Q 3Q 4Q iQ 2Q 3Q 4Q
(- %)
A. Short-Term Domestic Interest Rates /a
United States 14.1 10.7 8.6 8.1 8.4 9.2 8.8 9.1 9.8 10.3 9.1Japan 7.7 7.1 6.7 6.9 6.7 6.8 6.5 6.3 6.3 6.3 6.3Germany 12.1 8.9 5.8 5.7 5.4 5.7 6.3 6.0 6.0 6.0 5.9France 15.3 14.7 12.6 12.9 12.6 12.6 12.5 12.7 12.5 11.6 10.8United Kingdom 13.0 11.5 9.6 10.5 9.7 9.3 8.9 8.7 8.7 10.4 9.4
B. Short-Term International Interest Rates
Eurodollar Rate /b 16.5 13.1 9.6 9.2 9.3 10.1 9.9 10.1 11.4 11.9 9.9London Interbank Rate /b 16.8 13.2 9.6 9.3 9.3 10.0 9.8 10.2 11.4 11.8 10.0London Interbank Rate 7T 16.6 13.5 9.8 9.5 9.5 10.4 10.0 10.4 11.8 12.2 10.4
C. Effective Exchange Rates /d (--yearly % change--) (---------- change from previous quarter----------)
United States 12.7 11.7 5.8 -2.8 2.9 3.6 0.3 0.7 0.9 6.0 2.7Japan 13.1 -5.7 10.1 9.2 1.1 0.4 4.4 2.1 1.0 -2.4 1.0Germany -9.5 4.1 2.4 1.7 0.1 -2.4 0.3 0.0 -0.1 -2.1 -1.6France -10.6 -9.1 -8.7 0.5 -5.5 -2.6 -1.6 -1.0 0.1 -2.0 -1.5Italy -13.3 -7.5 -5.1 0.2 -2.0 -2.3 -2.4 -1.5 -0.4 -1.7 -1.9United Kingdom -1.1 -4.8 -8.0 -9.5 4.6 0.6 -2.0 -1.7 -2.5 -2.2 -3.8Australia 10.4 -5.0 -7.3 -2.2 -5.6 3.3 3.9 2.8 -2.4 -3.9 2.8Canada 2.9 1.9 3.2 -0.6 1.1 1.4 -0.3 -1.2 -2.7 0.9 0.8
/a Three months treasury bill rates or private bill rates, except for France and Germany, for which interbank moneyrates are quoted.
/b Three months, on US dollar deposits.7T Six month, on US dollar deposits.7- MERM weights.
Source: IMF, International Financial Statistics (various issues).

- 7 -
constituted a parallel influence, also clearly related to the appreciating
dollar. As a result, US import expenditure rose by 6 percent in 1983 and by
26 percent in 1984, while export revenue grew much less. The trade deficit of
the US rose from $43 billion in 1982 to $108 billion in 1984, and the current
account deficit increased by more than $90 billion over the same period (Table
3).
11. The corresponding increase in the net surplus outside the United
States exercised a powerful expansionary influence on the rest of the world,
equivalent to about 1 percent of world GDP. However, the distribution of this
impulse was uneven. Although emphasis on absolute values is rendered
difficult by the errors and omissions in the world current account balance, 1/
the broad trends are clear. Among industrial areas, the improvement in the
current accounts of Japan and Europe over the 1982-84 period was of about
equal magnitude: $28 billion. However, while improvement in the position of
Japan came as an addition to existing surpluses, Europe reached equilibrium in
its overall current account only in 1983, and improved slightly upon it in
1984. Some European countries are still running sizable deficits, offset by
surpluses in others. One consequence of this is that concerns about balance
of payments, and about the effects of deficits on exchange rates and on
domestic inflation still constrain some European governments' willingness to
relax financial policies in order to stimulate output and employment growth.
1/ "Errors and omissions" have increased rapidly since 1980. See Table 8.
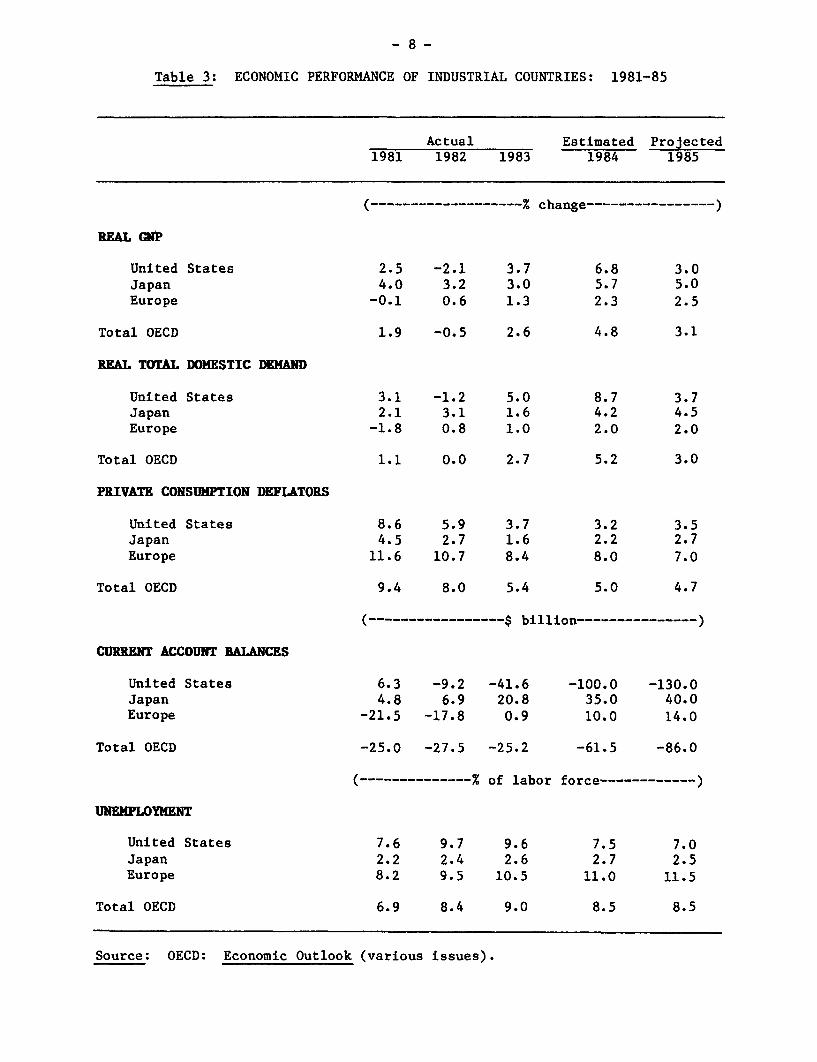
Table 3: ECONOMIC PERFORMANCE OF INDUSTRIAL COUNTRIES: 1981-85
Actual Estimated Projected1981 1982 1983 1984 1985
(-------------------% change----------------)
RETA GNr
United States 2.5 -2.1 3.7 6.8 3.0Japan 4.0 3.2 3.0 5.7 5.0Europe -0.1 0.6 1.3 2.3 2.5
Total OECD 1.9 -0.5 2.6 4.8 3.1
REAL TOTAL DOMESTIC DEMAND
United States 3.1 -1.2 5.0 8.7 3.7Japan 2.1 3.1 1.6 4.2 4.5Europe -1.8 0.8 1.0 2.0 2.0
Total OECD 1.1 0.0 2.7 5.2 3.0
PRIVATE CONSUMPTION DEFLATORS
United States 8.6 5.9 3.7 3.2 3.5Japan 4.5 2.7 1.6 2.2 2.7Europe 11.6 10.7 8.4 8.0 7.0
Total OECD 9.4 8.0 5.4 5.0 4.7
(…--------$ billion---------------)
CURRENT ACCOUNT BALANCES
United States 6.3 -9.2 -41.6 -100.0 -130.0Japan 4.8 6.9 20.8 35.0 40.0Europe -21.5 -17.8 0.9 10.0 14.0
Total OECD -25.0 -27.5 -25.2 -61.5 -86.0
(--------------% of labor force------------)
UNEMPLOYMENT
United States 7.6 9.7 9.6 7.5 7.0Japan 2.2 2.4 2.6 2.7 2.5Europe 8.2 9.5 10.5 11.0 11.5
Total OECD 6.9 8.4 9.0 8.5 8.5
Source: OECD: Economic Outlook (various issues).
12. Table 3 shows the relationship between the movements in GNP, domestic
demand and the balance of payments in the three major industrial areas. In
the United States, real domestic demand grew much faster than real GNP. This
was largely due to the impact of the rapidly growing fiscal deficit in a
country where private savings, traditionally quite low, have barely exceeded
private investments. Demand expansion fueled the growth of GNP, but also gave
rise to the current payments gap, as in the past two years the growth of real
domestic demand exceeded that of domestic product by more than 3 percentage
points. In Europe, in part because of concern with the balance of payments,
the growth of real domestic demand remained below that of GNP, thereby acting
as a break on the growth of real domestic output. As for Japan, where the
balance of payments constraint was never operative and domestic price rises
were also contained more successfully than even in the United States and in
most European countries, the growth in domestic demand accelerated only
recently and remained on average lower than that of GNP, thus contributing to
rising payments surpluses.
13. On the whole, the current account deficit of industrial countries
increased from $25.2 billion in 1982 to $61.5 billion in 1984. This growing
overall payments deficit and the rising imports of the industrial countries
have contributed to easing the developing countries' financial adjustment to
the particular problems of the early 1980s. Their own mounting debt, the
changes intervened in the attitudes of commercial lenders and of aid
suppliers, as well as the rise in interest rates, required the developing
countries to move towards a trade surplus position. This was facilitated by
the developments in the overall trade and payments position of industrial
countries just described.
- 10 -
14. Developing countries' export revenues increased by 8 percent in 1984,
while import expenditure grew by 2.4 percent. Their trade balance went from
an overall deficit of $49 billion in 1982 to a surplus of about $3 billion in
1984. 1/ Their current account imbalance was reduced by two-thirds during the
same period. The upsurge of exports to the United States, and, to a smaller
extent, to Europe and Japan also helped the recovery of domestic output in
most developing countries. On the whole, their real GDP growth rate nearly
doubled between 1983 and 1984. The impact of improved world demand and
relative price conditions 2/ for developing countries exports varied,
depending on individual country's export structure (by product and
destination), capacity to respond to outside stimuli, external financial
position and the nature and extend of the imbalances affecting it. It also
depended critically on the domestic policies that were followed by the various
countries, not only during the 1983-84 recovery period, but also earlier.
1/ See further Table 4.
2/ Developing countries' terms of trade improved in 1984 on account of thedecline in the price of both manufactured products exported by industrialcountries and oil (Table 10).

- 11 -
III. FINANCIAL ADJUSTMENT IN DEVELOPING COUNTRIES: 1982-84
15. In mid-1982, when Mexico's inability to meet its contractual debt
service obligations suddenly transformed the "debt problem" into a "debt
crisis", the world economic recession was at its worst. Economic activity,
export prices and volumes were declining. The sharp reduction of voluntary
private lending to developing countries (for many, a virtual cessation) left
to those countries faced with a pressing need to reduce their balance of
payments deficits no alternative to cutting back their imports. In some
countries, which had either tried to anticipate the- emergence of financial
difficulties or had already been affected by them (e.g. Turkey, Brazil), the
adjustment process began earlier. On the whole, however, developing
countries' imports began to be cut severely in 1982. 1/ In that year overall
import expenditure by developing countries fell by almost 8 percent. Low-
income Sub-Saharan African countries, hit by a dramatic decline in commodity
export revenues, and middle-income Latin American countries, facing the most
acute debt problems, reduced their import outlays most sharply; but. import
cutbacks were general across geographical regions and income groups (Table
4). Except for China and some of the agricultural Asian countries, most
developing countries also suffered declines in GDP growth rates. In the
1/ Unless otherwise specified, the developing countries' data quoted in thispaper refer to a panel of 90 countries, which account for 97 percent- oftotal developing countries' population, 92 percent of total GNP and 86percent of total-exports. The list is provided in Annex Table 1, togetherwith the components of the various regional and analytical subgroups usedin this paper. The IMF grouping. of developing countries that is mostcomparable with the 90 country panel totals is "non-oil developingcountries".
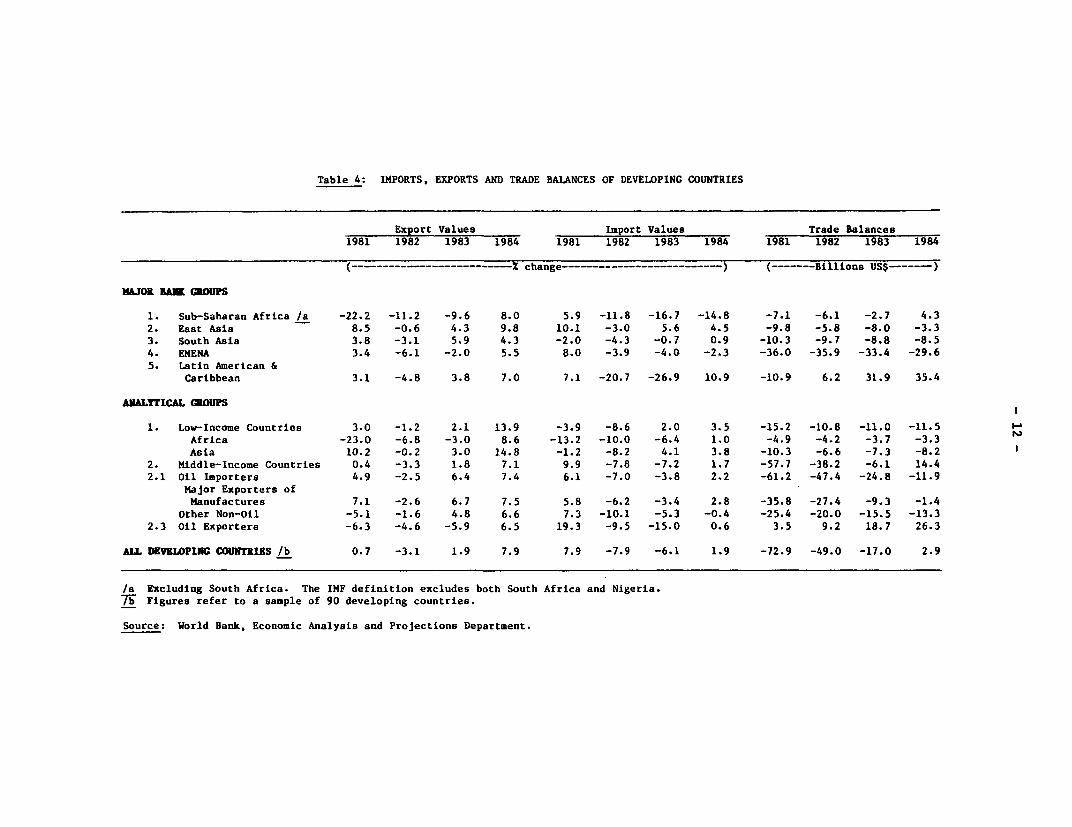
Table 4: IMPORTS, EXPORTS AND TRADE BALANCES OF DEVELOPING COUNTRIES
Export Values Import Values Trade Balances1981 1982 1983 1984 1981 1982 1983 1984 1981 1982 1983 1984
(--…-------------------- % change-------------------- --) ( ----Billions US$------)
LJOR. am GROUPS
1. Sub-Saharan Africa /a -22.2 -11.2 -9.6 8.0 5.9 -11.8 -16.7 -14.8 -7.1 -6.1 -2.7 4.3
2. East Asia 8.5 -0.6 4.3 9.8 10.1 -3.0 5.6 4.5 -9.8 -5.8 -8.0 -3.3
3. South Asia 3.8 -3.1 5.9 4.3 -2.0 -4.3 -0.7 0.9 -10.3 -9.7 -8.8 -8.5
4. EMENA 3.4 -6.1 -2.0 5.5 8.0 -3.9 -4.0 -2.3 -36.0 -35.9 -33.4 -29.6
5. Latin American 6Caribbean 3.1 -4.8 3.8 7.0 7.1 -20.7 -26.9 10.9 -10.9 6.2 31.9 35.4
ANALTTICAL C2DUPS
1. Low-Income Countries 3.0 -1.2 2.1 13.9 -3.9 -8.6 2.0 3.5 -15.2 -10.8 -11.0 -11.5
Africa -23.0 -6.8 -3.0 8.6 -13.2 -10.0 -6.4 1.0 -4.9 -4.2 -3.7 -3.3
Asia 10.2 -0.2 3.0 14.8 -1.2 -8.2 4.1 3.8 -10.3 -6.6 -7.3 -8.2
2. Middle-Income Countries 0.4 -3.3 1.8 7.1 9.9 -7.8 -7.2 1.7 -57.7 -38.2 -6.1 14.4
2.1 Oil Importers 4.9 -2.5 6.4 7.4 6.1 -7.0 -3.8 2.2 -61.2 -47.4 -24.8 -11.9
Major Exporters ofManufactures 7.1 -2.6 6.7 7.5 5.8 -6.2 -3.4 2.8 -35.8 -27.4 -9.3 -1.4
Other Non-Oil -5.1 -1.6 4.8 6.6 7.3 -10.1 -5.3 -0.4 -25.4 -20.0 -15.5 -13.3
2.3 Oil Exporters -6.3 -4.6 -5.9 6.5 19.3 -9.5 -15.0 0.6 3.5 9.2 18.7 26.3
ALL DEVKLOPING COUNTRIES /b 0.7 -3.1 1.9 7.9 7.9 -7.9 -6.1 1.9 -72.9 -49.0 -17.0 2.9
/a Excluding South Africa. The IMF definition excludes both South Africa and Nigeria.
71 Figures refer to a sample of 90 developing countries.
Source: World Bank, Economic Analysis and Projections Department.

- 13 -
regions where import reductions were sharpest, the absolute level of output
actually fell, by about 1 percent in Latin America and by 1.2 percent in Sub-
Saharan Africa (Table 5).
16. In 1983, middle-income Latin American countries, whose debt servicing
difficulties had reached a peak, again reduced their imports expenditure by
compressing real domestic absorption, including investments. Import
expenditure fell by 27 percent and the decline in their real output also
accelerated (to -2.9 percent). The combined effect of such a strong reduction
of imports and of increased exports to the United States and other industrial
countries was a first strong improvement in current accounts during the year.
17. In the course of the adjustment process, private incomes and
consumption expenditures were reduced throughout Latin America. However, the
brunt of the compression of domestic demand fell on investment. In Brazil,
for instance, the value of investment in constant prices was reduced by well
over one-third in three years; in the four major oil-importing debtor
countries (Argentina, Brazil, Chile, and Colombia) total real investments in
1983 were 40 percent below their 1981 level.
18. East Asian middle-income countries provided the sharpest contrast to
Latin America. These countries, and particularly the major exporters of
manufactures, had weathered the 1982 fall in their trade with only a moderate
slowdown in their traditionally fast growth of real output. Recovery of
demand for their exports, particularly in the United States, allowed them to
restore normal import growth rates in 1983, and to raise the growth rate of

- 14 -
Table 5: REAL GDP GROWTH IN DEVELOPING COUNTRIES
Actual Estimated Projected1982 1983 1984 1985
(---------% change--------)MAJOR BANK GROUPS
1. Sub-Saharan Africa /a -1.2 -2.4 -0.8 2.0East Africa 0.1 1.0 1.3 2.6West Africa -1.8 -3.9 -1.7 1.7
2. East Asia 5.4 7.3 7.2 6.3China 7.4 9.0 9.0 7.0Other East Asia 3.8 5.9 5.5 5.8
3. South Asia 2.8 6.2 4.4 5.3India 2.6 6.5 4.2 3-7Other South Asia 3.5 5.2 4.9 6.4
4. EMENA 3.5 2.5 2.6 3.6
5. Latin America and Caribbean -0.9 -2.9 2.8 3.6
WDR ANALYTICAL GROUPS
1. Low-Income Countries 5.0 7.2 6.6 6.0Africa 0.7 07 19 -Asia 5.4 7.8 7.1 6.3
2. Middle-Income Countries 0.8 0.0 3.1 3.8
2.1 Oil Importers 0.8 0.7 3.3 3.8
Major Exporters of 1.3 0.7 3.5 4.0Manufactures
Other Non-Oil -0.7 0.4 2.7 3.2
2.2 Oil Exporters 0.9 -1.0 2.7 3.9
ALL DEVELOPING COUNTRIES /b 1.9 2.0 4.1 4.5
Memorandum Items:
Low-Income Countries (excludingChina and India) 2.3 3.0 3.2 4.3
All Developing Countries(excluding China and India) 0.9 0.2 3.1 3.9
/a Excluding South Africa.lb Including South Africa. Total refers to a panel of 90 developing countries.
Source: World Bank, Economic Analysis and Projections Department.

- 15 -
domestic output while also reducing their external deficits. This pattern
continued and was consolidated in, among others, Korea, Thailand, Hong Kong
and Singapore, whose joint current account balance improved by $4 billion and
whose output growth was in excess of 5 percent during 1983. Better domestic
policies, reflected in lower domestic inflation rates, lower budget deficits
and more adroit exchange rate managements than in other middle-income
developing countries, coupled with greater capacity to respond to changes in
external conditions (built up through years of export-oriented fast
development) helped this fast and relatively painless adjustment.
19. In the middle-income countries of the Middle East, North Africa and
Southern Europe, 1/ the pattern of events followed a course mid-way between
Latin America and the Far East. Turkey, for instance, became unable to meet
its debt service obligations well before the onset of the world recession.
Its adjustment thus begun at a time when external circumstances were more
favorable. In the early 1980s, its exports and real GDP never stopped
growing, and by 1983 private per capita consumption, and by 1984 investments
could also start to recover.
20. As for Asian low-income countries, limited dependence on external
trade partly insulated India and China from external shock. More broadly,
these countries continued to improve their domestic policies, maintaining and
even accelerating their output growth rates. They had contained their balance
of payments deficits in the 1970s, and generally reduced them in the early
1/ These are the countries included in the Bank's EMENA region.

- 16 -
1980s. China moved into substantial surplus. Only in the case of India and
China, however, was the size of the payments deficit policy determined, in the
sense that few, if any, of the other countries in this group had the ability
to borrow much on commercial terms. India and China pursued very cautious
foreign borrowing policies, with the deliberate aim of avoiding excessive
dependence on external capital.
21. Sub-Saharan Africa continued to face the most severe difficulties in
the early 1980s. The value of its exports, almost exclusively primary
commodities, fell by more than 40 percent in 1981-83. Import expenditure had
to be drastically reduced over the same period. The improved trade balance,
however, was not enough to allow the region's debtor countries to meet their
debt service obligations. GDP continued to fall, and per capita incomes, now
frequently below their pre-independence levels, fell even more sharply.
Undoubtedly, domestic policy improvements in the region remained limited and
the policy thrust often unstable; but for these raw material exporters, with
often very trade-dependent economies, the negative evolution of raw material
prices, the lack of recovery in their traditional European markets and the
decline of aid left very little room for sustained adjustment measures which
did not require politically unenforceable sacrifices.
22. The consolidation of economic recovery in industrial countries during
1984, together with the significant shift in policy response that occurred in
many developing countries, determined a major turnaround in adjustment
results. Increased demand for their exports and greater ability to take
advantage of improved export market conditions created by a combination of
- 17 -
expenditure reduction and expenditure switching policies, put developing
countries in a position to resume output growth, while at the same time
reducing further their payment deficits (Table 6).
23. The changes in terms of trade that occurred in 1984 and the relative
import-export volume performances determined final outcomes in terms of trade
balances. Middle-income countries accounted for most of the improvement that
occurred from 1983 to 1984 ($14.5 billion). Among them the largest movements
towards surplus were made by the major exporters of manufactures, in both East
Asia and Latin America. Quantity factors played the major role, as the
improvement in middle-income countries terms of trade was minimal in 1984.
Low-income developing countries only marginally reduced their overall trade
deficit. Sub-Saharan African countries and, to a smaller extent, India and
China showed the largest improvement in trade balances. The former were
helped by a strong improvement in terms of trade, largely determined by a fall
in the prices of imported food and manufactures and a sharp increase in the
prices of exported tropical beverages (Table 4).
24. Middle-income countries registered the strongest improvements in
current account balances during 1984, despite sharply rising interest
payments. Middle-income oil importing countries registered a $15 billion
reduction in deficit, while oil exporters managed to reduce their current
account imbalance by almost $7 billion. Net private lending to middle-income
countries continued to fall in 1984, although by less than in 1983. Despite a
small increase in official lending, this group of countries registered a net
outflow of about $14 billion in 1984, as interest payments on existing and new

- 18 -
Table 6: DEVELOPING COUNTRIES CURRENT ACCOUNT BALANCE AND ITS FINANCING, 1970-84
(Billions of Current US$)
1970 1980 1981 1982 1983 1984
A. OWW-INCOME COUNTRIES
Asia
Net Exports (GNFS) -1.358 -15.755 -11.498 -6.831 -7.246 -8.687Net Factor Income -0.390 0.078 -0.212 -0.983 -0.523 -0.605Interest on KLT Debt -0.286 -1.363 -1.560 -1.515 -1.598 -1.833
Official -0.241 -0.689 -0.657 -0.762 -0.962 -1.079Private -0.045 -0,674 -0.904 -0.752 -0.636 -0.754
Current Account Balance -1.551 -9.685 -6.164 -1.364 -1.001 -3.083(Excl. Official Transfers)
Net Official Transfers 0.370 1.952 2.084 1.884 2.011 1.952MLT Loans 0.987 4.878 3.227 3.957 4.199 6.541
Official 0.971 3.410 3.452 3.883 3.542 4.222Private 0.016 1.468 -0.225 0.074 0.657 2.319
Net Direct Investment 0.029 0.159 0.422 0.488 0.546 0.643Change in Reserves -0.187 0.449 2.406 2.135 -4.224 -3.184Debt Outstandtng and Disbursed 11.524 38.412 39.545 42.941 46.290 52.831
As Percent of GNP 6.958 7.798 8.175 8.850 9.058 9.741*As Percent of Exp. GS 183.636 96.704 89.501 95.064 98.880 100.032
Debt Service Ratio 12.423 7.996 9.295 10.929 8.311 8.443
Africa
Net Exports (GNFS) -0.381 -5.385 -5.391 -4.135 -4.339 -3.784Net Factqr Income -0.161 -0.901 -1.098 -1.004 -1.049 -1.294Interest on MLT Debt -0.080 -0.698 -0.643 -0.567 -0.662 -1.000
Official -0.042 -0.312 -0.259 -0.267 -0.315 -0.435Private -0.038 -0.386 -0.384 -0.300 -0.348 -0.565
Current Account Balance -0.679 -5.837 -5.882 -4.978 -4.900 -4.594(Excl. Official Transfers)
Net Official Transfers 0.297 2.109 1.813 1.515 2.008 1.925MLT Loans 0.276 3.349 2.862 2.198 1.910 2.025
Official 0.247 2.366 2.249 1.858 1.922 2.231Private 0.030 0.983 0.614 0.340 -0.012 -0.206
Net Direct Investment 0.173 0.236 0.221 0.223 0.211 0.086Change in Reserves -0-111 0.555 0.377 0.500 0.171 0.607Debt Outstanding and Disbursed 2.874 20.787 22.905 24.487 25.399 26.583
As Percent of GNP 17.931 39.936 43.753 47.765 52.223 54.550As Percent of Exp. GS 75.232 175.807 216.466 260.561 279.452 278.067
Debt Service Ratio 6.065 12.541 13.801 15.654 16.507 19.893
B. MIDDLE-INCOME COUNTRIES
Major Exporters of Manufactures
Net Exports (GNFS) -5.719 -28.892 -26.983 -17.988 0.487 19.590Net Factor Income -1.768 -17.058 -25.505 -30.822 -32.135 -38.481Interest on MLT Debt -1.120 -14.880 -19.504 -22.510 -20.139 -25.839
Official -0.217 -2.158 -2.381 -2.948 -3.320 -3.818Private -0.903 -12.722 -17.123 -19.562 -16.819 -22.021
Current Account Balance -5.500 -35.260 -41.696 -38.294 -21.969 -9.345(Excl. Official Transfers)
Net Official Transfers 0.502 2.483 2.550 2.608 3.180 3.735MLT Loans 3.590 21.401 29.160 25.043 16.617 17.474
Official 0.868 5.065 5.139 4.827 6.525 7.626Private 2.722 16.336 24.021 20.216 10.092 9.848
Net Direct Investment 1.076 4.356 6.106 5.888 4.478 4.605Change in Reserves -0.503 1.606 0.127 4.098 4.369 -10.554Debt Outstanding and Disbursed 24.357 166.602 191.029 215.801 242.016 266.818
As Percent of GNP 15.871 22.848 24.839 28.017 34.746 37.638As Percent of Exp. GS 91.507 77.315 81.728 97.079 105.221 109.099
Debt Service Ratio 15.100 16.060 17.067 19.350 16.189 15.997

- 19 -
Table 6: DEVELOPING COUNTRIES' CURRENT ACCOUNT BALANCE AND-ITS FINANCING,1970-84 (CONTINUED)
(Billions 'of Current US$)
1970 1980 1981 1982 1983 1984
Other Non-Oil
Net Exports (GNFS) -1.345 -18.179 -23.517 -17.146 -12.721 -9.617Net Factor Income -0.960 -5.188 -6.005 -7.761 -9.900 -10.567Interest on MLT Debt -0.445 -4.457 -5.551 -6.762 -6.733 -8.002
Official -0.194 -.136 -1.353 -1.604 -1.927 -2.418Private -0.251 -3.321 -4.198 -5.157 -4.805 -5.584
Current Acdount Balance -1.923 -18.564 -24.056 -19.804 -17.743 -15.022(Excl. Official Transfers)
Net Official Transfers 0.583 3.084 3.'278 3.228 2.653 2.539MLT Loans - 1.747 11.789 12.866' 11.873' 7.918 10.798
Official 0.800 5.931 6.119 5.905 5.160 5.333Private 0.947 5.857 6.748 5.968 2.758 5.466
Net Direct Investment 0.149 1.653 1.875 1.355 1.390 1.126Change ih Reserves -0.635 -3.420 0.397 3.619 3.003 1.461Debt Outstanding and Disbursed 11.916 68.327 78.850 88.932 97.751 108.035-
As Percent of GNP 21.986 30.187 33.831 40.713 48.658 52.966As Percent of Exp. GS 110.987 120.672 136.398 155.433 175.472 183.860
Debt Service Ratio 13.577 17.184 20.765 22.697 23.094 24.929
Oil Exporters
Net Exports (GNFS) -0.915 14.628 -10.713 -13.701 7.854 .16.666Net Factor Income -2.207 -16.186 -19.006 -23.981 -22.631 -24.692Interest on MLT Debt -0.693 -11.454 -13.903 -16.660 -17.463 -21.252
Official -0.209 -1.656 -2.045 -2.132 -2.508 -2.830Private -0.485 -9.798 -11.859 -14.529 -14.956 -18.421
Current Account Balance -2.930 1.509 -27.297 -35.680 -11.052 -3.543(Excl. Official Transfers)
Net Official Transfers 0.595 2.007 2.485 1.918 1.918 1.809MLT Loans 1.643 16.998 23.559 20.503 18.133 13.323
Official 0.i61 4.'800 - 4.706 5.314 3.660 ' 6.194Private 0.881 12.198 18.853 15.190 14.473 7.129
Net Direct Investment 0.8i0 4.192 6.369 5.283 3.717' 2.922Change in Reserves -0.499 -17.077 2.217 15.767 3.549 -7.339Debt Outstanding and Disbursed 17.631 135.564 155.326 173.586 208.176 232.153
As Percent of GNP 18.519 24.863 25.058 32.386 39.893 43.849As Percent of Exp. GS 115.298 87.431 98.507- 123.694 157.769 164.274
Debt Service Ratio 18.073 17.848 19.776 24.977 26.132 28.090
C. ALL DEVELOPING COUNTRIES
Net Exports (GNFS) -9.717 -53.582 -78.102 -59.802 -15.966 14.168Net Factor Income -5.486 -39.255 -51.827 -64.551 -66.238 -75.640Interest on MLT Debt -2.624 -32.851 -41.161 -48.014 -46.596 -57.925
Official -0.902 -5.951 -6.694 -7.714 -9.032 -10.580Pri'vate -1.721' -26.899 -34.'467 -40.301 -37.564 -47.345
Current Account Balance -12.583 -67.837 -105.095.-100.121 -56.665 -35.588(Excl. Official Transfers)
Net Official Transfers 2.347 11.635 12.209 11.153 11.768 11.960MLT Loans 8.243 58.414 71.675 63.575 48.778 50.162
Official 3.646 -21.572 21.665 21.786 20.810 25.606Private 4.596 36.842 50.010 41.788 27.969 24.556
Net Direct Investment 2.317 10.595 14.992 13.237 10.342 9.383Change in Reserves -1.935 -17.887 5.524 26.119 6.868 -19.008Debt Outstanding and Disbursed 68.303 429.692 487.655 545.748 619.631 686.420
As Percent of GNP 14.096 21.008 22.596 26.477 31.311 33.758As Percent of Exp. GS 108.863 89.761 96.759 115.'037 130.843 135.383
Debt Service Ratio 14.746 16.016 17.589 20.543 18.999 19.690
Notes: GNFS. - Goods and Non-Factor Services; MLT - Medium-and Long Term; Debt ServiceRatio - Ratio of interest and amortization payments to exports.
Source: World Bank, Economic Analysis and Projections Department.

- 20 -
debt increased sharply during the year, and exceeded new loan receipts by that
amount. The current account deficit of Asian low-income countries widened by
about $2 billion in 1984, while that of African low-income countries remained
virtually unchanged. Rising interest payments offset the small improvement in
trade balances experienced by low-income African countries during 1984 (Table
6).
25. Growth in demand for developing countries exports was stimulated
mostly by the US recovery and the strong dollar, and, to a more limited
extent, by similar quantity and relative price impulses in Japan. Regionally,
it affected most positively those developing countries which are traditional
trading partners of the United States and of Japan. In terms of commodity
composition, it most strongly affected exports of manufactures. The demand
for non-fuel primary commodities and for petroleum remained surprisingly weak
by historical standards. These demand factors largely explain the differences
in observed trade patterns. Obviously, policy performance differences also
intervened, but the weakness of primary commodity markets, particularly in
1984, left little room for export expansion to those countries which had not
already developed a manufactures export potential in earlier years.
26. Generally speaking, the Latin American and East Asian countries, more
deeply tied to booming demand in North America and to Japan, and also
generally possessing relatively advanced manufacturing sectors were able to
expand their exports most easily. African countries, more tied to Europe
(where import demand grew much less than in North America and Japan) and, at
the same time, more dependent on exports of primary commodities, found

- 21 -
themselves in a less favorable position. The same applies to South Asian
countries (with India being a partial exception), for which exports of primary
products are of great importance.
27. The differences in external pull faced by various developing regions
are evident from their exports to the United States, Japan and the three major
European countries (Germany, France and the United Kingdom) over the 1982-84
period. Africa's exports to these countries grew more slowly in 1984 than
those of East Asia and Latin America, and recouped barely three-fifths of the
loss experienced in 1983. Exports of East Asia to the major industrial
countries increased in dollar value by about 6 percent in 1983, and by almost
25 percent in 1984. Latin American exports expanded by 13 percent in 1984
(about one-third faster than in the previous year), and South Asia's by about
12 percent (Table 7).
28. Within these total increases, developing countries' exports of
manufactured goods to the major industrial countries increased in dollar value
by 15.5 percent in 1983 and by almost 29 percent in 1984, pulled by a 31
percent increase in exports to the United States in 1983, followed by a 44
percent increase in 1984. Exports to Japan rose much less, and to Europe
least, although even exports to Europe rose at least twice as fast as overall
demand for manufactures in that region. Still incomplete data appear to
indicate that primary commodity exports to industrial countries, including
petroleum, also began to recover in 1984, even though they remained the
weakest component of the developing countries' overall export picture.

- 22 -
Table 7: MAJOR INDUSTRIAL COUNTRIES' IMPORTS FROM DEVELOPING COUNTRIESBY GEOGRAPHICAL ORIGIN
(% change)
1983 1984 (Jan.-Sept.)
UNITED STATES
from: Africa -24.3 4.0East Asia 16.3 38.5South Asia 47.8 17.8Latin America 10.9 16.0Total /a 6.0 22.0
JAPAN
from: Africa -11.8 11.1East Asia -4.0 21.6South Asia 3.0 -1.8Latin America 6.4 15.3
Total /a -2.0 17.7
EC3 /b
from: Africa -1.4 11.4East Asia 5.2 3.1South Asia -18.5 14.8Latin America 6.5 0.0
Total /a -0.5 4.7
MAJOR INDUSTRIAL COUNTRIES /c
from: Africa -13.7 8.1East Asia 6.4 24.5South Asia 8.1 12.2Latin America 9.5 12.6
Total /a 2.3 15.4
/a Including imports from EMENA countries.lb United Kingdom, France and Federal Republic of Germany.7E United States + Japan + EC3.
Source: IMF, Direction of Trade (various issues) and DRI, Trade System.

- 23 -
29. Expanding exports directly contributed to GDP growth in all
regions. In many countries, improved balance of payments positions also
allowed the relaxation of direct import control measures and, somewhat less
broadly, of financial stringency. Real GDP growth in 1984 was enough to
ensure some increase in real per capita GNP in most developing regions, with
the exception of Sub-Saharan Africa. 1/ Particularly remarkable was the
turnaround in real output growth that occurred in Latin America: from -2.6
percent in 1983 to 2.6 percent in 1984.
30. Domestic adjustment policies played a key role in determining these
outcomes. In the impact phase (1982 and the first part of 1983) a combination
of direct restraint of imports (through quantitative controls and devaluation)
and reduction in domestic absorption was predominant. This is particularly
evident in the case of middle-income Latin American countries (Chart 1).
Sometimes, direct import controls led to the reduction of production and
income-generation through the scarcity of raw materials, and of machinery and
other inputs into investment projects; sometimes, financial and other
restraints on income (including depreciation of effective exchange rates)
brought about the desired reduction of imports, also at the cost of lower
production; most often, these two effects were combined.
31. Expenditure switching measures, among which currency devaluations
were paramount, together with the onset of the recovery in industrial
countries, set the stage for a recovery of exports that began in late 1983 and
streugthened in 1984 (Chart 2). However, reduced domestic absorption still
1/ Per capita GDP growth is shown in Table 12.
- 24 -
Chart 1: REAL DOMESTIC ABSORPTION AND REAL INVESTMENT, 1980-84
(1980-100)
Developing Countries /a Middle-Income Latin America /b
O3 06=m. -bmrption 4' riI t rrm.t O __A_IIry-strn-r.t
Chart 2: REAL EXPORTS AND REAL EFFECTIVE EXCHANGE RATES, 1980-84
(1980-100)
Developing Countries /a Middle-Income Latin America /b
,f1a -
Oao so
lo *§lt*we Iga 19 19ao *"t lo lt 1064
O .es F.nl E:-. r--t=4 Rft=l E co,eRmte O3 M.er,-j,zr.:ie EF__=rt2; 4 R.ewnl Ex-hN=r9s- R=.nt_
/a Based on a sample of 26 developing countries.A7 Argentina, Brazil, Chile, Colombia and Mexico.
Source: World Bank, Economic Analysis and Projections Department.
- 25 -
played a considerable role during 1984. In most of Latin America, and in many
Mediterranean and several Asian developing countries, as well as in Sub-
Saharan Africa, per capita consumption continued to decline in 1984.
Investment was also generally lower than in earlier years, and mostly
concentrated on- the completion of old projects.
32. Developing countries as a group succeeded in reducing their external
imbalance by two-thirds in a relatively short time (between 1981 and 1984),
despite interest rates which remained exceptionally high both in nominal and
real terms throughout the period, and despite further growth in their stock of
debt. The remarkable success attained in adjusting external imbalances is
most evident in Latin America, whose trade balance went from -1.5 percent of
GDP in 1981 to about 5 percent in 1984 (in absolute amounts, from a deficit of
$11 billion to a surplus of about $35 billion).
33. Developing countries as a group have made dramatic progress in
fitting the growth of their economies to that of available resources, not only
by cutting overall demand through financial policies, but also by switching
production from the domestic market to exports through effective
devaluations. - The only major exception was Sub-Saharan Africa. African
governments were either laggard in appreciating fully the need for policy
change or were unable to implement them. However, the resources available in
many African countries made it extremely difficult to implement policy changes
that involved further reduction in domestic demand in the short term. More
importantly still, the economic structures of these countries, with embryonic
manufacturing sectors, greatly limit the scope that they have in the short run

- 26 -
for switching production to import substitution and, pending the revival of
commodity markets, to exports.
34. While financial adjustment has made considerable progress in 1982-84,
adjustment in the deeper sense of modified economic structures has barely
begun in many developing countries. As shown by falling investment, resources
continue to be scarce. In addition, high present and projected interest
rates, and the uncertainties of financial markets, render even those
developing countries that could borrow hesitant to do so and impel present
borrowers (like those in East Asia) to reduce their current account
deficits. Paradoxically, with Europe barely emerging from its current account
deficit and Latin American countries still barely able either to service or to
refinance their debt service obligations despite their current account
surpluses, only the country with the largest payments deficit, the United
States, is pursuing its expansion totally unconstrained by balance of payments
considerations (while Japan's huge surplus has not provided it an incentive to
accelerate growth). This unusual situation raises concerns as to what will
happen to world economic growth when the US current account deficit is
reduced, either by deliberate policy choice or by the emergence of a financing
constraint.
35. Another concern relates to trade. One can no longer deny that
protectionism is renascent and active. This is even better illustrated by
Bangladesh shirts than by Japanese automobiles and Brazilian and Korean
steel. When one of the world's poorest countries took a miniscule fraction of
the world market in a product whose strategic importance for industrial
countries is minor, it soon ran into quotas. Protectionism, and the threat of

- 27 -
it, most strongly affect the poorer developing countries by slowing down the
process of specialization in labor-intensive expotts.
36. Finally, capital flows to developing countries have not yet been
restored to normal levels. Financial market conditions - high real interest
rates, high debt stocks, -reduced present willingness to lend (as compared to
pre-1980 conditions) and the increased risk of sudden future changes in
lending conditions continue to impose on developing countries strong pressures
to reduce the growth of real domestic demand. Official flows have also fallen
dramatically.. With few exceptions, middle-income countries have to do wi.thout
significant development assistance at earlier stages of development than did
their predecessors ten or twenty years ago. Poor countries, including those
in Sub-Saharan Africa, whose needs are most acute, have to do with- lower
concessional flows than was generally expected-. before the, worsening of
external payments conditions in the early 1980s.

- 28 -
IV. THE CHALLENGES AHEAD: TRANSITION TOWARDS SUSTAINABLE
LONG-TERM GROWTH
37. The current recovery presents opportunities and challenges to
policymakers in industrial and developing countries both. Sustaining it is a
matter of strong, common interest. Unemployment is still very high in
industrial countries, particularly in Europe. Productive capital is also
generally underutilized. Shifts in the composition of demand, and the
reallocation of factor uses (in response to these shifts and to past and
ongoing changes in factor prices) continue to require considerable structural
adjustments in many industrial countries. Steady, reliable and strong overall
output growth would facilitate the management of these changes. Conversely,
the rigidities which have often contributed to past problems tend to be
reinforced by an environment of slow growth in which unemployment is rife. On
the financial side, debt, particularly public debt is very high in all
industrial countries and still growing. The resulting large interest rate
payments will have to be shouldered for many years. If inflation is kept
under control, only accelerated income growth will ease management of
corporate and public finances.
38. Developing countries are completing their financial adjustment
phase. They need a continuation of the world recovery to complete it, to
fully restore their creditworthiness, to regain access to the world capital
market and to concentrate on the structural adjustments of their economies
that are necessary to achieve long-term growth. The domestic costs, and

- 29 -
social and political pressures associated with the current financial
adjustment phase, are already quite high, and would become even more difficult
to bear without continued growth in export markets, a reduction in real
interest rates and resumption of capital inflows. Without them the momentum
of policy reform in developing countries would also falter and the attainment
of structural adjustment goals would again be postponed.
39. To cope with the sharp reduction in the net inflows of medium and
long term capital that occurred in 1982-84 as a consequence of the cutbacks in
international private lending, developing countries had no alternative but to
reduce their current account deficits. To do so, in the face of rising
interest payments on existing and new debt, they had to move rapidly towards a
trade surplus. This was facilitated in 1983-84 by the widening of the trade
deficit in the United States. In fact, developing countries reached a
substantial positive balance in goods and non-factor services in 1984, as
their payments on interest and amortization on medium and long term debt
exceeded the value of the new loans they were able to obtain from official and
private sources.
40. While most industrial and developing countries were drastically
reducing their current account deficits (or increasing their surpluses), the
payments deficit of the-United States was rapidly growing, as the mirror image
of the expanding US budget imbalance (Table 8). The channelling of the rest
of the world's (ex-ante) excess savings into the United States in 1983-84
helped generate a level of world economic activity higher than would have
otherwise been possible. However, this pattern cannot last if output growth

- 30 -
Table 8: WORLD TRADE AND CURRENT ACCOUNT BALANCE
1970-72 1976-78 1981 1982 1983 1984(Est.)
(-------------------Billions US$----------------)
TRADE BALANCE
Industrial Countries 10.5 -7.0 -28.0 -20.0 -16.0 -42.0of which:United States -2.0 -26.0 -28.0 -36.5 -61.0 -108.0Japan 7.0 17.0 20.0 18.1 31.5 44.0Europe 1.7 -4.0 -24.0 -14.2 -1.0 5.0
High Income Oil Exporters 4.0 39.0 132.0 62.0 37.0 56.0
Developing Countries -7.5 -23.0 -73.0 -48.0 -15.0 2.0
Other Countries -2.5 5.0 -2.0 15.0 17.0 18.0
Total /a 4.5 14.0 29.0 9.0 23.0 34.0
CURRENT ACCOUNT BALANCE /b
Industrial Countries 14.5 12.0 -4.0 -5.0 -3.0 -38.0of which:
United States 1.0 -4.5 10.7 -3.8 -35.5 -100.0Japan 5.0 10.5 6.2 8.1 22.3 35.0Europe 8.5 12.0 -6.3 -2.1 14.3 23.4
High Income Oil Exporters /c 3.5 24.0 60.0 10.0 -11.5 -4.5
Developing Countries -16.0 -38.0 -105.0 -100.0 -56.5 -35.5
Other Countries 1.0 -16.0 -8.0 8.0 10.0 12.0
Total /a -0.5 -18.0 -57.0 -87.0 -61.0 -66.0
/a Reflects statistical errors and asymmetrics.lb Excluding official transfers.7-c Partially estimated in 1983 and 1984.
Source: IBRD, OECD and IMF.
31 -
in Europe and Japan rise towards their potentials and developing countries
restore a measure of creditworthiness. It is unlikely that the United States
can continue to draw on external savings at the same rate as in 1984. It is
also undesirable that it should do sp. In the medium-term, a return to a
pattern of savings allocation more in line with the capital endowments of the
world's major regions would seem to be necessary on efficiency grounds.
Without renewed access to world capital markets and to the rest of the world's
excess savings, not only would the growth prospects of developing countries be
considerably reduced, but also those of the whole world economy. This implies
a return of industrial countries to a position of overall surplus on current
account and to a net flow of savings to developing countries.
41. A period of sufficiently high and steady non-inflationary economic
growth is needed to allow the progressive reabsorption of idle resources
(particularly of unemployed labor), the correction of existing disequilibria
in financial stocks and flows, and the completion of structural adjustments
underway in industrial and developing countries and their fruition, in terms
of greater efficiency in resource use and in capital accumulation. The
challenge lies in that a partial solution to these problems is a precondition
for sustained, non-inflationary growth, but it can hardly be achieved without
adequate growth already taking place. Credible, sustained non-inflationary
growth constitutes both a means and an end, which could become even more
elusive unless it -is pursued without delay.
42. The developing countries are seeking to regain a reasonable medium-
term balance in domestic and external finance. They need a more stable

- 32 -
external environment in terms of market access and finance to complete their
financial adjustment processes. Once this phase is over, they will have to
concentrate their efforts on the achievement conditions favorable to long term
growth, that is on the shifts in prices, in expenditures and in factor uses
most conducive to the sustained expansion of domestic output.
43. The tempo of domestic policy reform in developing countries needs to
be maintained and whenever possible quickened for the second phase of their
adjustment process to bear maximum results. Reform needs, though country
specific, have some common threads. Better utilization of existing productive
resources is clearly paramount. Greater efficiency is in large part a
function of internal price relationships and of correct balance between
domestic and world prices. Subsidies which distort prices and encourage waste
must be reduced, along with those which directly sustain undesirable
activities or inefficient enterprises. Reduction in subsidies is often a key
precondition for reducing fiscal deficits, themselves an indirect cause of
inflationary pressure. Reduced budget deficits, complemented by appropriate
monetary policies, are a precondition for the build-up of efficient financial
markets, which can attract renewed inflows of foreign capital and serve to
channel efficiently domestic savings into domestic investments. Allocation of
available capital resources, whether market or state determined, needs to be
inspired by stringent performance objectives. The more flexible the domestic
price system and the lower trade and exchange rate distortions, the greater
the chances that private and public investment decisions will be economically
and socially productive.

- 33 -
44. In shaping the future, the role of economic policies is central and
clear. In the short-term, a key objective of policies in both industrial and
developing countries must be to ensure the continuation of the present
economic recovery. In the medium-term, the objective of policies is to ensure
sustained non-inflationary growth. The industrial countries bear a particular
responsibility for ensuring, through appropriate domestic policies, that
freedom of trade is maintained, that capital flows from the richer towards the
poorer countries are renewed, and that national economic objectives are
compatible with each other and with international efficiency in the use of
resources. International cooperation for these objectives, so effective
during the past three decades, is both a necessary condition for resumed
growth and dependent upon it.

- 34 -
V. MEDIUM TERM ALTERNATIVES FOR INDUSTRIAL AND DEVELOPING COUNTRIES
45. The next 10 years, viewed schematically for the purpose of analyzing
macroeconomic policy and setting priorities, can be divided into two phases: a
period of unwinding the existing financial tensions, restoring more
sustainable global payment balances, normalizing interest and exchange rates,
decisively reducing inflationary expectations, and achieving a better
equilibrium in net flows of funds; followed by a period of faster output
growth in industrial countries and of overall development in developing
countries, funded by sustainable patterns of domestic capital accumulation and
of net foreign borrowing. These two phases roughly coincide with the medium
and the long term perspectives normally taken in World Bank World Development
Reports. Attention is focused here on the first phase.
46. Reasonably favorable central assumptions for the medium-term policy
scenarios are that industrial countries will attempt to bring about a
convergence of real interest rates with the trend growth rates of their
outputs, and to reduce the deficit in their current accounts without
disrupting the present phase of recovery in world economic activity. It is
further assumed, in part as a result of a correct growth perspective being
maintained by policymakers, and in part as the result of the postulated fiscal
and monetary adjustments, that trade protection will not increase during this
period. This assumption would be a break from recent trends. The effects of
an increase in trade protectionism will be examined as part of the downside
risks to the main scenario.

- 35 -
47. Given the short-term dynamics-of the.4984-85 situation, characterized
by strong financial tensions and considerable imbalances in trade and
payments flows .within and across regions, progress towards these objectives
will not be easy. Dealing in a positive and anticipatory fashion with the
risks inherent in the current situation will require moving away from policies
which have been successful in the short run. Good timing, and a degree.of
compatibility (whether planned or coincidental) --of financial policies within
and across countries are also prerequisites. An added difficulty is that
correcting existing internal and external imbalances may, at least in the
short term, tend to restrain output growth in both industrial and developing
countries. However, at least in industrial countries, actual inflation and
inflationary expectations seem to be under better control than at any time in
the past 15 years, and this should leave some leeway to the policy adjustments
necessary to sustain growth in the short-term. Moderate demand growth,
continued restraint in the setting of wage rates and expectations of very slow
increases in the prices of internationally traded primary commodities
(including oil) -should facilitate the task of, financial authorities in
regaining and maintaining control of both internal and external balances,
without unduly great risks.
48. Considerable uncertainties thus surround the attainability of the
policy objectives assumed to be pursued in the medium term, and not only
because the efficacy of available policy instruments may itself be in doubt.
However, there seems to be enough agreement on the desirability of the
objectives to be pursued, appreciation of the scale of the adjustment problem
at hand (particularly as it relates to the United States and to developing

- 36 -
countries), and signs of a will for action to make it reasonable to assume
that the opportunity to start a viable transition to sustainable and balanced
growth in the 1990s will be seized. However, if the assumption of the
adoption of gradual adjustment policies seems reasonable, it nevertheless
remains an assumption. We have not forecast that national authorities will
indeed act in this way; we have merely explored some of the consequences that
will ensue if they do--and also if they do not.
49. A continuation of existing policy trends would likely lead to medium
term results appreciably worse in terms of growth, and no better in terms of
inflation, than would a moderate but steady adjustment scenario. Moreover, a
"do nothing" scenario presents considerable risks of crisis, given that the
continued financing of some of the persisting fiscal and external payments
disequilibria is in no way automatically ensured. Even without a sudden
financing crisis, pressures towards greater trade protections could become
irresistible in many countries. Avoiding these risks should be an additional
reason for looking at feasible adjustment alternatives.
A. A Xediumr-Term Scenario with Moderate Policy Adjustments: 1985-90
A.l: The Industrial Countries
50. The assumptions underlying the medium-term scenario illustrated here
reflect appreciable adjustment in the existing financial imbalances, starting
with the industrial countries. While moderate and gradual, such adjustments
are assumed to start quite soon, probably within 1985 in terms of policy

- 37 -
decisions, and in 1986-87 in terms of initial effects. They are also expected
to be broadly credible in the various markets and to generate some positive
anticipatory effects. A key component of the overall adjustment process here
envisaged is a change in the current fiscal position of the United States and
a realignment of the US monetary stance to this new situation. The other
major industrial countries are expected to assess correctly the trend, scale
and likely effects of the US fiscal adjustment and to take action to ensure
broad compatibility of financial policies- across the major industrial areas,
in particular by ensuring that fiscal adjustment in the United States does not
lead to overall tightening of global demand. While broad compatibility of
policies is presumed, active coordination is not envisaged.
51. The reduction of the US budget deficit, beginning in 1986 and
continuing in the medium term is postulated to be such as to reduce the
Federal budget deficit to about 3 percent of 1990 GNP, from about 5 percent of
GNP in 1984. Monetary policy is assumed partly to offset the short-term
negative impact on domestic output of this tightening in fiscal policy.
Continued wage restraint, consistent with current and projected levels of
unemployment, should make a limited monetary accommodation possible and still
ensure a non-inflationary environment. The credibility of the change in US
fiscal position should also be of help in reducing expectations of future
inflation.
52. Fiscal and monetary stances are assumed to change in other industrial
countries. A parallel relaxation of monetary conditions is expected to take
place in those European countries where domestic inflation rates and
- 38 -
inflationary expectations have already been brought under satisfactory
control. In some cases it is expected that the restrictiveness of fiscal
policy, as measured by the changes in structural budget balances, will be
loosened, and taxes changed to stimulate investments. This should also be
possible in Japan.
53. The main financial consequences of these gradual policy changes in
industrial countries during the 1985-90 period are expected to be: (a) a
progressive decline in real interest rates on US dollar assets; (b) a gradual
depreciation of the US currency; (c) substantial stability of inflation
(measured in local currencies); and (d) a very modest increase in the real
price of non-fuel primary commodities, accompanied by a small decline in real
fuel prices. Economic growth in industrial countries is expected to continue
at a positive, if relatively modest, rate and to show greater stability than
in the past ten years. These results would ensure that an unwinding of the
existing financial tensions takes place in a context of reasonable, non-
inflationary growth, that would leave developing countries room for continued
internal and external adjustment (Table 9).
54. The postulated fiscal-monetary corrections are expected to bring
about a considerable reduction in real dollar interest rates: six-month
dollar LIBOR rates should gradually decline from the current 7 percent to
about 4 percent in real terms by the end of the 1980s, and real long term
dollar interest rates should gradually fall to a 3 - 4 percent range. This
would bring them down close to the trend growth of real output by the end of
the transition period, a significant break from the trends of the past five

- -39 -
Table 9: AVERAGE PERFORMANCE OF INDUSTRIAL AND DEVELOPINGCOUNTRIES, 1960-90
1960-73 1973-79 1980-85 1985-90
INDUSTRIAL COUNTRIES
(Average Annual Percent Change)GDP Growth 4.9 2.8 2.1 3.0Inflation Rate-/a 5.9 8.0 5.8 5.2
(Average Annual Rate)Real Interest Rate /b /c 2.5 0.7 6.8 4.1Nominal Interest Rate 7a; 5.8 8.4 12.6 9.5
DEVELOPING COUNTRIES /d
(Average Annual Percent Change)GDP Growth 6.3 5.2 3.0 5.0
Low-Income Asia 5.9 5.2 6.4 5.6Low-Income Africa 3.5 2.1 1.5 3.1
Middle-Income Oil ImportersMajor Exporters of Manuf. 6.7 5.8 2.0 5.5Other 5.3 4.3 1.5 3.8
Middle-Income Oil Exporters 6.9 4.9 1.8 4.4
Export Volumes /e 5.2 4.1 4.7 5.3Manufactures /e 13.8 11.0 7.7 8.5Primary /e 3.6 1.3 2.6 2.5
Import Volumes /e 5.9 5.9 2.0 6.5
Trade Prices (in current US$)Manufactures 3.8 12.7 -1.8 7.9Oil 4.6 37.9 -1.4 7.1Non-Oil 4.8 7.8 -7.0 9.5
/a GDP deflator in-local currencies.7W 6-month dollar LIBOR. Owing to the lack of historical data, the 1960-73
and 1973-79 period averages use a 3-month Eurocurrency rate./c Deflated by the U.S. GDP deflator.7W_ Estimates/projections for 1980-85 and 1985-90 are based on a sample of 90
developing countries./e Historical growth rates are for the periods 1965-73 and 1973-80.
Source: World Bank, Economic Analysis and Projections Department.

- 40 -
years, when the divergence from trend output growth has increased. Nominal
rates would follow a similar path from 1986 onwards.
55. Under this scenario, by 1990 the dollar would have gradually
depreciated by about 15 percent in terms of the SDR, relative to its average
1984 level. This trend could start as the combined result of reduced US
borrowing of foreign funds (as the growth of the US economy returns to a more
normal and sustainable rate), and of the relaxation of monetary restraints.
The reduction in expectations of future inflation generated by a credible
program of budget deficit reduction, continued wage restraint and the slow
growth of domestic unit costs should help allow the movement to remain
gradual. A sympathetic relaxation of monetary conditions in major European
countries would support the US policy adjustments. It would also help to
ensure, via a broadly parallel decline in short term interest rates, that the
depreciation of the dollar be gradual and orderly.
56. Inflation in industrial countries would remain stable at 4 to 5
percent throughout the period. The rate of increase of domestic prices would
tend to accelerate somewhat in the US, but decelerate in Europe, as exchange
rate adjustment unfolds. This process should be helped not only by a
normalization of consumer expectations, but also by overall stability in
international commodity prices. Prices of non-fuel commodities would
increase in real terms at only 1.5 percent per annum between 1985 and 1990,
while fuel prices would on average decrease in real terms by about 1 percent

- 41 -
per annum. 1/ Manufactured goods' export prices are also expected to increase
only moderately in local currency terms, reflecting the slow growth of unit
labor costs and competitive market conditions. In dollar terms, their prices
would grow faster (at about 8 percent per annum in 1985-90), reflecting the US
dollar depreciation. This would reverse the cumulative 14 percent decline in
their dollar prices which occurred between 1981 and 1984.
57. Under this scenario of gradual adjustment, industrial countries' real
growth would average 3 percent per annum over the' 1985-90 period.. This
represents only a moderate acceleration of trend growth with respect to the
previous five years (2.1 percent per annum). As trade protectionism is
assumed to stay at its present level, these growth' results must be seen as a
positive, if limited, outcome of a moderate fiscal-monetary adjustment
package. If there also occurred substantial realignments in factor prices,
and a reduction of rigidities in product and factor markets (particularly
labor markets), growth would accelerate further, as a result of higher
investment and of greater efficiency in the use of factors of production. In
any case, this moderate adjustment package would also lead to a further
acceleration of growth and slowdown in- inflation in industrial countries
further in the 1990s. Simple continuation of these macro policy trends would
improve the average growth of real output by half a percentage point in 1990-
95, and reduce average inflation by about the same amount. Real interest rate
normalization would also be completed in this period, by a convergence of real
interest rates and real growth rates of output in the early 1990s.
1/ The export prices of manufactured goods are used as deflators (Table 9).

- 42 -
58. The projected behavior of current account balances is causally
related to the projected path of interest rates. Globally, the current
account deficit of the industrial countries would decline. This would involve
some reallocation of surpluses from Japan to Europe, and a decline in the
current account deficit of the United States. The overall savings deficit of
the industrial countries would thus diminish. Taking into account errors and
omissions (which prevent a precise balancing of the global payments account),
the reduction in the overall current account deficit of industrial countries
would allow increased financing of the capital needs of the developing
countries, and some untightening of global capital markets. Nevertheless, at
the end of the period under consideration (1990), global balance will not yet
have been re-established. In particular, the United States would still be
running a substantial deficit on current account, and also a fairly large
structural (full employment) budget deficit. The persistence of these is not
desirable; nor is it likely that their financing could continue to be ensured
without risk. It is therefore assumed that an effort towards a further
reduction and ultimate elimination of these twin deficits will be made before
1990. Indeed, the gradual nature of the adjustment (in particular, of the
decline of the dollar) partly rest on the assumption that policies will
rapidly be put in place, and in such a way as to lend credibility to the
expectation that the U.S. payments deficit will in fact be eliminated before
an excessive foreign debt is accumulated. Given the importance of the first
steps towards the achievement of this goal, which are assumed to take place
during the 1985-90 period, success in the transition phase should make the
rest comparatively easy.

- 43 -
A.2: The Developing Countries
59. Moderate but timely policy changes in the industrial countries would
make it easier-for developing countries to complete their internal adjustment
process and to return, through trade and renewed access to private capital
markets, to a relatively fast sustainable rate of economic growth. The
interdependences are -numerous. Growth in the industrial countries imports
(itself dependent on income growth there and on the containment of
protectionism) is a necessary condition for the restoration of the developing
countries' creditworthiness. To allow developing countries first to resume
fully their contractual debt service, and then to reduce the share of exports
absorbed by it, the export recovery of 1983-84 needs to be sustained. Trade
growth is needed not only to service debt and to finance indispensable
imports; it is vital to promoting specialization and efficiency in domestic
production.
60. In the medium term scenario just described, developing countries'
export volumes could grow by about 5 percent per annum between 1985 and 1990:
8.5 percent for manufactures products and about 2.5, percent for primary
commodities (Table 9). Relative to GDP trends in both industrial and
developing countries, such export growth would constitute a favorable
performance and would entail further success of policies to promote exports
and to penetrate markets in industrial countries. Developing countries
overall terms of trade would remain virtually unchanged over the period, as
the projected modest changes in the real prices of non-fuel commodities and of
oil have virtually offsetting effects. However, there are some differences

- 44 -
across country groups: oil importing middle-income countries should enjoy
some improvement, mirrored by the worsening in the terms of trade of oil
exporting countries. Low-income countries, which rely on commodity exports
with the weakest price prospects, are likely to face a worsening of their
terms of trade during the 1985-90 period (Table 10).
61. The projected evolution of financial markets would also help
developing countries. Lower interest rates would reduce their debt service
burden and, together with export growth, help restore the creditworthiness of
many countries, particularly the heavily indebted middle-income countries of
Latin America. As their debt-service ratios fall from the extremely high
levels of 1982-83 and as international private banks become more confident in
the ability of a number of developing countries to sustain export growth,
voluntary lending could gradually resume (Table 11). This would help
accelerate the return to adequate investment growth, together with a gradual
relaxation of the restraints on private consumption.
62. Lower interest rates and adequate export growth would also ease the
adjustment path of those middle-income countries--particularly in Asia--which
are still creditworthy and continue to rely on significant private capital
inflows. They would be able to reduce their balance of payments deficit more
gradually than some of the large borrowers in Latin America had to do in
recent years, and thus continue to cope with external imbalances at lesser
costs in terms of reduced investments and foregone consumption.

Table 10: CHANGE IN TERMS OF TRADE, 1965-90
(Percent change per annum)
1965-73 1973-80 1981 1982 1983 1984 /b 1985 /c 1985-90 /c
TERIIS OF TE
Developing Countries /a 0.5 2.0 0.3 -0.5 -0.6 0.8 -1.1 0.0
Low-Income 0.4 -1.5 -0.3 -1.5 0.9 3.4 -2.1 -0.1
Asia 0.8 -1.6 1.1 -2.1 0.5 3.1 -1.8 -0.1Africa -0.7 -1.0 -5.6 0.3 2.8 5.2 -3.8 -0.3
Oil Importers -0.2 -2.3 -4.2 -0.7 2.5 0.1 0.0 0.1
Oil Exporters -0.4 9.0 9.8 1.0 -7.0 1.0 -2.8 -0.3
High-Income Oil Exporters 2i9 12.3 14.6 2.3 -8.6 -1.0 n.a. n.a.
Industrial Countries -0.5 -3.5 -2.1 2.0 2.1 -0.2 n.a. n.a.
/a Estimates for developing countries are based on a sample of 90 developing economies.7W Preliminary estimates.7T Projected.
Source: World Bank, Economic Analysis and Projections Department.

- 46 -
63. Private capital inflows would in any case be less important than in
the 1970s as a vehicle for increasing developing countries' investment
resources; private net lending to developing countries is expected to grow
only slowly in the next five years. The share of developing countries in the
total claims of private banks is also anticipated to decline during the
remainder of the 1980s. However, the role of international private capital
would still be quite important for some groups of developing countries,
particularly the middle-income countries that are major exporters of
manufactures and for the large low-income Asian countries.
64. Finally, official flows to middle-income countries could grow more
evenly and be used more effectively. In a steadier trade growth environment,
where current account imbalances in major industrial countries were also being
reduced and protectionist practices kept in check, export credits could again
expand faster than world trade. Given the expected lower growth rate of
private capital flows and the uncertainties surrounding them, growth in
official aid flows would be particularly important not only for low-income
countries, but also for many middle-income developing countries. By
facilitating the implementation of necessary policy reforms and by becoming
the catalyst for other capital flows, the overall impact of higher aid flows
could be a multiple of the yield of the investments that they directly
finance.
65. Improvement in the economic outlook of the developing countries does
not depend only on the external conditions they face. Sustained export
growth, the essential precondition for creditworthiness, depends both on

Table I1: Q'UERMTAC'WCO SBALA8 AM ITS 1I1hCING IM OEVLRPI1DG COUNTRIES, 1980, 1983 and 1990 /a
(Billions of current US$)
ALL DEVELOPINGCOUNTRiRs LCM-INCoIR COUNTRiEs NIDOI.B-INcoNR CoUNTRIES
Major Exporters Oil EaportingAsia Africa of Manufactures Other Non-OIl countries1980 1983 1990 1980 1983 1990 1980 1983 1990 1980 1983 1990 190 1983 1990 1980 1983 1990
Imi WKNTl (GM) -53.6 -16.0 -36.8 -15.8 -7.2 -26.6 -5.4 -4.3 -5.5 -28.9 0.5 0.7 -18.2 -12.7 -7.7 14.6 7.9 2.21011ISr ON MtU M IAC T D13 -32.9 -46.6 -84.2 -1.4 -1.6 -6.0 -0.7 -0.7 -1.9 -14.9 -20.1 -36.9 -4.5 -6.7 -11.4 -11.5 -17.5 -27.9
Official -5.9 -9.0 -20.9 -. 7 -1.0 -2.2 -0.3 -0.3 -1.7 -2.2 -3.3 -6.8 -1.1 -1.9 -4.8 -1.7 -2.5 -5.3 1Private -26.9 -37.6 -63.3 -0.7 -0.6 -3.7 -0.4 -0.3 -0.2 -12.7 -16.8 -30.0 -3.3 -4.8 -6.6 -9.8 -15.0 -22.6 4,'C91mmAOOf EALAmf lb -67.8 -56.7 -83.5 -9.6 -1.0 -20.5 -5.9 -4.9 -6.7 -35.4 -22.0 -27.2 -18.6 -17.7 -13.8 1.5 -11.1 -15.2
M omCI UNUSIU 11.6 11.7 22.9 2.0 2.0 2.8 2.1 1.9 3.5 2.5 3.2 9.1 3.1 2.7 4.5 2.0 1.9 3.0MI=A I.D T uoamii 58.4 48.8 72.6 4.9 4.2 19.8 3.3 1.9 2.9 21.4 16.6 28.7 11.8 7.9 6.4 17.0 18.1 14.9
Official 21.6 20.8 27.4 3.4 3.5 8:3 2.4 1.9 3.5 5.1 6.5 3.2 5.9 . 5.2 6.0 4.8 3.7 7.1Private 36.8 28.0 45.2 1.5 0.7 11.5 1.0 0.0 -0.6 16.3 10.1 25.5 5.9 2.8 0.4 12.2 14.5 7.9liOtao [to:
Debt Outatanding end Disbursed 429.7 619.6 1030.3 38.4 46.3 129.4 20.8 25.4 41.9 166.6 242.0 395.2 68.3 97.8 151.0 135.6 208.2 312.8Aa a percent of GNP 21.0 31.3 23.3 7.8 9.-i 10.6 39.9 52.2 44.8 22.8 34.7 25.0 30.2 48.7 36.2 24.9 39.9 28.0As a percent of Exports 89.8 130.8 94.9 - 96.7 98.9 118.3 175.8 279.5 252.1 77.3 105.2 67.8 120.71 175.5 125.3 87.4 157.8 121.9
Debt Service as a Percent of Exports 16.0 19.0 17.4 8.0 8.3- 10.9 12.5. 16.5 26.8 16.1 16.2 14.5 17.2 23.1 22.3 17.8 26.1 24.0
/a ligures are based on a sasple of 90 developing countrite.Tb Excludes official transfers.
Source: Vorld Bank. Econogic AsnlysL antd Projections Departmnt.

- 48 -
demand growth in the industrial countries and on developing countries price
competitiveness. The role of competitiveness is especially important for the
exporters of manufactures, and also for exporters of those foods and
industrial raw materials for which alternative supply sources exist in
industrial countries. Export price competitiveness depends on relative
productivity, and on exchange rates. Domestic policies have effects on the
former, and fully determine the latter. Openness of domestic markets, and
thus the degree of competition and the structure of incentives afforded to
domestic producers, is an important determinant of productivity.
Rationalization and movement towards greater liberalization of existing trade
and exchange regimes are important requirements for improved performance of
many developing countries in the 1980s.
66. Similarly, capital inflows contribute to determining investment
levels, but domestic savings are the key source of investment financing.
Encouragement of savings must remain a principal objective of development
policy. Efficiency in the use of available savings and, more broadly, of all
resources is not less important. Price distortions foster waste in many
countries. They frequently involve waste of capital. In some countries
misaligned incentives and inefficient firms (public or private) may actually
destroy national wealth. Through foreign borrowing, they may be absorbing and
misusing not only savings of the past, but also those of the future. Improved
processes of capital accumulation must, therefore, be accompanied by greater
efficiency in the use of domestic capital.
- 49 -
67. For low-income developing countries, external and internal conditions
for growth are -even more diverse than for middle-income countries. More
dependent on exports of primary commodities and generally less dependent on
international private capital inflows than their middle-income counterparts,
they face very mixed prospects. India and China, whose overall performance
dominates the low-income Asian countries, appear in general well placed to
continue to make steady progress in agricultural production. Continued
internal policy reform should help boost domestic production and improve their
export prospects. The relative weight of manufactures in their total exports
is greater than the average at their income levels. The ratio of their
overall exports to GDP and of their manufactures exports to industrial
production is still low, but these conditions magnify the potential benefits
of a continued trend towards greater external openness.
68. Under this scenario one can foresee a modest increase in the current
account deficit of these countries, in absolute amount and as a percentage of
GDP. Within a global scenario of steady growth and declining interest rates,
both India and China should be able to take on and use effectively increased
amounts of private capital. Under the conditions assumed in industrial
countries, and their implications for world capital markets, these large
countries should be able to expand their borrowing on commercial terms without
assuming undue risks, particularly if they can also rely on the projected
steady support by official capital flows. The expected increase in their debt
service and debt-to-GNP ratios is thus a reflection of these two economies
improved performance and increased flexibility, and of improved global
conditions. Both should maintain a strong growth performance in the remainder

- 50 -
of the 1980s. Most other low-income Asian countries could, under this
scenario, replicate this performance, although at generally lower levels, and
with greater reliance on aid rather than commercial capital.
69. By contrast, low-income African countries face a more uncertain and
difficult economic future. They suffer from slow demand growth for their
exports, declining terms of trade and low productivity in their agriculture.
The region, moreover, has suffered enormously from natural disasters. It has
experienced an almost constant decline in per capita income over the past
decade. Current high debt service and debt to GNP ratios are not expected to
return to historical levels within the next decade. Low-income African
countries have virtually no capacity to borrow in private capital markets.
Their external debt is small in absolute amount, but very large in relation to
their servicing capacity.
70. Naturally, external conditions are not alone responsible for the
African countries plight. Many domestic policy causes of their inadequate
earlier performance have been identified elsewhere. Some improvement in
performance has already taken place in many countries, particularly in overall
demand management.
71. Preventing a further sharp decline in per capita income in low-income
African countries would require steady improvement of domestic policies and
better external support. Even under our relatively optimistic central
scenario, net capital flows to these countries are expected to drop
considerably in the medium term, because of the relatively slow growth of

- 51 -
gross flows in nominal terms and the concomitant substantial growth of debt
service. Nowhere is aid a sufficient condition for economic improvement; but
nowhere is it more evidently one of the necessary conditions than in Sub-
Saharan Africa. Without a significant increase in the net resource inflows
provided by official development assistance (bilateral and multilateral),
adequate support for ongoing policy reforms and restructuring of development
and investment programs will not be forthcoming. This will require a
combination of growing gross inflows and, in some cases, of additional
rollovers of amortization charges on earlier loans. As emphasized by,a recent
World Bank report on Sub-Saharan Africa, it is necessary at a minimum that net
capital inflows be maintained in real terms at their 1980-82 ievels; otherwise
these countries will not have a chance to stop the economic and social decline
of the past 15 years. 1/
72. With an improved external environment and a measure of success in
domestic policies, developing countries as a group should be able to return to
a fairly rapid overall rate of output growth in the second part of the
1980s. A global export growth of about -5 percent per annum in 1985-90,
combined with expansion of official development assistance in line- with GNP
growth in industrial countries and growth in net private lending of about 10
percent per annum (from the very low levels-of 1985) should allow developing
countries to sustain import growth slightly above that of exports. Under
these conditions their current account deficit in 1990 would be almost twice
1/ World Bank, Towards Sustained Development in Sub-Saharan Africa,Washington, D.C., 1984.

- 52 -
as large as in 1983 in current dollars, but would decline from 29 to 22
percent of GNP. The debt/export ratio for all developing countries would also
decline and tend to return to levels roughly comparable to those of 1980,
while the debt service ratio would return to the same level as in 1983 (Table
11).
73. On average, developing countries would considerably improve their
growth prospects with respect to the first half of the 1980s. They would
experience an annual growth rate of real GDP of about 5 percent (Table 9).
Low-income countries are expected to grow slightly faster rate than middle-
income countries; but this result is totally attributable to the projected
fast growth of China and, to a lesser extent, India. In per capita terms, all
regions would advance, with the exception of low-income Africa, where even
stemming recent declines would require considerable effort (Table 12).
74. In summary, under this scenario, the salient features of the
transition period would be: (a) a modest but steady growth in economic
activity in industrial countries, and a reasonably favorable growth of markets
for manufactured goods of developing countries; (b) a reduction of the global
current account deficit of industrial countries; (c) gradually declining
interest rates; (d) a return to substantive creditworthiness of developing
countries and renewal of voluntary lending to them by international commercial
banks; and (e) a fairly substantial increase in real per capita output growth
in all regions (except for Africa South of the Sahara, where a return towards
as yet modest growth would also be in sharp contrast to the earlier decline).

Table 12: GROWTH RATES OF GDP PER CAPITA FOR DEVELOPING COUNTRIES, 1965-90
(Percent change per annum)
1965-73 1973-80 1981 '1982 1983 1984 /b 1985 /c 1985-90 /c
DEVELOPING COUNTRIES /a 4.1 3.3 1.2 -0.2 -0.1 2.1 2.4 3.0
Low-Income 3.0 3.1 2.0 3.0 5.2 4.7 4.1 3.6
Asia 3.2 3.5 2.5 3.4 6.0 5.3 4.4 3.9Africa 1.3 0.0 -1.4 -2.4 -2.4 -1.5 -0.3 -0.2
Oil Importers 4.6 3.1 -0.2 -1.4 -1.6 1.1 1.6 2.9
Major Exporters ofManufactures 5.1 3.5 -0.4 -0.7 -1.3 1.5 2.0 3.5
)ther Non-Oil 2.8 2.1 0.8 -3.2 -2.1 0.2 0.7 1.3
Oil Exporters 4.5 3.1 2.0 -1.7 -3.6 0.1 1.3 1.8
/a All data are based on a sample of 90 developing countries.7-b Preliminary estimates.7-c Projected.
Source: World Bank, Economic Analysis and Projections Department.
- 54 -
75. The reduction in the current account deficits of industrial
countries, while representing a move in the right direction, will still be a
long way off the desirable objective of a surplus. In a period when very
large surpluses are not expected to reappear soon in high income oil exporting
countries, the restoration of a substantial surplus position in the global
current account of industrial countries is a precondition for the cessation of
net resource flows from the developing to the industrial countries.
76. Managing the transition period is going to require sense of
direction. The practical steps are numerous and gradual. To keep a steady
course will require perseverance in the face of less than dramatic results.
Not doing so, would imply not only the loss of recent hard-won gains, but
possibly incurring further and much more serious failures.
77. The type of policy adjustment here envisaged only includes what is
deemed essential to the continuation of the current world economic recovery
and to the achievement of moderate, steady growth during the transition
period. At the higher end of the adjustment spectrum one could easily
envisage a range of policy changes that would have even more beneficial
effects on the world economy. If, for example, in addition to the changes in
fiscal and monetary mixes assumed in the moderate policy adjustment scenario,
one envisaged an actual decrease in trade protectionism and a growth of real
wages at a rate below that of overall production (so as to allow a buildup of
profits and of savings), incomes and employment could grow much faster still
in both industrial and developing countries. Further improvements could come
from improvements in labor mobility, from greater flexibility in labor and

- 55 -
capital utilizati6oi and, particularly- in the United States, from increased
private savings propensities.
B. The Risks of Non-Adjustment and the Effects on Developing Countries
78. Continuation of present policies and lack of fiscal adjustment in
industrial countries, especially in the United States, would pose a serious
threat to the durability of the present economic recovery. If existing fiscal
and payment imbalances were to widen, this could well put an end to the
recovery and cause a return to wide cyclical swings in the world economy.
Continued high interest rates would tend to slow down the growth of private
investments, consumption and real output in the United States and in the rest
of the industrialized world. Budget imbalances would in turn tend to widen
further, because of ensuing cyclical reduction in the growth of fiscal
revenues and increases in interest payments. The interest service burden on
public debt, on average already close to 5 percent of GNP in the seven major
industrial countries (up from 2 percent in the 1970s)- would increase further,
thus reducing by itself the already limited flexibility of fiscal policy.
79. The deterioration of world economic conditions could even be more
severe if the large fiscal and external payment imbalance of the United States
were to meet serious financing constraints deriving from changes in portfolio
preferences of wealth holders. Unless credible measures are taken to reduce
the fiscal deficit of the United States, external savers would, at some point
soon, raise the interest premium they demand for accepting the exchange risk
inherent in financing the US deficit. A sharp rise in dollar interest rates
or a sudden, sharp devaluation of the dollar could ensue. As the latter would
- 56 -
renew inflationary pressures and inflationary expectations whose control would
require considerable monetary tightening in the United States. The rise in
interest rates that might ensue could be even more pronounced and the
deterioration of growth conditions in industrial countries sharper and
deeper. Other industrial countries might then be unable to prevent a
recession even if they relax their own financial policies.
80. Employment, under these circumstances, would suffer. Trade
protectionist pressure could then become irresistible. Reduced international
competition would in turn contribute to a reversal of recent trends towards
greater flexibility in the use of productive resources in many industrial
countries. This would lead to rising real costs, first in the more protected
sectors and then economy wide.
81. The causality chain could vary across countries, depending on local
as well as global circumstances. The economic impact of higher trade
protection could also vary depending on its size, typology and regional
spread. What is clear, however, is that under a "do nothing" scenario, in
terms of economic policies and fiscal imbalances in particular, it would be
very difficult to avoid increased trade protectionism and reduced wage and
cost discipline in the tradable goods sectors.
82. Under these conditions, real output in industrial countries could
grow at best at only 2.5 percent between 1985 and 1990, a rate roughly the
same as that of 1973-84, and unemployment would continue to increase.
Developing countries would suffer even more in terms of reduced output

- 57 -
growth. Export volume and terms of trade prospects would worsen
substantially, due to increased trade protection, slower overall demand growth
for developing countries' goods and a fall -in the relative prices of primary
commodities. Developing countries' export volume growth could slow down to
about 3 percent per annum in 1985-90. 1/ Terms of trade could decline by as
much as 6 percentage points and purchasing power of exports would thus
increase at only 2 percent per annum. Roughly one-quarter of export revenue
would have to go to service existing debt. Considering the likely growth of
other net factor income, transfers and official long-term lending, simply to
maintain debt service ratios at 1985 levels developing countries would have to
constrain their import growth to about 2.5 percent per annum in real terms.
83. Reduced capacity to import, slower investment rates and deterioration
in the relative prices of tradable goods would substantially constrain the
rate of growth of developing countries real output: to less than 4 percent
per annum between 1985 and 1990, as compared to the 5.2 percent achieved in
the 1970s. This rate of growth of real output could even be slower if, as
seems in fact likely under these circumstances, a number of developing
countries found it impossible to maintain the momentum of policy reform
assumed in the calculations. This could happen as a result of a breakdown of
the social consensus necessary to keep meeting external obligations, and more
broadly to continue exerting present efforts with a view to future results.
1/ Export volume growth could be even lower, approaching the growth of realGNP in industrial countries, if trade protection were to limit severelythe expansion of exports of manufactured products from developing toindustrial countries.

- 58 -
84. Excluding from the total India and China, whose creditworthiness may
continue to ensure access to international private lending, reveals the extent
of the possible deterioration of growth prospects for other developing
countries under these circumstances. For the remainder of the developing
countries, average annual real output growth would be slightly higher than 3
percent. Taking into account the decline in their terms of trade, this would
mean that per capita income would either stagnate or decline in many of these
countries.
85. The medium term sustainability of such a scenario is open to serious
questions. New lending would fall short of interest payments for many
developing countries, which for the entire period would need to run a
considerable annual external surplus to meet their debt service obligations.
Higher net resource inflows could materialize only through increased official
flows, which is unlikely, or through continued involuntary lending by
international private banks to many developing countries having no concrete
prospects of-a restoration of their debt servicing capacity.
86. The two large Asian countries would also suffer substantially from
this situation, in terms of foregone growth, delayed modernization of their
agricultural sectors, retarded expansion of manufacturing capacity and loss of
policy reform momentum. Middle-income developing countries of Latin America
and Asia could perhaps increase intra-regional trade (already larger for them
than for other developing countries) to sustain export growth, but much would
depend on their external payments situation, which increased protection on
manufactured goods exports could render precarious. Other oil importing

- 59 -
middle-income- countries would find themselves in an -even more difficult
situation, faced by a. massive deterioration of. export growth and terms of
trade. Middle-income oil exporting devel-oping countries might. be able to
sustain their export growth to industrial ,countries -and domestic investments
somewhat better, although under these circumstances price prospects, for oil
would not be bright.
87. Even without a disruptive and prolonged financial crisis, the world
economy would suffer considerably in terms, of foregone growth and increased,
instability from lack' of policy adjustment. While the case for adjustment
cannot rest entirely on the anticipation o'f possible future losses and on
their avoidance, the risks involved inma "do nothing" scenario appear to be so
considerably high that their careful consideration should add both urgency arid
purpose to the efforts that are needed to. afford both industrial and
developing countries the possibility of a- sustained, non-inflationary period
of growth.

World Bank NEW indicate the effects of these systems onthe aUlocation of resources, intema,Pub cations Sub-Saharan Africa: Progress tional trade, and economic growth.
Of Related Report on Development The Johns Hopkins Univmrsity Press, 1982;of Related Prospects and Programs paperback 1984. 416 pages (including ap-
Interest A review of the foregoing book two pendixe, index).years later. LC-81-15558. ISBN 0-8018-2569-5, hard-Highlights some of the major problems cover; ISBN 0-8018-2570-9, paperback.that African governments have faced Stock Nos. JH 2569, $39.95 hardcover; IHin designing and implementing pro- 2570, $18.50 paperback.gramns of reform. Examines changesthat have been introduced in the level, Eastern and Southern Africa:pattem, and design of World Bank Past Trends and Futureeconomic work and operations in sup- Prospectsport of such reforms. Reviews the ex- * ulhatitent of donor government responses to Ravi Gthe increased and changed needs of Staff Working Paper No. 413. 1980. 24African countries for external assis- pages.tance. Stock No. WP 0413. $3.1983. 37 pages.Stock No. BK 9169. Free. Economic Growth and Human
ResourcesAccelerated Development in Norman Hicks, assisted bySub-Saharan Africa: An NEW jahangir Boroumand
Agend forAction Staff Working Paper No. 408. 1980. 40Agenda for Action Decentralization in Developing pages (including 3 appendixes, bibliog-In the faU of 1979, the African Gover- Countries: A Review of Recent raphy, and references).nors of the World Bank addressed amemorandum to the Bank's president Experence Stock No. WP 0408. $3.expressing their alarm at the dim eco- Dennis A Rondinelli, John R.nomic prospects for the nations of sub- NeUis, and G. Shabbir Cheema NEWSaharan Africa and asking that the Reports on the objectives of decentrali-Bank prepare a "special paper on the zation. Notes that many developing Economic Reform in Socialisteconomic development problems of countries began decentralization dur- Countries: The Experiences ofthese countries" and an appropriate ing the last 10 years to find ways of China, Hungry, Romania, andprogram for helping them. This report, using limited resources more effec- Yugoslaviabuilding on the Lagos Plan of Action, tively. Evaluates types of decentraliza- Peter T. Knightis the response to that request. tion and conditions and factors affect-The report discusses the factors that ing the implementation of policies Descrbes the Soviet-style system ofexplain slow economic growth in Af- supporting decentralization. Provides centralized planning as a prelude to anrica in the recent past, analyzes policy information on political commitment, in-depth discussion of reform designchanges and program orientations administrative support, effective de- as expenienced in China, Hungary, Ro-needed to promote faster growth, and sign and organization of programs, mania, and Yugoslavia. Some lessonsconcludes with a set of recommenda- and the need for adequate resources. from the reform of these countries aretions to donors, including the recom- Annexes look at Indonesia's provincial noted as possibly ylevant to future at-mendation that aid to Africa should development program, China's "pro- tempts at improving the efficiencydouble in real terms to bring about re- duction responsibility" system, and both of socialst economies and statenewed African development and Tunisia's deconcentration program. sectors of mixed economies.growth in the 1980s. The report's Staff Working Paper No. 581. 1983. 112 Staff Working Paper No. 579. 1983. 131agenda for action is general; it indi- pages. pages.cates broad policy and program direc- Stock No WP 0581 S5 ISBN 0-8213-0229-0. Stock No. WP 0579.tions, overall priorities for action, and $5.key areas for donor attention. Like the Development Strategies inLagos Plan, the report recognizes that Semi-Industrial Economies The Extent of Poverty in LatinAfrica has enormous economic poten- Bela Balassa and Associates Americatial, which awaits fuUer development. Provides an analysis of development Oscar Aimdr1981; 3rd printing 1983. 198 pages (in- strategies in semi-industrial economies Staff Working Paper No. 522. 1982. 117cluding statistical annex, bibliography). that have established an industrial pages.French: L.e developpemnent accelere en af- base. Endeavors to quantify the sys- ISBN 0-8213-0012-1. Stock No. WP 0522.rique au sud du Sahara: programme indi- tems of incentives that are applied incatif d'action. six semi-industrial developing econom- S5.Stock Nos. BK 9114 (English) and BK ies-Argentina, Colombia, Israel, Ko- Prices subject to change without notice9116 (French). Free. rea, Singapore, and Taiwan-and to and may vary by country.

NEW Implementing Programs of Managing Project-RelatedHuman Development Technical Assistance: The
The Effects of Corruption on Edited by Peter T. Knight; Lessons of SuccessAdministrative Performance: prepared by Nat J. Colleta, Jacob Francis Lethem and LaurenIllustrations from Developing Meernan, and others. CooperCountries Staff Working Paper No. 403. 1980. 376 Practical guidance for technical assis-David J. Gould and Jose A. pages (including references). tance designers and appraisers basedAmaro-Reyes Stock No. WP 0403. $15. on feedback from aid agencies and
technical assistance recipients in Af-Analyzes the effects of corruption on International Technology rica, Asia, and the Middle East whothE- administrative performance of de- Tase.Ise n oiypriiae nscesu rjcsveloping countries. Examitines the po- Part an success wiful benefitical, economic, and social factors that Optionts Plnnrsm and provnadvctitinerhs will rtcontribute to its incidence. Data from Frances Stewart Covers idpentfaidvicei i this report.Asia, Africa, and Latin America form Staff Working Paper No. 344. 1979. 178 of services and administration, imple-the basis for discussion. pages (including references). mentation and management of techni-Staff Working Paper No. 580. 1983. 60 Stock No. WP 0344. $5. cal assistance.pages. Staff Working Paper No. 586. 1984. 104ISBN 0-8213-0259-0. Stock No. WP 0580. pages. English and French.$3. NEW ISBN 0-8213-0239-6. Stock No. WP 0586.
First Things First: Meeting $5.Basic Human Needs in theDeveloping Countries n NEWPaul Streeten, with Shahid Javed the PBurki,Mahbub ul Haq, Norman Managing the Public Service sHicks, and Frances Stewart Developig Countries: IssuesThe basic needs approach to economic eanu Prospectsdevelopment is one way of helping the - . ways Ozgedizpoor emerge from their poverty. It en- Identifies better ways to manage hu-ables them to earn or obtain the ne- man resources to meet escalating de-cessities for life-nutrition, housing, mand for improved public services inwater and sanitation, education, and developing countries, where publichealth-and thus to increase their pro- service employment is growing fourductivity. times faster than in developed coun-This book answers the critics of the tries. Resultant problems in personnelbasic needs approach, views this ap- management, pubbic service trainingproach as a logical step in the evolu- programs, and the applicability oftion of economic analysis and develop- - western management practices in de-ment policy, and presents a - veloping country settings are consid-ment policy, and presents a ~~~~~~~~~~ered.clearsighted interpretation of the is- The Japanese and Korean Staff Working Paper No. 583. 1983. 100sues. Based on the actual experience of Experienes an an pages.various countries-their successes and Experences in Managing pages.failures-the book is a distillation of Development ISBN 0-8213-0243-4. Stock No. WP 0583.World Bank studies of the operational Miyohei Shinohara, Toru $3.implications of meeting basic needs. It Yanagihara, and Kwang Suk Kimalso discusses the presumed conflict The special style of economic manage- dist on for andbetween economic growth and basic ment that has produced the "econonmicc Distribution, for Brazilneeds, the relation between the New miracles" of these two countries is Lance Taylor, EdmariL. Bacha,Intemational Economic-Order and analyzed. Of particular interest are in- Eliana Cardoso, and Frank J. Lysybasic needs, and the relation between ferences about the power of prices and Explores the Brazilian experience fromhuman rights and basic needs. role of compefition, both intemal and the point of view of political economyOxford University Press, 1981; 3rd paper- extemal. Korean and Japanese eco- and computable general equilibriumback printing, 1984. 224 pages (including nomic management are characterized income distribution models.appendix, bibliography, index). as pragmatic and flexible. Oxford Univsity Press, 1980. 368 pages
LC 81-16836, ISBN 0-19-520-368-2, hard- Stqff Working Paper No. 574. 1984. 98 (including references, appendixes, index).cover; ISBN 0-19-520-369-0, paperback. pages. LC 80-13786. ISBN 0-19-520206-6, hard-Stock Nos. OX 520368, $18.95 hardcover; ISBN 0-8213-0233-7. Stock No. WP 0574. cover; ISBN 0-19-520207-4, paperback.OX 520369, $8.95 paperback. $3. Stock Nos. OX 520206, $27.50 hardcover;
The Hungarian Economic Levels of Poverty: Policy and ox 520207, $14.95 paperbac.Reform, 1968-81 Change Patterns of Development, 1950-Bela Balassa Amartya Sen 1970Staff Working Paper No. 506. 1982. 31 Staff Working Paper No. 401. 1980. 91 Hollis Chenery and Moisespages (including references). pages (including references). SyrquinStock No. WP 0506. $3. Stock No. WP 0401. $3. A comprehensive interpretation of the

structural changes that accompany the in developing countries during the Meeting Basic Needs: Angrowth of developing countries, using post-World War 1 period. Analyzes Overviewcross-section and time-series analysis problems, successes and failures, Mahbub ul Haq and Shahid Javedto study the stability of observed pat- e,nerging trends, and lessons learned. Bukiterns and the nature of time trends. Staff Working Paper No. 576. 1983. 71 Pureo
Oxford Unitersity Press, 1975; 4th paper- pag. Presents a sumary of the main find-
back prnnting, 1984. 250 pages (including ISBN 0-8213-0303-1. Stock No. WP 0576. World n ank as part of a program fortechnical appendix, statistical appendix, Wa2bibliography, index). reducing absolute poverty and meeting
LC 74-29172. ISBN 0-19-920075-0, hard- NEWb1 2 pees(cover; ISBN 0-19-920076-9, paperback. 1980. 28 paga (including 2 annexes).
Stock Nos. OX 920075, S19.95 hardcover; Policies for Strengthening Stock Nos. BK 9015 (Arabic), BK 9016OX 920076, $8.95 paperback. Local Government in (English), BK 9027 (French), BK 9018
Spanish: LA estructural del crecimiento Dev(popin Countnes (ppanae), BK 9019 (Spanish). $3 paper-
economico: un analisis para el periodo Glyev Cochpine Sheltec1950-1970. Editorial Tecnos, 1978. ShelterISBN 84-309-0741-6, Stock No. IB 0523, Looks at the ways by which highly Anthony A. Churchill
$8.95, ~~~~~~~~centralized govemnments effectivelyS8.95. utilize and improve resources within Defines the elements that constitute
local governments. The need for shelter; discusses the difficulties en-NEW strengthening personnel performance countered in developing shelter pro-
at the local level is discussed, includ- grams for the poor; estimates orders ofPioneers in Development ing an analysis of useful methodology, magnitude of shelter needs for the
Edited by Gerald M. Meier and Discussion of local revenue sources next twenty years; and proposes aDudley Seers and patterns of revenue generation strategy for meeting those needs.Some of the pioneers in development provides a framework from which to 1980. 39 pages.economics-Lord Bauer, Cohn Clark, examine factors affecting government Stock Nos. BK 9020 (Arabic), BK 9021Albert 0. Hirschman, Sir Arthur performance at higher levels. (English), BK 9022 (French), BK 9023Lewis, Gunnar Myrdal, Raul Prebisch, Staff Working Paper No. 582. 1983. 76 (Spanish). $3 paperback.Paul N. Rosenstein-Rodan, W.W. Ros- pages.tow, H. W. Singer, and Jan Tinber- ISBN 0-8213-0240-X. Stock No. WP Water Supply and WasteRen-offer a retrospective view of the 0582. $3. Disposalformative decade after World War 11 Discusses the size of the problem ofwhen they made their seminal contri- Policy Interventions for meeting basic needs in water supplybutions to the subject. In individual Technological Innovation in and waste disposal and its significancepapers, the pioneers recapture the in- Developing Countries to development in the context of thetellectual excitement, expectations, and Charles Cooper International Drinking Water Supplyactivism of that period and provide and Sanitation Decade. Examines therare autobiographical detail and insight Staff Working Paper No. 441. 1980. 59 Bank's past role in improving waterinto why they said what they did and pages (including references). supply and waste disposal facilities inwhat they now think about the state of Stock No. WP 0441. $3. developing countries and draws con-development thought and policy. clusions for the future.Commentary is provided by econo- Poverty and Basic Needs Series 1980. 46 pages.mists of the succeeding generation,who reappraise their ideas with the A series of booklets prepared by the Stock Nos. BK 9024 (Arabic), BK 9025benefit of hindsight. General over- staff of the World Bank on the subject (English), BK 9026 (French), BK 9027views of the subject have been written of basic needs. The series includes (Spanish). $3 paperback.
by Gerald Meier and Paul Streeten. cept of basuc needs, counhtrre the csn-P
Oxford University Press. May 1984. ies, and sectoral studies. Poverty and the DevelopmentAbout 400 pages. Hardcover only. of Human Resources: Regional
ISBN 0-19-520452-2. Stock No. OX Brazil Perspective520452, $29.95. Peter T. Knight and Ricardo J. Willem Bussink, David Davies,
Moran Roger Grawe, Basil Kavalsky, and
NEW An edited and updated edition of the Guy P. Pfeffermannmore detailed publication, Brazil: Hu- Staff Working Paper No. 406. 1980. 199
Planning in Developing man Resources Special Report (see de- paga (including 7 tables, 2 appendixes,Countries: Lessowts -of scription under Country Studies list- refprences, footnotaes).
Experience Stock No. WP 0406. $5
Ramgopal Agarwala Z981. 98 pages (including statistical ap-Reports that, in most developing pendix, map). English. Poverty and Human
countries, planning failed to live up to Stock No. BK 9028. S5. Developmentexpectations. Outlines steps to remedy Malnourished People: A Policy Paul Isenman and others
this situation. Recommends a general View Since economic giwth alone has notreorientation and emphasis on the reduced absolute poverty, it has beenmost effective areas in the initial for- Alan Berg necessary to consider other strategies.mulation of plans.Provides an in-depth Please refer to Food and Nutrition for The strategy examined in this study-review of the experience of planning information. human development-epitomizes the

idea that poor people should be LC 79-18026. ISBN 0-19-520094-2, hard- in public administration and manage-helped to help themselves. Four chap- cover, ISBN 0-19-520095-0, paperback. ment training (PAMT) in developingters provide an overview of alternative Stock Nos. OX 520094, $34.50 hardcover; countries. Highlights various aspectsstrategies; a detailed look at health, OX 520095, $12.95 paperback. of traWng and career developmenteducadon, nutrition, and fertility; les- French: Changement des structres c poli- programs including the impact ofsons from exising programs; and an tque de devloppement. Econo ica, 1981. PAMT programs in developing coun-examinaion of broader issues in plan- ISBN 2-7178-0404-8, Stock No. IB 0540, tries during the past 30 years, the rea-ning. $12.95. son for successful programs, and someOxford University Press. 1982. 96 pages Spanish: Cambio estructural y politica de innovative training designs and meth-(including statistical appendix). . desarrollo. Editorial Tecnos, 1980. ISBN stLC 82-2153. ISBN 0-19-520389-5. Stock 84-309-0845-5, Stock No. iB 0612, Staff Woring No. 584. 1984. 127 paga.No. OX 520389. $7.95. $12.95. ISBN 0-8213-0234-5.Stock No. WP 0584.
_ _ _ _ _ _ _ $~~~~~~~~~5.Reforming the New Economic Ne nMechanism in Hungary NEWbela Balassa Successes and Failures in Development. Human EcologicStaff Working Paper No. 534. 1982. 56 Meeting the Management ConsiderationspagIS. Challenge: Strategies and Their Robert GoodlandISBN 0-8213-0048-2. Stock No. WP 0534. Implementation . At the current time, approximately 200$3. Milan Kubr and John Wallace milion tribal people live in all regions
- ~~of the world and number among theSocial Infrastructure and Exankines the original nature of key poorest of the poor. This paper de-Services in Zimbabwe - management problems faced by devel- scribes the problems associated withRashid Faruqee oping countries and outlines proven the development process as it affectsStaff Working Paper No. 495. 1981. 111 strategies for improving management tribal peoples; outlines the requisitespages (including bibliography, map). competence and performance. Presents for meeting the human ecologic needs
SokN.WP 0495. $5. approaches to management develop- of tribal peoples; and presents generalStock No. WP 0495. S5. ment recently introduced by enter- principles that are designed to assist
prises and institutions such as busi- the Banks staff and project.designersness clinics and self-development in incorporating appropriate proce-
NEW programs for management as well as dures to ensure the survival of tribaltailored and action-oriented programs. peoples and to assist with their devel-
Some Temporal Aspects of Staff Working Paper No. 585. 1984. 120 opment.Development: A Survey pages. 1982, 118 pages (including 7 annexes, bib-R. S. Eckaus ISBN 0-8213-0254-X.Stock No. WP 0585. liography).Identifies, quantifies, and explains fac- S5. ISBN 0-8213-0010-5. Stock No. BK 0010.tors that lengthen project design and Tourism-Passport to $5.completion. Analyzes changes that Development? Perspectives ontake place over time in principal areas th S and Cultr Eff The Tropics and Economicthat affect economic development-la- e ocl an tura es Development: A Provocativebor supply, social structures and their of Tourism in Developing Inquiry into the Poverty ofbehavior, govemrnment support func- Countriestions, market organization and effi- Emanuel de Kadt, editor Nationsciency, and capital productivity. Notes The first serious effort at dealing with AnrwM.aacthat development has proved to be a the effects of tourism development in Examines major characteristics of therelatively slow process. a broad sense, concentrating on social tropical climates that are significant toStaff Working Paper No. 626. 1983. 51 and cultural questions. economic development.pages. A joint World Bank-Unesco study. Oxford The Johns Hopkins University Press, 1976;ISBN 0-8213-0300-7.Stock No. WP 0626. University Press, 1979. 378 pages (includ- 2nd printing, 1979. 128 pages (including$3. ing maps, index). naps, bibliography, index).
Structural Change and LC 79-18116. ISBN 0-19-520149-3, hard- LC 76-1 7242. ISBN 0-8018-1891-5, hard-Development Policy cover; ISBN 0-19-520150-7, paperback. cover; ISBN 0-8018-1903-2, paperback.Development Policy ~~~~Stock Nos. OX 520149, $24.95 hardcover; Stock Nos. JH 1891, $12.50 hardcover, IHHollis Chenery OX 520150, $9.95 paperback. 1903, $5 paperback.A retrospective look at Chenery's Spanish: Los tropicos y desarrollo econom-thought and' writing over the past two ico: reflexiones sobre la pobreza de las na-decades and an extension of his work NEW ciones. Editorial Tecnos, 1978. ISBN 84-in Redistribution with Growth and Pat- 309-0740-8, Stock No. IB 0529. $5.terns of Development. Develops a set of Training for Publictechniques for analyzing structural Administration and Twenty-five Years of Economicchanges and applies them to some ma- Development, 1950 to 1975jor problems of developing countries Management in Developing David Morawetztoday. Countries: A Review A broad assessment of developmentOxford University Press, 1979; 2nd paper- Samuel Paul efforts shows that, although the devel-back printing, 1982. 544 pages (including Analyzes the results of a survey of the oping countries have been remarkablyreferences, index). trends, developments, and problems successful in achieving growth, the

distribution of its benefits among and LC 77-17243. ISBN 0-8018-2134-7, hard- ica, 1978. ISBN 2-7178-0038-7, Stock No.within countries has been less satisfac- cover; ISBN 0-8018-2092-8, paperback. IB 0546, $7.95.tory. Stock Nos. IH 2134, $16.50 hardcover; IH Spnish: Venticinco anos dc daarroJloThe Johns Hopkins University Press, 1977; 2092, $7.95 papback. economico: 1950 a n975. Editorial Tesnos,3rd printing, 1981. 136 pages (including French: Vingt-cinq annees de deveop*- 1978. ISBN 84-309-0792-0, Stock No. IBstatistical appendix, rerences). ment economnique: 1950 a 1975. Econom- 0529, $7.95.
World Development Report
issue brings not only an overview of M anagement and/ ~~~~~~the state of development, but also a
detailed analysis of such topics as Development Senesi ' / structural change, the varying experi-
/fi | ! , ences of low- and middle-income Decentralization in Developingcountries, the relation of poverty and Countries: A Review of Recent
- t - human resource development, global Experience. WP 0581. $5. (Development)- I - - and national adjustment, and agricul- Development Finance Companies, State
K _ _ / ture and food stability. Each contains a and Pdvately Owned: A Review. WPstatistical annex, World Development 0578. S3. (Finance and Debt)
A large-format series of annual studies Indicators, that provides profiles of Economic Reform in Socialbt Countries:of 200 or more pages, the World Devel- more than 120 countries in twenty-five The Experiences of China, Hungary,opment Report, since its inception, has multipage tables. The data cover such Romania, and Yugoslavia. WP 0579. $5.been what The Guardian has called "a subjects as demography, industry, (Development)most remarkable publication. It is the trade, energy, finance, and develop- The Effect of Corruption onnearest thing to having an annual re- ment assistance and such measures of Administrative Performance: lllustrationsport on the present state of the planet social conditions as education, health, from Developing Countries. WP 0580. 53.and the people who live on it." Each and nutrition. (Development)
The Japanese and Korean Experiences inManaging Development. WP 0574. 53.
World Development Report 1983 World Development Report 1978 (Development)Profiles the economies of 125 nations. (Discusses the development experi- Managing Project-Related TechnicalExplores the role of management in ence, 1950-75, development priorities Assistance: The Lessons of Success. WPsuccessful development enterprises, in the middle-income developing 0586. $5. (Development)Provides reliable up-to-date statistics. countries, and prospects for alleviating Managing the Public Service inOxford University Press, 224 pages (in- poverty.) Developing Countries: Isues andcluding maps, annex, World Development Ordering information for World Devel- Prospects. WP 0583. 53. (Development)Indicators). ISBN 0-19-520432-8; $20 opment Report. All editions are $8, pa- Managing State-Owned Enterprises. WPhardcover; $8 paperback. perback. 0577. S5. (Industry)
World Development Report 1982 World Development Report 1983: Planning in Developing Countries:(Tackles the principal issues and obsta- Stock Nos. OX 520431 (English) hard- Lessons of Experience. WP 0576. $3.des in the efforts to improve the per- cover; OX 520432 (English) paperback. (Development)formance of world agriculture.) World Development Report 1982: Polides for Strengthening LocalWorld Development Report 1981 Stock Nos. BK 0086 (Arabic), OX 503225 Goverfinent in Developing Countries.(Discusses adjustment-global and na- (English), BK 0087 (Spanish), lB 0607 WP 0582. $3. (Development)tional-to promote sustainable growth (French), IB 0606 (Japanese). Price Distortions and Growth inin the changing world economy.) World Development Report 1981: (Finance and Debt)res . S3.
Stock Nos. lB 0594 (Arabic), OX 502998 (Finaces and Dauebt) etig hWorld Development Report 1980 (English), IB 0598 (German), IB 0593 Succes and Failu in Meing the(Discusses adjustment and growth in Management Challenge: Strategies andthe 1980s and poverty and human de- (Spanish). Their Implementation. WP 0585. $5.velopment,) World Development Report 1980: (Development)
Stock Nos. OX 139419 (English), IB 0599 Training for Public Administration andWorld Development Report 1979 (Spanish). Management in Developing Countries: A(Discusses development prospects and World Development Report 1979: Review. WP 0584. $5. (Development)intemnational policy issues, structural Stock No. OX 502638 (English). Please see category indicated afterchange, and country development ex-perience and issues.) World Development Report 1978: each title for description and
Stock No. OX 139414 (English). bibliographic information.

The Wfrld BankPublications Order Fonn
SEND TO: YOUR LOCAL DISTRIBUTOR OR TO WORLD BANK PUBLICATIONS(See the other side of this form.) P.O. BOX 37525
WASHINGTON, D.C. 20013 U.S.A.
Date _
Name Ship to: (Enter if different from purchaser)
Title Name
Firm Title
Address Firm
City State Postal Code Address
Country Telephone ( ) City State - Postal Code
Purchaser Reference No. Country Tilephone
Check your method of payment.Enclosed is my S Check L] Internmtional Money Order O Unesco Coupons OL International Postal Coupon.Make payable to World Bank Publications for U. S. dollars unless you are ordering from your local distributor.
Charge my O VISA a MasterCard O American Express O Choice. (Credit cards accepted only for orders addressedto World Bank Publications.)
Credit Card Account Number Expiration Date Signature
a Invoice me and please reference my Purchase Order No.
Please ship me the items listed below.
customer nlaeralSlock Number Author/ Title Routing Code Quantity Unit Prie Total Amount S
All prices subject to change. Prices may vary by country. Allow 6-8 weeks for delivery.
Subtotal Cost $
Total copies . Air mail surcharge if desired ($2.00 each) $
Postage and handling for more than two complimentary items ($2.00 each) S
rlbtal $Thank you for your order.
IsRD00s3

Distributors of World Bank Publications
ARGENTINA GERMANY, FEDERAL REUBUC KUWAIT SRI LANKA AND THE MALDIVESCarlos Hirsch, SRL OF MEMRB LAka Hous BookshopGalena Guemes UNONVerla P.O. BD 5463 P.O. Box 244Florida 165, 4th FloorOfc. 4531465 D5300 Bonn I Kuwat 100, Sir Chittmpalam A. Gadiner1333 Buen Aim SArocst4sst 23 MALAYSI MawCthb
AUSTRAUA, PAPUA NEW G aEECE Univmity of Mal Coopendve Colomo 2GUINEA, FilI, SOLOMON MEMRB Bookshop, LinutedISLANDS, AND VANUATU 24, Ippodamou Steet P.O Box 1127. hun Pantal Ban SWEDEN
Info-Line Athens-1635 Kual Lumpw For single titus:Ovemas Docunent Delivery HONG KONG, MACAU KE)uzCO ABCE Frtzes Kung. HovbokhendlBox S06, GPO Rep g tn 12 Box 16356Sydney, NSW 2001 As15 200 Ltd. LNFOTEC eeipaanI o 65AustaNWa 6 Fl., 146 Prince Edward Road, W, San LorefrD 153311 Col. del Valle 503 27 Stockholm
Kowloon Deleg, Benito luae For bscription odm:BAkRAIN Hong Kong 03100 Mexio City We Me W AB
P.O. Box 22103 NDIA MOROCCO Box 300D4Pa a O TBown 3217 UBS Pubishers Distnbutors Ltd. MEMRB S104 25 StockholmManama Town 317 Post Box 7015 2 Rue Moiere Rac neSWTZAND
BANGLADESH New Delhi 110002 Casablanca Libinte PavotMicr Industnes Development 10 Fist Main Road THE NETHERLANDS 6 Rue Gmwus
Assiutance Socie Gandhi Napr Medical Books Europe. BV 1MBE) Cae posL 381G.P O BOX aoo 3Bngalore 5609 Noorderwal 38, CH 1211 Genea 11
BELGIUM Apee0ay Chamber, P.O. Box 736 724 L Lochem TANZANIAPuMficadons dn Nations Unies 5 Walace Stet NIGERIA Oxfotd Universi PrmsPublica6ons des Nations Unins Bombv 4000DI Univerity Pms Limited P. O. Box 3299Av. du Rol 202 Three Coo aIdng Jesiho Dr es Salum1060 BmsseLs 811-B. Chownnghee LAne PM d on Cii Bwn 509 cho
BRAZIL ~~~~~~~~Calcutta 70016 Pibadae MA aStoreTAfANPubEcacoes Tecrticas internacionasis 7188, II(CA). Swaup Nagar NORWAY 306 Siom PRad
Ltdae Kampeua Tanum Kad Johan, AS. Bgkok
0R409S eo PGulod SP Sivapan Road P 0. Box 1177 TR AS OAiGO01409 Sao Paulo, ~ Nuigamakka Senhum Svo tc StlfftUi
CANADA Madrs 600034 Oslo 1 55 Ent Min Road
C.P 85 131 Ape _ INDO U NESIA PAIaSTAN CuperCBPR 6S 1501 Ampue J4ree Pt. Indim Limuted MAX Book AgeN y Trinzda West Indies30uchetvilb Quebec J4B 11A Sam Rtulangl 37 65 Shahrh-Quaide-Azam TUNSIA
CHILE Jakart Pusat P.O. BOx No. ;29 Societe Tunisiesu de DfumsnEditorilRea cirm iento PO BOx ISI Lahote 3 ; Avenue de CartaSnflcm 35n IRELAND PANAMA TurCl
Santt5 TDC Publisher EdiciomnLibrenxCultuni TURKEYCOSTA RICA 12 North Frederick Steet Panmena. SA. Haet Kiaprv AS.Ubria Tejos Dublin I Av. 7. Espan 16 469 lstikWalCddeasCaUe 11.13 TALY Panama Zone i Beyogu LubulAv. Fernandez GuellITLAvn losemz GueU Ucosa Commisliinaha Saoni SPA PERU UGANDA
Via Lamarmor 45 Elitonal Desamollo SA Uganda BookshopCYPRUS 50121 Florence AparUdo 3824 Attn: Mr. Marn-Luther GalAwangoPE.URB JAPAN P.O. Box 7145
p O Box 23 Eastern Book Service (EES) PHIULIPINES Kampala37.3. HonD 3{home, Bunkloku Nationl Book Store UNED ARAB EMIRATES
DENMARK 113 701 Rizal Avenue MEMRSamfunlditittel'tur Tokvo Metro Manla P 0 Box 6097RosenoeD1 s ACne 11 JORDAN PORTUGAL Shar ahDK 197D Copnhagen V EILMRB Uvmana Portugal UNITED KINGDOM AND
EG T, ARAB REPUIUC OF PFO Box 313 Rua Do Carmo 7D074 NORTHERNIIRELNDAl Ahram Jabal 1200 Lisbon NORfTHRo LtdGalarSoeet Amman SAUDI ARABIA P 0. Box 3
KENYA law Book Store Alton, Hampshire GU 34 2PGFINLAND Atnca Book Service (E A.) Ltd. P.O. Box 3196 United KingdomAkateemmnen KiLakauppa P O Box 45245 Riyadh 11471 VE?lEZUELAPSO BoxS12 Naiob INGAPORE, TAIWAN, BURMA Librea del Este
SF4.0010 KOREA, REP'BLIC OF Information Pubiations Private, Ltd. Aptdo. 60.337Helsinki 10 Pan Korea Book Corporation 0206 Ist Fl., Pes.Fu Indwuatrl Bldg.. Cara 1060-A
FRANCE P 0 Box 101. Kwangwhamun 24 New Industn Roa d WESTERN SAMOAWorld Bank Publations Seoul Sinppore Wesley Bookshop66 Avenue d'iena Api75116 Pans Mundi-Prensa Libros, SA.
Castello 3728001 Madind

~HG 3881.5 .W57 W67 NO.737c..3
C BANETH, JEAN, 1936-
SUSTAINING WORLD ECONOMICIRECOVERY
DATE NAME AND EXTENSION ROOMNUMBER!
i~~~~~~~~~~~~~~~~~~~~~~~~~~~~~~~~~~~~________________ l

The World Bank
Headquarters European Office Tokyo Office1818 H Street, N.W. 66, avenue d'1ena Kokusai BuildingWashington, D.C. 20433, U.S.A. 75116 Paris, France 1-1 Marunouchi 3-chome
Telephone: (202) 477-1234 Telephone: (1) 723-54.21 Chiyoda-ku, Tokyo 100, JapanTelex: WUI 64145 WORLDBANK Telex: 842-620628 Telephone: (03) 214-5001
RCA 248423 WORLDBK Telex: 781-26838Cable Address: INTBAFRAD
WASHINGTONDC
ISSN 0)2,3-2115/iSBN 0-8213-05'16-8