Embed Size (px)
Citation preview
P" , 'd' "' u. ~
il~,ra',.e~OB,
i:'
~
It!.-- -
..!
SH207CP6#61c.1
'II~
!'l ~
SuStalilahl1= 'III":III.~ ....
...
oar Man~gdnentJ ()ii.~y..""
l
,,".
.~I'
"
u
.-."""u...,..
III...
-,
I
J::;. ,.
-t. jII' '"
""
)" 1.
c/ S~stainable ~ i s h Production
in Lak~ Nasser: Ecological Basis and Management Policy
Edited by J.F. 9 'g 7
Il@m@M International Ce ter for L~ving Aquatic
Resource! Management
Sustainable Fish Production in Lake Nasser: 207 Ecological Basis and Management Policy Cp6 Proceedings of the First Planning Workshop, Lake Nasser Project # Ll 19-23 June 1998 Isis Island Hotel, Aswan, Egypt
e f l kUG6 2000
2000
Published by the International Center for Living Aquatic Resources Management, P.O. Box 500, GPO 10670, Penang, Malaysia.
Craig, J.E, Editor. 2000. Sustainable fish production in Lake Nasser: ecological basis and management policy. ICLARM Conf. Proc. 61, 184 p.
Managing Editor: Marie Sol Sadorra-Colocado Copyeditor and Production Coordinator. Sheila Siar Editorial Assistant: Regina Morales Cover Designer and Layout Artist: Mayanne Wenceslao
ISBN 971-802-006-3 ISSN 01 15-4435
I C ~ q ~ l c l w. li/ 10 ICLARM 1s one of the 16 international research centers of the Consultative Group on International
CGIAR Agricultural Research (CGIAR) that has initiated
E,. the public awareness campaign, Future Harvest. HARVEST (6
ii Sustainable fish production in Lake Nasser
CONTENTS
Foreword
Preface
Acknowledgements
I Introduction
M.M. EL SHAHAT
M.B.A. SAAD
J.F. CRAIG
TJ. PITCHER
11 Background A.A. MOHAMED
R.G. ABD ELLAH A.E. BELAL I.A. MAIYZA
R.H GOMA
S.A. RABEH
O.A. HABIB
O.A. HABIR
1.0. MOHAMEI)
1.0. MOHAMED T. IORIYA
M.M. ALL
O.A. HABIB
M.R.A. FISHAR
M.E. THARWAT
Lake Nas er Overwew
Confl~cts I etween Users
Alms of tMe Lake Nasser Project and F~rst Plannmg Workshop
The Use of Ecosystem Modellmg In Comparat~ve Pollcy Anolys~s Maxirmzlng Sustainable Benefits from Lake, Nasser's Aquauc Resources
Seasonal yar~atron In Mean Air and Water Temperature, Transparejicy, pH and D~ssolved Oxygen Along the Main Channel
Seasonal VerUcal Var~atron In Water Temperature and Total D~ssolved Solids
Seasonal and Spatial Vanatron of Nutrients
Bacter~olog~cal Stud~es
Seasonal Vanahon of Phytoplankton Abundance
Pnrnary P ~ ~ d u c t ~ o n of the Phytoplankton
Average Changes in the Dlstr~bution of Phytoplankton Chloroph~ll a in the Euphouc Zone In the Main Channel
Mzcrocystzs aemgznosa Kutz Water Blooms
Aquahc Macrophytes In Egyptian Nubia Pre- and Post-forma/hon of Lake Nasser
Zooplankton Distribution
Macrobenthic Fauna
Rsheatingi Birds
v
vi
vii
1
3 7
11
15
23
2
29
33
39
43
5 1
57
59
6 1
67
75
81
iii
H.A. ADAM
M.Z. AGAYPI
U. S.A. KHALIFA M.Z. AGAYPI H.A. ADAM
B.Z. SHENODA M. NAGUIB
M.M. EL SHAHAT
A. BARRANIA
M.M. MOHIEDDIN
Age and Growth of OreochromLs niloticus L. and Sarotherodon galilaeus Art.
A Note on the Relationship Between Catch and Water Level
Population Dynamics of Oreochromis niloticus L. and Sarotherodon galilaeus Art.
Net Cage Culture of Silver Carp, Hypophthalmichthys molitrtx Valenciennes, Without Artificial Feeds
Fisheries Management and Enhancement
Harvesting, Transporting, Processing and Marketing of Fish
Some Socioeconomic Aspects
111 Constraints and techniques J.F. CRAIG
T.J. PITCHER D. PREIKSHOT
IV Overviews G. PAT~ERSON
M. NOMURA
A.F. BORN
B .E . MARSHALL
M. AHMED
T.J. PITCHER
V Planning J.F. CRAIG
Constraints and Issues
RAPFISH: A Rapid Appraisal Technique to Evaluate the Sustainability Status of Fisheries
Ecosystem Studies and the Modelling of the Fishery in Lake Nasser/Nubia
Aquaculture
Stock Enhancement
Alien Fish Introductions: The African Experience and Its Relevance to Lake Nasser
Socioeconomic Policy Issues in the Management of the Fishery
Requirements for Fisheries Assessment and Management
Planning: Project Recommendations and Implementation Plans
Indices and appendices Species index
Author index
Appendix 1. List of Participants
Appendix 2. Workshop Program
iv Sustainable fish production in Lake Nasser
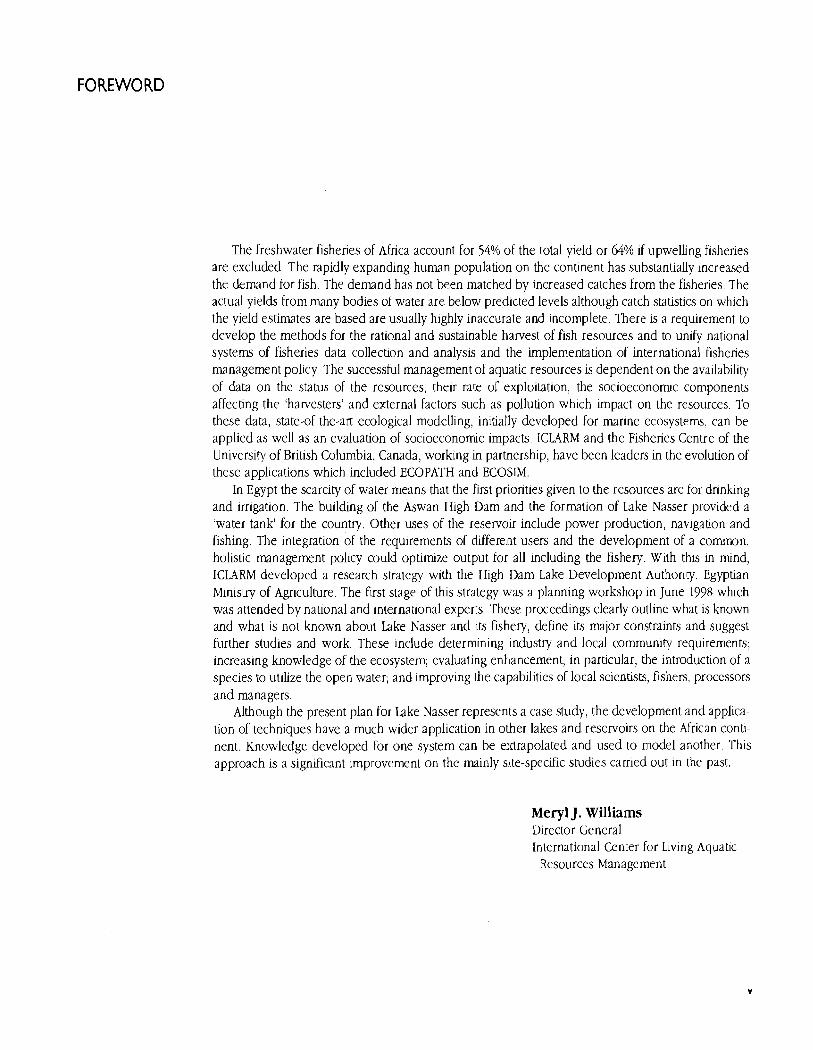
FOREWORD
The freshwater fisheries of Africa account for 54% of the total yield or 64% if upwelling fisheries are excluded. The rapidly expanding human population on the continent has substantially increased the demand for fish. The demand has not been matched by increased catches from the fisheries. The actual yields from many bodies of water are below predicted levels although catch statistics on which the yield estimates are based are usually highly inaccurate and incomplete. There is a requirement to develop the methods for the rational and sustainable harvest of fish resources and to unify national systems of fisheries data collection and analysis and the implementation of international fisheries management policy. The successful management of aquatic resources is dependent on the availability of data on the status of the resources, their rate or exploitation, the socioeconomic components affecting the 'harvesters' and external factors such as pollution which impact on the resources. To these data, state-of-the-art ecological modelling, initially developed for marine ecosystems, can be applied as well as an evaluation of socioeconomic impacts. ICLARM and the Fisheries Centre of the University of British Columbia, Canada, working in partnership, have been leaders in the evolution of these applications which included ECOPATH and ECOSIM.
In Egypt the scarcity of water means that the first priorities given to the resources are for drinking and irrigation. The building of the Aswan High Dam and the formation of Lake Nasser provided a 'water tank' for the country. Other uses of the reservoir include power production, navigation and fishing. The integration of the requirements of different users and the development of a common, holistic management policy could optimize output for all including the fishery. With this in mind, ICLARM developed a research strategy with the IIigh Dam Lake Development Authority, Egyptian Ministry of Agriculture. The first stage of this strategy was a planning workshop in June 1998 which was attended by national and international experts. These proceedings clearly outline what is known and what is not known about Lake Nasser and its fishery, define its major constraints and suggest further studies and work. These include determining industry and local community requirements; increasing knowledge of the ecosystem; evaluating enhancement, in particular, the introduction of a species to utilize the open water; and improving the capabilities of local scientists, fishers, processors and managers.
Although the present plan for Lake Nasser represents a case study, the development and applica- tion of techniques have a much wider application in other lakes and reservoirs on the African conti- nent. Knowledge developed for one system can be extrapolated and used to model another. This approach is a significant improvement on the mainly site-specific studies carried out in the past.
Meryl J. Williams D~rector General International Center for L~ving Aquatic
Resources Management
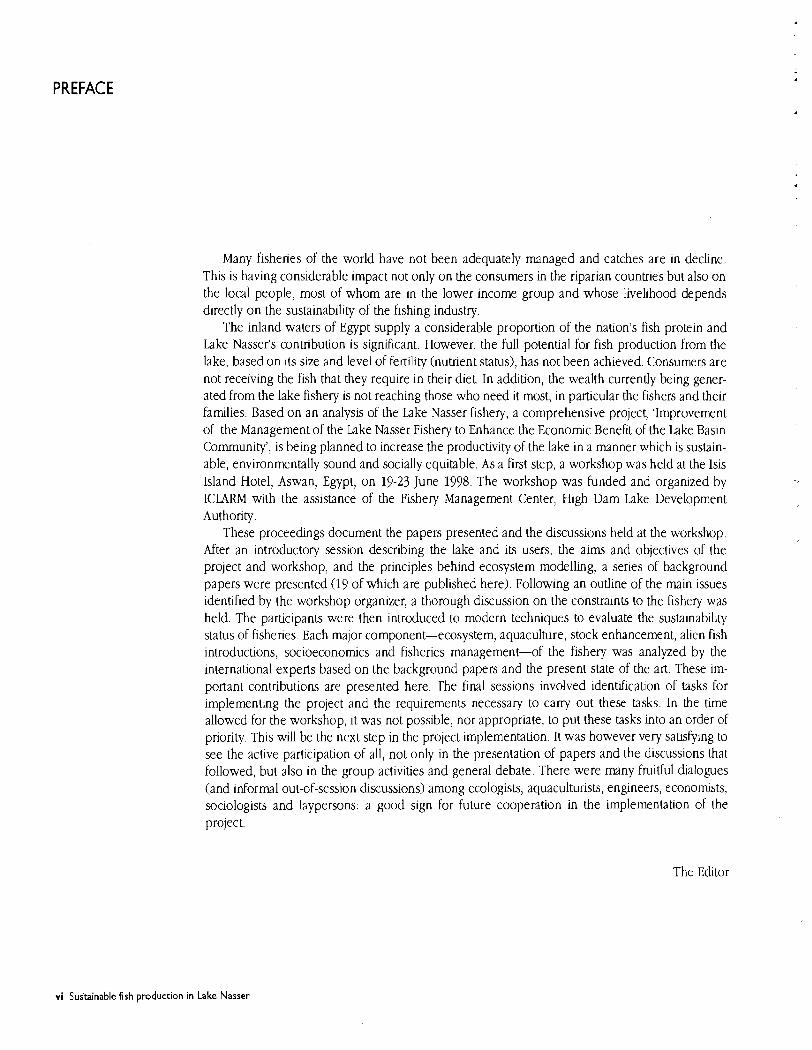
PREFACE
Many fisheries of the world have not been adequately managed and catches are in decline. This is having considerable impact not only on the consumers in the riparian countries but also on the local people, most of whom are in the lower income group and whose livelihood depends directly on the sustainability of the fishing industry.
The inland waters of Egypt supply a considerable proporbon of the nation's fish protein and Lake Nasser's contribution is significant. However, the full potential for fish production from the lake, based on its size and level of fertility (nutrient status), has not been achieved. Consumers are not receiving the fish that they require in their diet. In add~tion, the wealth currently being gener- ated from the lake fishery is not reaching those who need it most, in particular the fishers and their families. Based on an analysis of the Lake Nasser fishery, a comprehensive project, 'Improvement of the Management of the Lake Nasser Fishery to Enhance the Economic Benefit of the Lake Basin Community', is being planned to increase the productivity of the lake in a manner which is sustain- able, environmentally sound and socially equitable. As a first step, a workshop was held at the Isis Island Hotel, Aswan, Egypt, on 19-23 June 1998. The workshop was funded and organized by ICLARN with the assistance of the Fishery Management Center, High Dam Lake Development Authority.
These proceedings document the papers presented and the discussions held at the workshop. After an introductory session describing the lake and its users, the aims and objectives of the project and workshop, and the principles behind ecosystem modelling, a series of background papers were presented (19 of which are published here). Following an outline of the main issues ident~fied by the workshop organizer, a thorough discussion on the constraints to the fishery was held. The participants were then introduced to modcrn techniques to evaluate the sustainability status of fisheries. Each major component-ecosystem, aquaculhlre, stock enhancement, alien fish introductions, socioeconomics and fisheries management-of the fishery was analyzed by the international experts based on the background papers and the present state of the art. These im- portant contributions are presented here. 'The final sessions invdved identification of tasks for implementing the project and the requirements necessary to carry out these tasks. In the time allowed for the workshop, it was not possible, nor appropriate, to put these tasks into an order of priority. This will be the next step in the project implementation. It was however very satisfying to see the active participation of all, not only in the presentation of papers and the discussions that followed, but also in the group activities and general debate. There were many fruitful dialogues (and informal out-of-session discussions) among ecologists, aquaculturists, engineers, economists, sociologists and laypersons: a good sign for future cooperation in the implementation of the project.
The Editor
vi Sustainable fish production in Lake Nasser
ACKNOWLEDGEMENTS
The support of H.E. Prof. Dr. Youssuf Wally, Deputy Prime Mmister and Min~ster of Agr~culture and Land Reclamation for Egypt, is gratefully acknowledged. Mr. IIamdy Tolba, Chairman of IIigh Dam Lake Development Authority (HDLDA), has supported the project since its inception and this is very much appreciated. Thanks are due to General Salah Mesbah, Governor of the Aswan Governor- ate, who lundly closed the workshop. I am indebted to all the participants of the workshop, in particular those who gave presentations and acted as rapporteurs. Ms. Mona Hassan Mahmoud of the Fishery Management Center (FMC) and Ms. Amird Mohamed of ICLARM provided excellent secre- tarial support in Aswan. A special note of gratitude goes to Mr. Mohamed El Shahat, Director of FMC, and the local organizing committee at Aswan, in particular, Mr. Zakariya Attiya and Mr. Mohamed Koraiyem from HDLDA and Mr. Abdel Wahab Khalifa from FMC. Mrs. Hilary Craig provided consid- erable voluntary assistance. Ms. Samia Gornaa provided logistical support in Cairo and assistance and artistic flair in page design. Thanks go to Mr. Mohammed Said for giving the permssion to use his papyrus for the cover of these proceedings and to Mr. IKhalid Nour Eldein for help in redrawing many of the figures. The editor would particularly like to thank Ms. Mohamed and Mrs. Craig for all their help and effort in the preparation of these proceedings. The costs of the workshop, including the publication of this volume and the travel of invited participants, were provided by ICLARM. I am grateful to Ms. Sheila Siar and the Publications Unit in Makati Civ, Philippines, for their assistance. The workshop was held at the Isis Island Hotel and the efficient support of the hotel management and staff was very much appreciated.
The Editor
vii

Introduction
Lake Nasser Overview
M.M. El Shahat Fishery Management Center, High Dam lake Development Authority,Aswan, Egypt
El Shahat, M.M. 2000. Lake Nasser overview, p. 3-6. In J.F. Craig (ed.) Sustainable fish production in Lake Nasser: ecological basis and management policy. ICLARM Conf. Proc. 6 1 , I84 p.
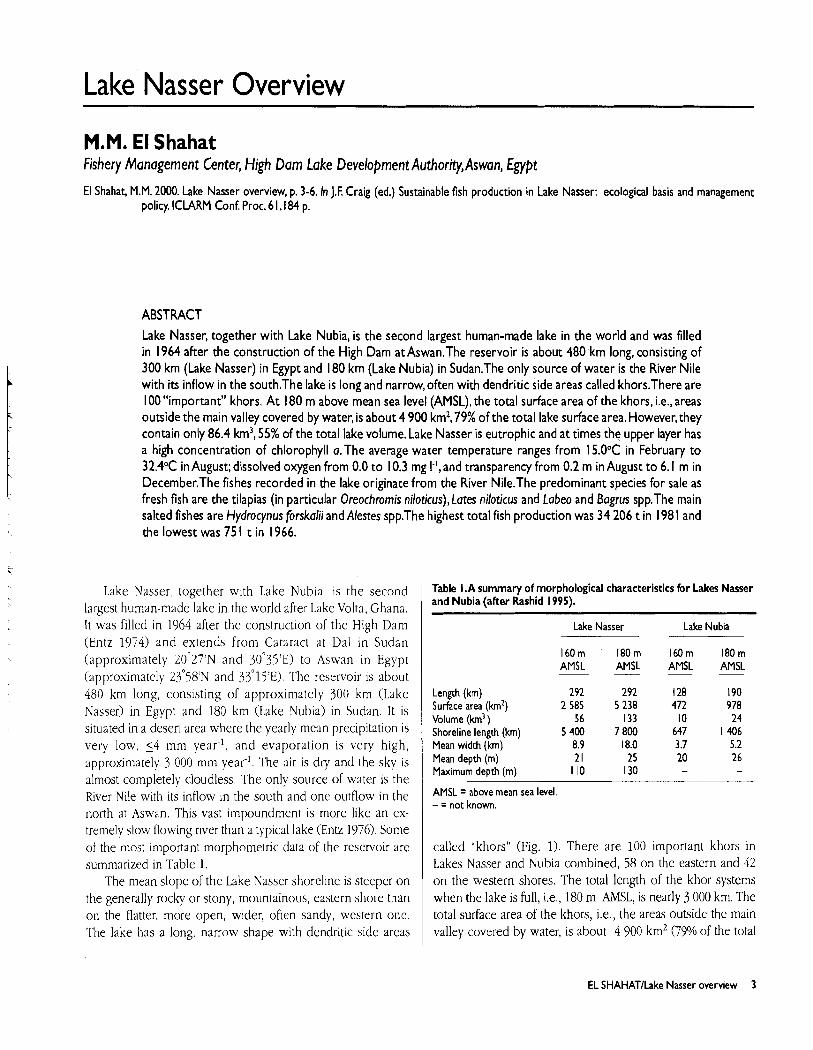
ABSTRACT
Lake Nasser, together with Lake Nubia, is the second largest human-made lake in the world and was filled in 1964 after the construction of the High Dam at Aswan.The reservoir is about 480 km long, consisting of 300 km (Lake Nasser) in Egypt and 180 km (Lake Nubia) in Sudan.The only source of water is the River Nile with its inflow in the south.The lake is long and narrow, often with dendritic side areas called khors.There are 100 "important" khors. A t 180 m above mean sea level (AMSL), the total surface area of the khors, i.e., areas outside the main valley covered by water, is about 4 900 km2, 79% of the total lake surface area. However, they contain only 86.4 km3, 55% of the total lake volume.Lake Nasser is eutrophic and at times the upper layer has a high concentration of chlorophyll a.The average water temperature ranges from 15.0% in February to 32.4"C in August; dissolved oxygen from 0.0 to 10.3 mg I-', and transparency from 0.2 m in August to 6.1 m in December.The fishes recorded in the lake originate from the River Nile.The predominant species for sale as fresh fish are the tilapias (in particular Oreochromis niloticus),Lates niloticus and Labeo and Bagrus spp.The main salted fishes are Hydrocynus forskalii and Alestes spp.The highest total fish production was 34 206 t in I98 1 and the lowest was 75 1 t in 1966.
Lake Nasser, together with Lake Nubia, is the second largest human-made lake in the world after Lake Volta, Ghana. It was filled in 1964 after the construction of the High Dam (Entz 1974) and extends from Cataract at Dal in Sudan (approximately 2 0 ' 2 7 ' ~ and 30'35'~) to Aswan in Egypt (approximately 23 '58 '~ and 33'15'~). The reservoir is about 480 km long, consisting of approximately 300 km (Lake Nasser) in Egypt and 180 km (Lake Nubia) in Sudan. It is situated in a desert area where the yearly mean precipitation is very low, 54 mm year-', and evaporation is very high, approximately 3 000 mm year-'. The air is dry and the sky is almost completely cloudless. The only source of water is the River Nile with its inflow in the south and one outflow in the north at Aswan. This vast impoundment is more like an ex- tremely slow flowing river than a typical lake (Entz 1976). Some of the most important morphometric data of the reservoir arc summarized in Table 1.
The mean slope of the Lake Nasser shoreline is steeper on the generally rocky or stony, mountainous, eastern shore than on the flatter, more open, wider, often sandy, western one. The lake has a long, narrow shape with dendritic side areas
Table 1.A summary of morphological characteristics for Lakes Nasser and Nubia (after Rashid 1995).
Lake Nasser
I60m 180m AMSL AMSL - -
Length (km) 292 292 Surface area (km2) 2 585 5 238 Volume (km3 ) 56 133 Shoreline length (km) 5400 7800 Mean width (km) 8.9 18.0 Mean depth (m) 2 1 25 Max~mum depth (m) 110 130
Lake Nubia
I60m l8Om AMSL AMSL - -
1 28 190 472 978
10 24 647 1 406 3.7 5.2 20 26 - -
AMSL = above mean sea level. - = not known.
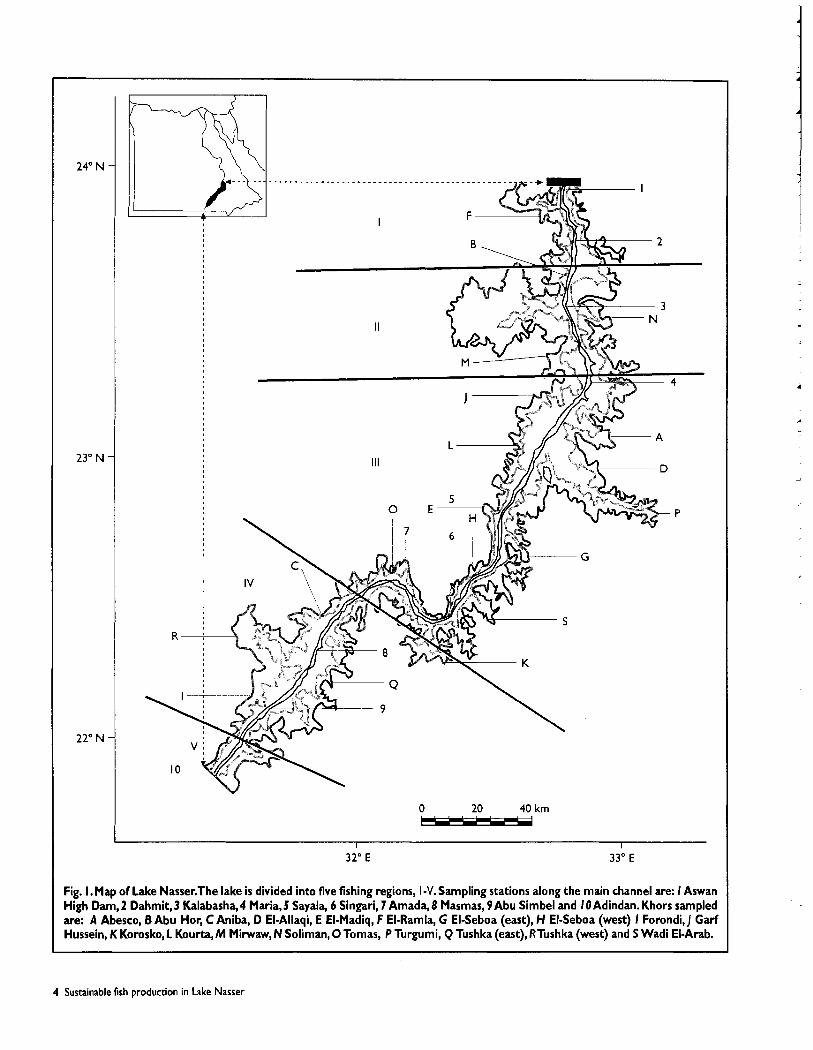
called "khors" (Fig. 1). There are 100 important khors in Lakes Nasser and Nubia combined, 58 on the eastern and 42 on the western shores. The total length of the khor systems when the lake is full, i.e., 180 m AMSL, is nearly 3 000 km. The total surface area of the khors, i.e., the areas outside the main valley covered by water, is about 4 900 km2 (79% of the total
EL SHAHATlLake Nasser overview 3
0 20 40 krn
Fig. I .Map of Lake Nasser.The lake is divided into five fishing regions, I -V. Sampling stations along the main channel are: I Aswan High Dam,2 Dahmit,3 Kalabasha,4 Maria,S Sayala, 6 Singari, 7 Amada,8 Masmas, 9Abu Simbel and IOAdindan. Khors sampled are: A Abesco, B Abu Hor, C Aniba, D El-Allaqi, E El-Madiq, F El-Ramla, G El-Seboa (east), H El-Seboa (west) I Forondi,] Gad Hussein, K Korosko, L Kourta,M Mirwaw, N Soliman, 0 Tomas, P Turgumi, Q Tushka (east), RTushka (west) and S Wadi El-Arab.
4 Sustainable fish production in Lake Nasser
lake surface). In volume, they contain only 86.4 km3 water (55% of the total lake volume).
The deepest part of the lake is the ancient riverbed with its adjacent strips of cultivated land which together form the origi- nal river valley. The bottom of this central area is between 85 and 150 m AMSL. The side areas of the lake lie between 150 and 180 m AMSL. The speed of the current in the central area is fast at the southern end of the Nubian gorge region (0.5 m s-I). This speed is gradually reduced within a few kilometers to 0.1-0.2 m s-' and in Lake Nasser to 0-0.03 m s-l.
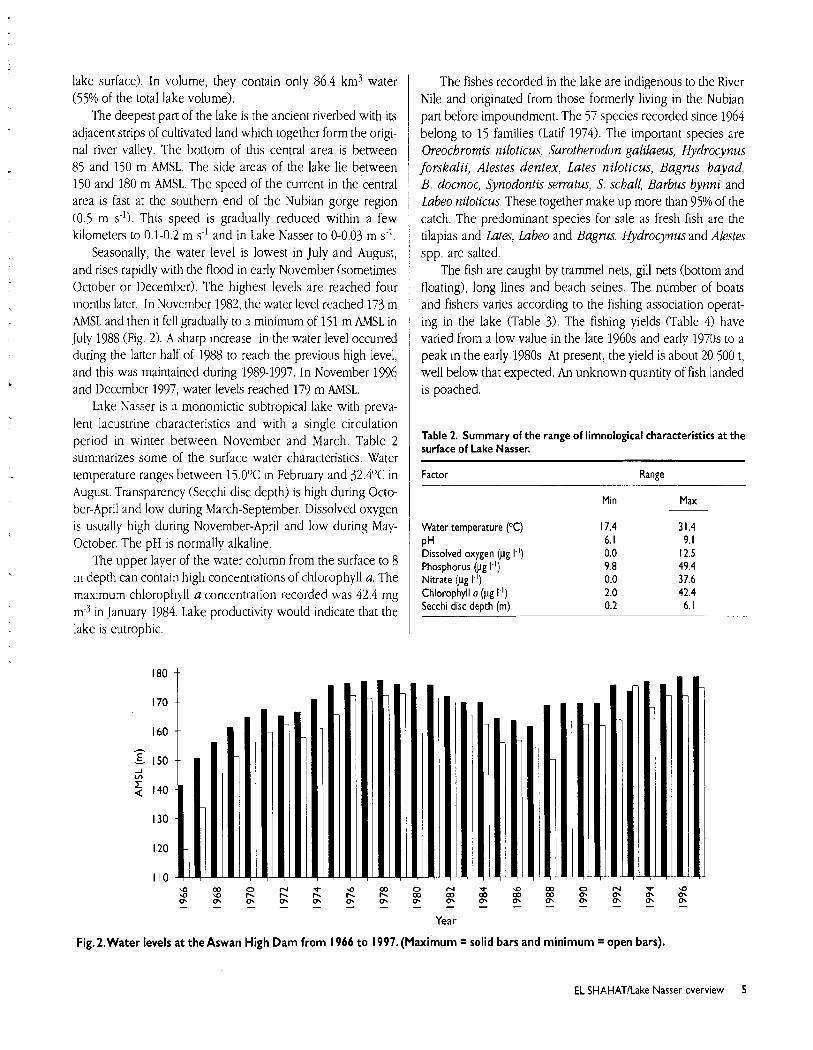
Seasonally, the water level is lowest in July and August, and rises rapidly with the flood in early November (sometimes October or December). The highest levels are reached four months later. In November 1982, the water level reached 173 m AMSL and then it fell gradually to a minimum of 151 m AMSL in July 1988 (Fig. 2). A sharp increase in the water level occurred during the latter half of 1988 to reach the previous high level, and this was maintained during 1989-1997. In November 1996 and December 1997, water levels reached 179 m AMSL.
Lake Nasser is a monomictic subtropical lake with preva- lent lacustrine characteristics and with a single circulation period in winter between November and March. Table 2 summarizes some of the surface water characteristics. Water temperature ranges between 15.0°C in February and 32.4"C in August. Transparency (Secchi disc depth) is high during Octo- ber-April and low during March-September. Dissolved oxygen is usually high during November-April and low during May- October. The pH is normally alkaline.
The upper layer of the water column from the surface to 8 m depth can contain high concentrations of chlorophyll u. The maximum chlorophyll a concentration recorded was 42.4 mg m3 in January 1984. Lake productivity would indicate that the lake is eutrophic.
The fishes recorded in the lake are indigenous to the River Nile and originated from those formerly living in the Nubian part before impoundment. The 57 species recorded since 1964 belong to 15 families (Latif 1974). The important species are Oreochromis niloticus, Sarotherodon galilaeus, Hydrocynus forskalii, Alestes dentex, Lates niloticus, Bagrus bayad, B. docmoc, Synodontis servatus, S, schall, Barbus bynni and Labeo niloticus. These together make up more than 95% of the catch. The predominant species for sale as fresh fish are the tilapias and Lates, Labeo and Bagms. Hydrocynus and Alestes spp. are salted.
The fish are caught by trammel nets, gill nets (bottom and floating), long lines and beach seines. The number of boats and fishers varies according to the fishing association operat- ing in the lake (Table 3). The fishing yields (Table 4) have varied from a low value in the late 1960s and early 1970s to a peak in the early 1980s. At present, the yield is about 20 500 t, well below that expected. An unknown quantity of fish landed is poached.
Table 2. Summary of the range of limnological characteristics at the surface of Lake Nasser.
Factor Range
Min Max
Water temperature PC) 17.4 PH 6.1 Dissolved oxygen (pg 1.') 0.0 Phosphorus (pg I-') 9.8 Nitrate (pg I.') 0.0 Chlorophyll o ( ~ g 1.') 2.0 Secchi disc depth (m) 0.2
Year
Fig. 2.Water levels at the Aswan High D a m from 1966 t o 1997. (Maximum solid bars and minimum = open bars).
EL SHAHATILake Nasser overview 5
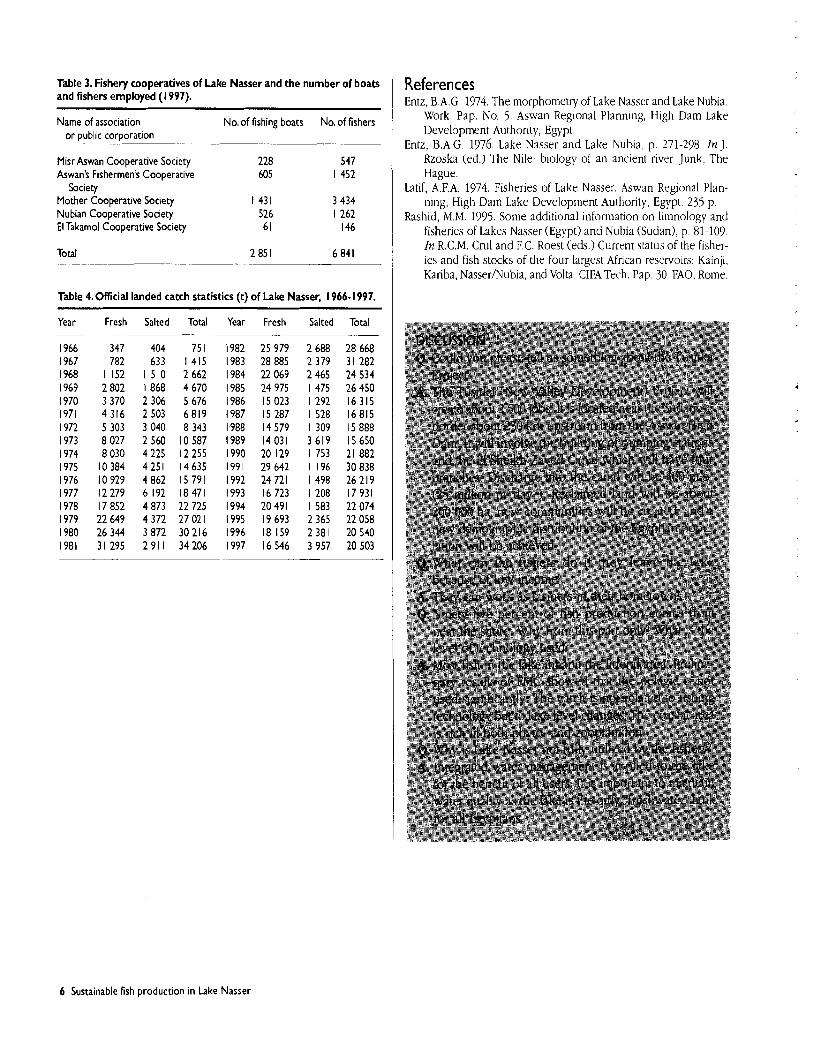
Table 3. Fishery cooperatives of Lake Nasser and the number of boats and fishers employed (1 997).
Name of association No. of fishing boats No. of fishers or public corporation
Misr Aswan Cooperative Society 228 547 Aswan's Fishermen's Cooperative 605 1 452
Society Mother Cooperative Society 1431 3 434 Nubian Cooperative Society 526 1 262 El Takarnol Cooperative Society 6 1 146
Total 2 851 6 841
Table 4. Official landed catch statistics (t) of Lake Nasser, 1966- 1997.
Year Fresh Salted Total Year Fresh Salted Total
References Entz, B.A.G. 1974. The morphometry of Lake Nasser and Lake Nubia.
Work. Pap. No. 5. Aswan Regional Plannmg, High Dam Lake Development Authority, Egypt.
Entz, B.A.G. 1976. Lake Nasser and Lake Nubia, p. 271-298. In J . Rzoska (ed.) The Nile: biology of an ancient river. Junk, The Hague.
Latif, A.F.A. 1974. Fisheries of Lake Nasser. Aswan Regional Plan- ning, High Dam Lake Development Authority, Egypt. 235 p.
Rashid, M.M. 1995. Some additional information on limnology and fisheries of Lakes Nasser (Egypt) and Nubia (Sudan), p. 81-109. In R.C.M. Crul and F.C. Roest (eds.) Current status of the fisher- ies and fish stocks of the four largest African reservoirs: Kainji, Kariba, Nasser/Nubia, and Volta. CIFATech. Pap. 30. FAO. Rome.
6 Sustainable fish production in Lake Nasser
Conflicts between Users
M.B.A. Saad Hydraulics Research Institute, El Kanater, Egypt
Saad, M.B.A.2000. Conflicts between users, p. 7-9. In J.F. Craig (ed.) Sustainable fish production in Lake Nasser: ecological basis and management policy. ICLARM Conf. Proc. 6 1,184 p.
ABSTRACT
The construction of the High Dam and the formation of Lake Nasser upstream have been among the most important projects for sustainable development in Egypt.The total storage capacity of the lake is 162 km3. Three types of storage are involved: (I) dead storage which extends from bed level to the water level at 147 m above mean sea level (AMSL) and has a capacity of 3 1.6 km3; (2) live storage between 147 and 175 m AMSL which has a capacity of 89.7 km3; and (3) emergency storage between 175 and 183 m AMSL with a capacity of 4 1 km3.The lake ensures that Egypt is provided with Nile water as specified in the 1959 agreement between Egypt and Sudan.The High Dam is the means of controlling sufficient flow for daily demands, which include agriculture, industry,tourism, hydroelectric power, drinking, domestic use and navigation.The development of the lake area is a major source of interest for many sectors in Egypt. Development projects include agricul- ture, industry,tourism and fishing production. Others are ready for implementation. In this paper, the conflicts between different users of the lake are highlighted and the environmental consequences resulting from development projects are described.
Introduction The River Nile, the longest river in the world (about 6 825
km), has the oldest and most extensive hydrological records of any water system. It collects the water from three basins: (a) the equatorial lakes plateau, (b) Bahar El Ghayal and (c) the basin of the rivers Sobat, Blue Nile and Atbara, which emerge from the Ethiopian mountains. There are seven dams and their associated reservoirs built on the Nile and its tribu- taries. Two of them store water all-year round. These are at the outlet of Lake Victoria in Uganda and at the Aswan High Dam on the main Nile in Egypt. Several reservoirs that fill seasonally are situated in Sudan. These are behind the Sennar and Roseires Dams on the Blue Nile, the Khasm EI Girba Dam on the Atbare River and the Jebel Awlia Dam on the White Nile. In Egypt, the Old Aswan Dam on the main Nile is used as a regulator for Lake Nasser. The annual yield (vol- ume) of the River Nile differs greatly from one year to an- other. It may rise to about 151 km3 as in the year 1878-1879, or drop to 42 km3 as in the year 1913-1914.
Water in Egypt is predominantly used for agriculture. The total area of cultivated land is about 3.1 million ha, which requires 54.5 km3 water year-'. Domestic use demands 2.9
km3 year.'. In addition to Lake Nasser, water demand is met from ground water and drainage. Several factors have led to a rapid increase in water demand. These include a rapid rise in the Egyptian population, excess cultivation of rice (actual area 650 000 ha compared to the planned area of 283 000 ha), horizontal expansion of the cultivated area, the change from sprinkler and drip to immersion irrigation, industrial develop- ment and improved living standards. By the year 2000, it is expected that demands will increase by about 10 km3 year-', 90% of which will be required for a new 43 million ha hori- zontal expansion of agriculture and 10% for an increase in domestic and industrial use. In the year 2027, the agricultural demand will be increased by about 5.6 km3 year-' (810 000 ha will be reclaimed) and the domestic and industrial demands will increase by 6 km3 year-' .
Lake Nasser storage basin The main reason for constructing the Aswan High Dam
was to safeguard the Egyptian people from the devastating consequences of droughts, which they have experienced many times in the past. The guaranteed annual flow of water from
SAADlConflias between users 7
Lake Nasser is 55.5 kmj. This volume provides about 96% of the total Egyptian demand. The outflow is carefully controlled on a daily basis, according to actual needs. The High Dam is 111 m above the riverbed level. The bed level is 85 m AMSL, while the roadway level is 196 m AMSL. The maximum level of the upstream reservoir reaches 182 m AMSL. The spillway at the west side of the river has been designed to release whatever exceeds this level with a maximum discharge amounting to 2 400 m3 s-'. The water held upstream of the High Dam at its maximum storage level comprises an artifi- cial lake, extending 480 km to the south with an average width of 13 km, and a surface area of about 62 500 km2. This lake is considered to be the second largest human-made lake in the world. It is evident that the storage of floodwater be- hind the dam will lead to the sedimentation of most of the suspended materials held in the lake. However, it was con- sidered while designing the High Dam that the reservoir would be spacious enough to hold large amounts of sediment over many years before the reservoir capacity was affected.
The reservoir storage capacity is 162 km3, distributed as follows: 1 31 km3 is the capacity for sediments deposited over 500
years. It lies between the bed and the 147 m water level. 1 90 km3 is the live storage capacity, which lies between the
147 and 175 m water levels. 1 41 km3 is the flood room (emergency storage) for protec-
tion against high floods. It lies between the 175 and 182 m water levels.
Lake Nasser hydrology
Water levels The water level of the lake changes both between months
and years depending on the rates of inflow and outflow. The highest water levels reached were in November 1996 and December 1997 at 179 m AMSL, and the lowest occurred in 1988 at 151 m AhlSL.
Water velocity The water velocity of the lake decreases as it approaches
the High Dam. The magnitude of the velocity depends on the inflow rates and the lake water level. At the entrance to the lake the flow velocity is about 0.5 m s-' and close to the dam it is about 0.03 m s-'.
Sedimentation After the construction of the High Dam, the sediment
movement changed completely. The average yearly deposi- tion is about 134 million t based on the average yearly inflow
of 84 km3. Based on recent studies, the accumulated sedimentation inside the lake is 2.76 km3. The coarser mate- rial of the sediment is usually deposited at the inflow to the lake in the south and fine material is deposited when the flow velocity is reduced further in the central and northern parts. Since the lake was created, a new submerged delta is being formed within it. However, due to the recent drought, the upper layers of the delta have degraded and moved with the flow towards the dam. The fine sediment can be traced to 200 km below the dam.
Water quality Factors such as climate, watershed characteristics, geol-
ogy, nutrients and thermal stratification have seasonal im- pacts on the quality of lake water. Generally, from samples collected before and after the flood, the lake water has good physical and chemical characteristics for use. The high tem- perature in the region accelerates evaporation and weather- ing processes. In addition, the production of C02 from aquatic plants helps in the transformation of calcite and dolomite into soluble calcium and magnesium bicarbonate. Such bio- logical activity may considerably affect the chemical proper- ties of the water.
Evaporation and other water losses The lake lies in a hot and extremely arid climatic area,
so evaporation represents a significant loss. Evaporation is difficult to measure accurately. The whole lake's annual evapo- ration losses for the period from 1764-1965 to 1770-1991 have been estimated at 9.6 km3 by bulk aerodynamics. During the same period, losses due to seepage were calculated at 0.05 km3. Extensive drilling of boreholes was carried out along cross sections on the Nile within the reservoir area and Darcy's law was applied to these data. Most of the reservoir basin consists of Nubian sandstone that is known to have low per- meability.
Conflicts There are many conflicting factors affecting the users of
the lake and its water quality. Due to the importance of the lake as a strategic water
reservoir for Egypt, the following should be considered and methods of reconciliation developed: I Agricultural development on the lake banks will increase
crop production but will also add low quality drainage water to the lake. I An increase in power generation will require more water
extraction from the lake that may be needed during maxi- mum agricultural demand.
8 Sustainable fish production in Lake Nasser
B An increase in navigation will enhance transportation but will also add a new source of pollution. The fishing industry is important to the national income but must not cause lake pollution. Urbanization and industrialization around the lake will develop the economy of the region but the lake will be the recipient of all the drainage water of such activities resulting in lower water quality.
Development of the Lake Nasser area In 1995, the National Water Research Centre organized a
three-day seminar in Aswan. The seminar was entitled "De- velopment of the lake area-visions and constraints". In this seminar, many papers were presented dealing with the de- sired developments for the lake area including industry, tour- ism, agriculture, mining and fishing. The participants at the seminar recommended the development of the lake area, but with the following considerations. Egypt's share from the Nile water is limited by the agreement of 1959. This share has been used completely for the last five years. Any develop- ment for the lake area would require water and it would affect the water supply for the Nile valley and delta. There is a need for identifying criteria for developing the lake. These should be applied strictly in order to prevent undesired ef- fects such as pollution.
The water resources of Egypt are very limited and the lake area should be kept as a natural-protected area. Future development in the lake area should not adversely affect water quality.
Summary and conclusions Lake Nasser represents the national freshwater bank.of
Egypt. Since the construction of the Aswan High Dam in 1964, Egypt has been able to release water downstream as de- manded. The lake is a relatively closed ecosystem with a water retention time of 20 years. The water quality of the lake is affected by many factors including inflows, water circulation, thermal stratification, loadings and sedimentation. The water resources of Egypt are very limited, therefore any future ac- tivities and perturbations on the lake should be carefully con- sidered before implementation. The area around the lake should be kept as a natural desert.
SAADlConflicts between users 9
Aims of the Lake Nasser Project and First Planning Workshop
J.F. Craig International Center for living Aquatic Resources Management,Africa and West Asia Region, Cairo, Egypt
Craig,J.F. 2000.Aims of the Lake Nasser Project and first planning workshop, p. I 1- 13. In J.F. Craig (ed.) Sustainable fish production in Lake Nasser: ecological basis and management policy. ICLARM Conf. Proc. 6 1 , 184 p.
ABSTRACT
The aim of the Lake Nasser Project is t o integrate social, economic and ecological factors in the formulation of a management policy for sustainable fish production.The workshop was held t o review the present state of knowledge, identify constraints, evaluate existing information and state of the art techniques, and determine future research objectives and strategy.
Introduction The successful management of aquatic resources is de-
pendent on the availability of data on the status of the re- sources, their rate of exploitation, the socioeconomic fxtors affecting the 'harvesters', and external factors such as pollu- tion that impact on the resources. In many countries, particu- larly in this region, the problems of acquiring suitable and sufficient data are compounded by the wide diversity of spe- cies, by the multiplicity of fishing techniques, by the dispersed and often inaccessible landing sites, by decentralized mar- kets, by interaction and often competition among traditional, artisanal and commercial fisheries, and sometimes by politi- cal and/or civil unrest.
Historic fisheries data collected from the Great Lakes in the African Region have been, in many cases, fragmented and analyzed only at the national level despite the resource being shared by more than one riparian state. Perhaps, what has been missed is a unified theme and the establishment of a goal to which data can be harnessed.
Some of the problems outlined above may be overcome by developing a consolidated, holistic approach using data from several sources to model a target lake. The modelling will depend on the exchange of good and reliable informa- tion. The need to develop a unified approach to the manage- ment of fish resources in the African region has been recognized for some time (Annala 1997).
Several parts of Africa are endowed with lakes, both large and small, and natural and artificial. The freshwater fisheries of the continent account for 54% of the total catch or 64% if upwelling fisheries are excluded. The lakes provide food and livelihood for millions of people. Small-scale fishers who tend to be the poorest members of the population take a large proportion of the catch in many of the areas. These fishers often live in remote areas making it difficult to monitor their catch or control their fishing techniques. Rapidly expanding human populations have increased the demand, both locally and for export, for fish production. The demand has not been matched by increased yields from the capture fisheries. The actual catches from many bodies of water are below pre- dicted levels although statistics on which the yields are based are usually highly inaccurate and incomplete. There have been many capture fisheries' research projects carried out in the region that have had specific objectives in ecological, socio- logical and/or economic disciplines. Rarely have these areas of research been integrated to formulate a common manage- ment policy for a shared fishery and, moreover, rarely have ecological considerations been integrated with the social and economic structures in which they are embedded (Fig. 1).
There is an important need to accumulate and share present knowledge concerning specific fisheries and to identify the data that are not available but are required to model the fish- eries. Two phases in the African Lakes' Program are envis- aged. The first phase (Years 1-5) will focus on lakes where
CRAlGlAims of the Lake Nasser Project.. . I I
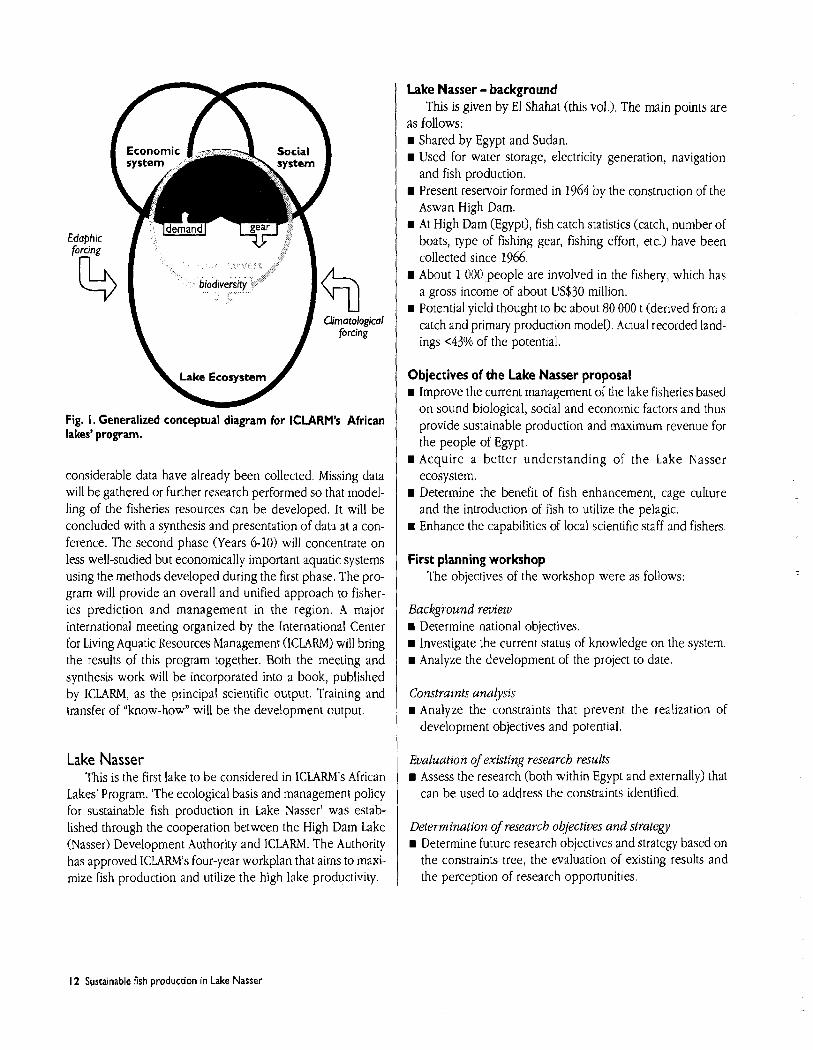
Fig. I. Generalized conceptual diagram for ICLARM's African lakes' program.
considerable data have already been collected. Missing data will be gathered or further research performed so that model- ling of the fisheries resources can be developed. It will be concluded with a synthesis and presentation of data at a con- ference. The second phase (Years 6-10) will concentrate on less well-studied but economically important aquatic systems using the methods developed during the first phase. The pro- gram will provide an overall and unified approach to fisher- ies prediction and management in the region A major international meeting organized by the International Center for Living Aquatic Resources Management (ICLARM) will bring the results of this program together. Both the meeting and synthesis work will be incorporated into a book, published by ICLARh4, as the principal scientific output. Training and transfer of "know-how" will be the development output.
Lake Nasser This is the first lake to be considered in ICLARM's African
Lakes' Program. 'The ecological basis and management policy for sustainable fish production in Lake Nasser' was estab- lished through the cooperation between the High Dam Lake (Nasser) Development Authority and ICLARM. The Authority has approved ICLARM's four-year workplan that aims to maxi- mize fish production and utilize the high lake productivity.
Lake Nasser - background T h is given by El Shahat ( h s vol.). The main points are
as follows: r Shared by Egypt and Sudan. r Used for water storage, electricity generation, navigation
and fish production. r Present reservoir formed in 1964 by the construction of the
Aswan High Dam. r At High Dam (Egypt), fish catch statistics (catch, number of
boats, type of fishing gear, fishing effort, etc.) have been collected since 1966.
I About 1 000 people are involved in the fishery, which has a gross income of about US$30 million.
r Potential yield thought to be about 80 000 t (derived from a catch and primary production model). Actual recorded land- ings <43% of the potential.
Objectives of the Lake Nasser proposal r Improve the current management of the lake fisheries based
on sound biological, social and economic factors and thus provide sustainable production and maximum revenue for the people of Egypt.
r Acquire a better understanding of the Lake Nasser ecosystem. Determine the benefit of fish enhancement, cage culture and the introduction of fish to utilize the pelagic. Enhance the capabilities of local scientific staff and fishers.
First planning workshop The objectives of the workshop were as follows:
Background review r Determine national objectives. r Investigate the current status of knowledge on the system. r Analyze the development of the project to date.
Constraints analysis r Analyze the constraints that prevent the realization of
development objectives and potential.
Evaluation of existing research results r Assess the research (both within Egypt and externally) that
can be used to address the constraints identified.
Determination of research objectives and stralegy r Determine future research objectives and strategy based on
the constraints tree, the evaluation of existing results and the perception of research opportunities.
I 2 Sustainable fish production in Lake Nasser
Identification of research subprojects B Specify subproject details including their objectives, major
activities, location and the human resources required.
Priority setting B Identify the criteria and methods to be used.
Apply the above to define a priority set of subprojects.
Acknowledgements I am grateful to Tony Pitcher for providing Fig. 1, drawn
from an idea we developed during my visit to the Fisheries Centre, University of British Columbia, Canada, in 1997.
Reference Annala, J.H., Editor. 1997. Fisheries and aquaculture research
planning needs for Africa and West Asia. ICLARM Conf. Proc. 50, 80 p.
CRAlGlAims of the Lake Nasser Project ... 13
The Use of Ecosystem Modelling in Comparative Policy Analysis: Maximizing Sustainable Benefits from Lake Nasser's Aquatic Resources
TJ. Pitcher University of British Columbia,Vancouver, Canada
Pitcher,T.J. 2000.The use of ecosystem modelling in comparative policy analysis: maximizing sustainable benefits from Lake Nasserf aquatic resources, p. 15-22.Inj.F. Craig (ed.) Sustainable fish production in Lake Nasser: ecological basis and management policy. ICLARM Conf. Proc. 6 I, 184 p.
ABSTRACT
Single-species approaches to fishery assessment are not sufficient t o avoid the changes to ecosystems caused by fishing.These changes include the replacement of high trophic level, generally high-value species, by low trophic level and lower-value species. Commercial fisheries' practices and ecosystem effects interact produc- ing serious depletion that i s usually detected too late to avert, and may result in fishery collapses and the failure of stocks t o rebuild. Multispecies management is required. Multispecies virtual population analysis (MSVPA) is one technique that can be used to assess species of fish for which good catch and diet data are available, but whole ecosystem modelling is required to evaluate the impacts of fishing on nonharvested groups. Ecosystems and their embedded fisheries can now be effectively modelled using the mass balance system of ECOPATH,which is briefly introduced. A new development, ECOSIM,allows simulation of"what if" questions that can be used to explore changes by the fishery sector. Beyond the limits of numerical simulation, ECOVAL comprises a new set of techniques for the comparative evaluation of alternative ecosystems. Eco- system models of current, unexploited and alternative ecosystems are drawn up and their benefits to society assessed. In natural aquatic ecosystems, the state of ecosystems in the past provides the alternatives: a pro- cess termed BACKTOTHE FUTURE. In human-made systems,a wide range of possible ecosystems,including present and unfished systems, may be compared. Benefits evaluated include total catch, economic value and diversity of fishery products, employment, biodiversity and sectoral conflict. Using ECOVAL, the ecosystem and associated fisheries that maximize total benefit to society may be adopted as a policy goal, taking into account the costs of shifting from the present system.
Introduction Fisheries management has a history of unpleasant sur-
prises that has dismayed the founders of this quantitative sci- ence (e.g., Larkin 1996; Beverton 1998; Holt 1998) and has led some prominent fishery scientists to consider that no fish- ery has ever been managed in sustainable fashion (Ludwig et al. 1993). For example, the unexpected collapse of the New- foundland cod caused economic and social hardship on a vast scale. At one time vaunted by the Canadian government as the "best managed fishery in the world" (Finlayson 1994), the cod were historically one of the most prolific fish stocks anywhere on the planet (Kurlanski 1997). Environmental and predator changes have been ruled out as a cause of the col- lapse (e.g., Myers and Cadigan 1995), and serious mistakes
have been identified in stock assessment (e.g., nonexplicit and unachievable policy goals and instruments: Matthews 1995; failure to use spatial data: Hutclngs 1996; and errors in bio- mass estimation: Walters and Maguire 1996). There is also a suspicion that political goals compromised scientific rnanage- ment of the cod (Hutchgs et al. 1997). Even today, the New- foundland cod resource has not begun to recover despite five years of closure, suggesting that all of these analyses have missed the vital factor of ecosystem change. Moreover, the lessons have not been fully learned by fishery managers, as we find that now North Sea cod stocks are also in danger of collapse (Cook et al. 1997).
Unlike rocket science, where a disaster can usually be traced by diligent engineers to faulty O-rings or other
PlTCHERlThe use of ecosystem modelling ... 15
defective hardware or software, fisheries are embedded in aquatic ecosystems that are very imperfectly understood. One contributory reason underlying fishery disasters like this is that management has generally not been designed to adapt and learn in the face of errors in data, uncertain assessment and ineffective control instruments, despite the long avail- ability of sophisticated quantitative methods for adaptive man- agement (reviewed by Walters 1986; Punt and Hilborn 1997; Bundy 1998; Hilborn and Liermann 1998). Moreover, the gen- eration of excess catching power (= overcapacity) has been identified as a major worldwide bioeconomic problem that is out of control and which no one can yet see how to arrest (Mace 1997).
There is, however, a second and more fundamental rea- son for fishery collapses, that unfortunately presages future disasters occurring at an increasing rate. This is the long-term effect of fishing on the species composition of aquatic eco- systems. The ecological processes leadmg to these changes in ecology seem to be ratchet-hke, difficult to reverse and, as yet, imperfectly understood (Pitcher, in press: a). Some recent evidence supports this conjecture: there has been a progressive deche in the trophic level of fish caught in all areas of the world, lncludlng freshwaters (Pauly et al. 1998a), as fishers maintain their income by switching to species lower down the food web when higher trophc level fish become depleted. A consequence 1s that "trash fish have come to replace high-value table fish, a process that has reached disaster levels in the South Chna Sea, the Gulf of Thailand and the Black Sea, and is proceeding unchecked almost ev- erywhere else (Pauly et al. 199813). Moreover, changes in cephalopod fisheries independently support the nokon of such a worldwide shft in the nature of exploited marine ecosystems (Caddy and Rodhousel998).
Avoiding these profound changes in aquatic ecosystems wrought by fisheries requires no less than a paradigm shift in fisheries management (Pitcher and Pauly 1998). Single- species fish stock assessment, although necessary for com- puting the details of age structure and population biomass, is simply incapable of providing the information to remedy or reverse this process (Pitcher, in press: a). What is needed is an evaluation of the impacts of fishing on aquatic ecosys- tems, and the adoption of policy goals that aim to maximize profits or total benefits to society, by comparing the fisher- ies in alternative exploited ecosystems (Pitcher 1998b). This agenda requires multispecies, ecosystem-based stock assess- ment models, and is an essential requirement for evaluating and maximizing the benefits from fisheries in the African lakes (Pitcher 1997).
Approaches to multispecies assessment Although multispecies methods for assessing the exploi-
tation status of fisheries have long been recognized as being critically needed (e.g., Larkin et al. 1984), there are no meth- ods yet generally accepted by the fisheries research commu- nity. Sissenwine and Daan (1991) comprehensively reviewed multispecies methods that showed promise at that time, but recent developments in ecosystem modelling have superseded their conclusions. Two approaches to multispecies assess- ment that might be used in Lake Nasser are briefly introduced here: MSVPA and mass-balance ecosystem modelling.
Multispecies virtual population analysis (MSVPA) Single-species virtual population analysis (VPA) estimates
the population numbers (and hence biomass) that must have existed in each age group from the recorded catch and an assumed fishing rate (actually the instantaneous fishing mor- tality, F). Each cohort is progressively estimated, stepping backwards in time from the present age structure, and VPA methods are sometimes termed cohort analysis (see descrip- tion of classic method in Pitcher and Hart 1982). Clever ways have been devised to tune the estimation to converge on the correct fishing rate and to adjust the results to known b~om- ass surveys. Recently, more sophisticated "catch-at-age meth- ods" have greatly extended the scope and power of the classic WA (e.g., CAGEAN: Deriso et al. 1985; stock synthesis: Methot 1990,1995). For example, Parma (1993) used CAGEAN meth- ods in a retrospective analysis of the Pacific halibut fishery from 1944 to 1990, finding that quotas should be adjusted downwards because halibut biomass had been consistently overestimated in each individual year's analysis. Length-based versions of VPA are also widely used (Pauly 1983; Jones 1984). A weak point of most of these methods is that natural mortal- ity has to be known quite accurately for the method to work well and, in fact, it is usually guessed.
MSVPA uses a similar catch-at-age technique to VPA, ex- cept that part of the natural mortality is explicitly modelled as the predation by each predator on each age group of prey. As the numbers of each age group of predatory species are estimated, their impact on prey species ripples through the analysis, age-class by age-class (a little used length-based version is termed phalanx analysis, Pope 1980). MSWA works best where there are many species of commercial fish that eat other commercial fish, as in the North Sea gadoid commu- nlty. MSVPA requires a large amount of historical catch data and biomass estimates, in addition to stomach samples that may be used to estimate the predation rate of each age-class of each predator species upon all others (Christensen 1994). MSVPA is reviewed by Magnusson (1995).
MSVPA techniques are helpful in estimating the biomass and harvestable quotas of commercial fish, but they are
16 Sustainable fish production in Lake Nasser
on unexploited groups, such as lower trophic groups, or unexploited top-carnivore animals that feed upon commer- cial fish, like billfish, seals, whales, aquatic reptiles and sea birds. MSVPA might be used for top carnivores in Lake Nasser's fisheries once sufficient data of age structure of the catches have been accumulated.
not capable of addressing the dynamics or impacts of fishing
Multispecies fisheries and ecosystem modelling In the past, most forms of ecosystem modelling have gen-
erally been of theoretical interest rather than practical rel- evance. Most are complex, involve many hundreds of parameters, do not encompass the whole ecosystem, and do not usually describe the fishery in sufficient detail, for ex- ample by gear sector, to be used directly in management. Some examples are: Ulltang (1995) on the Barent Sea, Andersen and Ursin (1977) and Ursin (1979) on the North Sea, Laevastu and Larkins (1981) and Low (1983) on the North Pacific.
In these models, usually only part of the ecosystem is included, and physical oceanographic or limnological pro- cesses that are not necessary for understanding the fishery are often confused with the essential biological features. In general, there seems to have been little advance on Larkin and Gazzy's (1982) pioneering attempt to model fish commu- nities by multiple predator prey models. Published models tend to be highly site-specific and so are difficult to adapt to new sites and, moreover, at best, they can often describe, but are not robust enough to make predictions or understand ecosystem processes.
provide full details of the method, but the basic ECOPATH
I
Ecosystem modelling based on ECOPATH
ECOPATH mass-balance and the Law of Maat In recent years, a series of developments in ecosystem
models based on the simplifying assumption of mass-balance have improved the situation described above. ECOPATH is a practical trophic mass-balance model developed by ICLARM (Christensen and Pauly 1992, 1993) based on original work by Polovina at the National Marine Fisheries Service in Ha- waii (e.g., Polovina 1984). Recent extensions to this technique have been led by the Fisheries Centre at the University of British Columbia, and comprise ECOSIM (Walters et al. 1997), a dynamic simulation technique. and ECOSPACE, a spatial ecosystem modelling tool. These developments are described below.
ECOPATH tallies the flows of matter within the major com- ponents of the system, defines the trophic level of each com- ponent and can be used to estimate biomass (B) given information on diet, mortality (production, P, to B ratio, which equals the total mortality rate, z) and consumption rates (consumption, Q, to B ratio). It is not the intention here to
approach is to solve a set of simultaneous linear equations, one for each group, i , in the system:
[Production of il - [all predation on i] - lnonpredation losses of il - [export of i] = 0
This may be expressed more explicitly as: [(Bi(P/B)i* EEi - CKBj (Q/B)j+ DC,,) - EX, ac] = 0
where,
C = summation for j = 1 to n, predator trophic groups; B, = mean biomass of group i; Bi = mean biomass of predator j; (PIB), = production/biomass, or total mortality rate of group
i (equilibrium); EE, = ecotrophic efficiency, the fraction of the production
of i that is either consumed within the system or exported out of the system;
(Q/B)i= food consumption/biomass of the predator j; DCji = fraction of i in the diet of predator j; EX, = exports (catches + emigration) of group i; and ac = accumulated biomass.
An equation like this is drawn up for each component of the system, and the set of simultaneous equations solved us- ing standard algorithms (Mackay 1981). Nonpredation losses include disease, the metabolic costs of assimilation and respi- ration. The model uses four parameters for each group (deri- vation of the model equations from the general principle set out above may be found in Christensen and Pauly (1992, 1993) and in the "help" files associated with the ECOPATH software package): the production to biomass ratio, P/B; the consumption to biomass ratio, QIB; the biomass, B, expressed in t km-2; and the ecotrophic efficiency, EE, expressing the amount of a group that is utilized within the system. In addi- tion, any exports from each group have to be estimated, and the proportion of each group's diet represented by other groups in the ecosystem. Three of these four parameters are required as input, and the remaining one is estimated for each group. As there are short cuts to the estimation of both P/B and QIB ratios, and EE can be "guesstimated" for most types of organisms; drawing up a preliminary ecosystem model is not so hard as might be imagined, especially where there are considerable background data.
What groups should be included in the ECOPATH model? For a freshwater body like Lake Nasser, the minimum system might be: fish-eating birds, fish-eating reptiles like crocodiles, top predator fish such as Nile perch, medium predatory fish such as tiger fish, benthic fish such as catfish, small pelagic
PITCHERIThe use of ecosystem modelling.. . 17
lapias, macrobenthos, meiobenthos, carnivorous zooplank- ton, herbivorous zooplankton, benthic producers such as algae, macrophtyes, phytoplankton and both organic and inorganic detritus pools. More groups, up to ECOPATH1s maximum of 50, may be added to these 16 as information becomes avail- able. The model will become more useful for fishery assess- ment as group composition becomes closer to the actual species targets of the fishery. Bacteria present a technical prob- lem in ECOPATH modelling as their flows are so large that their errors may swamp other data. They are often consid- ered a separate adjacent ecosystem for this reason. Fisheries for any of the model groups may be included, entered as annual catch per square kilometer. Up to six different gear types and target species can be included in the current soft- ware (version 4.0), and there is scope to enter bycatch.
Although quite extensive computationally so that purpose- written software is essential, ECOPATH models are conceptu- ally simple, being little more than accounting sheets for diet, biomass and the import and export of matter (or energy) among predators, prey, grazers and plants. The models are credible because, by using the principle of mass-balance, ECOPA'I'H models are grounded in physics: the first law of thermodynamics (the conservation of energy and matter) is obeyed. The principle of mass-balance in ecosystem model- ling may remind Egyptians of the ancient pharaonic Law of Maat, which appears to have meant truth, order and harmony. Maat encouraged all elements of government and administra- tion to be in harmony and balance with human endeavor and with the natural world, especially with the life-giving River Nile.
Many ecologists worry about the mass-balance assump- tion, but it is not as constraining as it may appear at first sight. It is consistent with the work of most aquatic biologists, whose state and rate estimates represent averages applied to a cer- tain period (although this generally is not stated). Here state and rate estimates are applied during an arbitrary period. In many cases, the period considered will be a typical season or a typical year, but the state and rate estimates used for model construction may refer to different years. For example, ECOPATH models may represent a decade or more, during which little change has occurred. When ecosystems have undergone large changes, two or more models may be needed, representing the ecosystem before, during and after the changes.
The mass balance assumption also has the advantage that model systems can be built without requiring vast amounts of accurate data: many variables can be estimated from inputs and outputs by solving the set of simultaneous linear equa- tions. They are robust in that even preliminary, incomplete models are still helpful and useable and may be improved
when more accurate data become available. They are quite easy to explain to nonscientists, and relatively easy to build and validate by junior and student scientists using the soft- ware.
Ecologists have also worried that uncertainty was not con- sidered in earlier versions of ECOPATH. The ECORANGER module in the most recent releases of the ECOPATH software now remedies this by allowing input of error distributions (uniform, triangular, normal or log-normal) to be attached to all the model inputs. Random values are drawn from these distributions in a Monte Carlo fashion for one model run, and the process repeated up to 1 000 times. Of the models that pass a selection criteria (such as mass-balance), the best-fit- ting one is chosen using a least square criterion, and its error bounds evaluated from the runs completed. This process in- volving prior and posterior distributions is analogous to the Bayesian estimation.
In addition to its use in evaluating fisheries, the ICLARM software guide to ECOPATH states that such modelling has a number of heuristic advantages: I requiring the modeller to review and standardize all avail-
able data on a given ecosystem, and identify information gaps;
I requiring the modeller to identify estimates (of states or rates) that are mutually incompatible, and which would prevent the system from running (e.g., prey productions that are lower than assumed food requirements of preda- tors);
I requiring the modeller to interact with disciplines other than their own (e.g., in order to describe a lake ecosystem, a plankton specialist will have to cooperate with fish biolo- gists and other colleagues working on the various consumer groups in that lake).
In addition, the ECOPATH files for a model can act as a consolidated database, accessible to all, that stores all refer- ences and notes about the sources and methods of estimating values.
Simulation of changes in ecosystems-ECOSIM The need for a simulation version of the static ECOPATH
mass-balance model of an ecosystem has long been recog- nized ECOSIM is based upon a simple idea, the substitution of rate of change of biomass for the mass-balance equation of ECOPA'rH, but the resulting simultaneous differential equa- tions are both conceptually and computationally challenging. Walters et al. (1997) have provided a practical solution and their paper lists a range of examples of successful validation of the technique. ECOSIM modelling is based on an ecosys- tem that is already described by the ECOPATH model, and has proved capable of reproducing changes that have been
18 Sustainable fish production in Lake Nasser
IAN R. SMITH MEMORIAL LIBRARY & 00C~MENIATlON CENTER, ICURM
observed in a number of ecosystems, such as the North Sea and Lake Victoria. The first published examples of the use of ECOSIM are an investigation of the influence of small pelagic fish and their fisheries on ecosystems by Mackinson et al. (1997), and an exploration of the stability of exploited eco- systems by Vasconcellos et al. (in press).
ECOSIM is capable of evaluating the impact of changes in fishing rates on the ecosystem for each of the modelled fish- eries, selectively across gear types or sectors of the fishing industry. "What if?" questions may be answered. One of the first examples of the use of ECOSIM at a specific location in this respect has been in evaluating alternative policy options for the Hong Kong fisheries (Pitcher et al. 1998), but this material has yet to be formally published. ECOSIM was used to predict the impact of six scenarios representing changes in the management of six gear type sectors on the relative abun- dance of eight groups of species. For example, halving the current fishing mortality from trawls provided considerable benefits for all fishery sectors, and for those elements of the ecosystem which needed to be conserved, such as marine mammals. The model suggested that the full benefits of such a policy may, however, take a decade to be realized. Further work In progress on the Hong Kong fisheries is evaluating benefits to the resource of artificial reefs that might be estab- lished in areas closed to fishing.
Clearly, ECOSIM has great potential to be used in fisher- ies management in this way, although it is premature and risky to place great reliance on exact results. Management plans have to be devised in such a way as to learn from the monitoring of changes that result from new policies, and to be flexible enough to adapt to unexpected outcomes.
Simulation of spatial dynamics of ecosystems -ECOSPACE
Another recent development, ECOSPACE, introduces the facility to spatially model ecosystems that have been summa- rized by ECOPATH (Walters et al., in press). This will be es- pecially useful in the evaluation of the benefits of closed areas. The model enables the layout, on a 50 by 50 grid, of a rough map of the coastline and islands, areas of higher productivity, the habitat preferences of each ECOPATH group of fish, and the shape and size of no-take areas closed to fishing. It in- cludes the movement characteristic of each ECOPATH group of fish and the bioeconomic spatial behavior of the fishers who, in the model, always move to maximize the profit from their catch. The ECOSPACE technique is so new that there are as yet no published examples.
Policy evaluation by comparison of constructed alter- native ecosystems-ECOVAL
In the ECOVAL approach, scientific tools are used to con- struct and evaluate present and alternative ecosystems. The policy objective for management becomes the building of the ecosystem that would, if achieved, maximize economic ben- efit to society. The approach is fundamentally different from a policy goal of sustainability, which may seek only to sustain present misery (Pitcher and Pauly 1998).
Comparisons among alternative ecosystems cannot be performed using ECOSIM alone, because it is difficult to trans- form one ecosystem into another using this simulation-mod- elling tool. This is not a defect of the ECOSIM tool, which can simulate changes credibly up to limits defined by changes in target species biomass no greater than about 50%, but an unavoidable consequence of the inherent uncertainty in ecol- ogy. It is virtually impossible to model major changes in ecol- ogy, species composition and trophic structure. For example, species either vacate (those going extinct) or exploit (those being introduced to a system) trophic niches. Ecologists can- not predict what will happen to this niche or what the im- pacts will be on other components of the ecosystem. In addition, many species alter the physical structure of the habi- tats in an ecosystem by providing refuge for juveniles, breed- ing sites, or surfaces that may be colonized by primary producers, sessile detritus feeders and their invertebrate graz- ers.
Although direct simulation modelling is likely to remain unfeasible for the foreseeable future, for the First time, the ECOPATH approach has made it credible to use other infor- mation to construct models of alternative ecosystems. The first steps are to draw up probable species compositions and their predation matrices. Introduced species or species that become extinct are easy in this respect. For example, data can be used from similar systems that may exist elsewhere, or may have existed in the recent past. In the last resort, infor- mation on diet and metabolic parameters may be borrowed from other models. By 1998, over 150 ECOPATH models had been published (see for example contributions in Christensen and Pauly 1993), and parameters for the same or sibling spe- cies can be used as a first approximation. Approximate biom- ass estimates based on other systems may be given as trial input to the ECOPATH model, which can then be used to adjust the values to be compatible with the newly constructed trophic web. The ability to run checks on the internal consis- tency of the model, such as respiration rates, is valuable here.
An analogous approach that can be applied to natural ecosystems is termed BACK TO THE FUTURE (BTF), where ecosystems that existed in the past are reconstructed using historical documents, archaeology and traditional or local environmental knowledge (TEK and LEK) (Pitcher 1998a, b,
PlTCHERlThe use of ecosystem modelling.. . 19
c). For a human-made system like Lake Nasser, BTF is clearly not appropriate, but the essential features of the procedure are very similar.
In summary, the ECOVAL method for fisheries manage- ment using alternative ecosystem evaluation comprises seven elements: B ECOPATH model construction of present and alternative
ecosystems; ECOSIM exploration of the limits to fishing, sector by sector, for each alternate;
a evaluation of economic and social benefits for each system; choice of policy goal as the ecosystem that maximizes benefits to society;
a design of instruments to achieve this policy goal; evaluation of costs of these management measures; and
a adaptive implementation and monitoring of management measures.
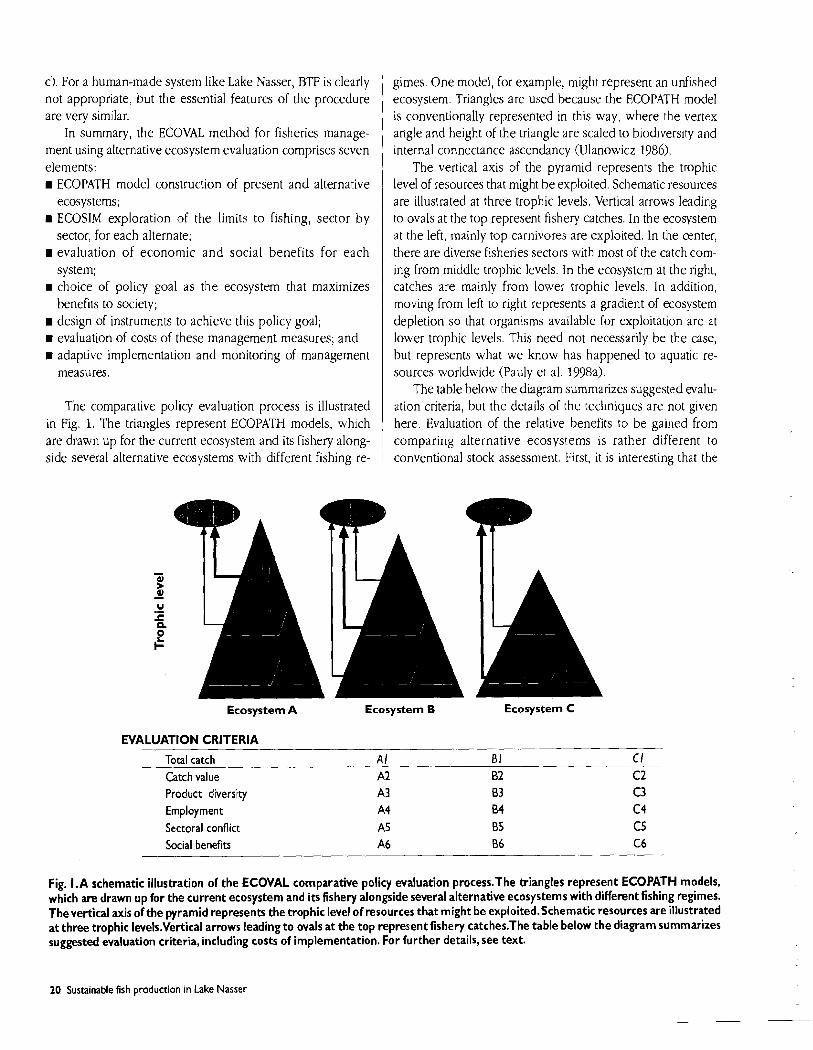
The comparative policy evaluation process is illustrated in Fig. 1. The triangles represent ECOPATH models, which are drawn up for the current ecosystem and its fishery along- side several alternative ecosystems with different fishing re-
gimes. One model, for example, might represent an unfished ecosystem. Triangles are used because the ECOPATH model is conventionally represented in this way, where the vertex angle and height of the triangle are scaled to biodiversity and internal connectance ascendancy (Ulanowicz 1986).
The vertical axis of the pyramid represents the trophic level of resources that might be exploited. Schematic resources are illustrated at three trophic levels. Vertical arrows leading to ovals at the top represent fishery catches. In the ecosystem at the left, mainly top carnivores are exploited. In the center, there are diverse fisheries sectors with most of the catch corn- ing from middle trophic levels. In the ecosystem at the right, catches are mainly from lower trophic levels. In addition, moving from left to right represents a gradient of ecosystem depletion so that organisms available for exploitation are at lower trophic levels. This need not necessarily be the case, but represents what we know has happened to aquatic re- sources worldwide (Pauly et al. 1998a).
The table below the diagram summarizes suggested evalu- ation criteria, but the details of the techniques are not given here. Evaluation of the relative benefits to be gained from comparing alternative ecosystems is rather different to conventional stock assessment. First, it is interesting that the
Ecosystem A Ecosystem B Ecosystem C
EVALUATION CRITERIA
Total catch A1 B I C I Catch value A2 B2 C2 Product diversity A3 B3 C3 Employment A4 B4 C4 Sectoral conflict A5 B5 C5 Social benefits A6 66 C6
Fig. 1.A schematic illustration of the ECOVAL comparative policy evaluation process.The triangles represent ECOPATH models, which are drawn up for the current ecosystem and its fishery alongside several alternative ecosystems with different fishing regimes. Thevertical axis of the pyramid represents the trophic level of resources that might be exploited.Schematic resources are illustrated at three trophic levels.Vertical arrows leading to ovals at the top represent fishery catches.The table below the diagram summarizes suggested evaluation criteria, including costs of implementation. For further details, see text.
20 Sustainable fish production in Lake Nasser
potential yield estimation procedure using an ecosystem model automatically provides sustainable yields, since anything greater will alter the nature of the ecosystem as detected by the ECOSIM modelling. Second, in addition to estimating the total catch and catch value, values may be put upon the di- versity of the fishery products, the amount of employment and secondary social and economic benefits of the fishery to local communities. Evaluation may also encompass conser- vation values such as biodiversity, the preservation of endan- gered species, and benefits and costs for multiple users of the aquatic resource. The procedure has social benefits too. Work- shops held to help build models of alternative systems can act as a neutral forum where opposing sectors meet and share knowledge in the interest of long-term conservation. Com- paring species levels predicted by the model provides talking points. Focusing on the alternatives highlights what could be achieved, as opposed to fighting over present scarcity. Moreover, when such policy goals are identified, an ecosys- tem-based agendum means that, during rebuilding, the pub- lic can act as sentinels of progress, and many diverse groups, including industry, local people, schools and colleges can have roles in providing data (Pitcher, in press: b). A sense of ownership of the process and goals fosters cooperation and reduces conflict.
Ecosystem modelling, such as that introduced in this work- shop, has to be an integral part of the methodology required for this new comparative ecosystem evaluation approach. Mass-balance ECOPATH and ECOSIM modelling has advan- rages in making clear the impacts of harvest, comparing the effects of alternative gear types, and in being able to provide estimates of unknown biomasses. A disadvantage is that in its present state of development, ecosystem modelling is not it- self able to provide single species quotas because, generally, many species have to be combined into one 'box' in the model. Conventional stock assessment methods will continue to be needed, but biomass values for single species will have to be constrained by the results of the ecosystem model. A way of merging current sophisticated single-species stock assessment methods with ecosystem modelling of the impacts of harvest needs to become an active research area.
References Andersen, K.P. and E. Ursin. 1977. A multispecies extension to the
Beverton and Holt theory of fishing, with accounts of phospho- rus circulation and primary production. Meddr. Danm. Fiskeriog. Havunders. N.S. 7319-435.
Beverton, R.J.H. 1998. Fish, fact and fantasy: a long view. Rev. Fish Biol. Fish. 8(3)229-250.
Bundy, A. 1998. The red light and adaptive management, p. 361- 368.1nT.J. Pitcher, P.J.B. IIart and D. Pauly (eds.) Reinventing fisheries management. Chapman and Hall, London.
Caddy, J.F. and P Rodhouse. 1998. Cephalopod and groundfish landings: evidence for ecological change in global fisheries? Rev. ~ i s h Biol. Fish. 8:l-14.
Christensen, V. 1994. A model of trophic interactions in the North Sea in 1981, the year of the stomach. Dana 11:l-28.
Christensen, V. and D. Pauly. 1992. ECOPATH 11-a system for bal- ancing steady-state ecosystem models and calculating network characteristics Ecol. Modelling 61 : 169-185.
Christensen, V. and D. Pauly, Editors. 1993. Trophic models of aquatic ecosystems. ICLARM Conf. Proc. 26, 390 p.
Cook, R.M., A. Sinclair and G. Stefansson. 1997. Potential collapse of North Sea cod stocks. Nature (Lond.) 385:521-522
Deriso, R.B., T.J. Quinn and P.R. Neal. 1985. Catch age analysis with auxiliary information. Can. J . Fish. Aquat. Sci. 42915-824
FInlayson, A.C. 1994. Fishing for truth. Institute of Social and Eco- nomic Research. Memorial University, Newfoundland. 176 p.
Hilborn, R. and M. Liermann. 1998. Standing on the shoulders of giants: learning from experience in fisheries. Rev. Fish Biol. Fish. 8(3):273-283.
Holt, S. J.1998. Fifty years on. Rev. Fish Biol. Fish. 8(3):357-366. Hutchings, J.A. 1996. Spatial and temporal variation in the density
of northern cod and a review of hypotheses for the stock's collapse. Can. J. Fish. Aquat. Sci. 53:943-962.
Hutchings, J.A., C. Walters and R.L. Haedrich. 1997. Is scientific inquiry incompatible with government information control? Can. J. Fish. Aquat. Sci. 54:1198-1210.
Jones, R. 1984. Assessing the effects of changes in exploitation pattern using length composition data (with notes on VPA and cohort analysis). FA0 Fish. Tech. Pap. 256, 118 p.
Kurlanski, M. 1997. Cod: a biography of the fish that changed the world. Knopf. Toronto. 294 p.
Laevastu, T. and H.A. Larkins . 1981. Marine fisheries ecosystem. Its quantitative evaluation and management. Fishing News Books. Woking. 176 p.
Larkin, P.A. 1996. Concepts and issues in marine ecosystem man- agement. Rev. Fish Biol. Fish. 6:139-164.
Larkin, P.A. and W. Gazey. 1982. Applications of ecological simula- tion models to management of tropical multispecies fisheries, p. 123-140. In D. Pauly and G.I. Murphy (eds.) Theory and management of tropical fisheries. ICLARM Conf. Proc. 9, 360 p.
Larkin, P.A., C.W. Clark, N. Daan, S. Dutt, V. Hongskul, S.A. Levin, G.G. Newman and D.M. Pauly. 1984. Strategies for multispecies management, p. 287-301. In R.M. May (ed.) Exploitation of ma- rine communities. Dalhem Workshop 32. Springer Verlag, Frank- furt.
Low, L.L. 1983. Application of a Laevastu-Larkins ecosystem model for Bering Sea groundfish management, p. 1161-1175. In G.D Sharp and J. Csirke (eds.) Expert Consultation to Examine Changes in Abundance and Species Composition of Neritic Fish Resources. F A 0 FIRM/R 291(3).
Ludwig, D., R. Hilborn and C.J. Waiters. 1993. Uncertainty, resource exploitation, and conservation: lessons from history. Science 260: 17-18
Mace, P.M. 1997. Developing and sustaining world fisheries re- sources: the state of science and management, p. 1-20. In D..4. Hancock, D.C. Smith, A. Grant and J.P. Beumer (eds.) Devel- oping and sustaining world fisheries resources: the state of science and management. CSIRO, Collingwood.
Mackay, A. 1981. The generalized inverse Pract. Comput. (Septem- ber). 108-1 10.
PITCHERIThe use of ecosystem modelling.. . 2 1
Mackinson, S., M. Vasconcellos, T.J. Pitcher, C.J. Walters and K. Sloman. 1997. Ecosystem impacts of harvesting small pelagic fish using a dynamic mass-balance model, p. 731-750. In For- age fishes in marine ecosystems. Alaska Sea Grant Symposium.
Magnusson, K.G. 1995. An overview of the multispecies VPA: theory and applications. Rev. Fish Biol. Fish. 5:195-212.
Matthews, D.R. 1995. Commons versus open access: the collapse of Canada's East Coast fishery. Ecologist 25:86-104.
Methot, R.D. 1990. Synthesis model: an adaptable framework for analysis of diverse stock assessment data, p. 259-277. In L.L. Low (ed.) The application of stock assessment techniques to gadids. International North Pacific Fisheries Commission, Vancouver.
Methot, R.D. 1995. Estimates of growth and abundance from simu- lated size composition data using the stock synthesis model. Collect. Vol. Sci. Pap. ICCAT 44:76-83.
Myers, R.A. and N.G. Cadigan. 1995. Was an increase in natural mortality responsible for the collapse of northern cocP Can. J. Fish. Aquat. Sci. 52:1274-1285.
Parma, A.M. 1993. Retrospective catch-at-age analysis of Pacific halibut: implications on assessment of harvesting policies, p. 247-265. In G. K N S ~ , D.M. Eggers, RJ. Marasco, C. Pautzke and T.J. Quinn (eds.) Management strategies for exploited fish populations, Fairbanks, Alaska. Alaska Sea Grant College Pro- gram 93-02.
Pauly, D. 1983. Length-converted catch curves: a powerful tool for fisheries research in the tropics. Part 1. Fishbyte 1:9-13.
Pauly, D., V. Christensen, J. Dalsgaard, R. Froese and F. Torres, Jr. 1998a. Fishing down marine food webs. Science 279360-863.
Pauly, D., P.J.B. Hart and T.J. Pitcher. 1998b. Speaking for them- selves: new acts, new actors and a new deal in a reinvented fisheries management, p. 409-415. In T.J. Pitcher, P.J.B. Hart and D. Pauly (eds.) Reinventing fisheries management. Chapman and Hall, London.
Pitcher, T.J. 1997. The fisheries resources of African lakes, p. 49-51. In J.H. Annala (ed.) Fisheries and aquaculture research plan- ning needs for Africa and West Asia, ICLARM Conf. Proc. 50, 80 p.
Pitcher, T.J. Rebuilding as a new goal for fisheries management: reconstructing the past to salvage the future. Ecol. Appl. (In press: a).
Pitcher, T.J. Fisheries management that aims to rebuild resources can help resolve disputes, reinvigorate fisheries science and encourage public support. Fish Fish. l(1). (In press: b).
Pitcher, T.J. 1998a. "Back to the future": a novel methodology and policy goal in fisheries, p 4-7. In D. Pauly, T.J. Pitcher and D. Preikshot (eds.) Back to the future: reconstructing the Strait of Georgia ecosystem. Fish. Cent. Res. Rep. Univ. B.C. 6(5).
Pitcher, T.J. 1998b. Ecosystem simulation models and the new "Back to the future" approach to fisheries management, p. 21-23. In D. Pauly (ed.) The use of ECOPATH with ECOSIM to evaluate strategies for sustainable exploitation of multispecies resources. Fish. Cent. Res. Rep. Univ. B.C. 6(2).
Pitcher, T.J. 1998c. Pleistocene pastures: Steller's sea cow and sea otters in the Strait of Georgia, p.49-52. In D. Pauly, T.J. Pitcher and D. Preikshot (eds.) Back to the future: reconstructing the Strait of Georgia ecosystem. Fish. Cent. Res. Rep. Univ. B.C. 6(5).
Pitcher, T.J. and D. Pauly. 1998. Rebuilding ecosystems, not sustainability, as the proper goal of fishery management, p. 311-329. In T.J. Pitcher, PIJ.B. Hart and D. Pauly (eds.) Rein- venting fisheries management. Chapman and Hall, London.
Pitcher, TJ. and P.J.B. Hart. 1982. Fisheries ecology. Chapman and Hall, London. 414 p.
Pitcher, T.J., R. Watson, A.M. Courtney and D. Pauly. 1998. Assess- ment of Hong Kong's inshore fishery resources. Fish. Cent. Res. Rep. Univ. B.C. 6(3): 168 p.
Polovina, J.J. 1984. Model of a coral reef ecosystem. Part I: the ECOPATH model and its application to French Frigate Shoal. Coral Reefs 3:l-11.
Pope, J.G. 1980. Phalanx analysis: an extension of Jones' length cohort analysis to multi-species cohort analysis. ICES CM 1980/ G. 191-18.
Punt, A.E. and R. Hilborn. 1997. Fisheries stock assessment and decision analysis: the Bayesian approach. Rev. Fish Biol. Fish. 7:35-63.
Sissenwine, M.P. and N. Daan. 1971. An overview of multispecies models relevant to management of living resources, p. 611. In N. Daan and M.P. Sissenwine (eds.) Multispecies models rel- evant to management of living resources. ICES Mar. Sci. Symp. 193.
Ulanowicz, R.E. 1986. Growth and development: ecosystem phe- nomenology. Springer Verlag, New York. 203 p.
Ulltang, 0. 1995. Multispecies modelling and management with ref- erence to the Institute of Marine Research's multispecies model for the Barent Sea. In A.S. Blix, L. Walloe and 0. Ulltang (eds ) Whales, seals, fish and man. Elsevier, Holland.
Ursin, E. 1979. Multispecies fish stock and yield assessment in ICES, p. 39-47. In M.C. Mercer (ed.) Multispecies approaches to fisheries management advice. ICES Mar. Sci. Symp. 59.
Vasconcellos, M., S. Mackinson, K. Sloman and D. Pauly. 1978. The stability of trophic mass-balance models of marine ecosystems: a comparative analysis. Ecol. Modelling. (In press)
Walters, C.J. 1986. Adaptive management of renewable resources. Reprinted facsimile edition, 1997. Fisheries Centre, Un~versity of British Columbia, Vancouver.
Walters, C.J. and J.J. Maguire. 1996. Lessons for stock assessment from the northern cod collapse. Rev. Fish Biol. Fish. 6:125-137.
Walters, C.J., D. Pauly and V. Christensen. ECOSPACE: prediction of mesoscale spatial patterns in trophic relationships of exploited ecosystems, with particular reference to impacts of marine pm- tected areas. (In press).
Walters, C.J., V. Christensen and D. Pauly. 1997. Structuring dy- namic models of exploited ecosystems from trophic mass-bal- ance assessments. Rev. Fish Biol. Fish. 7: 139-172.
22 Sustainable fish production in Lake Nasser

Background
Seasonal Variation in Mean Air and Water Temperature, Transparency, pH and Dissolved Oxygen Along the Main Channel
A.A. Mohamed Fishery Management Center, High Dam Lake Development Authority,Aswan, Egypt
Mohamed,A.A. 2000. Seasonal variation in mean air and water temperature, transparency, pH and dissolved oxygen along the main channel, p. 25-27. In J.F. Craig (ed.) Sustainable fish production in Lake Nasser: ecological basis and management policy. ICLARM Conf. Proc. 6 1 , 184 p.
ABSTRACT
Air and water temperature, pH, transparency and dissolved oxygen in Lake Nasser were measured in January, May, Augustand December 1996 at nine stations along the main channel. Air and water temperature tended to increase from north to south.The results showed that during January, water temperature was usually uniform from the surface to the bottom and close to air temperature. A thermocline was detected in August. Water transparency in the southern part of the lake was greatly reduced by the incoming, silt-laden water especially during the floods in August (Secchi disc depth 0.8 m).The pH of Lake Nasser was normally alkaline. Highest oxygen concentrations were found mostly during January and May.
Introduction This paper reviews seasonal variation in air and water tem-
perature, transparency, pH and dissolved oxygen along the main channel of Lake Nasser in 1996.
Materials and methods Sampling was conducted in January, May, August and De-
cember 1996 at nine locations along the main channel (Aswan High Dam, El-Rarnla, Kalabsha, El-Allaqi, El-Madiq, Korosko. Amada, Tushka and Abu Simbel) (see El Shahat, this vol., p 4). Air temperature and Secchi disc depth were measured at each of these stations and water samples were taken at 1, 3 , 6 , 9 , 12 and 18 m with a Nansen bottle. The water samples were used to measure water temperature, pH and dissolved oxygen (DO) (modified Winkler method, APHA 1992). Means of these vari- ables were calculated across all dcpths.
Results and conclusions
Air and water temperature In general, the temperature increased from north to south
(Fig. 1). The minimum air and water temperature was recorded in January and December. Water temperature was usually uni- form from surface to bottom at all stations at these times. In
May, the highest air temperature (35.8OC) was recorded at Arnada while the lowest (25.6'0 was recorded at Aswan High Dam. Maximum air and water temperatures were recorded in Au- gust. The water temperature was higher at the surface than at the bottom. At Abu Simbel In August, the water temperature at 1 m depth was 36.1°C but decreased to 30.1°C at 3 m depth Thermal stratification was also detected at Tushka at this time
Transparency Fig. 2 shows the seasonal variation in transparency (Secchi
disc depth) with station in the lake. There was considerable variation between stations. The highest values were recorded at Aswan High Dam. Transparency decreased gradually towards the south with the minimum values recorded at Abu Simbel Maximum transparency was observed in the main channel in January, while at most stations, minimum values were recorded in May and August.
The lower values for transparency in the south are related to the effects of turbid floodwater carrying sediment as well as to the abundance of phytoplankton.
Hydrogen-ion concentration (pH) Seasonal variations of pH at different stations are
shown in Fig. 3. The pH was almost always alkaline except in the deep water in the northern part of the lake (Aswan High Dam and El-Ramla) in August.
MOHAMEDlSeasonal variation in mean air and water temperature.. . 25
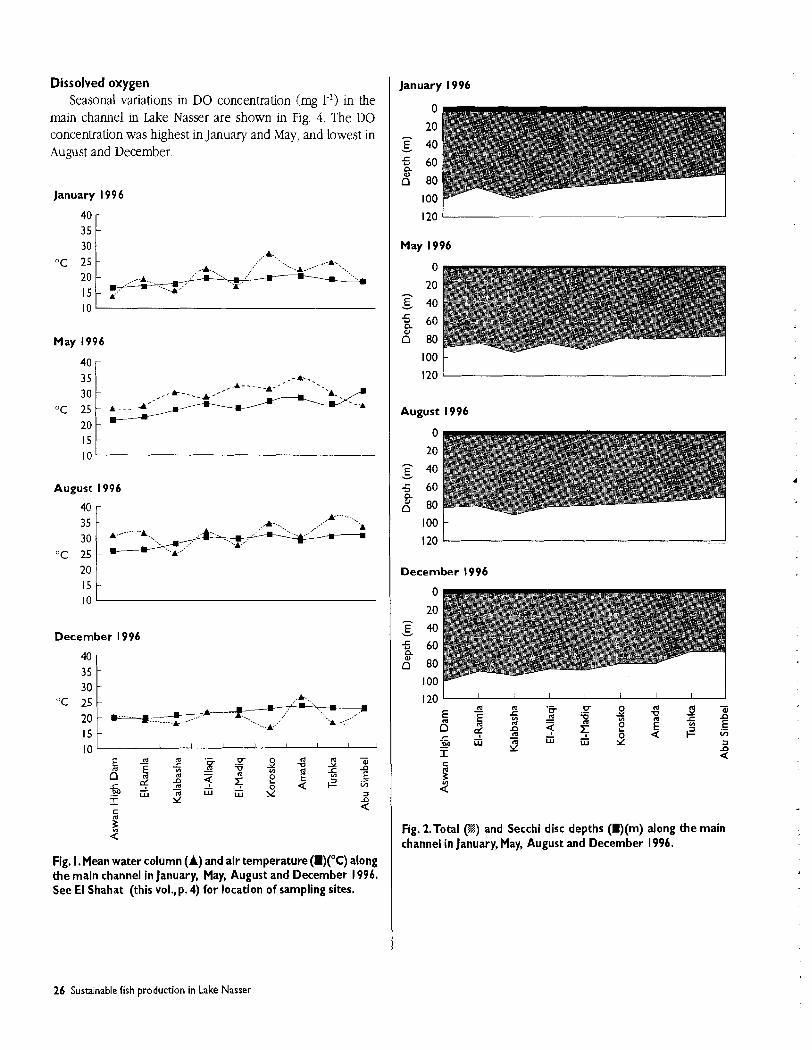
Dissolved oxygen Seasonal variations in DO concentration (mg I-') in the
main channel in Lake Nasser are shown in Fig. 4. The DO concentration was highest in January and May, and lowest in August and December
January 1996
May I996
40 r
August 1996
40 r
December I996
Fig. I. Mean water column (A) and air temperature (I)("C) along the main channel in January, May, August and December 1996. See El Shahat (this vol., p. 4) for location of sampling sites.
January 1996
120 1 I
May 1996
August 1996
December 1996
Fig. ZTotal (1) and Secchi disc depths (I)(m) along the main channel in January, May, August and December 1996.
26 Sustainable fish production in Lake Nasser
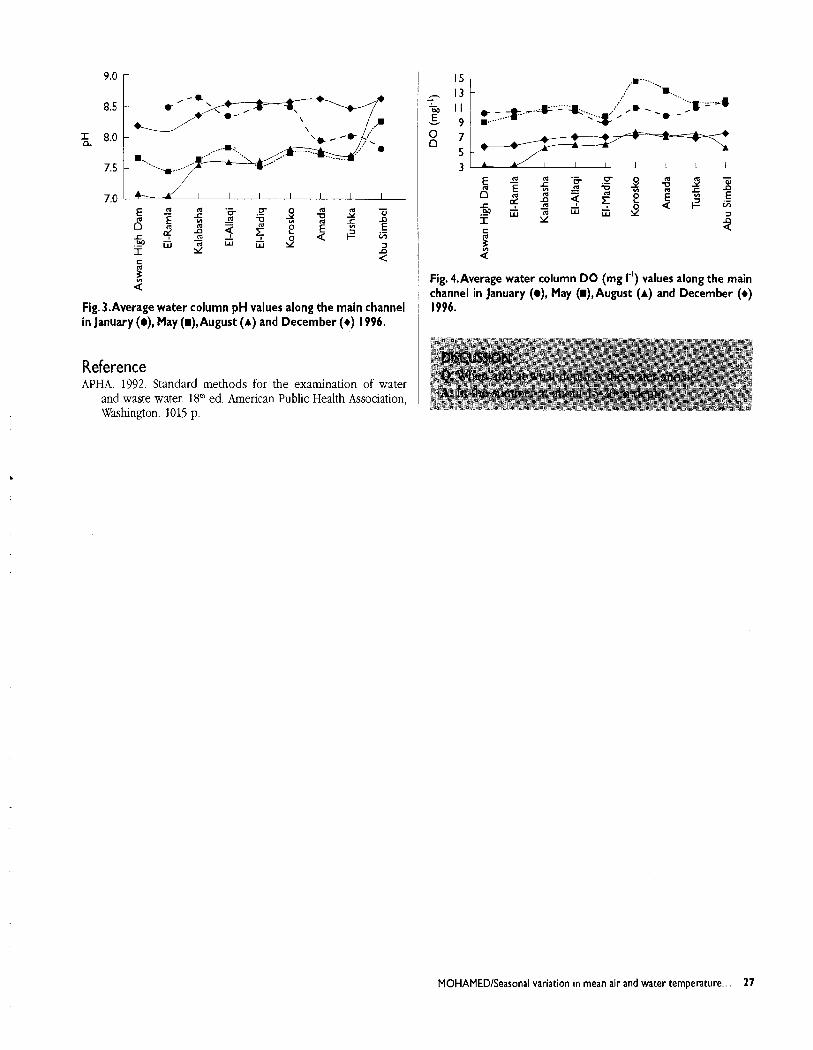
Fig, ).Average water column pH values along the main channel in January (a), May (.),August (A) and December (+) 1996.
Reference APHA. 1992. Standard methods for the examination of water
and waste water. 18" ed. American Public Health Association, Washington. 1015 p.
Fig. 4.Average water column DO (mg r') values along the main channel in January (o), May (.),August (A) and December (+) 1996.
MOHAMEDISeasonal variation in mean air and water temperature.. . 27
Seasonal Vertical Variation in Water Temperature and Total Dissolved Solids
R.G. Abd Ellah', A.E. Bela12 and I.A. Maiyza3 ' National Institute of Oceanography and Fisheries, Fayoum, Egypt
South Valley University,Aswan, Egypt National Institute of Oceanography and Fisheries, Alexandria, Egypt
Abd Ellah, R.G.,A.E. Belal and I.A. Maiyza. 2000. Seasonal vertical variation in water temperature and total dissolved solidsm, p. 29-3 I. In J.F. Craig (ed.) Sustainable fish production in Lake Nasser: ecological basis and management policy. ICLARM Conf. Proc. 6 1,184 p.
ABSTRACT
The vertical variation in water temperature and total dissolved solids (TDS) along the main channel of Lake Nasser over one year (1 993-1 994) i s presented.The lowest water temperature was observed in winter and thermal stratification was recorded in the summer.The highest value forTDS was found during the summer. TDS concentrations were inversely proportional to the water 1evel.The TDS in Lake Nasser do not reach high levels due to continuous water change, i.e., the inflow of freshwater from the south and the outflow through theAswan High Dam in the north.
Introduction This study examined the seasonal variability of water
temperature and total dissolved solids (TDS) in Lake Nasser for the period 1.993-1994
Methods During the period January 1993 to January 1994, five
seasonal cruises on Lake Nasser were undertaken. Ten hydrographic stations-Aswan High Dam, Dahmit, Kalabsha, Maria, Sayala, El-Singari, Arnada, . hlasrnas, Abu Simbel and Adindan- were established to cover the main channel of the lake (see El Shahat, this vol., p 4). Water temperature and TDS were measured at the surface and at 5, 10, 20, 30, 40, 50 and 60 m depth and as near the bottom as the depth allowed. Water temperature was measured using a reserving ther- mometer and TDS were determined according to the standard method of APHA(1992). In addition, TDS data for the pcriod 1975-1992 (Awadallah, pers. cornm.; Ibrahim 1984; Tawfik 1993) were also used.
Results and conclusions Due to vertical mixing, the vertical water temperature gra-
dient was very weak in the winter of 1993 The surface water temperature ranged from 17.0°C in the south to 19.0°C in the middle region (Fig. 1). In the spring, surface warming caused
the development of a negative water temperature gradient and there were indications of a thermocline developing. The water temperature was 20.0°C at the surface decreasing to 16.0°C near the bottom.
In summer, thermal stratification was at a maximum. The surface water temperature reached 28.0°C decreasing to <18.O0C near the bottom of the lake. In the autumn, surface cooling and vertical convection currents created a surface iso- thermal layer (20 m) with a temperature of about 27.0°C over- lying a stratified layer similar to that of the summer. During the next winter (1994), the water temperature was similar at all depths (20.0-21.O0C) (Fig. 1).
In general, the vertical water temperature gradient of the lake was dependent on the season of the year, the time of the day, climatic condition and the inflow from the south. The middle part of the lake usually had a higher water tempera- ture throughout the year which may be due to the slower flow of water there.
During the winter of 1993, the vertical TDS concentration increased from south to north (<I40 to >I55 mg I-'). The concentration of TDS in the spring decreased with depth (Fig. 2). This was probably due to evaporation at the surface. As in the winter! the concentrations were greater in the north than in the south.
The highest concentration of TDS (210 mg 1.') was found in summer in the middle region of the lake. In autumn (flood season), the TDS concentration varied between 180 mg 1.' in
ABD ELLAH, BELAL and MAIYZAISeasonal vertical variation in water temperature.. . 29
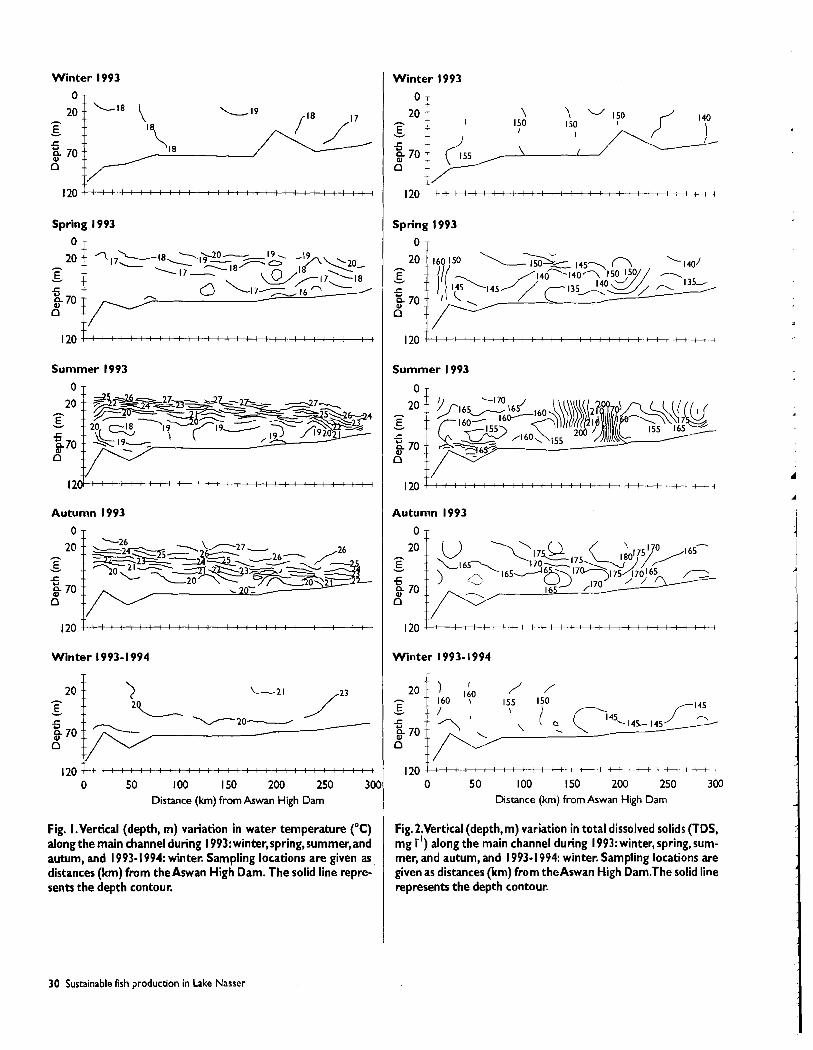
Winter 1993
Spring 1993
0 T
Summer 1993 n T
Autumn 1993
0 T
Winter 1993-1 994 T
0 50 100 150 200 250 30C Distance (krn) from Aswan High Dam
Fig. 1.Vertical (depth, m) variation in water temperature ("C) along the main channel during 1993: winter, spring, summer, and autum, and 1993- 1994: winter. Sampling locations are given as distances (km) from the Aswan High Dam. The solid line repre- sents the depth contour.
Winter 1993
O I
Spring 1993
0 1
Summer 1993
0 T
Ninter 1993- 1994
7g.Z.Vertical (depth,m) variation in total dissolved solids (TDS, ng I") along the main channel during 1993: winter, spring, sum- ner, and autum, and 1993- 1994: winter. Sampling locations are riven as distances (km) from theAswan High Dam.The solid line ~epresents the depth contour.
30 Sustainable fish production in Lake Nasser
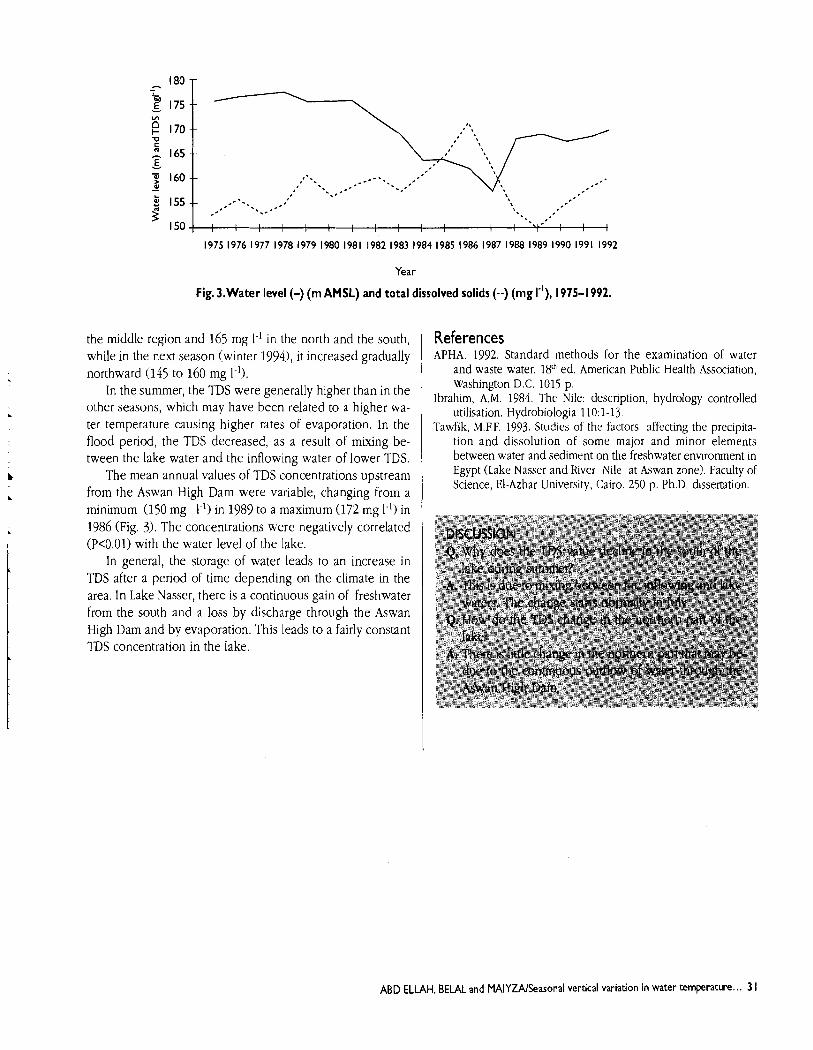
Year
Fig. 3.Water level (-) (m AMSL) and total dissolved solids (--) (mg I-'), 1975-1992.
the middle region and 165 mg 1.' in the north and the south, while in the next season (winter 1994), it increased gradually northward (145 to 160 mg 1-I).
In the summer, the TDS were generally higher than in the other seasons, which may have been related to a higher wa- ter temperature causing higher rates of evaporation. In the flood period, the TDS decreased, as a result of mixing be- tween the lake water and the inflowing water of lower TDS.
The mean annual values of TDS concentrations upstream from the Aswan High Dam were variable, changing from a minimum (150 mg 1.') in 1989 to a maximum (172 mg 1.') in 1986 (Fig. 3). The concentrations were negatively correlated (P<0.01) with the water level of the lake.
In general, the storage of water leads to an increase in TDS after a period of time depending on the climate in the area. In Lake Nasser, there is a continuous gain of freshwater from the south and a loss by discharge through the Aswan High Dam and by evaporation. This leads to a fairly constant TDS concentration in the lake.
References APHA. 1992. Standard methods for the examination of water
and waste water. 1gCh ed. American Public Health Association, Washington D.C. 1015 p.
Ibrahim, A.M. 1984. The Nile: description, hydrology controlled utilisation. Hydrobiologia 110:l-13.
Tawfik, M.F.F. 1993. Studies of the factors affecting the precipita- tion and dissolution of some major and minor elements between water and sediment on the freshwater environment in Egypt (Lake Nasser and River Nile at Aswan zone). Faculty of Science, El-Azhar University, Cairo. 250 p. P h D dissertation.
ABD ELLAH, BELAL and MAIYZAISeasonal vertical variation in water temperature ... 3 1
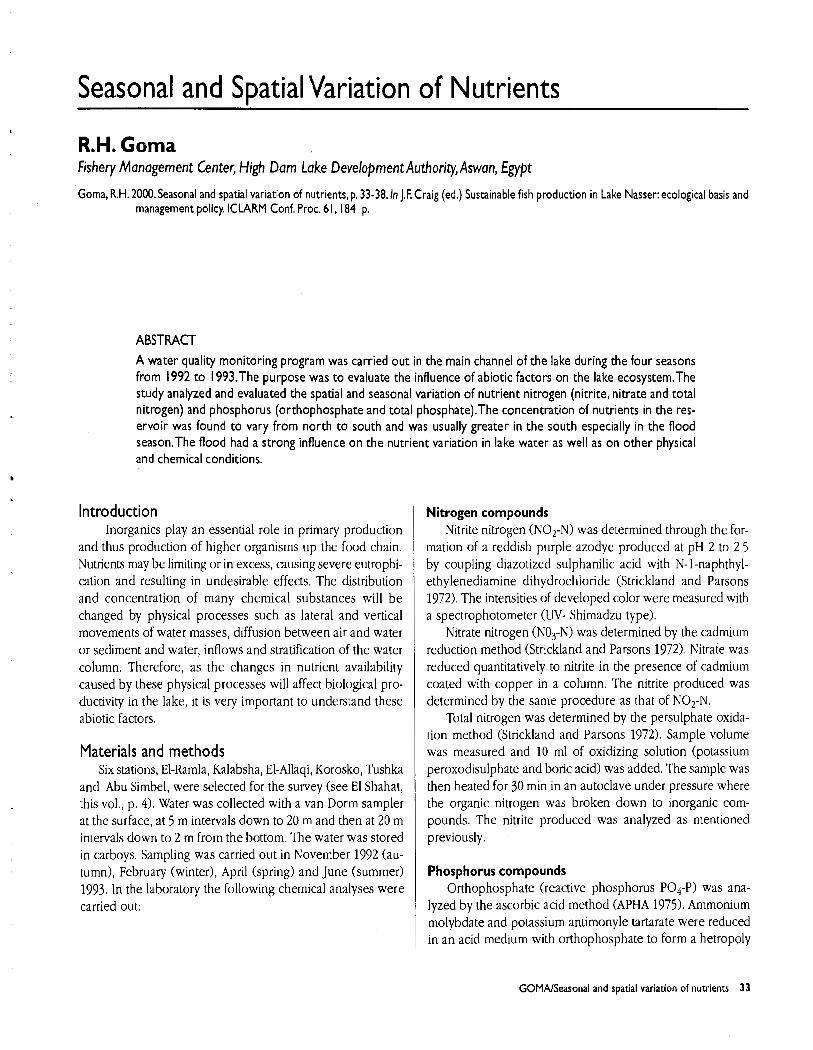
Seasonal and Spatial Variation of Nutrients
R.H. Goma Fishery Management Center, High Dam Lake Development Authority,Aswan, Egypt
Goma, R.H. 2000. Seasonal and spatial variation of nutrients, p. 33-38. In J.F. Craig (ed.) Sustainable fish production in Lake Nasser: ecological basis and management policy. ICLARM Conf. Proc. 61,184 p.
ABSTRACT
A water quality monitoring program was carried out in the main channel of the lake during the four seasons from 1992 to 1993.The purpose was t o evaluate the influence of abiotic factors on the lake ecosystem.The study analyzed and evaluated the spatial and seasonal variation of nutrient nitrogen (nitrite, nitrate and total nitrogen) and phosphorus (orthophosphate and total phosphate).The concentration of nutrients in the res- ervoir was found to vary from north t o south and was usually greater in the south especially in the flood season.The flood had a strong influence on the nutrient variation in lake water as well as on other physical - and chemical conditions.
b
Introduction Inorganics play an essential role in primary production
and thus production of higher organisms up the food chain. Nutrients may be limiting or in excess, causing severe eutrophi- cation and resulting in undesirable effects. The distribution and concentration of many chemical substances will be changed by physical processes such as lateral and vertical movements of water masses, diffusion between air and water or sediment and water, inflows and stratification of the water column. Therefore, as the changes in nutrient availability caused by these physical processes will affect biological pro- ductivity in the lake, it is very important to understand these abiotic factors.
Materials and methods Six stations, El-Ramla, Kalabsha, El-Allaqi, Korosko, Tushka
and Abu Simbel, were selected for the survey (see El Shahat, this vol., p. 4). Water was collected with a van Dorm sampler at the surface, at 5 m intervals down to 20 m and then at 20 m intervals down to 2 m from the bottom. The water was stored in carboys. Sampling was carried out in November 1992 (au- tumn), February (winter), April (spring) and June (summer) 1993. In the laboratory the following chemical analyses were carried out:
Nitrogen compounds Nitrite nitrogen (NO2-N) was determined through the for-
mation of a reddish purple azodye produced at pH 2 to 2 5 by coupling diazotized sulphanilic acid with N-l-naphthyl- ethylenediamine dihydrochloride (Strickland and Parsons 1972). The intensities of developed color were measured with a spectrophotometer (UV- Shimadzu type).
Nitrate nitrogen (NO3-N) was determined by the cadmium reduction method (Strickland and Parsons 1972). Nitrate was reduced quantitatively to nitrite in the presence of cadmium coated with copper in a column. The nitrite produced was determined by the same procedure as that of NO2-N.
Total nitrogen was determined by the persulphate oxida- tion method (Strickland and Parsons 1972). Sample volume was measured and 10 ml of oxidizing solution (potassium peroxodisulphate and boric acid) was added. The sample was then heated for 30 min in an autoclave under pressure where the organic nitrogen was broken down to inorganic com- pounds. The nitrite produced was analyzed as mentioned previously.
Phosphorus compounds Orthophosphate (reactive phosphorus PO4-P) was ana-
lyzed by the ascorbic acid method (APHA 1975). Ammonium molybdate and potassium antimonyle tartarate were reduced in an acid medium with orthophosphate to form a hetropoly
GOMAlSeasonal and spatial variation of nutrients 33
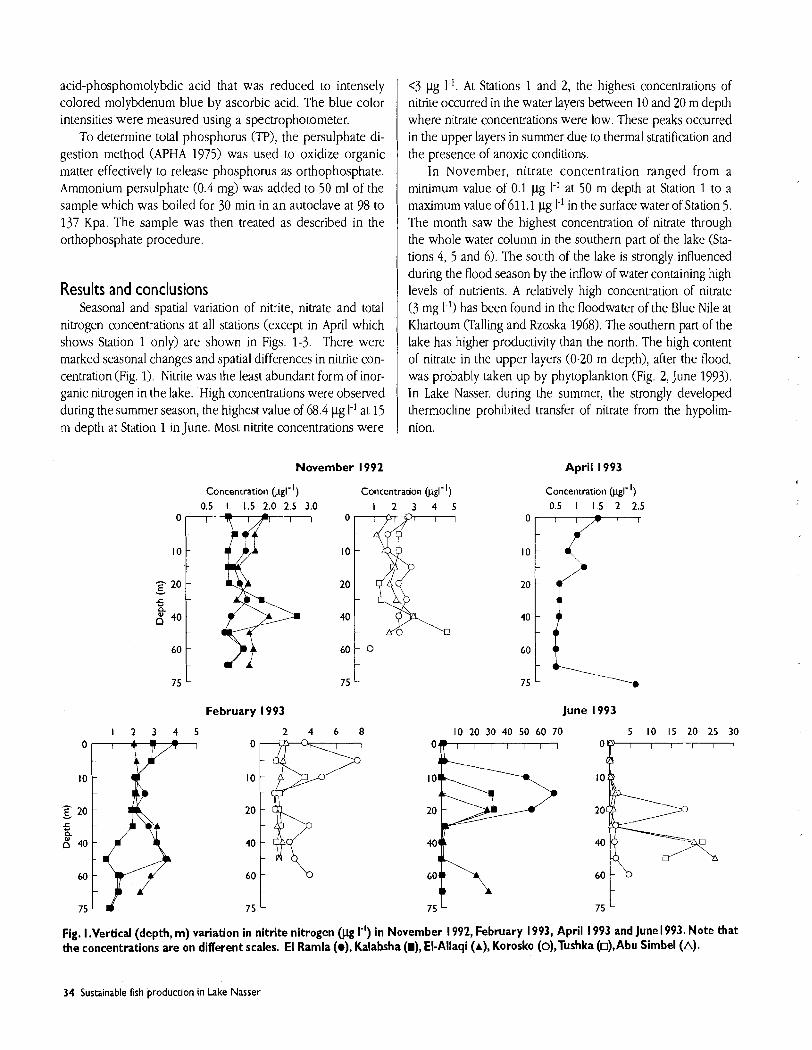
<3 pg I-'. At Stations 1 and 2, the highest concentrations of nitrite occurred in the water layers between 10 and 20 m depth where nitrate concentrations were low. These peaks occurred in the upper layers in summer due to thermal stratification and the presence of anoxic conditions.
In November, nitrate concentration ranged from a minimum value of 0.1 pg I-' at 50 m depth at Station 1 to a maximum value of 611.1 pg 1.' in the surface water of Station 5. The month saw the highest concentration of nitrate through the whole water column in the southern part of the lake (Sta- tions 4, 5 and 6). The south of the lake is strongly influenced during the flood season by the inflow of water containing high levels of nutrients. A relatively high concentration of nitrate (3 mg 1.') has been found in the floodwater of the Blue Nile at Khartoum (Talling and Rzoska 1968). The southern part of the lake has higher productivity than the north. The high content of nitrate in the upper layers (0-20 m depth), after the flood, was probably taken up by phytoplankton (Fig. 2, June 1993). In Lake Nasser, during the summer, the strongly developed thermocline prohibited transfer of nitrate from the hypolim-
colored molybdenum blue by ascorbic acid. The blue color intensities were measured using a spectrophotometer.
To determine total phosphorus (TP), the persulphate di- gestion method (APHA 1975) was used to oxidize organic matter effectively to release phosphorus as orthophosphate. Ammonium persulphate (0.4 mg) was added to 50 ml of the sample which was boiled for 30 min in an autoclave at 98 to 137 Kpa. The sample was then treated as described in the orthophosphate procedure.
Results and conclusions Seasonal and spatial variation of nitrite, nitrate and total
nitrogen concentrations at all stations (except in April which shows Station 1 only) are shown in Figs. 1-3. There were marked seasonal changes and spatial differences in nitrite con- centration (Fig. 1). Nitrite was the least abundant form of inor- ganic nitrogen in the lake. High concentrations were observed during the summer season, the highest value of 68.4 pg 1.' at 15 m depth at Station 1 in June. Most nitrite concentrations were I nion.
November 1992 April 1993
Concentration (pgl-I) 0.5 1 1.5 2.0 2.5 3.0 - -
I 0
10
20
40
60
Concentration (pgl-I) 1 2 3 4 5
Concentration (pgl-I) 0.5 1 1.5 2 2.5
I I -
-
-
- -
-
-
-
- 75
February 1993 June 1993
Fig. I .Vertical (depth, m) variation in nitrite nitrogen (pg I") in November 1992, February 1993, April 1993 and June 1993. Note that the concentrations are on different scales. El Ramla (o), Kalabsha (w), El-Allaqi (A), Korosko (o),Tushka (o),Abu Simbel (A).
34 Sustainable fish production in Lake Nasser
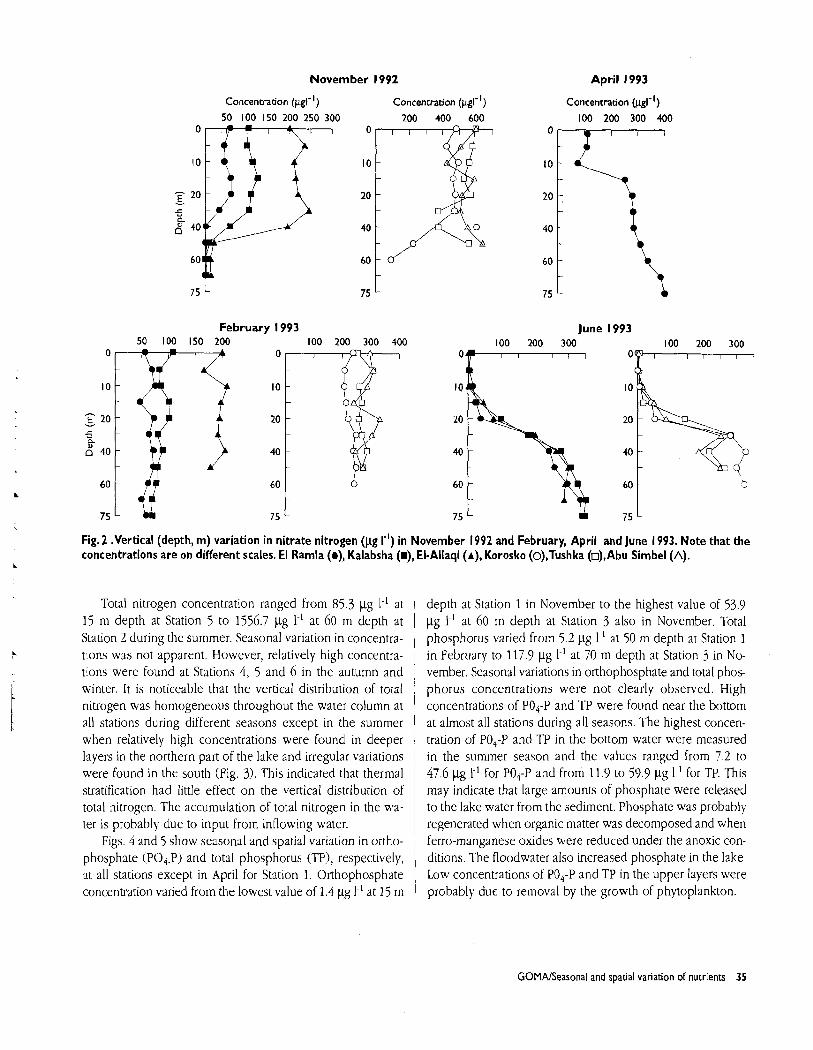
November 1992 April 1993
Concentration (pgl-') Concentration (pgl-I)
50 100 150 200 250 300 200 400 600 0 0
10 10
20 20
5 n
40 40
60 60
February 1993
Concentration (pglq')
100 200 300 400
June 1993 100 200 300 - 0
Fig.2 .Vertical (depth, m) variation in nitrate nitrogen (pg I-") in November 1992 and February, April and June 1993. Note that the concentrations are on different scales. El Ramla (a), Kalabsha (I), El-Allaqi (A), Korosko (o),Tushka (o),Abu Simbel (A).
Total nitrogen concentration ranged from 85.3 yg I-' at 1
15 m depth at Station 5 to 1556.7 yg 1 ~ ' at 60 m depth at 1 Station 2 during the summer. Seasonal variation in concentra- i tions was not apparent. However, relatively high concentra- I tions were found at Stations 4, 5 and 6 in the autumn and , winter. It is noticeable that the vertical distribution of total ~ nitrogen was homogeneous throughout the water column at ' all stations during different seasons except in the summer 1 when relatively high concentrations were found in deeper i layers in the northern part of the lake and irregular variations 1 were found in the south (Fig. 3). This indicated that thermal stratification had little effect on the vertical distribution of total nitrogen. The accumulation of total nitrogen in the wa- ter is probably due to input from inflowing water.
Figs. 4 and 5 show seasonal and spatial variation in ortho- phosphate (P04.P) and total phosphorus (TP), respectively, at all stations except in April for Station 1. Orthophosphate concentration varied from the lowest value of 1.4 pg 1.' at 15 m
depth at Station 1 in November to the highest value of 53.9 pg 1-' at 60 m depth at Station 3 also in November. Total phosphorus varied from 5 2 pg 1.' at 50 m depth at Station 1 in February to 117.9 pg I-' at 70 m depth at Station 3 in No- vember. Seasonal variations in orthophosphate and total phos- phorus concentrations were not clearly observed. High concentrations of PO4+ and 1'P were found near the bottom at almost all stations during all seasons. The highest concen- tration of PO,-P and TP in the bottom water were measured in the summer season and the values ranged from 7.2 to 47.6 pg P1 for PO4-P and from 11.9 to 59.9 pg I-' for TP. This may indicate that large amounts of phosphate were released to the lake water from the sediment. Phosphate was probably regenerated when organic matter was decomposed and when ferro-manganese oxides were reduced under the anoxic con- ditions. The floodwater also increased phosphate in the lake. Low concentrations of PO4-P and TP in the upper layers were probably due to removal by the growth of phytoplankton.
GOMAlSeasonal and spatial variation of nutrients 35
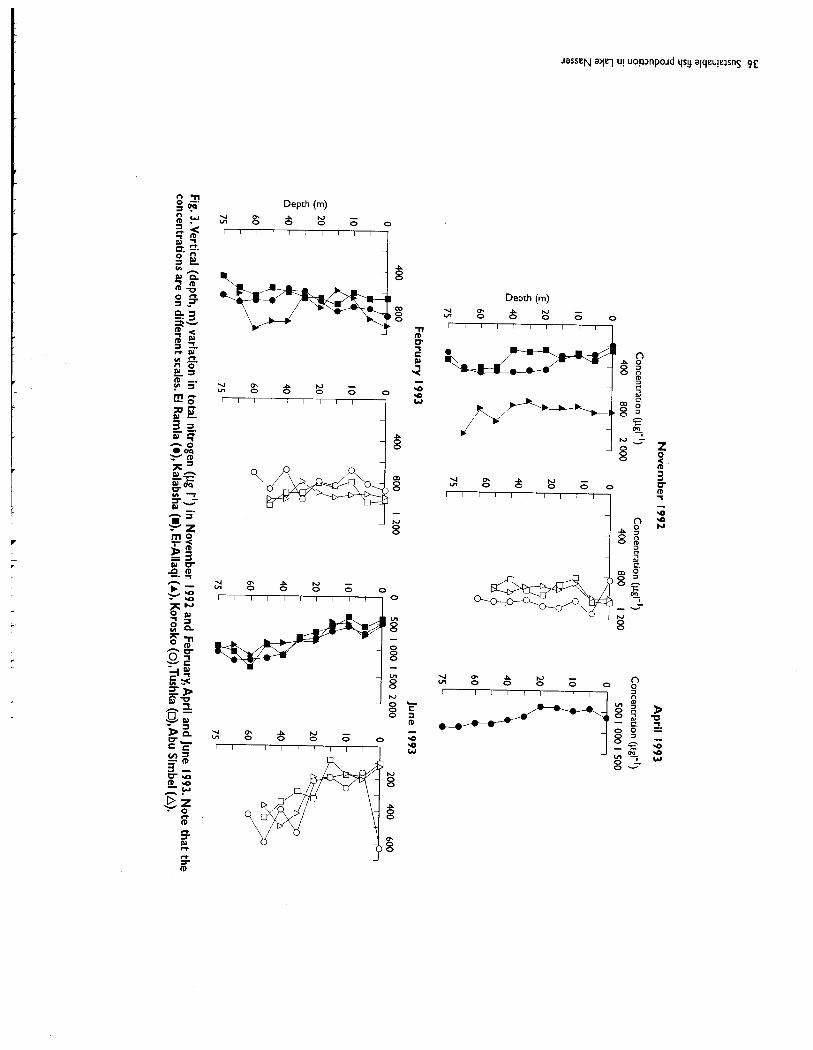
November 1992
Concentration (pgl-I) Concentration (pgl-I) 400 800 2 000 400 800 1 200
0 0
10 10
p 20 20 -
5 b
40 40
60 -
75 - 75
February 1993
April 1993
Concentration (pgl-I) 500 1 000 1 500
June 1993
Fig. 3.Vertical (depth, m) variation in total nitrogen (pg rI.') in November 1992 and February,April and June 1993. Note that the concentrations are on different scales. El Ramla (e), Kalabsha (I), El-Allaqi (A), Korosko (o),Tushka (u),Abu Simbel (A).
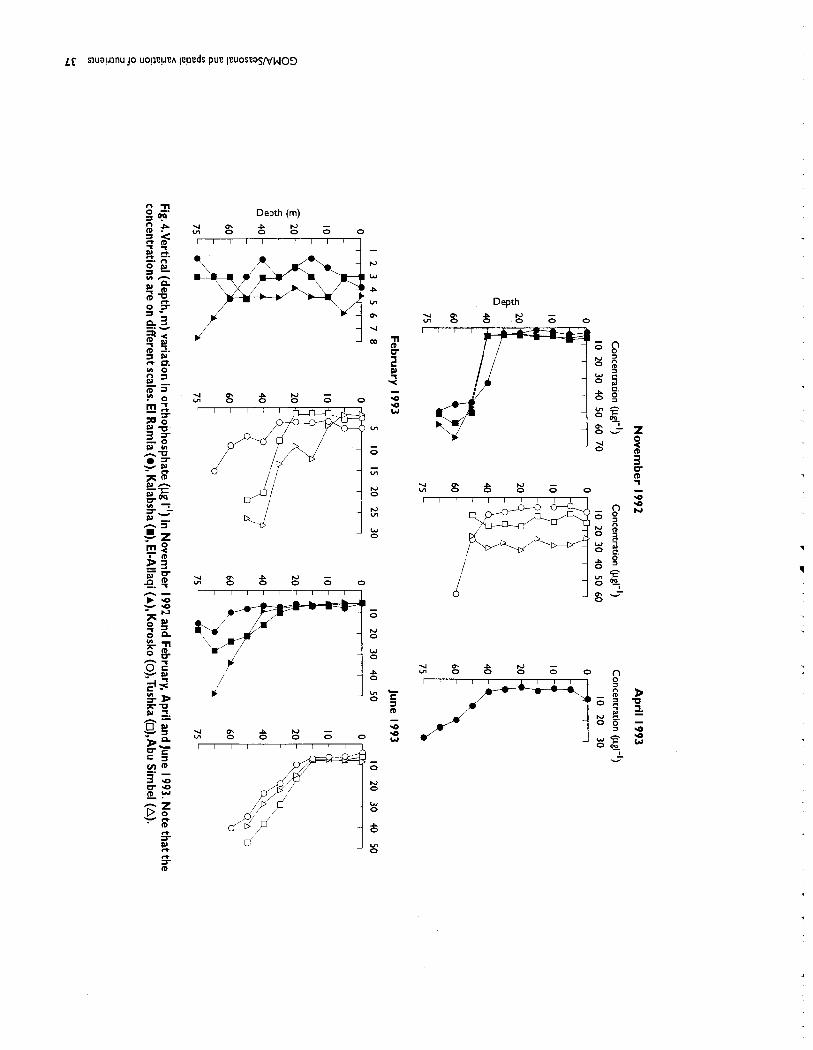
November 1992
Concentration (pgl-I) Concentration @$I)
10 20 30 40 50 60 70 10 20 30 40 50 60 0 0
10 10
5 20 20 n.
d 40 40
60 60
February 1993
April 1993
Concentration (p&)
10 20 30
40
60
June 1993
Fig. 4.Vertical (depth,m) variation in orthophosphate (pg I") in November 1992 and February, April and June 1993. Note that the concentrations are on different scales. El Ramla (e), Kalabsha (I), El-Allaqi (A), Korosko (o),Tushka (o),Abu Simbel (A).
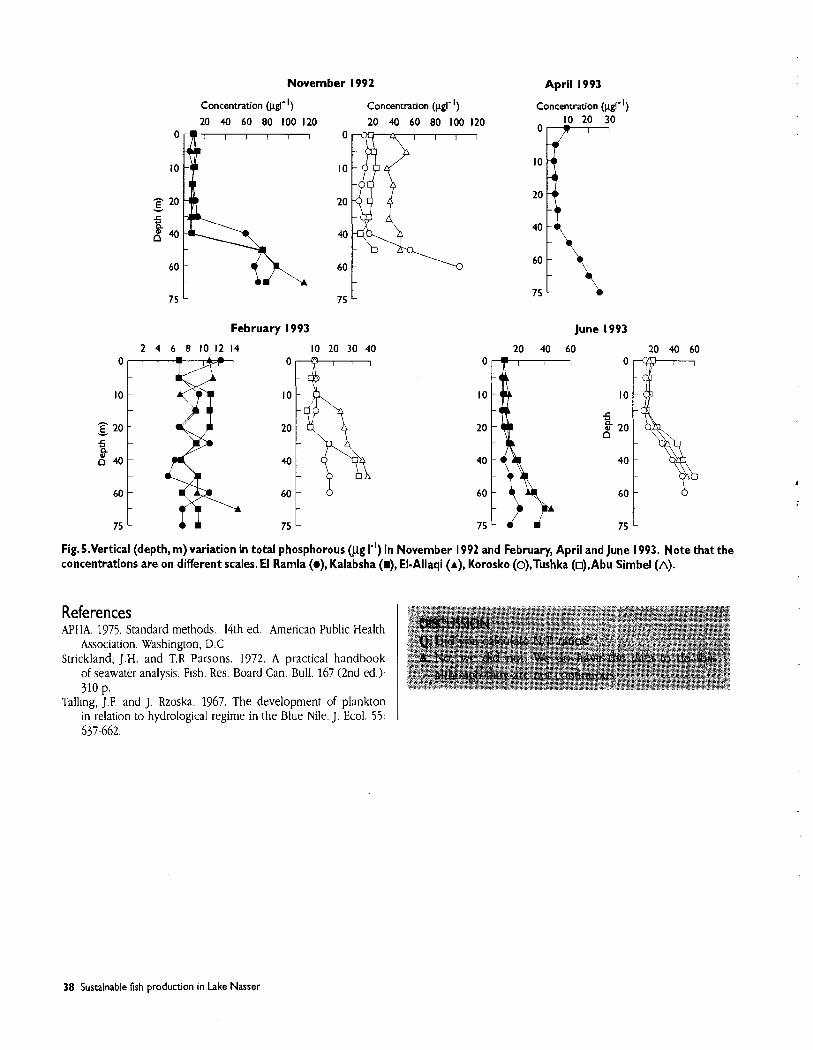
November 1992 April 1993
Concentration (~gl- I)
20 40 60 80 100 120 I I l l l l 0
10
20
40
60
75
February 1993
Concentration k t - ' ) Concentration (pgl-l) 20 40 60 80 100 120 10 20 30
0-
June 1993
Fig.5.Vertical (depth,m) variation in total phosphorous (pg I") in November 1992 and February, April and June 1993. Note that the concentrations are on different scales. El Ramla (a), Kalabsha (I), El-Allaqi (A), Korosko (o),Tushka (o),Abu Simbel (A).
Talling, J.F. and J. Rzoska. 1967. The development of plankton in relation to hydrological regime in the Blue Nile. J. Ecol. 55: 637-662.
References APHA 1975 Standard methods 14th ed Amencan Publ~c Health
4ssoaanon Washington, D C Stnckland, J H 2nd TR Parsons 1972 A pract~cal handbook
of seawater analys~s F~sh Res Board Can Bull 16' (2nd ed ) 310 p.
38 Sustainable fish production in Lake Nasser
, , , ,
d,
Bacteriological Studies
S.A. Rabeh National Institute of Oceanography and Fisheries, Cairo, Egypt
Rabeh, S.A. 2000. Bacteriological studies, p. 39-4 I. In Craig (ed.) Sustainable fish production in Lake Nasser: ecological basis and management policy. ICLARM Conf. Proc. 6 1, 184 p.
ABSTRACT
The assessment of the sanitary quality of near-surface water along the main channel (nine stations) and of near-surface and near-bottom waters of one station (Tushka) of five selected khors during the winter of 1997- 1998 is presented.The water quality was based on the values of total bacter~al counts (TBC) at 22.0 and 37.0°C and total and fecal coliforms (TC and FC) as indicators of fecal contamination.The possible presence of sulphate-reducing bacteria (SRB) as the main cause of H2S production was also examined in near-bottom water and bottom sediments of three stations of the main channel and at one station of each of the five studied khors. Bacterial numbers in the main channel were high in the south of the lake, decreased in the middle and then increased in the north.The highest and lowest numbers of bacteria in near-surface and near- bottom waters were recorded at El-Allaqi and Kalabsha khors, respectively.The highest counts ofTC and FC were recorded at E I -Ramla and El-Madiq while the lowest counts were recorded at El-Allaqi. Compared with other examined stations, the highest counts o fTC and FC were recorded at the source point for the El- Sheekh Zayed Canal in near-surface and near-bottom waters. A complete absence of SRB in almost all tested samples was recorded. It was concluded that there was a small degree of microbial pollution at some sites and recommendations on more stringent measures to prevent further pollution are suggested.
Introduction As a result of population increase, one of the main objec-
tives of developing countries is to conserve and develop all food sources, especially those that provide animal protein. Lakes are among the most important sources of freshwater fisheries but they are often subject to pollution. The major sources of water pollution are domestic, industrial and agri- cultural wastes (Hendry et al. 1982). Bacteriological analysis is now carried out with increasing frequency to ascertain the sanitary quality of water. Plate count agar is presently the most valuable and sensitive tool for routine monitoring of water quality and treatment efficiency (Grabow 1970). For many years, coliform bacteria have served as indicators of the degree of fecal contamination in water (Menon 1974).
Sulphate-reducing bacteria (SRB) are environmentally im- portant microorganisms. Their influence can be divided into ecological and economic effects (Postgate 1982). During the hot months, a problem of odor and change in taste has arisen in some areas of Lake Nasser due to H,S production by SRB (Saleh 1776).
The aim of the present work was a sanitary and bacterio- logical assessment of the Lake Nasser water by monitoring the number of bacteria (both total and fecal coliforms, TC and FC) developing at 22.0 and 37.0°C. The study also inves- tigated the possible presence of SRB in near-bottom water and bottom sediments of Lake Nasser.
Materials and methods
Sampling and stations A sterile 250-ml glass bottle fitted with a stopper pro-
tected by an aluminum foil cover was used for sampling the near-surface water from nine stations of the main channel and eight stations in five khors (one station for each khor except four in Tushka). In the case of near-bottom water samples taken from three stations of the main channel, Aswan High Dam, El-Madiq and Abu Simbel (see El Shahat, this vol., p. 4), and from eight stations in the khors, a weighted, ster- ilized bottle on a cord was used. Bottom-sediment samples
RABEHlBacteriological studies 39
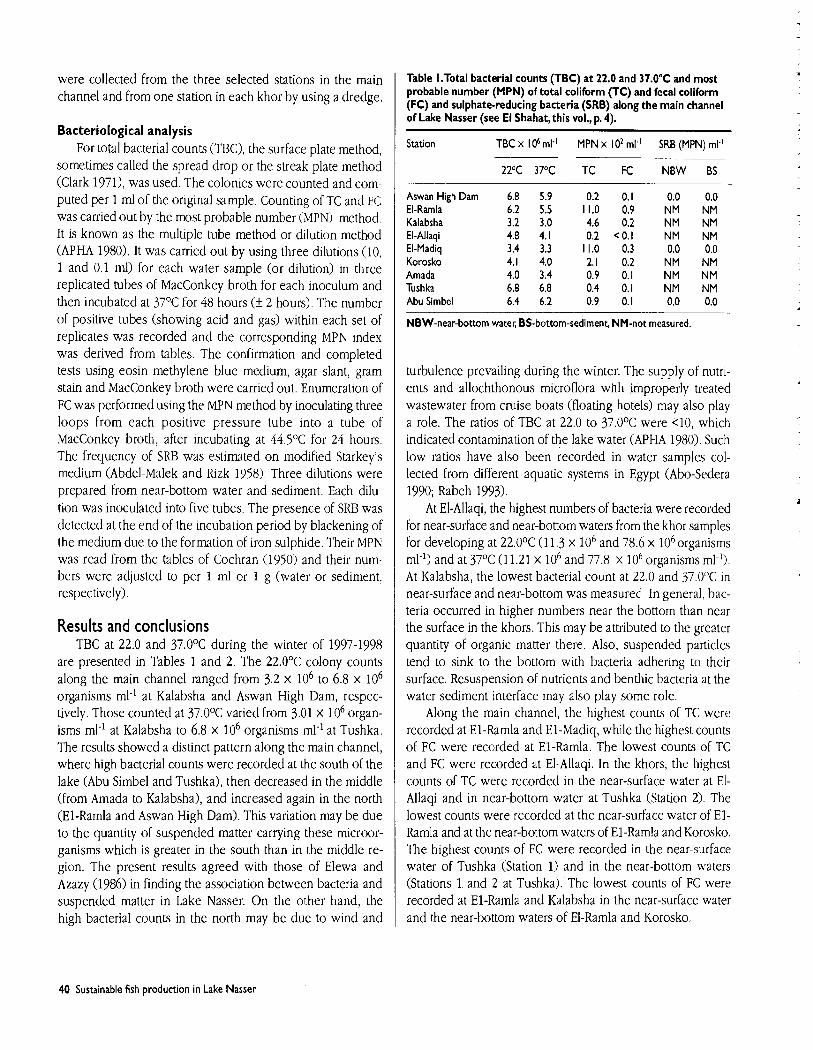
were collected from the three selected stations in the main channel and from one station in each khor by using a dredge.
Bacteriological analysis For total bacterial counts (TBC), the surface plate method,
sometimes called the spread drop or the streak plate method (Clark 1971), was used. The colonies were counted and com- puted per 1 rnl of the original sample. Counting of TC and FC was carried out by the most probable number (MPN) method. It is known as the multiple tube method or dilution method (APHA 1980). It was carried out by using three dilutions (10, 1 and 0.1 rnl) for each water sample (or dilution) in three replicated tubes of MacConkey broth for each inoculum and then incubated at 37OC for 48 hours (f 2 hours). The number of positive tubes (showing acid and gas) within each set of replicates was recorded and the corresponding MPN index was derived from tables. The confirmation and completed tests using eosin methylene blue medium, agar slant, gram stain and MacConkey broth were carried out. Enumeration of FC was performed using the MPN method by inoculating three loops from each positive pressure tube into a tube of MacConkey broth, after incubating at 44.5"C for 24 hours. The frequency of SRB was estimated on modified Starkey's medium (Abdel-Malek and Rizk 1958). Three dilutions were prepared from near-bottom water and sediment. Each dilu- tion was inoculated into five tubes. The presence of SRB was detected at the end of the incubation period by blackening of the medium due to the formation of iron sulphide. Their MPN was read from the tables of Cochran (1950) and the11 num- bers were adjusted to per 1 rnl or 1 g (water or sediment. respectively).
Results and conclusions TBC at 22.0 and 37.0°C during the winter of 1997-1998
are presented in Tables 1 and 2. The 22.0°C colony counts along the main channel ranged from 3.2 x lo6 to 6.8 x lo6 organisms ml-' at Kalabsha and Aswan High Dam, respec- tively. Those counted at 37.0°C varied from 3.01 x lo6 organ- isms ml-' at Kalabsha to 6.8 x lo6 organisms ml-' at Tushka. The results showed a distinct pattern along the main channel, where high bacterial counts were recorded at the south of the lake (Abu Simbel and Tushka), then decreased in the middle (from Amada to Kalabsha), and increased again in the north (El-Ramla and Aswan High Dam). This variation may be due to the quantity of suspended matter carrying these microor- ganisms which is greater in the south than in the middle re- gion. The present results agreed with those of Elewa and Azazy (1986) in finding the association between bacteria and suspended matter in Lake Nasser. On the other hand, the high bacterial counts in the north may be due to wind and
Table I.Total bacterial counts (TBC) at 22.0 and 37.0°C and most probable number (MPN) of total coliform (TC) and fecal coliform (FC) and sulphate-reducing bacteria (SRB) along the main channel of Lake Nasser (see El Shahat,this vol., p. 4).
Station
Aswan High Dam El-Ramla Kalabsha El-Allaqi El-Madiq Korosko Amada Tushka Abu Simbel
TBC x 1 O6 ml-' MPN x 1 O2 ml"
22°C 37°C TC FC
6.8 5.9 0.2 0.1 6.2 5.5 1 1.0 0.9 3.2 3.0 4.6 0.2 4.8 4.1 0.2 < 0.1 3.4 3.3 l 1.0 0.3 4.1 4.0 2.1 0.2 4.0 3.4 0.9 0.1 6.8 6.8 0.4 0.1 6.4 6.2 0.9 0.1
SRB (MPN) ml-'
NBW BS
NBW-near-bottom water, BS-bottom-sediment, NM-not measured.
turbulence prevailing during the winter. The supply of nutri- ents and allochthonous microflora with improperly treated wastewater from cruise boats (floating hotels) may also play a role. The ratios of TBC at 22.0 to 37.0°C were 4 0 , which indicated contamination of the lake water (APHA 1980). Such low ratios have also been recorded in water samples col- lected from different aquatic systems in Egypt (Abo-Sedera 1990; Rabeh 1993).
At El-Allaqi, the highest numbers of bacteria were recorded for near-surface and near-bottom waters from the khor samples for developing at 22.0°C (1 1.3 x lo6 and 78.6 x lo6 organisms ml-') and at 37°C (11.21 x 10"nd 77.8 x 10%rganisms ml-I). At Kalabsha, the lowest bacterial count at 22.0 and 37.0°C in near-surface and near-bottom was measured. In general, bac- teria occurred in higher numbers near the bottom than near the surface in the khors. This may be attributed to the greater quantity of organic matter there. Also, suspended particles tend to sink to the bottom with bacteria adhering to their surface. Resuspension of nutrients and benthic bacteria at the water sediment interface may also play some role.
Along the main channel, the highest counts of TC were recorded at El-Ramla and El-Madiq, while the highest counts of FC were recorded at El-Ramla. The lowest counts of TC and FC were recorded at El-Allaqi. In the khors, the highest counts of TC were recorded in the near-surface water at El- Allaqi and in near-bottom water at Tushka (Station 2). The lowest counts were recorded at the near-surface water of E l - Ramla and at the near-bottom waters of El-Ramla and Korosko. The highest counts of FC were recorded in the near-surface water of Tushka (Station 1) and in the near-bottom waters (Stations 1. and 2 at Tushka). The lowest counts of FC were recorded at El-Ramla and Kalabsha in the near-surface water and the near-bottom waters of El-Ramla and Korosko.
40 Sustainable fish production in Lake Nasser
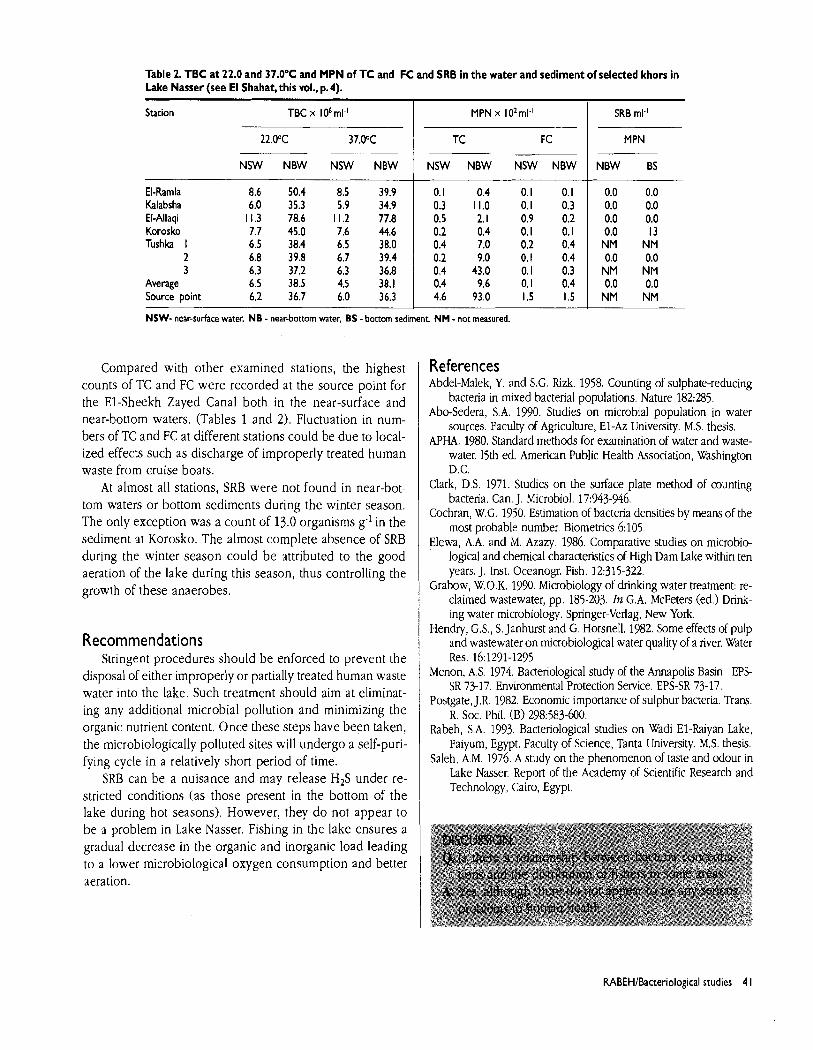
El-Ramla Kalabsha El-Allaqi Korosko Tushka I
2 3
Average Source point
Table 2. TBC at 22.0 and 37.0°C and MPN of T C and FC and SRB in the water and sediment of selected khors in Lake Nasser (see El Shahat, this vol., p. 4).
- -- , -
NSW- near-surface water. NB - near-bottom water, BS - bottom sed~ment. NM - not measured.
Station TBC x I Ob ml-'
2 2 . K 37.00C
N S W N B W N S W N B W
Compared with other exam~ned stations, the highest counts of TC and FC were recorded at the source point for the El-Sheekh Zayed Canal both in the near-surface and near-bottom waters. (Tables 1 and 2 ) . Fluctuation in num- bers of TC and FC at different stations could be due to local- ized effects such as discharge of improperly treated human waste from cruise boats.
At almost all stations, SRB were not found in near-bot- tom waters or bottom sediments during the winter season. The only exception was a count of 13.0 organisms g-' in the sediment at Korosko. The almost complete absence of SRB during the winter season could be attributed to the good aeration of the lake during this season, thus controlling the growth of these anaerobes.
Recommendations Stringent procedures should be enforced to prevent the
disposal of either improperly or partially treated human waste water into the lake. Such treatment should aim at eliminat- ing any additional microbial pollution and minimizing the organic nutrient content. Once these steps have been taken, the microbiologically polluted sites will undergo a self-puri- fying cycle in a relatively short period of time.
SRB can be a nuisance and may release H2S under re- stricted conditions (as those present in the bottom of the lake during hot seasons). However, they d o not appear to be a problem in Lake Nasser. Fishing in the lake ensures a gradual decrease in the organic and inorganic load leading to a lower microbiological oxygen consumption and better aeration.
MPN x 102rnl-I
TC FC
NSW N B W NSW N B W
References Abdel-Malek, Y. and S.G. Rizk. 1958. Counting of sulphate-reducing
bacteria in mixed bacterial populations. Nature 182:285. Abo-Sedera, S.A. 1990. Studies on microbial population in water
sources. Faculty of Agriculture, E1-Az University. M.S. thesis. APHA. 1980. Standard methods for examination of water and waste-
water. 15th ed. American Public Health Association, Washington D.C.
Clark, D.S. 1971. Studies on the surface plate method of counting bacteria. Can. J. Microbiol. 17:943-946.
Cochran, W.G. 19j0. Estimation of bacteria densities by means of the most probable number. Biornetrics 6:105.
Elewa, A.A. and M. Azazy. 1986. Comparative studies on microbio- logical and chemical characteristics of High Dam Lake within ten years. J. Inst. Oceanogr. Fish. 12:315-322.
Grabow, W.O.K. 1990. Microbiology of drinking water treatment: re- claimed wastewater, pp. 185-203. In G.A. McFeters (ed.) Drink- ing water microbiology. Springer-Verlag, New York.
Hendry, G.S., S. Janhurst and G. Horsnell. 1982. Some effects of pulp and wastewater on microbiological water quality of a river. Water Res. 16:1291-1295.
Menon, AS. 1974. Bacteriological study of the Annapolis Basin. EPS- SR 73-17. Environmental Protection Service. EPS-SR 73-17.
Postgate, J.R. 1982. Economic importance of sulphur bacteria. Trans. R. Soc. Phil. (B) 298:583-600.
Rabeh, S.A. 1993. Bacteriological studies on Wadi El-Raiyan Lake, Faiyum, Egypt. Faculty of Science, Tanta University. M S . thesis.
Saleh, A.M. 1976. A study on the phenomenon of taste and odour in Lake Nasser. Report of the Academy of Scientific Research and Technology, Cairo, Egypt.
SRB ml-'
MPN
N B W BS
RABEH/BacteriologicaI studies 4 1
Seasonal Variation of Phytoplankton Abundance
O.A. Habib Fishery Management Center, High Dam lake Development Authority,Aswan, Egypt
Habib,O.A.2000.Seasonal variation of phytoplankton abundance,p.43-49.h j. F. Craig (ed.) Sustainable fish production in Lake Nasser:ecological basis and management policy. ICLARM Conf. Proc. 6 I, 184 p.
ABSTRACT
In 199 1, six stations along the main channel of Lake Nasser were sampled, from Station I in the north to Station 6 in the south t o estimate phytoplankton abundance.The total number of phytoplankton cells or colonies was high during January-March at Stations 2 and 3 and during July-August at Stations 3 to 5.The number was very low at Stations I and 6 except for July at Station 6 where a very high value was observed at the surface. For the water column (0-20 m), the total phytoplankton number as algal units I-' ranged from 2.8 x lo3 at 20 m depth in November at Station 6 to 2 592.1 x lo3 at the surface in August at Station 5. The phytoplankton community was composed of blue-green algae, diatoms, green algae and dinoflagellates. Blue-greens dominated the community, as a percentage, during spring and summer. Diatoms dominated the community only once in winter (December). Noticeable peaks of green algae were recorded in spring at Stations I to 4 and in summer at Stations 5 and 6. Dinoflagellates were verpfew except for some remarkable peaks in late winter and spring.
Introduction Planktonic algae occur in all types of water, where envi-
ronmental conditions are suitable for their growth (Feldmann 1951; Tiffany 1951). Seasonal patterns in phytoplankton peri- odicity result from the integration of such factors as light, temperature, nutrient concentrations and biological interac- tions (Fogg 1965; Hutchinson 1967; Round 1971, 1981; Porter 1977; Keating 1978).
Methods Water samples were collected four times (February, May,
August and November) during 1991 at six stations, El-Ramla, Kalabsha, El-Allaqi, Korosko, Tushka and Abu Simbel, along the main channel of Lake Nasser (see El Shahat, this vol., p. 4). One-liter water samples were collected at 5 m intervals from the surface to 20 m depth (0, 5, 10, 15 and 20 m) in polyethylene bottles and fixed with 10 ml of 4% formalin for later treatment. Each sample was left to settle in a measuring cylinder for 48 h, after which 900 ml of the supernatant were carefully siphoned off.
The residue was transferred into a 100 ml cylinder and left to settle again for 48 h. The supermiant was again si-
phoned off and the final volume of the sample was made up with water to 25 ml in a vial. A counting chamber of 1 ml capacity was used to count the algae with a microscope. Empty and obvious dead cells were not included in the counts. Re- sults were expressed in algal units per liter. Algal units were individual cells of single-celled species and colonies of cyanophytes.
Results Seasonal variation in the total number of phytoplankton
cells or colonies at five depths (5 m intervals from the surface to 20 m depth) is shown in Fig. 1. In general, Stations 2 and 3 had similar trends in seasonal variation of phytoplankton abun- dance, with high values in February (2 326 x lo3 and 1 966 x lo3 algal units I-' in the surface layer for both, respectively), and August (583 x lo3 algal units I-' in the surface and 993 x 103 algal units 1-' at 5 m depth, respectively). Values in May were low (40 x lo3 algal units 1.' at 20 m depth and 98 x lo3 algal units 1.' at 15 m depth, respectively). Stations 4 and 5 were also similar to each other in seasonal variation of phytoplankton abundance with high values in August only (1 899 x lo3 algal units I-' at 5 in depth and 2 592 x lo3 algal
HABlBlSeasonal variation of phytoplankton abundance 43
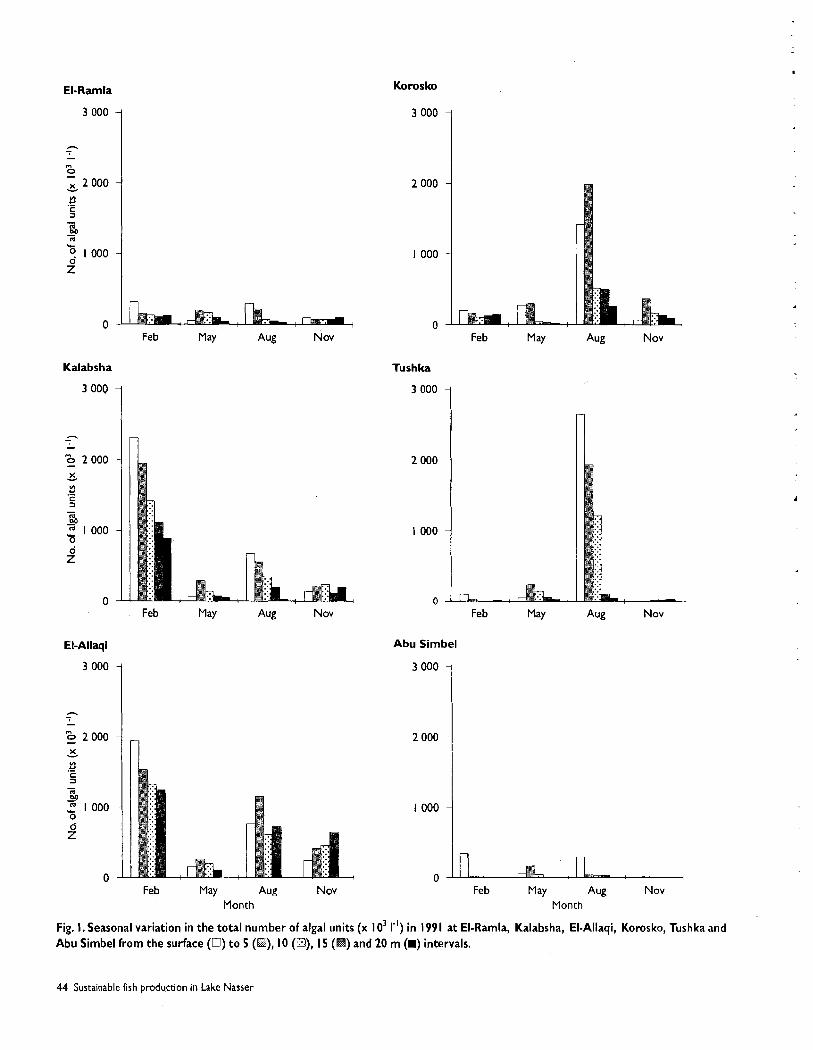
El-Ramla
3 000
- - - 0
0 x 2 000 w
3 .- C
- % - m L
? l 000 5
0
Kalabsha
3 000
h - - "0 - 2 000 X - V) u .- C 3 - % 2 l 000 0
z"
0
El-Allaqi
3 000
- - p 2 000 X w
V) u .- c - 0 - 2 l 000 0
;
0 Feb May Aug N ov
Month
Korosko
3 000
2 000
1 000
Feb May
Tushka
3 000
2 000
1 000
Aug Nov
Feb Aug Nov
Abu Sirnbel
Feb May Aug Nov
Month
Fig. I . Seasonal variation in the total number of algal units (x 1 o3 1.') in 1991 at El-Ramla, Kalabsha, El-Allaqi, Korosko, Tushka and Abu Simbel from the surface (0) to 5 (El), 10 (m), 15 (B) and 20 m (m) intervals.
44 Sustainable fish product~on In Lake Nasser
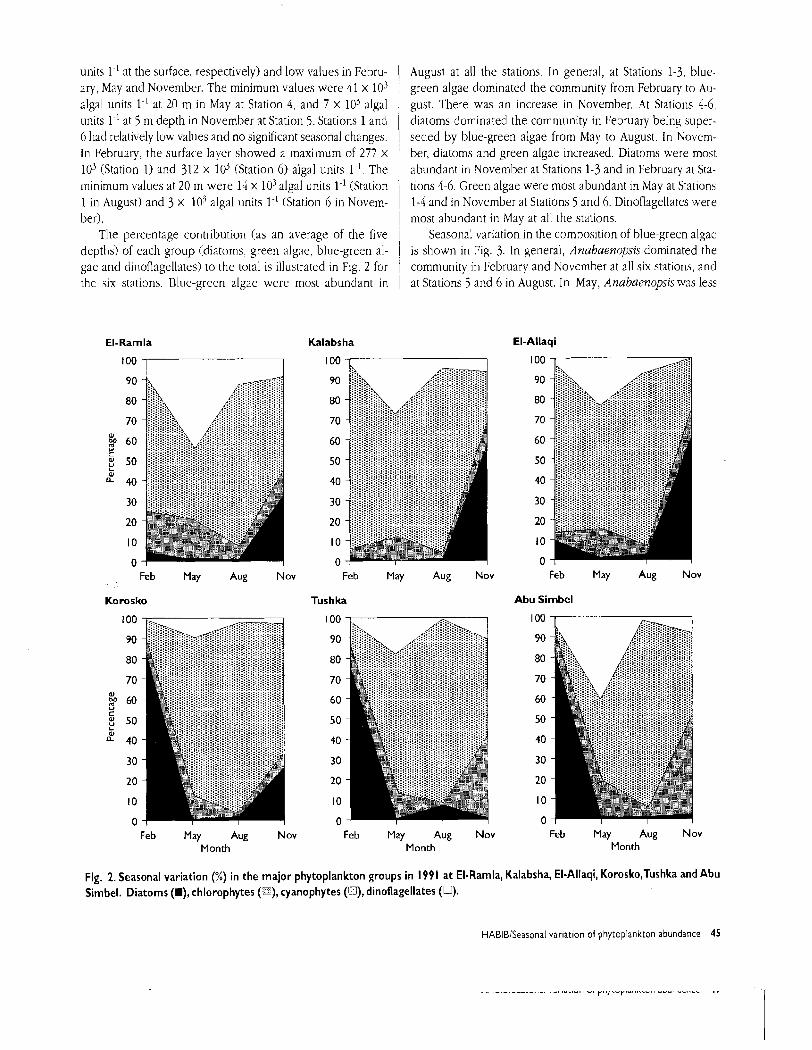
units 1.' at the surface, respectively) and low values in Febru- ary, May and November. The minimum values were 41 x 103 algal units 1-' at 20 m in May at Station 4, and 7 x lo3 algal units 1.' at 5 m depth in November at Station 5. Stations 1 and 6 had relalively low values and no significant seasonal changes. In February, the surface layer showed a maximum of 277 x lo3 (Station 1) and 312 x lo3 (Station 6) algal units 1.'. The minimum values at 20 m were 14 x lo3 algal units 1.' (Station 1 in August) and 3 x lo3 algal units 1.' (Station 6 in Novem- ber).
The percentagt. contribution (as an average of the five depths) of each group (diatoms, green algae, blue-green al- gae and dinoflagellates) to the total is illustrated in Fig. 2 for the six stations. Blue-green algae were most abundant in
El-Ramla
Feb May Aug Nov
Korosko
Feb May Aug Nov Month
August at all the stations. In general, at Stations 1-3, blue- green algae dominated the community from February to Au- gust. There was an increase in November. At Stations 4-6. diatoms dominated the community in February being super- seded by blue-green algae from May to August. In Novern- ber, diatoms and green algae increased. Diatoms were most abundant in November at Stations 1-3 and in February at Sta- tions 4-6. Green algae were most abundant in May at Stations 1-4 and in November at Stations 5 and 6. Dinoflagellates were most abundant in May at all the stations.
Seasonal variation in the composition of blue-green algae is shown in Fig. 3. In general, Anabaenopsis dominated the community in February and November at all six stations, and at Stations 5 and 6 in August. In May, Anabaenopsis was less
Kalabsha El-Allaqi
Feb May Aug Nov Feb May Aug Nov
Tushka Abu Simbel
Feb May Aug Nov Feb May Aug Nov Month Month
Fig. 2. Seasonal variation (%) in the major phytoplankton groups in 1991 at El-Rarnla, Kalabsha, El-Allaqi, Korosko,Tushka and Abu Simbel. Diatoms (B), chlorophytes (G), cyanophytes (O), dinoflagellates (a).
HABIBlSeasonal variation of phytoplankton abundance 45
Primary Production of the Phytoplankton
O.A. Habib Fishery Management Center, High Dam lake Development Authority,Aswan, Egypt
Habib, O.A. 2000. Primary production of the phytoplankton, p. 5 1-55. In J.F. Craig (ed.) Sustainable fish production in Lake Nasser: ecological basis and management policy. ICLARM Conf. Proc. 6 1,184 p.
ABSTRACT
Phytoplankton primary production was estimated at six stations,from El Ramla in the north toAbu Simbel in the south, along the main channel of Lake Nasser from September 1986 to August 1987. Gross and net production (gC m-2 day") was generally high in September or October and April or May and low in August, ranging from 1.0 in August at Station 5 to 27.4 in April at Station 2 for gross production, and from 0.7 in August to 23.8 in September at Station 5 for net production. Respiration (gC m-I day-') ranged from 0.3 in September at Station I and in August at Station 5 to 12.5 in April at Station 2.
Introduction Primary production is one of the most important sources
of energy input to freshwater ecosystems and has been stud- ied largely to obtain basic information on carbon transfer. Primary production can be measured through carbon uptake, oxygen production or the formation of organic compounds. The classic procedure for determining the oxygen content (oxygen production) of natural water is the "light-and-dark" bottle technique (Vollenweider 1969). This paper describes primary productivity and respiration by the phytoplankton as measured by the light-and-dark bottle technique at six sta- tions in the main channel of Lake Nasser from September 1986 to August 1987. The data given in this paper are the first to be published for Lake Nasser since Samaan (1971).
Methods Water samples were collected monthly with a van Dorn-
type water sampler at six stations: El-Ramla, Kalabsha, El- Allaqi, Korosko, Tushka and Abu Simbel (see El Shahat, this vol., p. 4) from September 1986 to August 1987. The primary production of phytoplankton was estimated by the chloro- phyll a method according to Ishimura et al. (1962) and Aruga (1966). The photosynthetic and respiratory activities of phy- toplankton were measured to obtain photosynthesis-light curves on a chlorophyll a basis. The diurnal changes of light
intensity were measured with a lux meter and the attenuation of light in water was estimated from the Secchi disc depth. The relative intensity (RLI) at depths of sampling was deter- mined from the light attenuation in water; the depth for 1% RLI (Dl%) is approximately three times the Secchi disc depth. The absolute light intensity at each depth for every hour of the day was calculated using the diurnal changes of light intensity in accordance with RLI and the hourly gross photo- synthesis at each depth was read from the photosynthesis- light curve according to the respective light intensity. The hourly gross photosynthesis at each depth was summed from sunrise to sunset or from sunrise to noon and multiplied by 2, to obtain the daily gross production at each depth and the daily gross production at each depth was multiplied by the chlorophyll a concentration at respective depth to obtain the daily gross production per m3. Daily gross production at each depth was integrated from the surface to the lower limit of the euphotic zone to obtain the daily gross production per m2 of the surface. The hourly respiration on a chlorophyll a basis was multiplied by the chlorophyll a concentration at each depth and by 24 to obtain the daily respiration per m3 at respective depth. The daily respiration of each depth was integrated from the surface to the lower limit of the euphotic zone to obtain the daily respiration per m2 of the surface. The difference between the daily gross production and the daily respiration was taken at each depth to obtain the daily net
HABIBIPrimary production of the phytoplankton 5 1
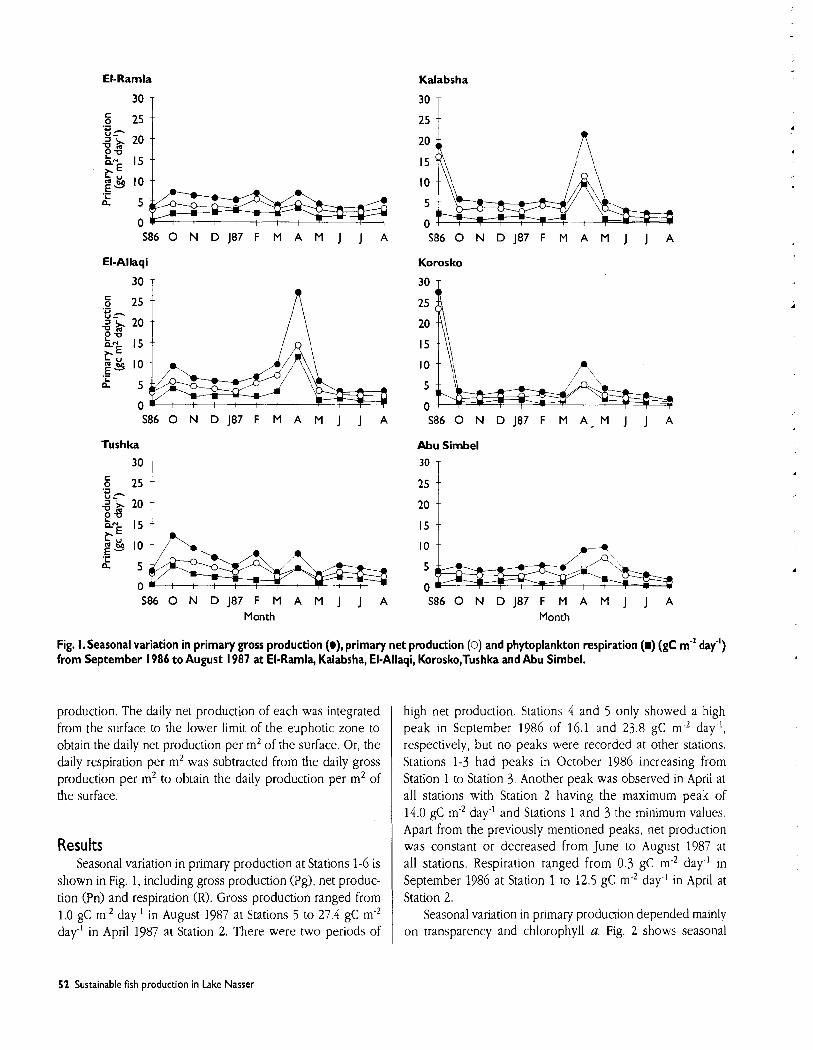
El-Ramla
30 1 Kalabsha
S 8 6 O N D j 8 7 F M A M j j A
El-Allaqi
30 T
S 8 6 O N D J 8 7 F M A M J J A Month
Korosko
30
25
20
15
10
5
0
Abu Simbel
30 T
S86 0 N D J 8 7 F M A M J j A Month
Fig. I. Seasonal variation in primary gross production (@), primary net production (0) and phytoplankton respiration (I) (gC mS2 day") from September 1986 to August 1987 at El-Ramla, Kalabsha, El-Allaqi, Korosko,Tushka and Abu Simbel.
production. The daily net production of each was integrated from the surface to the lower limit of the euphotic zone to obtain the daily net production per m2 of the surface. Or, the daily respiration per m2 was subtracted from the daily gross production per m2 to obtain the daily production per m2 of the surface.
Results Seasonal variation in primary production at Stations 1-6 is
shown in Fig. 1, including gross production (Pg), net produc- tion (Pn) and respiration (R). Gross production ranged from 1.0 gC m-2 day-' in August 1987 at Stations 5 to 27.4 gC m-2 day-' in April 1987 at Station 2. There were two periods of
high net production. Stations 4 and 5 only showed a high peak in September 1986 of 16.1 and 23.8 gC m-* day-', respectively, but no peaks were recorded at other stations. Stations 1-3 had peaks in October 1986 increasing from Station 1 to Station 3. Another peak was observed in April at all stations with Station 2 having the maximum peak of 14.0 gC m-2 day-' and Stations 1 and 3 the minimum values. Apart from the previously mentioned peaks, net production was constant or decreased From June to August 1987 at all stations. Respiration rqnged from 0.3 gC m-2 day-' in September 1986 at Station 1 to 12.5 gC m-2 day-' in April at Station 2.
Seasonal variation in primary production depended mainly on transparency and chlorophyll a. Fig. 2 shows seasonal
52 Sustainable fish production in Lake Nasser
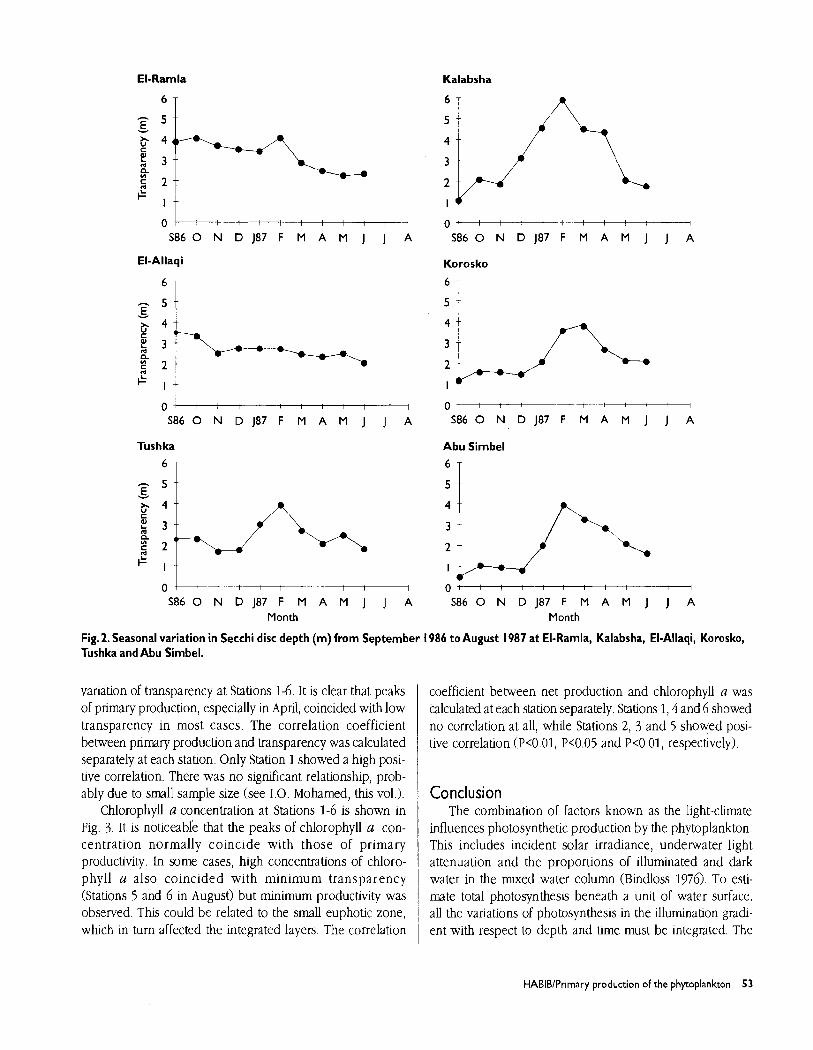
El-Ramla
V
Kalabsha
El-Allaqi
T Korosko
T
Tushka
T
- 5 E V
Abu Simbel
T
-- 5 t
Fig. 2. Seasonal variation in Secchi disc depth (m) from September 1986 to August 1987 at El-Ramla, Kalabsha, El-Allaqi, Korosko, Tushka and Abu Simbel.
'A c 2
-- 5 E -
variation of transparency at Stations 1-6. It is clear that peaks of primary production, especially in April, coincided with low transparency in most cases. The correlation coefficient between primary production and transparency was calculated separately at each station. Only Station 1 showed a high posi- tive correlation. There was no significant relationship, prob- ably due to small sample size (see 1.0. Mohamed, thls vol.).
Chlorophyll a concentration at Stations 1-6 is shown in Fig. 3. It is noticeable that the peaks of chlorophyll a con- centration normally coincide with those of primary productivity. In some cases, high concentrations of chloro- phyll a also coincided with minimum transparency (Stations 5 and 6 in August) but minimum productivity was observed. This could be related to the small euphotic zone, which in turn affected the integrated layers. The correlation
--
-- 5 --
coefficient between net production and chlorophyll a was calculated at each station separately. Stations 1 , 4 and 6 showed no correlation at all, while Stations 2, 3 and 5 showed posi- tive correlation (P(0.01, P(0.05 and P<0.01, respectively).
cC 1 . . :; I
x 4 --
u C 4 --
3 --
2 -- L,
I - - '.
I --
4 0 1 - - t - 1 ' t-I O l i i i i i i i i i i l
S86O N D J87 F M A M J j A S86O N D l 8 7 F M A M j j A Month Month
Conclusion The combination of factors known as the light-climate
influences photosynthetic production by the phytoplankton. This includes incident solar irradiance, underwater light attenuation and the proportions of illuminated and dark water in the mixed water column (Bindloss 1976). To esti- mate total photosynthesis beneath a unit 01 water surface. all the variations of photosynthesis in the illumination gradi- ent with respect to depth and time must be integrated. The
HABIBIPrirnary production of the phytoplankton 53
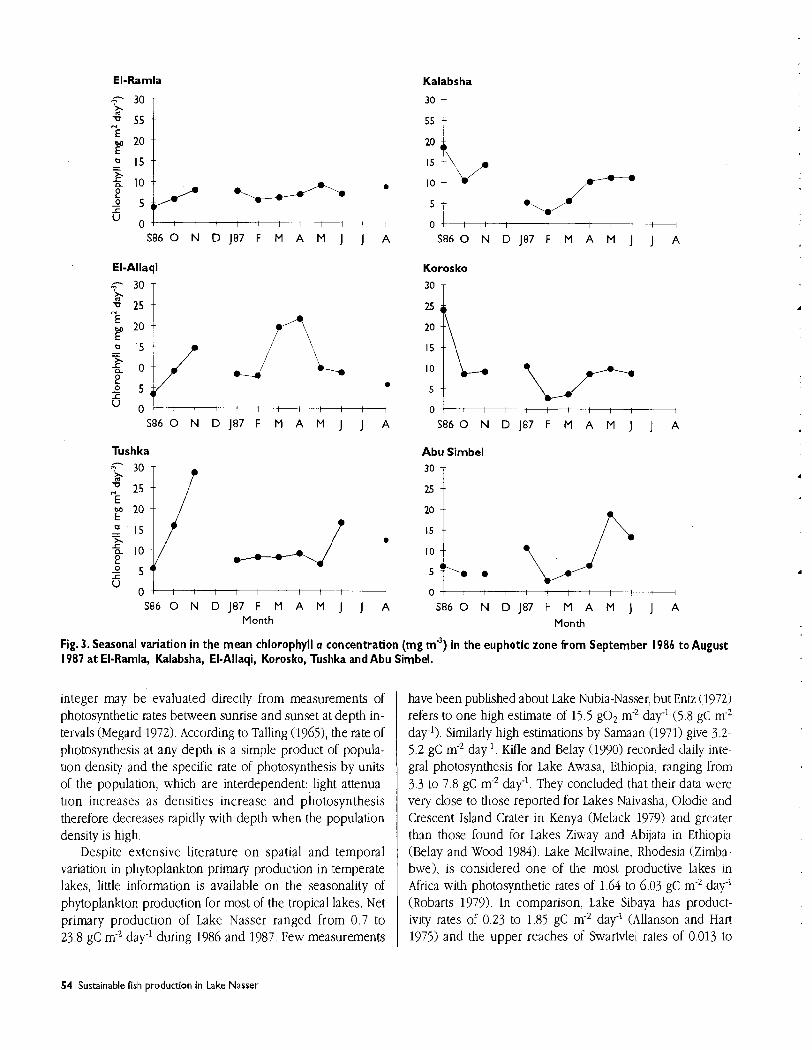
El-Ramla Kalabsha
:: 7
El-Allaqi -- 30 T
Koros ko
30 T
S 8 6 O N D J 8 7 F M A M J J A S 8 6 O N D J87 F M A M J j A
Tushka Abu Simbel
S 8 6 O N D J 8 7 F M A M j J A S 8 6 O N D J 8 7 F M A M J ] A Month Month
Fig. 3. Seasonal variation in the mean chlorophyll a concentration (mg mJ) in the euphotic zone from September 1986 to August 1987 at El-Ramla, Kalabsha, El-Allaqi, Korosko, Tushka and Abu Simbel.
integer may be evaluated directly from measurements of photosynthetic rates between sunrise and sunset at depth in- tervals (Megard 1972). According to Talling (1965), the rate of photosynthesis at any depth is a simple product of popula- hon density and the speclfic rate of photosynthesis by units of the population, which are interdependent: light attenua- tion increases as densities increase and photosynthesis therefore decreases rapidly with depth when the population density is high.
Despite extensive literature on spatial and temporal variation in phytoplankton primary production in temperate lakes, little information is available on the seasonality of phytoplankton production for most of the tropical lakes. Net primary production of Lake Nasser ranged from 0.7 to 23.8 gC m-2 day" during 1986 and 1987. Few measurements
have been published about Lake Nubia-Nasser, but Entz (1972) refers to one high estimate of 15.5 go2 m-2 day-' (5.8 gC rn-2 day-'). Similarly high estimations by Samaan (1971) give 3.2- 5.2 gC m-2 day-'. Kfle and Belay (1990) recorded daily ink- gral photosynthcsis for Lake Awasa, Ethiopia, ranging from 3.3 to 7.8 gC m'2 day". They concluded that their data were very close to those reported for Lakes Naivasha, Olodie and Crescent Island Crater in Kenya (Melack 1979) and greater than those found for Lakes Ziway and Abijata in Ethiop~a (Belay and Wood 1984). Lake McIlwaine, Rhodesia (Zimba- bwe), is considered one of the most productive lakes in Africa with photosynthetic rates of 1.64 to 6.03 gC m-2 day" (Robarts 1979). In comparison, Lake Sibaya has product- ivity rates of 0.23 to 1.85 gC m-2 day.' (Allanson and Hart 1975) and the upper reaches of Swartvlei rates of 0.013 to
54 Sustainable fish production in Lake Nasser
0.017 gC m-2 hour-' (Robarts 1976). Talling (1965) recorded daily rates between 4.0 and 6.0 gC m-2 day-' in a number of east African lakes, and Melack and Kilham (1974) found rates of 0.3 to 2.0 g o 2 m-2 day-' (1.2-7.5 gC m-2 day-') for a number of east African alkaline, saline lakes. G a d (1975) found that the mid-day integral photosynthetic rate in Lake George, Uganda, was between 1 and 2 go, m-2 hour-' (375-750 mgC m-2 hour-I). Perhaps the most productive lake in Africa is Lake Arangudi, an Ethiopian soda lake, for w h c h Talling et al. (1973) reported a productivity of 43-57 go, m-2 day-' (16- 21 gC m-2 day-'). Lewis (1974) found the average net primary production of 1.7 gC m-2 day-' for Lake Lanao, Philippines, which is considered to be one of the most productive lakes. This was similar to Lake Victoria with 1.7-3.8 gC m-2 day-' (Talling 1965).
References Allanson, R . R . and R.C. Hart. 1975. The primary production of Lake
Sibaya, KwaZulu, South Africa. Verh. Int. Ver. Limnol. 17:1426- 1433.
Aruga, Y. 1966. Ecological studies of photosynthesis and matter production of phytoplankton. 111. Relationship bctwcen chloro- phyll amount in water and primary productivity. Bot. Mag.
b Tokyo 7920-27. Belay, A. and R.B. Wood. 1784. Primary productivity of five
Ethiopian rift valley lakes. Verh. Int. Ver. Limnol. 221187-1192. Bindloss, M.E. 1976. The light-climate of Loch Leven, a shallow
Scottish lake, in relation to primary production by phytoplank- ton. Freshwat. Biol. 6501-518.
Entz, B.A.G. 1972. Composition of the physical and chemical envi- b ronments of Volta Lake and Lake Nasser, p. 883-892. In 2. Kajak
and A. Hillbricht-Ilkowska (eds.) Productivity problems of fresh- waters. Waraszawa, Krakow.
C h f . G.G. 1975. Photosynthesis production and irradiance-photo- synthesis relationships of the phytoplankton from a shallow equatorial lake (Lake George, Uganda). Oecologia 18:165-183.
Ishimura, S., Y. Saijo and Y. Aruga. 1762. Photosynthetic character- istics of marine phytoplankton and their ecological meaning in the chlorophyll method. Bot. Mag. (Tokyo) 75:212-220.
Kifle, D. and A. Belay. 1770. Seasonal variation in phytoplankton primary production in relation to light and nutrients in Lake Awasa, Ethiopia. Hydrobiologia 196:217-227.
Lewis, W.M., Jr. 1974. Primary production in the plankton community of a tropical lake. Ecol. Monogr. 44:377-409
Megard, R.O. 1772. Phytoplankton, photosynthesis and phospho- rus in Lake Minnetonka, Minnesota. Limnol. Oceanogr. 17:68- 87.
Melack, J.M 1977. Photosynthetic rates of four tropical African freshwaters. Freshwat. Biol. 9:555-571.
Melack, J.M. and P. Kilham. 1774. Photosynthetic rates of phytoplank- ton in east African alkaline, saline lakes. Limnol. Oceanogr. 19743-755.
Robarts, R.D. 1976. Primary productivity of the upper reaches of a south African estuary (Swartvlei). J. Exp. Mar. Biol. Ecol. 24:93- 102.
Robarts, R.D. 1779. Underwater light penetration, chlorophyll a and primary production in a tropical African lake (Lake McIlwaine, Rhodesia). Arch. Hydrobiol. 86:423-444.
Samaan, A.A. 1971. Report on the trip of Lake Nasser to investigate its primary productivity during March 1971. Report for Lake Nasser Development Center, Aswan. 11 p.
Talling, J.F. 1965. The photosynthetic activity of phy~oplankton in east African lakes. 1nt. Rev. Gesamt. ~ ~ d r o b i o l . 50:l-31.
1 Talling, J.F., R.B. Wood, M.V. Prosser and R.M. Baxter. 1973.
I The upper limit of photosynthetic activity by phytoplankton: evidence from Ethiopian soda lakes. Freshwat. Biol. 3: 53-76.
Vollenweider, R.A. 1969. A manual on methods for measuring i primary production in aquatic environments. IBP handbook No.
12. Blackwell Scientific, Oxford. 213 p.
HABIBIPrimary production of the phytoplankton 55
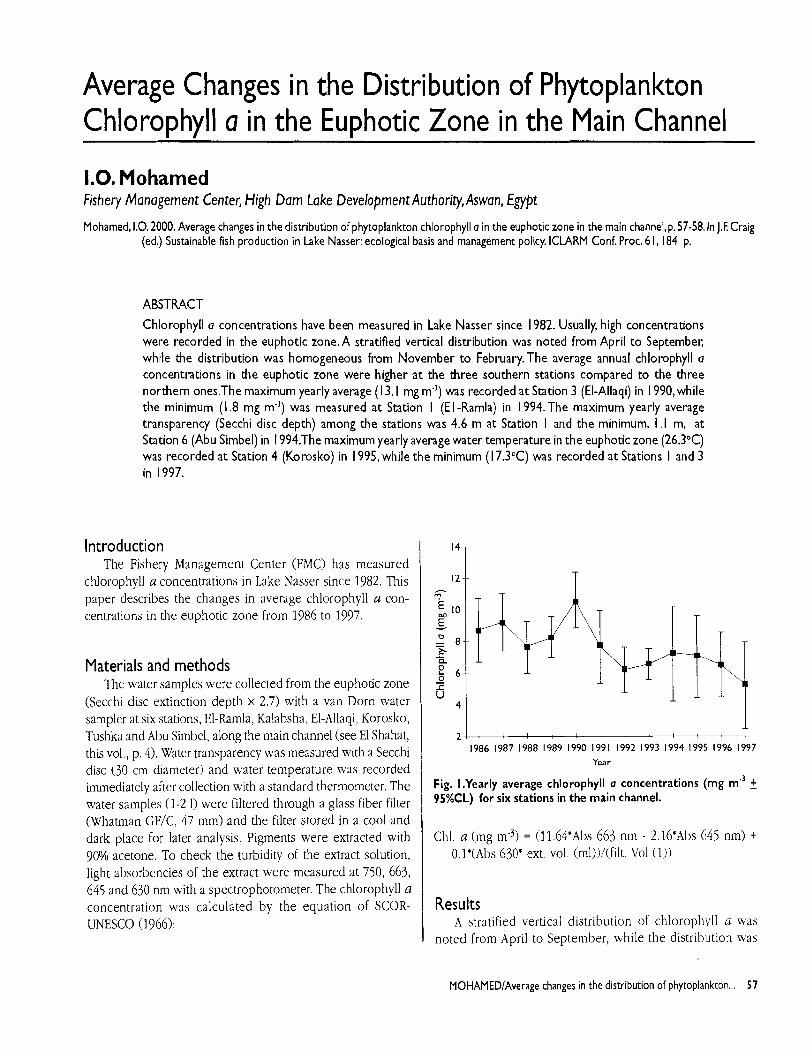
Average Changes in the Distribution of Phytoplankton Chlorophyll a in the Eu~hotic Zone in the Main Channel
1.0. Mohamed Fishery Management Center, High Dam lake DevelopmentAuthority,Aswan, Egypt
Mohamed, l.0.2000. Average changes in the distribution of phytoplankton chlorophyll a in the euphotic zone in the main channel,^. 57-58. In J.F. Craig (ed.) Sustainable fish production in Lake Nasser: ecological basis and management policy. ICLARM Conf. Proc. 61, 184 p.
ABSTRACT
Chlorophyll a concentrations have been measured in Lake Nasser since 1982. Usually, high concentrations were recorded in the euphotic z0ne.A stratified vertical distribution was noted from April to September, while the distribution was homogeneous from November to February.The average annual chlorophyll a concentrations in the euphotic zone were higher at the three southern stations compared to the three northern ones.The maximum yearly average (1 3.1 mg m 7 was recorded at Station 3 (El-Allaqi) in 1990, while the minimum (1.8 mg m-9 was measured at Station I (El -Ramla) in 1994. The maximum yearly average transparency (Secchi disc depth) among the stations was 4.6 m a t Station I and the minimum, I .I m, at Station 6 (Abu Simbel) in 1994.The maximum yearly average water temperature in the euphotic zone (26.3"C) was recorded a t Station 4 (Korosko) in 1995, while the minimum ( 1 7.3"C) was recorded at Stations I and 3 in 1997.
Introduction The Fishery Management Center (FMC) has measured
chlorophyll a concentrations in Lake Yasser since 1982. This paper describes the changes in average chlorophyll a con- centrations in the euphotic zone from 1986 to 1997.
Materials and methods The water samples were collected from the euphotic zone
(Secchi disc extinction depth x 2.7) with a van Dorn water sampler at six stations, El-Ramla, Kalabsha, El-Allaqi, Korosko, Tushka and Abu Simbel, along the main channel (see El Shahat, this vol., p. 4). Water transparency was measured with a Secchi disc (30 cm diameter) and water temperature was recorded immediately after collection with a standard thermometer. The water samples (1-2 1) were filtered through a glass fiber filter (Whatman GF/C, 47 mm) and the filter stored in a cool and dark place for later analysis. Pigments were extracted with 90% acetone. To check the turbidity of the extract solut~on, light absorbencies of the extract were measured at 750, 663, 645 and 630 nm with a spectrophotometer. The chlorophyll a concentration was calculated by the equation of SCOR- UNESCO (1966):
I986 1987 I988 1989 1990 1991 1992 1993 1994 1995 1996 1997 Year
Fig. I .Yearly average chlorophyll o concentrations (mg m'3 2 95%CL) for six stations in the main channel.
Chl. a (mg m-3) = (11.64*Abs 663 nm - 2.16*Abs 645 nm) t O.l*(Abs 630* ext. vol. (ml))/(filt. Vol (1))
Results A stratified vertical distribution of chlorophyll n was
noted from April to September, while the distribution was
MOHAMEDlAverage changes in the distribution of phytoplankton ... 57
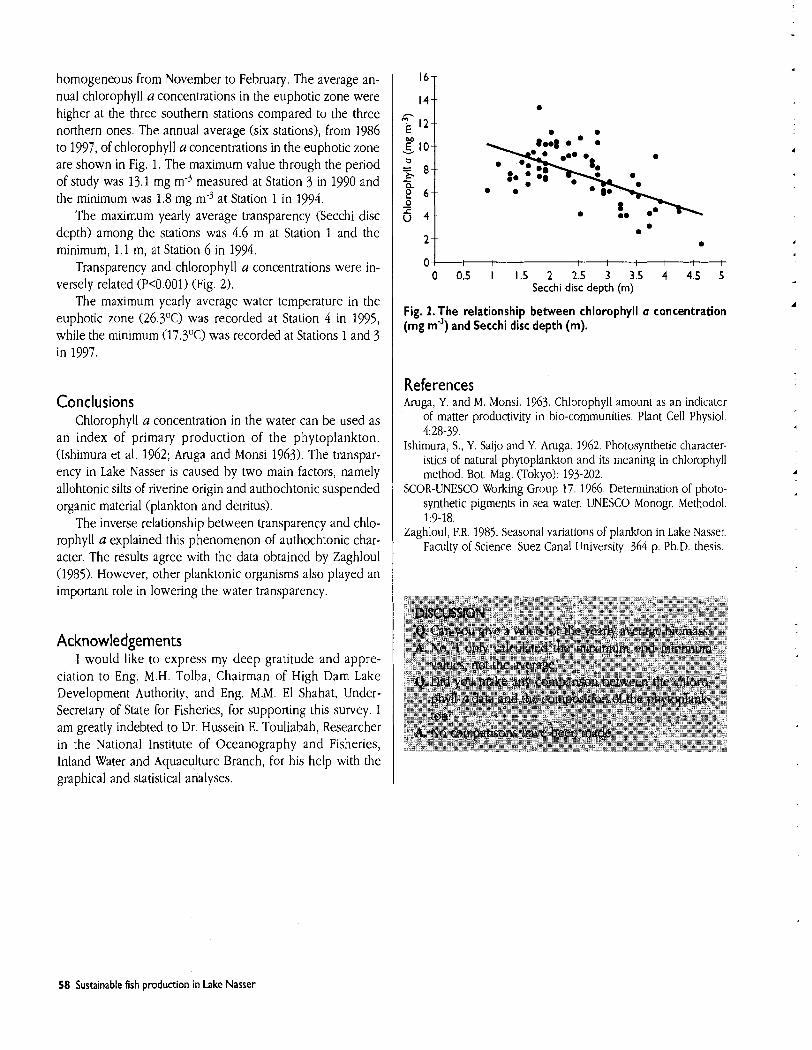
homogeneous from November to February. The average an- nual chlorophyll a concentrations in the euphotic zone were higher at the three southern stations compared to the three northern ones. The annual average (six stations), from 1986 to 1997, of chlorophyll a concentrations in the euphotic zone are shown in Fig. 1. The maximum value through the period of study was 13.1 mg m3 measured at Station 3 in 1990 and the minimum was 1.8 mg m-3 at Station 1 in 1994.
The maximum yearly average transparency (Secrhi disc depth) among the stations was 4.6 m at Station 1 and the minimum, 1.1 m, at Station 6 in 1994.
Transparency and chlorophyll a concentrations were in- versely related (P<0.001) (Fig. 2).
The maximum yearly average water temperature in the euphotic zone (26.3OC) was recorded at Station 4 in 1995, while the minimum (17.3'C) was recorded at Stations 1 and 3 in 1997.
Conclusions Chlorophyll a concentration in the water can be used as
an index of primary production of the phytoplankton. (Ishimura et al. 1962; Aruga and Monsi 1963). The transpar- ency in Lake Nasser is caused by two main factors, namely allohtonic silts of riverine origin and authochtonic suspended organic material (plankton and detritus).
The inverse relationship between transparency and chlo- rophyll a explained this phenomenon of authochtonic char- acter. The results agree with the data obtained by Zaghloul (1985). However, other planktonic organisms also played an important role in lowering the water transparency.
Acknowledgements I would like to express my deep gratitude and appre-
ciation to Eng. M.H. Tolba, Chairman of High Dam Lake Development Authority, and Eng. M.M. El Shahat, Under- Secretary of State for Fisheries, for supporting this survey. I am greatly indebted to Dr. Hussein E. Touliabah, Researcher in the National Institute of Oceanography and Fisheries, Inland Water and Aquaculture Branch, for his help with the graphical and statistical analyses.
o ! I I I I I I I I
0 0.5 1 1.5 2 2.5 3 3.5 4 4.5 5 Secchi disc depth (rn)
Fig. 2.The relationship between chlorophyll a concentration (mg m") and Secchi disc depth (m).
References Aruga, Y, and M. Monsi. 1963. Chlorophyll amount as an indicator
of matter productivity in bio-communities. Plant Cell Physiol. 4:28-39.
Ishimura, S., Y. Saijo and Y. Aruga. 1962. Photosynthetic character- istics of natural phytoplankton and its meaning in chlorophyll method. Bot. Mag. (Tokyo): 193-202.
SCOR-UNESCO Working Group 17. 1966. Determination of photo- synthetic pigments in sea water. UNESCO Monogr. Methodol. 1:9-18.
Zaghloul, F.R. 1985. Seasonal variations of plankton in Lake Nasser. Faculty of Science, Suez Canal University. 364 p. Ph.D. thesis
58 Sustainable fish production in Lake Nasser
Microcystis aeruginosa Kutz Water Blooms
1.0. Mohamed' and T. loriya2 'Fishery Management Center, High Dam lake Development Authority, Aswan, Egypt 'Tokyo University of Fisheries, Tokyo, lapon Mohamed, 1.0. and T. loriya. 2000. Microcystis aeruginosa Kutz water blooms, p. 59-60. In J.F. Craig (ed.) Sustainable fish production in Lake Nasser:
ecological basis and management policy. ICLARM Conf. Proc. 6 1,184 p.
ABSTRACT After the construction of the Aswan High Dam,water blooms of Microcystis aeruginosa were observed only at the southern end o f the lake between Wadi Halfa and Abu Simbel. Recently, water blooms were observed in the central area of the lake.Vet-y occasionally, they were seen a t Korosko in the nor thern area. Formerly, M. aeruginosa water blooms occurred annually fo r several months before the floodwater period, but now they
occur intermittently all the year round.
Introduction I Table I. Date, location and surface water temperature when water
After the construction of the Aswan High Dam, extensive water blooms of Microcystis aemrginosa Kutz were common every year, for several months before the flood period, in the southern areas of the lake between Wadi Halfa in Lake Nubia (Sudan) and Abu Simbel in Lake Nasser. An investigation was initiated to monitor the temporal and spatial changes of these blooms.
Materials and methods Since 1985, monthly surveys have been conducted to iden-
tify water blooms in the main channel of Lake Nasser from the Aswan High Dam to Abu Simbel (see El Shahat, this vol., p. 4). When blooms were observed, water samples were col- lected in plastic buckets, fixed with 10% formalin and stored in sample bottles. In the laboratory, identification and count- ing of each species was undertaken.
Results The dates when M. aeruginosa blooms were observed
are shown in Table 1. The size of water bloom patches varied from a few centimeters to 35 m in diameter and the blooms were usuaily found to be at <1 cm depth. The largest blooms were observed on 11 December 1989, when patches of plants were distributed over a length of 125 km, from El-Seboa to Abu Simbel. M. aeruginosa was the dominant species.
/ blooms were observed.
Date --
Locat~on Water temperature ("C)
19 Aug 1987 I9 Aug 1 987 I6 Aug I988 9 Sep 1989 I I Dec 1989 I I Dec 1989 I I Dec 1989 22 May 1990 l4Aug 1991 16 Oct 1992 I6 Oct 1992 19 Feb 1993
Abu Simbel Tushka Korosko Tushka Abu Simbel Tushka El-Seboa Korosko Abu Simbel Abu Simbel Wadi El Arab Korosko
25 Aug 1993 Tushka 28.5 26 Feb 1994 Tushka -
On 9 September 1989 at Tushka, Oscillatoria tenuis was domi- nant although M. aeruginosa still was >40%. As shown in Table 1, the occurrences of water blooms were not restricted to any particular season, but tended to be more common in the month just before the flood period (from late summer to early autumn).
Conclusions Reports of water blooms in Lake Nasser are few (Entz
1976). Since 1965, when Lake Nasser was filled, extensive water blooms of M. aermginosa were observed annually for
MOHAMED and lORlYAlMicrocystis aeruginosa Kutz water blooms 59
several months before the flood water period only in Lake Nubia and in the southern areas of Lake Nasser, between Wadi Halfa and Abu Simbel (Entz 1976). Before 1987, the occurrence of the water blooms was restricted to the area south of Tushka and Abu Simbel. From the results, 12 occur- rences of water blooms were observed in the area between Abu Simbel and Korosko and only two occurrences were seen in the areas north of Korosko. The northern movement of water blooms is gradual. It took about 20 years to move from Abu Simbe! to Korosko. Korosko is situated at the Great Bend of the lake, which forms a kind of "threshold" for phy- toplankton distribution (Habib et al. 1990). The water bloom has only been observed twice in the region north of Korosko but the spread appears to be accelerating. The seasonality of water bloom outbreaks has disappeared.
At present, Lake Nasser is almost totally devoid of indus- trial pollution and nutrient enrichment from agricultural run- off. However, monitoring the occurrence of water blooms in Lake Nasser in relation to eutrophication must be continued. Hammerton (1963) pointed out that even a very mild degree of eutrophication from industrial development could have a serious effect on the Nile because of the high temperature and high radiation inputs.
Acknowledgements The authors are greatly indebted to the captain and crew
of the research vessel El Sadaka for their kind efforts. Mr Abu El Wafa Hassan and Mr h b i e Said Ahmed are also acknowledged for their help during the work.
References Entz, B.A.G. 1976. Lake Nasser and Lake Nubia, p. 271-298, In
1, Rzoska (ed) The Nile: biology of an ancient river. Junk. The Hague.
Habib, O.A., 1.0. Mohammed, S.M. Mohamed and Y. Aruga. 1990. Seasonal changes of rhe Secchi disc depth and suspended solid at six stations along the main channel of the High Dam Lakr, Egypt. La mer (Bull. Soc. Franco-Jap.) 28:37-47.
Hammerton, D. 1963. A longitudinal survey of the main Nile, p. 8-1 1. In Annual Report. Hydrobiology Research Unit, Univer- sity of Khartoum.
60 Sustainable fish production in Lake Nasser
Aquatic Macrophytes in Egyptian Nubia Pre- and Post-formation of Lake Nasser
M.M.Ali South Valley University,Aswan, Egypt
Ali, M.M. 2000.Aquatic macrophytes in Egyptian Nubia pre- and post-formation of Lake Nasser, p. 61 -65. In J.F. Craig (ed.) Sustainable fish production in Lake Nasser: ecological basis and management policy. ICLARM Conf. Proc. 6 1, 184 p.
ABSTRACT
The paper gives an account of the dynamic changes in the Lake Nasser aquatic macrophyte communities in relation to water and hydrosoil physical and chemical characteristics.Two types of aquatic macrophyte changes were recognized: changes due to alteration of the Nile system in Egyptian Nubia from "lotic" or"fluviatile" to "lentic" or"lacustrine" and changes due to the continuous alteration in the physical and chemical character- istics of water and hydrosoil. Literature and field surveys suggest that major changes have occurred in the aquatic macrophytes in Lake Nasser following completion of the Aswan High Dam in 1964. However, recent changes in the submerged macrophyte communities in the lake appear to be related to physical factors (e.g., water level fluctuations and human activities).
Introduction Aquatic submerged macrophytes can cause weed prob-
lems by the growth of dense vegetation that interferes with irrigation and hydroelectric schemes, fisheries and/or naviga- tion. On the other hand, they are beneficial to the aquatic system because they produce oxygen, purify the water by trapping silt particles, take up toxic substances and provide habitats for fish fry and other organisms.
Profound changes can occur to the flora of a system after the building of dams and the impoundment of water. Rorslett (1989) summarized the changes in vegetation, following im- poundment for hydroelectric schemes as: (a) a decline in spe- cies richness; (b) the gradual disappearance of the shallow water and mid-depth communities; (c) a conspicuous absence of submerged vascular macrophytes in storage hydroelectric lakes when lake levels are >7 m annually; and (d) an increase in the incidence of species possessing strategies of the rud- era1 (R) type.
Morphological changes in the river may occur as a result of changes in the flow regime. An increase in the flow can cause erosion of river banks and result in a reduction of the mean size of particles remaining. Alternatively, reduced flows can result in sedimentation with decreasing substrate diver- sity Ueffries and Mills 1990). After impoundment, resulting
either in reservoir formation or in raising the level of an exist- ing lake, there is usually an increase in the total biological productivity, with a risk of eutrophication due to leaching of nutrients from the newly inundated ground.
Methods Information on the past distribution of aquatic plants In
Egyptian Nubia before the formation of Lake Nasser is based on literature records. However, data on distribution and ecol- ogy of aquatic plants after formation are mainly derived from surveys. Sampling of the euhydrophyte communities was undertaken during three sampling periods, 1984-1986 (at 18 stations), 1988-1990 (at 17 stations) and 1993-1994 (at three stations) (see El Shahat, this vol., p. 4) .
Submerged macrophytes were sampled using a replicated grapnel-sampling technique (Murphy et al. 1981). Thc grap- nel was attached to a wooden pole and collected both foliage from the water column and overwintering vegetation and roots buried in the sediment. In the laboratory, plants from each grapnel haul were washed to remove mud, stones, mollusc shells and aquatic invertebrates. Plants were separated into different taxa, identified after Tackholm (1974), Moore (1986) and Triest (19891, and a list of species was recorded.
ALllAquatic rnacrophytes in Egyptian Nubia 61
Standing crop dry weight of each species per grapnel haul was determined after air-drying.
Results
Aquatic macrophytes In 1962-1964, several expeditions of Egyptian and Euro-
pean botanists explored the Nubian area. The part of the Nile valley, which was to become Lake Nasser, had a relatively rich submerged and emergent flora (57 species, of which six were euhydrophytes: Alisma gramineum Lejeune, Damosonium alisma Mill, var. compactum, Potamogeton crispus L., P, pectinatus L., P, perfoliatus L . and Zannichellia palustris L.) (Boulos 1967). Similar data were presented by other authors (e.g., Aballah and Sa'ad. 1972; Ahti et al. 1973; El-Hadidi 1976) from studies during the same period.
After the construction of the Aswan High Dam, two euhydrophyte species (A. gramineum and D. alisma) appear to have been lost from the region, but the other four species have colonized the lake, with varying degrees of success.
In 1967. Vallisneria spiralis L. was recorded for the first time in Egypt (El-Hadidi 1968; El-Hadidi and Ghabbour 1968). In 1978-1986, eight species were recorded (Ali 1987; Springuel and Murphy 1991). Five of them (Potamogeton schxeinfurthii, Najas horrida, N. marina subsp. armata and Nitella hyalina)
were new to the area (see Table 1). Sixteen sites were visited during the 17-month period from November 1988 to March 1990 and the results are given in Table 2. In November 1988, no aquatic vegetation was recorded at any of the Lake Nasser sites.
In February 1989, seedlings of N. marina subsp. armata appeared in both shallow and deepwater zones. Z. palustris was also observed. In May 1989, Najas marina subsp. armata became more abundant and reached its highest biomass of 507g m-* (Table 3). N. horrida and N. hyalina were com- monly found. In September 1989, 1/: spiralis dominated the aquatic plant community at the Amada site, which is situated in the middle section of the lake. In October 1989, N. hyalina disappeared and N. marina subsp. armata became domi- nant. In March 1990, the abundance of N. horrida increased and became dominant at some sites.
From Table 2, the following may be inferred: (a) N. ma- rina dominated the deepwater zone at all sites (except at Amada, where it was dominated by V. spiralis) and (b) the aquatic vegetation was more abundant in deep than in shal- low water.
In 1993-1994, the author surveyed the northern sector of Lake Nasser from the Aswan High Dam to El-Allaqi. Dense cover of two "nuisance species" was recorded, Myrophyllurn spicatum L , in Abu Hor and Ceratophyllum demersum L . at the Aswan High Dam port in addition to N hom'da, N. marina
Table I. Freshwater macrophyte species recorded in Egyptian Nubia pre- and post-formation of the Aswan High Dam in 1964.
Species 1962-1 964 1966-1 967 1978-1 986 1988- 1990 1993- 1994
Alsirno grornineurn + Dornosoniurn olisrno var. cornpocturn + Potornogeton perfoliotus + F! crispus + F pectinatus + Zonnichellio polustris + Vollrsnerro sprrolrs F! trichoides F! schweinfurthiia Nojos horridob N. rnorino subsp. orrnoto Nitello hyalino' Myrophyllurn spicaturn Cerotophyllurn dernersurn
' This specles was misidentified as Potornogeton nodosus. This species was rnis~dentified as Nojos pect~nolis (All 1987). This species was rnis~dentified as Choro sp.in Springuel and Murphy (1990). Sources: a) Pre-inundation, 1962-1964 Boulos (1967): El-Hadidi (1968) and El-Hadidi and Ghabbour (1968):Abdalla and Sa'ad (1972): Ahti et al. (1973); (b) Post-inundation, 1966-1968: Ghabbour (1972) and El-Hadidi and Ghabbour (1968); 1978-1986: Ali (1987) and Springuel and Murphy (1991); 1988-1990: Ali (1992); and 1993- 1994: author's records (northern part of the lake from the Aswan High Dam to El-Allaqi).
62 Sustainable fish product ion i n Lake Nasser
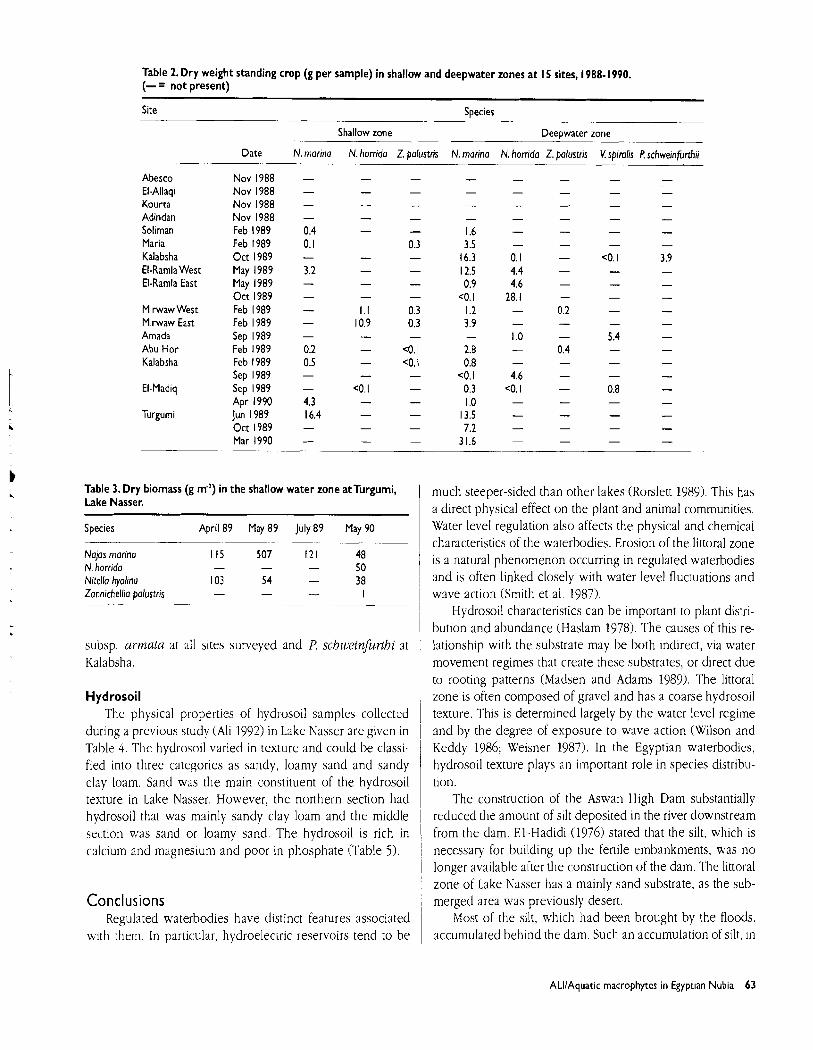
Table 2. D r y weight standing crop (g per sample) in shallow and deepwater zones at IS sites, 1988-1 990. (- = not present)
Site Species
Shallow zone Deepwater zone
Date N. rnorino N. horrido Z. Dolustris N. marina N. horrido Z. Dolustris Y sDimlis P. schweinfurthii
Abesco El-Allaqi Kourta Adindan Soliman Maria Kalabsha El-Ramla West El-Ramla East
Mirwaw West Mirwaw East Amada Abu Hor Kalabsha
El-Madiq
Turgumi
Nov 1988 Nov 1988 Nov 1988 Nov 1988 Feb 1989 Feb 1989 Oct 1989 May 1989 May 1989 Oct 1989 Feb 1989 Feb 1989 Sep 1989 Feb 1989 Feb 1989 Sep 1989 Sep 1989 Apr 1990 Jun 1989 Oct 1989 Mar 1990
Table 3. D ry biomass (g ml) i n the shallow water zone atTurgumi, Lake Nasser.
Species April 89 May 89 July 89 May 90
Nojos rnorino I I S 507 121 48 N. horrid0 - - - 50 Nitella hyolino 103 54 - 38 Zonnichellio polustris - - - I
subsp, urrnatu at all sites surveyed and P schu;einfurthi at Kalabsha.
Hydrosoil The physical properties of hydrosoil samples collected
during a previous study (Ali 1992) in Lake Nasser are given in Table 4 The hydrosoil varied in texture and could be classi- fied into three categories as sandy, loamy sand and sandy clay loam. Sand was the main constituent of the hydrosoil texture in Lake Nasser. However, the northern section had hydrosoil that was mainly sandy clay loam and the middle section was sand or loamy sand. The hydrosoil is rich in calcium and magnesium and poor in phosphate (Table 5).
Conclusions Regulated waterbodies have distinct features assoc~ated
with them. In particular, hydroelectric reservoirs tend to be
much steeper-sided than other lakes (Rorslett 1989). This has a direct physical effect on the plant and animal communities. Water level regulation also affects the physical and chemical characteristics of the waterbodies. Erosion of the littoral zone is a natural phenomenon occurring in regulated waterbodies and is often linked closely with water level fluctuations and wave action (Smith et al. 1987).
Hydrosoil characteristics can be important to plant distri- bution and abundance (Haslam 1978). The causes of this re- lationship with the substrate may be both indirect, via water movement regimes that create chese substrates, or direct due to rooting patterns (Madsen and Adams 1989). The littoral zone is often composed of gravel and has a coarse hydrosoil texture. This is determined largely by the water level regime and by the degree of exposure to wave action (Wilson and Keddy 1986; Weisner 1987). In the Egyptian waterbodies, hydrosoil texture plays an important role in species distribu- tion.
The construction of the Aswan High Dam substantially reduced the amount of silt deposited in the river downstream from the dam. El-Hadidi (1976) stated that the silt, which is necessary for building up the fertile embankments, was no longer available after the construction of the dam. The littoral zone of Lake Nasser has a mainly sand substrate, as the sub- merged area was previously desert.
Most of the silt, which had been brought by the floods. accumulated behind the dam. Such an accumulation of silt, in
ALllAauatic rnacro~hvtes in Eev~tian Nubia 63
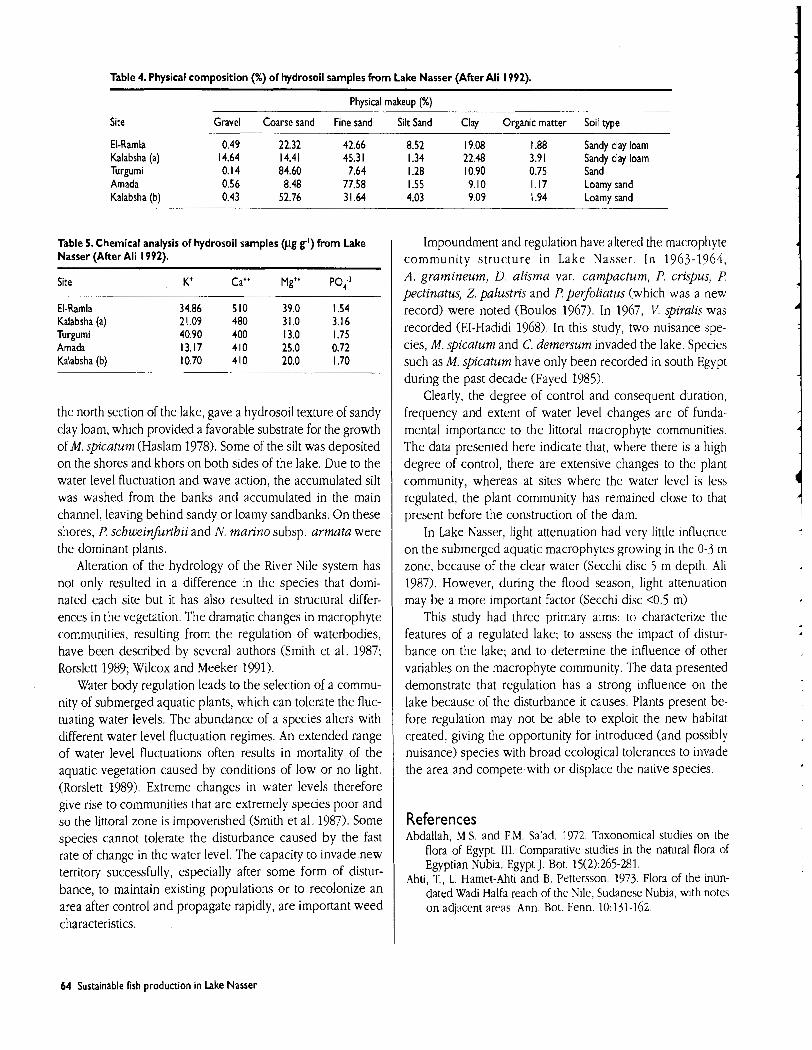
Table 4. Physical composition (X) of hydrosoil samples from Lake Nasser (After Ali 1992).
Physical makeu~ (%1
Site Gravel Coarse sand Fine sand Silt Sand Clay Organic matter Soil type
El-Ramla 0.49 22.32 42.66 8.52 19.08 1.88 Sandy clay loam Kalabsha (a) 14.64 14.4 1 45.3 1 1.34 22.48 3.9 1 Sandy clay loam Turgumi 0.14 84.60 7.64 1.28 10.90 0.75 Sand Amada 0.56 8.48 77.58 1.55 9.10 1.17 Loamy sand Kalabsha (b) 0.43 52.76 3 1.64 4.03 9.09 1.94 Loamy sand
Table 5. Chemical analysis of hydrosoil samples (pg g') from Lake Nasser (After Ali 1992).
Site --
K+ Ca" Mg" Poi1
El-Ramla 34.86 5 10 39.0 1.54 Kalabsha (a) 21.09 480 3 1 .O 3.16 Turgumi 40.90 400 13.0 1.75 Amada 13.17 410 25.0 0.72 Kalabsha (b) 10.70 410 20.0 1.70
the north section of the lake, gave a hydrosoil texture of sandy clay loam, which provided a favorable substrate for the growth of M. spzcatum (Haslam 1978). Some of the silt was deposited on the shores and khors on both sides of the lake. Due to the water level fluctuation and wave action, the accumulated silt was washed from the banks and accumulated in the main channel, leaving behind sandy or loamy sandbanks. On these shores, P. schweinfurthii and N. marino subsp. armata were the dominant plants.
Alteration of the hydrology of the River Nile system has not only resulted in a difference In the species that domi- nated each site but it has also resulted in structural differ- ences in the vegetation. The dramatic changes in macrophyte communities, resulting from the regulation of waterbodies, have been described by several authors (Smith et al. 1987; Rorslett 1989; Wilcox and Meeker 1991).
Water body regulation leads to the selection of a commu- nity of submerged aquatic plants, which can tolerate the fluc- tuating water levels. The abundance of a species alters with different water level fluctuation regimes. An extended range of water level fluctuations often results in mortality of the aquatic vegetation caused by conditions of low or no light. (Rorslett 1989). Extreme changes in water levels therefore give rise to communities that are extremely species poor and so the littoral zone is impoverished (Smith et al. 1987). Some species cannot tolerate the disturbance caused by the fast rate of change in the water level. The capacity to invade new territory successfully, especially after some form of distur- bance, to maintain existing populations or to recolonize an area after control and propagate rapidly, are important weed characteristics.
Impoundment and regulation have altered the macrophyte community structure in Lake Nasser. In 1963-1964, A. gramineum, D, alisma var. campactum, P. crispus, P. pectinatus, Z. palustris and P. perfoliatus (which was a new record) were noted (Boulos 1967). In 1967, V. spiralis was recorded (EI-Hadidi 1968). In this study, two nuisance spe- cies, M. spicatum and C. demersum invaded the lake. Species such as M. spicatum have only been recorded in south Egypt during the past decade (Fayed 1985).
Clearly, the degree of control and consequent duration, frequency and extent of water level changes are of funda- mental importance to the littoral macrophyte communities. The data presented here indicate that, where there is a high degree of control, there are extensive changes to the plant community, whereas at sites where the water level is less regulated, the plant community has remained close to that present before the construction of the dam.
In Lake Nasser, light attenuation had very little influence on the submerged aquatic macrophytes growing in the 0-3 m zone, because of the clear water (Secchi disc 5 m depth. Ali 1987). However, during the flood season, light attenuation may be a more important factor (Secchi disc c0.5 m).
This study had three primary aims: to characterize the features of a regulated lake; to assess the impact of distur- bance on the lake; and to determine the influence of other variables on the macrophyte community. The data presented demonstrate that regulation has a strong influence on the lake because of the disturbance it causes. Plants present be- fore regulation may not be able to exploit the new habitat created. giving the opportunity for introduced (and possibly nuisance) species with broad ecological tolerances to invade the area and compete with or displace the native species.
References Abdallah, M.S. and F.M. Sa'ad. 1972. Taxonomical studies on the
flora of Egypt. 111. Comparative studies in the natural flora of Egyptian Nubia. Egypt J. Bot. 15(2):265-281.
Ahti, T., L. Hamet-Ahti and B. I'ettersson. 1973. Flora of the inun- dated Wadi Halfa reach of the Nile, Sudanese Nubia, with notes on adjacent areas Ann. Rot. Fenn. 10:131-162.
64 Sustainable fish production in Lake Nasser
Ali, M.M. 1987. Studies on the shoreline vegetation of Aswan High Dam Lake (Lake Nasser) and impact of the lake on desert., Assiut University. 253 p. M.S. thesis.
Ali, M.M. 1992. Ecological studies on freshwater macrophytes in regulated water-bodies in Egypt and the UK. Assiut University. 235 p. Ph.D. thesis
Boulos, L. 1967. Flora of the Nile region in Egyptian Nubia. Feddes Rep. 73:184-215.
El-Hadidi, M.N. 1968. Vallisenria L. in Egypt. Candollea 23:51-58. EI-Hadidi, M.N. 1976. The riverine flora in Nubia, p. 103-109. In J.
Rzoska (ed.) The Nile: biology of an ancient river. Junk, The Hague.
El-Hadidi, M.N. and S.I. Ghabbour. 1968. A floristic study of the Nile valley at Aswan. Rev. Zool. Bot. Afr. LXXVIII:3-4.
Fayed, A.A. 1985. The distribution of Myriophyllum spicatum L . in the inland waters of Egypt. Folia Geobot. Phytotax. Praha. 20:197- 199.
Ghabbour, S.I. 1972. Flora of the Nile region at the Dongola reach, Sudanese Nubia. Rev. Zool. Bot. Ah. 85(1-2):l-29.
Haslam, S.M. 1978. River plants. Cambridge University Press. 396 p. Jeffries, M, and D. Mills. 1990. Freshwater ecology. Principles and
applications. Belhaven Press, London. 285 p. Madsen, J.D. and M.S. Adams. 1989. The distribution of submerged
aquatic macrophyte biomass in a eutrophic stream, Badfish Creek: the effect of environment. Hydrobiologia 171: 11 1-1 19.
Moore, J.A. 1986. Charophytes of Great Britain and Ireland. B.S.B.I. Publ. 5: 140 p.
Murphy, K.J., R.G. Hanbury and J.W. Eaton. 1981. The ecological effects of 2-methylthiotriazine herbicides used for aquatic weed control in navigable canals. 1. Effects on aquatic flora and water chemistry. Arch. Hydrobiol. 91:294-331.
Rorslett, B. 1989. An integrated approach to hydropower impact assessment. 11. Submerged macrophytes in some Norwegian hy- droelectric lakes. Hydrobiologia 175:65-82.
Smith, B.D., P.S. Maitland and S.M. Pennock. 1987. A comparative study of water level regimes and littoral benthic communities in Scottish lochs. Biol. Consem. 39:291-316.
Springuel, I.V, and K.J. Murphy. 1990. Euhydrophytes of Egyptian Nubia. Aquat. Bot. 37:17-25.
Springuel, I.V. and K.J. Murphy. 1991. Euhydrophyte communities of the River Nile and its impoundments in Egyptian Nubia. Hydrobiologia 281:35-47.
Tackholm, V. 1974. Student's flora of Egypt. Cairo University Press. 888 p.
Triest, L. 1989. Flora of tropical East Africa-Najadaceae. Royal Botanic Gardens, London. 9 p.
Weisner, G. 1987. The relation between wave exposure and distri- bution of emergent vegetation in a eutrophic lake. Freshwat. Biol. 18:537-544.
Wilcox, D.A. and J.E. Meeker. 1991. Disturbance effects on aquatic vegetation in regulated and unregulated lakes in northern Min- nesota. Can. J. Bot. 69(7):1542-1551.
Wilson, S.D. and P.A. Keddy. 1986. Measuring diffuse competition along an environment gradient: results from a shoreline plant community. Am. Nat. 127462-869.
ALllAquatic macrophytes in Egyptian Nubia 65
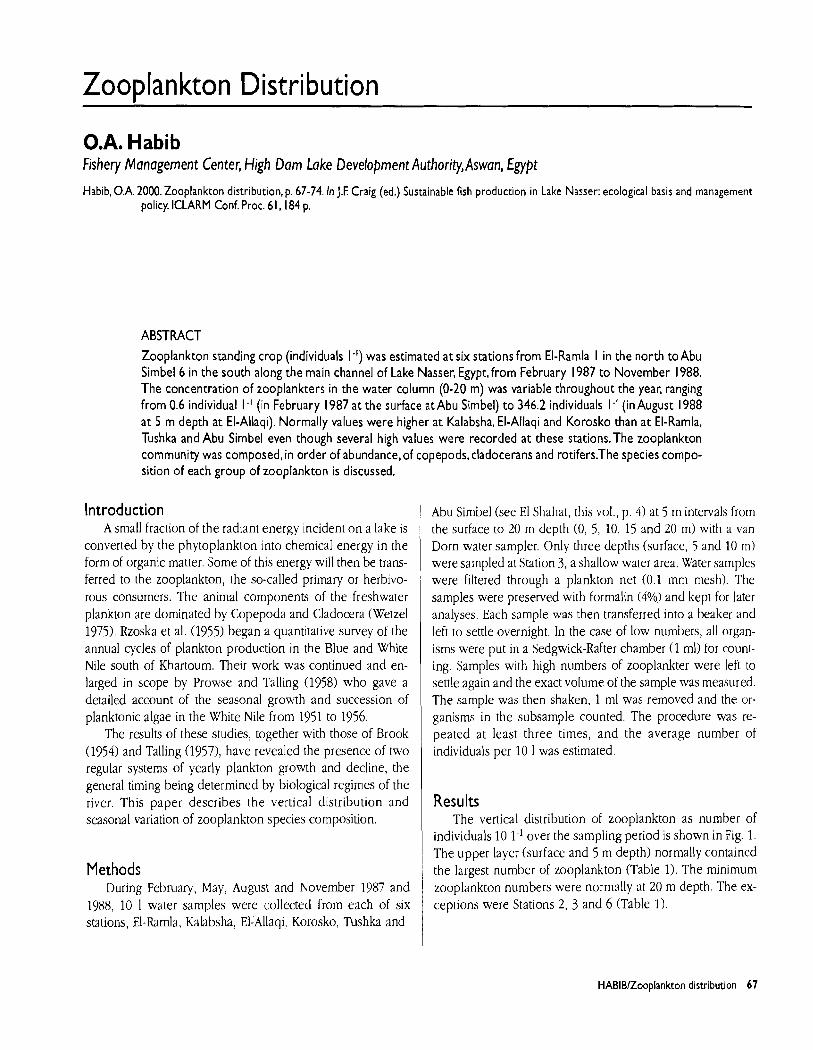
Zooplankton Distribution
O.A. Habib Fishery Management Center, High Dam Lake Development Authority, Aswan, Egypt
Habib, O.A. 2000. Zooplankton distribution, p. 67-74. In J.F. Craig (ed.) Sustainable fish production in Lake Nasser: ecological basis and management policy. ICLARM Conf. Proc. 6 I, 184 p.
ABSTRACT
Zooplankton standing crop (individuals I-') was estimated at six stations from El-Ramla I in the north toAbu Simbel6 in the south along the main channel of Lake Nasser, Egypt, from February 1987 to November 1988. The concentration of zooplankters in the water column (0-20 m) was variable throughout the year, ranging from 0.6 individual I-' (in February 1987 at the surface at Abu Simbel) to 346.2 individuals I-' (in August 1988 at 5 m depth at El-Allaqi). Normally values were higher at Kalabsha, El-Allaqi and Korosko than at El-Ramla, Tushka and Abu Simbel even though several high values were recorded at these stations.The zooplankton community was composed, in order of abundance, of copepods, cladocerans and rotifers.The species compo- sition of each group of zooplankton is discussed.
Introduction A small fraction of the radiant energy incident on a lake is
converted by the phytoplankton Into chemical energy in the form of organic matter. Some of this energy will then be trans- ferred to the zooplankton, the so-called primary or herbivo- rous consumers. The animal components of the freshwater plankton are dominated by Copepoda and Cladocera (Wetzel 1975). Rzoska et al. (1955) began a quantitative survey of the annual cycles of plankton production in the Blue and White Nile south of Khartoum. Their work was continued and en- larged in scope by Prowse and Talling (1958) who gave a detailed account of the seasonal growth and succession of planktonic algae in the White Nile from 1951 to 1956.
The results of these studies, together with those of Brook (1954) and Talling (1957), have revealed the presence of two regular systems of yearly plankton growth and decline, the general timing being determined by biological regimes of the river. This paper describes the vertical distribution and seasonal variation of zooplankton species composition.
Methods During February, May, August and November 1987 and
1988, 10 1 water samples were collected from each of six stations, El-Rarnla, Kalabsha, El-Allaqi. Korosko, Tushka and
Abu Simbel (see El Shahat, this vol., p. 4) at 5 m intervals from the surface to 20 m depth (0, 5, 10, 15 and 20 m) with a van Dorn water sampler. Only three depths (surface, 5 and 10 m) were sampled at Station 3, a shallow water area. Water samples were filtered through a plankton net (0.1 mm mesh). The samples were preserved with formalin (4%) and kept for later analyses. Each sample was then transferred into a beaker and left to settle overnight. In the case of low numbers, all organ- isms were put in a Sedgwick-Rafter chamber (1 ml) for count- ing. Samples with high numbers of zooplankter were left to settle again and the exact volume of the sample was measured. The sample was then shaken, 1 ml was removed and the or- ganisms in the subsample counted. The procedure was re- peated at least three times, and the average number of individuals per 10 1 was estimated.
Results The vertical distribution of zooplankton as number of
individuals 10 1.' over the sampling period is shown in Fig. 1. The upper layer (surface and 5 m depth) normally contained the largest number of zooplankton (Table 1). The minimum zooplankton numbers were normally at 20 m depth. The ex- ceptions were Stations 2, 3 and 6 (Table 1).
HABlBlZooplankton distribution 67
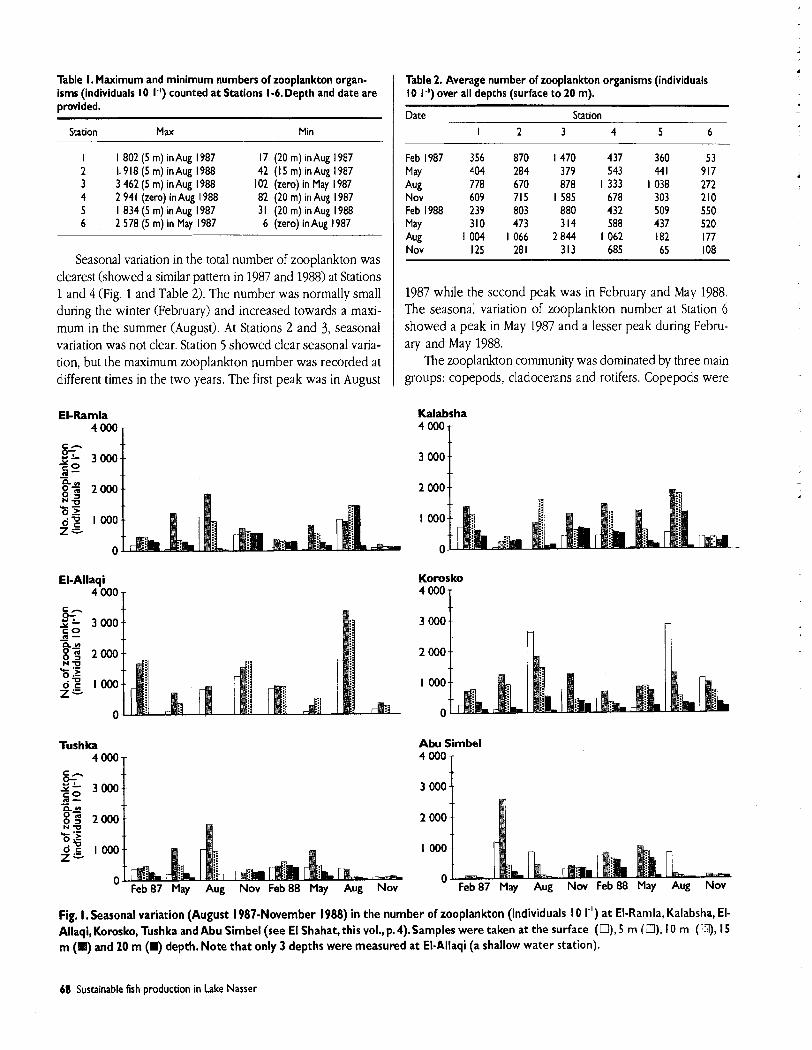
Table I. Maximum and minimum numbers of zooplankton organ- isms (individuals 10 1") counted at Stations 1-6. Depth and date are provided.
Station Max Min
I 1 802 (5 m) in Aug 1987 17 (20 m) in Aug 1987 2 1.918(5m)inAug1988 42 (1 5 m) in Aug 1987 3 3 462 (5 m) in Aug 1988 102 (zero) in May 1987 4 2 941 (zero) in Aug 1 988 82 (20 m) in Aug 1 987 5 1 834 (5 m) in Aug 1987 3 1 (20 m) in Aug 1 988 6 2 578 (5 m) in May 1987 6 (zero) in Aug 1987
Seasonal variation in the total number of zooplankton was clearest (showed a similar pattern in 1987 and 1988) at Stations 1 and 4 (Fig. 1 and Table 2). The number was normally small during the winter (February) and increased towards a maxi- mum in the summer (August). At Stations 2 and 3, seasonal variation was not clear. Station 5 showed clear seasonal varia- tion, but the maximum zooplankton number was recorded at different times in the two years. The first peak was in August
Table 2. Average number of zooplankton organisms (individuals 10 I-') over all depths (surface to 20 m).
Date Station I 2 3 4 5 6
Feb 1987 356 870 1 470 437 360 53 May 404 284 379 543 441 917 Aug 778 670 878 1 333 1 038 272 Nov 609 715 1585 678 303 210 Feb1988 239 803 880 432 509 550 May 310 473 314 588 437 520 *ug 1 004 1 066 2 844 1 062 182 177 Nov 125 281 313 685 65 108
1987 while the second peak was in February and May 1988. The seasonal variation of zooplankton number at Station 6 showed a peak in May 1987 and a lesser peak during Febru- ary and May 1988.
The zooplankton community was dominated by three main groups: copepods, cladocerans and rotifers. Copepods were
El-Ramla Kalabsha 4000 4 000
c h O X 3000 $2
3 000 - gs
a 2000 2 000 5i< ' -- 0 .z 6 7 1000 1 000 z;=.
0 0
El-Allaqi 40001
Korosko 4 000 T
Tushka
4 0 0 0 ~
Abu Simbel 4 0 0 0 ~
Lh r" 3 000
SE) - E? 2000 NP 'S s 0-2 1000 z z
O Feb 87 May Aug N a Feb 88 May Aug N a May Aug Nov Feb 88 May Aug Nov
Fig. I. Seasonal variation (August 1987-November 1988) in the number of zooplankton (individuals I 0 I") at El-Ramla, Kalabsha, El- Allaqi, Korosko, Tushka and Abu Simbel (see El Shahat, this vol., p. 4).Samples were taken at the surface (a), 5 m (U), I0 m (Q, 15 m (El) and 20 m (U) depth. Note that only 3 depths were measured at El-Allaqi (a shallow water station).
68 Sustainable fish production in Lake Nasser
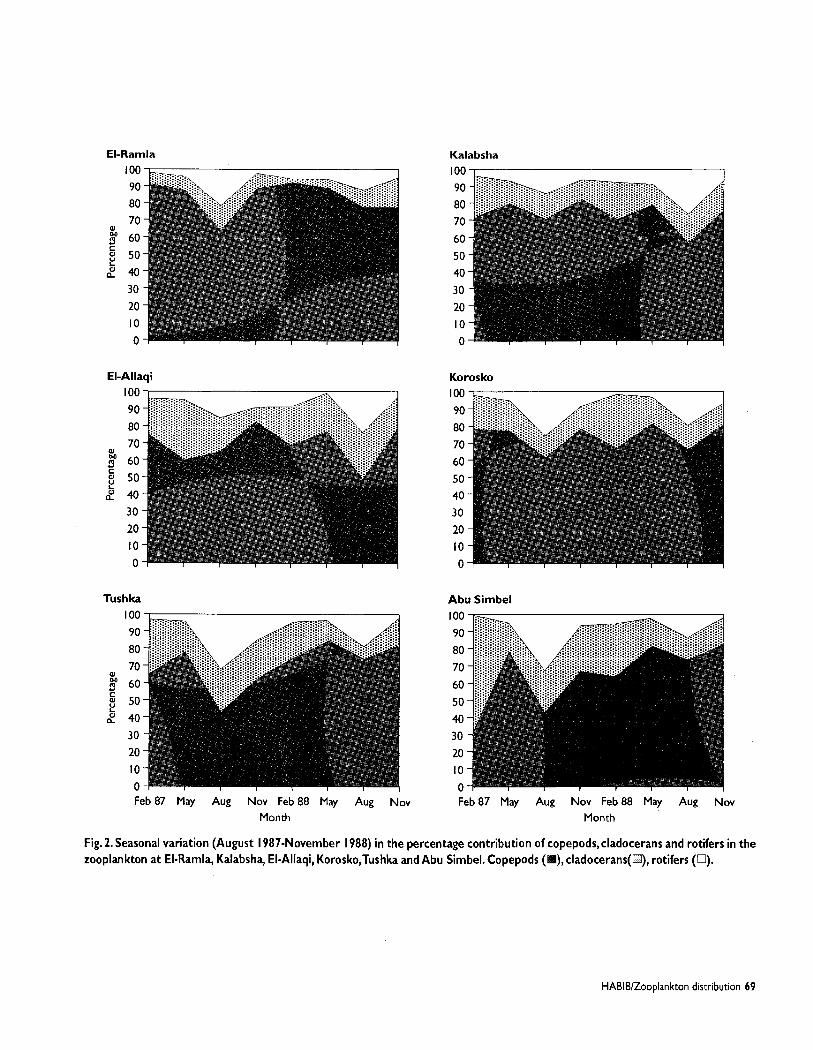
El-Ramla Kalabsha
El-Allaqi Korosko
Tush ka Abu Sirnbel
Feb 87 May Aug Nov Feb 88 May Aug Nov
Month Feb 87 May Aug Nov Feb 88 May Aug Nov
Month
Fig. 2. Seasonal variation (August 1987-November 1988) in the percentage contribution of copepods, cladocerans and rotifers in the zooplankton at El-Ramla, Kalabsha, El-Allaqi, Korosko,Tushka and Abu Simbel. Copepods (El), cladocerans('U), rotifers (0).
HABIBIZooplankton distribution 69
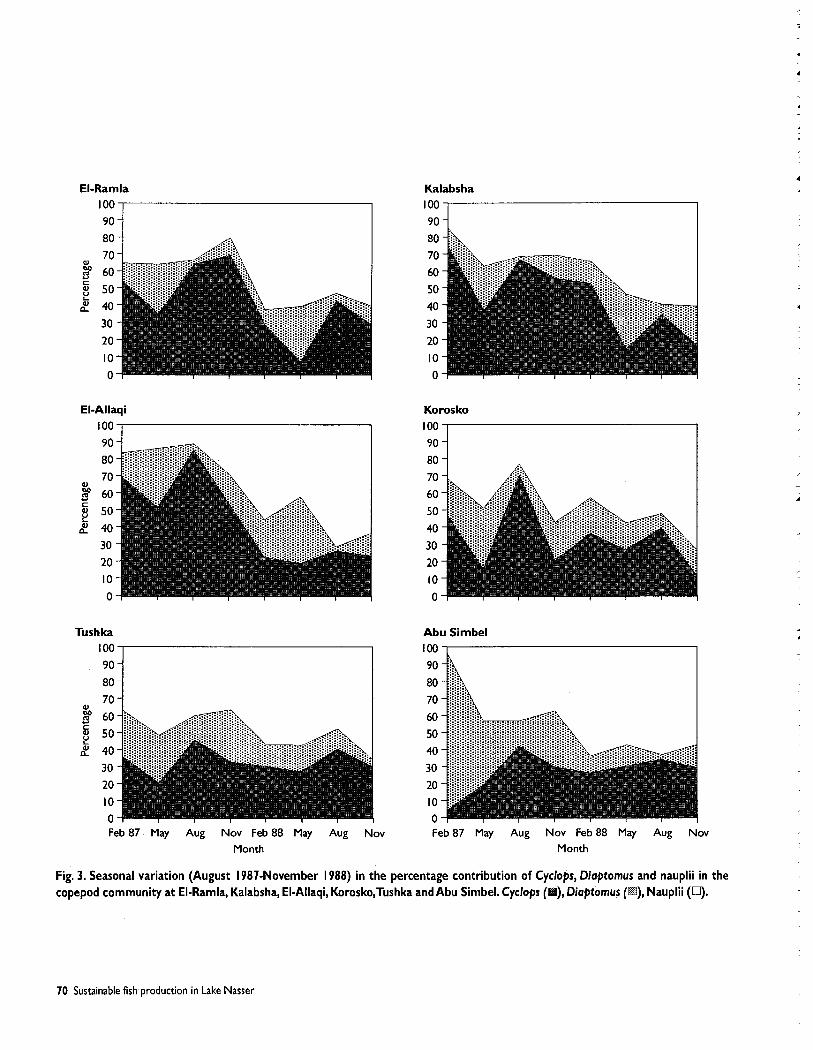
El-Ramla
I : I Kalabsha
90
El-Allaqi Korosko
Tushka Abu Simbel
Feb 87 May Aug Nov Feb 88 May Aug Nov Month
Feb 87 May Aug Nov Feb 88 May Aug Nov Month
Fig. 3. Seasonal variation (August 1987-November 1988) in the percentage contribution of Cyclops, Diaptomus and nauplii in the copepod community at El-Ramla, Kalabsha, El-Allaqi, Korosko,Tushka and Abu Simbel. Cyclops (a), Diaptomus (D), Nauplii (0).
70 Sustainable fish production in Lake Nasser
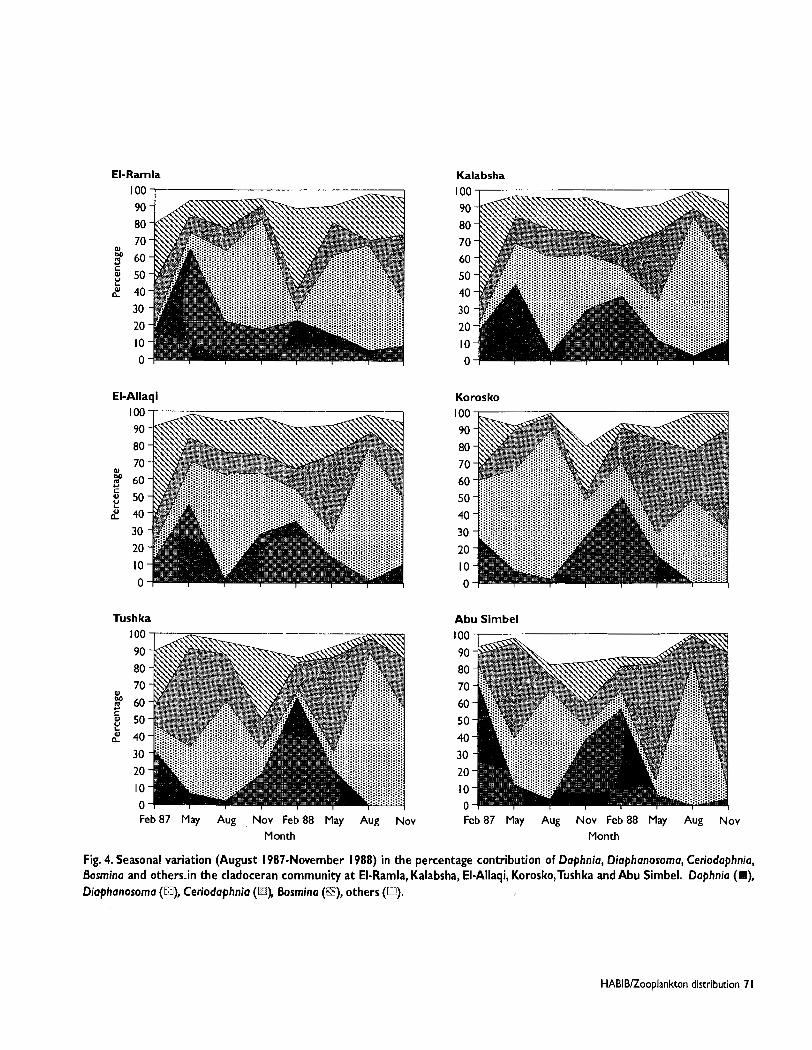
El-Ramla Inn ,
El-Allaqi
Kalabsha
Koros ko
Tushka Abu Sirnbel
Feb 87 May Aug Nov Feb 88 May Aug Nov Month
Feb 87 May Aug Nov Feb 88 May Aug Nov Month
Fig. 4. Seasonal variation (August 1987-November 1988) in the percentage contribution of Daphnia, Diaphanosoma, Ceriodaphnia, Bosmina and others i n the cladoceran community at El-Ramla, Kalabsha, El-Allaqi, Korosko,Tushka and Abu Simbel. Daphnia (H), Diaphanosoma (a), Ceriodaphnia (O), Bosmina (a), others (0).
HABIBIZooplankton distribution 7 1
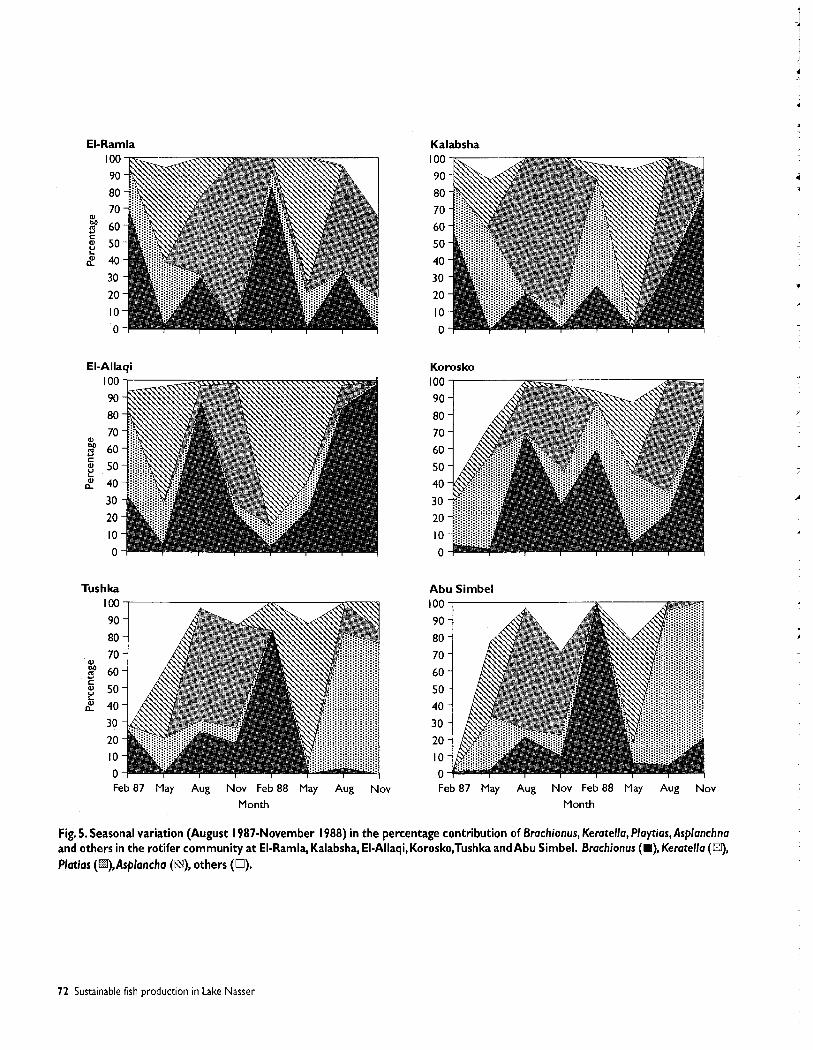
El-Ramla Kalabsha
El-Allaqi
Tushka
Feb 87 May Aug Nov Feb 88 May Aug Nov Month
Koros ko
Abu Sirnbel
Feb 87 May Aug Nov Feb 88 May Aug Nov Month
Fig. 5. Seasonal variation (August 1987-November 1988) in the percentage contribution of Brachionus, Keratella, Playtias, Asplanchna and others in the rotifer community at El-Ramla, Kalabsha, El-Allaqi, Korosko,Tushka and Abu Simbel. Brachionus (W), Keratella (m), Platias (D),Asplancha (El), others (0).
72 Sustainable fish production in Lake Nasser
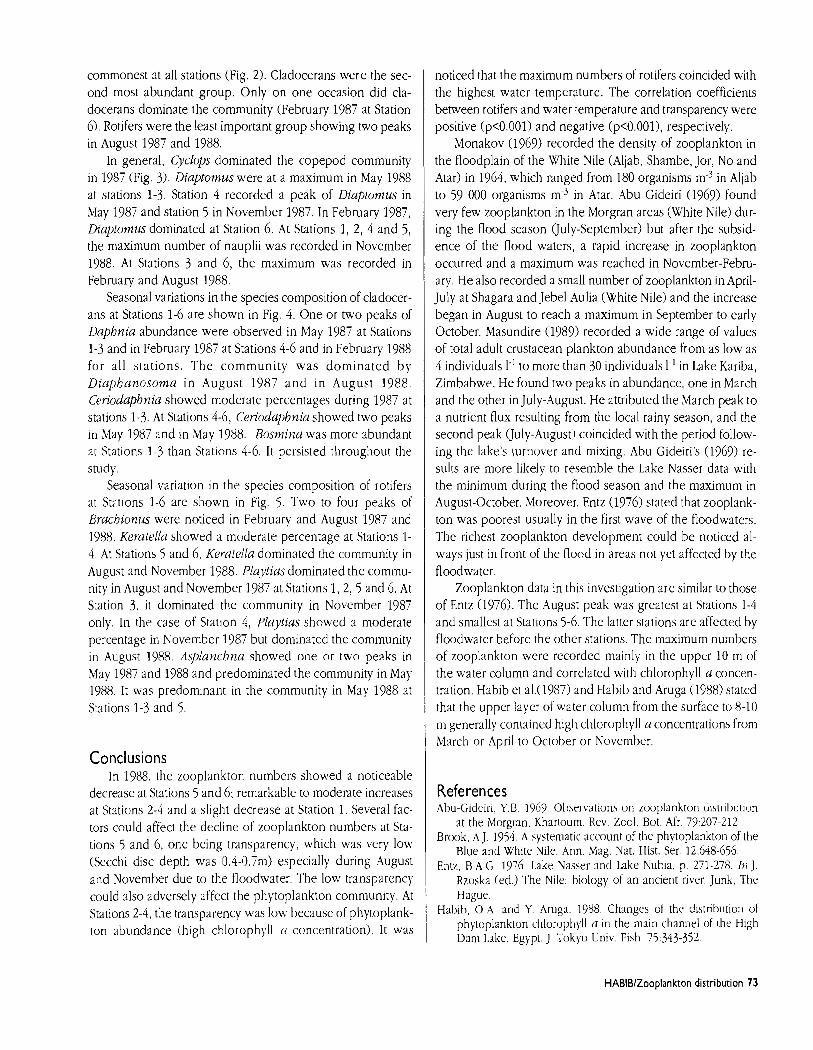
commonest at all stations (Fig. 2). Cladocerans were the sec- ond most abundant group. Only on one occasion did cla- docerans dominate the community (February 1987 at Station 6). Rotifers were the least important group showing two peaks in August 1987 and 1988.
In general, Cyclops dominated the copepod community in 1987 (Fig. 3). Diaptomus were at a maximum in May 1988 at stations 1-3. Station 4 recorded a peak of Diaptomus in May 1987 and station 5 in November 1987. In February 1987, Diaptomus dominated at Station 6. At Stations 1, 2, 4 and 5, the maximum number of nauplii was recorded in November 1988. At Stations 3 and 6 , the maximum was recorded in February and August 1988.
Seasonal variations in the species composition of cladocer- ans at Stations 1-6 are shown in Fig. 4. One or two peaks of Daphnia abundance were observed in May 1987 at Stations 1-3 and in February 1987 at Stations 4-6 and in February 1988 for all stations. The community was dominated by Diaphanosoma in August 1987 and in August 1988. Ceriodaphnia showed moderate percentages during 1987 at stations 1-3. At Stations 4-6, Ceriodaphnia showed two peaks in May 1987 and in May 1988. Bosmina was more abundant at Stations 1-3 than Stations 4-6. I t persisted throughout the study.
Seasonal variation in the species composition of rotifers at Stations 1-6 are shown in Fig. 5. Two to four peaks of Brachionus were noticed in February and August 1987 and 1988. Kerulella showcd a moderate percentage at Stations 1- 4. At Stations 5 and 6, Keratella dominated the community in August and November 1988. Playtias dominated the commu- nity in August and November 1987 at Stations 1, 2, 5 and 6. At Station 3, it dominated the community in November 1987 only. In the case of Station 4, Playtias showed a moderate percentage iri November 1987 but dominated the community in August 1988. Asplanchna showed one or two peaks in May 1987 and 1988 and predominated the community in May 1988. It was predominant in the community in May 1988 at Stations 1-3 and 5.
Conclusions In 1988, the zooplankton numbers showed a noticeable
decrease at Stations 5 and 6; remarkable to moderate increases at Stations 2-4 and a slight decrease at Station 1. Several fac- tors could affect the decline of zooplankton numbers at Sta- tions 5 and 6, one being transparency, which was very low (Secchi disc depth was 0.4-0.7m) especially during August and November due to the floodwater. The low transparency could also adversely affect the phytoplankton community. At Stations 2-4, the transparency was low because of phytoplank- ton abundance (high chlorophyll a concentration). I t was
noticed that the maximum numbers of rotifers coincided with the highest water temperature. The correlation coefficients between rotifers and water temperature and transparency were positive (p<0.001) and negative (p<0.001), respectively.
Monakov (1969) recorded the density of zooplankton in the floodplain of the White Nile (Aljab, Shambe, Jor, No and Atar) in 1964, which ranged from 180 organisms m-3 in Aljab to 59 000 organisms m-3 in Atar. Abu Gideiri (1969) found very few zooplankton in the Morgran areas (White Nile) dur- ing the flood season (July-September) but after the subsid- ence of the flood waters, a rapid increase in zooplankton occurred and a maximum was reached in November-Febru- ary. He also recorded a small number of zooplankton in April- July at Shagara and Jebel Aulia (White Nile) and the increase began in August to reach a maximum in September to early October. Masundire (1989) recorded a wide range of values of total adult crustacean plankton abundance from as low as 4 individuals I-' to more than 30 individuals IF1 in Lake Kariba, Zimbabwe. He found two peaks in abundance, one in March and the other in July-August. He attributed the March peak to a nutrient flux resulting from the local rainy season, and the second peak (July-August) coincided with the period follow- ing the lake's turnover and mixing. Abu Gideiri's (1969) re- sults are more likely to resemble the Lake Nasser data with the minimum during the flood season and the maximum in August-October. Moreover, Entz (1976) stated that zooplank- ton was poorest usually in the first wave of the floodwaters. The richest zooplankton development could be noticed al- ways just in front of the flood in areas not yet affected by the floodwater.
Zooplankton data in this investigation are similar to those of Entz (1976). The August peak was greatest at Stations 1-4 and smallest at Stations 5-6. The latter stations are affected by floodwater before the other stations. The maximum numbers of zooplankton were recorded mainly in the upper 10 m of the water column and correlated with chlorophyll a concen- tration. Habib et a1.(1987) and Habib and Aruga (1988) stated that the upper layer of water column from the surface to 8-10 rn generally conpained high chlorophyll a concentrations from March or April to October or November.
References Abu-Gideiri. Y.B. 1969. Observations on zooplankton dis~r-hution
at the Morgran. Khartoum. Rev. Zool. Bot. Afr. 79207.212 Brook, A,]. 1954. A systematic account of the phytoplankton of the
Blue and White Nile. Ann. Mag. Nat. Hist. Ser. 12648-656. Entz, R A G 1976. Lake Nasser and Lake Nubia, p. 271-278. In J
Rzoska (ed.) The Nile: biology of an ancient river Junk, The Hague.
Habib, 0 . A and Y. Aruga. 1988. Changes of the distribution of phytoplankton chlorophyll a in the main channel of the High Darn Lake, Egypt. J . Tokyo Univ. Fish 75343-352
HABIBIZooplankton distribution 73

Habib, O.A., T. loriya and Y. Aruga. 1987. The distribution of chlo- rophyll a as an index of primary productivity of phytoplankton in Khor El Ramla of the High Dam Lake, Egypt. J . Tokyo Univ. Fish. 74: 145-157.
Masundire, H. 1989. Zooplankton population dynamics in the Sanyati Basin, Lake Kariba, Zimbabwe. Arch. Hydrobiol. Beih. 33369- 473.
Monakov, A.V. 1969. The zooplankton and zoobenthos of the White Nile and adjoining waters in the Republic of the Sudan. Hydrobiologia 33:l6l-l85.
Prowse, G.A. and J.F. Talling. 1958. The seasonal growth and suc- cession of plankton algae in the White Nile. Limnol. Oceanogr. 3:223-238.
Rzoska, J., A.J. Brook and G.A. Prowse. 1955. Seasonal plankton development in the White and Blue Nile near Khartoum. Verh. Int. Ver. Limnol.12: 327-334.
Talling, J.F. 1957. The longitudinal succession of water characteris- tics in the White Nile. Hydrobiologia 11:73-89.
Wetzel, R.G. 1975. Limnology. W.B. Saunders. Philadelphia. 743 p.
74 Sustainable fish production in Lake Nasser
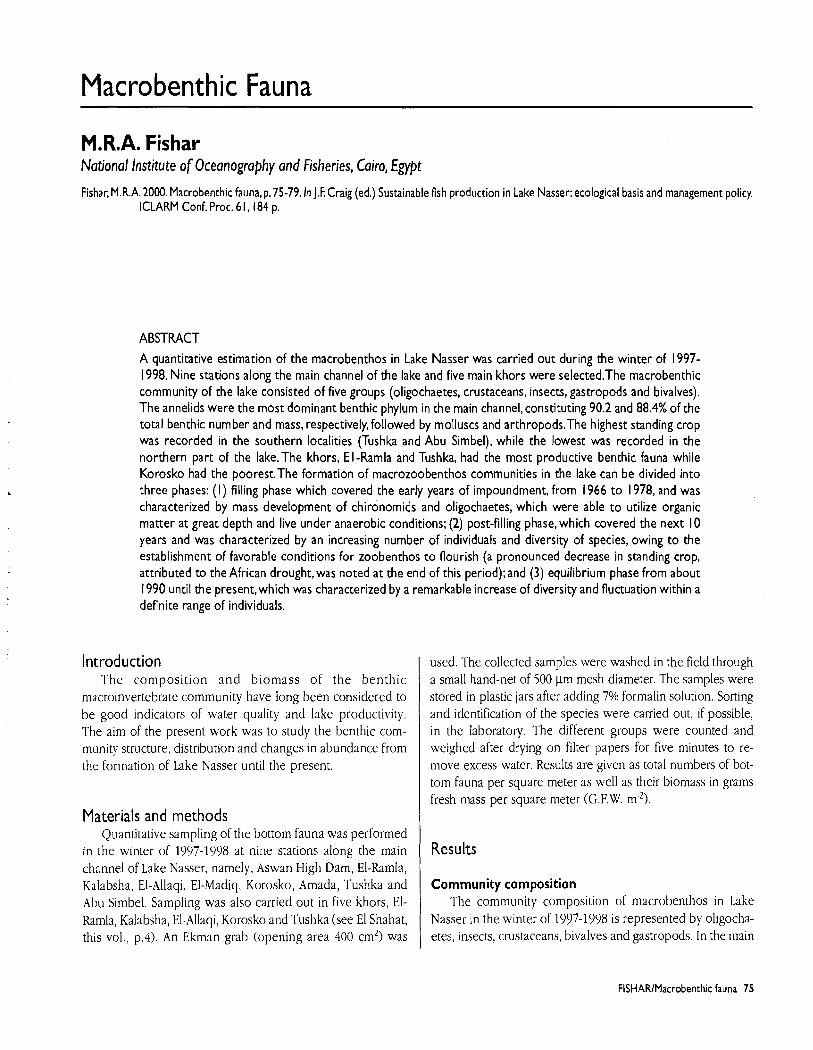
Macrobenthic Fauna
M.R,A. Fishar National Institute of Oceanography and Fisheries, Cairo, Egypt
Fishar, M.R.A.2000. Macrobenthic fauna, p. 75-79. In J.F. Craig (ed.) Sustainable fish production in Lake Nasser: ecological basis and management policy. ICLARM Conf. Proc. 6 1,184 p.
ABSTRACT
A quantitative estimation of the macrobenthos in Lake Nasser was carried out during the winter of 1997- 1998. Nine stations along the main channel of the lake and five main khors were selected.The macrobenthic community of the lake consisted of five groups (oligochaetes, crustaceans, insects, gastropods and bivalves). The annelids were the most dominant benthic phylum in the main channel, constituting 90.2 and 88.4% of the total benthic number and mass, respectively,followed by molluscs and arthropods.The highest standing crop was recorded in the southern localities (Tushka and Abu Simbel), while the lowest was recorded in the northern part of the lake.The khors, E I-Ramla and Tushka, had the most productive benthic fauna while Korosko had the poorest.The formation of macrozoobenthos communities in the lake can be divided into three phases: (I) filling phase which covered the early years of impoundment, from 1966 to 1978, and was characterized by mass development of chironomids and oligochaetes, which were able to utilize organic matter at great depth and live under anaerobic conditions; (2) post-filling phase, which covered the next I 0 years and was characterized by an increasing number of individuals and diversity of species, owing to the establishment of favorable conditions for zoobenthos to flourish (a pronounced decrease in standing crop, attributed to the African drought, was noted at the end of this period); and (3) equilibrium phase from about 1990 until the present,which was characterized by a remarkable increase of diversity and fluctuation within a definite range of individuals.
Introduction The composition and biomass of the benthic
macroinvertebrate community have long been considered to be good indicators of water quality and lake productivity. The aim of the present work was to study the benthic com- munity structure, distribution and changes in abundance from the formation of Lake Nasser until the present.
Materials and methods Quantitative sampling of the bottom fauna was performed
in the winter of 1997-1998 at nine stations along the main channel of Lake Nasser, namely, Aswan High Dam, El-Ramla, Kalabsha, El-Allaqi, El-Madiq, Korosko, Amada, Tushka and Abu Simbel. Sampling was also carried out in five khors, El- Ramla, Kalabsha, El-Allaqi, Korosko and Tushka (see El Shahat, this vol., p.4). An Ekman grab (opening area 400 cm2) was
used. The collected samples were washed in the field through a small hand-net of 500 ym mesh diameter. The samples were stored in plastic jars after adding 7% formalin solution. Sorting and identification of the species were carried out, if possible, in the laboratory. The different groups were counted and weighed after drying on filter papers for five minutes to re- move excess water. Results are given as total numbers of bot- tom fauna per square meter as well as their biomass in grams fresh mass per square meter (G.F.W. m2).
Results
Community composition The community composition of macrobenthos in Lake
Nasser in the winter of 197-1998 is represented by oligocha- etes, insects, crustaceans, bivalves and gastropods. In the main
FlSHARlMacrobenthic fauna 75
groups, constituting 90.2% and 88.0% of the total benthic num- ber and mass, respectively, followed by molluscs 5.0% and 8.6% and arthropods 4.8% and 2.9% (Fig. 1). In the khors, the percentage composition of different groups varied. Oligocha- etes were the most abundant in El-Ramla, Kalabsha and Korosko but with lower percentage values than in the main channel. Arthropods were most abundant in El-Allaqi and Tushka. However, molluscs were fewer in their numerical abundance, but their biomass percentages were higher than other groups (Fig. 2). The dominance of oligochaetes in most sampling sites in the main channel and khors is possibly due to their ability to adapt to many kinds of habitat and their tolerance to low oxygen concentrations or anoxic conditions (Brinkhurst 1970).
Distribution In the main channel, the distribution of bottom fauna var-
ied widely from one region to another. The lowest popula- tion density and biomass were observed in northern localities (Aswan High Dam and Kalabsha), while the highest values were recorded in the southern ones (Tushka and Abu Simbel). The middle stations were relatively similar (Fig. 3). The de- cline in standing crop of benthos in the north was attributed to the increasing depth of the water and the reduction in dissolved oxygen (Fishar 1995).
Oligochaetes were most abundant at Tushka and Abu Simbel, while the lowest standing crop was recorded at Kalabsha. They were represented by four species, Limnodrillus udekemianus, L. hofmeisteri, Pristina sp. and Branchzora sowerbyi. The first and second species were recorded at all stations, while Pristina sp. was found in the middle and north- ern parts of the lake. B. sowerbyi was recorded only in the northern part of the lake.
Population density Biomass
Fig. I. Percentage number and mass of benthic groups in the main channel. Molluscs (0), arthropods (m), annelids (8).
V El-Ramla Kalabsha El-Allaqi Korosko Tushka
El-Ramla Kalabsha El-Allaqi Korosko Tushka
Khor
Fig. 2. Percentage composition (A) number and (8) mass of benthic groups in five khors. Molluscs (O), arthropods (W), annelids (El).
Arthropods showed irregular distribution along the main channel of the lake. They were represented by three main groups, ostracods, chironomids and tricoprerans. Chirono- mid larvae and pupae were recorded at most stations of the main channel, while the ostracod species were recorded in the southern stations (Amada and Abu Simbel). The tricopteran species appeared only at Kalabsha.
Only one species of mollusc was identified, Valvata nilotica, which was found in the middle stations (El-Madiq and Korosko).
The benthic community in the khors was more rich and diversified than in the main channel. This was mainly due to the shallower water, lack of current and the presence of macrophytes which offered a favourable habitat by provid- ing protection from predators, food and a good substratum for these organisms. In the khors, as shown in Fig. 4, El- Ramla was the most productive followed by Tushka and
76 Sustainable fish production in Lake Nasser
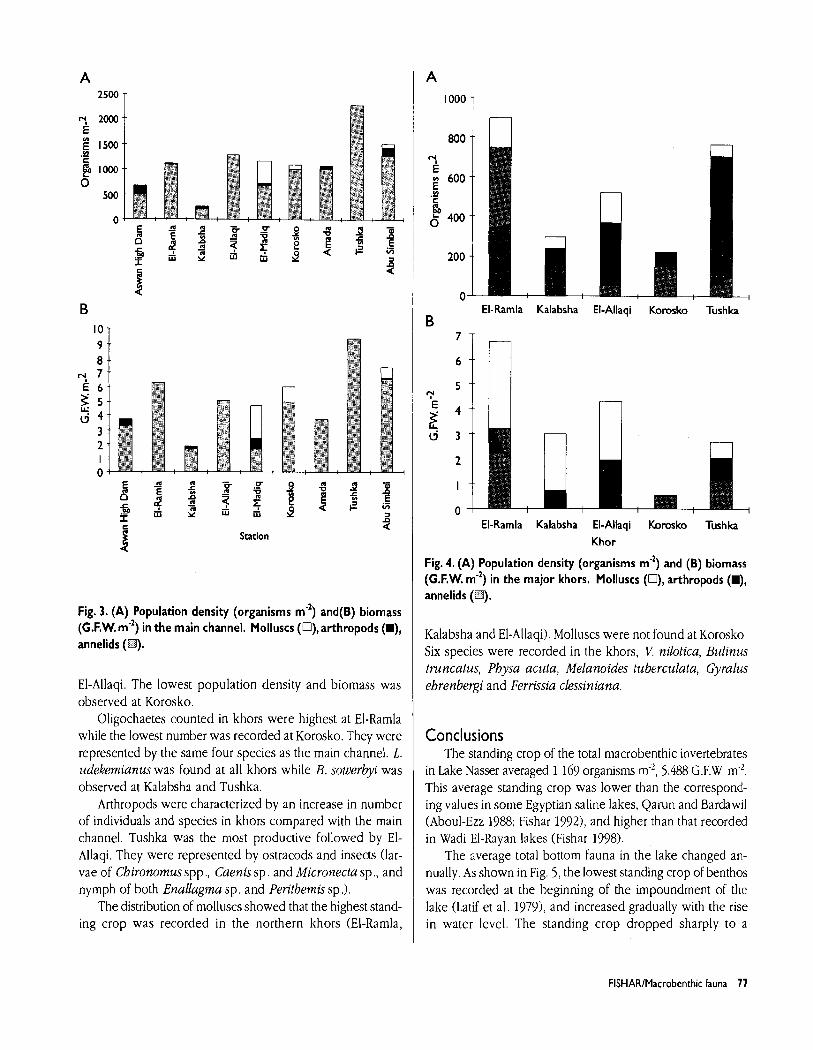
Station
Fig. 3. (A) Population density (organisms m") and(B) biomass (G.F.w. m-') in the main channel. Molluscs (O), arthropods (W), annelids (O),
El-Allaqi. The lowest population density and biomass was observed at Korosko.
Oligochaetes counted in khors were highest at El-Ramla while the lowest number was recorded at Korosko. They were represented by the same four species as the mam channel. L. udekemianus was found at all khors while B. sowerbyi was observed at Kalabsha and Tushka.
Arthropods were characterized by an increase in number of individuals and species in khors compared with the main channel. Tushka was the most productive followed by El- Allaqi. They were represented by ostracods and insects (lar- vae of Chironomus spp ., Caenis sp. and Micronecta sp., and nymph of both Enallagma sp. and Perithemis sp .I.
The distribution of molluscs showed that the highest stand- ing crop was recorded in the northern khors (El-Ramla,
El-Ramla Kalabsha El-Allaqi Korosko Tushka B
El-Ramla Kalabsha El-Allaqi Korosko Tushka Khor
Fig. 4. (A) Population density (organisms m") and (B) biomass (G.F.W. m-') in the major khors. Molluscs (O), arthropods (W), annelids (Dli).
Kalabsha and El-Allaqi). Molluscs were not found at Korosko. Six species were recorded in the khors, V. nilotica, Bulinus truncatus, Physa acuta, Melanoides tuberculata, Gyralus ehrenbergi and Ferrissia clessiniana.
Conclusions The standing crop of the total macrobenthic invertebrates
in Lake Nasser averaged 1 169 organisms m-L, 5.488 G.F.W m-l. This average standing crop was lower than the correspond- ing values in some Egyptian saline lakes, Qarun and Bardawil (Aboul-Ezz 1988; Fishar 1992), and higher than that recorded in Wadi El-Rayan lakes (Fishar 1998).
The average total bottom fauna in the lake changed an- nually. As shown in Fig. 5, the lowest standing crop of benthos was recorded at the beginning of the impoundment of the lake (Latif et al. 1979), and increased gradually with the rise in water level. The standing crop dropped sharply to a
FISHARIMacrobenthic fauna 77
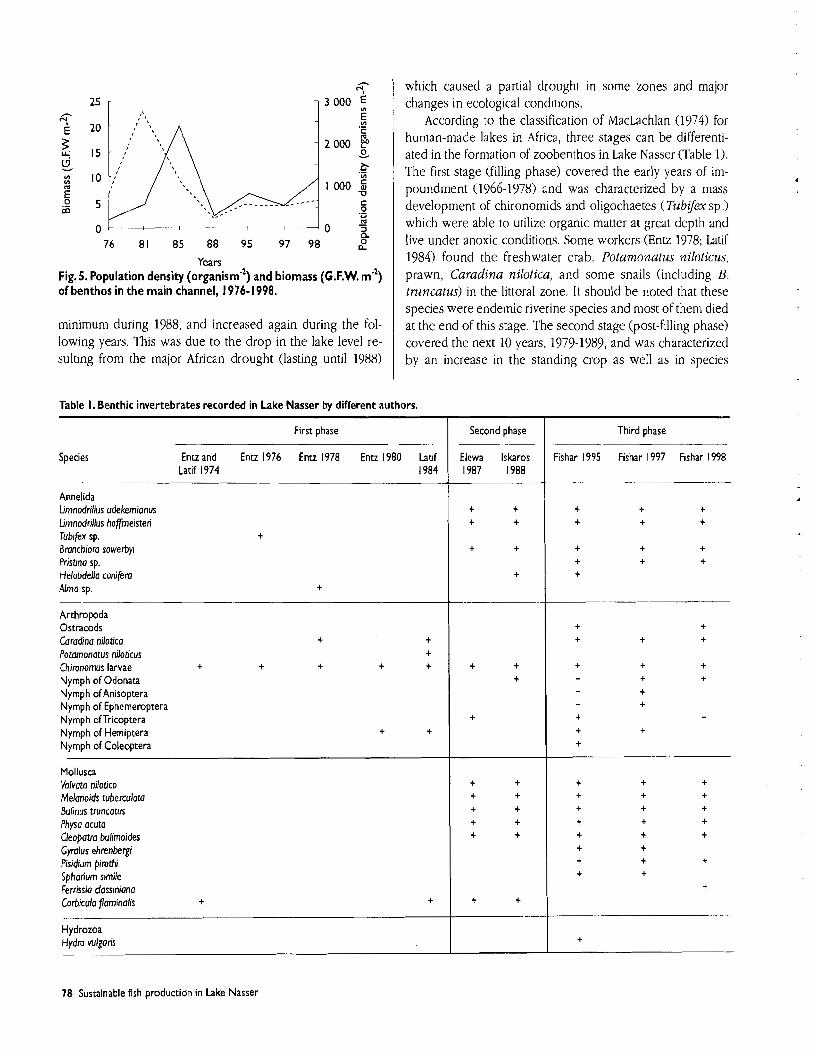
76 81 85 88 95 97 98 a o
Years Fig. 5. Population density (organism-') and biomass (G.F.W. m") of benthos in the main channel, 1976- 1998.
minimum during 1988, and increased again during the fol- lowing years. This was due to the drop in the lake level re- sulting from the major African drought (lasting until 1988)
which caused a partial drought in some zones and major
Table I. Benthic invertebrates recorded in Lake Nasser by different authors.
changes In ecolog~cal cond~t~ons. According to the classification of MacLachlan (1974) for
human-made lakes in Africa, three stages can be differenti- ated in the formation of zoobenthos in Lake Nasaer (Table 1 ). The first stage (filling phase) covered the early years of im- poundment (1966-1978) and was characterized by a mass development of chironomids and oligochaetes ( Tubifx sp .) which were able to utilize organic matter at great depth and live under anoxic conditions. Some workers (Entz 1978; Latif 1984) found the freshwater crab, Potamonatus niloticus, prawn, Caradina nilotica, and some snails (including B. trmncatus) in the littoral zone. It should be noted that these species were endemic riverine species and most of them died at the end of this stage. The second stage (post-filling phase) covered the next 10 years, 1979-1989, and was characterized by an increase in the standing crop as well as in species
Flrst phase
Spec~es Enu and Entz 1976 Entz 1 978 Entz 1980 Lat~f Lat~f 1974 1984
Annehda hmnodrrllus udekemronus hmnodrrllus hofmersten Tubrfex sp. t
Branchroro sowerbyr Prrstrno sp. Helobdella conrfero Almo sp t
-
Arthropoda Ostracods Coradino nilotico t t
Potomonatus niloticus t
Chrronomus larvae + t + t t
Nymph of Odonata Nymph of Anisoptera Nymph of Ephemeroptera Nymph ofTricoptera Nymph of Hemiptera + t
Nymph of Coleoptera
Mollusca Volvota nilotica Melonoids tuberculoto Butinus truncotus Physo ocuta Cleopotro bulimoides Gyrolus ehrenbergi Pisidium pimthi Spharium simile Ferrissia clossiniono Corbrculo fJominolis +
Hydrozoa Hydra vulgoris
Second phase
Elewa lskaros 1987 1988
Third phase
Fishar 1995 Fishar 1997 Fishar 1998
78 Sustainable fish production in Lake Nasser
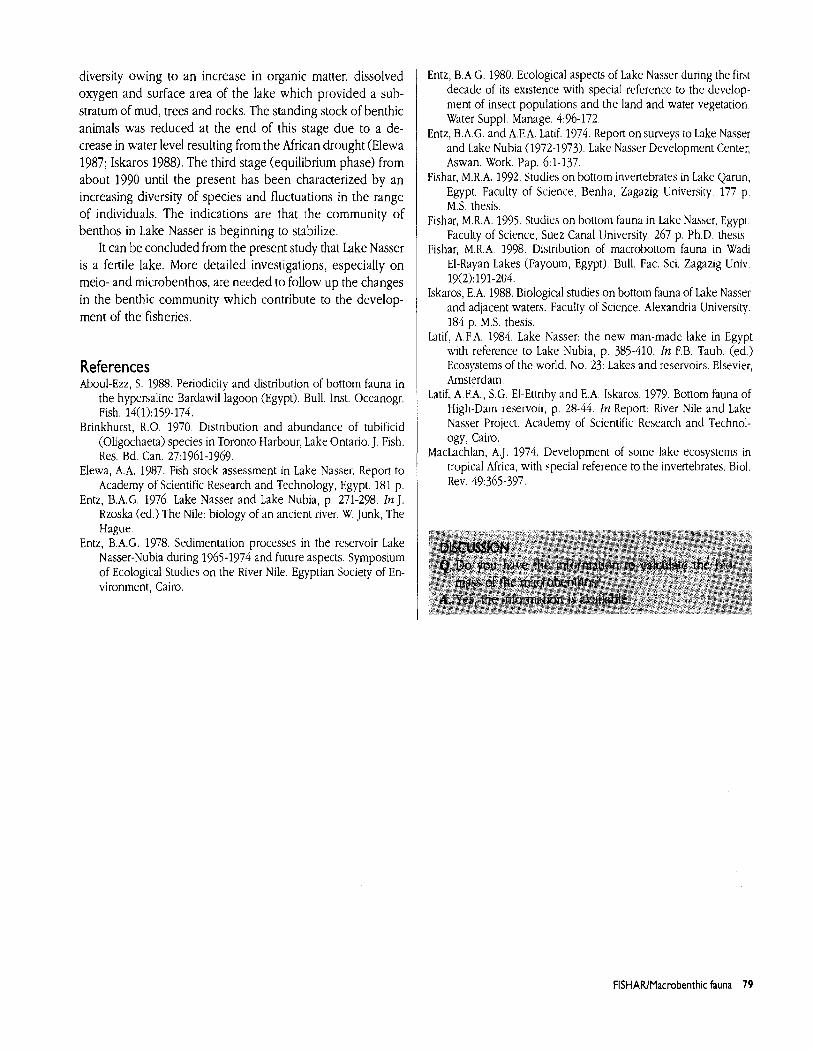
diversity owing to an increase in organic matter, dissolved oxygen and surface area of the lake which provided a sub- stratum of mud, trees and rocks. The standing stock of benthic animals was reduced at the end of this stage due to a de- crease in water level resulting from the African drought (Elewa 1987; Iskaros 1988). The third stage (equilibrium phase) from
b about 1990 until the present has been characterized by an increasing diversity of species and fluctuations in the range of individuals. The indications are that the community of benthos in Lake Nasser is beginning to stabilize.
It can be concluded from the present study that Lake Nasser is a fertile lake. More detailed investigations, especially on meio- and microbenthos, are needed to follow up the changes in the benthic community which contribute to the develop- ment of the fisheries.
References Aboul-Ezz, S. 1988. Periodicity and distribution of bottom fauna in
the hypersaline Bardawil lagoon (Egypt). Bull. Inst. Oceanogr. Fish. 14(1):159-174.
Brinkhurst, R.O. 1970 Distribution and abundance of tubificid (Ohgochaeta) species in Toronto Harbour, Lake Ontario. J. Fish. Res. Bd Can. 27:1961-1969.
Elewa, A.A. 1987. Fish stock assessment in Lake Nasser. Report to Academy of Scientific Research and Technology, Egypt. 181 p.
L
Entz, B.A.G. 1976. Lake Nasser and Lake Nubia, p. 271-298. In J. Rzoska (ed.) The Nile: biology of an ancient river. W. Junk, The Hague
Entz, B.A.G. 1978. Sedimentation processes in the reservoir Lake Nasser-Nubla dur~ng 1965-1974 and future aspects. Symposium of Ecological Studies on the River Nile Egyptian Society of En- vironment, Cairo.
Entz, B.A.G. 1980. Ecological aspects of Lake Nasser during the first decade of its existence with special reference to the develop- ment of insect populations and the land and water vegetation. Water Suppl. Manage. 496-172.
Entz, B.A.G. and A.F.A. Latif. 1974. Report on surveys to Lake Nasser and Lake Nubia (1972-1973). Lake Nasser Development Center, Aswan. Work. Pap. 6:l-137.
Fishar, M.R.A. 1992. Studies on bottom invertebrates in Lake Qarun, Egypt. Faculty of Science, Benha, Zagazig University. 177 p. MS. thesis.
Fishar, M.R.A. 1995. Studies on bollom h u m in Lake Nasser, Egypl. Faculty of Science, Suez Canal University 267 p Ph.D. thesis
Fishar, M.R.A. 1998. Distribution of macrobottom fauna in Wadi El-Rayan Lakes (Fayoum, Egypt). Bull. Fac. Sci. Zagazig Univ. 19(2):191-204.
Iskaros, E.A. 1988. Biological studies on bottom fauna of Lake Nasser and adjacent waters. Faculty of Science, Alexandria University. 184 p. MS. thesis.
Latif. A.F.A. 1984. Lake Nasser: the new man-made lake in Egypt with reference to Lake Nubia, p. 385-410. In EB. Taub. (ed.) Ecosystems of thc world. No. 23: Lakes and rcscrvoirs. Elsevier, Amsterdam.
Latif, A.F.A., S.G. El-Ettriby and E.A. Iskaros. 1979. Bottom fauna of High-Dam reservoir, p. 28-44. In Report: River Nile and Lake Nasser Project. Academy of Scientific Research and Technol- ogy, Cairo.
MacLachlan, A.J. 1974. Development of some lake ecosystems in tropical Africa, with special reference to the invertebrates Biol. Rev. 49365-397.
FlSHAWMacrobenthic fauna 79
Fish-eating Birds
M.E,Tharwat Ain Shams University, Cairo, Egypt
Tharwat, M.E. 2000. Fish-eating birds, p. 81. In J.F. Craig (ed.) Sustainable fish production in Lake Nasser: ecological basis and management policy. ICLARM Conf. Proc. 6 1,184 p.
ABSTRACT Open-water areas and large concentrations of fish are natural attractants to fish-eating birds. In addition to predation, the birds damage fish that escape, disturb brood stock and contribute to the spread of disease and parasites.
The number of bird species and subspecies that occur in Egypt are 123 and 392 respectively, of which 186 are resi- dent, 12 are extinct and 17 are endemic (Tharwat 1997). The rest are migratory birds, which visit Egypt in summer from the south or in the winter from the north. Some visit Egypt twice a year, in the spring on their way south or in the au- tumn when travelling north to Europe and Asia. Forty-one species and subspecies are known to inhabit the Lake Nasser area. Twenty of these are fish-eating birds, namely: the great cormorant, Phalacrocorax carbo sinensis (Blumenbach); the African darter, Anhinga rufa rufa (Lacepede and Daudin); the white pelican, Plecanus onocrotalus L.; the pink-backed pelican, P. mdescens Gmelin; the bittern, Botaurms stellaris stellavis (L.); the little egret, Ardea garzetta L.; the Goliath heron, A. goliath Cretzschma; the purple heron, A. purpurea L.; the yellow-billed stork, Mycteria ibis (L.); the ruddy shel- duck, Tadorna ferruginea (Pallas); the garganey, Anas querquedula (L.); the pochard, Athya ferina (L.); the black kite, Milvus rnigmns migrans(Boddaert); the African fish eagle, Haliaetus vocifer(Daudin); the moorhen, Gallinula chloropus chloropus (L.); the eagle owl, Bubo bubo ascalapbus Savigny; the common kingfisher, Alcedo nlthis althis (L.); the osprey, Pandion haliaetus haliaetus (L.); the common black-headed gull, Lams ridibundus L.; and the scissor-billed tern or Afri- can skimmer, Rynchopsflavirost~-is Vieillot.
Open-water areas and concentrations of fish are natural attractants to fish-eating birds. As well as consuming fish, the birds damage fish that escape, disturb brood stock and con- tribute to the spread of disease and parasites. Large concen- trations of shore birds can cause pollution problems. Those causing most damage are gulls, egrets, cormorants, pelicans, ospreys, terns, kingfishers, ducks and herons.
Reference Tharwat, M.E. 1997. Birds known to occur in Egypt. Natural
Biodiversity Unit. No. 8. Arab Republic of Egypt, Cabinet of Ministers, Egyptian Environmental Affairs Agency Department of Natural Protection. 203 p.
THARWATIFish-eating birds 8 1
Age and Growth of Oreochromis niloticus L. and Sarotherodon ealilaeus Art.
H.A. Adam Fishery Management Center, High Dam Lake Development Authority,Aswan, Egypt
Adam, H.A.2000.Age and growth of Oreochromis niloticus L.and Sarotherodon galilaeus Art., p.83-84. In J.F. Craig (ed.) Sustainable fish production in Lake Nasser: ecological basis and management policy. ICLARM Conf. Proc. 6 1, I84 p.
ABSTRACT
Scales were used t o age and estimate the growth of Oreochromis niloticus L. and Sarotherodon galilaeusArt.The average standard lengths o f 0. niloticus for the successive age groups I to IV years were 24 1,300,354 and 392 mm, respectively. For S.galilaeus, the average standard length for the successive age groups I t o Ill years were 224, 250 and 275 mm, respectively.
Introduction Oreochromis niloticus L. and Sarotherodon galilaeus Art.
are the most common species in Lake Nasser capture fishery. This study investigated the age and growth of the two species. Age and growth are parameters used in fisheries sci- ence and management.
The scales of 0. niloticus and S. galilaeus, used to age the fishes, are typically cycloid and fan-shaped. Concentric ridges or circuli are arranged around the focus, which may be cen- tral or slightly off center towards the posterior. Radial grooves extend from the focus to the anterior edge of the scale. The size of the scales varies from one location to another on the fish (Azim 1974). Different terms have been applied to the spaced circuli. In the present study, following Arora (1951), the boundary between the winter and the succeeding sum- mer band is considered as a year mark. The use of the scale method for age and growth studies of species of tilapia has been validated by others (Halden 19%; Jensen 1958; El Bolock and Koura 1960,1961; Elester and Jensen 1960; El Zarka 1961: Azim 1974) but not in this study.
Materials and methods Random samples of 0 . niloticus and S, galilaeus were
collected monthly from January 1989 to December 1990. For each individual fish, the date and locality caught were re- corded and the standard length was measured to the nearest
millimeter using a measuring board. Scales from each f~sh were collected from the left side below the lateral line behind the pectoral fin, and stored in envelopes. The location from which the scales were taken was consistent throughout. This consistency was shown by Joris (1957) and EI-Zarka (1959) to be a necessary precaution to avoid discrepancies that might arise during growth calculations. Before reading, the scales were cleaned with 10% ammonium hydroxide solution, washed with distilled water, and mounted dry between two glass slides bound with tape. They were examined with the help of a scale projector.
Results and conclusions The average standard lengths of 0. niloticus for succes-
sive age groups I to IV years were 241,300,354 and 392 mm, respectively. The growth increment in length was greatest in the first year and markedly decreased with age. For S. galilaeus, the average standard lengths for the successive age groups I to 111 years were 224, 250 and 275, mm respectively. As with 0. niloticus, the growth increment was greatest in the first year and decreased with age.
References Arora, H.L. 1951. An investigation of the California sand dab
Citharichthys sordidus (Girard). Calif. Fish Game 37(1):3-42.
ADAMlAge and growth of Oreochrornis niloticus L. . . . 83
Azim, M.E.A. 1974. Biological studies on Tilapia niloticus L. and Tilapia galilaea Art. in Lake Nasser. Faculty of Science, Alexan- dria University, Egypt. M.S. thesis.
El-Bolock, A.R and R. Koura. 1960. Age, growth and breeding sea- son of Tilapia zillii Gerv. In Egyptian experimental ponds. Notes Mem. 49:l-36. Institute of Freshwater Biology, Cairo.
El-Bolock, A.R. and R. Koura. 1961. The age and growth of Tilapia galilaea Art., T. nilotica L, and 7: zillii Gew. from Beteha area (Syrian Region). Notes Mem. 59:l-27. Institute of Freshwater Biology, Cairo.
Elester, H.J. and K.W. Jensen. 1960. Lirnnological and fishery inves- tigations of Nozha Hydrodrome near Alexandria, Egypt, 1954- 1956. Notes Mem. Institute of Freshwater Biology, Cairo.
El-Zarka, S. 1959. Fluctuations in the population of yellow perch, Percu~uuescens (Mitchill) in Saginaw Bay, Lake Huron. Fish. Bull. U.S. Fish Wildl. Sew. 151:365-415.
El-Zarka, S. 1961. Tilapia fisheries investigations in Egyptian lakes. I Annulus formation on the scales of the cichlid fish T zillii Gew. and its validity in age and growth studies. Notes Mem. 60:l-18. Institute of Freshwater Biology, Cairo.
Halden, M.J. 1955. Ring formation in the scales of Tilapia variabilb Bonl. and T. esculenta Goham from Lake Victoria. E. Afr. Fish. Res. Org. Annu. Rep. 1954-1955. Appendix C.
Jensen, K.W. 1958. Determination of age and growth of Tilapia nilotica L., T. galilaea Art., T. rillii Gerv. and Lates niloticus L. by means of their scales. K. Norske Vidensk. Selsk. Forh. 30:150-157.
Joris, L. 1957. Structure and growth of scales of yellow perch of Green Bay. Trans. Am. Fish. Soc. 86:169-194.
84 Sustainable fish production in Lake Nasser
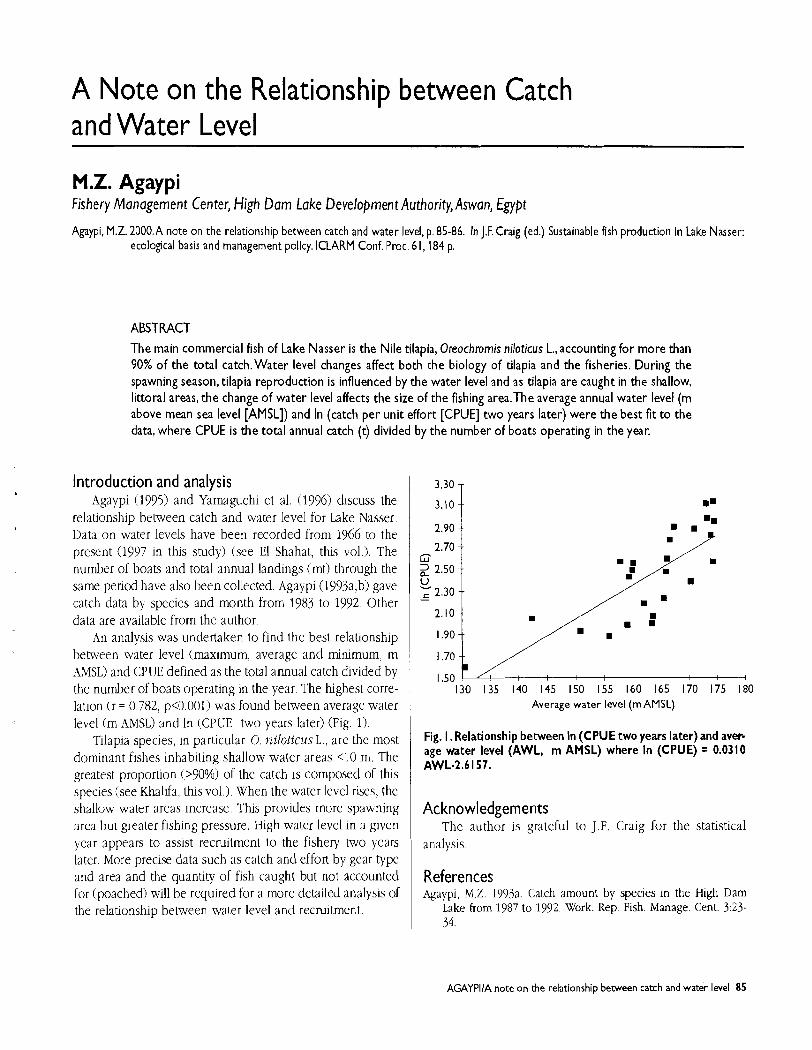
A N o t e on the Relationship between Catch and Water Level
M.Z. Agaypi Fishery ~ana~ement Center, High Dam Lake Development Authority,Aswan, Egypt
Agaypi, M.Z. 2000.A note on the relationship between catch and water level, p. 85-86. In J.F. Craig (ed.) Sustainable fish production in Lake Nasser: ecological basis and management policy. ICLARM Conf. Proc, 6 I, 184 p.
ABSTRACT The main commercial fish o f Lake Nasser is the Nile tilapia, Oreochromis niloticus L.,accounting for more than 90% of the total catch.Water level changes affect both the biology of tilapia and the fisheries. During the spawning season, tilapia reproduction is influenced by the water level and as tilapia are caught in the shallow, littoral areas, the change o f water level affects the size of the fishing area.The average annual water level (m above mean sea level [AMSL]) and In (catch per unit effort [CPUE] two years later) were the best fit t o the data, where CPUE is the total annual catch (t) divided by the number o f boats operating in the year.
Introduction and analysis . Agaypi (1995) and Yarnaguchi et al. (1996) discuss the
relationship between catch and water level for Lake Nasser. Data on water levels have been recorded from 1966 to the present (1997 in this study) (see El Shahat, this vol.). The number of boats and total annual landings (mt) through the same period have also been collected. Agaypi (1993a,b) gave catch data by species and month from 1983 to 1992. Other data are available from the author.
An analysis was undertaken to find the best relationship between water level (maximum, average and minimum, m AMSL) and CPUE defined as the total annual catch divided by the number of boats operating in the year. The highest corre- lation (r = O 782, p<0.001) was found between average water level (m AMSL) and In ('CPUC two years later) (Fig. 1).
Tilapia species, in particular 0, niloticus L., are the most dominant fishes inhabiting shallow water areas 4 0 m. The greatest proportion (>90%) of the catch is composed of this species (see Khalifa, this vol.). When the water level rises, the shallow water areas increase. This provides rriore spawning area but greater fishing pressure. High water level in a given year appears to assist recruitment to the fishery two years later. More precise data such as catch and effort by gear type and area and the quantity of fish caught but not accounted for (poached) will be required for a more detailed analysis of the relationship between water level and recruitment.
130 135 140 145 150 155 160 165 170 175 180 Average water level (m AMSL)
Fig. I. Relationship between In (CPUE two years later) and avep age water level (AWL, m AMSL) where In (CPUE) = 0.0310 AWL-2.6 157.
Acknowledgements Thc author is grateful to J.F. Craig for the statistical
analysis.
References Agaypi, M.Z. 1993a. Catch amount by species in the High Dam
Lake from 1987 to 1992. Work. Rep. Fish. Manage. Cent. 3 2 3 - 34.
AGAYPIIA note on the relationship between catch and water level 85
Agaypi, M.Z. 1993b. Preliminary studies on the catch amount of fish in the High Dam Lake from 1983 to 1986. Work. Rep. Fish. Manage. Cent. 31-22,
Agaypi, M.Z. 1995. A preliminary report OF catch corresponding to the water level in the High Dam Lake from 1987 to 1992. Work. Rep. Fish. Manage. Cent. 4:25-32.
Yamaguchi, Y., N. Hirayama, S. Yamada, A. Koiki, and M. Zaki. 1996. Regression model for predicting a catch from water level of High Dan1 Lake in Egypt. Work. Rep. Fish. Manage. Cent. 5:121-132.
86 Sustainable fish production in Lake Nasser
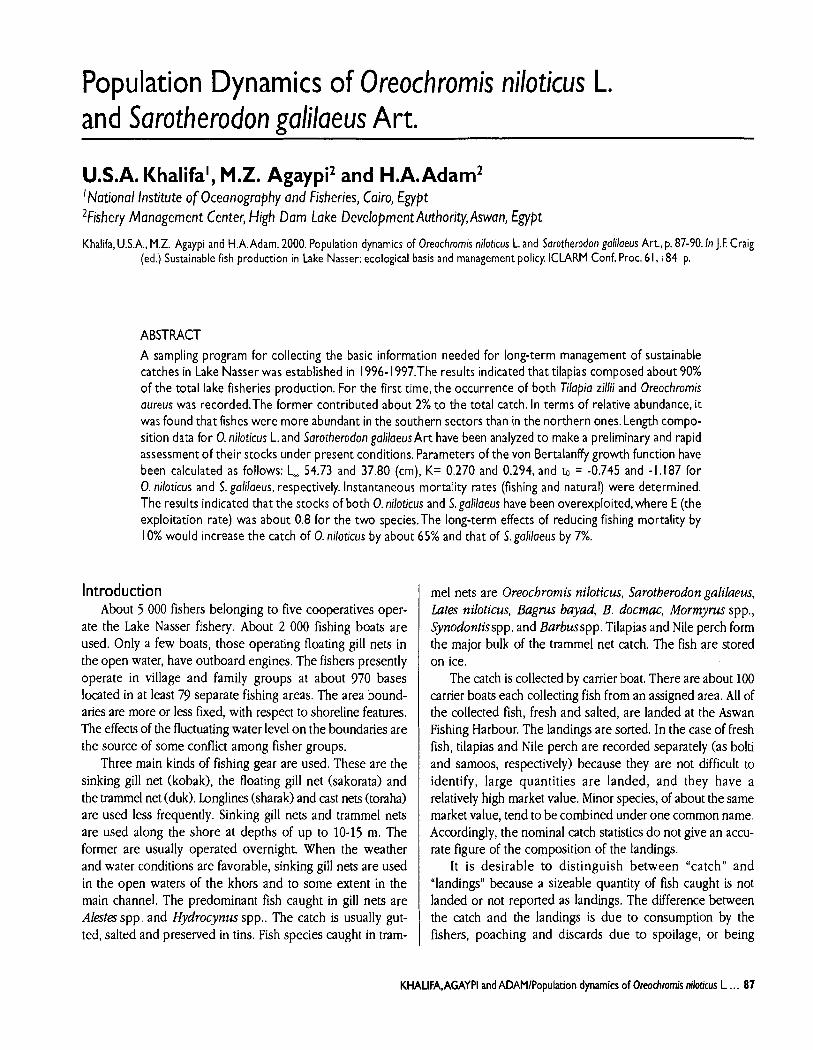
Population Dynamics of Oreochromis niloticus L. and Sarotherodon galilaeus Art.
U.S.A. Khalifa', M.Z. Agaypi2 and H.A.Adam2 'National Institute of Oceanography and Fisheries, Cairo, Egypt 2Fishery Management Center, High Dam Lake DevelopmentAuthority,Aswan, Egypt
Khalifa, U.S.A., M.Z. Agaypi and H.A.Adam. 2000. Population dynamics of Oreochromis nilotrcus L. and Sorotherodon galilaeus Art., p. 87-90. In J.F. Craig (ed.) Sustainable fish production in Lake Nasser: ecological basis and management policy. ICLARM Conf. Proc. 6 1 , 184 p.
ABSTRACT
A sampling program for collecting the basic information needed for long-term management of sustainable catches in Lake Nasser was established in 1996- 1997.The results indicated that tilapias composed about 90% of the total lake fisheries production. For the first time, the occurrence of both Tilapia zillii and Oreochromis aureus was recorded.The former contributed about 2% to the total catch. In terms of relative abundance, i t was found that fishes were more abundant in the southern sectors than in the northern ones. Length compo- sition data for 0. niloticus L. and Sarotherodon galilaeus Ar t have been analyzed to make a preliminary and rapid assessment of their stocks under present conditions. Parameters of the von Bertalanffy growth function have been calculated as follows: L, 54.73 and 37.80 (cm), K= 0.270 and 0.294, and to = -0.745 and - 1 . I87 for 0. niloticus and S. galilaeus, respectively. Instantaneous mortality rates (fishing and natural) were determined. The results indicated that the stocks of both 0. niloticus and S. galilaeus have been overexploited, where E (the exploitation rate) was about 0.8 for the two species.The long-term effects of reducing fishing mortality by 10% would increase the catch of 0. niloticus by about 65% and that of S. galilaeus by 7%.
Introduction About 5 000 fishers belonging to five cooperatives oper-
ate the Lake Nasser fishery. About 2 000 fishing boats are used. Only a few boats, those operating floating gill nets in the open water, have outboard engines. The fishers presently operate in village and family groups at about 970 bases located in at least 79 separate fishing areas. The area bound- aries are more or less fxed, with respect to shoreline features. The effects of the fluctuating water level on the boundaries are the source of some conflict among fisher groups.
Three main kinds of fishing gear are used. These are the sinking gill net (kobak), the floating gill net (sakorata) and the trammel net (duk). Longlines (sharak) and cast nets (toraha) are used less frequently. Sinking gill nets and trammel nets are used along the shore at depths of up to 10-15 m. The former are usually operated overnight. When the weather and water conditions are favorable, sinking gill nets are used in the open waters of the khors and to some extent in the main channel. The predominant fish caught in gill nets are Alestes spp. and Hydrocynus spp.. The catch is usually gut- ted, salted and preserved in tins. Fish species caught in tram-
mel nets are Oreochromis niloticus, Sarotherodon galilaeus, Lutes niloticus, Bagrus bayad, B, docmac, Mormyrus spp., Synodontisspp. and Barbusspp. Tilapias and Nile perch form the major bulk of the trammel net catch. The fish are stored on ice.
The catch is collected by carrier boat. There are about 100 carrier boats each collecting fish from an assigned area. All of the collected fish, fresh and salted, are landed at the Aswan Fishing Harbour. The landings are sorted. In the case of fresh fish, tilapias and Nile perch are recorded separately (as bolti and samoos, respectively) because they are not difficult to identify, large quantities are landed, and they have a relatively high market value. Minor species, of about the same market value, tend to be combined under one common name. Accordingly, the nominal catch statistics do not give an accu- rate figure of the composition of the landings.
It is desirable to distinguish between "catch" and "landings" because a sizeable quantity of fish caught is not landed or not reported as landings. The difference between the catch and the landings is due to consumption by the fishers, poaching and discards due to spoilage, or being
KHALIFA,AGAYPI and ADAMlPopulation dynamics of Oreochromis niloticus L .. . 87
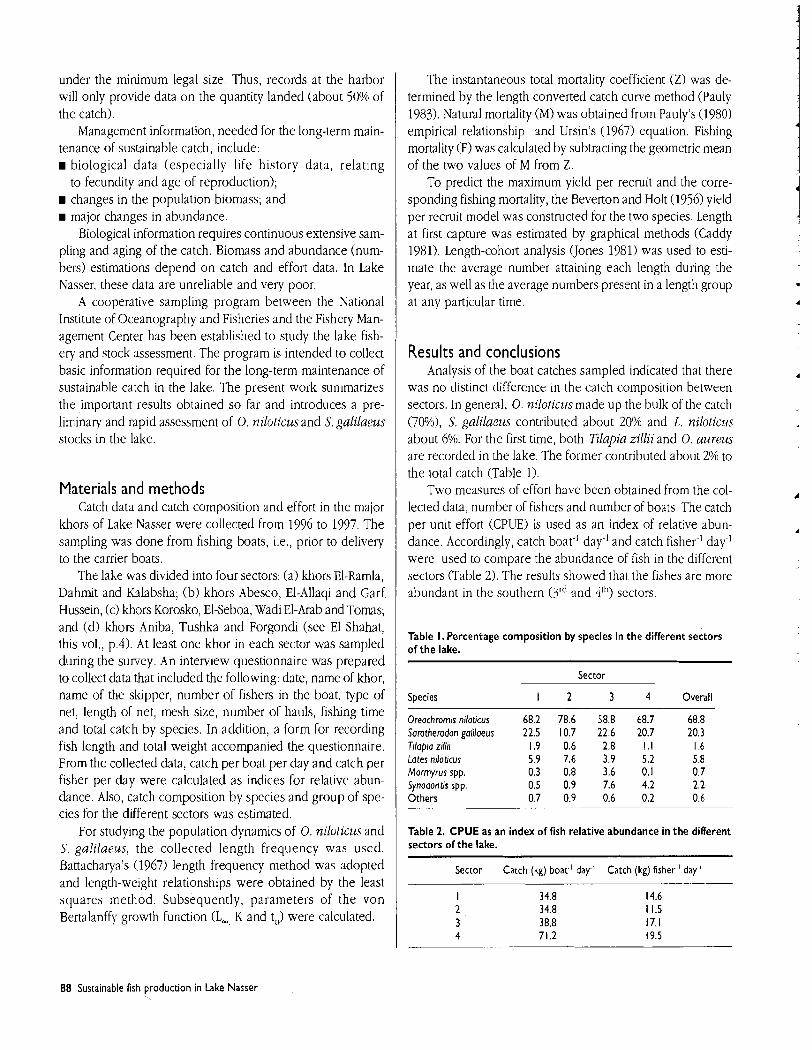
under the minimum legal size. Thus, records at the harbor will only provide data on the quantity landed (about 50% of the catch).
Management information, needed for the long-term main- tenance of sustainable catch, include: I biological data (especially life history data, relattng
to fecundity and age of reproduction); I changes in the population biomass; and
major changes in abundance. Biological information requires continuous extensive sam-
pling and aging of the catch. Biomass and abundance (num- bers) estimations depend on catch and effort data. In Lake Nasser, these data are unreliable and very poor.
A cooperative sampling program between the National Institute of Oceanography and Fisheries and the Fishery Man- agement Center has been established to study the lake fish- ery and stock assessment The program is intended to collect basic information required for the long-term maintenance of sustainable catch in the lake. The present work summarizes the important results obtained so far and introduces a pre- liminary and rapid assessment of 0. nzloticus and S. galilaeus stocks in the lake.
Materials and methods Catch data and catch composition and effort in the major
khors of Lake Nasser were collected from 1996 to 1977. The sampling was done from fishing boats, i.e., prior to delivery to the carrier boats.
The lake was divided into four sectors: (a) khors El-Rarnla, Dahrnit and Kalabsha; (b) khors Abesco, El-Allaqi and Garf Hussein; (c) khors Korosko, El-Seboa, Wadi El-Arab and Tornas; and (d) khors Aniba, Tushka and Forgondi (see El Shahat, this vol., p.4). At least one khor in each sector was sampled during the survey. An interview questionnaire was prepared to collect data that included the following: date, name of khor, name of the skipper, number of fishers in the boat, type of net, length of net, mesh size, number of hauls, fishing time and total catch by species. In addition, a form for recording fish length and total weight accompanied the questionnaire. From the collected data, catch per boat per day and catch per fisher per day were calculated as indices for relative abun- dance. Also, catch composition by species and group of spe- cies for the different sectors was estimated.
For studying the population dynamics of 0. niloticus and S , galilaeus, the collected length frequency was uscd. Battacharya's (1967) length frequency method was adopted and length-weight relationships were obtained by the least squares method. Subsequently, parameters of the von Bertalanffy growth function (L,, K and t& were calculated.
The instantaneous total mortality coefficient (Z) was de- termined by the length converted catch curve method (Pauly 1983). Natural mortality (M) was obtained from Pauly's (1980) empirical relationship and Ursin's (1967) equation. Fishing mortality (F) was calculated by subtracting the geometric mean of the two values of M from Z.
To predict the maximum yield per recruit and the corre- sponding fishing mortality, the Beverton and Holt (1956) yield per recruit model was constructed for the two species. Length at first capture was estimated by graphical methods (Caddy 1981). Length-cohort analysis Uones 1781) was used to esti- mate the average number attaining each length during the year, as well as the average numbers present in a length group at any particular time.
Results and conclusions Analysis of the boat catches sampled indicated that there
was no distinct difference in the catch composilion belween sectors. In general, 0. niloticus made up the bulk of the catch (70%), S. galilaeus contributed about 20% and L. niloticus about 6%. For the first time, both Tilapia zillii and 0. aureus are recorded in the lake. The former contributed about 2% to the total catch (Table 1).
Two measures of effort have been obtained from the col- lected data, number of fishers and number of boats. The catch per unit effort (CPUE) is used as an index of relative abun- dance. Accordingly, catch boar1 day-' and catch fisher-' day-' were used to compare the abundance of fish in the different sectors (Table 2). The results showed that the fishes are more abundant in the southern ( 3 1 ~ and 4'h) sectors.
Table I . Percentage composition by species in the different sectors of the lake.
Sector
Species 1 2 3 4 Overall
Oreochromis niloticus 68.2 78.6 58.8 68.7 68.8 Sorotherodon golilaeus 22.5 10.7 22.6 20.7 20.3 Tilopla zil111 1.9 0.6 2.8 1.1 1.6 Lotes niloticus 5.9 7.6 3.9 5.2 5.8 Morrnyrus spp. 0.3 0.8 3.6 0.1 0.7 Synodontis spp. 0.5 0.9 7.6 4.2 2.2 Others 0.7 0.9 0.6 0.2 0.6
Table 2. CPUE as an index of fish relative abundance in the different sectors of the lake.
Sector Catch (kg) boat-' day-' Catch (kg) fisher.' day-'
88 Sustainable fish production in Lake Nasser
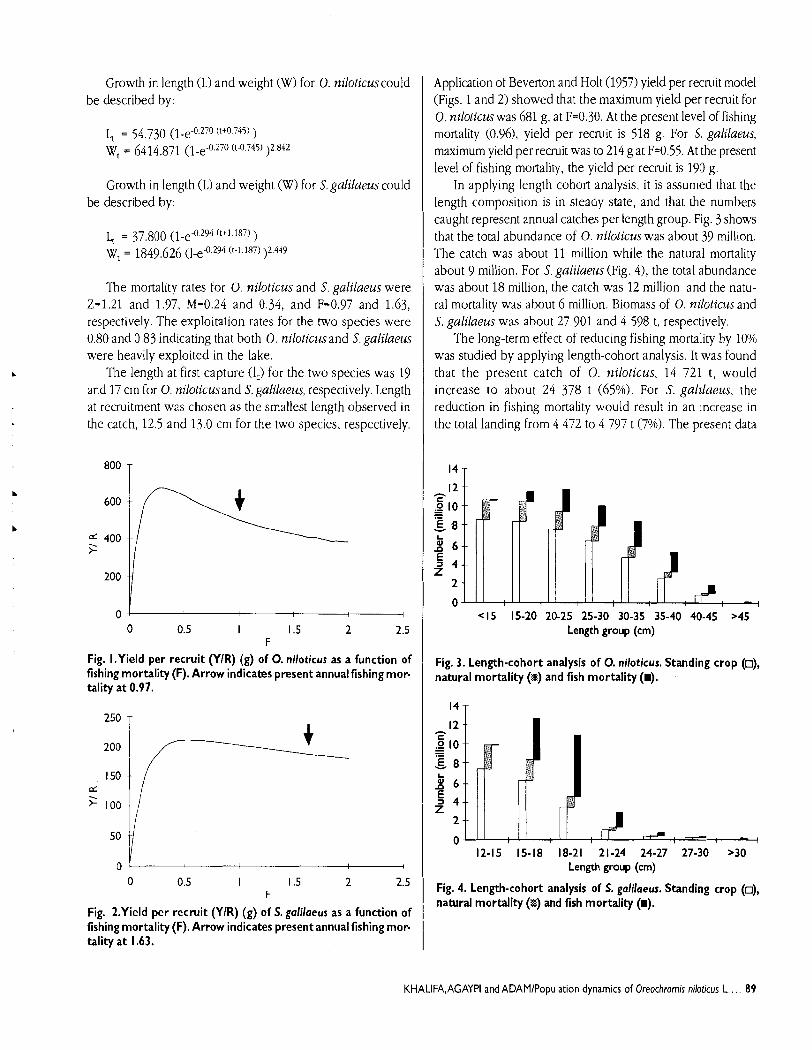
Growth in length (L) and weight (W) for 0. niloticuscould be described by:
Growth in length (L) and weight (W) for S. galilaeus could be described by:
The mortality rates for 0. niloticus and S, galilaeus were 2=1.21 and 1.97, M=0.24 and 0.34, and F=0.97 and 1.63, respectively. The exploitation rates for the two species were 0.80 and 0.83 indicating that both 0. niloticus and S. galilaeus were heavily exploited in the lake.
The length at first capture (I,) for the two species was 19 and 17 cm for 0. niloticusand S. galilaeus, respectively. Length at recruitment was chosen as the smallest length observed in the catch, 12.5 and 13.0 cm for the two species, respectively.
Fig. I .Yield per recruit (YIR) (g) of 0. niloticus as a function of fishing mortality (F). Arrow indicates present annual fishing mor- tality at 0.97.
Fig. 2.Yield per recruit (YIR) (g) of S. galilaeus as a function of fishing mortality (F). Arrow indicates present annual fishing mop tality at 1.63.
Application of Beverton and Holt (1957) yield per recruit model (Figs. 1 and 2) showed that the maximum yield per recruit for 0. niloticus was 681 g, at F=0.30. At the present level of fishing mortality (0.96), yield per recruit is 518 g. For S. galilaeus, maximum yield per recruit was to 214 gat F=0.55. At the present level of fishing mortality, the yield per recruit is 190 g.
In applying length cohort analysis, it is assumed that the length composition is in steady state, and that the numbers caught represent annual catches per length group. Fig. 3 shows that the total abundance of 0. niloticzfi was about 39 million. The catch was about 11 million while the natural mortality about 9 million. For S. galilaeus (Fig. 41, the total abundance was about 18 million, the catch was 12 million and the natu- ral mortality was about 6 million. Biomass of 0. niloticus and S. galiheus was about 27 901 and 4 598 t, respectively.
The long-term effect of reducing fishing mortality by 10% was studied by applying length-cohort analysis. I t was found that the present catch of 0. niloticus, 14 721 t , would increase to about 24 378 t (65%). For S. galilaeus, the reduction in fishing mortality would result in an increase in the total landing from 4 472 to 4 797 t (7%). The present data
<I5 15-20 20-25 25-30 30-35 35-40 40-45 >45 Length group (cm)
Fig. 3. Length-cohort analysis of 0. niloticus. Standing crop (a), natural mortality (a) and fish mortality (I).
12-15 15-18 18-21 21-24 24-27 27-30 >30 Length group (cm)
Fig. 4. Length-cohort analysis of S. galilaeus. Standing crop (o), natural mortality (B) and fish mortality (I).
KHALIFA,AGAYPI and ADAMIPopulation dynamics of Oreochrornis niloticus L. . . . 89
are only preliminary and the sampling program should be continued on a regular basis.
References Battacharya, C.G. 1967. A simple method of resolution of a distribu-
tion into Gussian components. Biometrics 231 15-135. Beverton, R.J.H. and S.J. Holt. 1956. A review of methods for esti-
mating mortality rates in fish populations, with special refer- ence to sources of bias in catch sampling. Rapp. P.V. Reh . Cons. Int. Explor. Mer 14067-83.
Beverton, R.J.H. and S.J. Holt. 1957. On the dynamics of exploited fish populations. Fish. Invest. Ser. 11. 19: 533 p.
Caddy, J.F. 1981. Use of Beverton and Holt yield tables for preliminary assessment of effects of changes in size at first cap- ture and fishing effort in a mixed species fishery. FA0 Fish. Rep. 263, 165 p.
Jones, R. 1981. The use of length composition data in fish stock assessments (with notes on VPA and cohort analysis). FA0 Fish. Circ. 734, 55 p.
Pauly, D. 1980. On the interrelationships between natural mortality, growth parameters and mean environmental temperature in 175 fish stocks. J. Cons. Perm. Int. Explor. Mer. 39 (3) 175-192.
Pauly, D. 1983. Some simple methods for the assessment of tro- pical fish stocks. FA0 Fish. Tech. Pap. 234, 52 p.
Ursin, E. 1967. A ~nathematical model of some aspects of fish growth. respiration and mortality. J. Fish. Res. Bd. Can. 24(11):2355- 2453.
90 Sustainable fish production in Lake Nasser
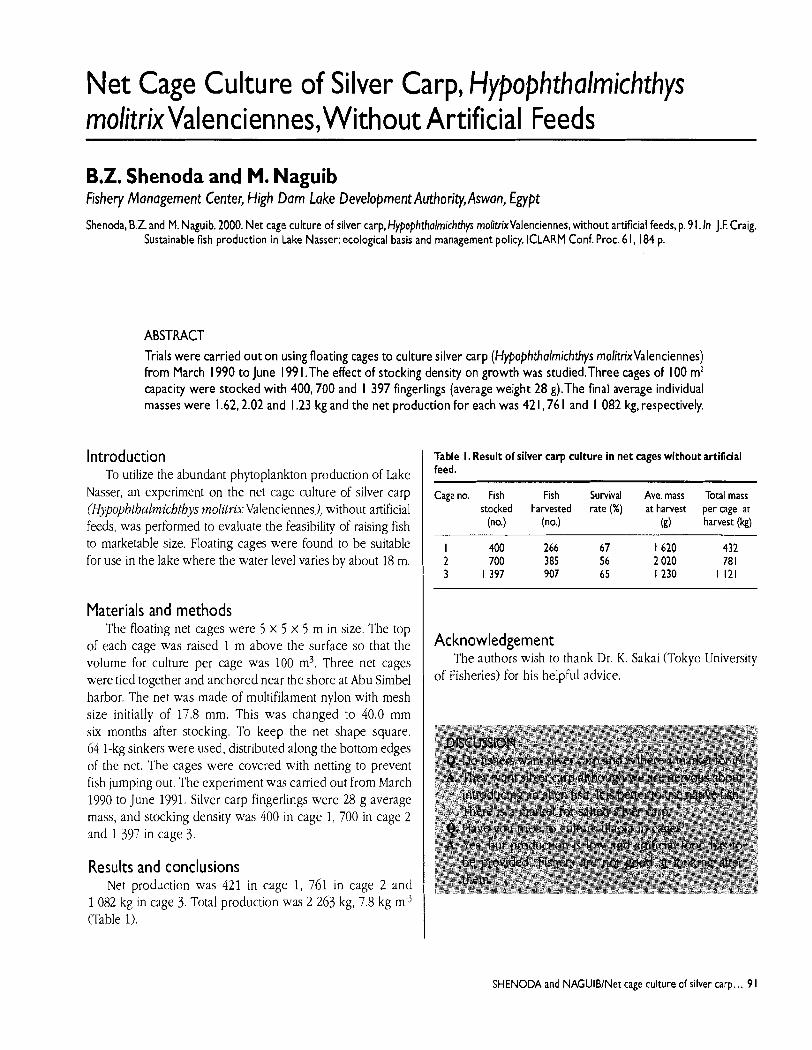
Net Cage Culture of Silver Carp, Hypophthalmichthys rnolitrixValenciennes, Without Artificial Feeds
B.Z. Shenoda and M. Naguib Fishery Management Center, High Dam Lake DevelopmentAuthority,Aswan, Egypt
Shenoda, B.Z. and M. Naguib. 2000. Net cage culture of silver carp, Hypophthalrnichthys rnolitrixValenciennes, without artificial feeds, p. 9 I. In J.F. Craig. Sustainable fish production in Lake Nasser: ecological basis and management policy. ICLARM Conf. Proc. 6 1,184 p.
ABSTRACT Trials were carried o u t o n using floating cages t o culture silver carp (Hypophthalmichthys molitrixValenciennes) f rom March 1990 t o June 199 I .The effect o f stocking density on growth was studied.Three cages o f I 0 0 m2 capacity were stocked w i th 400,700 and 1 397 fingerlings (average weight 28 g).The final average individual masses were 1.62,2.02 and 1.23 kg and the net product ion f o r each was 42 1,76 1 and 1 082 kg, respectively.
Introduction To utilize the abundant phytoplankton production of Lake
Nasser, an experiment on the net cage culture of silver carp (Hypophthalmichthys molitrix Valenciennes), without artificial feeds, was performed to evaluate the feasibility of raising fish to marketable size. Floating cages were found to be suitable for use in the lake where the water level varies by about 18 m.
Materials and methods The floating net cages were 5 x 5 x 5 m in size. The top
of each cage was raised 1 m above the surface so that the volume for culture per cage was 100 m3. Three net cages were tied together and anchored near the shore at Abu Simbel harbor. The net was made of multifilament nylon with mesh size initially of 17.8 mm. This was changed to 40.0 mm six months after stocking. To keep the net shape square, 64 1-kg sinkers were used, distributed along the bottom edges of the nct. Thc cages were covered with netting to prevent fish jumping out. The experiment was carried out from March 1990 to June 1991. Silver carp fingerlings were 28 g average mass, and stocking density was 400 in cage 1, 700 in cage 2 and 1 397 in cage 3.
Results and conclusions Net production was 421 in cage 1, 761 in cage 2 and
1 082 kg in cage 3. Total production was 2 263 kg, 7.8 kg m-j (Table 1).
Table I. Result of silver carp culture in net cages without artificial feed.
Cage no. Fish Fish Survival Ave. mass Total mass stocked harvested rate (%) at harvest per cage a t
(no.) (no.) (g) harvest (kg)
Acknowledgement The authors wish to thank Dr. K. Sakai (Tokyo University
of Fisheries) for his helpful advice.
SHENODA and NAGUIBINet cage culture of silver carp ... 91
Fisheries Management and Enhancement
M.M. El Shahat Fishery Management Center, High Dam Lake Development Authority, Aswan, Egypt
El Shahat, M.M.2000. Fisheries management and enhancement, p.93-94. In Craig (ed.) Sustainable fish production in Lake Nasser:ecological basis and management policy. ICLARM Conf. Proc. 6 1, I84 p.
ABSTRACT
Lake Nasser is an important source of fish for Egyptians.The High Dam Lake Development Authority is responsible for the management and development of the lake fisheries. Its goal is to maximize fish production and utilize the high lake productivity through several procedures and regulations: (a) a closed fishing season; (b) restrictions on gear type and mesh size; (c) determination of size for marketing; (d) production and restocking of native fish species; (e) establishment of infrastructureand ice plants at fish landing centers in the north and south regions of the lake;and (f) social welfare of the fishers through policy concern, construction of shelters and provision of medical care.
The High Dam Lake Development Authority (HDLDA) is responsible for the utilization of the natural resources in the lake region including fisheries, agriculture, mining and ser- vices.
To manage the fisheries industry, HDLDA controls research, administration and production. Management is achieved by a variety of techniques: I There is a closed fishing season during the peak of the
Oreochromis niloticus L. (tilapia) spawning season. rn Closed areas have been established to maintain tilapia stocks.
There are restrictions on gear type to prevent catching immature fish. Production (in hatcheries) and restocking of native and exotic fish species to enhance the lake's fish populations are being practiced.
rn Fish-landing and harbor facilities have been constructed at Aswan and Abu Simbel (300 km from the High Dam) to improve fish handling conditions. I Workshops and a floating dry dock have been constructed
for carrier boat maintenance. Fishers' societies and companies have been established for fish production, processing and marketing. The Misr Aswan Company for fishing and processing is one of the biggest companies in the region. I Carrier vessels have been designed and constructed to trans-
port fish and to keep it fresh.
rn Ice plants have been established in Aswan and Abu Sirnbel for the fishing carrier boats. I Experiments on aquaculture techniques and fish farming.
including fish propagation of native species, are being un- dertaken. Net cage culture has been used to test the poten- tial for the introduction of new species in the lake. Fish farming in khors and enclosures has been carried out to increase fish production.
D Fish meal is produced from fish waste and used in animal feeds.
rn A fish pellet factory has been constructed. rn Environmental, physical, chemical and biological studies
are being undertaken. A tentative relationship between fish and primary production has been derived.
r Special procedures to prevent lake pollution are being undertaken by applying Egyptian environmental laws. Pollution is monitored and controlled. HDLDA has taken all precautions to prevent sewage water from entering the lake.
m Studies on fishing operations and nets are being under- taken to develop fishing gear technology.
w Fishers' living conditions havc been improved by esta- blishing shelters, providing medical care and supplying food.
EL SHAHATIFisheries management and enhancement 93

94 Sustainable fish production in Lake Nasser
Harvesting,Transporting, Processing and Marketing of Fish
A. Barrania Institute of National Planning, Cairo, Egypt
Barrania,A. 2000. Harvesting, transporting, processing and marketing of fish, p. 95-97. In J.F. Craig (ed.) Sustainable fish production in Lake Nasser: ecological basis and management policy. ICLARM Conf. Proc. 61, 184 p.
ABSTRACT
The storage of water in Lake Nasser commenced in 1964. Fish landings increased progressively during the period 1966- 198 1 . However, during 1982- 1997, the landings tended to decrease. In 1997 landings were esti- mated at 20 000 t.This was due mainly to the low water level and overfishing.About 90% of the fish were tilapia species.The most common gears used were trammel nets (duk) and gill nets (kobak) operated from small boats, most of which were equipped with outboard engines.The 4 000 fishers were dispersed over about 500 fishing bases of variable location,which were used as fish collecting sites. Approximately 10-20% of the fish caught were salted.To transport the fish (both fresh and salted) to the receiving harbor,a number of boats of varying sizes were operated by fishers' cooperative societies.The collection of the catch was rather poorly organized. The marketing of iced fish was done mostly by the Egyptian Marketing Company (EMC). Processed fish were marketed jointly by the Misr Aswan Company (MAC) and EMC, while fishers' coopera- tive societies were responsible for the marketing of salted fish. Price regulations for fresh fish caught were enforced, which led to smuggling of considerable quantities. Proper fisheries management, improvement in the fish collection system and the establishment of appropriate pricing policies are strongly recommended to achieve the predicted potential yield.
Introduction The purpose of th~s paper is to provide a brief description
of the present status as well as development requirements of harvesting, transportation, processing and marketing of Lake Nasser fish. The sources of information and data used include previous studies and records of the High Dam Lake Development Authority and the fishers' cooperative societies a5 well as field trips, observations and interviews with many people.
Fishing operations The lake is divided into five fishing zones, affiliated to
five different organizations (see El Shahat, this vol., p. 4). Fishing operations are carried out by fishers (4 000 in 1996), who are based along the shore or on small islands. There were an estimated 500 fishing bases in 1996. However, this number varies as locations are not fixed. The bases are sited
near suitable fishing grounds and where they can be reached directly by the carrier boats.
Two types of locally made wooden boat are used mainly in Lake Nasser. In the northern half of the lake, the fishers use flat-bottomed, canoe-type, Alexandrine boats. As most of the fishing is in the khors (inlets), these boats are adequate as rough water is rarely encountered. In the southern part of the lake, the traditional "Nile River" fishing boats, which are heavier and broader, are used. Both types of boats are reasonably cheap to build and are adequate for fishing and transporta- tion. In 1996, the number of fishing boats was estimated at 2 834, most of which are equipped with outboard engines of 15 hp or more.
Gill and trammel nets are used for fishing. Alestes spp. and Hydrocynzls spp. are mainly caught in floating gill nets (sakorata) and most are salted. Trammel nets (duk) are used to catch Oreochromis niloticus, Lutes niloticus and Bugrus spp. which are processed fresh.
BARRANIAlHarvesting, transporting, processing and marketing of fish 95
Fish landings Recorded annual data are available from 1966 to 1997
and are given by El Shahat (this vol., p. 3). The fish are usu- ally landed at the Aswan High Dam port either fresh or salted. The contribution of salted fish decreased gradually from >50% in the 1960s to about 10% in the 1990s. This may be due to overfishing of the fish species that are salted, as they are sold at free market prices, compared to species that are marketed fresh which have lower enforced market prices. The most important species in the 1996 landings were 0, niloticus(84%) and L. niloticus (4%).
The highest landings were observed in March, Septem- ber, November and December in 1996 (Table 1). A closed season has been imposed since 1991 for the period 15 April to 31 May, the main spawning period of tilapia in the lake.
Fish transportation Fresh and tins of salted fish (see below) are transported
from the different regions of the lake (fishing bases) to the fish-receiving port at Aswan High Dam by a number of carry- ing boats (approximately 102 of varying sizes and capacity) operated by the MAC and the fishers' cooperative societies. Some of the carrying boats have refrigeration units while oth- ers use ice in the holds to preserve the fish. The fishers de- pend on the carrying boats not only to collect the fish, but also to supply goods, including salt used for preservation of some species, and for personal transport. However, it is re- ported that the carrying boats are not fully utilized. After the construction of the Aswan to Abu Simbel road, fishers started to smuggle the catch from many of the sites. Further, the carrying boats are not always accessible to all the fishers.
Salted fish In recent years, about 7-12% of the fish caught from Lake
Nasser has been salted. The prominent fish salted are Alestes spp., Labeo spp., Hydrocynus spp. and Eutropius niloticus. The fish caught are sun-dried for about 24 hours. The larger fish are gutted before being salted while smaller ones are salted whole. The fish are rubbed with salt then packed in tins. They are transported to the salted fish marketing center and separated by species and packed in separate tins. At this stage, the quantity of salt is adjusted. The tins are then tightly sealed and stored. The fish are ready for consumption after three months. Salted fish from Lake Nasser are subject to spoil- age and heavy losses. They are considered to be a low-grade product.
Table I. Monthly landings (t ) of fresh and salted fish, 1996.
Month Fresh fish Salted fish Total
January 1 329 177 1 506 February 1 125 130 1 255 March 2 844 140 2 984 April 1210 175 1 385 May 216 79 296 June 1414 117 1531 July 1 164 230 1 394 August 1 488 269 1 757 September 1 892 265 2 157 October 1 628 272 1 899 November 1913 191 2 104 December 1 937 336 2 274
Total 18 159 2 381 20 540
Source: High Dam Lake Development Authority (HDLDA)
Fish marketing The Egyptian Marketing Company (EMC) markets most of
the iced fish. Both MAC and EMC market fish fillet products. Salted fish is sold through the Marketing Centre of Salted Fish in Aswan, where the product is auctioned to wholesalers under the control of representatives from the fishers' cooperative societies. Cairo is the main receiver of Lake Nasser fishes. Fewer are marketed in Aswan and the towns of Upper Egypt.
Price regulations for fresh fish are enforced. The prices are set by the Ministry of Supply and Trade, and are reviewed periodically. The final price to be paid to producers is de- cided after determining the degree of freshness. This system usually creates problems for all parties concerned and leads to smuggling of considerable quantities of the catch. The obligatory prices do not reflect the real economic ones. The black market has flourished and administering controlled prices has become difficult and expensive. The two available alter- natives are either to determine the economic price of fish based on the cost of production and marketing or according to the interaction between the forces of supply and demand, reflected through auctions occurring in other parts of Egypt.
Conclusions Development efforts should strive to improve the fisher-
ies management of the lake. Accurate data, including infor- mation about the real catch and fishing effort, are required. The current division of the lake into closed geographical ar- eas should be examined and revised if necessary. Fish han- dling, collection and processing are poor and need improvement. An appropriate pricing policy is needed.
96 Sustainable fish production in Lake Nasser
Recommendations To exploit the fisheries of Lake Nasser in a sustainable
manner, the following recommendations are suggested: a One body should administer the exploitation and manage-
ment of the whole lake instead of the boat owners who, at present, control most fishing areas of the lake The current distribution of fishers should be revised. The rules and regulations for fishing in the lake should be enforced.
a A thorough assessment of the stocks available and the~r distribution should be conducted so that the extent to which the lake can be safely fished at different water levels is known. The data provided from previous studies are mostly from fish landings at the Aswan High Dam port rather than the actual fish catches, and this has been a major constraint to analysis. The unexploited area in the pelagic region of the lake should be given attention.
a More efficient and economic alternatives for collection and transportation of fish from the fishing camps to the port should be investigated. This includes improving fish han- dling.
a Appropriate pricing policies are needed to encourage fish- ers to deal through legal channels.
BARRANIAIHarvesting, transporting, processing and marketing of fish 97
Some Socioeconomic Aspects
M,M. Mohieddin Menoufia University, Menoufia, Egypt
Mohieddin, M.M. 2000. Some socioeconomic aspects, p. 99-101. In J.F. Craig (ed.) Sustainable fish production in Lake Nasser: ecological basis and management policy. ICLARM Conf. Proc. 6 1,184 p.
ABSTRACT
This paper attempts to raise a debate on the current state of sociological research on Egyptian lakes. It stresses the need for a solid database as an essential starting point. Furthermore, it shows that the existing problems can only be understood when viewed from a perspective that takes into account not only the biophysical aspects of lakes but also the socioeconomic ones. In planning for the sustainable development of Lake Nasser, a thorough understanding of organizational, behavioral, environmental and political processes is required.The paper provides a brief assessment of the state of sociological research on lakes in Egypt fol- lowed by a review of the development of Lake Nasser and the consequences of the Aswan High Dam con- struction. It discusses the development of fishing activities and their concomitant aspects, i.e., production, organization and marketing.The paper also stresses the fact that the lake i s a contested terrain for several government agencies.This is a major problem that needs to be addressed if any meaningful policy on lake management is to be elaborated and effectively implemented.
Introduction To say that the sociology of lakes in Egypt is an under-
developed field of investigation is an understatement. The field is virtually nonexistent. A few academic studies and some related to applied projects are available (personal in- formation), but the subject is far from a coherent body of knowledge. This is surprising, given the fact that about 41% of Egypt's fish production in 1996 came from the 10 lakes and coastal depressions (GADF 1997). Furthermore, a con- siderable number of villages, towns and fishers and their families are almost totally dependent for their livelihood on these areas.
Of the lakes in Egypt, Lake Nasser stands out as one of the most understudied from the sociological point of view. In the Working Reports of the Fishery Management Center, issued by the High Dam Lake Development Authority (HDLDA), between 1993 and 1996, there is not a single study devoted to the social aspects of the lake. Another report on the developmental profile of the governments of Aswan and Qena makes a very hasty statement in reference to the lake: "Lake Nasser offers a unique opportunity for freshwater fish- ing, however, data on production in the governorate are not
available" (Nagi et al. 1994). Given the current state of knowl- edge on lakes in general and Lake Nasser in particular, this paper can only attempt to raise questions rather than pro- vide answers.
Lake Nasser and its impact The physical impacts of building the Aswan High Dam
were to flood land in the reservoir area, create a new body of water, change the amount and timing of the flow of water downstream and generate electrical power at the dam site. These impacts were expected to change the regional and national economy, provoke shifts in human settlements, and later alter the water relations of the alluvial lands of the river valley and the delta (White 1988).
The connections between physical and social effects were perceived as relatively direct: flooding the reservoir area would cause population dislocation, creating the new reservoir would provide fishing grounds and improve navi- gation, generation of power at the dam would increase elec- tricity supply and reduce energy prices, and the regulation of the stream flow would result in increased agricultural
MOHlEDDlNlSome socioeconomic aspects 99
downstream, and an opportunity to change crop patterns and water scheduling (White 1988).
The clearest losers resulting from the dam construction have been the 100 000 or more Nubians, half-Egyptian and half-Sudanese, who had to be evacuated from their homes in the zone and transferred to government-built villages far from the river (Pearce 1994). They settled in eight villages on newly irrigated lands in the Kom Ombo area, 20 km to the north of Aswan. The history of this mass evacuation in Egypt has been recorded (Kennedy 1977, 1978; Fahim 1982). Much less is known about the Sudanese who were moved to the area of Khashm el Gibra.
Some 30 years after their relocation, a few observations were made about the Nubians in Egypt. Their health had improved through a reduction in the incidence of infectious diseases. Their agricultural production remained relatively modest. Prompted by the efforts of social workers in the new villages, the Nubians had increased their interest and effec- tiveness in handicrafts. However, they were unhappy in their desert edge locations without their palm trees and river banks, and they were reported to be anxious to return to the river or the lakeshore (White 1988). The development project at Tushka may provide an opportunity for some of them to go back. The impact of their return on the aquatic environment of the lake and hence its fisheries is not known.
Since the 1960s, employment in the fishing industry has grown considerably. According to the 1960 census, the Gover- norate of Aswan had 547 fishers (Maslahat 1962). By 1966, there were about 600 working on 200 boats in the lake alone. These figures increased by almost 10 fold to reach 5 000 fish- ers and 2 000 boats in 1981, accounting for 5.7% and 6.0% average annual rate of increase for fishers and boats, respec- tively (GADF 1997). By comparison, the overall average an- nual growth rate of the labor force for the entire Governorate of Aswan during the intercensus period of 1976-1986 was 1.6% (CAPMAS 1978, 1989). These numbers have not signifi- cantly changed since 1981, and thus the lake provides few employment opportunities. Fishers working on Lake Nasser are organized in several cooperatives that vary in size as mea- sured by the number of boats under their control (see El Shahat, this vol., p. 6). According to GADF (1997) data, these coopera- tives had in their possession a total of 2 851 boats working in the lake in 1 9 7 (Table 1). The largest cooperative owned 1 431 boats, and the smallest had 61. It is not known if there are other boats fishing in the lake and if so what is their resistance or willingness to join the cooperatives.
For each of these cooperatives, a production target is set by GADF. In 1997, the production target was 34 164 t. Actual landings were at about 19 300 t, a difference of about 15 000 t (44%) between targeted and actual.
It is not clear how these production targets are set, or upon what assumption they were based. It is not clear if the fishers themselves are consulted about production targets. However, the general pattern is one of production shortage in all cooperatives, except for the Nubian cooperative, which comes very close to achieving its set target (99.7%) (Table 1).
These data clearly indicate that fishing performance is weak. This is so despite the fact that the Aswan Governorate is ranked third in the nation in terms of annual per capita production of fish, 39 kg. It has only been surpassed by the two Red Sea Governorates, Suez (95 kg) and the Red Sea (55 kg).
It is worth noting that the statistics on the lake's yield (see El Shahat, this vol., p. 6) are highly variable and subject to controversy. Data from HDLDA set production for 1996 at 20 540 t (about 4.8% of the total national production of fish). Data from GADF indicated production at about 45 401 t in the same year (about 10.5% of the total Egyptian production). Although there has been a systemic decline in production in the past two decades, severe discrepancies in data sources make any kind of analysis highly susceptible. An accurate database is clearly needed for any meaningful analysis of the current status and for future lake planning.
With declining production and increasing numbers of fish- ers and boats on the lake, one would expect much more fierce competition for fishing and diminishing returns. This provides a perfect prescription for illegal fishing practices, which in turn impacts on fishing sustainability. The declining productivity from the lake has been attributed to low water levels in the lake during the 1980s (see El Shahat and Agaypi, this vol.) resulting from successive years of drought in Africa, overfishing and the centralized pricing system, which in turn leads to the spread of fish poaching. Recently, there have been some allegations that Nile crocodiles are threatening life in Lake Nasser. It is estimated that the lake has about 260 crocodiles (>3 m) in addition to an unspecified number of small ones (Al-Ahram 1998). They are seen as a threat to fishers and their livelihood. Striking a balance between biodiversity and sustainability of fishing and the livelihood of fishers is complex and cannot be dealt with in such an oversimplistic way.
Apart from production, markets and marketing (distribu- tion) must be considered. Until now, pricing of fish produced from Lake Nasser is subject to control by the state. This is probably because freshwater fish are considered to be more in demand by the majority of the population compared to saltwater fish. However, this remains an assumption as no one knows who consumes what, how fish markets are struc- tured and if there has been a change in the taste of the urban population that has led to declining demand for freshwater fish. Furthermore, it is not known how fishers respond to
100 Sustainable fish production in Lake Nasser
Table I.Targeted, actual and shortages o f fish yields (t) and number of boats working in the lake in 1997 by co-operative societies.
Cooperative No. of boats Actual Targeted Shortage Ave. production societies production (t ) production (t) (t ) per boat
Mother 1 431 8 741 17 148 8 407 6.1 Aswan Fishermen's 605 2 230 7 260 5 030 3.7 Misr Aswan 228 1 648 2 724 1 076 7.5 Nubian 5 26 6 262 6 288 26 12.0 Al-Takamol 6 1 419 744 3 25 6.8 Total 2851 19 300 34 164 14 864 6.8
changing policies: poaching is only one option. If their entire household economy is considered, what alternative subsis- tence strategies do they adopt in order to resist government intervention? All these sociological questions require investi- gation not only with regard to Lake Nasser but also to all other lakes in Egypt.
Finally, there is the issue of the administration of the lake. Like other lakes in Egypt, Lake Nasser is a contested terrain, where several authorities have vested interests including GADF, HDLDA, the Ministry of Agriculture, the Ministry of Public Works and Water Resources, the Ministry of Tourism and the Governorate of Aswan. Each of these has its own plans for the lake. These plans are not necessarily compatible with one another and sometimes they conflict. The history of minis- tries' and authorities' joint committees has been one of "agree- ing not to agree". An agreement has to be reached and a clear long-term policy has to be devised if sustainability of the lake's ecosystem is to be achieved.
References Al-Ahram. 1998. Article. (29 May). CAPMAS. 1978. The population and housing census of 1976. Aswan
Governorate, Final results. CAPMAS, Cairo CAPMAS. 1989. The population and housing census of 1986. Aswan
Governorate, Final results. CAPMAS, Cairo. Fahim, H. 1982. Dams, people and development: the Aswan High
Dam case. Pergamon, New York. GADF 1997. Statistical tables. General Authority for Development
of Fisheries, Cairo. Kennedy, J.C. 1977. Struggle for change in Nubian community: an
individual in society and history. Mayfield Publishing Co., Palo.
Kennedy, J.C., Editor. 1978. Nubian centennial life: studies in Is- lamic syncretism and cultural change. Univers~ty of Cahfornia Press, Berkeley.
Maslahat, A.-T. 1962. The population census of 1960. Vol.l.Aswan Governorate, Cairo.
Nagi, S.Z., M.H. Abdel Aal, S I. El Tawila, T. Hatem, N.S. Hopkins, N.G. Knox and S . Mehanna. 1994. The Governorates of Aswan and Qena: developmental profiles. Cairo Social Research Cen- ter. American University in Cairo, Cairo.
Pearce, F. 1994. High and dry in Aswan. New Sci. 142:28-32. White, G.F. 1988. The environmental effect of the High Dam at
Aswan. Environment 30:25-40.
MOHlEDDlNlSome socioeconomic aspects 10 1

Constraints and Issues
J.F. Craig International Center for living Aquatic Resources Management,Africa and West Asia Region, Cairo, Egypt
Craig,J.F.2000. Constraints and issues,~. 105-108. In J.F. Craig (ed.) Sustainable fish production in Lake Nasser:ecological basis and management policy. ICLARM Conf. Proc. 6 1,184 p.
ABSTRACT Some of the major biological, economic and social constraints on the fishery are 0utlined.A summary of a workshop discussion provides a consensus on the major issues.The participants recommended that the next stage in the project development was to compile a database on existing knowledge, identify information gaps and train those involved in the fishery.
Introduction The factors which influence the fishery of Lake Nasser are
many and varied. To understand these factors will take an in- depth analysis of present knowledge about the lake and fur- ther field and desk studies. Likewise, the constraints that do not allow the fishery to reach its full potential are varied and complex, and cannot be understood without detailed exarni- nation and discussions with concerned parties.
Some of the possible constnints on the fishery are pre- sented in Fig. 1. These can be biological, economical and sociological. The total mass of fish available to the consumer may be below maximum because (a) insufficient fish are landed (a decline in the catch); (b) the fish landed are unsuit- able (for example, carps are not acceptable to most Egyptians although sardines, if they were introduced into the lake, prob- ably would be); (c) fish are captured illegally (poaching); and/or (d) the fish landed are spoiled. Some causes for these constraints are given in the figure. The relative importance of each will become apparent as the state of knowledge about the system is elucidated.
Workshop discussion rn The lake appears to be highly productive so nutrients do
not appear to be limiting. I The lake does not seem to be overfished. There have been
no complaints from fishers. This does not mean that mea-
surements of potential yield from population dynamic studies should be ignored.
w It is important to look at the fishers' reaction to change. w There is a lack of reliable and available data on the ecosys-
tem. w All previously obtained data should be published in refer-
eed scientific journals, to ensure their quality and to make them available to interested parties.
rn Should we adapt the "no hypothesis role" and assume that conditions will not deteriorate, and the fishery will con- tinue without any recommendations for better management? No. Although the lake is considered to be highly produc- tive, it should not be left without plans for effective man- agement. The lake will be overfished. Interaction with other lake users should be considered in developing a strategic management plan.
Compilation of group reports on overcoming constraints
The following are the workshop participants' majority views on the main issues, which need to be considered in the planning process: rn Has the potential production of the lake been estimated
accurately? No. w Is there potential for fish other than tilapias? Yes. rn Could the tilapia catch be increased? Possibly.
CRAIG/Constraints and issues 105
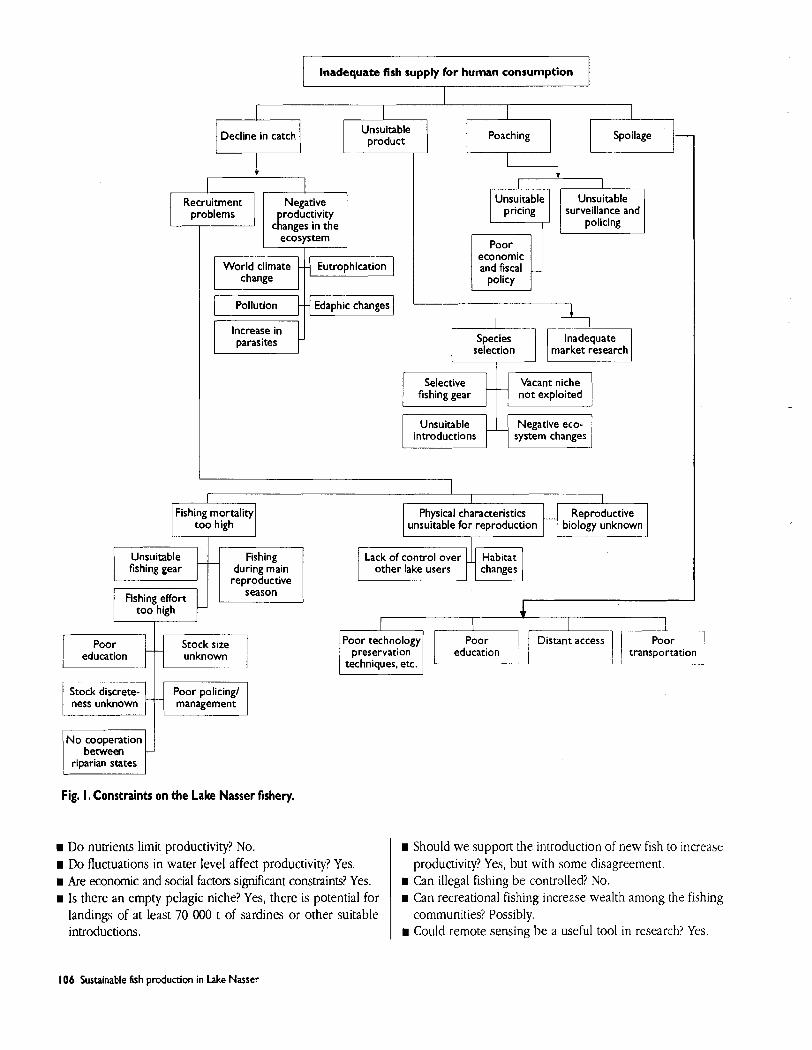
lnadequate fish supply f o r human consumption
Unsuitable Unsuitable Recruitment Negative productivity
changes in the ecosystem
economic and fiscal World climate - Eutrophication
change
Pollution - Edaphic changes
Increase in parasites - lnadequate
selection
fishing gear not exploited
Unsuitable Negative eco- introductions system changes
Fishing mortality too high
Unsuitable Fishing during main reproductive
season
too high
I I
".." education
Physical characteristics unsuitable for reproduction
preservation education transportation techniques, etc. 2 L-~~ .~.
Reproductive biology unknown
Stock size unknown
I
Stock discrete- ness unknown 7 Poor policing1
N o cooperation between
riparian states 1 Fig. I. Constraints on the Lake Nasser fishery.
106 Sustainable fish production in Lake Nasser
r Do nutrients limit productivity? No. r Do fluctuations in water level affect productivity? Yes. r Are economic and social factors sigdkant constraints? Yes. I Is there an empty pelagic niche? Yes, there is potential for
landings of at least 70 000 t of sardines or other suitable introductions.
r Should we support the introduction of new fish to increase productivity? Yes, but with some disagreement.
r Can illegal fishing be controlled? No. I Can recreational fishing increase wealth among the fishing
communities? Possibly. r Could remote sensing be a useful tool in research? Yes.
r Does stock enhancement improve the fishing in the lake? Most participants felt that there was no evidence for thls. Stocking with hatchery-reared tilapia should be evaluated.
r Could aquaculture be increased around the lake, and would you support the development of cage culture in the lake? Yes, but with reservations in view of its possible impact on water quality.
r Is water quality a prime concern for the management of the lake? Yes.
r Could artificial reefs significantly increase fish productivity? Uncertain. I Are there too many bodies administering the lake? Yes. I Is the present management system satisfactory? No. r Are there any endangered fish species, and is their conser-
vation important? Uncertain. r Is there a potential danger from water hyacinth? Possibly. I Would potential benefits from the lake be increased by im-
proving the postharvest treatment of fish? Yes, upgrading would provide fish suitable for export.
r Are parasites a problem? Unknown. I Are fish kills a problem? No.
Top priorities for the next stage in project development:
I. Compilation of existing knowledge
Raw data to be assembled onto CD-ROM, making them available to users
The existing data require analysis, and information gaps need to be identified (see below). The workshop was unable to ascertain what data were accessible, although in some cases it was obvious that available data had not been analyzed cor- rectly.
Preparation of a manuscript based on existing data The contents of the manuscript may be limited by lack of
suitable information and will almost certainly not be suitable for a modern management plan. For example, ecosystem modelling requires current information on biomass and pro- duction at each trophic level. The document will act as back- ground work for identifying the most important areas for future research required to fulfill the objectives of the project. The contents would be:
Section 1. Descriptive r Physical and chemical limnology H Prima~y production I Secondary production I Benthos
r Fish biology r Fish-eating reptiles and birds
Section 2. Thefishery r Fishery assessment and management I Economics a Social aspects r Ecosystem modelling
Section 3. Critical issues r Stock enhancement r Overfishing
Water quality r Introductions I Artificial reefs r Protected areas r Endangered species I Other lake users
2.Training needs
m Scientists and technicians r Fishers r Processing
Possible information ga s identified by the works 1 op
The participants, with the limited amount of information at their disposal, considered the following to be lacking (the list will be modified after compilation and analysis of exlstlng data; see top priorities above):
1. Data from Lake Nubia (Sudan) 2. Data from remote sensing 3. Wind forcing and currents 4. Temperature profiles 5 . Surface area and habitat distribution 6. Light regime 7. Oxic/anoxic boundary 8. Total nitrogen, phosphorus and silicon distribution 9. Chlorophyll a (planktonic and benthic) 10. Algal taxa 11. Biomass and production rates (planktonic and benthic) 12. Stock discreteness 13. Conservation of endangered species 14. Stock potential and assesment by catch statistics, acous-
tics and experimental fishing 15. Rehabilitation, including artificial reefs and sanctuaries 16. The effect of parasites and the role of birds and other
species as intermediate hosts
CRAlGlConstraints and issues 107

17. The threat from the introduction of floating macrophytes 18. Human population, organization, system structure,
origin of the fishers and income distribution 19. Legal and illegal marketing structure (can illegal fishing
be controlled?) 20. Processing technology (postharvest treatment) 21. National plan(s) for development 22. Review of policy of interested government agencies and
respective plans for the lake
108 Sustainable fish production in Lake Nasser
23. Cost of production and marketing 24. Pricing policy 25. Costlbenefit analysis of management policies such as
enhancement 26. Environmental and social impact assessment 27. Infrastructure development plans such as roads and
landing sites that will have impacts on the industry
RAPFISH:A Rapid Appraisal Technique to Evaluate the Sustainability Status of Fisheries
T.J. Pitcher and D. Preikshot university of British Columbia, Vancouver, Canada
Pitcher,T.J. and D. Preikshot. 2000. RAPF1SH:A rapid appraisal technique to evaluate the sustainability status of fisheries, p. 109- 1 16. In J.F. Craig (ed.) Sustainable fish production in Lake Nasser: ecological basis and management policy. ICLARM Conf. Proc. 6 I, 184 p.
ABSTRACT
RAPFISH is a new rapid appraisal technique for evaluating the sustainability of fisheries. Fisheries may be defined flexibly, from a broad scope such as all the fisheries in a lake, down to a single jurisdiction, target species,gear type o r vessel. A set of fisheries may be compared,or the time trajectories of individual fisheries may be plotted. Ordinations of sets of attributes are performed using multidimensional scaling followed by rotation. Ordinations are bounded by reference points that simulate the best and worst possible fisheries using extremes of the attribute scores,while random fisheries define the center of the plot.Separate RAPFISH ordinations are performed using sets of predefined attributes in ecological, economic, technological and social disciplines; more disciplines may be added as required.Attributes are chosen to reflect sustainability within each discipline, and although intended to remain fixed for all analyses, may be refined o r substituted, as improved information becomes available. A combined ordination may also be performed, providing an unweighted conflation of the disciplines. Some validations of the method are presented, using simulated fishery data. Published work using RAPFISH is reviewed briefly along with prospects for further improve- ments of the technique, and an example for three major herring fisheries is described.
Introduction In conventional stock assessment, much effort goes into
determining stock status relative to biological reference points, such as levels of fishing mortality, spawning biomass or age structure (Smith 19931, where the objective is to obtain diag- nostics that may give early warning of serious depletion or collapse. Increasingly, stock assessment relies upon the estl- mation of many stock parameters and requires extensive cur- rent and historical data measured from the fishery and from independent biomass surveys. There is a mismatch between the complexity of these stock assessment models and the high degree of irreducible uncertainty inherent in fisheries research (Walters 1998). At the same time, extensive data requirements preclude the application of these models to many of the world's fisheries. Moreover, conventional stock assess- ment relates to the ecological, or occasionally, the economic sphere, and yet fisheries are in reality a multidisciplinary human endeavor that has social, technological and ethical
implications. Ideally, an evaluation of sustainability of a fish- ery in all of these spheres should be required for objective decision making.
This paper describes a recently developed novel tech- nique, RAPFISH, that employs simple, easily scored attributes and aims to provide a rapid, cost-effective and multidisciplinary appraisal of the status of a fishery, in terms of sustainability (Pitcher et al. 1998; Pitcher, in press; Pitcher and Preikshot, in press). The technique is still under development and only the most recent version is described here. Multivariate ordina- tions of scored attributes evaluate fishery status separately within ecological, technological, economic and social areas; further areas such as ethics may easily be included. A com- bined, unweighted interdisciplinary evaluation can be added. We show how the method may be used to diagnose emerg- ing problems in fisheries, in other words to evaluate the "health" of fisheries by making comparisons.
PITCHER and PREIKSHOTIRAPFISH: a rapid appraisal technique.. . 109
The RAPFISH technique While fisheries management is increasingly seen to be as
much about managing human behavior as about fish ecology (e.g., Jentoft 19920, apart from economics, most analyses of the human aspects of fisheries have been nonquantitative with little predictive or diagnostic power. Nevertheless, this human dimension is so intertwined with the gear, vessels, markets; biological and economic sustainability, manage- ment, allocation and the rebuilding of depleted and collapsed stocks, that the study of fisheries can be regarded as truly multidisciplinary. RAPFISH is a rapid appraisal technique designed to allow an objective multidisciplinary evaluation, but it is not intended to replace conventional stock assess- ment for setting quotas, etc.
Definition of fisheries to be evaluated The RAPFISH method is very flexible about the scope of
fisheries included in the analysis. For example, the ordination can be of a set of fisheries or the trajectory in time of a single fishery, or both. Snapshots of a fishery in time may be taken at regular intervals such as every year or every five years or at points when major shifts are known to have occurred. Points, which plot very closely together, or even fall at identical loca- tions on the ordination, will not disrupt the analysis.
Additionally, the actual scope of what is considered a fish- ery turns out not to affect the results, provided that roughly the same scope is chosen for items to be compared. For ex- ample, at one extreme, all of the fisheries in a country or lake may be combined and compared en masse with those in other lakes or countries (e.g., for African lakes, Preikshot et al. 1998). At the other extreme, the method can accommodate a fishery for two different species using the same gear type on the same vessel, or for the same species in the same location using two different gear types. An example of the former is fishery for sardines and anchovies on "volante" pair trawls in the northern Adriatic. An example of the latter is the "volante" and "lampara" fisheries for anchovies in the Adriatic (for both see Pitcher et al. 1999). Fisheries from individual fishing com- munities may also be compared.
Attributes and data required for disciplines covered Work using the RAPFISH technique so far has ordinated
fisheries in four disciplinary areas that are critical to long-term viability of a fishery: I Ecological (including fish population parameters and
environment) I Technological (including gear and fishing characteristics) I Economic (including both micro- and macroeconomic
factors) I Social (including social and anthropological factors)
Within each ordination, a set of nine to 10 attributes is defined. Attribute numbers are designed to maximize discrimi- nating power in the ordination technique, where a rule of thumb is to have three times as many fisheries as attributes used to ordinate them (Stalans 1995). Criteria for choosing attributes are that they are easily and objectively scored, and that extreme values are easily ascribed to "good" and "bad" in relation to sustainability, and that scores are available for all the fisheries and time periods in the analysis. Table 1 lists the attributes for the four disciplines above that have been used in most analyses to date. Separate analyses will be compa- rable if the attributes are fixed.
Fixed reference points To provide the ordination with fixed reference points, status
is assessed relative to the best and worst possible fisheries that may be constructed from the set of attributes for each discipline. Two hypothetical fisheries, "good" or "bad", are simulated by choosing extreme scores for each attribute. Note that "good" and "bad" are evaluated in terms of sustainability of the fishery within the discipline. If these scores cannot easily be assigned to an attribute, then the attribute itself may not be useful for the RAPFISH analysis. The "good" and "bad values are shown in the list of attributes in Table 1. The "good" and "bad" fisheries are generally plotted on the final ordina- tion, and their positions are used to rotate the plot and to calculate percentage changes in status.
Random reference points In addition, 20 random sets of attribute scores ("random"
fisheries) are simulated for each discipline. Values are chosen at random from the score ranges for each attribute and en- tered as "fisheries" in the ordination. The objective here is to show if status evaluations are meaningful, since any fishery locations that lie inside the "random" area could have arisen by chance. More than 20 random points might be chosen to improve statistical rigor, but there are limits because most ordination methods allow only about 100 data points to be included.
After pilot work, in which the random fisheries ordination positions were shown to be normally distributed about zero (Pitcher et al. 1999), individual random fisheries have been replaced by the mean and 95% C.L. These are usually repre- sented as crossed lines on the final ordination plot. Further- more, by convention, the ordination plot is recentered to the zero of the random points.
Combined interdisciplinary ordination Two ordination scores from each analysis, making eight
scores in all when there are four disciplinary analyses, may
1 10 Sustainable fish production in Lake Nasser
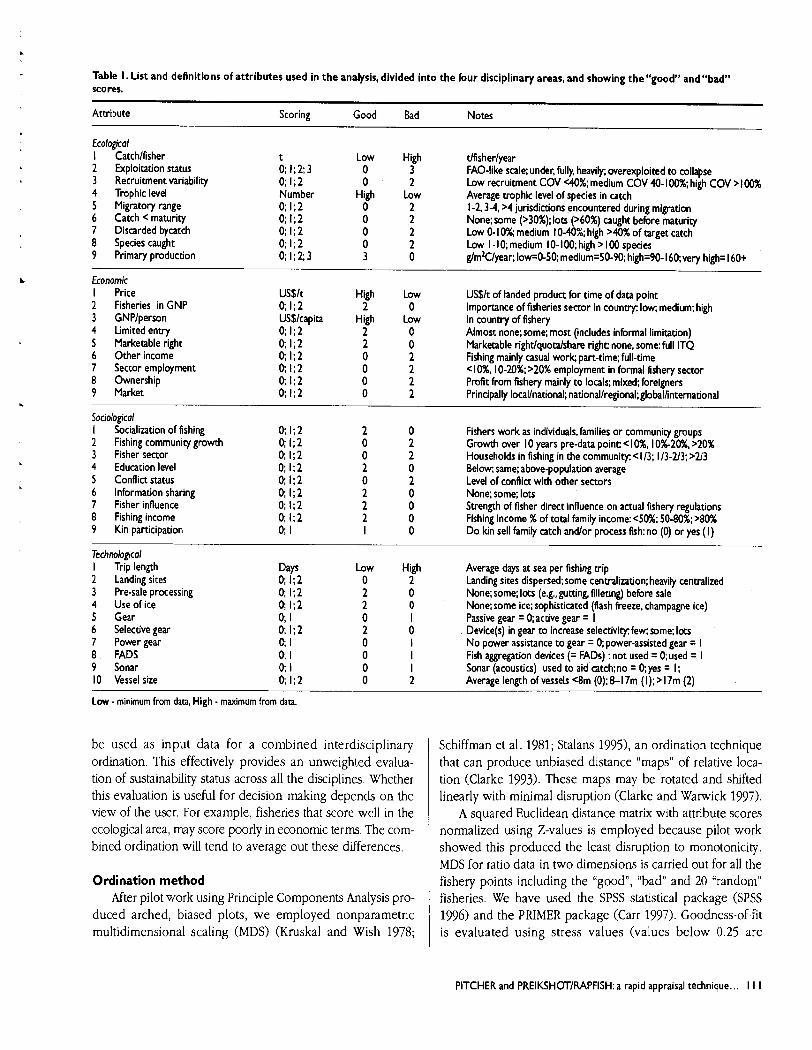
Table I. List and definitions o f attributes used in the analysis, divided into the four disciplinary areas, and showing the "good" andNbad" scores.
Attribute Scoring Good Bad Notes
Ecological I Catchlfisher t Low High tlfisherlyear 2 Exploitation status 0; 1;2;3 0 3 FAO-like scale; under, fully, heavily; overexploited t o collapse 3 Recruitment variability 0; 1;2 0 2 Low recruitment COV <40%; medium COV 40- 100%; high COV > 100% 4 Trophic level Number High Low Average trophic level of species in catch 5 Migratory range 0; 1;2 0 2 1-2.3-4, >4 jurisdictions encountered during migration 6 Catch < maturity 0; 1;2 0 2 None; some (>30%); lots (>60%) caught before maturity 7 Discarded bycatch 0; 1;2 0 2 Low 0- 10%; medium 10-40%; high >40% of target catch 8 Species caught 0; 1;2 0 2 Low I - 10; medium 10- 100, high > 100 species 9 Primary production 0; 1;2;3 3 0 glm2Clyear; low=O-50; mediumz50-90; highz90-160; very high= 160+
Economic I Price US$lt High Low US$lt of landed product for time of data point 2 Fisheries in GNP 0; 1;2 2 0 Importance of fisheries sector in country: low; medium; high 3 GNPlperson US$lcapita High Low In country of fishery 4 Limited entry 0; 1;2 2 0 Almost none; some; most (includes informal limitation) 5 Marketable right 0; 1;2 2 0 Marketable rightlquotalshare right none, some: full ITQ 6 Other income 0; 1;2 0 2 Fishing mainly casual work, part-time; full-time 7 Sector employment 0; 1;2 0 2 <lo%, 10-20%; >20% employment in formal fishery sector 8 Ownership 0: l;2 0 2 Profit from fishery mainly to locals; mixed;foreignen 9 Market 0; 1;2 0 2 Principally locallnational; nationallregional; globallinternational
Sociological I Socialization of fishing 0; 1;2 2 0 Fishers work as individuals,families or community groups 2 Fishing community growth 0; 1;2 0 2 Growth over I 0 years pre-data point < lo%, 10%-20%, >20% 3 Fisher sector 0; 1;2 0 2 Households in fishing in the community: <113; 113-U3; >213 4 Education level 0; 1;2 2 0 Below; same; above-population average 5 Conflict status 0; 1;2 0 2 Level of conflict with other sectors 6 Information sharing 0; 1;2 2 0 None; some; lots 7 Fisher influence 0; 1;2 2 0 Strength of fisher direct influence on actual fishery regulations 8 Fishing income 0; 1;2 2 0 Fishing income % of total family income: 40%; 50-80%:>80% 9 Kin participation 0; I I 0 Do kin sell family catch andlor process fish: no (0) or yes (I)
Technological I Trip length 2 Landing sites 3 Pre-sale processing 4 Use of ice 5 Gear 6 Selective gear 7 Power gear 8 FADS 9 Sonar 10 Vessel size
Days 0; 1;2 0; 1;2 0; 1;2 0; I 0; 1;2 0; I 0; I 0; I 0; 1;2
Low High 0 2
Average days at sea per fishing trip Landing sites dispersed; some centralization; heavily centralized None; some; lots (e.g., gutting, filleting) before sale None;some ice; sophisticated (flash freeze, champagne ice) Passive gear = 0; active gear = I Device(s) in gear to increase selectivity: few; some; lots No power assistance to gear = 0; power-assisted gear = I Fish aggregation devices (= FADS) :not used = 0; used = I Sonar (acoustics) used to aid catch; no = 0; yes = I; Average length of vessels <8m (0); 8-1 7m (I); > 17m (2)
Low. minimum from data, High - maximum from data.
be used as input data for a combined interdisciplinary ordination. This effectively provides an unweighted evalua- tion of sustainability status across all the disciplines. Whether this evaluation is uscful for decision making depends on the view of the user. For example, fisheries that score well in the ecological area, may score poorly in economic terms. The com- bined ordination will tend to average out these differences.
Ordination method After pilot work using Principle Components Analysis pro-
duced arched, biased plots, we employed nonparametric multidimensional scaling (MDS) (Kruskal and Wish 1978;
Schiffman et al. 1981; Stalans 1995), an ordination technique that can produce unbiased distance "maps" of relative loca- tion (Clarke 1993). These maps may be rotated and shifted linearly with minimal disruption (Clarke and Warwick 1997).
A squared Euclidean distance matrix with attribute scores normalized using Z-values is employed because pilot work showed this produced the least disruption to monotonicity. MDS for ratio data in two dimensions is carried out for all the fishery points including the "good", "bad" and 20 "random" fisheries. We have used the SPSS statistical package (SPSS 1996) and the PRIMER package (Carr 1997). Goodness-of-fit is evaluated using stress values (values below 0.25 are
PITCHER and PREIKSHOTIRAPFISH: a rapid appraisal technique ... I I I
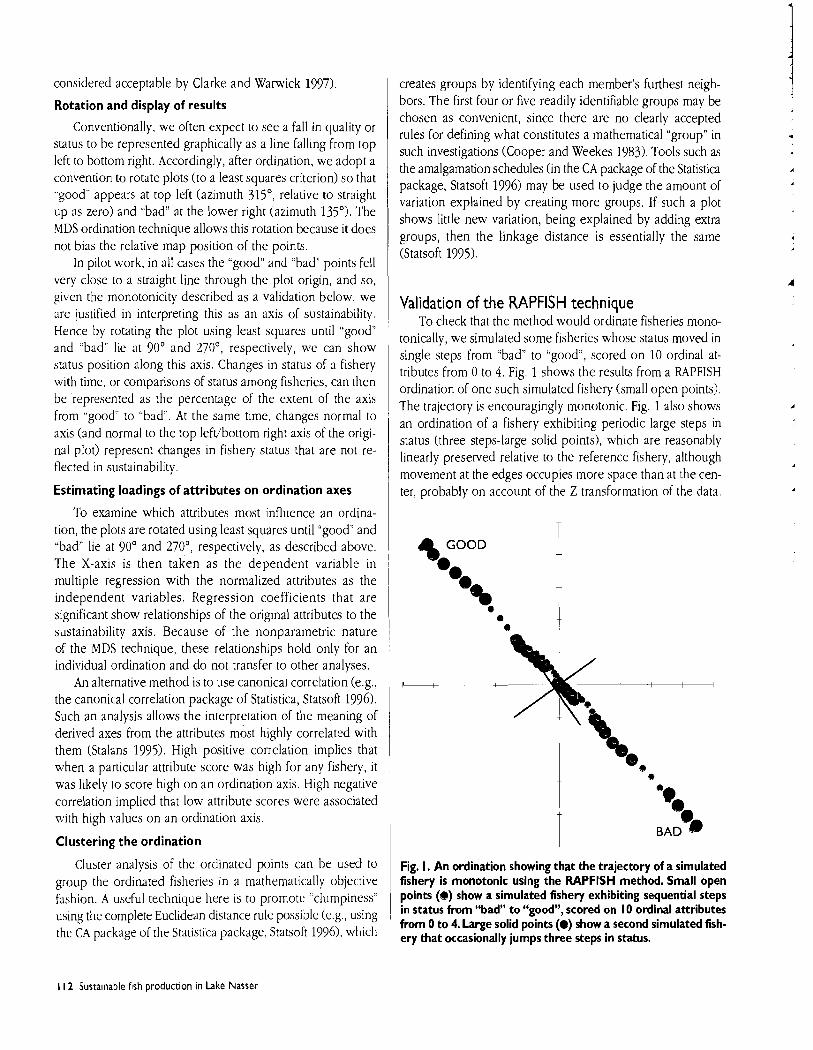
Rotation and display of results
Conventionally, we often expect to see a fall in quality or status to be reprcscnted graphically as a line falling from top left to bottom right. Accordingly, after ordination, we adopt a convention to rotate plots (to a least squares criterion) so that .,good" appears at top left (azimuth 315', relative to straight up as zero) and "bad" at the lower right (azimuth 135'). The RIDS ordination technique allows this rotation because it does not bias the relative map position of the points.
In pilot work, in all cases the "good" and "bad" points fell very close to a straight line through the plot origin, and so, given the monotonicity described as a validation below, we are justified in interpreting this as an axis of sustainability. Hence by rotating the plot using least squares until "good1' and "bad" lie at 90" and 270°, respectively, we can show status position along this axis. Changes in status of a fishery with time, or comparisons of status among fisheries, can then be represented as the percentage of the extent of the axis from "good" to "bad''. At the same time, changes normal to axis (and normal to the top left/bottom right axis of the origi- nal plot) represent changes in fishery status that are not re- flected in sustainability.
Estimating loadings of attributes on ordination axes
To examine which attributes most influence an ordina- tion, the plots are rotated using least squares until "good" and .'bad" lie at 90" and 270°, respectively, as described above. The X-axis is then taken as the dependent variable in multiple regression with the normalized attributes as the independent variables. Regression coefficients that are significant show relationships of the original attributes to the sustainability axis. Because of the nonparametric nature of the MDS technique, these relationships hold only for an individual ordination and do not transfer to other analyses.
An alternative method is to use canonical correlation (e.g., the canonical correlation package of Statistica, Statsoft 1996). Such an analysis allows the interpretation of the meaning of derived axes from the attributes most highly correlated with them (Stalans 1995). High positive correlation implies that when a particular attribute score was high for any fishery, it was likely to score high on an ordination axis. High negative correlation implied that low attribute scores were associated with high values on an ordination axis.
Clustering the ordination
Cluster analysis of the ordinated points can be used to group the ordinated fisheries in a mathematically objective fashion. A useful technique here is to promote "clumpiness" using the complete Euclidean distance rule possible (e.g., using the CA package of the Statistica package, Statsoft 1996), which
bors. The first four or five readily identifiable groups may be chosen as convenient, since there are no clearly accepted rules for defining what constitutes a mathematical "group" in such investigations (Cooper and Weekes 1983). Tools such as the amalgamation schedules (in the CA package of the Statistica package, Statsoft 1996) may be used to judge the amount of variation explained by creating more groups. If such a plot shows little new variation, being explained by adding extra groups, then the linkage distance is essentially the same (Statsoft 1995).
Validation of the RAPFISH technique To check that the method would ordiAate fisheries mono-
tonically, we simulated some fisheries whose status moved in single steps from "bad" to "good", scored on 10 ordinal at- tributes from 0 to 4. Fig. 1 shows the results from a RAPFISH ordination of one such sindated fishery (small open points). The trajectory is encouragingly monotonic. Fig. 1 also shows an ordination of a fishery exhibiting periodic large steps in status (three steps-large solid points), which are reasonably linearly preserved relative to the reference fishery, although movement at the edges occupies more space than at the cen- ter, probably on account of the Z transformation of the data.
BAD
Fig. I. An ordination showing that the trajectory of a simulated fishery is monotonic using the RAPFISH method. Small open points (@) show a simulated fishery exhibiting sequential steps in status from "bad" to "good", scored on I 0 ordinal attributes from 0 to 4. Large solid points (8) show a second simulated fish- ery that occasionally jumps three steps in status.
I I 2 Sustainable fish production in Lake Nasser
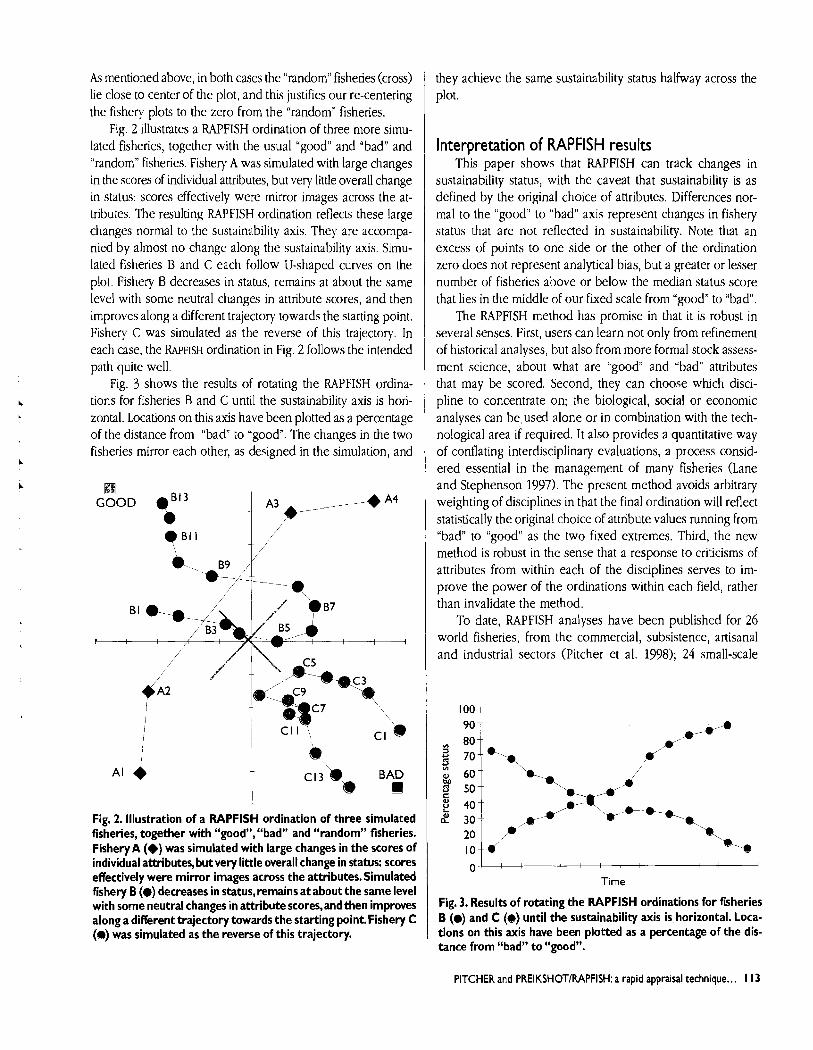
As mentioned above, in both cases the "random" fisheries (cross) lie close to center of the plot, and this justifies our re-centering the fishery plots to the zero from the "random" fisheries.
Fig. 2 illustrates a RAPFISH ordination of three more simu- lated fisheries, together with the usual "good" and "bad" and "random" fisheries. Fishery A was simulated with large changes in the scores of individual attributes, but very little overall change in status: scores effectively were mirror images across the at- tributes. The resulting RAPFISH ordination reflects these large changes normal to the sustainability axis. They are accompa- nied by almost no change along the sustainability axis. Simu- lated fisheries B and C each follow U-shaped curves on the plot. Fishery B decreases in status, remains at about the same level with some neutral changes in attribute scores, and then improves along a different trajectory towards the starting point. Fishery C was simulated as the reverse of this trajectory. In each case, the RAPFISH ordination in Fig. 2 follows the intended path quite well.
Fig. 3 shows the results of rotating the RAPFISH ordina- tions for fisheries B and C until the sustainability axis is hori- zontal. Locations on this axis have been plotted as a percentage of the distance from "bad" to "good". The changes in the two fisheries mirror each other, as designed in the simulation, and
C13 BAD 6
Fig. 2. Illustration of a RAPFISH ordination of three simulated fisheries, together with "good", "bad" and "random" fisheries. Fishery A (+) was simulated with large changes in the scores of individual attributes, but very little overall change in status: scores effectively were mirror images across the attributes. Simulated fishery B (0) decreases in status, remains at about the same level with some neutral changes in attribute scores,and then improves along a different trajectory towards the starting point. Fishery C (a) was simulated as the reverse of this trajectory.
they achieve the same sustainability status halfway across the plot.
Interpretation of RAPFISH results This paper shows that RAPFISH can track changes in
sustainability status, with the caveat that sustainability is as defined by the original choice of attributes. Differences nor- mal to the "good" to "bad" axis represent changes in fishery status that are not reflected in sustainability. Note that an excess of points to one side or the other of the ordination zero does not represent analytical bias, but a greater or lesser number of fisheries above or below the median status score that lies in the middle of our fixed scale from "good to "bad.
The RAPFISH method has promise in that it is robust in several senses. First, users can learn not only from refinement of historical analyses, but also from more formal stock assess- ment science, about what are "good" and "bad" attributes that may be scored. Second, they can choose which disci- pline to concentrate on; the biological, social or economic analyses can be used alone or in combination with the tech- nological area if required. It also provides a quantitative way of conflating interdisciplinary evaluations, a process consid- ered essential in the management of many fisheries (Lane and Stephenson 1997). The present method avoids arbitrary weighting of disciplines in that the final ordination will reflect statistically the original choice of attribute values running from "bad" to "good" as the two fixed extremes. Third, the new method is robust in the sense that a response to criticisms of attributes from within each of the disciplines serves to im- prove the power of the ordinations within each field, rather than invalidate the method.
To date, RAPFISH analyses have been published for 26 world fisheries, from the commercial, subsistence, artisanal and industrial sectors (Pitcher et al. 1998); 24 small-scale
Time
Fig. 3. Results of rotating the RAPFISH ordinations for fisheries B (0) and C (@) until the sustainability axis is horizontal. Loca- tions on this axis have been plotted as a percentage of the dis- tance from "bad" to "good".
PITCHER and PREIKSHOTIRAPFISH: a rapid appraisal technique.. . 1 13
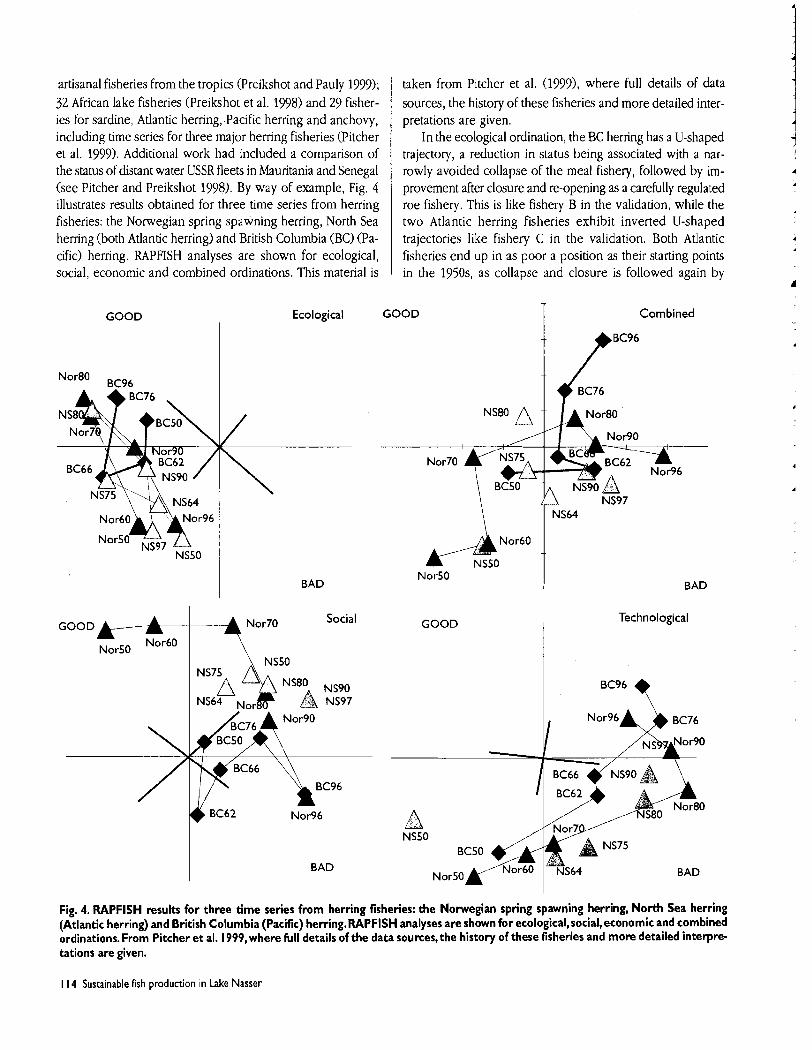
artisanal fisheries from the tropics (Preikshot and Pauly 1999), 32 African lake fisheries (Preikshot et al. 1998) and 29 fisher- ies for sardine, Atlantic herring, Pacific herring and anchovy, including time series for three major herring fisheries (Pitcher et al. 1999). Additional work had included a comparison of the status of distant water USSR fleets in Mauritania and Senegal (see Pitcher and Preikshot 1998). By way of example, Fig. 4 illustrates results obtained for three time series from herring fisheries: the Norwegian spring spawning herring, North Sea herring (both Atlantic herring) and British Columbia (BC) (Pa- cific) herring. RAPFISH analyses are shown for ecological, social, economic and combined ordinations. This material is
taken from Pitcher et al. (1999), where full details of data sources, the history of these fisheries and more detailed inter- pretations are given.
In the ecological ordination, the BC herring has a U-shaped trajectory, a reduction in status being associated with a nar- rowly avoided collapse of the meal fishery, followed by im- provement after closure and re-opening as a carefully regulated roe fishery. This is like fishery B in the validation, while the two Atlantic herring fisheries exhibit inverted U-shaped trajectories like fishery C in the validation. Both Atlantic fisheries end up in as poor a position as their starting points in the 1950s, as collapse and closure is followed again by
Ecological GOOD
NS80 A
GOOD
BC96
BAD
Nor70 Social
Nor50 Nor60
I BAD
GOOD
Combined
NS64
BAD
Technological
BAD
Fig. 4. RAPFISH results for three time series from herring fisheries: the Norwegian spring spawning herring, North Sea herring (Atlantic herring) and British Columbia (Pacific) herring. RAPFISH analyses are shown for ecological, social, economic and combined ordinations. From Pitcher et al. 1999, where full details of the data sources, the history of these fisheries and more detailed interpre- tations are given.
1 14 Sustainable fish production in Lake Nasser
overfishing and depletion. In the social ordinat~on, the prin- cipal feature is the high status of the Norwegian fishery in the 1 9 5 0 ~ ~ when small vessels were crewed by close kin from small-integrated coastal communities. This status decreases to end up in almost the same posltion as the BC fishery in the most recent year, In the technological ordination, the BC and Norwegian fisheries swing across the plot as drift nets give way to purse seines and trawls, both of these fisheries im- proving their status towards the end on account of the use of by-catch reduction devices. (A fourth ordination, in econom- ics, is not shown here).
This example shows that the RAPFISH ordinations for the three herring fisheries mirror in general what we know of the ecology, economics and sociology associated with their his- tories of collapse and rebuilding, and their relative status and characteristics. Here, the RAPFISH technique appears to be giving the right signals about shifts in sustainability status, which might be loosely defined as fisheries "health". Note that the combined ordination averages the positions on the disciplinary ordinations.
Prospects for the RAPFISH technique In addition to providing a rapid assessment of status, the
RAPFISH method might be useful in a "triage" of fisheries (Pauly, in press), to determine where limited management resources might be focused to greatest effect. It may also be used to track changes in a single fishery in an attempt to foresee problems before some combination of biological, eco- nomic or social effects leads to disaster. An important ques- tion is whether this technique can be used to diagnose key problems (such as environmental change, overcapitalization or recruitment overfishing) early enough to give warning of impending trouble. Attributes that more clearly define the period immediately preceding a documented collapse would increase the power of this method.
A more formal analysis of the leverage of individual attributes would also be valuable. Errors, or differences in opinion in the scoring of the attributes, can be taken into account by including the extreme scores as separate "fisher- ies". Forecasts of fishery status in the coming year can be compared under different policy options
RAPFISH analyses that employ additional disciplines, such as ethics, are in preparation. Additional fields that capture special features of a fishing gear that evolves with time, such as the cod traps used in Newfoundland since the 1750s, might be valuable for special analyses. And an important aspect of fisheries that has long been ignored, the impact of fishing on ecosystem structure (Pitcher and Pauly 1998), may also be an important field to add.
References Can; M.C. 1997. Plymouth routines in multivariate ecological re-
search. PRIMER user manual. UK Plymouth Marine Laboratory. 27 p.
Clarke, K.R. 1993. Multivariate analyses of changes in community structure. Aust. J. Ecol. 19:117-143.
Clarke, K.R. and R.M. Warwick. 1997. Change in marine communi- ties: an approach to statistical analysis and interpretation. UK Plymouth Marine Laboratory. 144 p.
Cooper, R.A. and A.J. Weekes. 1983. Section 10: multivariate analy- sis, p. 240-259. In R.A. Cooper and A.J. Weekes (eds.) Data, models and statistical analysis. Philip Allan, Oxford.
Jentoft, S. 1998. Social science in fisheries management: a risk as- sessment, p. 174-184. In T.J. Pitcher, P.J.B. Hart and D. Pauly (eds.) Reinventing fisheries management. Chapman and Hall, London.
Kruskal, J.B. and M. Wish. 1978. Multidimensional scaling. Sage Publications, Beverley Hills, CA.
Lane, D.E. and R.L. Stephenson. 1997 Fisheries management sci- ence: integrating the roles of science, economics, sociology and politics into effective fisheries management, p. 177-182. In D.A. Hancock, D.C. Smith, A. Grant and J.P. Beumer (eds.) Develop- ing and sustaining world fisheries resources: the state of sci- ence and management. CSIRO, Collingwood.
Pauly, D. When is fisheries management needed? In T.J.H. Adams and P. Dalzell (eds.) SPC/FFA Workshop on the Management of South Pacific Inshore Fisheries, Vol. 3. Noumea, New Caledonia. (In press).
Pitcher, T.J. RAF'FISH, a rapid appraisal technique for fisheries and its applications to the Code of Conduct for Responsible Fisher- ies. FA0 Fish. Circ. No. FIRM/C. (In press).
Pitcher, T.J. and D.B. Preikshot. RAPFISH: a rapid appraisal tech- nique to evaluate the sustainability status of fisheries. Fish. Res. (In press).
Pitcher, T.J. and D. Pauly. 1998. Rebuilding ecosystems, not sustainability, as the proper goal of fishery management, p. 311-329. In T.J. Pitcher, P.J.B. Hart and D. Pauly (eds.) Rein- venting fisheries management. Chapman and Hall, London.
Pitcher, T.J, and D. Preikshot. 1998. Rapfish: a rapid appraisal of the status of West African distant water fleet fisheries relative to home fleets using the RAPFISH technique, p. 90-93. In R. Bonfil, G. Munro, U.R. Sumaila, H. Valtysson, M. Wright, TJ. Pitcher, D. Preikshot, N. Haggan and D. Pauly (eds.) Distant water fleets: an ecological, economic and social assessment. Fish. Cent. Res. Rep. Univ. B.C. 6(6).
Pitcher, T.J., A. Bundy, D. Preikshot, T. Hutton and D. Pauly. 1998. Measuring the unmeasurable: a multivariate interdisciplinary method for rapid appraisal of health of fisheries, p. 31-54. In T.J. Pitcher, P.J.B. Hart and D. pauly (eds.) Reinventing fisheries management. Chapman and Hall, London.
Pitcher, T.J., S. Mackinson, M. Vasconcellos, L. Nottestad and D Preikshot. 1999. Rapid appraisal of the status of fisheries for small pelagics using multivariate, multidisciplinary ordination. p.759-782. In T.J. Quinn, F. Funk. J. Heiferz, J.N. lanelli. J.E Power, J.F. Schweigert, P.J. Sullivan and C.4. Zhong (eds.) Fish- ery stock assessment models. Alaska Sea Grant, Fairbanks.
Preikshot, D.B. and D. Pauly. 1999. A multivariate interdisciplinary assessment of small-scale tropical fisheries, p. 803-814. In TJ. Quinn, F. Funk. J. Heiferz, J.N. Ianelli, J.E. Power, J.F. Schwelgert, P.J. Sullivan and C.4. Zhong (eds.) Fishery stock assessment models. Alaska Sea Grant, Fairbanks.
PITCHER and PREIKSHOTIRAPFISH: a rapid appraisal technique.. . 1 15

Preikshot, D.B., E. Nsiku, T.J. Pitcher and D. Pauly. 1998. An inter- disciplinary evaluation of the status and health of African lake fisheries using a rapid appraisal technique. J. Fish Biol. 53 (Suppl. A):382-393.
Schiffman, S.S., M.L. Reynolds and F.W. Young. 1981. Introduction to multidimensional scaling: theory, methods and applications. Academic Press, London.
Srnilh, S.J. 1993 Risk evaluation and biological reference points for fisheries management: a review, p. 339-353. In G. Kruse, D.M. Eggers, RJ. Marasco, C. Pautzke and T.J. Quinn (eds.) Manage- ment strategies for exploited fish populations. Alaska Sea Grant, Anchorage.
SPSS Inc. 1996. SPSS for Windows, release 7.5. Stalans, L.J. 1995. Multidimensional scaling. In L.G. Grimm and P.R.
Yarnold (eds.) Reading and understanding multivariate statis- tics. American Psychological Association, Washington.
Statsoft Inc. 1995. Multidimensional scaling, p. 3235-3258. In Statsoft. Statistica Vol. 111: Statistics 11. Statsoft Inc., Tulsa.
Statsoft Inc. 1996. Statistica for Windows, release 5.1 D. Walters, C.J. 1998. Designing fisheries management systems that do
not depend on accurate stock assessment, p. 279-288. In TI). Pitcher, P.J.B. Hart and D. Pauly (eds.) Reinventing fisheries management. Chapman and Hall, London.
1 16 Sustainable fish production in Lake Nasser

Ecosystem Studies and the Modelling of the Fishery in Lake NasserlNubia
G. Patterson University of Greenwich, London, UK
Patterson, G. 2000. Ecosystem studies and the modelling of the fishery in Lake NasserlNubia, p. 1 19- 127.InJ.F. Craig (ed.) Sustainable fish production in Lake Nasser: ecological basis and management policy. ICLARM Conf. Proc. 6 I, I84 p.
ABSTRACT This paper reviews basic limnological studies on Lake Nasser and recommends that further work concen- trates on an understanding of seaspnal structure,principal habitats of the lake and primary production rates in these habitats.This will provide accurate estimates of the carbon flux of the lower trophic levels that can be used in fish production modelling for the lake (ECOPATH). Appropriate methods to be adopted are also discussed and constraints identified.
Introduction This paper attempts to draw together the discussions which
took place during the Workshop. In particular, it considers basic ecological studies that provide relevant information for the management of the fishery in the lake. These include climate, hydrology, physico-chemical properties of the water column, and measurements of phytoplankton and zooplank- ton. The prime objective is to provide information for quanti- tative modelling (e.g., ECOPATH, Pitcher, this vol.) of the ecosystem. Studies of the "production basis" of the lake would also allow for short-term predictions of potential yield, which could be used in the management of the fishery on, for ex- ample, a seasonal basis. Ecological studies are also of value to allow an understanding of human-induced factors which may be having an impact on the lake (pollution), allowing management priorities to be set.
Current knowledge of the ecology of Lake Nasser is sum- marized in detail by Latif (1984). Papers presented at the Workshop and published as background papers in these pro- ceedings provide additional and updated information.
This paper summarizes the author's view (derived from discussions generated during the Workshop) on how to di- rect hydrological and ecological studies (particularly at lower trophic levels) to better understand the basis for fish produc- tion in Lake Nasser. This will include an understanding of (a) hydrological cycles, (b) light regimes, (c) nutrient regimes (including oxygen) and (d) habitat types. Further, the collec-
tion of suitable data on (e) "biomass and taxa" and (0 carbon flux rates at lower trophic levels (primary and secondary pro- duction) will provide essential inputs into a larger ecosystem model (ECOPATH), giving insights into the basis of yield and variability in the fishery (see Pitcher, this vol.). The paper is broken into these headings (although there are many cross- cutting issues) and considers the various methods which could be adopted to perform the proposed work. Constraints to carrying out this program are also discussed. The Appendix specifically examines the value of remote sensing to the pro- posed study.
Hydrological cycles Lake Nasser is a warm monomictic lake (using the defini-
tions of Wetzel 1983) with a period of thermal stratification during the summer months, and complete mixing of the wa- ter column during the winter. Most published data on the thermal structure of Lake Nasser are from the central channel of the lake, and it may be that the mixing regime is more complex in some of the shallower bays (khors). I t is also noteworthy that the hypolimnion rapidly becomes deoxygen- ated during the summer, and this is discussed in the section on "Nutrients and oxygen". Seasonal and interannual varia- tion in overall volume of Lake Nasser is discussed in the sec- tion on "Habitat types".
PATTERSONlEcosystem studies and the modelling.. . 1 19
The thermal structure of the lake is principally controlled by meteorological conditions (mainly air temperature and wind), and these factors are obviously not consistent year by year. Lake Nasser is further subject to interannual variation due to the variable volumes of water carried into the lake dependent on rainfall in the catchment. It is emphasized here, therefore, that all the studies suggested below have to be part of a long-term monitoring program designed to examine this inter-annual variation. A direct understanding of stratification is fundamental, and a program designed to understand the three-dimensional structure of the lake is recommended.
Studies on thermal structure generally require the use of a conductivity/temperature/depth probe (CTD) which allows for rapid plotting of water density/depth relationships. As stated above, there may be a complex stratificatiodmixing regime within the lake, and therefore the number of profiles recorded should be maximized. Profiles should be collected from shal- lower areas as well as from the main channel. Transects from shallow areas into the main channel during different periods of the annual cycle would usefully illustrate the whole three- dimensional structure of the lake. Since stratification is funda- mentally linked to deoxygenation in the lake (see below), oxygen should be measured; incorporating an electronic oxy- gen meter with the CTD may appropriately do this.
Due to its reliance on ship deployment, the temporal in- tensity of measurements using a CTD is often limited. One solution is the installation of thermistor chains anchored to the bottom of the lake, to continuously record temperature at selected depths. These devices are expensive and, unless there are multiple deployments, site selection and therefore degree of spatla1 coverage, are problematic. It may be that a system of this kind close to the water outlet of the hydroelectric turbines could play a dual role in Lake Nasser, and the cost (and data) could be shared between researchers and the power-generating authorities. Additionally it is suggested that monitoring of night-time lake surface temperature using sat- ellite imagery (with concurrent measurements of temperature profiles and surface temperatures to assist with calibration) may offer a synoptic view of lake structure (see Appendix).
As previously mentioned, the stratificationlmixing regime is fundamentally driven by climatic factors. It is therefore im- portant that meteorological data from the lake are collected so they can be related to the stratificatiodmixing regime by using various hydrological calculations on energy balance and stability of stratification.
Light One of the characteristic features of the annual flood of
the Nile in the lower Egypt Valley was the large amount of suspended sediments carried down by the river. Since the
building of the Aswan High Dam, these sediments have tended to accumulate in Lake Nasser although they are carried a cer- tain distance along the lake from their input point in the south. An important consequence of this turbid water is that it rap- idly attenuates surface-arriving irradiance through the water column. This may be an important factor limiting primary production in the lake, and may be a more important factor than nutrient limitation (see below).
Light extinction is measured by calculating the slope of light intensity: depth curve using a submersible electronic probe sensitive to Photosynthetically Active Radiation (PAR). These devices can be incorporated with CTDs. The less ex- pensive Secchi disc, though, is a useful indicator of light avail- ability for photosynthesizing organisms, and it is suggested that Secchi depth be incorporated in all possible sample loca- tions. This method is sufficiently simple that, combined with a Global Positioning System (GPS) reading, it can be carried out by nonspecialists (such as fishers). As many readings as possible in all parts of the lake and all seasons are recom- mended.
It would be advisable to relate Secchi depth with direct measurements of suspended materials, which involves filter- ing water, drying and weighing the filtrate to measure suspended load directly. The correlation will never be per- fect due to variation in the nature of the suspended material (including plankton), but would probably suffice so that Secchi depth can be used as a semi-quantitative measure of suspended load, as well as to estimate the depth of the euphotic zone.
The possibility that remote sensing may be able to provide a more synoptic view of suspended load (and there- fore light penetration) is discussed in the Appendix Direct measurements using light meters andlor Secchi depth would then play an important role in improving the quantitative es- timate of sediment load from remote sensing.
Nutrients and oxygen Lake Nasser is clearly rich in nutrients, as large amounts
are carried into the lake during annual floods from the catchments of the Blue and White Nile. Figures for dissolved nutrients in the lake quoted by Goma (this vol.) and by Latif (1984) indicate high levels of orthophosphate P0.3 mgl-' P) and nitrate (>0.5 mgl-' N) in the open water of the lake. Values in the enclosed khors are likely to be higher. An approximation of the published N:P ratios suggests that N probably becomes deficient before P (i.e., the lake is poten- tially N limited); and the high numbers of heterocystous N- fixing cyanophytes in the lake (principally Anabaena spp.) also indicate relative N deficiency. However, the fact that there are easily detectable concentrations of available N and P in
120 Sustainable fish production in Lake Nasser
the water column suggests that nutrient deficiency is not a factor in the lake and that, possibly, the only limitation to production is light (see above) and the annual deoxygen- ation of a large proportion of lake water.
From this point of view, it is surprising that Lake Nasser has not suffered (as is common with similar nutrient-rich waterbodies in the tropics) a major bloom of aquatic macro- phytes. Because many of these problematic exotic weeds exist in the catchment of the lake, it seems unlikely (though not impossible) that this is due to a lack of inoculum. At present, a bloom of aquatic macrophytes must be considered as a potential problem and should be monitored diligently, as it could have a catastrophic effect on the fishery and an even worse impact on the operation of the hydroelectric output of Aswan High Dam.
Limnological studies often include measurement of avail- able nutrients. There are, however, a great number of prob- lems in interpreting these data. Point measurements of nutrients take little account of their flux rates. For example, a number of highly productive waterbodies show levels of dissolved nutrients consistently below detection limits (approximately 3 pgl-', i.e., values < 1% of those found in Lake Nasser). This perceived anomaly between low nutrients and high produc- tion is due to the rapid recycling of dissolved nutrients in nutrient-limited systems. Nutrient status can be somewhat better interpreted by measuring "total" values of N and P by digesting unfiltered water samples. This still leads to prob- lems of interpretation since it is likely that values for "total" N may overestimate the N value available as a nutrient for the phytoplankton; "total" P is a better measure of available P. Studies on nutrients in Lake Nasser should be directed to- wards understanding the nutrient budget of the lake, and it is suggested that knowledge of major nutrient pathways would be of value. This would include water inputs at source, atmo- spheric inputs, internal recycling of nutrients, as well as N- fixation by cyanophytes and denitrification by bacteria. It would require, however, a major study and it is suggested that some limited program of measuring total nutrient values (N, P and Si), as well as an understanding of the major sources and sinks of nutrients, would suffice where a greater level of detail regarding primary production rates (in different habi- tats) is pan of the same program (see below).
Increases in human population in the Lake Nasser region (particularly the major program to settle large numbers of people close to the lake as part of the Tushka Project) are likely to result in increased nutrient input to the lake. Whether this will have an impact on the already nutrient-rich water is doubtful. More likely is the increase of other pollutants (hy- drocarbons, pesticides and heavy metals) which may prove a problem. Environmental impact assessment (EIA) of resettle- ment programs in the region of Lake Nasser is recommended.
The summer deoxygenation of the hypolimnion is an im- portant feature of Lake Nasser. The depth of the oxic-anoxic boundary varies in the main channel of the lake from 10 to 30 m according to Latif (1984) and Abd Ellah et al. (this vol.). The depth of the oxic-anoxic boundary in shallower parts of the lake is not reported, but the extent of deoxygenation may be an important factor in limiting fish production. Fish cannot survive in deoxygenated water and therefore parts of the lake they can occupy during summer are reduced. Truly pelagic fish (of which there are few in Lake Nasser due to the original riverine fauna) will simply be compressed into the upper parts of the water column Large areas of benthos, however, will be mhabitable for the stratified periods, and this limitation of feeding areas may be a notable constraint on fish production. This may be exaggerated due to the fact that populations of less-mobile benthic invertebrates will be fewer in areas sub- ject to repeated deoxygenation. Fishar (this vol.) showed there was very limited benthic fauna in deeper waters). It is recom- mended that greater attention be paid to plotting the oxic- anoxic boundary in all parts of the lake in order to understand the variation in habitat conditions (see sectian below on habitat types).
Conditions of deoxygenation at the sediment/water inter- face of large portions of the lake will also allow trapped nu- trients to be released from the sediment as they become more soluble at lower redox potentials. This factor may be impor- tant in maintaining the high nutrient status of the lake.
Habitat types Similar to most tropical lakes subject to wet and dry sea-
sons in the catchment, there is a seasonal variation in lake level. As large quantities of water are drawn off to maintain power generation and acceptable volume of flow in the lower Nile, this is even more exaggerated in Lake Nasser. There is a seasonal difference in water level of 10-20 m, with lowest values around August and highest values around December. In addit~on, the mean annual level of the lake has varied since the closure of Aswan High Dam, with a period of filling from 1964 until the early 1980s, followed by a decline due to a period of exceptionally low rainfall in the catchment. Since the late 1980s, the volume of the lake has risen close to its highest acceptable level, which equates to a water volume of 168 km3.
These water level variations have enormous consequences on lake habitats with, for example, productive benthic areas drying out during periods of low water level, or becoming too deep to support active photosynthesizing organisms (i.e., below the euphotic depth) during periods of high water level. Similarly, inundation of benthic areas with deoxygen- ated hypolimnetic water may also have a dramatic effect on
PATTERSON/Ecosystern studies and the modelling.. . I 2 I
pnmary and secondary produchon (see section on nutrients and oxygen above). Benthic production may be a major, if not the dominant, input of carbon into the food web of the lake. This may be exaggerated in Lake Nasser where the fish fauna is of predominantly benthic feeding fish and lacks true pelagic species.
The bathymey of Lake Nasser is well known, being basi- cally that of the well-mapped topography of Nile Valley prior to closure by the Aswan High Dam. It would seem appropriate that a simple geographical information system (GIs) could be developed which considered depth (at various filling levels), oxic-anoxic boundary depth and light regime (with knowl- edge of water turbidity), to define those areas dominated by benthic and pelagic production for any given time. Values ob- tained for biomass (both primary and secondary producers) and production rates could be applied to this habitat mosaic to give overall lakewide production estimates. This would inevi- tably be a fairly crude estimate of lakewide production (though improving with greater knowledge of limnological processes and primary production rates - see below), though far prefer- able to previous estimates. It would generate more realistic figures of benthic and pelagic production for entering into the ECOPATH model. A GIs of this kind would also allow greater understanding of interannual variation in fish catch, as it would provide a lakewide estimate of carbon input.
It may be useful to calculate the variation of lake surface area from satellite imagery (see Appendix) for comparison with that calculated from knowledge of lake bathymetry.
Biomass and taxa The simplest way to estimate biomass of primary produc-
ers is to measure chlorophyll a concentration; and methods for assessing both planktonic, floating macrophyte and benthic chlorophyll a are straightforward. Converting chlorophyll a concentrations to total dry mass (needed for the ECOPATH model) leads to inaccuracy in the estimation of dry weight, despite the fact that published conversion rates exist. This is, however, likely to prove more straightforward than other di- rect or indirect measurements of plant biomass. Dry mass of rnacrophytes is relatively simple to measure directly, but for microscopic algae it is particularly difficult. Biomass for plank- tonic algae often estimated from biovolume, which depends on a calculation of size and shape of all planktonic taxa and a reasonable quantitative method of estimating the populations of these taxa-this is done by counting (usually with an in- verted microscope). To count samples to the level of accuracy required for biomass estimates requires skill and is time-con- suming. It is probably not necessary to count to this level of accuracy if chlorophyll a measurements are also being made.
Examination of identified taxa present in both planktonic and benthic populations should, however, be carried out at least to a semi-quantitative level, as seasonal or spatial varia- tions in dominant taxa provide important clues for lake pro- cesses. Particularly, the relative proportion of the main algal divisions should be recorded where, for example, a high pro- portion of cyanophytes may indicate the possibility of fish poisoning, N-fixation (where heterocysts are present); and also are generally regarded as poorer food items for fish com- pared to other groups (such as diatoms).
The only accurate way to measure zooplankton biomass is by counting the organisms (usually sampled using a variety of nets) and working out a relationship between size of indi- viduals and their biomass (simply counting individuals will not suffice as an input to the ECOPATH model). Since the zooplankton community tends to be dominated by a few spe- cies only, it is possible to make reasonable estimates of zoo- plankton biomass m this way
Similarly for benthic invertebrates, methods for biomass estimation involve counting and size estimation. This is a more difficult exercise than for plankton since the benthos 1s much more heterogeneous than the pelagic environment and the range of organisms found is greater. For Lake Nasser relating distribution of benthic populations to the depths of light pen- etration and the extent of deoxygenated sediment boundary water, will reveal a great deal about the principal secondary producers. As stated above, it is felt that benthic production may dominate over pelagic production, and therefore is wor- thy of increased study. Since the distribution of benthic or- ganisms is highly depth dependent, an appropriate sampling strategy would be to assess benthic populations on a transect from the lakeshore to deeper water. It would be appropriate to carry this out at low and high levels of water to investigate the ability of these organisms to recolonize substrate exposed during periods of low water level, as well as their ability to recolonize deoxygenated zones after reoxygenation during the autumn turnover. Fishar (this vol.) has made good pre- liminary studies of the benthic fauna.
It is likely that efforts to estimate bacterial biomass would prove of little value unless major resources are dedicated to them. This is not likely to be required for the satisfactory production of the ECOPATH model of the lake, though the amount of carbon recycled via detrital breakdown of bacteria could be high.
Carbon flux rates Obviously a critical value required by the ECOPATH model,
and one of the well-accepted limiting factors on fish produc- tion, is the rate of primary production in Lake Nasser. There are some published rates for primary production of plankton
122 Sustainable fish production in Lake Nasser
primary production (to this author's knowledge). As stated earlier, benthic production may be a larger proportion of to- tal lake primary production than previously envisaged.
The choice of methods for measuring primary production is principally between radioactive 14c (measures carbon up- take) or oxygen light/dark methods (measures oxygen evolu- tion by photosynthesis). The 14c method has advantages where photosynthetic rates are low and greater sensitivity is needed; the oxygen method is less sensitive but requires lower tech- nology and is a better measure of both gross and net photo- synthesis than the former (which measures some value between gross and net photosynthesis). At lower rates of pho- tosynthesis, the oxygen method suffers in comparison where longer incubation periods may be required to show an oxy- gen difference between the light and dark incubation vessels. Since production rates for Lake Nasser are generally high, this is probably not a problem, and therefore it is recom- mended that the oxygen method be used exclusively.
The oxygen method for measuring planktonic photosyn- thesis is already well established in Lake Nasser. Techniques for measuring benthic production are a little more complex, and require light/dark incubation chambers which can be placed over areas of rock or sand and water samples drawn off to measure oxygen concentration. It is easier to deal with these chambers by sending down divers to sample the water prior to their being disturbed by the removal of benthos for measurement of biomass (as chlorophyll a). The use of divers is probably inappropriate due to the presence of crocodiles. The alternative to in situ incubations may be to develop a shipboard method on benthic core samples.
Though aquatic macrophytes would be included in benthic samples, it would be useful to measure production rates on portions of macrophytes by labelling individual plants to ex- amine growth.
Though techniques to estimate biomass of secondary pro- ducers are straightforward (though time-consuming), estimat- ing production rates of both zooplankton and benthic fauna is difficult. I t may be that this value could be satisfactorily entered as "unknown" in the ECOPATH model. The cohort method, often used for measuring secondary production of zooplankton, is unlikely to be of value in Lake Nasser since invertebrate populations will probably not be easily separable into distinct cohorts. Life-cycle studies on common zooplankters would answer this. A similar but more highly developed method than cohort analysis is the "growth increment summation method" (for discussion, see Rigler and Downing 1984) which takes into account the development rates of each distinct life stage. This may be appropriate for estimating zooplankton production rates for the few domi- nant species in the lake. Measurement of production rates for
beyond the scope of the program proposed for Lake Nasser. As stated above, bacterial production may form an impor-
tant link in the carbon pathways of Lake Nasser - particu- larly in deoxygenated benthic environments. The dominant processes are likely to be methanogenesis and sulphur re- duction (hydrogen metabolism); measurement of methane and hydrogen sulphide concentrations in deoxygenated hypolimnetic water may give an approximate value of the rate of these processes during the stratified season.
There is a recently developed method using stable iso- tope ratio analysis to indicate both the sources of energy (car- bon) of biological tissue. This can assist with an understanding of the relative contribution of benthic production versus pe- lagic production in fish tissue since the different carbon sources are likely to have different isotopic signatures (12C:13c). Addi- tionally, the ratios of nitrogen isotopes ( 1 4 ~ : 1 5 ~ ) in fish tissue are a good indicator of their trophic position. Nitrogen ratios could be used to test the ECOPATH model and the relative trophic level at which various species and ages of fish could be assigned. Further information on this method is available in Lajtha and Michener (1994). It is felt that initially tissues should be sampled and stored for possible analysis of stable isotope ratios, and a study of this kind be costed.
Constraints A list of constraints were identified at the Workshop (see
also Craig, this vol.) which outlined the difficulties of per- forming the studies described above. It is in these areas that efforts should be made towards initiating improvements and to which resources should be directed. Establishing the bal- ance of effort in dealing with these different constraint areas is one of the major challenges in upgrading the ecological research capacity on Lake Nasser. Constraints identified were as follows: w Scientists responsible for sampling and processing data may
not be sufficiently trained w Lack of scientific equipment (both major items and
consumables) w Lack of computing facilities I Lack of literature I Lack of communication and technical support from scien-
tists outside the region (isolation) I Lack of well-trained technicians (particularly in equipment
maintenance) w Lack of ship time to carry out sampling programs w Lack of time (this alludes to those scientists charged with
insufficient data collection and being too busy with other duties).
PATTERSONlEcosystem studies and the modelling.. . 123
All these constraints need to be addressed by future projects. They can be summed up as "adequately training and resourcing staff of the national institutions responsible for carrying out these studies". Improving communications is a vital part of this process.
There also appears to be a lack of clarity of institutional responsibility and need for a coordinated approach to this work. The workshop discussions reported in these proceed- ings can be regarded as an important first step in developing an integrated approach. Data from a wide range of national institutions should be collated, for example, the High Dam Lake (Nasser) Development Authority collects hydrological and meteorological data, which should be archived and made available to all scientists in the region. A number of other similar examples exist. These data may already be available, and it is possible that scientists are simply not aware of them. In particular, a greater level of cooperation is encouraged between the two principal aquatic research organizations, the Fishery Management Centre and the National Institute of Oceanography and Fisheries. They should demarcate their areas of responsibility in order to avoid duplication or, worse, gaps in data collection.
Although there is no evidence of research and monitoring taking place in the Sudanese part of Lake Nasser/Nubia, it is clearly desirable that Egyptian and Sudanese scientists coop- erate in the monitoring of this shared resource. Knowledge on the quality and volume of input waters from the Nile can be provided only from Sudan, and it is likely that at least these basic values are collected in Khartoum below the confluence of the White and Blue Nile.
Conclusions Future efforts to understand the productive basis of Lake
Nasser should concentrate on estimates of primary producer biomass (as chlorophyll a) and production, and their spatial and temporal variation. This will require knowledge of varia- tion in the principal factors that dictate distribution of pri- mary producers, such as stratification (inducing oxygen depletion), light penetration and habitat types. Nutrient stud- ies should be carefully planned to ensure that results can be related to biological functions and therefore be interpreted. Measurement of populations of secondary producers (princi- pally the invertebrates) should also be carried out with the objective of understanding the biomass of each major group on a lakewide basis. Values derived from these studies will then be used in modelling to determine whole-lake processes, particularly the production of important commercial fish species.
References Lajtha, K. and R. Michener, Editors. 1994. Stable isotopes in ecology
and environmental science, methods in ecology. Blackwell Sci- entific, Oxford.
Latif, A.EA. 1984. Lake Nasser-the new man-made lake in Egypt (with reference to Lake Nubia), p. 411-466. In F.B. Taub (ed.) Ecosystems of the world. 23. Lakes and reservoirs. Elsevier, Amsterdam.
Rigler, F.H. and J.A. Downing. 1984. The calculation of secondary productivity, p. 19-58. In J.A. Downing and F.H. Rigler (eds.) A manual on the methods for the assessment of secondary pro- ductivity in freshwaters. Blackwell Scientific, Oxford.
Wetzel, R.G. 1983. Limnology. 2nd ed. Saunders College Publica- tion, Philadelphia.
124 Sustainable fish production in Lake Nasser

APPENDIX
Use of the National Oceanic and AtmosphericAdminis- tration (NOAA) satellite imagery to interpret suspended loads and thermal structure of Lake Nasser
Lakes and reservoirs are dynamic systems, and significant changes can occur over a period of a few days. Satellites can be used to survey whole waterbodies over this time span. NOAA satellites can measure lake surface temperature, dis- tinguish between water and land, and measure concentra- tions of suspended matter in the water column1. The orbit of the NOAA satellite passes each point on the earth's surface twice a day at approximately the same time each day (giving one day and one night images). Daytime images are used for measuring suspended matter in water; night-time images are used for measuring lake surface temperature and water extent. The resolution of NOAA satellites is approximately 1 km2, and therefore for Lake Nasser there will be approxi- mately 6 000 pixels (data points) making up the image.
Most archived raw NOAA imagery is downloadable from the World Wide Web at no cost. The NOAA data archive site on the Web for the Lake Nasser region shows that from Au- gust 1997 to August 1998, there were 64 images available,
Assuming cloud-free conditions-not likely to be a major problem in the reglon of Lake Nasser
PATTERSONlEcosystem studies and the modelling.. . 125
spaced approximately evenly throughout the year (approxi- mately five images per month). Almost all are day images, however, which can be used for sediment measurements but not for thermal studies and water extent. For the period Au- gust 1996 to August 1997, there was a greater number of images (total 236), and these are a mix of day and night.
The NOAA website is being added to all the time. It will certainly be operational in the foreseeable future (funded under NASA's Mission to Planet Earth-a 15-year program). There are also other alternative sources of NOAA data for the area. This may be required since it appears that the number of images archwed for the area can change from year to year. One possibility is to specifically request from NOAA that the 1 km resolution data be captured routinely over the area and archived on the web (this may be a free service), Since the area of our interest (Lake Nasser) is relatively small, it may be that some users requesting data from the same orbit (for example US Government sources) would have priority. Occasionally, therefore, the Lake Nasser data would not be archived. A further alternative to web-derived data is to have a local NOAA receiver with processing software. This guaran- tees regular "real-time" data, but is costly (approximately US$50 000). It may be an option if the system can be proven to be of value. Ground-truthing of NOAA imagery for Lake Nasser is seen as an important next step before the purchase of a receiver is considered. An important advantage of a local receiver is that imagery arrives in real-time, and therefore allows immediate response with respect to management actions or directing sampling programs.
The NOAA images of Lake Nasser shown here are of sur- face temperature (Fig. 1) and suspended matter (Fig. 2).
The algorithms used to derive these values are not tested for Lake Nasser and are therefore not completely reliable. Fig. 1 shows temperature variation of the surface water, and these values seem close to the expected (Latif 1984). The image was captured in April when the thermocline was beginning to form. Warmer water in the south compared to the north suggests that the thermocline develops earlier in the south of the lake. The narrower parts of the channel also show higher surface temperatures, suggesting earlier formation of the ther- mocline in these relatively sheltered parts of the lake.
In Fig. 2 the estimate of suspended matter is semi-quand- tative and could only be further improved by comparing sat- ellite-derived data directly with in situ measurements of suspended matter (or some proxy value of suspended matter such as Secchi depth). Fig. 2 does, however, clearly show the change in concentration of suspended matter between the source of sediment input in the south of the lake to the Aswan High Dam in the north where water clarity is much higher.
A project to assess the value of NOAA imagery would be an ideal research topic for an Egyptian postgraduate student spending approximately 50% of hidher time in a center of excellence for remote sensing, and 50% in the field working with a regional institution, collecting in situ data. This would be a suitable MS. or a Ph.D. For further information on re- mote sensing of inland waters see: Patterson, G., M. Wooster and C. Sear. 1995. Real-time monitoring of African lakes, reservoirs and wetlands using remote sensing with special reference to Lake Malawi/Niassa. NRI Special Publications (copies obtainable from the author).
126 Sustainable fish production in Lake Nasser

Aquaculture
M, Nomura New Fish Development Association,Tokyo, Japan
Nomura, M. 2000. Aquaculture, p. 129- 13 1 . In J.F. Craig (ed.) Sustainable fish production in Lake Nasser: ecological basis and management policy. ICLARM Conf. Proc. 6 1,184 p.
ABSTRACT
Construction of the Fishery Management Center (FMC),Aswan, was completed under Japanese aid in 1981. Cooperative studies between the Japanese and Egyptian Governments on seed production and aquaculture continued until 1993. Techniques for artificial seed production of tilapia (Oreochromis niloticus) were devel- oped at FMC, and a large-scale hatchery was completed in 1998. Experiments on breeding and stocking the lake with silver carp (Hypophthahichthys molitrix) fry were carried out. Fry production technology for benni (Barbus bynni) and Nile perch (Lates niloticus) have been investigated. Relevant legislative and management measures must be implemented for successful fish propagation. Investigations to determine the cause of species decline must be made before selecting suitable species for enhancement.The possibility of introducing new fish species into the openwater pelagic area is being considered.
Introduction In May 1978, the author came to Aswan for the first time
to formulate an integrated regional development plan for the Lake Nasser area in southern Egypt. From the results of this research, the Egyptian Government judged that fisheries showed the most promise. Fishing was already practiced in the lake and there was a high potential for production. The FMC, constructed under Japanese grant aid, was completed in December 1981. Cooperation between the Center and Ja- pan continued for 12 years until December 1993. Expert help was supplied by the Tokyo University Fisheries Department.
Main results obtained in seed production and aquaculture
Mass production technology for tilapia (Oreochromis niloticus)
The techniques of artificial seed production, which con- sist of egg taking and fertilization from cultured and/or cap- tured wild fish, hatching out and rearing of fry up to release size, were developed at FMC. It has been possible to produce about 500 000-600 000 fry (average body mass 2-7 g) per 300 female broodfish which were kept in 400 m2 ponds. A new
large-scale hatchery was completed in 1998. Judging from the tentative production performance undertaken by FMC, it is considered that 5-6 million fry can be produced in the new hatchery per annum.
Culture of silver carp, Hypophthalrnichthys molitrix Since 1984, FMC has conducted induced spawning of sil-
ver carp by hormone (pituitary) injection. FMC can produce one million eggs and 100 000 fry each year. Experiments were carried out on the potential of stocking the lake with silver carp fry. FMC installed three net cages in separate areas of the lake, and fry of 28 g were stocked. In one area, fish grew to about 2 kg in 15 months and production was 7.8 kg m-2. In the other two areas, they hardly grew and survival was low (See Shenoda and Naguib, this vol.).
Artificial propagation technology for fish conservation
Several fish species in Lake Nasser and the River Nile have declined. Fry production technology has been investi- gated for benni (Barbus bynnt] and Nile perch (Lates nibticus). Induced spawning of Nile perch was attempted by hormone (HCG) injection. The female released some eggs, but these eggs did not fertilize. Benni were caught by bottom gill nets
of maturity (based on gonad development, "GSI") were noted in March-June and September-October. Eggs from these fish were stripped and artificially fertilized and reared from July to December. They grew to 52 cm and 80% survived. Growth decreased at 250°C and stopped at 16.0°C. At the end of December, all fish died when the temperature dropped to 150°C.
Techniques and measures for the successful propagation of fish resources
When fisheries resources are decreasing in natural waters, efforts should be made for recovery by using tech- niques such as propagation. Three areas of study are involved: I Legislation: restriction and prohibition on catching speci-
fied species; establishment of closed seasons and areas; restriction on the use of specified fishing gears; and meth- ods and size limits. Management of the natural environment: the increase and improvement of spawning grounds; establishment of con- servation areas; and removal of predators.
I Stocking: release of large quantities of eggs and fry into natural waters.
Selection of fish species for propagation Fish species that are suitable for propagation and that
tend to decrease in the lake must be chosen. According to fishery statistics of 1966-1992, catches of Labeospp. and Bagm spp. have decreased remarkably. Tilapia also decreased at certain fishing sites. In the choice of fish species for propaga- tion, it is necessary to determine whether the decrease is due to overfishing, change in environmental conditions, or inter- relationships among fish species. The following information are required: 1 Environmental information: water temperature, pH, trans-
parency, dissolved oxygen, TDS, chlorophyll a, phyto- and zooplankton (species and number), and iota1 nitrogen and phosphorus.
ing ontogenetic development, interrelationships among spe- cies, age and size at maturation, preferred spawning grounds and spawning seasons.
I Fishery information: monthly catch statistics classified by the fishing grounds and by species, fishing gears employed, fishing effort and landed fish surveys (distribution of fish length and age, GSI, etc.)
A number of important factors have to be considered be- fore releasing large numbers of artificial seed. In particular, following the Rio de Janeiro Convention (19921, care must be taken with the introduction of exotic species which may have a detrimental effect on the ecosystem. Stocked fish should normally be endemic.
Benni is one of the important species of Lake Nasser and common in the southern part. Techniques for the artificial seed production of this species should be improved, and large numbers of fry stocked in the lake.
Labeo and Bagrus species may have decreased due to , low oxygen in the bottom layers of the lake in summer and/ or overfishing by bottom gill nets in the southern part of the lake. These factors need to be investigated.
The Egyptian Government hopes to introduce new fish species into the openwater area of Lake Nasser, which makes up as much as 80% of the total lake area but only 6% of the total catch.
Conclusions The fundamental task of FMC is to conduct research that
will be useful in maintaining the natural living resources of Lake Nasser. Aquaculture should continue to release a large quantity of tilapia fry, and study the effect of release by tag- ging methods. Experiments on seed production of useful na- tive species should continue. The selection and introduction of fish species, which can utilize the openwater area in Lake Nasser, should be undertaken to increase total yield of the lake.
130 Sustainable fish production in Lake Nasser
Stock Enhancement
A.F. Born L
FA0 Inland Water Resources and Aquaculture Service, Rome, Italy
Born,A.F. 2000. Stock enhancement, p. 133- 144. In J.F. Craig (ed.) Sustainable fish production in Lake Nasser: ecological basis and management policy. ICLARM Conf. Proc. 6 1,184 p.
ABSTRACT Enhancement of fish stocks through repeated stocking with material raised within aquaculture installations is one of the most widespread measures for management of inland fisheries today.Stocking programs have often been implemented without properly examining the causes for the decline in the fishery or the reasons for suboptimal production.This has resulted in failures of stocking programs in the past because factors, such as overfishing, poor fisheries management and degradation of the aquatic environment were not simultaneously addressed. Few stocking programs have been evaluated in terms of their returns, cost-benefits and associated environmental impacts.
Introduction Enhancement of fish stocks through repeated stocking with
material raised within aquaculture installations is one of the most widespread measures for management of inland fisher- ies today (Welcomrne and Bartley 1998). Stocking of open waterbodies refers to a repeated release over a prolonged pcriod to supplement or sustain a population of a species that generally already exists or that was introduced before (Cowx 1998). In contrast, introductions are usually carried out in a limited time frame with the aim to establish self- reproducing populations. The aims of stocking programs are to supplement or sustain the recruitment of one or more aquatic organisms and thus to raise the total production or the production of selected elements of a fishery beyond a level which is sustainable by natural processes (FA0 1997a). The definition of the term "stocking", and whether the out- puts of stocking programs should belong to aquaculture or capture fisheries production statistics, is still a topic of de- bate. Because stock enhancement is often not included as a separate item in production records, future prospects of stock- ing as a tool to increase food security are difficult to predict. Inconsistent reporting makes global assessment of stock en- hancement complicated, so formulation of a clear definition of stocking and guidelines for its reporting need to be devel- oped both globally and nationally.
In the literature, stocking or stock enhancement is also referred to as hatchery enhancement, culture-based fisheries, artificial stocking and extensive aquaculture. For the purpose of this paper the term "stocking" is used.
Stocking should be considered if the natural reproduction rate of the target species is not sufficient to sustain a certain level of production or biomass in a population. However, stocking programs have often been implemented without properly addressing the causes for the decline in the fishery or the reasons for suboptimal production. This has resulted in failures of stocking programs in the past because factors. such as overfishing, poor fisheries management and degrada- tion of the aquatic environment, were not simultaneously addressed. It is of utmost importance that stocking programs are undertaken concurrently with appropriate monitoring and management measures, e.g., restriction of fishing effort, closed seasons, closed areas and protection of vital habirat, to make them sustainable and more effective.
Stocking is practiced for various reasons of which the most important ones are (Cowx 1994; Welcomme and Bartley 1998):
Compensation: to mitigate a disturbance to the environ- ment caused by human activities. The quality of the altered or alternate habitat should be sufficient to ensure survival of the stocked fish. Native species should be stocked and
BORNlStock enhancement 133
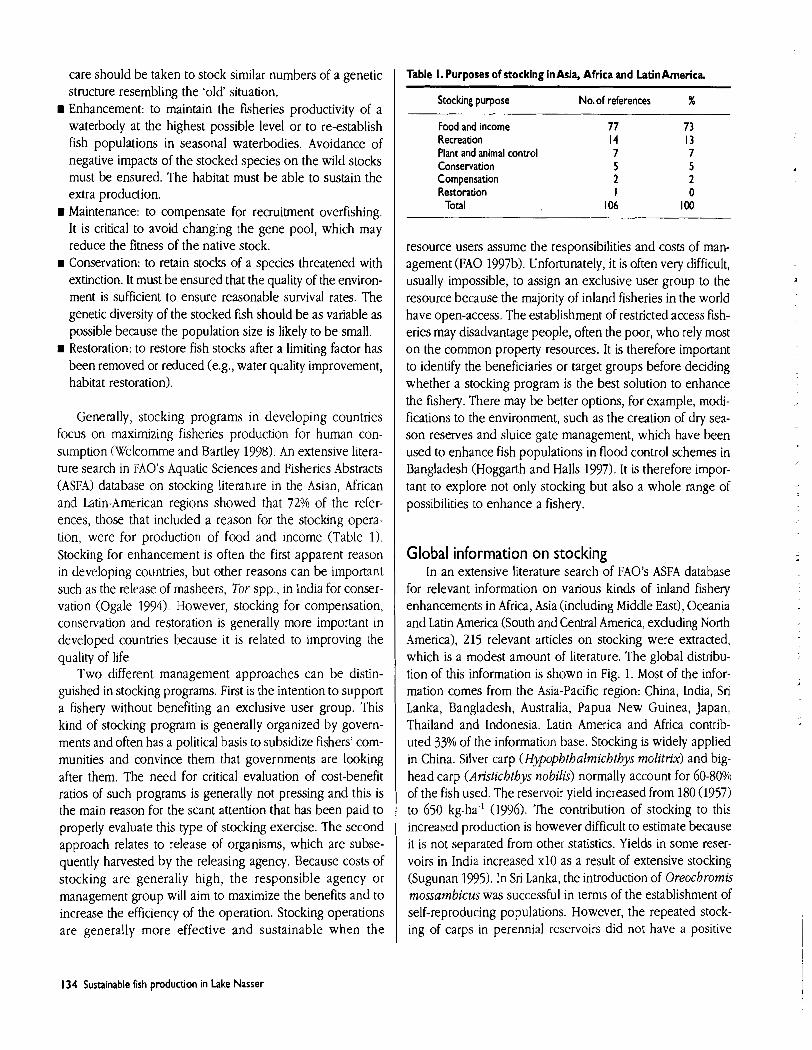
care should be taken to stock similar numbers of a genetic structure resembling the 'old' situation.
r Enhancement: to maintain the fisheries productivity of a waterbody at the highest possible level or to re-establish fish populations in seasonal waterbodies. Avoidance of negative impacts of the stocked species on the wild stocks must be ensured. The habitat must be able to sustain the extra production.
r Maintenance: to compensate for recruitment overfishing. It is critical to avoid changing the gene pool, which may reduce the fitness of the native stock.
r conservation: to retain stocks of a species threatened with extinction. It must be ensured that the quality of the environ- ment is sufficient to ensure reasonable survival rates. The genetic diversity of the stocked fish should be as variable as possible because the population size is likely to be small.
r Restoration: to restore fish stocks after a limiting factor has been removed or reduced (e.g., water quality improvement, habitat restoration).
Generally, stocking programs in developing countries focus on maximizing fisheries production for human con- sumption (Welcornrne and Bartley 1998). An extensive litera- ture search in FAO's Aquatic Sciences and Fisheries Abstracts (ASFA) database on stocking literature in the Asian, African and Latin-American regions showed that 72% of the refer- ences, those that included a reason for the stocking opera- tion, were for production of food and income (Table 1). Stocking for enhancement is often the first apparent reason in developing countries, but other reasons can be important such as the release of masheers, Tor spp., in India for conser- vation (Ogale 1994). However, stocking for compensation, conservation and restoration is generally more important in developed countries because it is related to improving h e quality of life.
Two different management approaches can be distin- guished in stocking programs. First is the intention to support a fishery without benefiting an exclusive user group. This kind of stocking program is generally organized by govern- ments and often has a political basis to subsidize fishers' com- munities and convince them that governments are looking after them. The need for critical evaluation of cost-benefit ratios of such programs is generally not pressing and this is the main reason for the scant attention that has been paid to properly evaluate this type of stocking exercise. The second approach relates to release of organisms, which are subse- quently harvested by the releasing agency. Because costs of stocking are generally high, the responsible agency or management group will aim to maximize the benefits and to increase the efficiency of the operation. Stocking operations are generally more effective and sustainable when the
Table I. Purposes o f stocking in Asia, Africa and Latin America
Stocking purpose No. of references %
Food and income Recreation Plant and animal control Conservation Compensation Restoration
Total
resource users assume the responsibilities and costs of man- agement (FA0 1997b). Unfortunately, it is often very difficult, usually impossible, to assign an exclusive user group to the resource because the majority of inland fisheries in the world have open-access. The establishment of restricted access fish- eries may disadvantage people, often the poor, who rely most on the common property resources. It is therefore important to identify the beneficiaries or target groups before deciding whether a stocking program is the best solution to enhance the fishery. There may be better options, for example, modi- fications to the environment, such as the creation of dry sea- son reserves and sluice gate management, which have been used to enhance fish populations in flood control schemes in Bangladesh (Hoggarth and Halls 1997). It is therefore impor- tant to explore not only stocking but also a whole range of possibilities to enhance a fishery.
Global information on stocking In an extensive literature search of FA03 ASFA database
for relevant information on various kinds of inland fishery enhancements in Africa, Asia (including Middle East), Oceania and Latin America (South and Central America, excluding North America), 215 relevant articles on stocking were extracted, which is a modest amount of literature. The global distribu- tion of this information is shown in Fig. 1. Most of the infor- mation comes from the Asia-Pacific region: China, India, Sri Lanka, Bangladesh, Australia, Papua New Guinea, Japan, Thailand and Indonesia. Latin America and Africa contrib- uted 33% of the information base. Stocking is widely applied in China. Silver carp (Hypophthalmichthys molitrix) and big- head carp (Aristichthys nobilis) normally account for 60-80% of the fish used. The reservoir yield increased from 180 (1957) to 650 kg.ha-I (1996). The contribution of stocking to this increased production is however difficult to estimate because it is not separated from other statistics. Yields in some reser- voirs in India increased x10 as a result of extensive stocking (Sugunan 1995). In Sri Lanka, the introduction of Oreochromis mossambicus was successful in terms of the establishment of self-reproducing populations. However, the repeated stock- ing of carps in perennial reservoirs did not have a positive
134 Sustainable fish production in Lake Nasser
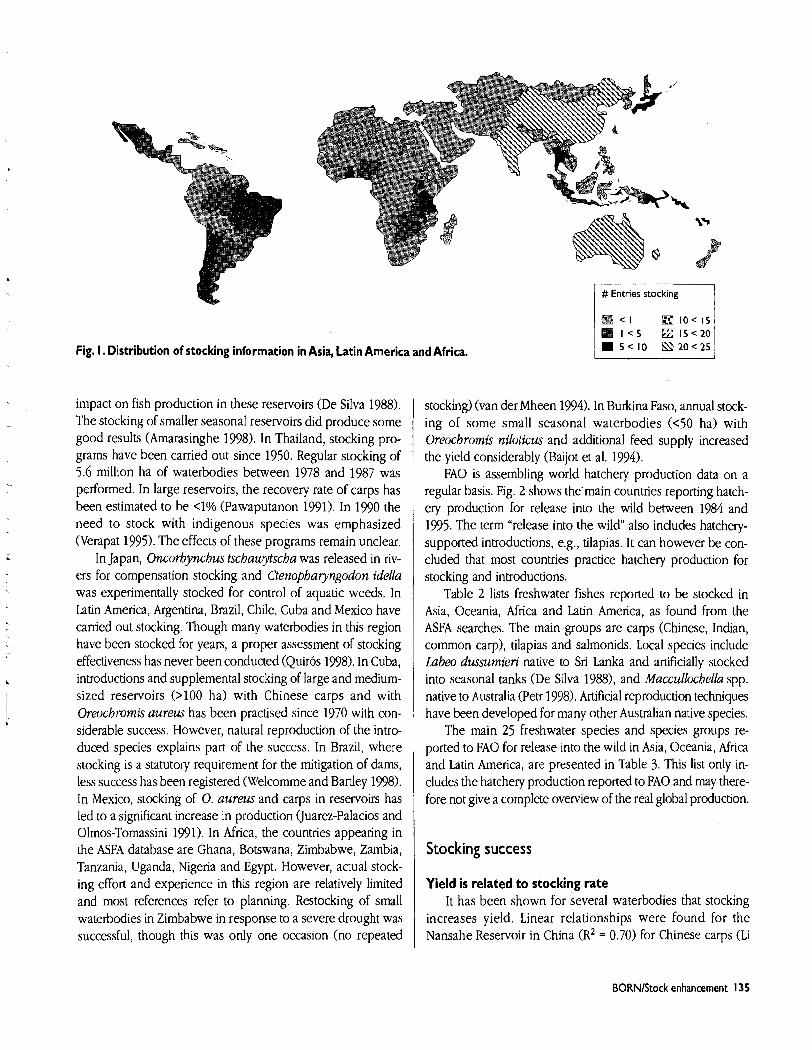
Fig. I. Distribution of stocking information in Asia, Latin America and Africa.
impact on fish production in these reservoirs (De Silva 1988). The stocking of smaller seasonal reservoirs did produce some good results (Amarasinghe 1998). In Thailand, stocking pro- grams have been carried out since 1950. Regular stocking of 5.6 million ha of waterbodies between 1978 and 1987 was performed. In large reservoirs, the recovery rate of carps has been estimated to be 4 % (Pawaputanon 1991). In 1990 the need to stock with indigenous species was emphasized (Verapat 1995). The effects of these programs remain unclear.
In Japan, Oncorhynchus tschawytscha was released in riv- ers for compensation stocking and Ctenopharyngodon idella was experimentally stocked for control of aquatic weeds. In Latin America, Argentina, Brazil, Chile, Cuba and Mexico have carried out stocking. Though many waterbodies in this region have been stocked for years, a proper assessment of stocking effectiveness has never been conducted (Quiros 1998). In Cuba, introductions and supplemental stocking of large and medium- sized reservoirs (>I00 ha) with Chinese carps and with Oreochromis aureus has been practised since 1970 with con- siderable success. However, natural reproduction of the intro- duced species explains part of the success. In Brazil, where stocking is a statutory requirement for the mitigation of dams, less success has been registered (Welcomme and Banley 1998). In Mexico, stocking of 0. aureus and carps in reservoirs has led to a significant increase in production Uuarez-Palacios and Olmos-Tomassini 1991). In Africa, the countries appearing in the ASFA database are Ghana, Botswana, Zimbabwe, Zambia, Tanzania, Uganda, Nigeria and Egypt. However, actual stock- ing effort and experience in this region are relatively limited and most references refer to planning. Restocking of small waterbodies in Zimbabwe in response to a severe drought was successful, though this was only one occasion (no repeated
# Entries stocking 1
stocking) (van der Mheen 1994). In Burkina Faso, annual stock- ing of some small seasonal waterbodies (<50 ha) with Oreochromis niloticus and additional feed supply increased the yield considerably (Baijot et al. 1994).
FA0 is assembling world hatchery production data on a regular basis. Fig. 2 shows the'main countries reporting hatch- ery production for release into the wild between 1984 and 1995. The term "release into the wild also includes hatchery- supported introductions, e.g., tilapias. It can however be con- cluded that most countries practice hatchery production for stocking and introductions.
Table 2 lists freshwater fishes reported to be stocked in Asia, Oceania, Africa and Latin America, as found from the ASFA searches. The main groups are carps (Chinese, Indian, common carp), tilapias and salmonids. Local species include Labeo dussumieri native to Sri Lanka and artificially stocked into seasonal tanks (De Silva 1988), and Maccullochella spp. native to Australia (Petr 1978). Artificial reproduction techniques have been developed for many other Australian native species.
The main 25 freshwater species and species groups re- ported to FA0 for release into the wild in Asia, Oceania, Africa and Latin America, are presented in Table 3. This list only in- cludes the hatchery production reported to FA0 and may there- fore not give a complete overview of the real global production.
Stocking success
Yield is related to stocking rate It has been shown for several waterbodies that stocking
increases yield. Linear relationships were found for the Nansahe Reservoir in China (R2 = 0.70) for Chinese carps (Li
BORNlStock enhancement 135
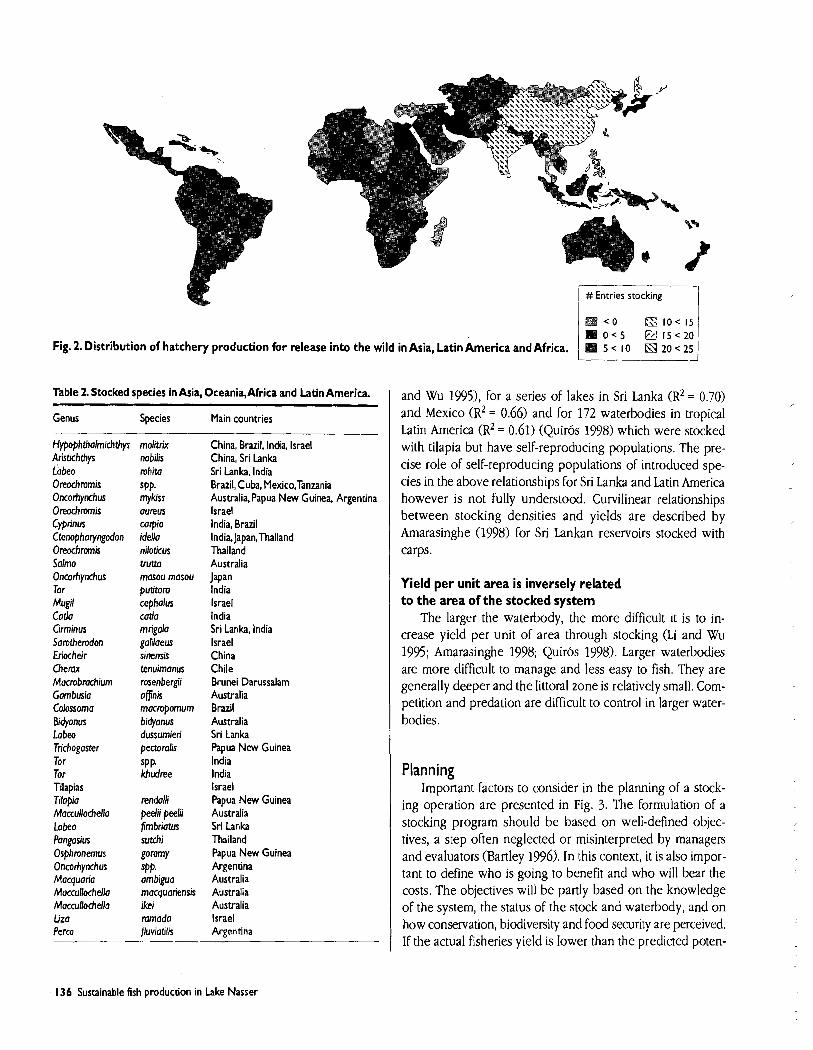
# Entries stocking 1
Table 2. Stocked species in Asia, Oceania,Africa and Latin America.
Fig. 2. Distribution of hatchery production for release into the wild in Asia, Latin America and Africa.
Genus Species Main countries
< o 6310<15 0 < 5 0 1 5 ~ 2 0 I 5 < lo 20 c 25
Hypophthalrnichthys molitrix China, Brazil, India, Israel Aristichthys Labeo Oreochmmis Oncorhynchus Oreochrornis cyprinus Ctenopharyngodon Oreochrornis Salrno Oncorhynchus Tor Mugil Catla Cirrhinus Sorothemdon Eriocheir Chemx Macmbmchium Gambusia Colossorna Bidyanus Labeo Trichogoster Tor Tor Tilapias Tilapia Maccullochella Labeo Pangasius Osphronernus Oncorhynchus Mocquaria Maccullochella Maccullochella Lza Perca
nobilis rohita SPP. rnykss aureus carpi0 idella niloticus trum masou masou putitom cephalus catla rnrigala galilaeus sinensis tenuirnanus rosenbergii ofinis mocropornurn bidyanus dussurnieri peaoralis SPP. khudree
rendalli peelii peelii firnbriotus sutchi goramy SPP. arnbigua rnacquariensis ikei rarnada fluviatilis
China, Sri Lanka Sri Lanka, lndia Brazil, Cuba, Mexico,Tanzania Australia, Papua New Guinea, Argentina lsrael India, Brazil India, japan,Thailand Thailand Australia Japan lndia lsrael lndia Sri Lanka, lndia lsrael China Chile Brunei Darussalam Australia Brazil Australia Sri Lanka Papua New Guinea lndia lndia lsrael Papua New Guinea Australia Sri Lanka Thailand Papua New Guinea Argentina Australia Australia Australia lsrael Argentina
and Wu I%), for a series of lakes in Sri Lanka (R2 = 0.70) and Mexico (RZ = 0.66) and for 172 waterbodies in tropical Latin America (R2 = 0.61) (Quiros 1998) which were stocked with tilapia but have self-reproducing populations. The pre- cise role of self-reproducing populations of introduced spe- cies in the above relationships for Sri Lanka and Latin America however is not fully understood. Curvilinear relationships between stocking densities and yields are described by Amarasinghe (1998) for Sri Lankan reservoirs stocked with carps.
Yield per unit area i s inversely related to the area of the stocked system
The larger the waterbody, the more difficult it is to in- crease yield per unit of area through stocking (Li and Wu 1995; Amarasinghe 1998; Quirb 1998). Larger waterbodies are more difficult to manage and less easy to fish. They are generally deeper and the littoral zone is relatively small. Com- petition and predation are difficult to control in larger water- bodies.
Planning Important factors to consider in the planning of a stock-
ing operation are presented in Fig. 3. The formulation of a stocking program should be based on well-defined objec- tives, a step often neglected or misinterpreted by managers and evaluators (Bartley 1996). In this context, it is also impor- tant to define who is going to benefit and who will bear the costs. The objectives will be partly based on the knowledge of the system, the status of the stock and waterbody, and on how conservation, biodiversity and food security are perceived. If the actual fisheries yield is lower than the predicted poten-
136 Sustainable fish production in Lake Nasser
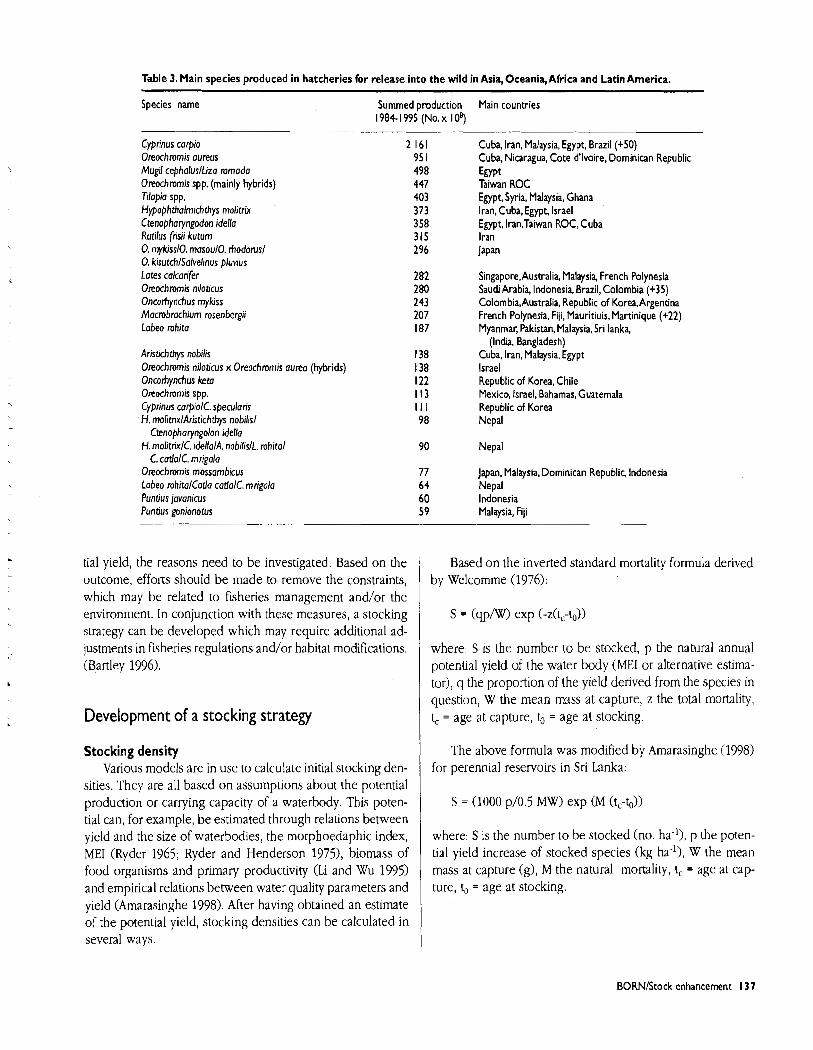
Table 3. Main species produced in hatcheries for release into the wild in Asia,Oceania,Africa and Latin America.
Species name Summed production Main countries 1984- 1995 (No. x 1 08)
Cyprinus corpio Oreochmmis oureus Mugil cepholuslLizo mmodo Oreochmmis spp. (mainly hybrids) Tilapio spp. Hypophtholmichthys molitrix Ctenophoryngodon idella Rutilus frisii kutum 0. mykissl0, mosoul0. rhodorusl 0. kisutchlSolvelinus pluvius Lotes calcorifer Oreochromis niloticus Oncorhynchus mykiss Mocrobrochium rosenbergii Lobeo mhito
Aristichthys nobilis Oreochmmis niloticus x Oreochmmis aureo (hybrids) Oncorhynchus keto Oreochmmis spp. Cyprinus corpioK. sgeculoris H. rnolitrixlAristichthys nobilisl
Ctenopharyngolon idello H. molitrixlC. idellolA. nobilislL mhitol
C. catlolC rnrigolo Oreochromis mossambicus Lobeo mhitolCotlo cotlolC. mrigolo Puntius javonicus Puntius gonionotus
Cuba, Iran, Malaysia, Egypt, Brazil (+50) Cuba, Nicaragua, Cote d'lvoire, Dominican Republic Egypt Taiwan ROC Egypt, Syria, Malaysia, Ghana Iran, Cuba, Egypt, Israel Egypt, Iran,Taiwan ROC, Cuba Iran Japan
Singapore,Australia, Malaysia, French Polynesia Saudi Arabia, Indonesia, Brazil, Colombia (+35) Colombia,Australia, Republic of Korea,Argentina French Polynesia, Fiji, Mauritiuis, Martinique (+22) Myanmar, Pakistan, Malaysia, Sri lanka,
(India, Bangladesh) Cuba, Iran, Malaysia, Egypt Israel Republic of Korea, Chile Mexico, Israel, Bahamas, Guatemala Republic of Korea Nepal
Nepal
Japan, Malaysia, Dominican Republic, lndonesia Nepal Indonesia Malaysia, Fiji
tial yield, the reasons need to be investigated. Based on the outcome, efforts should be made to remove the constraints, which may be related to fisheries management and/or the environment. In conjunction with these measures, a stocking strategy can be developed which may require additional ad- justments in fisheries regulations and/or habitat modifications. (Bartley 1996).
Development of a stocking strategy
Stocking density Various models are in use to calculate initial stocking den-
sities. They are all based on assumptions about the potential production or carrying capacity of a waterbody. This poten- tial can, for example, be estimated through relations between yield and the size of waterbodies, the morphoedaphic index, ME1 (Ryder 1965; Ryder and Henderson 1975), biomass of food organisms and primary productivity (Li and Wu 1995) and empirical relations between water quality parameters and yield (Amarasinghe 1998). After having obtained an estimate of the potential yield, stocking densities can be calculated in several ways.
Based on the inverted standard mortality formula derived by Welcomme (1976):
S = (qp/W) exp (-z(t,-to))
where S 1s the number to be stocked, p the natural annual potential yield of the water body (ME1 or alternative estirna- tor), q the proportion of the yield derived from the species in question, W the mean m s s at capture, z the total mortality, t, = age at capture, to = age at stocking.
The above formula was modified by Amarasinghe (1998) for perennial reservoirs in Sri Lanka:
S = (1000 p/0.5 MW) exp (M &-to))
where: S is the number to be stocked (no. ha-'), p the poten- tial yield increase of stocked species (kg ha-'), W the mean mass at capture (g), M the natural mortality, t, = age at cap- ture, to = age at stocking.
BORNlStock enhancement 137
Li and Wu (1995) used the following formula for Chinese reservoirs:
d = F / W S
thereby improving the evaluation of stocking (Davenport and Ekaratne 1997).
where: d is the number to be stocked (no. ha-l year-'), F = annual fish yield (kg ha-') estimated from biomass of food organisms, W the mean mass at capture (kg), S = return rate (%I.
Lorenzen (1995) used mathematical modelling to evalu- ate a culture-based fishery for carps. The dynamics of stock- ing were related to stocking density, stocking size, fishing effort, competition, predation and the carrying capacity of the system. Information is also required on growth, natural mortality, density-dependent factors, fishing mortality, effort and gear selectivity. This is often difficult to obtain.
After calculation of the initial stocking rate, the density can be adjusted according to growth rates and size at harvest. This kind of adjustment is practiced in China. Basically, fast growth of a stocked species indicates an abundance of food and the stocking density can thus be increased. Depending on the desired size at harvest, an optimal stocking rate is derived after several years of experience. It has been shown in the Dongfeng Reservoir, China, that these empirical stock- ing rates indeed maximized the yield after evaluation of the stocking densities with a modified cohort analysis technique (Lorenzen et al. 1997).
Size of the stocked fish The size at stocking is determined by the survival rate
(the larger the fingerling, the lower the mortality rate) and the production costs (the larger the fingerling, the higher the costs). The optimal stocking size is often determined empirically. A priori knowledge on the biology of the native fish fauna may help to determine a minimum stocking size. In Chinese reser- voirs, 90% of the bighead and silver carp fingerlings 4 3 cm were preyed on by an endemic piscivorous fish, whereas those exceeding 13 cm were rarely attacked by predators (Li and Wu 1995).
Time of release According to C o w (1994), fish should be stocked when
flow rates and water temperatures are generally low to mini- mize displacement and stress. Fish should be released when food is available (Cowx 1%4; Sugunan 1995) but not during the spawning season, as the stocked species may interfere with natural reproduction processes (Cowx 1994). Such "out of phase" releases may offer an excellent opportunity to dis- tinguish cohorts of released and naturally produced offspring
Site and mechanism of release Fish can be released: (a) at one site (spot planting); (b) at
several sites (scatter planting); or (c) into the same region over a period of time (trickle planting) (Cowx 1994). Spot planting can lead to competition among stocked fish or with indigenous fish. Though this way of stocking is probably less effective than scatter or trickle planting, it is generally easier and less expensive. Trickle planting in particular requires extra labor and costs, and fish have to be available for a longer period.
Environmental assessment Several international organizations stress the importance
of a precautionary approach to resource management to avoid irreversible or slowly reversible changes (within two to three decades), and that priority should be given to conserve the productive capacity of the resource in cases where the likely impact of resource use is uncertain (FA0 1996). These as- pects should be addressed during the formulation of any stock- ing program. More specifically these include: assessment of risks to the environment, native fish stocks, genetic composi- tion of the resident and stocked fish; and assessments related to transfer of diseases. An overview of possible impacts and the associated measures for prevention, mitigation and reha- bilitation is presented in Table 4.
Collection of information on the biology and ecology of the concerned species is an important first step. Because fish for stocking are mainly produced through induced spawning in aquaculture operations (Welcomme and Bartley 1998), the genetic characteristics of the hatchery fish are important for the assessment of the risks involved. The genetic characteris- tics can have an indirect effect on the indigenous species through predation, competition and new diseases. Directly, they can initiate changes in gene flow (hybridization and in- trogression) (Carvalho and Cross 1998). A first step should assess the genetic resources. Protein and isozyme analysis provides a quick and relativly inexpensive means to examine genetic variability. DNA analysis is also becoming available (Bartley 1996). The use of a large base of healthy, nonrelated, brood stock to maximize genetic variability and prevent the stock from inbreeding is especially important if a repeated release over a prolonged period is practiced. Alternatively, seed could be raised from natural resources in the hatchery, though this may be detrimental to natural populations and therefore not sustainable (Bartley 1996).
138 Sustainable fish production in Lake Nasser
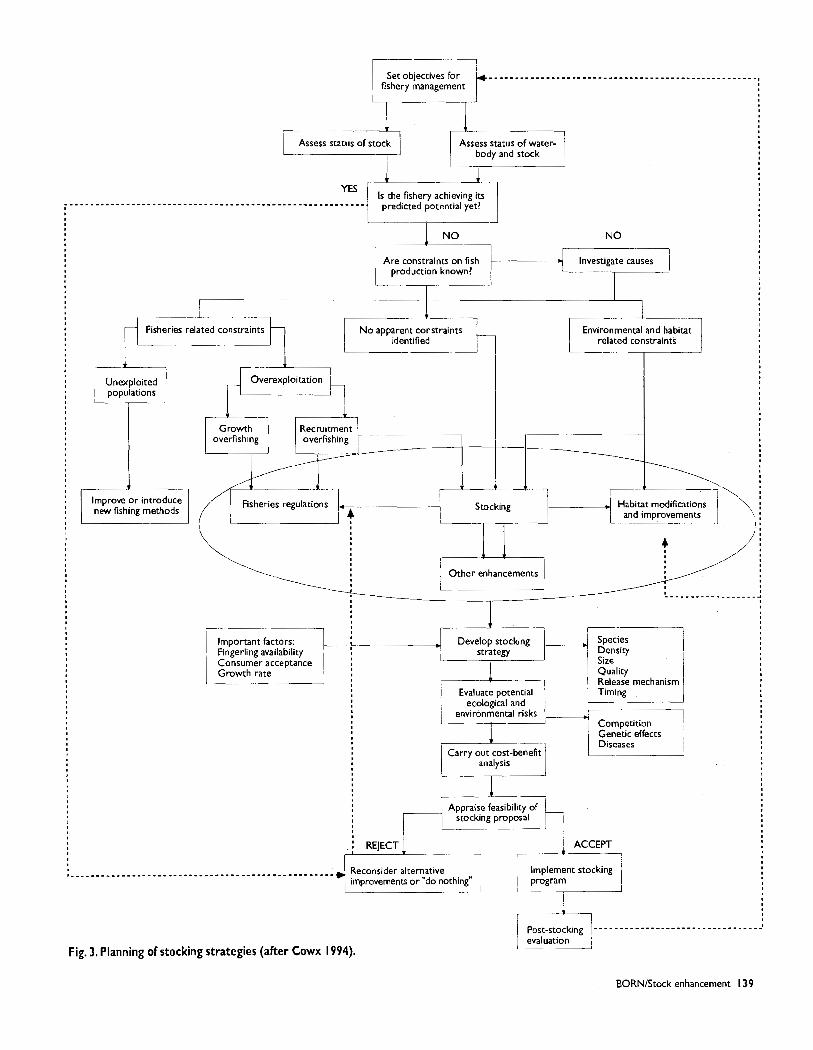
Assess status of stock . I
I
Assess status of water- body and stock
Is the fishery achieving its predicted potential yet?
I 1 Are constraints on fish Investigate causes i production known? I
Fisheries related constraints w 1 N o apparent constraints I
identified h Environmental and habitat related constraints
1 Overexplotat~on
Growth Recru~tment overfishlng overfishlng
/
. I
F~sherles regulations , - stocklng 4 Habnat mod~ficat~ons I and Improvements L -lp-
I I 1
Unexploited
new fishing methods
Important factors: Fingerling availability Consumer acceptance Growth rate
Diseases
analysis
Appraise feasibihty of stocking proposal
ACCEPT ,
Reconsider alternative Implement stocking i m p r o v e m e o r d o nothing" i program
Fig. 3. Planning of stocking strategies (after Cowx 1994).
BORNlStock enhancement 139
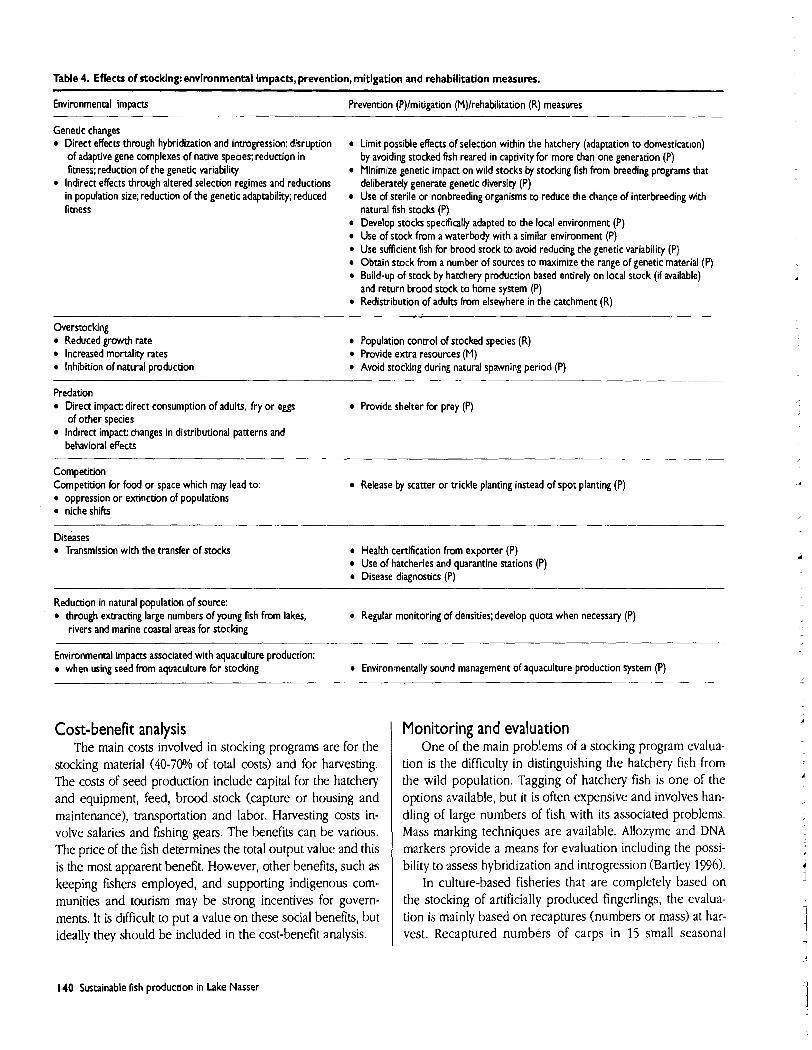
Table 4. Effects o f stocking: environmental impacts, prevention, mitigation and rehabilitation measures.
Environmental impacts Prevention (P)lmitigation (M)lrehabilitation (R) measures
Genetic changes Direct effects through hybridization and intmgression: disruption * Limit possible effects of selection within the hatchery (adaptation to domestication) of adaptive gene complexes of native species; reduction in by avoiding stocked fish reared in captivity for more than one generation (P) fitness; reduction of the genetic variability Minimize genetic impact on wild stocks by stocking fish from breeding programs that lndrect effects through altered selection regimes and reductions deliberately generate genetic diversity (P) in population size; reduction of the genetic adaptability; reduced Use of sterile or nonbreeding organisms to reduce the chance of interbreeding with fitness natural fish stocks (P)
Develop stocks specifically adapted to the local environment (P) Use of stock from a waterbody with a similar environment (P)
* Use sufficient fish for brood stock to avoid reducing the genetic variability (P) Obtain stock from a number of sources to maximize the range of genetic material (P) Build-up of stock by hatchery production based entirely on local stock (if available) and return brood stock to home system (P) Redistribution of adults from elsewhere in the catchment (R)
- - - -
Overstocking Reduced growth rate Population control of stocked species (R) Increased mortal~ty rates Provide extra resources (M) Inhibition of natural production Avoid stocking during natural spawning period (P)
Predaoon Direct impact: direct consumption of adults, fry or eggs Provide shelter for prey (P) of other species Indirect impact changes in distributional patterns and behavioral effects
Competition Competition for food or space which may lead to: * oppression or extinction of populations
niche shifts
Release by scatter or trickle planting instead of spot planting (P)
Diseases Transmission with the transfer of stocks Health certification from exporter (P)
Use of hatcheries and quarantine stations (P) Disease diagnostics (P)
Reduction in natural population of source: through extracting large numbers of young fish from lakes, Regular monitoring of densities; develop quota when necessary (P) rivers and marine coastal areas for stocking -- - --
Environmental impacts associated with aquaculture production: when using seed from aquaculture for stocking Environmentally sound management of aquaculture production system (P)
Cost-benefit analysis The main costs involved in stocking programs are for the
stocking material (40-70% of total costs) and for harvesting. The costs of seed production include capital for the hatchery and equipment, feed, brood stock (capture or housing and maintenance), transportation and labor. Harvesting costs in- volve salaries and fishing gears. The benefits can be various. The price of the fish determines the total output value and this is the most apparent benefit. However, other benefits, such as keeping fishers employed, and supporting indigenous com- munities and tourism may be strong incentives for govern- ments. It is difficult to put a value on these social benefits, but ideally they should be included in the cost-benefit analysis.
Monitoring and evaluation One of the main problems of a stocking program evalua-
tion is the difficulty in distinguishing the hatchery fish from the wild population. Tagging of hatchery fish is one of the options available, but it is often expensive and involves han- dling of large numbers of fish with its associated problems. Mass marking techniques are available. Allozyme and DNA markers provide a means for evaluation including the possi- bility to assess hybridization and introgression (Bartley 1996).
In culture-based fisheries that are completely based on the stocking of artificially produced fingerlings, the evalua- tion is mainly based on recaptures (numbers or mass) at har- vest. Recaptured numbers of carps in 15 small seasonal
140 Sustainable fish production in Lake Nasser
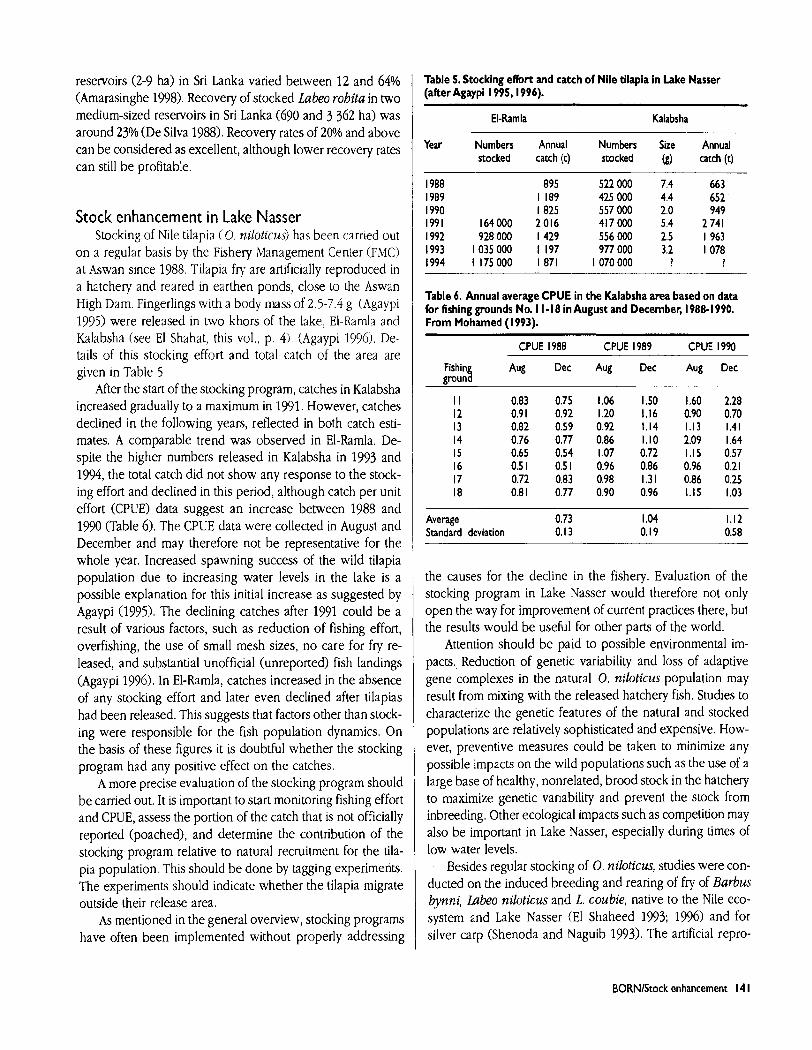
reservoirs (2-9 ha) in Sri Lanka varied between 12 and 64% (Amarasinghe 1998). Recovery of stocked Labeo rohita in two medium-sized reservoirs in Sri Lanka (690 and 3 362 ha) was around 23% (De Silva 1988). Recovery rates of 20% and above can be considered as excellent, although lower recovery rates can still be profitable.
Stock enhancement in Lake Nasser Stocking of Nile tilapia (0. niloticus) has been carried out
on a regular basis by the Fishery Management Center (FMC) at Aswan since 1988. Tilapia fry are artificially reproduced in a hatchery and reared in earthen ponds, close to the Aswan High Dam. Fingerlings with a body mass of 2.5-7.4 g (Agaypi 1995) were released in two khors of the lake, El-Rarnla and Kalabsha (see El Shahat, this vol., p. 4). (Agaypi 19963. De- tails of this stocking effort and total catch of the area are given in Table 5.
After the start of the stocking program, catches in Kalabsha increased gradually to a maximum in 1991. However, catches declined in the following years, reflected in both catch esti- mates. A comparable trend was observed in El-Ramla. De- spite the higher numbers released in Kalabsha in 1993 and 1994, the total catch did not show any response to the stock- ing effort and declined in this period, although catch per unit effort (CPUE) data suggest an increase between 1988 and 1990 (Table 6). The CPUE data were collected in August and December and may therefore not be representative for the whole year. Increased spawning success of the wild tilapia population due to increasing water levels in the lake is a possible explanation for this initial increase as suggested by Agaypi (1995). The declining catches after 1991 could be a result of various factors, such as reduction of fishing effort, overfishing, the use of small mesh sizes, no care for fry re- leased, and substantial unofficial (unreported) fish landings (Agaypi 1996). In El-Ramla, catches increased in the absence of any stocking effort and later even declined after tilapias had been released. This suggests that factors other than stock- ing were responsible for the fish population dynamics. On the basis of these figures it is doubtful whether the stocking program had any positive effect on the catches.
A more precise evaluation of the stocking program should be carried out. It is important to start monitoring fishing effort and CPUE, assess the portion of the catch that is not officially reported (poached), and determine the contribution of the stocking program relative to natural recruitment for the tila- pia population. This should be done by tagging experiments. The experiments should indicate whether the tilapia migrate outside their release area.
As mentioned in the general overview, stocking programs have often been implemented without properly addressing
Table 5. Stocking effort and catch of Nile tilapia in Lake Nasser (after Agaypi 1995,1996).
El-Ramla Kalabsha
Year Numbers Annual Numbers Size Annual stocked catch (t) stocked (g) catch (t)
Table 6. Annual average CPUE in the Kalabsha area based on data for fishing grounds No. I 1-1 8 in August and Decembec 1988-1 990. From Mohamed (1 993).
CPUE 1988 CPUE 1989 CPUE 1990
Fishin Aug Dec Aug Dec Aug Dec pun!
I I 0.83 0.75 1.06 I2 0.91 0.92 1.20 13 0.82 0.59 0.92 14 0.76 0.77 0.86 15 0.65 0.54 1.07 16 0.51 0.51 0.96 17 0.72 0.83 0.98 18 0.81 0.77 0.90
Average 0.73 Standard deviation 0.13
the causes for the decline in the fishery. Evaluation of the stocking program in Lake Nasser would therefore not only open the way for improvement of current practices there, but the results would be useful for other parts of the world.
Attention should be paid to possible environmental im- pacts. Reduction of genetic variability and loss of adaptive gene complexes in the natural 0, niloticus population may result from mixing with the released hatchery fish. Studies to character~ze the genetic features of the natural and stocked populations are relatively sophisticated and expensive. How- ever, preventive measures could be taken to minimize any possible impacts on the wild populations such as the use of a large base of healthy, nonrelated, brood stock in the hatchery to maximize genetic variability and prevent the stock from inbreeding. Other ecological impacts such as competition may also be important in Lake Nasser, especially during times of low water levels.
Besides regular stocking of 0. niloticus, studies were con- ducted on the induced breeding and rearing of fry of Barbus bynni, Labeo niloticus and L. coubie, native to the Nile eco- system and Lake Nasser (El Shaheed 1993; 1996) and for silver carp (Shenoda and Naguib 1993). The artificial repro-
BORNlStock enhancement 14 1
duction of B. bynni and Labeo spp. is interesting from the viewpoint of restoration of these populations that have de- clined in the past decade. Silver carp has been used in cage culture trials but has not been released to the open water. There is concern that introduced silver carp may establish itself in Lake Nasser. In fact there is some indication that sil- ver carp may be able to breed in the wild in southern Africa (Impacto 1997).
Conclusions Stocking is one of the most widespread practices in in-
land fisheries management, but unfortunately it has often been practised without adequate planning, monitoring or evalua- tion. Because of concerns about the negative effects that stock- ing can have o n the environment and the native fish populations, careful planning of these programs is very im- portant. The impact of regular stocking of Nile tilapia into Lake Nasser on the catches of this species and on the lake's environment and ecosystem is not well understood. The avail- able data do not permit any decisive conclusions in this re- spect, and it is therefore suggested that the stocking program be evaluated. The results of such an evaluation may be in- strumental in improving the efficiency and effectiveness of the program.
Acknowledgements I would like to thank Mrs. K.M.M. de Pauw, Environmen-
tal Consultant, for allowing me to use her data shown in Table 4 of this paper. Furthermore I wish to thank Dr. D.M. Bartley and Dr. J. Kapetsky of the FA0 Inland Water Resources and Aquaculture Service, and Dr. K.J. Rana of the FA0 Fishery Statistics Group for their valuable comments and suggestions.
References Agaypi, M.Z. 1995. A preliminary report of fry releasing effect in the
Kalabsha area. Work. Rep. Fish. Manage. Cent. 4:l-23. Cairo University Press, Cairo.
Agaypi, M.Z. 1996. A preliminary report of fry releasing effect in the north part of Lake Nasser. Work. Rep. Fish. Manage. Cent. 51- 10. Cairo University Press, Cairo.
Amarasinghe, U.S. 1998. How effective are the stocking strategies for the management of reservoir fisheries in Sri Lanka? p. 422- 436. In I.G. Cowx (ed.) Stocking and introduction of fish. Blackwell Science, Fishing News Books, Oxford.
Baijot, E., J. Moreau and S. Bouda. 1994. Aspects hydrobiologiques et piscicoles des retenues d'eau en zone soudano-sahelienne: Le cas du Burkina Faso. Centre Technique de Coop6ration Agricole et Rurale, Ede/Bruxelles. 250 p.
Bartley, D.M. 1996. Conservation of biological diversity in hatchery enhancement programmes, p. 424-438. In F. di Castri and T. Younes (eds.) Biodiversity, science and development: towards a new partnership. CAB International, University Press, Cam- bridge.
Carvalho, G.R. and T.F. Cross.1998. Enhancing fish production through introductions and stocking: genetic perspectives, p. 397- 413. In I.G. Cowx (ed.) Stocking and introduction of fish. Blackwell Science, Fishing News Books, Oxford.
Cowx, 1.G. 1994. Stocking strategies. Fish. Manage. Ecol. 1:15-30. Cowx, I.G., Editor. 1998. Stocking and introduction of fish. Blackwell
Science, Fishing News Books, Oxford. 456 p. Davenport, J. and S.U.K. Ekaratne. 1997. Successful enhancement
of a lagoon prawn fishery at Rekawa, Sri Lanka. Aquacult. News (December):24-25.
De Silva, S.S. 1988. Reservoirs of Sri Lanka and their fisheries. FA0 Fish. Tech. Pap. 298, 128 p.
El Shaheed, M.N.A. 1993. Preliminary study of rearing experiment of Barbus bynni in concrete pond. Work. Rep. Fish. Manage. Cent. 3:333-340. Cairo University Press, Cairo
El Shaheed, M.N.A. 1996. An experiment on induced spawning of Labeo species with pituitary gland injection. Work. Rep. Fish. Manage. Cent. 5:115-120. Cairo Univ. Press, Cairo.
FAO. 1996. FA0 technical guidelines for responsible fisheries: pre- cautionary approach to capture fisheries and species introduc- tions. No. 2. FAO, Rome. 53 p.
FAO. 1997a. FA0 technical guidelines for responsible fisheries: in- land fisheries. No. 6. FAO, Rome. 36 p.
FAO. 1997b. Report of the Expert Consultation on Inland Fisheries Enhancements, 7-11 April 1997, Dhaka, Bangladesh. FA0 Fish. Rep. 559, 18 p.
Hoggarth, D. and A. Halls. 1997. Restocking the flood plains from natural sources. Aquacult. News Uune):25-27.
Impacto. 1997. Environmental assessment of fish culture in the Chidenguele lakes, Gaza province, Mozambique. Final Rep. GCP/ 1NT/555/SWE, 68 p. FAO, Rome.
juarez-Palacios, J.R. and M.E. Olmos-Tomassini. 1991. Tilapia in capture and culture-enhanced fisheries in Latin America, p. 244- 273. In: Indo-Pacific Fishery Commission: country reports pre- sented at the Fifth Session of the Indo-Pacifi c Fishery Commission Working Party of Experts on Inland Fisheries, Bogor, Indonesia, 24-29 June 1991, and papers contributed to the Workshop on Tilapia in Capture and Culture-enhanced Fisheries in the Indo- Pacific Fishery Commission Countries, Bogor, Indonesia, 27-29 June 1991. FA0 Fish. Rep. 458, Suppl. FAO, Rome.
Li, S. and S. Wu. 1995. Culture and capture of fish in Chinese reser- voirs. International Development Research Center, Ottawa, Ontario. Canada and Southbound. 128 p.
Lorenzen, K. 1995. Population dynamics and management of cul- ture-based fisheries. Fish. Manage. Ecol. 2:61-73.
Lorenzen, K., G. Xu, F, Cao, J. Ye and T. Hu. 1997. Analysing exten- sive fish culture systems by transparent population modelling: bighead carp culture in a Chinese reservoir. Aquacult. Res. 28867- 880.
Mheen, H.W. van der. 1994. Practical aspects of stocking small water bodies: an example from Zimbabwe. CIFA Tech. Pap. 2, 40 p.
142 Sustainable fish production in Lake Nasser
Mohamed, M.S. 1993. CPUE, catchhoat-month, in each fishing ground of the High Dam Lake 1988 to 1992. Work. Rep. ~ i s h . Manage. Cent. 3:117-135. Cairo University Press, Cairo.
Ogale, S.N. 1994. Endangered Deccan mahseer, Tor kbudree (Sykes): a case study, p. 213-218. In P.V.Dehadrai, P. Das and S.R. Verma (eds.) Threatened fishes of India. Proceedings of the National Seminar on Endangered Fishes of India, National Bureau of Fish Genetic Resources, Allahabad, 25-26 April 1992. Muzaffarnagar India Nature Conservators.
Pawaputanon, 0. 1991. Inland capture fisheries in Thailand, p. 106- 11 1. In Indo-PaciFic Fishery Commission: country reports pre- sented at the Fifth Session of the Indo-Pacific Fishery Commission Working Party of Experts on Inland Fisheries, 24-29 June 1991, Bogor, Indonesia; and papers contributed to the Workshop on Tilapia in Capture and Culture-enhanced Fisheries in the Indo- Pacific Fishery Commission Countries, 27-29 June 1991, Bogor, Indonesia. FA0 Fish. Rep. 458, Suppl.
Petr, T 1998. Review of the administration and of the benefits from fishery enhancements in Australia. In T. Petr (ed.) Inland fish- ery enhancements. Papers presented at the FAO/DFID Expert Consultation on Inland Fishery Enhancements, 7-11 April 1997, Dhaka, Bangladesh. FA0 Fish. Tech. Pap. 374, 463 p.
Quirbs, R1 1998. Reservoir stocking in Latin America, an evaluation, p. 91-117. InT. Petr (ed.) Inland fishery enhancements. Papers presented at the FAO/DFID Expert Consultation on Inland Fish- ery Enhancements, 7-11 April 1997, Dhaka, Bangladesh. FA0 Fish. Tech. Pap. 374, 463 p.
Ryder, R.A. 1965. A method for estimating the potential fish yield of north-temperate lakes. Trans. Am. Fish. Soc. 94:214-218.
Ryder, R.A. and H.F. Henderson. 1975. Estimations of potential fish yield for the Nasser Reservoir, Arab Republic of Egypt. J. Fish. Res. Board Can. 323127-3151
Shenoda, Z.S. and hl. Naguib. 1993. Induced spawning of silver carp by hypophysis injection in 1987. Work. Rep. Fish. Manage. Cent. 3:305-323 Cairo University Press, Cairo.
Sugunan, V.V. 1995. Reservoir fisheries of India. FA0 Fish. Tech. Pap. 345,423 p.
Verapat. C. 1995. Inland capture fisheries in Thailand. Workshop on Fisheries Management in Rural Reservoirs, 20-24 February 1995, Ubolrachathani, Thailand. 25 p.
Welcomme, R.L. 1976. Approaches to resource evaluation and man- agement in tropical inland waters. FAO, IPFC/76/SYM/48: 491- 500.
Welcomme, R.L. and D.M. Bartley. 1998. An evaluation of present techniques for the enhancement of fisheries, p. 1-39. In T. IJetr (ed.) Inland fishery enhancements. Papers presented at the FAO/ DFlD Expert Consultation on Inland Fishery Enhancements. 7-11 April 1997, Dhaka, Bangladesh. FA0 Fish. Tech. Pap. 374. 463 p.
BORNlStock enhancement 143
144 Sustainable fish production in Lake Nasser
Alien Fish 1ntroductions:The African Experience and Its Relevance to Lake Nasser
B.E. Marshall University of Zimbabwe, Harare, Zimbabwe
Marshall, B.E. 2000. Alien fish introductions: the African experience and its relevance to Lake Nasser, p. 145- 153. In J.F. Craig (ed.) Sustainable fish production in Lake Nasser: ecological basis and management policy. ICLARM Conf. Proc. 6 I , 184 p.
ABSTRACT
The introduction of alien fish species is an important tool in fishery management that has increased fish yields in many places.They impose an ecological cost, however, and this paper reviews two successful introductions in Africa with strikingly different ecological consequences.The introduction of lates niloticus caused major changes in Lake Victoria, which included the virtual extinction of most of its endemic cichlid species. In contrast, Limnothrissa miodon had little impact in Lake Kariba apart from changes to the zooplankton commu- nity.These cases emphasize that the riverine fish fauna in human-made lakes is much less vulnerable to change than the lacustrine cichlids of the African Great Lakes.The fish populations in Lake Nasser would noqthere- fore, be adversely affected by the introduction of a planktivorous fish species, since there is clearly a vacant niche for such a species. Some possibilities are discussed, with clupeids being preferred, and it is suggested that they could increase the fish yield of the lake by at least 30 000 t year' at relatively little cost.
Introduction Most human societies rely on alien animal and plant spe-
cies for the bulk of their food supplies. It is difficult for people living in the Old World today to visualize life without maize, potatoes or tomatoes, what the Americas would be like with- out wheat and cattle, or for people in Egypt to imagine a time when there were no date plalms in the country. Humankind has used these alien species to transform the ecology of huge areas, e.g., natural forests have been replaced by plantations, grasslands by monocultures of cereal crops and herds of an- telope by cattle. Given these tendencies, it is surprising that most fisheries differ from terrestrial production systems by still depending on the natural populations of fish that occur in the oceans, lakes and rivers of the world.
This situation may change of course, especially in inland waters where numerous fish introductions have taken place during the last century, involving something like 291 species in 148 countries (Welcomme 1988).
These introductions have been responsible for a number of problems, including predation, competition and hybridiza- tion with native species, the introduction of new parasites or diseases, crowding, stunting and degradation of water quality
(Pitcher 1995). Nevertheless, introduced fish species have been responsible for major increases in productivity in many areas, and there may be compelling reasons for further introduc- tions, especially where there is a pressing need for increasing protein supplies, as there is in many developing countries. Fish introductions are an especially important management tool in large artificial reservoirs that are relatively immature, with rapidly changing systems. Their fish populations consist of riverine species, many of which are unable to adapt to the new ecological niches that become available following the creation of an artificial lake.
A successful fish introduction will, of course, bring about irreversible ecological changes. In some cases, these changes are relatively slight and affect only some components of the ecosystem, but in others they are widespread with major im- pacts on all communities. It is therefore critically important that the probable extent of these changes (the "cost") is un- derstood and balanced against the outcome (the "benefit") before any introduction is considered. What constitutes an acceptable costhenefit ratio will obviously vary according to different viewpoints e.g., something acceptable to national governments as a foreign currency earner may adversely
MARSHALUAlien fish introductions: the African experience.. . 145
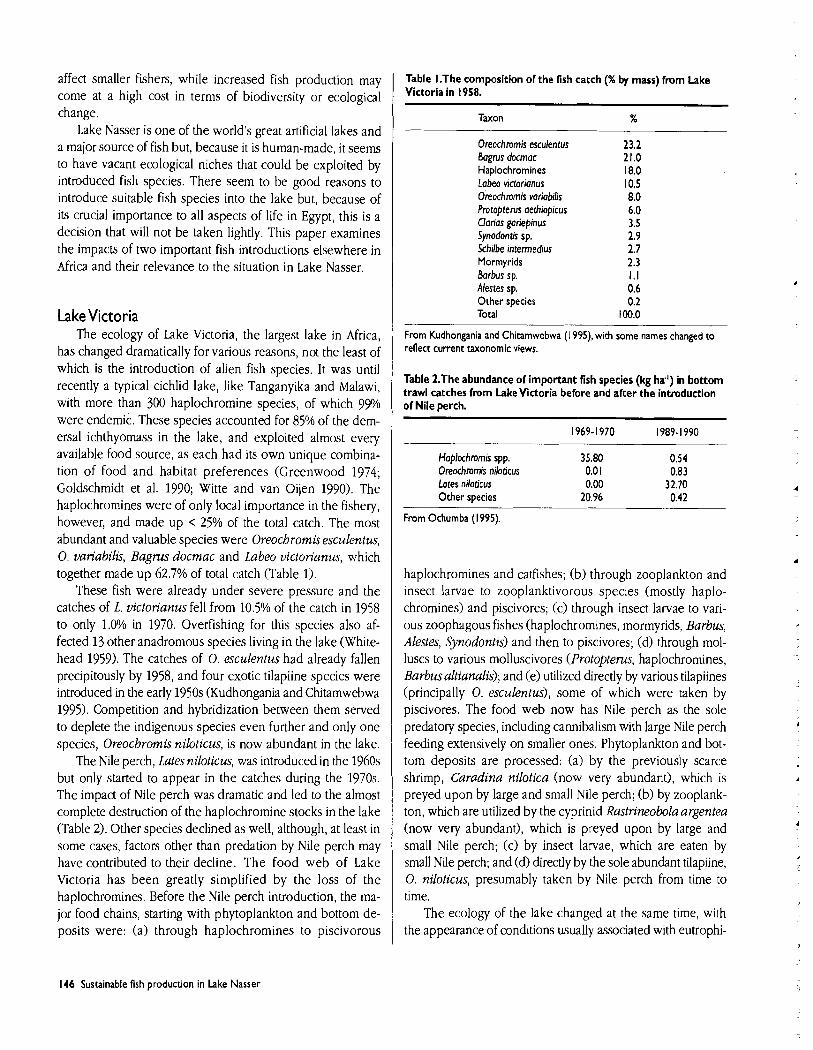
affect smaller fishers, while increased fish production may come at a high cost in terms of biodiversity or ecological change.
Lake Nasser is one of the world's great artificial lakes and a major source of fish but, because it is human-made, it seems to have vacant ecological niches that could be exploited by introduced fish species. There seem to be good reasons to introduce suitable fish species into the lake but, because of its crucial importance to all aspects of life in Egypt, this is a decision that will not be taken lightly. This paper examines the impacts of two important fish introductions elsewhere in Africa and their relevance to the situation in Lake Nasser.
Lake Victoria The ecology of Lake Victoria, the largest lake in Africa,
has changed dramatically for various reasons, not the least of which is the introduction of alien fish species. It was until recently a typical cichlid lake, like Tanganyika and Malawi, with more than 300 haplochromine species, of which 99% were endemic. These species accounted for 85% of the dem- ersal ichthyomass in the lake, and exploited almost every available food source, as each had its own unique combina- tion of food and habitat preferences (Greenwood 1974; Goldschmidt et al. 1990; Witte and van Oijen 1990). The haplochromines were of only local importance in the fishery, however, and made up < 25% of the total catch. The most abundant and valuable species were Oreochromis esculentus, 0. variabilis, Bagrus docmac and Labeo victorianus, which together made up 62.7% of total catch (Table 1).
These fish were already under severe pressure and the catches of L. victorianus fell from 10.5% of the catch in 1958 to only 1.0% in 1970. Overfishing for this species also af- fected 13 other anadromous species living in the lake (White- head 1959). The catches of 0. esculentus had already fallen precipitously by 1958, and four exotic tilapiine species were introduced in the early 1950s (Kudhongania and Chitamwebwa 1995). Competition and hybridization between them served to deplete the indigenous species even further and only one species, Oreochromis niloticus, is now abundant in the lake.
The Nile perch, Lates niloticus, was introduced in the 1960s but only started to appear in the catches during the 1970s. The impact of Nile perch was dramatic and led to the almost complete destruction of the haplochromine stocks in the lake (Table 2). Other species declined as well, although, at least in some cases, factors other than predation by Nile perch may have contributed to their decline. The food web of Lake Victoria has been greatly simplified by the loss of the haplochromines. Before the Nile perch introduction, the ma- jor food chains, starting with phytoplankton and bottom de- posits were: (a) through haplochromines to piscivorous
Table [.The composition of the fish catch (% by mass) from Lake Victoria in 1958.
Oreochrornis esculentus Bagrus docmac Haplochromines Labeo viaorionus Oreochromis variabilis Protopterus aethiopicus Clorias goriepinus Synodontis sp. Schilbe intemedius Mormyrids Barbus sp. Alestes sp. Other species Total
From Kudhongania and Chitamwebwa ( 1 995), with some names changed to reflect current taxonomic views.
Table 2.The abundance of important fish species (kg hd ) in bottom trawl catches fmm LakeVictoria before and after the introduction of Nile perch.
Haplochrornis spp. 35.80 0.54 Oreochromis niloticus 0.0 1 0.83 Lates niloticus 0.00 32.70 Other species 20.96 0.42
From Ochumba (1995).
haplochromines and catfishes; (b) through zooplankton and insect larvae to zooplanktivorous species (mostly haplo- chromines) and piscivores; (c) through insect larvae to vari- ous zoophagous fishes (haplochromines, mormyrids, Barbus, Alestes, Synodontis) and then to piscivores; (d) through mol- luscs to various molluscivores (Protopterus, haplochrornines, Barbus altianalis); and (e) utilized directly by various tilapiines (principally 0 . esculentus), some of which were taken by piscivores. The food web now has Nile perch as the sole predatory species, including cannibalism with large Nile perch feeding extensively on smaller ones. Phytoplankton and bot- tom deposits are processed: (a) by the previously scarce shrimp, Caradina nilotica (now very abundant), which is preyed upon by large and small Nile perch; (b) by zooplank- ton, which are utilized by the cyprinid Rastrineobola argentea (now very abundant), which is preyed upon by large and small Nile perch; (c) by insect larvae, which are eaten by small Nile perch; and (d) directly by the sole abundant tilapiine, 0. niloticus, presumably taken by Nile perch from time to time.
The ecology of the lake changed at the same time, with the appearance of conditions usually associated with eutrophi-
146 Sustainable fish production in Lake Nasser
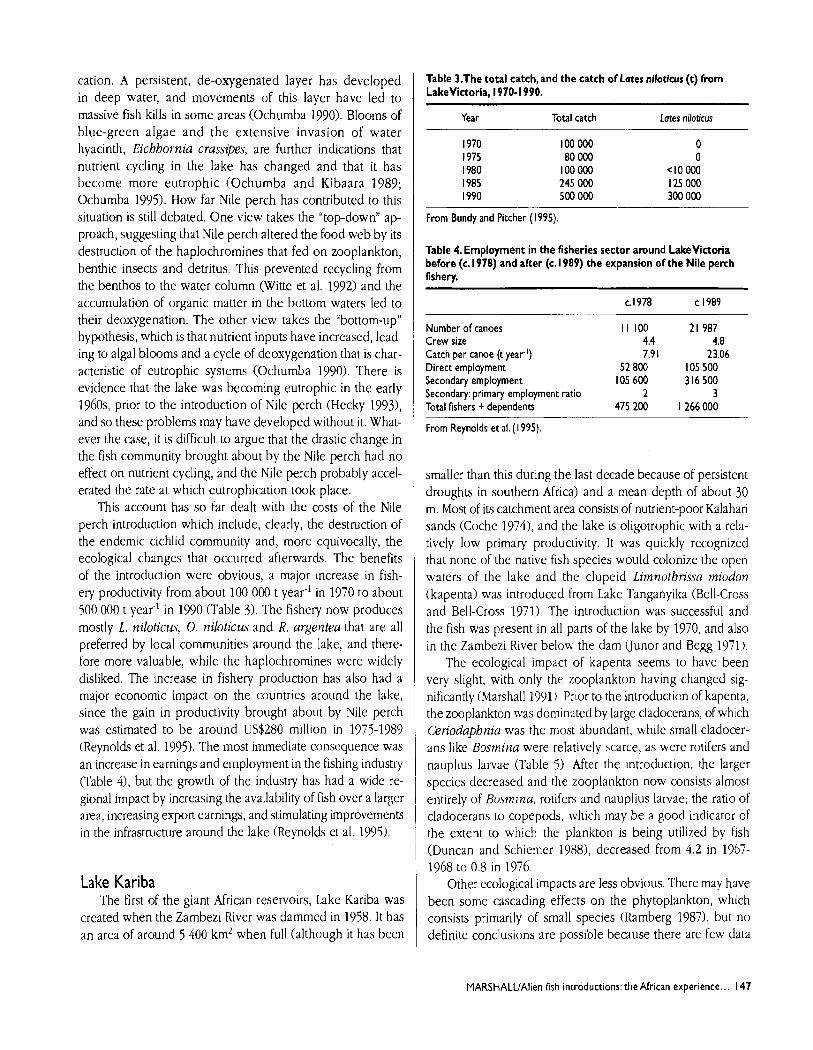
cation. A persistent, de-oxygenated layer has developed in deep water, and movements of this layer have led to massive fish kills in some areas (Ochumba 1990). Blooms of blue-green algae and the extensive invasion of water hyacinth, Eichhornia crassipes, are further indications that nutrient cycling in the lake has changed and that it has become more eutrophic (Ochumba and Kibaara 1989; Ochumba 1995). How far Nile perch has contributed to this situation is still debated. One view takes the "top-down" ap- proach, suggesting that Nile perch altered the food web by its destruction of the haplochromines that fed on zooplankton, benthic insects and detritus. This prevented recycling from the benthos to the water column (Witte et al. 1992) and the accumulation of organic matter in the bottom waters led to their deoxygenation. The other view takes the "bottom-up" hypothesis, which is that nutrient inputs have increased, lead- ing to algal blooms and a cycle of deoxygenation that is char- acteristic of eutrophic systems (Ochumba 1990). There is evidence that the lake was becoming eutrophic in the early 1960s, prior to the introduction of Nile perch (Hecky 1993), and so these problems may have developed without it. What- ever the case, it is difficult to argue that the drastic change in
\ the fish community brought about by the Nile perch had no effect on nutrient cycling, and the Nile perch probably accel- erated the rate at which eutrophication took place.
This account has so far dealt with the costs of the Nile perch introduction which include, clearly, the destruction of the endemic cichlid community and, more equivocally, the ecological changes that occurred afterwards. The benefits of the introduction were obvious, a major increase in fish- ery productivity from about 100 000 t year-' in 1970 to about 500 000 t year-' in 1990 (Table 3). The fishery now produces mostly L. niloticus, 0. niloticus and R, argentea that are all preferred by local communities around the lake, and there- fore more valuable, while the haplochromines were widely disliked. The increase in fishery production has also had a major economic impact on the countries around the lake, since the gain in productivity brought about by Nile perch was estimated to be around US$280 million in 1975-1989 (Reynolds et al. 1995). The most immediate consequence was an increase in earnings and employment in the fishing industry (Table 4), but the growth of the industry has had a wide re- gional impact by increasing the availability of fish over a larger area, increasing export earnings, and stimulating improvements in the infrastructure around the lake (Reynolds et al. 1995).
Lake Kariba The first of the giant African reservoirs, Lake Kariba was
created when the Zambezi River was dammed in 1958. It has an area of around 5 400 km2 when full (although it has been
Table 3.The total catch,and the catch of Lates niloticus (t) from . . LakeVictoria, 1970-1 990.
Year Total catch lates niloticus
From Bundy and Pitcher (1995).
Table 4. Employment in the fisheries sector around LakeVictoria before (c. 1978) and after (c. 1989) the expansion of the Nile perch fishery.
c. 1 978 c. 1 989
Number of canoes l l 100 21 987 Crew size 4.4 4.8 Catch per canoe (t year-') 7.9 1 23.06 Direct employment 52 800 105 500 Secondary employment 105 600 316 500 Secondary: primary employment ratio 2 3 Total fishers + dependents 475 200 1 266 000
From Reynolds et al. (1 995).
smaller than this during the last decade because of persistent droughts in southern Africa) and a mean depth of about 30 m. Most of its catchment area consists of nutrient-poor Kalahari sands (Coche 1974), and the lake is oligotrophic with a rela- tively low primary productivity. It was quickly recognized that none of the native fish species would colonize the open waters of the lake and the clupeid Limnothrissa miodon (kapenta) was introduced from Lake Tanganyika (Bell-Cross and Bell-Cross 1971). The introduction was successful and the fish was present in all parts of the lake by 1970, and also in the Zambezi River below the dam Uunor and Begg 1971).
The ecological impact of kapenta seems to have been very slight, with only the zooplankton having changed sig- nificantly (Marshall 1991 1. Prior to the introduction of kapenta, the zooplankton was dominated by large cladocerans, of which C'eriodaphnia was the most abundant, while small cladocer- ans like Bosmina were relatively scarce, as were rotifers and nauplius larvae (Table 5). After the introduction, the larger species decreased and the zooplankton now consists almost entirely of Bosmina, rotifers and nauplius larvae; the ratio of cladocerans to copepods, which may be a good indicator of the extent to which the plankton is being utilized by fish (Duncan and Schiemer 1988), decreased from 4.2 in 1967- 1968 to 0.8 in 1976.
Other ecological impacts are less obvious. There may have been some cascading effects on the phytoplankton, which consists primarily of small species (Ramberg 1987), but no definite conclusions are possible because there are few data
MARSHALUAlien fish introductions: the African experience ... 147
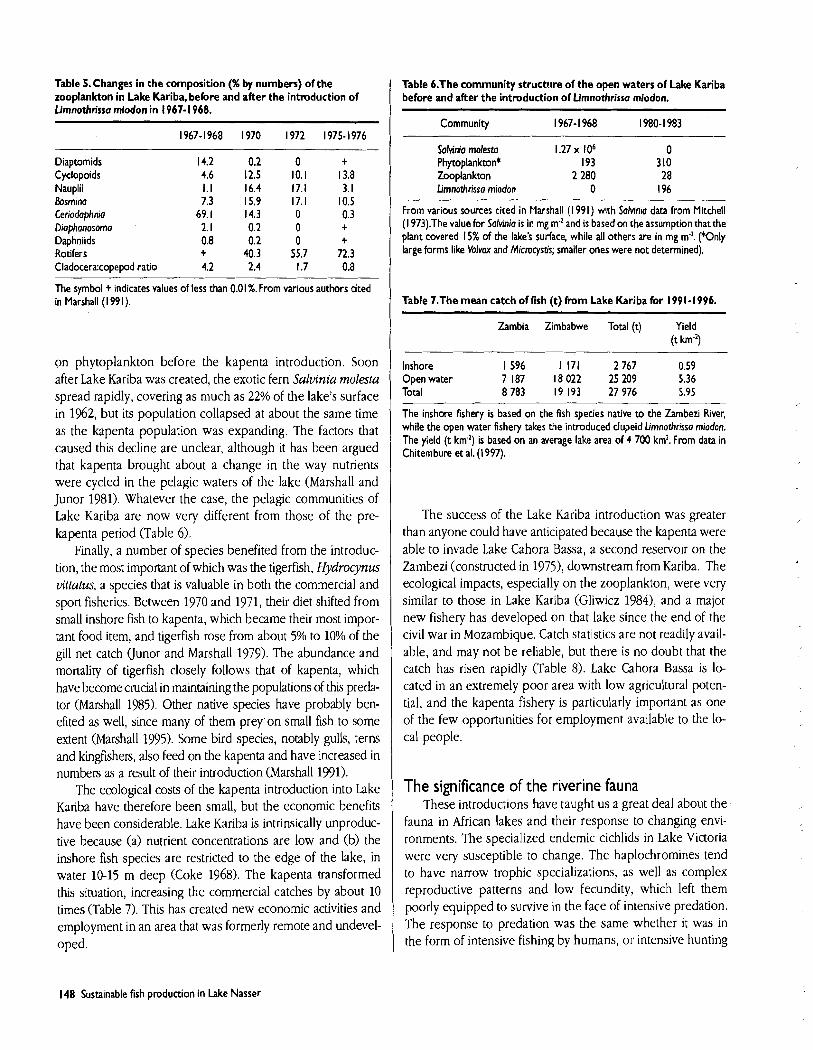
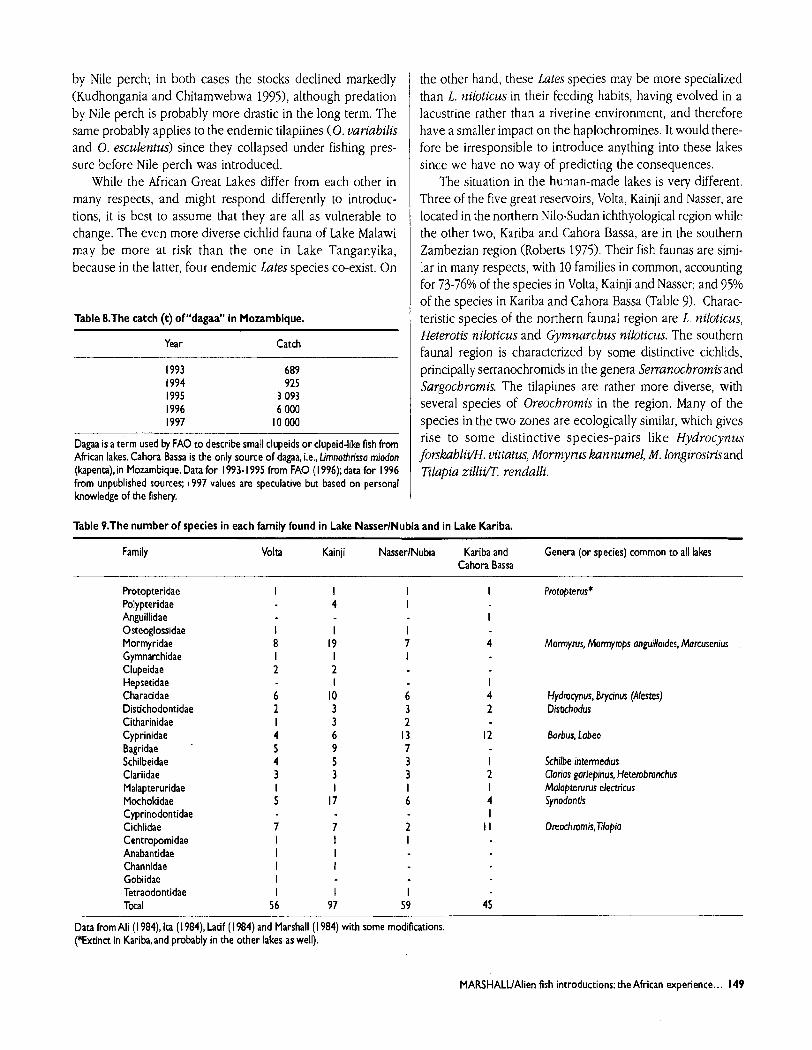
by Nile perch; in both cases the stocks declined markedly (Kudhongania and Chitamwebwa 1995), although predation by Nile perch is probably more drastic in the long term. The same probably applies to the endemic tilapiines (0. variabilis and 0. esculentus) since they collapsed under fishing pres- sure before Nile perch was introduced.
While the African Great Lakes differ from each other in many respects, and might respond differently to introduc- tions, it is best to assume that they are all as vulnerable to change. The even more diverse cichlid fauna of Lake Malawi may be more at risk than the one in Lake Tanganyika, because in the latter, four endemic Lates species co-exist. On
the other hand, these Lates species may be more specialized than L. niloticus in their feeding habits, having evolved in a lacustrine rather than a riverine environment, and therefore have a smaller impact on the haplochromines. It would there- fore be irresponsible to introduce anything into these lakes since we have no way of predicting the consequences.
The situation in the human-made lakes is very different. Three of the five great reservoirs, Volta, Kainji and Nasser, are located in the northern Nilo-Sudan ichthyological region while the other two, Kariba and Cahora Bassa, are in the southern Zambezian region (Roberts 1975). Their fish faunas are simi- lar in many respects, with 10 families in common, accounting for 73-76% of the species in Volta, Kainji and Nasser; and 95% of the species in Kariba and Cahora Bassa (Table 9). Charac- teristic species of the northern faunal region are L niloticus, Heterotis niloticus and Gymnarchus niloticus. The southern faunal region is characterized by some distinctive cichlids, principally serranochromids in the genera Serranochromis and Sargochromis. The tilapiines are rather more diverse, with several species of Oreochromis in the region. Many of the species in the two zones are ecologically similar, which gives rise to some distinctive species-pairs like Hydrocynus fonkahlifl. uittatus, Mormyrus kunnumel, M. longzrostris and Tilapiu zillifl. rendalli.
Table &The catch (t) ofUdagaa" in Mozambique.
Year Catch
Dagaa is a term used by FA0 to describe small clupeids or clupeid-like fish from African lakes. Cahora Bassa is the only source of dagaa, i.e., Lirnnothrisso rniodon (kapenta), in Mozambique. Data for 1993- 1995 from FA0 (1 996); data for 1 996 from unpublished sources; 1997 values are speculative but based on personal knowledge of the fishery.
Table 9.The number of species in each family found in Lake NasserlNubia and in Lake Kariba.
Family Volta Kainji NasserlNubia Kariba and Genera (or species) common to all lakes Cahora Bassa
Protopteridae Polypteridae Anguillidae Osteoglossidae Mormyridae Gymnarchidae Clupeidae Hepsetidae Characidae Distichodontidae Citharinidae Cyprinidae Bagridae . Schilbeidae Clariidae Malapteruridae Mochokidae Cyprinodontidae Cichlidae Centropomidae Anabantidae Channidae Gobiidae Tetraodontidae Total
Protopterus*
Morrnyrus Mormyrops onguilloides, Marcusenius
Hydmcynus, Brycinus (Alestes) Distichodus
Borbus, Labeo
Schilbe intermedius Clorios gariepinus, Heterobronchus Mohpterurus electricus Synodontis
Data from Ali (1 984), lta (1984), Latif ( I 984) and Marshall ( I 984) with some modifications. (*Extinct in Kariba, and probably in the other lakes as well).
MARSHALUAlien fish introductions: the African experience.. . 149
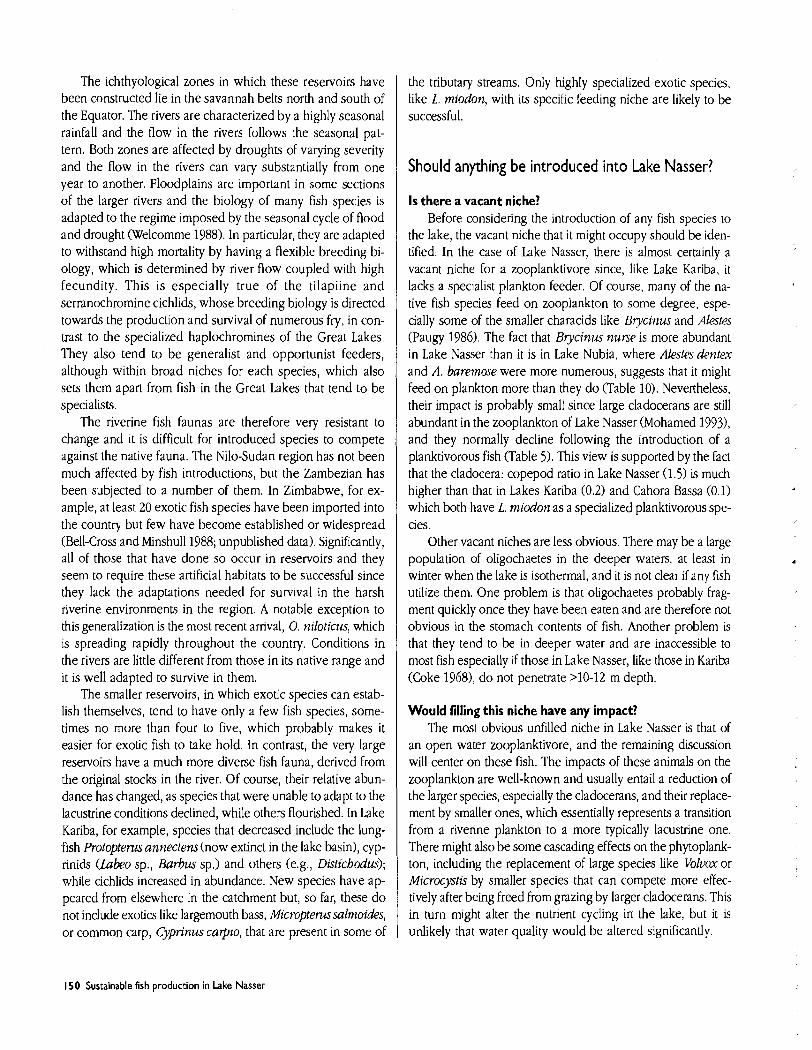
The ichthyological zones in which these reservoirs have been constructed lie in the savannah belts north and south of the Equator. The rivers are characterized by a highly seasonal rainfall and the flow in the rivers follows the seasonal pat- tern. Both zones are affected by droughts of varying severity and the flow in the rivers can vary substantially from one year to another. Floodplains are important in some sections of the larger rivers and the biology of many fish species is adapted to the regime imposed by the seasonal cycle of flood and drought (Welcomme 1988). In particular, they are adapted to withstand high mortality by having a flexible breeding bi- ology, which is determined by river flow coupled with high fecundity. This is especially true of the tilapiine and serranochromine cichlids, whose breeding biology is directed towards the production and survival of numerous fry, in con- trast to the specialized haplochromines of the Great Lakes They also tend to be generalist and opportunist feeders, although within broad niches for each species, which also sets them apart from fish in the Great Lakes that tend to be specialists.
The riverine fish faunas are therefore very resistant to change and it is difficult for introduced species to compete against the native fauna. The Nilo-Sudan region has not been much affected by fish introductions, but the Zambezian has been subjected to a number of them. In Zimbabwe, for ex- ample, at least 20 exotic fish species have been imported into the country but few have become established or widespread (Bell-Cross and Minshull1988; unpublished data). Significantly, all of those that have done so occur in reservoirs and they seem to require these artificial habitats to be successful since they lack the adaptations needed for survival in the harsh riverine environments in the region. A notable exception to this generalization is the most recent arrival, 0 niloticus, which is spreading rapidly throughout the country. Conditions in the rivers are little different from those in its native range and it is well adapted to survive in them.
The smaller reservoirs, in which exotic species can estab- lish themselves, tend to have only a few fish species, some- times no more than four to five, which probably makes it easier for exotic fish to take hold. In contrast, the very large reservoirs have a much more diverse fish fauna, derived from the original stocks in the river. Of course, their relative abun- dance has changed, as species that were unable to adapt to the lacustrine conditions declined, while others flourished. In Lake Kariba, for example, species that decreased include the lung- fish Protopterus annectens (now extinct in the lake basin), cyp- rinids (Labeo sp., Barbus sp.) and others (e.g., Distichodus); while cichlids increased in abundance. New species have ap- peared from elsewhere In the catchment but, so far, these do not include exotics like largemouth bass, Microptemwsalmoides, or common carp, Cyprinus calpio, that are present in some of
the tributary streams. Only highly specialized exotic species, like L, miodon, with its specific feeding niche are likely to be successful.
Should anything be introduced into Lake Nasser!
I s there a vacant niche? Before considering the introduction of any fish specles to
the lake, the vacant niche that it might occupy should be iden- tified. In the case of Lake Nasser, there is almost certainly a vacant niche for a zooplanktivore since, like Lake Kariba, it lacks a specialist plankton feeder. Of course, many of the na- tive fish species feed on zooplankton to some degree, espe- cially some of the smaller characids like Bycinus and Alestes (Paugy 1986). The fact that Brycinus nurse is more abundant in Lake Nasser than it is in Lake Nubia, where Alestes dentex and A. baremose were more numerous, suggests that it might feed on plankton more than they do (Table 10). Nevertheless, their impact is probably small since large cladocerans are still abundant in the zooplankton of Lake Nasser (Mohamed 1973, and they normally decline following the introduct~on of a planktivorous fish (Table 5). This view is supported by the fact that the cladocera: copepod ratio in Lake Nasser (1.5) is much higher than that in Lakes Kariba (0.2) and Cahora Bassa (0.1) which both have L. miodon as a specialized planktivorous spe- cies.
Other vacant niches are less obvious. There may be a large population of oligochaetes in the deeper waters, at least in winter when the lake is isothermal, and it is not clear if any fish utilize them. One problem is that oligochaetes probably frag- ment quickly once they have been eaten and are therefore not obvious in the stomach contents of fish. Another problem is that they tend to be in deeper water and are inaccessible to most fish especially if those in Lake Nasser, like those in Kariba (Coke 1968), do not penetrate >lo-12 m depth.
Would filling this niche have any impact? The most obvious unfilled niche in Lake Nasser is that of
an open water zooplanktivore, and the remaining discussion will center on these fish. The impacts of these animals on the zooplankton are well-known and usually entail a reduction of the larger species, especially the cladocerans, and their replace- ment by smaller ones, which essentially represents a transition from a riverine plankton to a more typically lacustrine one. There might also be some cascading effects on the phytoplank- ton, including the replacement of large species like Volvox or Microcystis by smaller species that can compete more effec- tively after being freed from grazing by larger cladocerans. This in turn might alter the nutrient cycling in the lake, but it is unlikely that water quality would be altered significantly.
I SO Sustainable fish production in Lake Nasser
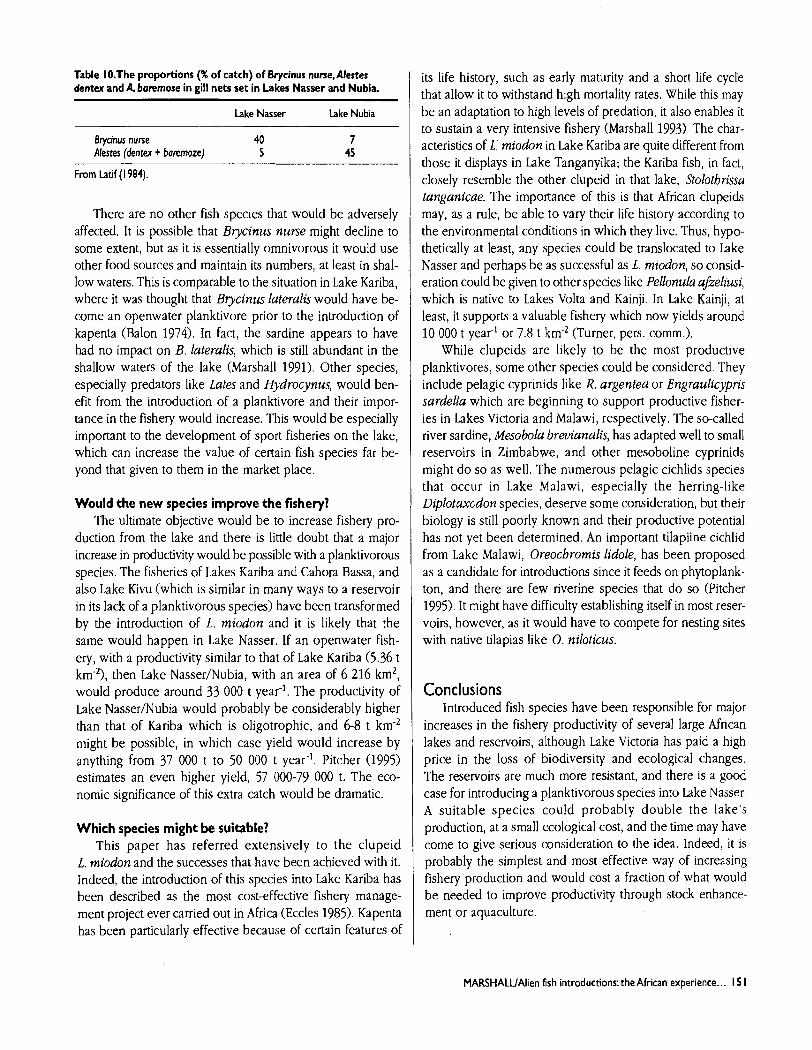
Table I O.The proportions (% of catch) of Brycinus nurse, Alestes dentex and A. baremore in gill nets set in Lakes Nasser and Nubia.
Lake Nasser Lake Nubia
Brycinus nurse 40 7 Alestes (dentex + boremoze) 5 45
From Latif (1 984).
There are no other fish species that would be adversely affected. It is possible that Brycinus nurse might decline to some extent, but as it is essentially omnivorous it would use other food sources and maintain its numbers, at least in shal- low waters. This is comparable to the situation in Lake Kariba, where it was thought that Brycinus lateralis would have be- come an openwater planktivore prior to the introduction of kapenta (Balon 1974). In fact, the sardine appears to have had no impact on B, lateralis, which is still abundant in the shallow waters of the lake (Marshall 1991). Other species, especially predators like Lates and Hydrocynus, would ben- efit from the introduction of a planktivore and their impor- tance in the fishery would increase. This would be especially important to the development of sport fisheries on the lake, which can increase the value of certain fish species far be- yond that given to them in the market place.
L
Would the new species improve the fishery? The ultimate objective would be to increase fishery pro-
duction from the lake and there is little doubt that a major increase in productivity would be possible with a planktivorous species. The fisheries of Lakes Kariba and Cahora Bassa, and also Lake Kivu (which is similar in many ways to a reservoir in its lack of a planktivorous species) have been transformed by the introduction of L. miodon and it is likely that the same would happen in Lake Nasser. If an openwater fish- ery, with a productivity similar to that of Lake Kariba (5.36 t km-2), then Lake Nasser/Nubia, with an area of 6 216 km2, would produce around 33 000 t year-'. The productivity of Lake Nasser/Nubia would probably be considerably higher than that of Kariba which is oligotrophic, and 6-8 t km-2 might be possible, in which case yield would increase by anything from 37 000 t to 50 000 t year-'. Pitcher (1995) estimates an even higher yield, 57 000-79 000 t. The eco- nomic significance of this extra catch would be dramatic.
Which species might be suitable? This paper has referred extensively to the clupeid
L. miodon and the successes that have been achieved with it. Indeed, the introduction of this species into Lake Kariba has been described as the most cost-effective fishery manage- ment project ever carried out in Africa (Eccles 1985). Kapenta has been particularly effective because of certain features of
its life history, such as early maturity and a short life cycle that allow it to withstand high mortality rates. While this may be an adaptation to high levels of predation, it also enables it to sustain a very intensive fishery (Marshall 1993). The char- acteristics of L: miodon in Lake Kariba are quite different from those it displays in Lake Tanganyika; the Kariba fish, in fact, closely resemble the other clupeid in that lake, Stolothrissa tanganicae. The importance of this is that African clupeids may, as a rule, be able to vary their life history according to the environmental conditions in which they live. Thus, hypo- thetically at least, any species could be translocated to Lake Nasser and perhaps be as successful as L. miodon, so consid- eration could be given to other species like Pellonula afzeliusi, which is native to Lakes Volta and Kainji. In Lake Kainji, at least, it supports a valuable fishery which now yields around 10 000 t year-' or 7.8 t km-2 (Turner, pers. comm.).
While clupeids are likely to be the most productive planktivores, some other species could be considered. They include pelagic cyprinids like R. argentea or Engraulicypris sardella which are beginning to support productive fisher- ies in Lakes Victoria and Malawi, respectively. The so-called river sardine, Mesobola brevianalis, has adapted well to small reservoirs in Zimbabwe, and other mesoboline cyprinids might do so as well. The numerous pelagic cichlids species that occur in Lake Malawi, especially the herring-like Diplotaxodon species, deserve some consideration, but their biology is still poorly known and their productive potential has not yet been determined. An important tilapiine cichlid from Lake Malawi, Oreochromis lidole, has been proposed as a candidate for introductions since it feeds on phytoplank- ton, and there are few riverine species that do so (Pitcher 1995). It might have difficulty establishing itself in most reser- voirs, however, as it would have to compete for nesting sites with native tilapias like 0. niloticus.
Conclusions Introduced fish species have been responsible for major
increases in the fishery productivity of several large African lakes and reservoirs, although Lake Victoria has paid a h~gh price in the loss of biodiversity and ecological changes. The reservoirs are much more resistant, and there is a good case for introducing a planktivorous species into Lake Nasser. A suitable species could probably double the lake's production, at a small ecological cost, and the time may have come to give serious consideration to the idea. Indeed, it is probably the simplest and most effective way of increasing fishery production and would cost a fraction of what would be needed to improve productivity through stock enhance- ment or aquaculture.
MARSHALUAlien fish introductions: the African experience. .. I 5 I
References Ali, M.T. 1984. Lake Nubia (Sudan), p. 247-259. In J.M. Kapetsky
and T. Petr (eds.) Status of African reservoir fisheries. CIFA Tech. Pap. 10. FAO, Rome.
Balon, E.K. 1974. Fish production of a tropical ecosystem, p. 249- 573. In E.K. Balon and A.G. Coche (eds.) Lake Kariba: a man- made tropical ecosystem in central Africa. Junk, The Hague.
Bell-Cross, G. and B. Bell-Cross. 1971. Introduction of Limnotbrissa miodon and Limnocaradina tanganicaefrom Lake Tanganyika into Lake Kariba. Fish. Res. Bull. Zambia 5:207-214.
Bell-Cross, G. and J.L. Minshull. 1988. The fishes of Zimbabwe. Na- tional Museums and Monuments of Zimbabwe, Harare. 294 p.
Bundy, A. and T.J. Pitcher. 1995. An analysis of species changes in Lake Victoria: did the Nile perch act alone? p. 110-135. In T.J. Pitcher and P.J.B. Hart (eds.) The impact of species changes in African lakes. Chapman and Hall, London.
Chitembure, R.M., L. Karenge and M. Mugwagwa. 1997. 1996 Joint fisheries statistical report, Lake Kariba. SADC Fish. Proj. Rep. 51, 31 p. Zambia/Zimbabwe.
Coche, A.G. 1974. Limnological study of a tropical reservoir, p. 1-247. In E.K. Balon and A.G. Coche (eds.) Lake Kariba: a man-made tropical ecosystem in central Africa. Junk, The Hague.
Coke, M. 1968. Depth distribution of fish on a bush-cleared area of Lake Kariba, central Africa. Trans. Am. Fish. Soc. 97:460-465.
Duncan, A. and F. Schiemer. 1988. Fish pressures on ecosystems: dynamic, holistic indices, p. 176-182. In S.S. De Silva (ed.) Pro- ceedings of Symposium on Reservoir Fishery Management and Development in Asia. International Development and Research Council, Ottawa.
Eccles, D.H. 1985. Lake flies and sardines-a cautionary note. Biol. Conserv. 33:309-333.
FAO. 1996. Yearbook of fishery statistics. Vol. 80. Catches and land- ings, 1995. FAO, Rome.
Gliwicz, Z.M. 1984. Limnological study of Cahora Bassa reservoir with special regard to sardine fishery expansion. FAO/GCP/MOZ/ 006/SWE Field Doc. 8, 71 p.
Goldschmidt, T., F. Witte and J. Visser. 1990. Ecological segregation in zooplanktivorous haplochromine species (Pisces, Cichlidae) from Lake Victoria. Oikos 58:356-368.
Greenwood, P.H. 1974. The cichlid fishes of Lake Victoria, east Af- rica: the biology and evolution of a species flock. Bull. Br. Mus. (Nat. Hist.) (Zool.) Suppl. 6. 134 p.
Hecky, R.E. 193. The eutrophication of Lake Victoria. Verh. Int. Ver. Theor. Angew. Limnol. 25:3948.
Ita, E.O. 1984. Lake Kainji (Nigeria), p. 43-103. In: J.M. Kapetsky and T. Petr (eds.) Status of African reservoir fisheries. CIFA Tech. Pap. 10. FAO, Rome.
Junor, F.J.R. and B.E. Marshall. 1979. The relationship between tigerfish and the Tanganyika sardine in Lake Kariba. Rhodesia Sci. News 13:lll-113.
Junor, F.J.R. and G.W. Begg. 1971. A note on the successful introduc- tion of Limnotbrissa miodon (Boulenger) "The Lake Tanganyika sardine" to Lake Kariba. Newsl. Limnol. Soc. S. Afr. 16:8-14.
Kudhongania, A.W. and D.B.R. Chitamwebwa. 1995. Impact of envi- ronmental change, species introductions and ecological interac- tions on the fish stocks of Lake Victoria, p. 19-32. In T.J. Pitcher and P.J.B. Hart (eds.) The impact of species changes in African lakes. Chapman and Hall, London.
Latif, A.F.A. 1984. Lake Nasser (Egypt), p. 93-246. In J.M. Kapetsky and T. Petr (eds.) Status of African reservoir fisheries. CIFA Tech. Pap. 10. FAO, Rome.
Marshall, B.E. 1984. Lake Kariba (Zimbabwe/Zambia), p. 105-1 53. In J.M. Kapetsky and T. Petr (eds.) Status of African reservoir fisher- ies. CIFA Tech. Pap. 10. FAO, Rome.
Marshall, B.E. 1985. Changes in the abundance and mortality rate of tigerfish in the eastern basin of Lake Kariba. J. Limnol. Soc. S. Afr. 11:46-50.
Marshall, B.E. 1991. The impact of the introduced sardine Limnotblisra miodon on the ecology of Lake Kariba. Biol. Conserv. 55:151- 165.
Marshall, B.E. 1993. The biology of the African clupeid Limnotbrissa miodon, with special reference to its small size in artificial lakes. Rev. Fish Biol. Fish. 3:17-38.
Marshall, B.E. 1995. Why is Limnotbrissa miodon such a successful species and is there anywhere else we should put it?, p. 527-545. 1nT.J. Pitcher and P.J.B. Hart (eds.) The impact of species changes in African lakes. Chapman and Hall, London.
Marshall, B.E. and F.J.R. Junor. 1981. The decline of Salvinia molesta on Lake Kariba. Hydrobiologia 83:477-484.
Mitchell, D.S. 1973. Supply of plant nutrient chemicals in Lake Kariba, p. 165-169. In W.C. Ackermann, G.F. White and E.B. Worthington (eds.) Man-made lakes: their problems and environmental ef- fects. Geophys. Monogr. Ser. 17. American Geophysical Union, Washington, DC.
Mohamed, M.S. 1993. Changes in the distribution of zooplankton at six stations along the main channel of the High Dam Lake, April 1986. Work. Rep. Fish. Manage. Cent. Aswan 2:209-223.
Ochumba, P.B.O. 1990. Massive fish kills within the Nyanza Gulf of Lake Victoria. Hydrobiologia 208:93-99.
Ochumba, P.B.O. 1995. Lirnnological changes in Lake Victoria since the Nile perch introduction, p. 33-43. In T.J. Pitcher and P.J.B. Hart (eds.) The impact of species changes in African lakes. Chapman and Hall, London.
Ochumba, P.B.O. and D. Kibaara. 1989. Observation on blue-green algal blooms in the open waters of Lake Victoria, Kenya. Afr. J. Ecol. 27:23-34.
Paugy, D. 1986. Revision systhatique des Alesteset Brycinus africains (Pisces, Characidae). Editions de I'ORSTOM, Paris. 295 p.
Pitcher, T.J. 1995. Thinking the unthinkable: a candidate model for predicting sustainable yields of fish species in African lakes, p. 494-525. 1nT.J. Pitcher and PJ.B. Hart (eds.) The impact of spe- cies changes in African lakes. Chapman and Hall, London.
Ramberg, L. 1987. Phytoplankton succession in the Sanyati Basin, Lake Kariba. Hydrobiologia 153:193-202.
Reynolds, J.E., D.F. Greboval and P. Mannini. 1935. Thirty years on: the development of the Nile perch fishery in Lake Victoria, p. 180-214. In TJ. Pitcher and P.J.B. Hart (eds.) The impact of spe- cies changes in African lakes. Chapman and Hall, London.
Roberts, T.R. 1975. Geographical dstribution of African freshwater fishes. Zool. J. Linn. Soc. 57:249-319.
Welcomme, R.L. 1985. River fisheries. FA0 Fish. Tech. Pap. 262, 330 p. Welcomme, R.L. 1988. International introductions of inland aquatic
species. FA0 Fish. Tech. Pap. 294, 318 p. Whitehead, P.J,P. 1959. The anadromous fishes of Lake Victoria. Rev.
Zool. Bot. Afr. 76:329-363. Witte, F. and M.J.P. van Oijen. 1990. Taxonomy, ecology and fishery
of haplochromine trophic groups. Zool. Verh. (Leiden) 262:l- 47.
Witte, F., T. Goldschmidt, P.C. Goudswaard, W. Ligtvoet, M.J.P. van Oijen and J.H. Wanink. 1992. Species extinction and concomi- tant ecological changes in Lake Victoria. Neth. J. Zool. 42:214- 232.
152 Sustainable fish production in Lake Nasser
MARSHALUAlien fish introductions: the African experience.. . 153
Socioeconomic Policy Issues in the Management of the Fishery
M, Ahmed International Center for Living Aquatic Resources Management, Penang, Malaysia
Ahrned,M.2000.Socioeconomic policy issues in the management of the fishery,~. 155- 159.InJ.F.Craig (ed.) Sustainable fish production in Lake Nasser: ecological basis and management policy. ICLARM Conf. Proc. 6 1, 184 p.
ABSTRACT
Despite being less important in Egypt's overall economy, the fishery in Lake Nasser has expanded to a re- markable extent over the years.Two aspects of fisheries management in the lake, namely fishing rights alloca- tion and fish marketing, have been analyzed in this paper. Both of these have strong implications for optimal fishery production and sustainable management of the lake fishery. Major issues such as governance and participation,economic and social welfare of labor fishers,settlement and population growth around the lake, and factor share and resource rents are discussed in the context of a management policy for sustainable fish production. Based on a review of the experiences from some other lakes in and outside of the region, this paper concludes that a competitive and more realistic price and marketing structure is needed to replace current marketing and price control. Similarly, government-sponsored programs, such as cage culture, re- stocking, recreational fisheries and tourism, to improve income as well as t o attract new investment in the industry, will require participation by a wider group, not just boat owners.
Introduction Fisheries are an important component of all African lakes,
whether human-made or natural. They provide an important source of high-quality animal protein and make significant contributions to the local and national economy in terms of income, employment and food supply.
Unlike natural lakes, the significance of fisheries in hu- man-made lakes has nearly always had secondary significance, often a potential to be exploited in the future. The propo- nents of Lake Nasser did not have fisheries in mind as an option for development when it was first created. The main objective of its creation was water supply security for all of Egypt. Barrania and Saad (this vol.) emphasized that the di- rect use of water for agricultural, household, industrial and other commercial purposes is the principal priority of the Egyptian Government in the use of Lake Nasser. Hence, un- like some of the major human-made lakes where generation of hydro-electricity was the main objective of construction, electricity production was considered to be of secondary importance in Lake Nasser, as was fish propagation and fish- ery development.
Nevertheless, the lake has become an important source of fish protein for Egyptians. The fishing industry in the lake has expanded significantly. Manshard (1975) observed that within four years (1965-1969), the number of fishers in the lake increased from 200 to 3 200. By official accounts, about 4 000 fishers are currently engaged in fishing, and they catch about 22 000 t. An unofficial estimate puts the potential yield from the lake as >50 000 t. The total inland fishery production in Egypt is currently about 220 000 t. The annual domestic consumption of fish in Egypt is quite substantial, 7.2 kg per person (FA0 1997) which is quite high by African standards.
Socioeconomic characteristics of the Lake Nasser fishery
Fishing operations take place from as many as 500 fishing camps located along the shores or on small islands in the lake. A more detailed description of the fishing operation can be found in Barrania (this vol.). However, in the context of development and sustainable management of the fisheries, two aspects of fisheries management of the lake have strong socioeconomic and policy significance that need some
AHMED/Socioeconomic policy issues.. . 155
analysis. These are (a) fishing rights allocation and fishing labor, and (b) marketing management.
Fishing rights allocation and fishing labor Unlike other African lakes (such as Lakes Volta and Kariba)
where fishing villages sprang up spontaneously, Lake Nasser did not attract any permanent settlement. Instead, the fishing industry was developed along commercial lines, utilizing the surplus labor force from other parts of Egypt. Fishing rights were allocated to owners of boats and gear through licences issued by the lake authority. The boat and gear owners, who are usually wealthy and powerful people, recruit fishers from various parts of the country to work as fishing laborers.
The labor force comes from as far as 300 km from the lakeshore. Usually, the boat owners employ this migrant la- bor on a periodic basis. Fishers stay in the fishing camps for a certain period of time as contractual employees of the boat and gear owners. The boat owner supplies food and other essential items required during fishing. At the end of the con- tract period, fishers are paid and go home. Hence, the com- mon fishers have no ownership over their catch. The entire revenue from fish sales belongs to the owner. The net amount after payment of labor, fishing inputs and other related ex- penses is profit. According to Barrania (this vol.) these ("semi- feudalisticn) boat owners control most fishing areas in the lake.
There is, however, little information on the structure and conduct of the labor market, and on the socioeconomic back- ground of the fishing labor force. It is suggested that boat owners dictate employment conditions, and laborers get an inequitable share of the total fishing income.
Marketing management Government-owned agencies control fish marketing in
Lake Nasser. According to Barrania (this vol.), two state-owned companies collect the catch of fresh fish from individual fish- ing units and process them into frozen fish fillets before sell- ing to national and international markets. Fishers are offered a fixed price for their catch, which is currently 2.2 Egyptian pounds per kg. It is alleged that the price for this type of fish in the open market could be three to four times higher. This has resulted in illegal sales to private buyers and under-re- porting of the fish catch by licensed fishers.
State control of fish marketing from human-made lakes is not uncommon. Fishers in many such lakes are required to land their catch at designated landing centers managed by government agencies. There are instances where a portion of the catch is taken by the management authority as rent once the boat brings the catch to the landing site, for example in Kaptai Lake in Bangladesh (Khan 1998). Authorities may pay a fixed price for the catch and include some charges as user
fees, for example in Nam Ngun Reservoir in the Lao People's Democratic Republic (Burapha Development Consultants 1992). However, such practices by government authorities have led to serious conflicts with respect to management of the stock and recording of catch. Fishers often resort to sale through illegal channels to avoid paying taxes or selling at a lower price. In Kaptai Lake, it was observed that high-value species were under-reported in the catch composition in offi- cial records.
The fishery of Lake Cahora Bassa in Mozambique is an- other example of monopolistic control on fish marketing by government agencies. The government fisheries agency (PESCOM) operates a contracting system that provides the fishers with gill nets in exchange for exclusive rights to pur- chase the catch at fixed prices. The fishers' negotiating power for a better price was confiscated by this arrangement. This caused severe conflicts between PESCOM and private pur- chasers, as well as between PESCOM and fishers in the early 1980s (Bernaesek and Lopes 1983).
As for Lake Nasser, it has been observed that fishers re- sort to selling fish outside the official channel in order to get a higher price for their catch. As a consequence, the use of data on landings as the basis of catch statistics became more and more unreliable. In recent times, the system of state con- trol in marketing has been abandoned by most governments around the world in line with their policies for reducing inef- ficiency and waste in public resources management.
Major issues for an efficient and equitable management of the fisheries in the lake
Governance and participation Experiences throughout the world have shown that regu-
latory management by state authorities has not only failed, it has also become more and more counterproductive. I t has failed to enforce the rules and save the resources from over- exploitation. It has not ensured an equitable and just distribu- tion of benefits to those who provide their labor and who are engaged in the actual harvesting of the fish. Lake Nasser is not any different in these respects. For instance, monitoring and surveillance of fishing activities along the several thou- sand kilometers of shore of the lake is an impossible under- taking on the part of the lake authority. At the same time, given the existing control of the government over the landing and marketing of the catch, estimation of total catch is virtu- ally impossible.
To optimize the fish harvest on a sustainable basis, it is important to achieve a higher degree of compliance of fish- ing regulations, as well as to collect a reliable estimate of the catch. Management options, such as a property rights system,
156 Sustainable fish production in Lake Nasser
common property management, and decentralization and power sharing between government and resource users, have become popular in recent years in small-scale fisheries in developing countries (Pinkerton 1989; Ahmed et al. 1996). However, experiences suggest that a clearly defined and ho- mogeneous stakeholder group and strong motivation to par- ticipate in the management of resources, linked with other rural sectors, largely determine the success of decentralized and local level management efforts (often known as partici- patory management).
The strength of both civil society and government also play a crucial role in the success of decentralized manage- ment, such as co-management and community-based man- agement. Many people argue that the existence of a strong civil society is a pre-condition for success of the above. Un- fortunately, in many developing countries, especially those in the African continent including Egypt, the strength of the civil society is gradually eroding. In many cases the govern- ments are equally weak, although Egypt has a relatively stron- ger government compared to many African neighbors. However, attempts are being made in some countries, par- ticularly in Asia, to improve the strength of civil society through capacity building and empowerment strategies by national and international NGOs.
Other pre-conditions for a higher success of participatory management include the existence of scope for horizontal integration with other sectors such as agriculture and tour- ism, and the ability to produce a higher benefit from such integration.
Price and marketing Throughout the world, state intervention in fish market-
ing has contributed little to rational management and maxi- mization of the benefits from the fishery. Perhaps, at the beginning of the development of a fishery when a well- organized marketing system was yet to be established, gov- ernment-owned agencies provided a form of economic secu- rity such as a guaranteed price for the catch. But as the industry matured and private sector marketing and infrastructure (e.g., roads and preservation or processing establishments) devel- oped, the role of most government marketing agencies diminished. The Egyptian Government should review its cur- rent regulation on fish marketing, including the price-fixing in the Lake Nasser fisheries. Price-fixing as practiced in Lake Nasser forms a negative economic incentive. The impact of such a negative incentive on the fishing effort, and conse- quently on the state of fish stocks should also be investi- gated.
Economic and social welfare of the labor fishers Fishing in most African lakes began with the spontaneous
establishment of fishing villages within a short period after the creation of the lakes. Initially, when dams were built, people moved out. As the fishery developed, people moved back. Soon with the introduction of species, restocking, aqua- culture and vertical economic activities, and the development of roads, infrastructure and markets, the fisheries produced a significant source of food and income. For instance, in Lake Volta, numerous fishery development programs were initi- ated by the government over the years, including vertically integrated activities such as landing centers, input supplies and postharvest activities in order to maximize fishery ben- efits and improve the welfare of the fishers (Kapetsky and Petr 1984). These certainly attracted more people, often dif- ferent from those displaced. It also led to uneven competi- tion and conflicts over access to lake resources. In Lake Nasser, the situation was different. Although fishing started to de- velop within a few years of the lake formation, no attempt was made to establish permanent settlements or any form of welfare program for the fishers. The welfare of the fishing labor force and its role in management of the lake is an im- portant issue. There is at present very little information avail- able on the condition of the fishers. Analysis of the labor market and productivity, together with the socioeconomic con- ditions of the labor fishers and their families, should be an important research focus in this regard.
Factor shares and resource rent A particular aspect to be considered with respect to mar-
keting of fish is that the current low price offered by govern- ment affects the boat owners' share of the fishing income. The government can see it as a means of collecting resource rent on and above the fee paid by boat owners as licence fee, which the government might see as a nominal entry fee. While it is true that the current low price offered by the government deters boat owners from putting all their catch for sale to the government marketing agency, it is hard to argue against it on the ground that the government is taking the fishers' share away.
The majority of the fishers, who in this case are labor fishers, are not part of this transaction. One can even argue that the wage rates paid to labor fishers are independent of the unit price of fish received by the boat owners. Despite the above, it is important to review the role and performance of the state-owned marketing agency, including its own eco- nomic efficiency. If the collection of resource rent is one jus- tification for low fixed prices, there may be other means of collecting rent. Rather than indirectly charging an arbitrary rent in the form of lower price for their catch, a more direct and transparent approach would be more appropriate.
AHMEDlSocioeconomic policy issues. .. 157
Research is needed to determine the factor productivity, so that efforts can be made to correct discrepancies, if there are any, in the current allocation of factor shares, including re- source rent.
Settlement and population growth around the lake When the Aswan High Dam was built, it displaced several
thousand people. Over 100 000 from the Nubian provinces of Egypt and Sudan were resettled (Manshard 1975). However, after the lake was formed, no new settlements were estab- lished. Around many other African lakes, new settlements were developed within a few years. For instance, in Lake Volta, Ghana, fishers from the Lower Volta area moved up- stream and established their own villages without any out- side assistance (Kapetsky and Petr 1984). In Asia, settlements around lakes were equally quick to be established, especially where fishing and agriculture could be combined. The areas around Lake Nasser are sparsely populated. People live mostly in fishing camps separated from their permanent home base and families. There are no permanent communities around the lake. People who work as fishers and in fishing-related trading live in about 500 camps scattered around the lake or on islands. Infrastructure and facilities are minimal, and there have been no efforts in the past to develop other means of livelihood to support a permanent settlement. This issue is very complex for Lake Nasser from the point of view of main- taining the quality of the lake water vis-A-vis optimal man- agement of fisheries and the need to provide security to those involved in the fisheries. From the perspective of developing partnerships for a sustainable fiphery management, the estab- lishment of a more settled community around the lake may be useful. Development, such as a culture-based fishery and restocking, will need much closer links with beneficiaries and resource users. Furthermore, research is required to deter- mine whether or not the establishment of human settlements is socially and economically feasible. The effects of human settlement and other land-bound activities around the lake on the quality of lake water should also be carefully investi- gated.
Conclusions The creation of artificial lakes by dam construction has
negative as well as positive impacts. In this case, it displaced people who were culturally distinct, destroyed habitats and biodiversity, and altered the ecology and environment both upstream and downstream. The formation of Lake Nasser was
no different from many other lakes in these regards although the scale of the impacts may have been outweighed by the benefits it provided to Egypt's national economy including the fishery However, much of the potential benefit from the fishery has been either lost or remained untapped due to the absence of a sustainable management strategy, which includes sound policies and institutions that link people or beneficia- ries closer to the resource. State intervention through control over access, exploitation and marketing lead to ineffective regulation, costly and inefficient management, illegal prac- tices and inequity, and inaccurate statistics.
A competitive and more realistic price and marketing struc- ture is needed for improving the economic benefits from the fisheries in Lake Nasser. Also, any government-sponsored pro- gram to improve income as well as to attract new investment in the industry, such as restocking, cage culture, develop- ment of a pelagic fishery, recreational fisheries and tourism, will require participation by a wide group, not just the boat owners. Appropriate institutional and policy environments are needed.
References Ahmed, M., A.D. Capistrano and M.M. Hossain. 1996. Experiences
of partnership models for the co-management of Bangladesh fisheries. Fish. Manage. Ecol. 4:233-248.
Bernaesek, G. and S. Lopes. 1983. Present status of African reser- voir fisheries: the Cahora Bassa experience. Food and Agricul- ture Organization, Rome. 36 p.
Burapha Development Consultants. 1992. Nam Ngum socio-eco- nomic survey. Burapha Development Consultants Co. Ltd., Lao People's Democratic Republic. 63 p.
FAO. 1997. The state of world fisheries and aquaculture 1996. Fisheries Department, FAO, Rome. 123 p.
Kapetsky, J.M. and T. Petr. 1984. Status of African reservoir fisheries. FA0 Fish. Tech. Pap. 10.
Khan, K.U.A. 1998. Technical, social and institutional aspects of reservoir fisheries in Kaptai Lake, Bangladesh. Asian Institute of Technology, Bangkok. 320 p. Ph.D. dissertation.
Manshard, W. 1975. The large African reservoirs, p. 69-78. In Natu- ral resources and development. Institute for Scientific Co-op- eration, Federal Republic of Germany, and the Geological Survey of the Federal Republic of Germany.
Pinkerton, E. 1989. Introduction: attaining better fisheries manage- ment through co-management-prospects, problems and propositions, p. 3-33 In E. Pinkerton (ed.) Co-operative management of local fishers: New direction for improved management and community development. University of British Columbia Press, Vancouver.
158 Sustainable fish production in Lake Nasser
AHMED1Socioeconomic policy issues.. . 159
Requirements for Fisheries Assessment and Management
T.J. Pitcher University of British Columbia, Vancouver, Canada
Pitcher,T.J. 2000. Requirements for fisheries assessment and management, p. 161-164. In J.F. Craig (ed.) Sustainable fish production in Lake Nasser: ecological basis and management policy. ICLARM Conf. Proc. 6 I, 184 p
ABSTRACT Data requirements and the design of a frame survey for monitoring resources are discussed. Single-species stock assessments are outlined using either production or dynamic pool models. Quantitative management targets need to be identified for each commercial species. Multispecies assessment can include the impacts of harvest on a range of alternative ecosystems.A detailed fisheries management plan should be drawn up for the lake, including systematic documentation of the quantitative assessments of the principal commercial species.There is a need to design appropriate and enforceable instruments t o implement management targets aimed at maximizing the benefit to society of the lake's fisheries. Because of the remoteness of the lakeshore, co-management between government and the local community is advised to maximize compliance with regulations.
Introduction This paper is a brief outline of the present state of knowl-
edge about research that could be used to estimate the ex- ploitation status and management of Lake Nasser's fish resources from the workshop in Aswan held in June 1998. Statements here are based only on research material presented and discussed at the workshop; other work and information may be available, and so this paper may serve to identify material not presented there.
Catch data Fishery assessment needs accurate catch data by species,
place and time. Time series of catch data were presented for tilapia (Oreochromis niloticm) and Nile perch (Lates niloticus). For many Lake Nasser stocks, it will be important to obtain estimates of catches in Lake Nubia, since the fish populations extend across the international border. At present, Lake Nubia catch figures do not seem to be available.
Landings of each fish species should be estimated using a frame survey, which has to be planned with statistical rigor. In the workshop, it was not made clear how catch data had been gathered, whether statistical confidence limits had been
estimated, and where in the lake fish had been caught. More- over, it seems likely that much of the catch data comes from the official government landing site in Aswan, but the visit to this site suggested that more careful records need to be taken, particularly of the less abundant species, such as large catfish and cyprinids. It was not clear whether catch data were as- sembled only at Aswan, or whether attempts had been made to estimate catch at the point of origin. Illegal catch was re- ported at the workshop as being at least equal to the legal catch, estimated from informal interviews with fishers. Clearly, some effort should be made to obtain improved estimates of the true catch from the lake. Two methods of doing this might be: (a) to ask "what must catch have been to reduce biomass to the present level?" This requires estimates of B, and B,,,,, and (h) to employ confidential interview techniques. using survey statistics methods with internal cross validation and methods to detect lies. Market records of prices at the gov- ernment-landing site at Aswan miss the obviously extensive trade in fish that occurs outside the government system. This is important because underestimates of catch may provide false signals that resources are in good shape and encourage depletion and overfishing.
PITCHERIRequirements for fisheries assessment and management 16 1
Effort data Many forms of fish stock assessment require estimates of
fishing effort. Data required are the number of vessels by gear type, vessel size, place and time. Unfortunately, very little material on the composition, gear types and catching power of the fishing fleet was presented at the workshop. This information would be provided and monitored in the future by a frame survey program, although this would not improve the historical record of catches needed for assess- ment. Fish landed by carrier boats are transported down the lake to Aswan, and carrier boat loads and trip numbers would provide a good crosscheck on landings data.
Stock assessment-parameter estimates Critical parameters for stock assessment are growth and
mortality by species, location and season. In addition, data are required on biomass, reproductive status and diet.
Growth At the workshop it was clear that both age-based and
length-based methods have been used quite effectively to estimate growth parameters such as Loo, Woo, and K for many Lake Nasser fish. It would be valuable to compile a compre- hensive database of this work so that any gaps can be identi- fied. The auximetric growth parameter, Phi-prime, generally has not been estimated. This should be done, as it can assist the validation of other estimates. In most cases, various pre- programmed software packages had been used to fit growth parameters, but simple techniques of fitting using spreadsheet methods might be encouraged because of the ease of obtain- ing confidence limits by Monte Carlo methods (see Pitcher 1999).
Mortality Very few estimates of total mortality, Z, were presented at
the workshop, which is surprising because of the simplicity of obtaining approximate estimates of Z from aged catch curves or from length-based catch curves. Most presenters had used Pauly's (1980) empirical equation to obtain natural mortality, M, but estimates of current F were very few.
Reproductive cycle It is important to estimate fecundity and the timing and
frequency of spawning, or brood production in tilapia, but little of this material was presented at the workshop. The location and relative abundance of juveniles of species with high conservation status such as the cyprinids might be moni- tored with specially designed surveys.
Biomass Biomass estimates are required, not only as a part of con-
ventional stock assessment, but also for ecosystem modelling. Estimates that are independent of stock assessment proce- dures and of fishery-based data are especially valuable. In the Aswan workshop, almost no biomass estimates for fish stocks were presented. Regular surveys of relative biomass using specially designed sampling gear or adaptations of gear used by commercial fishers should be designed and carried out. Tagging can help as part of a mark and recapture survey. Regular acoustic surveys can also be valuable and may be carried out reasonably cheaply using modern portable equip- ment.
Diet For ecosystem modelling, quantitative information on the
diet of the fish, including noncommercial species has to be assembled. These data should preferably be gathered by sea- son and at several locations in the lake. As there are several different methods for scoring fish stomach contents, a diet survey needs to be carefully designed in relation to resources and humanpower.
Stock assessment-single-species assessment Single-species assessments may be carried out using a
variety of approximate and standard methods. It is often best to employ the widest range of methods possible, to allow for cross validation. Many methods these days may be performed using spreadsheets, and uncertainties estimated using Monte Carlo simulation.
Approximate methods for potential yield Approximate methods of estimating potential yield have
been applied to Lake Nasser, such as the Morphoedaphic in- dex (ME1 - Ryder 1982) and Pitcher's target lake method (Pitcher and Bundy 1998). Beddington and Cooke's (1983) method and the approximate catch/effort "Walter" plot (Walters 1986) technique have not been used on the lake's fisheries.
Production models Nonequilibrium methods for production (= surplus yield)
models can be employed only when time series of catch and effort are available, although some short cuts are possible The surplus production, or a semi-age-structured form. such as the delay-difference model (Hilborn and Walters 1992) with environmental drivers may be used to estimate current biomass and unexploited biomass. The latter concept in a human-made lake such as Lake Nasser is of interest
162 Sustainable fish production in Lake Nasser
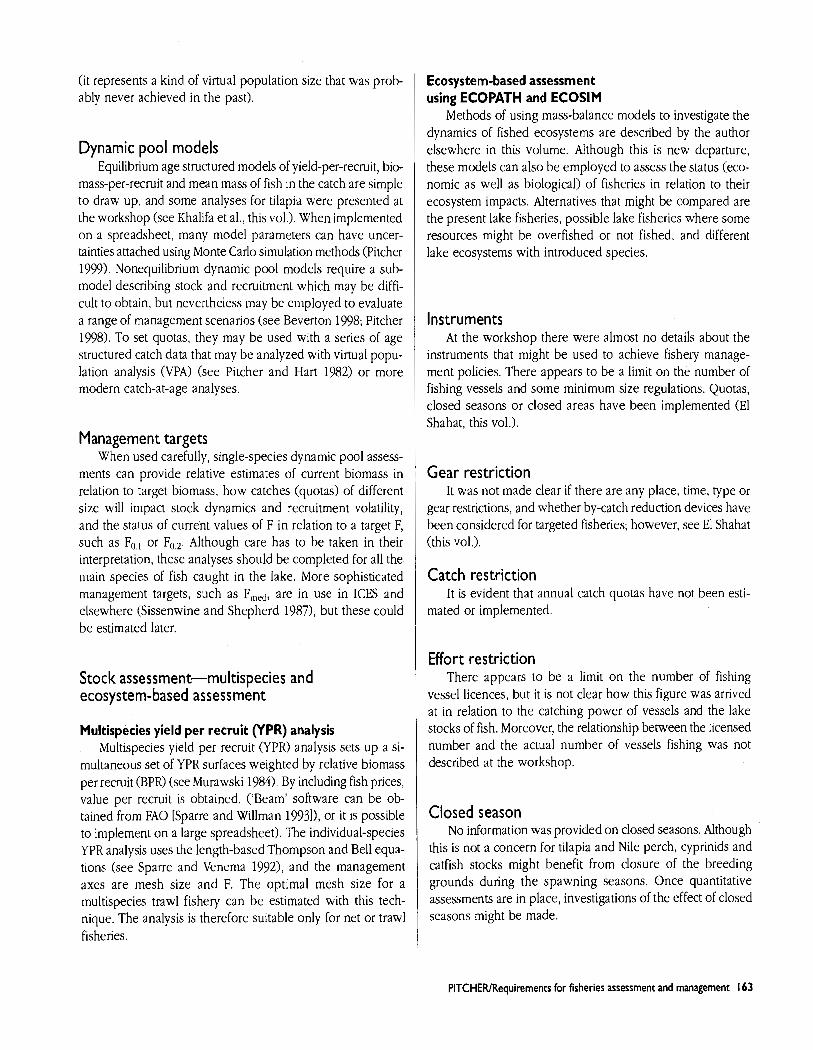
(it represents a kind of virtual population size that was prob- ably never achieved in the past).
Dynamic pool models Equilibrium age structured models of yield-per-recruit, bio-
mass-per-recruit and mean mass of fish In the catch are simple to draw up, and some analyses for tilapia were presented at the workshop (see Khalifa et al., this vol.). When implemented on a spreadsheet, many model parameters can have uncer- tainties attached using Monte Carlo simulation methods (Pitcher 1999). Nonequilibrium dynamic pool models require a sub- model describing stock and recruitment which may be diffi- cult to obtain, but nevertheless may be employed to evaluate a range of management scenarios (see Beverton 1998; Pitcher 1998). To set quotas, they may be used w~th a series of age structured catch data that may be analyzed with virtual popu- lation analysis (VPA) (see Pitcher and Hart 1982) or more modern catch-at-age analyses.
Management targets When used carefully, single-species dynamic pool assess-
ments can provide relative estimates of current biomass in relation to target biomass, how catches (quotas) of different size will impact stock dynamics and recruitment volatility, and the status of current values of F in relation to a target F, such as Fo or Fo,z. Although care has to be taken in their interpretation, these analyses should be completed for all the main species of fish caught in the lake. More sophisticated management targets, such as Fmrd, are in use in ICES and elsewhere (Sissenwine and Shepherd 19871, but these could be estimated later.
Stock assessment-multispecies and ecosystem-based assessment
Multispecies yield per recruit (YPR) analysis Multispec~es y~eld per recruit (YPR) analysis sets up a si-
multaneous set of YPR surfaces weighted by relative biomass per recruit (BPR) (see Murawski 1984). By including fish prices, value per recruit is obtained. ('Beam' software can be ob- tained from FA0 [Sparre and Willman 19931), or it is possible to implement on a large spreadsheet). The individual-species YPR analysis uses the length-based Thompson and Bell equa- tions (see Sparre and Venema 1992), and the management axes are mesh size and F. The optimal mesh size for a multispecies trawl fishery can be estimated with this tech- nique. The analysis is therefore suitable only for net or trawl fisheries.
Ecosystem-based assessment using ECOPATH and ECOSIM
Methods of using mass-balance models to investigate the dynamics of fished ecosystems are described by the author elsewhere in this volume. Although this is new departure, these models can also be employed to assess the status (eco- nomic as well as biological) of fisheries in relation to their ecosystem impacts. Alternatives that might be compared are the present lake fisheries, possible lake fisheries where some resources might be overfished or not fished, and different lake ecosystems with introduced species.
Instruments At the workshop there were almost no details about the
instruments that might be used to achieve fishery manage- ment policies. There appears to be a limit on the number of fishing vessels and some minimum size regulations. Quotas, closed seasons or closed areas have been implemented (El Shahat, this vol.).
Gear restriction It was not made clear if there are any place, time, type or
gear restrictions, and whether by-catch reduction devices have been considered for targeted fisheries; however, see El Shahat (this vol.).
Catch restriction It is evident that annual catch quotas have not been esti-
mated or implemented.
Effort restriction There appears to be a limit on the number of fishing
vessel licences, but it is not clear how this figure was arrived at in relation to the catching power of vessels and the lake stocks of fish. Moreover, the relationship between the licensed number and the actual number of vessels fishing was not described at the workshop.
Closed season No information was provided on closed seasons. Although
this is not a concern for tilapia and Nile perch, cyprinids and catfish stocks might benefit from closure of the breeding grounds during the spawning seasons. Once quantitative assessments are in place, investigations of the effect of closed seasons might be made.
PITCHERIRequirements for fisheries assessment and management 163
Closed areas The area adjacent to the Aswan High Dam is closed to
fishing vessels for security reasons, although it is not clear how well enforced this regulation is. Closed areas can act as a valuable hedge against uncertainty in fisheries management and should be considered seriously for several areas of the lake. Spatial information on catches, effort and biomass would make spatially partitioned stock assessment easier.
Community management Because of the remoteness of the lakeshore, co-manage-
ment between government and the local community is ad- vised to maximize compliance with regulations. As shown in Fig. 1, the efficacy of regulations drawn up by central govern- ment institutions is generally high, but compliance by local fishers is low. Compliance with regulations drawn up by lo- cal fishing communities is often high, but generally not very efficacious. A balance between the two, represented by co- management, maximizes the benefit to the resource.
References Beddington, J.R. and J.G. Cooke. 1983. The potential yield of fish
stocks. FA0 Tech. Pap. 242, 47 p. Beverton, R.J.H. 1998. Fish, fact and fantasy: a long view. Rev. Fish
Biol. Fish. 8(3):229-250. Hilborn, R. and C.J. Walters. 1992. Quantitative fisheries stock as-
sessment: choice, dynamics and uncertainty. Chapman and Hall, New York. 570 p.
Murawski, S.A. 1984. Mixed species yield-per-recruitment analyses accounting for technological interactions. Can. J. Fish. Aquat. Sci. 41:897-916.
Pauly, D. 1980. On the interrelationships between natural mortality, growth parameters and mean environmental temperature in 175 fish stocks. J. Consew. CIEM 39(3):175-192.
Pitcher, T.J. 1998. A cover story: fisheries may drive stocks to ex- tinction. Rev. Fish Biol. Fish. 8(3):367-370.
Pitcher, T.J. 1999. Beverton and Holt: the spreadsheet and uncer- tainty. Naga: ICLARM Q. 22(1):37-41.
Pitcher, T.J. and A. Rundy. 1998. The problems of estimation of potential yield in data-sparse lake fisheries: a new family of approximate models with examples from African lake fisheries. Rev. Fish Biol. Fish. 8(4):473-480
Pitcher, T.J. and P.J.B. Hart. 1982. Fisheries ecology. Chapman and Hall, London. 414 p.
Ryder, R.A. 1982. The MEI-use, abuse and fundamental concepts. Trans. Am. Fish. Soc. 111:154-164.
Sissenwine, M.P. and J.G. Shepherd. 1987. An alternative perspec- tive on recruitment over-fishing and biological reference points. Can. J. Fish. Aquat. Sci. 44:913-918.
Sparre, P.J. and R. Willman. 1993. Software for the bio-economic analysis of fisheries. BEAM 4. Analytical bio-economic simula- tion of space-structured multi-species and multi-fleet fisheries. FA0 Comput. Inf. Ser. (Fish.) 1(3), 86 p.
Government Co-management Community control control
Fig. I .Co-management achieves a balance between government and local design and control of regulations for fisheries.
Sparre, P.J. and S.C. Venema. 1992. Introduction to tropical fish stock assessment. Part 1. Manual. FA0 Fish. Tech. Pap. 306 (11, 376 p.
Walters, C.J. 1986. A robust approach to equilibrium yield curves. Can. J. Fish. Aquat. Sci. 431332-1339.
164 Sustainable fish production in Lake Nasser

Planning
Planning: Project Recommendations and Implementation Plans
J.F. Craig International Center for living Aquatic Resources Management,Africa and West Asia Region, Cairo, Egypt
Craig, J.F. 2000. Planning: project recommendations and implementation plans, p. 167- 170. In J.F. Craig (ed.) Sustainable fish production in Lake Nasser: ecological basis and management policy. ICLARM Conf. Proc. 6 1 , 184 p.
ABSTRACT Suggestions arising from the workshop discussions for implementing the project are listed, including tasks and requirements for identified subprojects.
Summary of the discussions following the reports of the working groups on development of the Lake Nasser Project
Several common features emerged from the presentations made by he various working groups in relation to the sustainability and enhancement of the fishery in Lake Nasser. These included the following: I The base for the project should be in Aswan. I There is a need to set priorities. This process is complex.
However, training, the establishment of a database, and deal- ing with existing knowledge should come first (see Craig, this vol., p. 107) Further, essential activities may emerge after the Workshop proceedings have been circulated. I Information gaps should be clearly identified (see Craig, this
vol., p. 105). I Contact should be ~nade at an early stage wilh policyrnakers,
Sudanese authorities (important to consider the lake as a whole) and local fishers (make them feel part of the project). I Trainlng is essential in new methods and techniques. This
would be achieved by short courses, possibly in Aswan or elsewhere (e.g., ICLARIVI). There is also a need to improve staff qualifications. Master's or doctorate degrees for the staff could be obtained overseas or, if cost is a problem, in Egypt with short periods outside. I A Lake Nasser Fishery Management Research Group should
be formed. The linkages between trophic groups were, with a few exceptions, seldom stresscd at thc workshop. Sincc this project takes a multidisciplinary approach, it is impor-
tant that the workers involved develop their research with a view to strengthening these linkages. The multidisciplinary approach becomes particularly important where there is an interface between human and biological aspects of the fish- ery; and there may be a need for training in multidisciplinary projects. ICLARM has experience in this field. Tasks and re- quircmcnts for rcscarch arc listcd bclow. I Several groups gave what amounted to a "wish-list" of equip-
ment needs, which is probably unrealistic at present. All the institutions involved in research on Lake Nasser should there- fore assess what equipment they already have and deter- mine the extent lo which it can be shared. Access to the literature was identified as a major constraint, Everyone working on Lake Nasser is finding it very difficult to keep up-to-date, but there may be ways in which chis project could meet [hat need. I There is a need for improved communications, which in-
cludes access to the Internet. There is a general need for more outside consultation, including advice from experts, and it was suggested that an advisory group be set up to review reports and proposals before submission. I 'She establishment of a newsletter would improve communi-
cations. This would be distributed locally and intcrnation- ally. I It was accepted that it is difficult for local workers to travel to
international meetings, but some funds should be used for this purpose. It is also possible that overseas students mght be able to work on Lake Nasser, while establishing links with local scientists.
CRAIGIPlanning: project recommendations and implementation plans 167
w Most of the sampling in the lake seems to have been done in the central channel. I t is necessary to sample in all areas, including the khors, on a mul~idisciplinary basis. The Nile valley was well-mapped before it was flooded.
w Postharvest techniques were well below acceptable stan- dards, resulting in unnecessary spoilage and a product un- suitable for export. Training and improvement of the facilities are required.
Tasks and requirements for each discipline as identified in the workshop
Fishery management research group
Tasks w Oversee the activities of all subprojects. w Provide guidelines to ensure an ecosystem approach to the
study and integration of topics. w Compile and synthesize all existing and new research data. w Develop management tools for the lake, taking into ac-
count ecological, economic and social factors.
Physical and chemical limnology
Tasks Collect and analyze: w Available data from remote sensing. w Meteorological data from at least two representative weather
stations, including temperature, wind, evaporation, relative humidity and precipitation.
w Hydrological data (calculate water balance). w Water temperature and dissolved oxygen data (calculate
profiles including stratification patterns). w Light data including the effect of suspended matter.
Nutrient, pH, total dissolved solids (TDS), etc., data.
Requirements w Conduct~vity/temperature/depth probe (CTD) with addi-
t~onal fac~l~ty for measurmg Lght (photosynthetlc actwe radiation, PAR) and 0, concentration
w Van Dorn-type sampling bottles and suitable winch for deployment
w Laboratory equipped with basic glassware, chemicals and analytical instruments for nutrient analysis
w Research vessel time
Bacteria
Tasks w Monitor sanitary quality of the lake water for drinking,
irrigation, agriculture and fish production w Determine the role of bacteria in nutrient cycles.
Requirements w A well-equipped microbiology laboratory
Phytoplankton
Tasks w Determine spatial (vertical and horizontal) distribution and
standing crop of chlorophyll a. w Determine primary production for planktonic and benthic
algae. w Measure sunshine and PAR. w Collect satell~te data on lake surface temperature and
suspended scdiment valucs (with posslble addition of chlorophyll a measurements)
Requirements w Researcher, field assistants and technicians w Fluorometer a Inverted microscope and counting chamber w Hand-held oxygen meter and incubation vessels w Data from physical and chemical limnology studies
including ineteorological data w Research vessel time
Macrophytes
Tasks w Determine spatial and temporal d~strlbut~on and standma
crop (chlorophyll a and dry weight). w Determine primary production particularly In the shallow
water zone (down to one meter) and of the charaphytes
Requirements rn Researcher, ficld assistants and technicians rn Drying oven, oxygen meter, conductivity meter, spectro-
photometer and balance
Zooplankton
Tasks Perform qualitative and quantitative studies, including tax- onomy and estimates of biomass and production.
w Estimate zooplankton consumption of phytoplankton. rn Estimate fish consumption of zooplankton.
168 Sustainable fish production in Lake Nasser
Requirements r References and expert advice for identification r Plankton nets
Research and stereoscopic microscopes r .4quaria
Benthic invertebrates
Tasks r Estimate biomass and production. r Determme seasonal cycles In abundance
Apply data to ecosystem models.
Requirements r Scientist, assistant and technician r Equipment (unspecified) r Training in taxonomy
Fish-eating reptiles and birds
Tasks I Estimate abundance of predators. r Determine the fish species eaten and their size range by
examination of the predator's stomach content. rn Quantify the biomass of fish eaten.
Requirements r Two biologists for bird surveys r One biologist and one hunter for crocodile and other rep-
tile surveys r Research vessel time r External expert on reptiles to train local staff r Training in gut content analysis and relating bony struc-
tures remaining in the gut to the size of fish consumed Cameras with zoom telephoto lenses
rn Tagging equipment r Life insurance for the crocodiles biologist! r Laboratory space with dissection equipment, etc. r Training in statistics
Fishery biology and aquaculture
Tasks r Examine the potential benefits and hazards of introducing
a new fish species to utilize the openwater area. rn Determine the genetic composition of Nile tilapia used in
stock enhancement and the natural, wild fish and deter- mine the cost/benefit of the enhancement program. I Culture threatened endemic fish for re-introduction.
Requirements r Access to a genetics laboratory r Boat with facilities for live fish transportation I Truck for live fish transpor?ation rn Training, especially in genetics
Fishery assessment
Tasks r Estimate sustainable harvest (yield) by species. r Improvement of fishery statistics through camp (fishers,
gears, boats, etc.) and landed and salted fish (composition. length, frequency. etc.) surveys.
r Estimate biomass by hydroacoustics. r Gather biological data on age and growth, reproduction.
food and feeding, demographic structure, etc r Develop a database. I Apply analytical and ecosystem models.
Requirements r Researchers, assistants and field technicians r Database manager r Stereo microscope for ageing by otoliths, scales. opercula.
fin rays, etc. r Research rnicroscupe r Research vessel time r Echo-sounder (integrated system) a Training in hydroacoustics
Sociology
Tasks r Review literature concerning social aspects of human ac-
tivities in the lake to identify knowledge gaps. In particular. the relationship between human behavior and the natural ecosystem and how human behavior is affected by change in the fish resources base.
r Collect qualitative data (interviews, group meetings, etc.) on issues such as markets and marketing.
r Collect quantitative data (stratified sampling) on how the process of production is organized, the relative importance of fisheries to the fishers' household economy, allocation of the catch value, catch distribution to the consumers, the conditions of workers in the processing piant, organization of the fishing cooperatives, their success and legal status. living conditions in the campsites, the potential role of sport fishing, formulation of policies and enforcement regula- tions, and quota setting.
CRAIGIPlanning: project recommendations and implementation plans 169
Requirements I Project leader and two research assistants
Economics
Tasks I Collect and analyze data on: - Policy and institutional aspects including national plans
for lake development and legal and institutional aspects. - Economics of production including fishing technology
and impacts, labor force participation and fishing opera- tions and fish processing.
- Fish marketing including demand and supply of fish; patterns in human consumption of fish, fish markets, chan- nels and margins; fish prices and pricing policies.
- Income and its distribution including scarceness of in- come of fishers' families and sharing of fishing income and distribution.
Establish policy recommendations.
Requirements I One senior economisr, two research assistants and six field
data collectors Tape recorders and calculators
I Training in research methods, research design, field data collection, computers and databases
170 Sustainable fish production in Lake Nasser

Indices and appendices
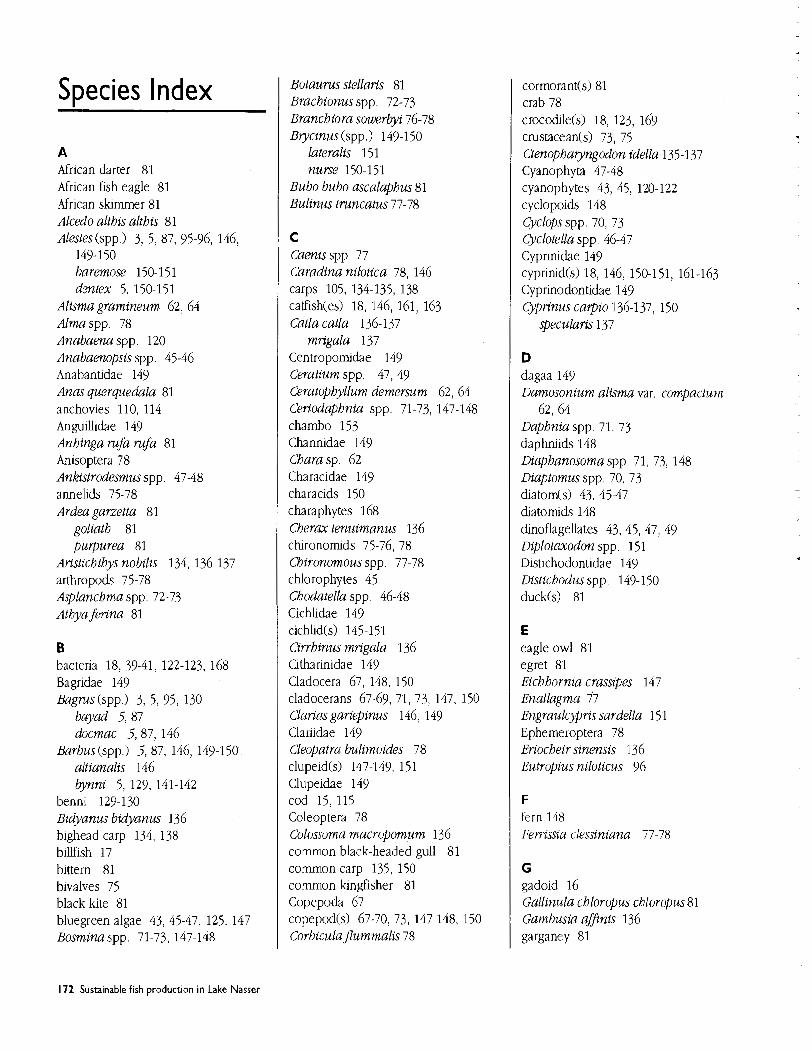
Species Index
A African darter 81 African fish eagle 81 African slurnrner 81 Alcedo althis althis 81 Alestes (spp.) 3, 5, 87, 95-96, 146,
149-1 50 baremose 150-151 dentex 5, 150-151
Alisma gramineum 62, 64 Alma spp. 78 Anabaena spp. 120 Anabaenopsis spp. 45-46 Anabantidae 149 Anas querquedala 81 anchovies 110, 114 Anguillidae 149 Anhinga ruja rufa 81 Anisoptera 78 Ankistrodesmus spp. 47-48 annelids 75-78 Ardea garzetta 81
goliath 81 purpurea 81
Aristichthys nobilis 134, 136-137 arthropods 75-78 Asplanchma spp. 72-73 Athya ferina 81
B bactena 18, 39-41, 122-123, 168 Bagrldae 149 Bagms(spp1 3, 5, 95, 130
bayad 5, 87 docmac 5,87, 146
Barbus (spp ) 5,87, 146, 149-150 altzanalzs 146 bynnz 5 , 129, 141-142
benn~ 129-130 Bzdyanus bzdyanus 136 b~ghead carp 134, 138 billfish 17 bittern 81 blvalves 75 black k~te 81 bluegreen algae 43, 45-47, 125, 147 Bosmzna spp 71-73, 147-148
Botaurus stellaris 81 Brachionus spp. 72-73 Branchiora sowerbyi 76-78 B ycinus (spp.) 149-1 50
lateralis 151 nurse 150-151
Bubo bubo ascalaphus 81 Bulinus truncatus 77-78
C Caenis spp. 77 Caradina nilotica 78, 146 carps 105, 134-135, 138 catfish(es) 18, 146, 161, 163 Catla catla 136-1 37
mrigala 137 Centropomidae 149 Ceratium spp. 47, 49 Ceratophylhm demersum 62, 64 Ceriodaphnia spp. 71-73, 147-148 chambo 153 Channidae 149 Charasp. 62 Characidae 149 characids 150 charaphytes 168 Cherax tenuirnanus 136 chironomids 75-76, 78 Chironornous spp. 77-78 chlorophytes 45 Chodatella spp . 46-48 Cichlidae 1/19 cichlid(s) 145-1 51 Cirrbinus mrigala 136 Citharinidae 149 Cladocera 67. 148, 150 cladocerans 67-69, 71, 73. 147, 150 Clarias gariepinus 146, 149 Clariidae 149 Cleopatra bulimoides 78 clupe~d(s) 147-149. 151 Clupeidae 149 cod 15, 115 Coleoptera 78 Colossorna macmpornurn 136 common black-headed gull 81 common carp 135, 150 common kingfisher 81 Copepoda 67 copepod(s) 67-70, 73, 147-148, 150 CorbiculaJurnrnalis 78
cormorant(s) 81 crab 78 crocodile(s) 18, 123, 169 crustacean(s) 73, 75 Ctenopharyngodon idella 135-137 Cyanophyta 47-48 cyanophytes 43, 45, 120-122 cyclopoids 148 Cyclops spp. 70, 73 Cyclotella spp. 46-47 Cyprinidae 149 cyprinid(s1 18, 146, 150-151, 161-163 Cyprinodontidae 149 Cyprinus carpio 136-1 37, 150
specularis 137
D dagaa 149 Darnosonium alisma var. cornpacturn
62, 64 Daphnia spp. 71, 73 daphniids 148 Diaphanosoma spp. 71, 73, 148 Diaptomus spp. 70, 73 diatom($ 43, 45-47 diatomids 148 dinoflagellates 43, 45, 47, 49 Diplotmodon spp . 151 Distichodontidae 14') Distichodus spp. 149-1 50 duck(s) 81
E eagle owl 81 egret 81 Eichhornza cvassipes 147 Enallagma f i Engraulcjpris sardella 151 Ephemeroptera 78 Eriocheir sinensis 136 Eutropius niloticus 96
F fern 148 Ferrissia clessiniana 77-78
G gadoid 16 Gallinula chloropus chloropus 81 Gambusia affinis 136 garganey 81
172 Sustainable fish production in Lake Nasser
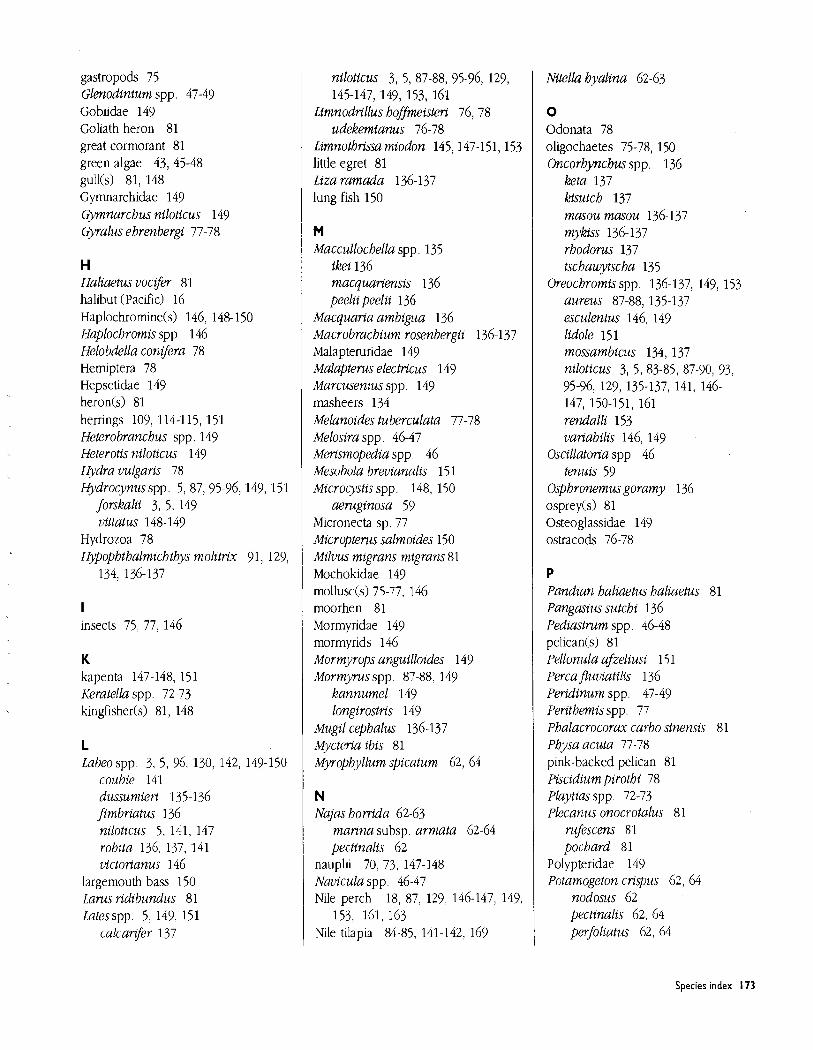
gastropods 75 Glenodinium spp. 47-49 Gobiidae 149 Goliath heron 81 great cormorant 81 green algae 43, 45-48 gull(s) 81, 148 Gymnarchidae 149 Gymnarchus niloticus 149 Gyralus ehrenbergi 77-78
H Haliaetus vocq?er 81 halibut (Pacific) 16 Haplochromine(s) 146, 148-1 50 Haplochromis spp 146 Helobdella conifera 78 Herniptera 78 Hepsetidae 149 heron(s) 81 herrings 109, 114-115, 151 Heterobranchus spp. 149 Heterotis niloticus 149 Hydra uulgaris 78 Hydrocynus spp. 5,87,95-96,149,151
forskalii 3, 5, 149 vittatus 148-149
Hydrozoa 78 Hypophthalmichthys molitrix 91, 129,
134, 136-137
I insects 75, 77, 146
K kapenta 147-148, 151 Keratella spp. 72-73 kingfisherb) 81, 148
L Laheo spp 3, 5, 96, 130, 142, 149-150
cozlbie 141 dussunzieri 135-136 fimbriatus 136 niloticus 5, 141. 147 rohita 136, 137, 141 victorianus I46
largemouth bass 150 Lams ridibundus 81 Lutes spp. 5, 149, 151
calcarifer 137
niloticus 3, 5, 87-88, 95-96, 129, 145-147, 149, 153, 161
Limnodrillus hofmeisteri 76, 78 udekemianus 76-78
Limnothrissa miodon 145,147-1 51,153 little egret 81 Liza ramada 136-137 lung fish 150
Pl Maccullochella spp. 135
ikei 136 macquariensis 136 peelii peelii 136
Macquaria ambigua 1 36 Macrobrachiurn rosenbergii 136-137 Malapteruridae 149 Malapterus electricus 149 Marcusenius spp . 149 masheers 134 Melanoides tu berculata 77-78 Melosira spp. 46-47 Merismopedia spp. 46 Mesobola breuianalis 151 Microcystis spp. 148, 150
aeruginosa 59 Micronecta sp. 77 Micropterms salmoides 150 Milvus migrans migrans 81 Mochokidae 149 mollusc(s) 75-77, 146 moorhen 81 Mormyridae 149 mormyrids 146 Mormyrops anguilloides 149 Mormyrus spp. 87-88, 149
kannumel 149 longirostris 149
Mugil cephalus 136-137 Mycteria ibis 81 Myrophyllum spicatum 62, 64
N Najas horrida 62-63
manna subsp. armata 62-64 pectinalis 62
nauplii 70, 73, 147-148 Navicula spp. 46-47 Nile perch 18, 87, 129, 146-147, 149,
153, 161, 163 Nile tilapia 84-85, 141-142, 169
Nitella hyalina 62-63
0 Odonata 78 oligochaetes 75-78, 150 Oncorhynchus spp. 136
keta 137 kisutch 137 masou masou 1361 37 mykiss 136-137 rhodorus 137 tschawytscha 135
Oreochromis spp. 136-137, 149, 153 aureus 87-88, 135-1 37 esculentus 146, 149 lidole 151 mossambicus 134, 137 niloticus 3, 5 , 83-85, 87-90, 93, 95-96. 129, 135-137, 141, 146- 147, 150-151, 161 rendalli 153 variabilis 146, 149
Oscillatoria spp 46 tenuis 59
Osphronemus goramy 136 osprey(s) 81 Osteoglassidae 149 ostracods 76-78
P Pandian haliaetus haliaetus 81 Pangasius sutchi 136 Pediastrum spp. 46-48 pelican(s) 81 Pellonula afzeliusi 151 ~ e r c a Juviatilis 136 Peridinum spp. 47-49 Perithemis spp 77 Phalacrocorax carbo sinensis 81 Physa acuta 77-78 pink-backed pelican 81 Piscidium pirothi 78 Playtias spp. 72-73 Plecanus onocrotalus 81
rufescens 81 pochard 81
Polypteridae 149 Potamogeton crispus 62, 64
nodosus 62 pectinalis 62, 64 perfoliatus 62, 64
Species index 173
schweinfurthii 62-64 trichoides 62
Potamonatus nioticus 78 prawn 78 Pristina spp. 76, 78 Protopteridae 149 Protopterms spp. 146, 149
aethiopicus 146 annectens 150
Puntius gonionotus 137 javanicus 137
Purple heron 81
R Rastrineobola argenta 146-147, 151 r o ~ e r s 67-69, 72-73, 147-148 ruddy shelduck 81 Rutilus frisii kutum 137 Rynchopsflavirostris 81
S Salmonids 135 Salmo trutta 136 Salvelinus pluvius 137 Salvinia molesta 148 sardines 105, 110, 114, 151 Sargochromi spp. 149
Sarotherodon galilaeus 5, 83-84, 87-90, 136
scissor-billed tern 81 Schilbe tnterrnedius 146, 149 Schilbeidae 149 seals 17 serranochromids 149-1 50 Serranochromis spp. 149 shrimps 146 silver carp 91, 129, 131, 134, 138,
141-142 snails 78 Spharium simile 78 Staurastrum spp. 47-48 Stolothrissa tanganicae 151 Synedra spp. 46-47 Synodontis spp. 87-88, 146. 149
serratus 5 schall 5
T Tadornu femginea 83 tern($ 81, 148 Tetraodontidae 149 tiger fish 18, 148 Tilapia spp. 137, 149
rendalli 136, 149 zillii 87-88, 149
tdapia(s) 3, 5, 18, 83, 85-87, 93, 96, 105, 107, 129-131, 135-136, 141, 143-144, 161-163
tilappine(s) 146, 149-151 Torspp. 134, 136
khudree 136 putitora 136
Trichogaster pectoralis 136 tricopterans 76, 78 Tubifexspp. 78
v Vallisneria spiralis 62-64 Valvata nilotica 76-78 Volvox spp. 148, 150
W water hyacinth 107, 147 whales 17 white pelican 81
Y yellow-billed stork 81
z Zannichelliapalustris 62-64
174 Sustainable fish production in Lake Nasser
Author index
A AbdaUah, MS. 62,64 Abdel Aal, M.H. 9, 101 Abd Ellah, R.G. 29, 121 Abdel-Malek, Y. 40-41 Aho-Sedera, S.A. 40, 41 Aboul-Ezz, S. 77, 79 Abu-Gideiri, Y.B. 73 Ackermann, W.C. 152 Adam, H.A. 83, 87, 163 Adarns, M.S. 63, 65 Adarns, T.J.H. 115 Agaypi, M.Z. 85-87, 100, 141-142, 163 Ahmed, M. 155, 157-158 Ahti, T. 62, 64 Al-Ahram 100-101 Ali, M.M. 61, 63-65 Ali, M.T. 149, 152 Allanson, B.R. 54-55 Arnarasinghe, U.S. 135-137, 141-142 Anderson, K.P. 17, 21 Annala, J.H. 11, 13, 22 APHA (American Public Health
Association) 25, 27, 29, 31, 33-34, 38, 40-41
Arora, H.L. 83 Aruga, Y. 51, 55, 58, 60, 73, 74 Azazy, M. 40-41 Azim, M.E.A. 83-84
B Baijot, E. 135, 142 Balon, E.K. 151-152 Barrania, A. 95, 155-156 Bartley, D.M. 133-138, 140, 142-143 Battacharya, C.G. 88, 90 Baxter, R.M. 55 Beddington, J.R 162, 164 Begg, G.W. 147, 152 Belal, A.E. 29, 121 Belay, A. 54-55 Bell-Cross, B. 147, 152 Bell-Cross, G. 147, 150, 152 Bernaesek, G. 156, 158 Beumer, J.P. 21-22, 115 Beverton, R. J. H. 15, 21, 88-90, 163-164
Bindloss, M.E. 53, 55 Blix, AS. 22 Bonfil, R. 115 Born, A.F. 133 Bouda, S. 135. 142 Boulos, L. 62, 64-65 Brinkhurst, R.O. 76, 79 Brook, A.J. 67, 73-74 Bundy, A. 16, 21, 109, 113, 115, 147,
152, 162,164 Burapha Development Consultants
156, 158
C Caddy, J.F. 16. 21, 88, 90 Cadigan, N.G. 15, 22 Cao, F. 138, 142 Capistrano, A.D. 157-158 CAPMAS 100-101 Carr, M.C. 111, 115 Carvalho, G.R. 138, 142 Castri, F. di 142 Chtamwebwa, D.B.R. 146, 149, 152 Chiternbure, R.M. 148, 152 Christensen, V. 16-22 Clark, C.W. 16, 21 Clark, D.S. 40-41 Clarke, K.R. 111-112, 115 Coche, A.G. 147, 152 Cochran, W.G. 40-41 Coke, M. 148, 150, 152 Cook, R.M. 15, 21 Cooke, J.G. 162, 164 Cooper, R.A. 112, 115 Courtney, A.M. 19, 22 Cowx, I.G. 133, 138-139, 142 Craig, J.F. 11, 105, 123, 167 Cross, T.F. 138, 142 Crul, R.C.M. 6 Csirke, J. 21
D Daan, N. 16, 21-22 Dalsgaard, J. 16, 20, 22 Dalzell, P. 11 5 Das, P. 143 Davenport, J. 138, 142 Dehadrai, P.V. 143 Deriso, R.B. 16, 21 De Silva, S.S. 135, 141-142, 152 Downing, J.A. 123-124
Duncan, A. 147, 152 DUK, S. 16, 21
E Eaton, J.W. 61, 65 Eccles, D.H. 151-152 Eggers, D.M. 22, 116 Ekaratne, S.U.K. 138, 142 El-Bolock, A.R. 83-84 Eleste1,H.J. 83-84 El-Ettriby,S.G. 77, 79 Elewa, A.A. 40-41, 78-79 El-Hadidi, M.N. 62-65 El Shahat, M.M. 3, 12, 25-26, 29, 33,
39-41, 43, 51, 57, 59, 61, 67-68, 75, 85, 88, 93, 95, 100. 141, 163
El Shaheed, M.N.A. 141-142 El IBwila, S.1. 99, 101 El-Zarka, S. 83-84 Entz, B.A.G. 3. 6, 54-55, 59-60: 73,
78-79
F FA0 (Food and Agriculture Organiza-
tion of the United Nations) 133-134, 138, 142, 149, 152. 155. 158
Fahim, H. 100-101 Fayed, A.A. 64-65 Feldrnann, J. 43, 49 Finlayson, A.C. 15, 21 Fishar, M.R.A. 75-79, 121-122 Fogg, G.E. 43, 49 Froese, R. 16, 20, 22 Funk, F. 115
G GADF (General Authority for Develop-
ment of Fisheries) 99-101 Gad, G.G. 55 Gazey, W. 17. 21 Ghabbour, S.I. 62, 65 Gliwicz, Z.M. 148, 152 Goldschrnidt, T. 146-147, 152 Goma, R.H. 33,120 Goudsward, P.C. 147, 152 Grabow, W.O.K. 39,41 Grant, A. 21, 115 Greboval, D.F. 147, 152 Greenwood, P.H. 146, 152 Grirnrn, L.G. 116
Author index 175
H Hab~b, 0 A 43 51. 60. 67. 73-74 Haednch. R L 15. 21 Haggan N 11 5 Halden, M J 83-84 Halls, A 134, 142 Hamet-Aht~, L 62, 64 Hammerton, D 60 Hanbury. R G 61 65 Hancock, D A 21, 115 Hart, P J B 16, 21-22 115-116 151-152,
163-164 Hart, R C 54-55 Haslam, S M 63-65 Hatem, T 99, 101 Hecky, R E 147, 152 He~ferz, J 115 Henderson. H F 137 143 Hendry, G S 39, 41 Hdborn, R 15-16, 21-22, 162, 164 Hillbr~cht-Ilkowska, A 55 Hmyarna, N 85-86 Hoggarth D 134, 142 Halt S J 15. 21 88-90 Hongskul, V 16, 21 Hopkins. N S 99, 101 Horsnell, G 39, 41 Hossain, M M 157-158 Hu. T 138, 142 Hutch~ngs, J A 15, 21 Hutchmson, G E 43, 49 Hutton, T 109, 115
I lanelli, J .N. 115 Ibrahim, A.M. 29, 33 Impacto 142 Ioriya, T. 59, 73-74 Ish~mura 51. 55, 58 Iskaros, E.A. 77-79 Ira, E.O. 149. 152
J Janhurst, S. 39, 41, 44 Jeffries, M. 61, 65 Jensen, K.W. 83-84 Jentoft, S. 110, 115 Jones, R. 16, 21, 88, 90 Joris, L. 83-84 Juarez-Palacios, J . 135, 142 Junor, F.J.R. 147-148, 152
K Kajak. 2. 55 Kalff, J . 47. 49 Kapetsky, J .M. 152, 157-158 Karenge, L. 148. 152 Keadng, K.1 43, 49 Keddy, P.A. 63, 65 Kennedy, J.C. 100-101 Khalifa, U S A . 85, 87, 163 Khan, K.U.A. 156, 158 Kibaara, D. 147, 152 Kdle, D. 54-55 Kilham, P. 55 Knox, N.G. 99, 101 Koiki, A. 85-86 Koura, R. 83-84 Kruse, G . 22, 116 Kruskal, J.B. 111, 115 Kudhongania, A.W. 146. 149, 152 Kurlanski, M. 15, 21
L Laevastu, T.17, 21 Lajtha, K.123-124 Lane, D E . 113, 115 Larkin, P.A. 15-17, 21 Larkins, H.A 17, 21 Latif, A.F.A. 5-6, 77-79, 119-121, 124,
126, 149, 151-152 Levin, S.A. 16, 21 Lewis, W.M., Jr. 55 Li, S. 135-138, 142 Lierrnan, M. 16) 2.1 Ligvoet, W. 147, 152 Lopes, S. 156, 158 Lorenzen, K. 138, 142 LOW, L.L. '17, 21-22 Ludwig. 1). 15, 21
M Mace, P.M. 16, 21 Mackay, A. 17: 21 hlackinson, S. 19, 22: 110, 114-115 hlaclachlan, A\j . 78-79 hladsen, J.D. 63, 65 Magnusson, K.G. 16, 22 Maguire, J.J. 15, 22 Maitland, P S 63-65 Maiyza, I.A. 29, 121 Mannini, P. 147, 152
Manshard. W 155, 158 Marasco. R J 22, 116 Marshall, B E 145, 147-149 151-152 Maslahat, Al-T~adad 100-101 Vasundire H 73-74 Mattheas l) R I5 22 May R M 21 McFeters. G A 41 Meeker, J E 64-65 Megard, R 0 54-55 Mehanna, S 99, 101 Melack, J M 54-55 Menon, A S 39.41 Mercer, M C 22 Methot, R D 16, 22 Mheen, I i W van der 135, 142 M~chener, R 123-124 Mdls, D 61, 65 Mmshull. J L 150, 152 Mitchell, D S 148 152 Mohamed. A A 25 Mohamed, 1 0 53, 57. 59 60 Mohamed, M S 141, 141, 150 152 Mohamed, S M 60 Moh~eddin, M M 99 Monakov, A V 73-74 Mons~, M 58 Moore, J A 61 65 Ivloreau, J 135, 142 Mugwagwa, M 148, 152 Munro, G 115 Murawsk~, S A 163-164 Murphy, G I 21 Murphy, K J 61-62, 65 Myers, R A 15
N Nagi, S.Z. 99, 101 Naguib, M . 91, 141, 143 Neal, P.R. 16, 21 Newman, G.G. 16, 21 Nomura, M. 129 Nottestad, L. 110, 114-115 Nsiku, E. 110, 114, 116
0 Ochurnba, P.B.O. 146-147, 152 Ogale, S.N. 134, 143 Oijen, M.J.P. van 146-147, 152 Olmos-Tomassini, M.E. 135, 142
176 Sustainable fish production in Lake Nasser
P Parma, A.M. 16, 22 Parsons, T.R. 33, 38 Patterson, G. 119, 126 Paugy, D. 150, 152 Pauly, D.M. 16-22, 88, 90, 109-110,
113-116, 162, 164 Pautzke, C. 22, 116 Pawaputanon, 0.135, 143 Pearce, F. 100-101 Pennock, S.M. 63-65 Petr, T. 135, 14.1, 152, 157, 158 Petterson, B. 62, 64 Pinkerton, E. 157-1 58 Pitcher, T.J. 15-16, 19-22, 109-110,
113-116, 119, 145, 147, 151-152, 161-164
Polovina, J.J. 17, 22 Pope, J.G. 16, 22 Porter, K G 43, 49 Postgate, J.R. 39, 41 Power, J.E. 115 Pre~kshot, 1). 22, 109-110, 113-116 Prosser, M.V. 55 Promse, G.A. 67, 74 Punt, A.E. 16, 22
Q Quinn, T.J. 16, 21-22, 115-116 Quiros, R. 135.136, 143
R Rabeh, S.A. 39-41 Ramberg, L 147, 152 Rashid, M.M. 3, 6 Reynolds: J E. 147, 152 Reynolds, M.L. 111, 116 Rigler, F.H. 123-124 Rizk, S.G. 40-41 Robarts, R.D. 54-55 Roberts, T.R. 149, 152 Rodhouse, P. 16, 21 Roest, F.C. 6 Rorslett, B. 61, 63-65 Round, F.E. 43, 49 Ryder, R.A. 137, 143, 162, 164 Kzoska, J . 6, 34, 38, 67, 73-74, 79
S Sa'ad, F.M. 9, 62, 64 Saad. M.B.A. 7, 155
Saijo, Y. 51, 55, 58 Saleh, A.M. 39, 41 Samaan, A.A. 51, 54-55 Schiemer, F. 147, 152 Schiffman, S.S. 111, 116 Schweigert, J.F. 115 SCOR-UNESCO Working Group 57-58 Sear, C. 126 Sharp, G.D. 21 Shenoda, B.Z. 91, 141, 143 Shepherd, J.G. 163-164 Sinclair, A. 15, 21 Sissenwine, M.P. 16, 22, 163-164 Sloman, K. 19, 22 Smith, B.D. 63-65 Smith, D.C. 21, 115 Smith, S.J. 109, 116 Sparre, P.J. 163-164 Springuel, I.V. 62, 65 SPSS Inc. 111,116 Stalans, L.J. 110, 111-112, 116 Statsoft Inc. 112, 116 Stefansson, G. 15, 21 Stephenson, R.L. 113, 115 Strickland, J.D.H. 33, 38 Sugunan, V.V. 134, 138, 143 Sullivan, P.J. 115-116 Sumaila, U.R. 115
T Tackholm, V. 61,65 Talling, J.F. 34, 38, 54-55, 67, 74 Taub, F.B. 79, 124 Tawfik, M.F.F. 29, 31 Tharwat, M.E. 81 Tiffany, L.H. 43, 49 Torres, F., Jr. 16, 20, 22 Triest, L. 61, 65
U Ulanowicz, R.E. 20, 22 Ulltang, 0. 17, 22 Ursin, E. 17, 21-22, 88, 90
v Valtysson, H. 115 Vasconcellos, M. 19, 22, 110, 114-115 Venema, S.C. 163-164 Verapat, C. 135, 143 Verma, S.R. 143
Viner, A.B. 47-49 Visser, J. 146, 152 Vollenweider, R.A. 51, 55
W Walloe, L. 22 Walters, C.J. 15-22, 109, 116, 162, 164 Wanmk, J.H. 147, 152 Warwick, R.M. 111-112, 115 Watson, R. 19, 22, 48 Watson, S. 47, 49 Weekes, A.J. 112, 115 Weisner, G . 63, 65 Welcornme, R.L. 133-135, 137-138, 143,
145, 150, 152 Wetzel, R.G. 67, 74, 11 9, 124 White, G.F. 99-101, 152 Whitehead, P.J.P. 146, 152 Wilcox, D.A. 64-65 Willman, R. 163-164 Wilson, S.D. 63, 65 Wish, M. 111, 115 Witte, F. 146-147, 152 Wood, R.B. 54-55 Wooster, M. 126 Worthington, E.B. 152 Wright, M. 115 WU, S. 136-138, 142
X Xu, G. 138, 142
Y Yamada, S. 85-86 Yamaguchi, Y. 85-86 Yarnold, P.R. 116 Ye, J. 138, 142 Young, FW 111, 116 Younes, T. 142
z Zaghloul, F.R. 58 Zhong, C.-I. 115
Author index 177

Appendix I. List of Participants
A b d Ellah, Radwan Gad E l Rab National lnstitute of Oceanography
and Fisheries I 0 I Kasr El Aini St,., Cairo
Egypt Fax: 0215941341 E-mail: [email protected]
Abdel Hadi,Yasser Mohamed International Center for Living Aquatic
Resources Management Abbassa,Abou-Hammad, Sharkia
Egypt Fax: 0551400497 E-mail: [email protected]
Abdullah, Mohammed Saif Food and Agriculture Organization Al-Eslah Al- Zerai St, Dokki, Cairo
Egypt Fax: 021349598 1 E-mail: [email protected]
Adam, Hussein A m m a r Fishery Management Center High Dam Lake Development
Authority PO. Box 129, Aswan
Egypt Fax: 0971480466
Agaypi, Morad Zaki High Dam Lake Development
Authority Fishery Management Center PO. Box 129, Aswan
Egypt Fax: 0971480466
Ahmed, Mahfuzuddin International Center for Living Aquatic
Resources Management P.O. Box 500 GPO 10670 Penang Malaysia Fax: 60416434463 E-mail: [email protected]
Ali, Magdi Mohamed Faculty of Science SouthValley University Aswan 8 1528
Egypt Fax: 0971480448- 480450
Badawi, Hussein Kame1 National lnstitute of Oceanography
and Fisheries I 0 I Kasr El Aini S t , Cairo
E ~ Y pt Fax: 0215941341 E-mail:[email protected]
Barrania,Ahmed lnstitute of National Planning Salah Salem Road Nasr City, Cairo
E ~ Y pt Fax: 021262 1 15 1 E-mail: Inp I O@idsc I .gov.eg
Born, B r a m Food and Agriculture Organization Viale delleTerme di Caracalla 00 100 Rome Italy Fax: 00 39 6 57053020 E-mail: [email protected]
Craig, John F. International Center for Living Aquatic
Resources Management Abbassa,Abou-Hammad, Sharkia
E ~ Y pt Fax: 0551400497 E-mail: [email protected]
Present address: Whiteside. Dunscore Dumfries Scotland Fax: 00414 1389820860
El-Shabrawy, Gamal National lnstitute of Oceanography
and Fisheries 10 1 Kasr El Aini St,., Cairo
Egypt Fax: 021594 134 1 E-mail: [email protected]
El-Shahat, Mohamed Fishery Management Center High Dam Lake Development
Authority PO. Box 129, Aswan
Egypt Fax: 0971480466
Fishar, Mohamed Reda A l i National lnstitute of Oceanography
and Fisheries 10 1 Kasr El Aini St., Cairo
Egypt Fax: 021594 134 1 E-mail: [email protected]
Goma, Rokaya Hussein Fishery Management Center High Dam Lake Development
Authority PO. Box 129, Aswan
E ~ Y pt Fax: 0971480466
Habib, Ol fa t Anwar Fishery Management Center High Dam Lake Development
Authority PO. Box 18, Aswan
E ~ Y pt Fax: 0971480466
Khalifa, Usama Said Ahmed National lnstitute of Oceanography
and Fisheries 10 1 Kasr El Aini St., Cairo
Egypt Fax: 021594 1341 E-mail: [email protected]
Appendix 1 179
Marshall, Brian University of Zimbabwe Harare Zimbabwe Fax: 00 263 4 333407 E-mail: [email protected]
Mohamed, Ahmed Abdel Rahman Fishery Management Center High Dam Lake Development
Authority PO. Box 129, Aswan
Egypt Fax: 0971480466
Mohamed, lbrahim Omar Fishery Management Center High Dam Lake Development
Authority PO. Box 129, Aswan
Egypt Fax: 0971480466
Mohieddin, M. Mohamed University of Menoufia l On El-Nasr St.,Apt. No. 403 New Maadi, Cairo
Egypt
Nomura, Minoru New Fish Development Association 2-5-5 Ryosei, Ayase Si Kanagwa 252- 1 126
Japan Fax: 00 8 1 467783969
Patterson, Graeme Natural Resources lnstitute University of Greenwich Central Avenue, Chatham Maritime Kent ME4 4TB United Kingdom Fax: 00 44 1 634 88355 1 E-mail: [email protected]
Pitcher,Tony G. Fisheries Centre University of British Columbia 2204 Main Mall,Vancouver, B.C. Canada V6T 1 24 Fax: 00 60 4 822 8434 E-mail:[email protected]
Rabeh, Saleh Ahmed National Institute of Oceanography
and Fisheries 10 1 Kasr El Aini S., Cairo
E ~ Y pt Fax: 0215941341 E-mail: [email protected]
Rowe, P. Roger International Center for Living Aquatic
Resources Management Abou-Hammad Sharkia, Abbassa
E ~ Y pt Fax: 0551400497 E-mail: [email protected]
Saad, Mohamed Bahaa Eldin Ahmed Mohamed Hydraulics Research lnstitute Delta Barrage, PC. I362 1 Egypt Fax: 0212189539 E-mail: [email protected]
Shenoda, Botros Zaki Fishery Management Center High Dam Lake Development
Authority PO. Box 129, Aswan
Egypt Fax: 0971480466
Tharwat, Mahmoud Ezzeldin Faculty of Agriculture Ain Shams University Shoubra El Kheima,Cairo
Egypt Fax: 021395 1779
180 Sustainable fish production in Lake Nasser
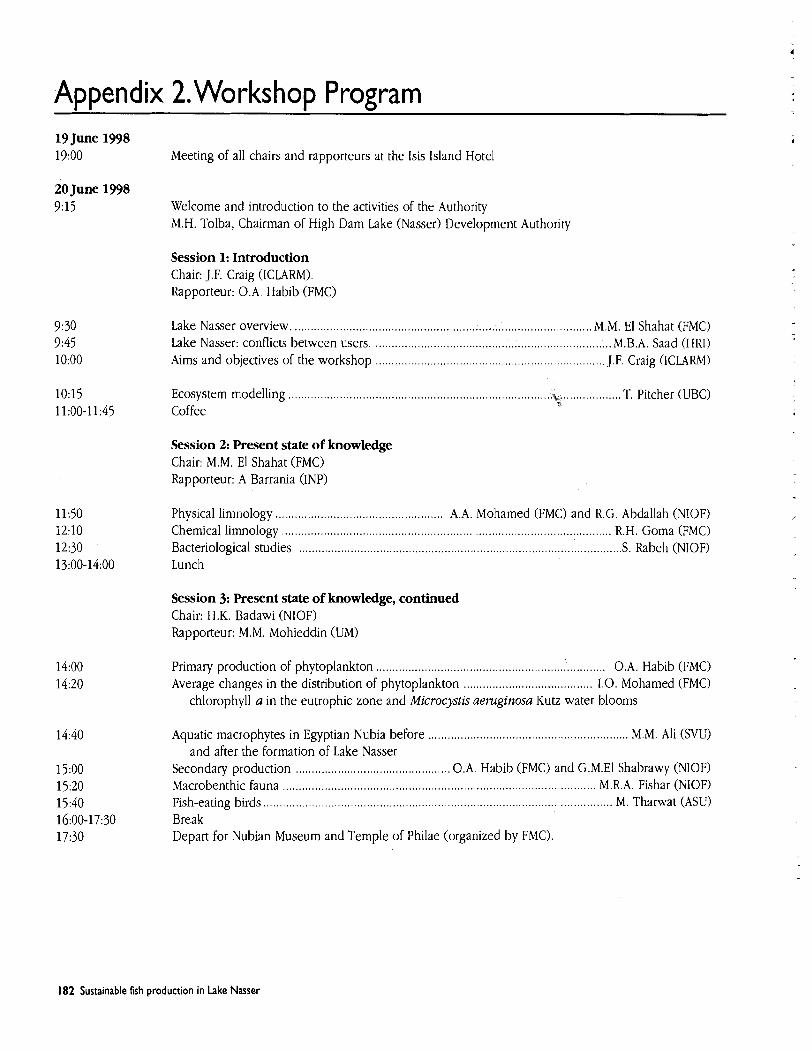
Appendix 2. Workshop Program 19 June 1998 19:OO Meeting of all chairs and rapporteurs at the Isis Island Hotel
20 June 1998 9:15 Welcome and introduction to the activities of the Authority
M.H. Tolba, Chairman of High Dam Lake (Nasser) Development Authority
Session 1: Introduction Chair: J.F. Craig (ICLARM). Rapporteur: O.A. Habib (FMC)
Lake Nasser overview. ............................................................................................ M.M. El Shahat (FMC) Lake Nasser: conflicts between users. ......................................................................... M.B.A. Saad (HRI)
....................................................................... Aims and objectives of the workshop J F Craig (ICLARM)
Ecosystem modelling ................................................................................................ T. Pitcher (UBC) Coffee
Session 2: Present state of knowledge Chair: M.M. El Shahat (FMC) Rapporteur: A Barrania (INP)
Physical limnology .................................................... A.A. Mohamed (FMC) and R.G. Abdallah (NIOF) .................................................................................................. Chemical limnology R.H. Goma (FMC)
Bacteriological studies ................................................................................................... S. Rabeh (NIOF) Lunch
Session 3: Present state of knowledge, continued Chair: H.K. Badawi (NIOF) Rapporteur: M.M. Mohieddin CUM)
Primary production of phytoplankton ....................................................................... O.A. Habib (FMC) Average changes in the distribution of phytoplankton ...................................... 1.0. Mohamed (FMC)
chlorophyll a in the eutrophic zone and Microcystis aeruginosa Kutz water blooms
.............................................................. Aquatic macrophytes in Egyptian Nubia before M.M. Ali (SVU) and after the formation of Lake Nasser
................................................ Secondary production O.A. Habib (FMC) and G.M.EI Shabrawy (NIOF) ......................................................... .................................... Macrobenthic fauna ... M.R.A. Fishar (KIOF)
....................................................................................................... Fish-eating birds M. Tharwat (ASU) Break Depart for Nubian Museum and Temple of Philae (organized by FMC).
182 Sustainable fish production in Lake Nasser
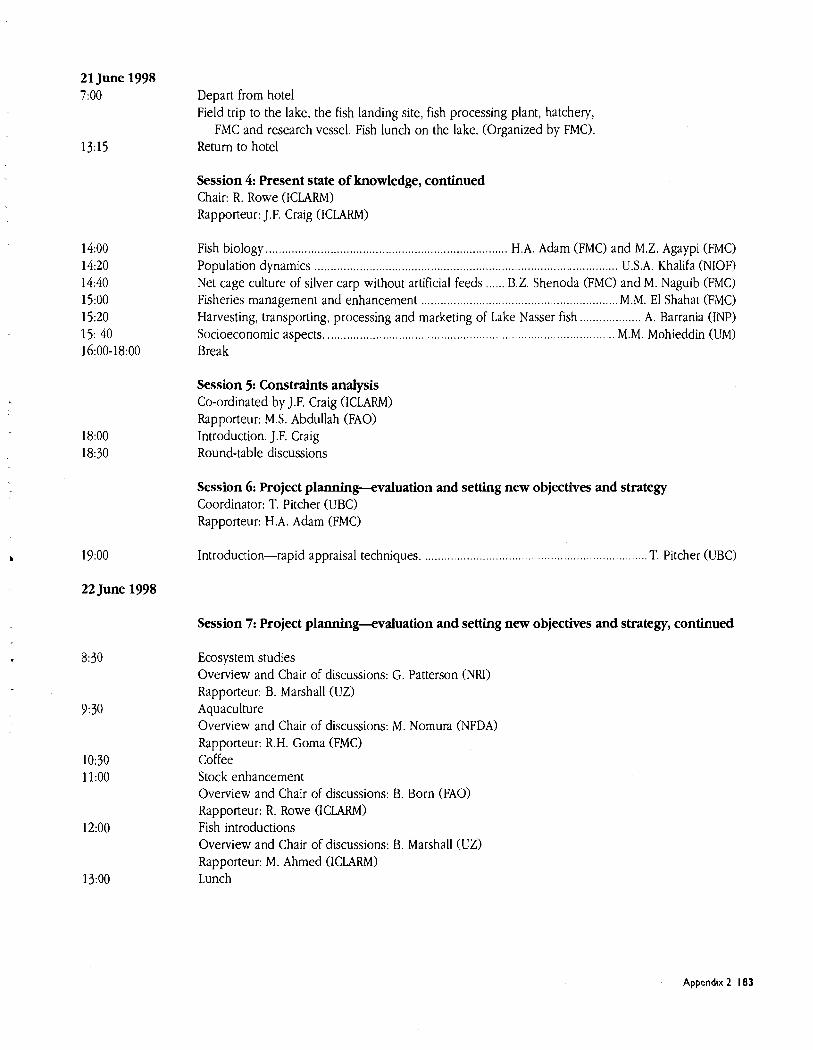
21 June 1998 7:OO
l9:OO
22 June 1998
Depart from hotel Field trip to the lake, the fish landing site, fish processing plant, hatchery,
FhlC and research vessel. Fish lunch on the lake. (Organized by FMC). Return to hotel
Session 4: Present state of knowledge, continued Chair: R. Rowe (ICLARM) Rapporteur: J.F. Craig (ICLARM)
Fish biology ........................................................................... H.A. Adam (FMC) and M.Z. Agaypi (FMC) Population dynamics ......................................................................................... US,A. Khalifa (NIOF) Net cage culture of silver carp without artificial feeds ...... B.Z. Shenoda (FMC) and M. Naguib (FMC) Fisheries management and enhancement ............................................................. M.M. El Shahat (FMC) Harvesting, transporting, processing and marketing of Lake Nasser fish ................... A. Barrania (INP) Socioeconomic aspects. ........................................................................................ M.M. Mohieddin (UM) Break
Session 5: Constraints analysis Co-ordinated by J.F. Craig (ICLARM) Rapporteur: MS. Abdullah (FAO) Introduction. J.F. Craig Round-table discussions
Session 6: Project planning-evaluation and setting new objectives and strategy Coordinator: T. Pitcher (UBC) Rapporteur: H.A. Adam (FMC)
Introduction-rapid appraisal techniques. ..................................................................... T. Pitcher (UBC)
Session 7: Project planning+valuation and setting new objectives and strategy, continued
Ecosystem studies Overview and Chair of discussions: G. Patterson (NRI) Rapporteur: B. Marshall (UZ) Aquaculture Overview and Chair of discussions: M. Nomura (IVFDA) Rapporteur: R.H. Goma (FMC) Coffee Stock enhancement Overview and Chair of discussions: B. Born (FA01 Rapporteur: R. Rowe (ICLARM) Fish introductions Overview and Chair of discussions: B. Marshall (UZ) Rapporteur: M. Ahmed (ICLARM) Lunch
Appendix 2 183
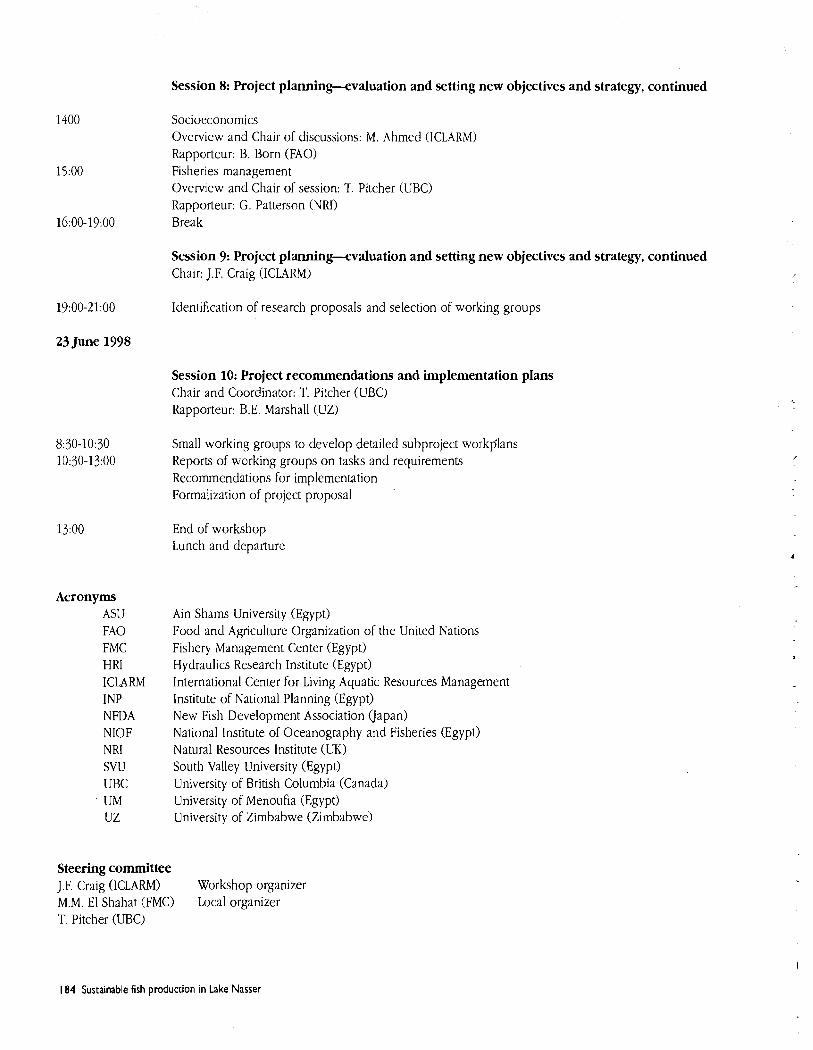
Session 8: Project planning-evaluation and setting new objectives and strategy, continued
19:OO-21:OO
23 June 1998
Acronyms ASU FA0 FMC HRI ICLARM INP NFDA NIOF NRI SVU UBC UM uz
Socioeconomics Overview and Chair of discussions: M. Ahmed (ICLARM) Rapporteur: B. Born (FAO) Fisheries management Overview and Chair of session: T. Pitcher (UBC) Rapporteur: G. Patterson (NRI) Break
Session 9: Project planning-evaluation and setting new objectives and strategy, continued Chair: J.F. Craig (ICLARM)
Identification of research proposals and selection of working groups
Session 10: Project recommendations and implementation plans Chair and Coordinator: T. Pitcher (UBC) Rapporteur: B.E. Marshall (UZ)
Small working groups to develop detailed subproject workglans Reports of working groups on tasks and requirements Recommendations for implementation Formalization of project proposal
End of workshop Lunch and departure
Ain Shams University (Egypt) Food and Agriculture Organization of the United Nations Fishery Management Center (Egypt) Hydraulics Research Institute (Egypt) International Center for Living Aquatic Resources Management Institute of National Planning (Egypt) New Fish Development Association (Japan) National Institute of Oceanography and Fisheries (Egypt) Natural Resources Institute (UK) South Valley University (Egypt) University of British Columbia (Canada) University of Menoufia (Egypt) University of Zimbabwe (Zimbabwe)
Steering committee J.F. Craig (ICLARM) Workshop organizer M.M. El Shahat (FMC) Local organizer T. Pitcher (UBC)
184 Sustainable fish production in Lake Nasser
~ I.~
" It,'fJ
" ""
r! If'!.1
11111
~ '
11
"of ' .'. . ,,'" '
(SO§tainablefish pr~uction in LakeNJ Editot;";;WOO~:lCI.ARij'CoQ,t'prof. 61, .
:coldgicafbasis ~~(J,map.ag~ment policy.j;F. d'I
..,'""1
'.
,I IN1EREST,-' 'f'
.'a::;:;;;::;III_~d
Ir
""
~
'I
'"
01
'.r-
il'j
i
ii' - I
,I....
..
II