Embed Size (px)
Citation preview

SUZUKI MOTOR CORPORATION
Winter, 2020

P 2
1. Company Outline
2. Mid-Term Management Plan
3. Car Business - India
4. Car Business - other markets
5. Environment/Safety Technologies
(Appendix)
Q3 FY2019 Summary
Agenda
P 3
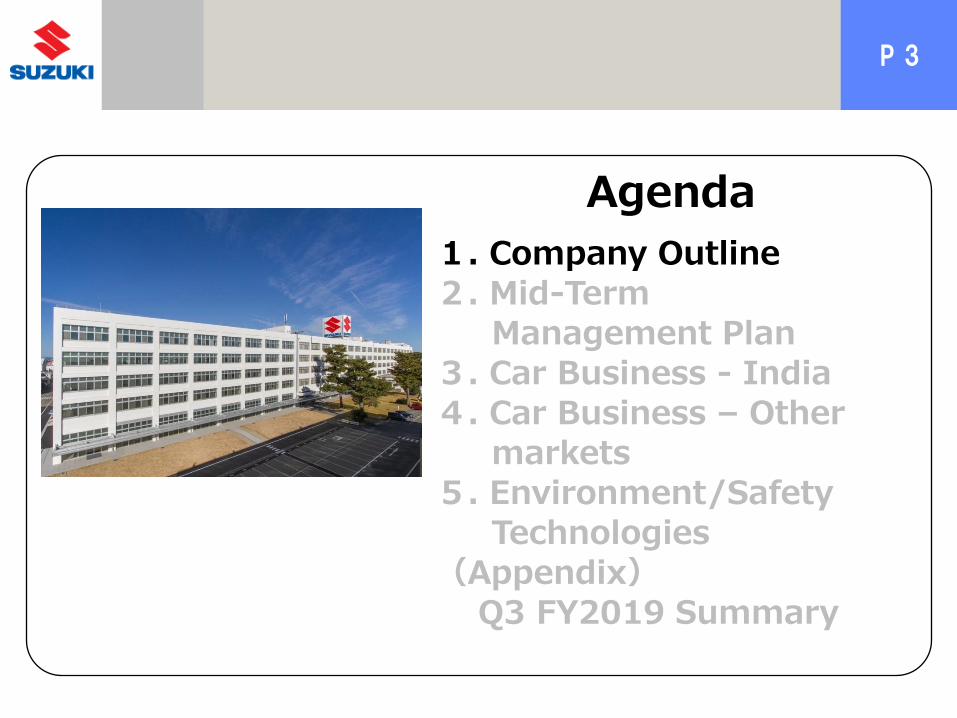
Agenda
1. Company Outline 2. Mid-Term
Management Plan 3. Car Business - India
4. Car Business – Other markets
5. Environment/Safety Technologies
(Appendix)
Q3 FY2019 Summary

P 4
1909 Suzuki Loom Works established 1920 Suzuki Loom Manufacturing Co. incorporated 1952 Started motorcycle business 1954 Name changed to Suzuki Motor Co., Ltd 1955 Started Automobile business 1965 Started Marine business 1968 First overseas motorcycle production (Thailand) 1975 First overseas automobile production (Pakistan) 1979 ALTO mini-vehicle debuts 1981 Business tie-up with General Motors(dissolved in 2008) 1983 Start of automobile production at Maruti Suzuki 1990 Name changed to Suzuki Motor Corporation 1993 WAGON R mini-vehicle debuts 2004 Launch of global strategic model, SWIFT 2013 Accumulated automobile sales reached 50 million 2015 New management and mid-term management plan “SUZUKI NEXT 100” 2016 Started exploration of business partnership with Toyota(Capital Alliance
Agreement in 2019)
Suzuki Loom Works, circa 1909
Place of foundation Nakajima-cho, Hamamatsu
Suzuki historical timeline

P 5
Japan
(Automobiles/Motorcycles/
Marine)
Hungary(Automobiles)
Thailand
(Automobiles/
Motorcycles/
Marine
28 production sites in 20 countries/regions
Production in 20 countries/regions outside Japan, mainly in Asia
U.S.(ATV)
Colombia (Motorcycles)
Egypt (Automobiles)
Vietnam (Automobiles/Motorcycles) Philippines (Motorcycles)
Major production facilities
China (Motorcycles)
Indonesia (Automobiles/Motorcycles)
Brazil (Automobiles/Motorcycles)
Pakistan (Automobiles/Motorcycles)
Myanmar (Automobiles)
India (Automobiles/Motorcycles)
P 6
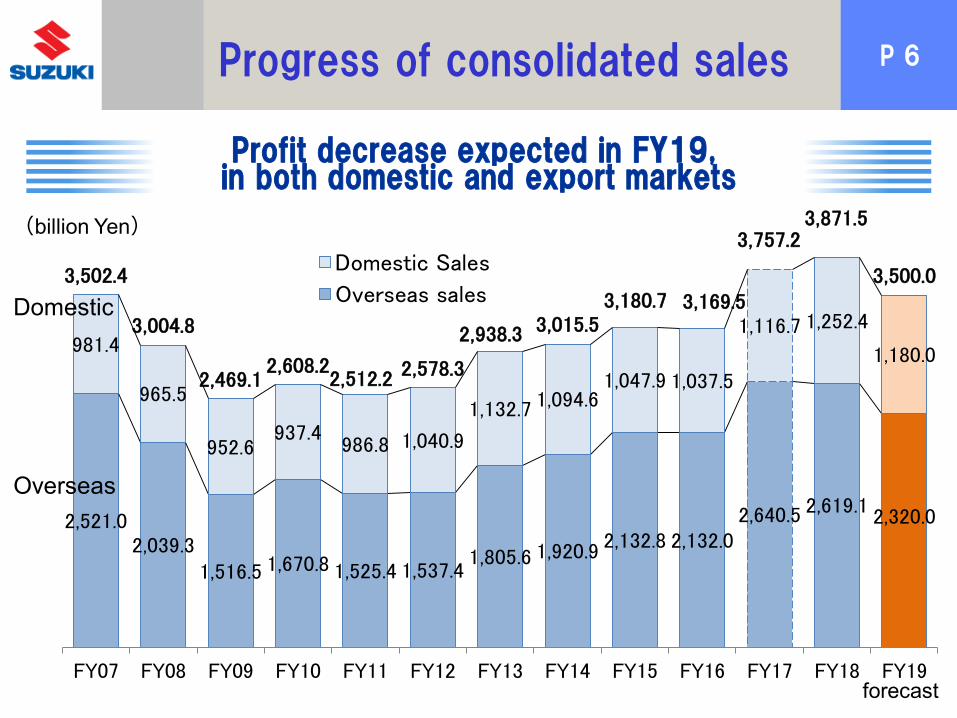
2,521.0 2,039.3
1,516.5 1,670.8 1,525.4 1,537.4 1,805.6 1,920.9 2,132.8 2,132.0
2,640.5 2,619.1 2,320.0
981.4
965.5
952.6 937.4
986.8 1,040.9
1,132.7 1,094.6 1,047.9 1,037.5
1,116.7 1,252.4
1,180.0
3,502.4
3,004.8
2,469.1 2,608.2
2,512.2 2,578.3
2,938.3 3,015.5 3,180.7 3,169.5
3,757.2 3,871.5
3,500.0
FY07 FY08 FY09 FY10 FY11 FY12 FY13 FY14 FY15 FY16 FY17 FY18 FY19
Domestic Sales
Overseas sales
(billion Yen)
Progress of consolidated sales
Profit decrease expected in FY19, in both domestic and export markets
Domestic
forecast
Overseas

P 7
0
50
100
150
200
(billion yen)
1979 Introduction of ALTO
Constantly profitable since 1950 FY2019 forecast
1993 Introduction of WAGON R
2002 Obtained majority of Indian and Indonesian production JVs
2004 Introduction of SWIFT
2008 Economic crisis
Note Figures from FY1950 to FY1976 are non-consolidated figures, FY1977 and onwards are consolidated figures
Progress of net income
Constant profit for almost 70 years: solid management
Stayed profitable through economic crisis of 2008
FY2018 result: 178.8

P 8
596 672 728 756 630 639 668 725 689
223 197 205 195 207 245 281 278 256 32
1,006 1,051 1,054 1,171 1,305 1,445 1,654 1,754 1,738
543 540 542 550 536
425 439
384
160 204 181 196 183 164
182 186
166 2,560 2,664 2,709 2,867 2,861 2,918
3,224 3,327
2,849
0
500
1,000
1,500
2,000
2,500
3,000
FY11 FY12 FY13 FY14 FY15 FY16 FY17 FY18 FY19
(1,000 units)
Decrease in Japan and Asia in FY19
North America
Progress of global car sales
forecast
Others Asia (excl.India) India Europe Japan
Others Asia (incl.India) Europe Japan

P 9
Agenda
1. Company Outline 2. Mid-Term
Management Plan 3. Car Business - India
4. Car Business – Other markets
5. Environment/Safety Technologies
(Appendix)
Q3 FY2019 Summary
• All-new “SWIFT” compact car • A global compact car representing Suzuki
Brand
SWIFT

P 10
3,180.7 3,169.5
3,757.2 3,871.5
3,700.0
2,861 2,918 3,224 3,327 3,400
1,501 1,367 1,580 1,743 2,000
FY15 FY16 FY17 FY18 FY19
Auto
mobile
s
Moto
rcyc
les
6.1% 8.4%
10.0% 8.4%
7.0%
9.6%
15.4% 17.9%
13.3%
10.0%
Net S
ale
s In June 2015, Suzuki announced “SUZUKI NEXT 100”, a 5-year plan for
FY2015-19 Key targets (Net sales, Operating profit ratio and ROE) achieved in FY17
≪Target≫
ROE(%)
Operating profit(%)
Sales units (1,000)
Consolidated sales (bln yen)
Mid-Term Management Plan Key targets achieved in FY17

P 11
FY17 FY18 FY19
Forecast
Annual payout per share 74 yen 74 yen 74 yen
Payout ratio 15.1% 18.7% -
5 yen 6 yen 7 yen 8 yen 10 yen 10 yen 15 yen 17 yen 30 yen
37 yen 37 yen
7 yen 7 yen 8 yen 10 yen 14 yen 17 yen
17 yen 27 yen
44 yen 37 yen 37 yen
12 yen 13 yen 15 yen 18 yen 24 yen 27 yen
32 yen
44 yen
74 yen 74 yen 74 yen
FY09 FY10 FY11 FY12 FY13 FY14 FY15 FY16 FY17 FY18 FY19
Year end Interim
FY18 Dividend : 74 yen
Dividend payout ratio 18.7% in FY18 = Target 15% or more(FY19)
・Target set at 15% or more, placing priority on growth investment
・Purchased own shares totaling 120 million (460.3 billion Yen) in FY15
・Recovery of equity capital ratio (40.9% as of Mar. 2019) is priority issue
・Net income decreased in FY18, but maintains dividend amount in view of
stable payout
Mid-Term Management Plan “Shareholder return” Dividend payout ratio
Forecast

P 12 Mid-Term Management Plan “Team Suzuki” Corporate Governance enhancement
FY12 FY13 FY14 FY15 FY16 FY17 FY18
Term
SupervisionExecution
Outside directors,total directors 2/7
Supporting div.
Seats
Corporatemission
Code of conduct
FY19
2 outside directorsamong 8 total
pre FY11
Toshihiro Suzuki
Committees
Advisory Committee on Personneland Remuneration, etc.
Corporate Governance Committee
Chairman
President
Board
of Directo
rs
New Mid-Term Management PlanSUZUKI NEXT 100(FY15~FY19)
Mid-Term Management Target(FY10~FY14)
Mid-TermManagement Plan
Vis
ion
Drafted Suzuki Activity Charter, Suzukiemployees Activity Charter in 2003
Suzuki Group Code of Conduct
Drafted "Mission Statement" in 1962
Osamu SuzukiChairman and President between
2008 and 2015
Term of board members shortened to 1 year from 2002
Introduced executive officers system in 2006
2 outside directorsamong 9 total
Not more than 30 from 1989
Corporate Governance Dept.Secretariat of Audit&Supervisory Board
Reduced to 15

P 13
Directors/Auditors after the 154th AGM (Nominees) Increase of one Outside Directors to total of 3 (incl. one female nominee)
Name Position Current position new nominees
Osamu Suzuki
Yasuhito Harayama
Toshihiro Suzuki
Osamu Honda
Masahiko Nagao
Masakazu Iguchi * Outside Director Toshiaki SuzukiManaging Officer & Executive General ManagerDomestic Marketing I, Domestic Marketing
Sakutaro Tanino * Outside Director Osamu Kawamura *Representative Director and Chairman,Chanson Cosmetics Inc.
Hideaki Domichi *Former Ambassador Extraordinary and Plenipotentiaryof Japan to India/Bhutan
Yuriko Kato *Representative Director and President,M2Labo. Inc.
Toyokazu Sugimoto
Masato Kasai
Norio Tanaka
Nobuyuki Araki
Norihisa Nagano
* Outside Directors
Auditors
Current members Management to be approved at 154th General Meeting(Nominees)Name
Directo
rs
Osamu SuzukiRepresentative Director and Chairman
Yasuhito HarayamaRepresentative Director and Vice Chairman
Toshihiro SuzukiRepresentative Director and President
Osamu HondaDirector and Senior Technical Executive
Masahiko NagaoDirector and Managing Officer
Toyokazu SugimotoAudit & Supervisory Board Member
Masato KasaiAudit & Supervisory Board Member
Norio TanakaAudit & Supervisory Board Member (Outside)
Nobuyuki ArakiAudit & Supervisory Board Member (Outside)
Norihisa NaganoAudit & Supervisory Board Member (Outside)
New
New
New
New
Mid-Term Management Plan “Team Suzuki” Corporate Governance enhancement

P 14
Objective…sustainable growth, increase enterprise value in the mid and long term Standard …following criteria is applied
Holdings …Appropriateness of individual cross-shareholdings (enhancement of
corporate value, capital costs) is examined by the Board of Directors every year Advance reduction of stocks to be sold
Exercise of voting rights
Recent disposals
Basic principles
Create business opportunity Business partnership
Establish, maintain or strengthen stable transaction and cooperation
Decision is to be made by respecting management policy of the investment company and in view of our mid-and long-term enterprise value
Mid-Term Management Plan “Capital Efficiency” Policy shareholding guidelines
Volkswagen AG 4,397 thousand shares (2015) SUBARU CORPORATION 13,690 thousand shares (2016) Asahi Group Holdings 527 thousand shares (2017)
P 15
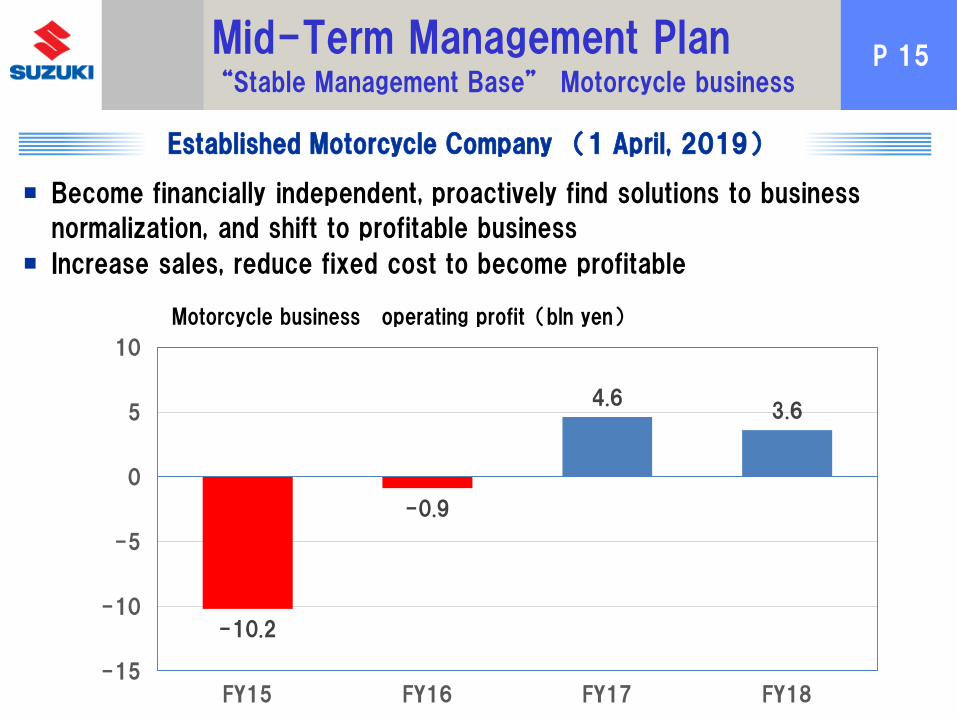
Become financially independent, proactively find solutions to business
normalization, and shift to profitable business Increase sales, reduce fixed cost to become profitable
-10.2
-0.9
4.6 3.6
-15
-10
-5
0
5
10
FY15 FY16 FY17 FY18
Motorcycle business operating profit(bln yen)
Mid-Term Management Plan “Stable Management Base” Motorcycle business
Established Motorcycle Company (1 April, 2019)

P 16
Suzuki cars selected as Top 3 of World Urban Car by WCA for 3 years in a row (2017 Ignis, 2018 Swift, 2019 Jimny)
Jimny won “2019 World Urban Car”, selected as top 3 of “2019 World Car Design of the Year”
Swift was awarded Car of the Year for 3 generations in Japan (RJC) and India (ICOTY)
Attractive big motorcycles introduced such as GSX-R/V-Strom series and KATANA
Automobiles
Motorcycles
Marine
New flagship outboard motor DF350A Innovation Award at 2017 IBEX Show
(Highest award count of 8 times for 4-stroke outboards)
Example of 4x DF350A (350×4=1,400ps)
Mid-Term Management Plan “Strengthening of Manufacturing” Creative Products

P 17
Disadvantages of local production ・Increased production cost due to multiple locations
・Duplicated jigs and facilities
Partial review of local production and distribution
Local model-Local production ・Part of Indian export production shifted to ASEAN
Designate production site by model ・Model sharing among ASEAN nations
・SWIFT production shifted from Europe to Japan
Indian production for ASEAN ⇒ Shift to production in ASEAN ・Allocate production capacity for Indian market needs
・Improve occupancy rate in ASEAN factories
Production of SWIFT in Europe ⇒ Japan ・Improve occupancy rate in Sagara Plant
・Improve efficiency of Hungarian plant by concentrating in production of a single platform
Effect
Improvement in profit in Japan, Europe and
Asia
Mid-Term Management Plan “Strengthening of Manufacturing”
Optimal Global Production
Optimal global production & procurement systems

P 18
Illustrate the future of 10-15 years in a
long term perspective instead of extension from the present, and plan backwards
Indian market has possibility to grow to a large market in circa 2030 Even in such a case, Suzuki intends to maintain the current market share of 50%
We need to determine, what we can do to realize the long term perspective Effectively allocate management resources of people, goods and money by
changing viewpoint Immediate actions required, to confront this challenge towards the future
Automobile sector faces a drastic change
Indian market in 2030
A challenge towards the future
Drafting new Management Plan on a long-term perspective
Drafting new management plan considering the above
30 25 20FY
Backcast
Drafting new Management Plan

P 19
Outline of cooperation with Toyota Environmental
technologies Safety
technologies Information
technologies
Mutual supply of products and components
Toyota’s strength: Provision of electrified technology and products
Supply HEV systems (Global) Penetration of HEV Technology (India), Supply Electrified vehicles (Europe)
Suzuki’s strength: Provision of compact vehicles and powertrains
Supply of Suzuki compact cars (India), Toyota to produce new Suzuki engine supported by Denso and Toyota at Toyota’s Polish plant (Europe), Supply of Suzuki cars produced in India (Africa)
Development & production leveraging strength of both companies
Joint development and supply of C segment MPV (India) Production of Vitara Brezza at Toyota plant in India (India)
Cooperation with Toyota
Supply of Suzuki developed EVs to Toyota in India
Development of compact,
ultrahigh-efficiency powertrain
Production of Suzuki vehicles in
Toyota plant in India
Supply of Suzuki models to
African markets
Mutual supply of products such as Hybrids in India
Toyota and Suzuki announced that the two companies entered into an agreement regarding a capital alliance, in order to establish and promote a long-term partnership between the two companies for promoting collaboration in new fields, including the field of autonomous driving. Toyota plans to acquire 24,000,000 shares of common stock in Suzuki (total value of JPY 96 billion) by underwriting the disposition of treasury shares by way of third-party allotment conducted by Suzuki. Suzuki plans to acquire, through purchase in the market, shares in Toyota equivalent to JPY 48 billion. Completion of Payment of 96 billion for Disposition of Treasury Shares on 9 December, 2019.
20 M
arc
h, 2019
28 A
ugust
, 2019

P 20 SDGs and CSR activities of the Suzuki Group
(ENVIRONMENT) Improvement in fuel efficiency, Development of
next-generation vehicles, Reduction of
substances of concern and use of their
alternatives, Purification of plant effluent,
Thorough water-saving at plants and offices,
Control of air pollution, Promotion of 3Rs,
Promotion of green procurement, Life Cycle
Assessment
(SOCIAL) Welfare vehicles,
A range of products equipped with Suzuki Safety
Support, Traffic safety
Suzuki Foundation, Suzuki Education and Culture
Foundation, Educational support activity, Suzuki Plaza,
Activities by domestic plants and distributors, and
overseas group companies, Diversity, Actions to
promote participation by women, With our business
partners, Improving corporate value (GOVERNANCE)
Efforts for compliance
P 21 Included in Indexes for ESG Investments
・Included in the FTSE4Good Index Series and the FTSE Blossom Japan Index for the first time in July 2019
●Global indexes for ESG (Environmental, Social, and Governance) investments
●About FTSE4Good Index Series ・Created by FTSE Russell, a wholly owned subsidiary of London Stock Exchange
Group, designed to measure the performance of companies demonstrating strong ESG practices
・Used by a wide variety of market participants focused on ESG investments to create and assess responsible investment funds and other products
●About FTSE Blossom Japan Index
・ESG index focused on Japanese firms ・Adopted by the world’s largest pension fund, Government Pension Investment Fund
(GPIF), for ESG investments
・The Company will continuously be conscious of disclosing the efforts for ESG, and enhance communication with the stakeholders to consistently promote sustainable enhancement of corporate value.

P 22
Compact SUV VITARA BREZZA (India)
・ Strong and dynamic exterior ・ Wide range of body colors including two
tone variant ・ Developed to meet the requirement and
needs in the Indian market
Agenda
1. Company Outline 2. Mid-Term
Management Plan 3. Car Business - India
4. Car Business – Other markets
5. Environment/Safety Technologies
(Appendix)
Q3 FY2019 Summary

P 23
23.9 27.8 37.1
53.6
73.4 77.2 75.0
42.2
28.0
14.9
15.6
426.1 426.4 486.1
564.4
669.1
781.0 830.3
622.9
545.0
0.0
10.0
20.0
30.0
40.0
50.0
60.0
70.0
80.0
0.0
100.0
200.0
300.0
400.0
500.0
600.0
700.0
800.0
FY12 FY13 FY14 FY15 FY16 FY17 FY18 FY18 FY19
43.6
<Apr.-Dec. YoY>
57.1 Oct.-Dec.
Apr.-Sept.
Maruti Suzuki Financial Performance
Decline in both sales and profit in 3Q FY19 3Q FY19 saw decline in sales and profit, mainly due to increase in
discounts, poor sales mix, cost to meet safety and emissions regulations, in addition to sales decrease Maruti Suzuki financial performance
※Figures post FY15 are based on IndAS (Indian IFRS)
Sales (rs. billion)
Net income (Rs. billion)
3Q results

P 24
1,006 1,051 1,054 1,171 1,305 1,444 1,643 1,730 1,308 1,065
1,622 1,607 1,450 1,430 1,484
1,603 1,644 1,648
1,225 1,053
2,628 2,658 2,504 2,601 2,790
3,047 3,288 3,377
2,533
2,118
38.3% 39.5%
42.1% 45.0% 46.8% 47.4%
50.0% 51.2% 51.7% 50.3%
FY11 FY12 FY13 FY14 FY15 FY16 FY17 FY18 FY18 FY19
Maruti Others Share
<Apr.-Dec. YoY>
Progress of Car Sales in India
Wholesale of Maruti and market total
3Q FY19 saw decrease YoY due to overall market decline Oct.-Dec. results were positive due to festive season demand
Wholesales 407k units (+0.4% YoY) Retail sales 501k units (+1.0% YoY)
1,000 units
※Wholesale volume excluding commercial vehicles

P 25
426 433 414 427 369 304 178
496 542 585 748 872
641 593
33 54 64
59 46
36
20
68 94
196
254 264
194
184
129 143
152
155 179
132
89
1,171 1,305
1,444
1,643 1,730
1,308
1,065
36% 33% 29% 26%
21% 23% 17%
0
500
1,000
1,500
2,000
FY14 FY15 FY16 FY17 FY18 FY18 FY19
Vans
Utility vehicles
Mid-Size
Compact
Mini
<Apr.-Dec. YoY>
Maruti Suzuki Sales of automobiles by model type
Change in model mix in the domestic market New Wagon R is now classified as compact, and proportion of Mini further
decreased
※Wholesale volume excluding commercial vehicles
(1,000 units)

P 26
DZIRE (1200ccGE, 1300ccDE)
BALENO (1200ccGE,1300ccDE)
IGNIS (1200ccGE)
S-CROSS (1300ccDE)
SWIFT (1200ccGE, 1300ccDE)
CELERIO (1000ccGE)
Utility vehicles
Mini Compact
Mid-Size
CIAZ (1500ccGE/DE, 1300ccDE)
ALTO 800 (800ccGE)
VITARA BREZZA (1500ccGE ,1300ccDE )
NEW
WAGON R (1000ccGE,1200ccGE)
ERTIGA (1500ccGE/DE,1300ccDE)
ALTO K10 (1000ccGE)
XL6 (1500ccGE)
NEW
S-PRESSO (1000ccGE)
NEW
NEW
NEW
Maruti Suzuki cars
Lineup of models

P 27
Strengthen Dealer Network … 4 sales channels
Maruti Suzuki Arena ・Urban (Large dealers, site to be provided by Maruti) ・Rural (Small/Mid-size dealers, Circuit service)
NEXA ・Premium car dealership
Commercial ・SUPER CARRY pickups
True Value ・New concept pre-owned car dealerships ・264 dealerships as of end Dec. 2019
Strengthen Sales Network
SUPER CARRY
Sales Outlets
40 190 310 322 127 252 316 360 370 1,619
1,820 2,020
2,121 2,264 2,349 1,619
1,947 2,312
2,627 2,934 3,041
0
1000
2000
3000
Mar. 15 Mar. 16 Mar. 17 Mar. 18 Mar. 19 Dec. 19
Arena
NEXA
Comercial
Model dealership
Large ARENA dealership
Mid-size ARENA dealership
Small-size ARENA dealership

P 28
Gujarat Plant A began its operations (Feb. 2017) Gujarat Plant B began its operations (Jan. 2019) Plant C planned (SOP July 2020)
700 700 700
800 800 800
250 250 250 250 250
250
0
1000
2000
Existing +Plant A +Plant B
1,500
2,000 1,750
Gujarat Plant C 〃 B 〃 A
(17.2) (19.1)
Manesar Plant Gurgaon Plant
750
JV with Toshiba and Denso Constructed in supplier park next to Gujarat Plant Penetration of Hybrid vehicles will contribute to
environmental issues in India
Production of Lithium-ion batteries in India
Strengthen Production Base
Start-up of Gujarat Plant
Production capacity in India (2 shifts, 1,000 units)
⇨Total 750,000 units p.a.

P 29
Ceremony held in Sep.2017 among the events during PM Abe’s visit to India
Participation of PM Abe, PM Modi and 5,000 government and business people
Suzuki is committed to Indian Government’s “Make in India” and “Skill India” initiative, and contribute to growth of the Indian automotive industry
Ceremonies for opening of Gujarat Plant and
cornerstone laying of lithium-ion battery plant
Development of EV
Started field testing of 50 prototype vehicles from October 2018
Feedback will be incorporated in future EV production
Proto-type EV
Expansion of production capacity and development of EV in India

P 30
VITARA
• Carries forward the SUV excellence that Suzuki has nurtured over the years
• Suzuki’s latest compact SUV that embodies advances that meet diverse contemporary needs
• Advanced safety technologies and outstanding fuel economy
Agenda
1. Company Outline 2. Mid-Term
Management Plan 3. Car Business - India
4. Car Business – Other markets
5. Environment/Safety Technologies
(Appendix)
Q3 FY2019 Summary

P 31
In addition to decrease in 1H production due to restructuring of final inspection structure, typhoon disaster, consumption tax increase in 2H resulted in decrease YoY Mini: -4.7% YoY Compact: -10.1% YoY
Reduced production, typhoon disaster and tax increase resulted in decrease YoY
Automobile sales: Japan
(1,000 units)
Sales of Mini-cars and Compact Cars in Japan Market share of mini-vehicles <Apr.-Dec. YoY>
80 85 81 76 81 107 112 131 93 83
516 586 647 679 549 532 556 594
421 401
596
672 728
756 630 639
668 725
514 485
30.5% 29.7% 28.6% 31.3% 30.3% 30.9% 29.9% 30.9% 30.9% 29.8%
FY11 FY12 FY13 FY14 FY15 FY16 FY17 FY18 FY18 FY190
250
500
750
Mini
Compact

P 32
Following 18 Oct., reported implementation status of preventive measures to MLIT (Final inspection operations)
Complete measures in the current inspection lines where inspectors can stably conduct accurate inspection by Mar. 2020 ⇒ Normalize production • Management of final inspection process and operation
…【Operating (partially prepared)】 • Collection of voices from worksite …【Operating】 • Maintenance of rules …【Conducted】 • Reduction of inspectors’ load …【Increasing inspectors】 • Improvement and reinforcement of inspection facilities…【Conducted】
Further improve from FY2020 and onward, including to unify layout of inspection lines so as to inspect in the same way throughout all plants, secure number of certified inspectors in preparation of future production changes, and meet inspections for changes in cars with new technologies
(Companywide measures) • Establishment of permanent exhibit area to study improper conducts
【by Mar. 2020】 • Handing out Compliance Handbook to all employees 【by Feb. 2020】 • Introduction of service to feedback revision of laws to in-house regulations in
timely manner 【by Mar. 2020】 • Fulfill and continuously conduct training for improving communication, etc.
Implementation Status of Preventive Measures regarding the Improper Conducts of the Final Vehicle Inspection in the Plants
Conducted the second report to the Japanese Ministry of Land, Infrastructure, Transport and Tourism (MLIT) on 31 January

P 33
3Q FY19 resulted in 107% YoY
Increase of sales in Germany, France, Italy and Spain resulted in 107% YoY in total of 5 European markets
96 87 96 99 107
128 142 146
104 111
1.0% 1.0% 1.0% 1.0% 1.0%
1.1% 1.3% 1.3%
1.3% 1.3%
0
50
100
150
FY11 FY12 FY13 FY14 FY15 FY16 FY17 FY18 FY18 FY19
<Apr.-Dec. YoY>
Automobile sales: Europe
* Total of retail sales in UK, Germany, France, Italy and Spain
Share
Sales in 5 major European markets* (1,000 units)

P 34
100 86 76 89 133 112
137 136 100
75
61.2% 58.8%
54.7% 55.3%
59.5%
53.4% 55.2% 54.2% 53.7%
61.7%
0
50
100
150
FY11 FY12 FY13 FY14 FY15 FY16 FY17 FY18 FY18 FY19
<Apr.-Dec. YoY>
(千台)
Suzuki first started overseas production (1975)
Taxis are called “SUZUKI” in Pakistan
3Q FY19 saw increase in interest rates, price hike owing to weak Rupees, and was 75% YoY
Launched ALTO in Apr. same car as sold in Japan
Suzuki secures majority market share
Automobile sales: Pakistan
Sales in Pakistan
Special taxi demand
Share (1,000 units)

P 35
Due to decline in total market since 18 Nov., 3Q FY19 resulted in 91% YoY
In February, the XL7 a three-row, seven-seater crossover vehicle that combines the design of an SUV with the convenience of an MPV was launched.
94
142 165 148
120 92 114 111
88 79
10.3%
12.2% 13.3% 12.9%
11.6%
8.6%
10.3% 9.9% 10.2% 10.1%
0
50
100
150
FY11 FY12 FY13 FY14 FY15 FY16 FY17 FY18 FY18 FY19
(1,000 units)
Automobile sales: Indonesia
Retail Sales in Indonesian Market(figures pre FY12 are wholesales)
Share
Decline in total market, tough condition continues
<Apr.-Dec. YoY>

P 36
1 1 1 1
4
12
9 11
0
5
10
FY12 FY13 FY14 FY15 FY16 FY17 FY18 FY18 FY19
Retail Sales in Myanmar
Jan. 2018: Thilawa plant SOP
Automobile sales: Myanmar
Ertiga and Swift selling well
Gradual import restrictions of used cars from Apr. 2017 resulted in growth of new car market
3Q FY19 saw 118% YoY owing to sales of Ertiga and Swift
(1,000 units)
<Apr.-Dec. YoY>

P 37
NEW Hybrid system (Equipped on SOLIO models) ・ A Suzuki unique parallel hybrid system
combining Motor Generator Unit (MGU) with Auto Gear Shift (AGS)*
・ MGU supplements traction during gear shift, enabling smooth acceleration
* Manual transmission with automatic gearshift and clutch operation by electro hydraulic actuator
Agenda
1. Company Outline 2. New Mid-Term
Management Plan 3. Car Business - India
4. Car Business – Other markets
5. Environment/Safety Technologies
(Appendix)
Q3 FY2019 Summary
P 38
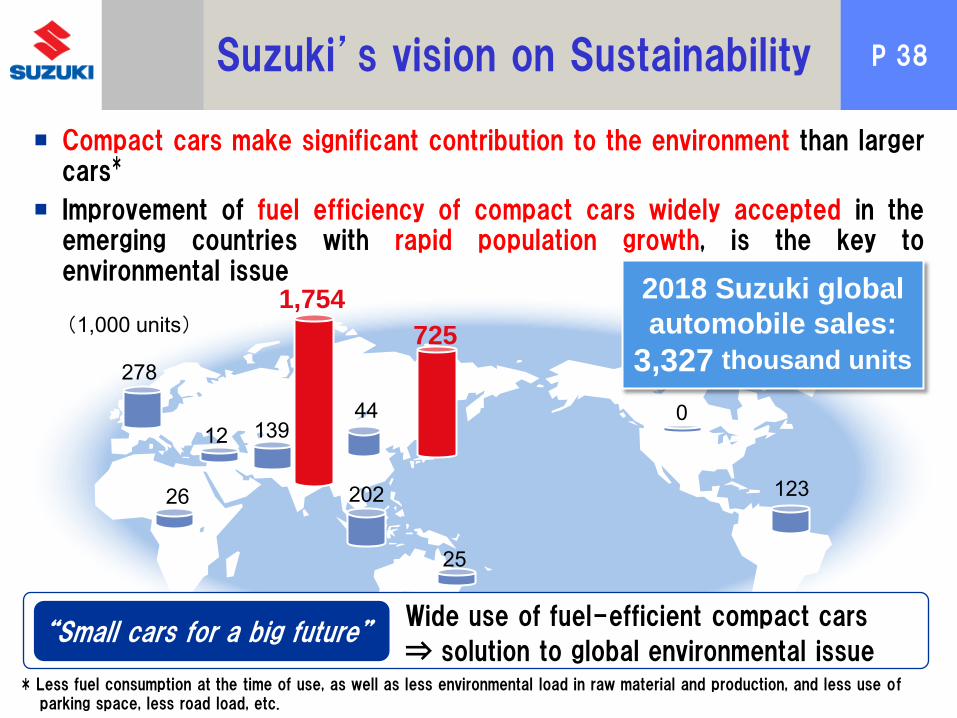
1,754
725
202
278
0
123 26
25
12 44
139
2018 Suzuki global
automobile sales:
3,327 thousand units (1,000 units)
Suzuki’s vision on Sustainability
Compact cars make significant contribution to the environment than larger cars*
Improvement of fuel efficiency of compact cars widely accepted in the emerging countries with rapid population growth, is the key to environmental issue
“Small cars for a big future” Wide use of fuel-efficient compact cars
⇒ solution to global environmental issue * Less fuel consumption at the time of use, as well as less environmental load in raw material and production, and less use of
parking space, less road load, etc.

P 39
Improvement of powertrain
Lightweight New Lightweight Platform
Electrification
Introduction with ALTO (weight reduction of 60kg)
Sustainable Technologies
New SWIFT (weight reduction of 120kg)
SOLIO IGNIS
WAGON R
SWIFT ALTO
0.8L 2-cylinder diesel engine DDiS Engine
Proto-type EV (India)

P 40
Sales of automobiles with hybrid systems (Thousand units)
FY16 Global Sales FY17 Global Sales FY18 Global Sales
Hybrids % Hybrids % Hybrids %
Japan 639 287 44.9% 668 350 52.4% 725 382 52.7%
India 1,445 85 5.9% 1,654 85 5.2% 1,754 149 8.5%
Others 835 17 2.0% 902 27 3.0% 848 29 3.5%
Total 2,918 389 13.3% 3,224 462 14.3% 3,327 561 16.9%Note: Hybrid cars include mild hybrid, S-enecharge and SHVS Hybrid sales in Others are export from Japan and India
System configuration of hybrid system
Hybrid cars account for 17% of global sales*
Sales of Suzuki hybrid cars
System configuration of mild hybrid system
ISG (Generator with motor function)
Exclusive lithium ion battery Reducer AGS (Auto Gear Shift) Power Pack

P 41
New Hustler for Japanese market equipped with latest advanced safety technologies
・Safety Support Car S Wide certification ・Advanced Emergency Brake Support (AEBS) certification
・Dual camera brake support (day/night) ・Reverse mode brake support
SUZUKI SAFETY SUPPORT Suzuki's Advanced Safety Technologies
Preceding car departure notice
Weaving alert function
Dual camera brake support
Lane departure warning
Traffic sign recognition
Adaptive cruise control
Lane departure prevention
High beam assist
Camera for 360° view
Unintended start prevention
Unintended start prevention (rear)
Reverse mode brake support
Collision mitigation brake Safety Support Car S Wide

P 42
・A new concept compact crossover wagon XBEE launched in Japan in December 2017
・Combination of utility of a wagon with Fun element of an SUV
・Equipped with Suzuki Safety Support preventive safety technologies
・Rated as Support car S Wide in the Safety Support Car ratings
Agenda
1. Company Outline 2. New Mid-Term
Management Plan 3. Car Business - India
4. Car Business – Other markets
5. Environment/Safety Technologies
(Appendix)
Q3 FY2019 Summary
XBEE

P 43 3Q FY2019 Highlights
FY2019 9 months FY2018 9 months
(’19/4-12) (’18/4-12) Ratio
Net Sales 2,626.1 2,838.8 -212.7 -7.5% First decrease in 3 periods (since Dec. 2016)
Operating Income 170.4 256.5 (Margin) (6.5%) (9.0%)
Ordinary Income 194.8 306.1 (Margin) (7.4%) (10.8%)
Net Income* 116.6 180.8 (Margin) (4.4%) (6.4%)
・Decreased net sales …Decrease in sales in India and Pakistan, impact of yen appreciation, etc.
・Decreased operating income…Appreciation of yen and increase in various expenses, in addition to decreased net sales
・Decreased ordinary income …Decrease in interest income in India, etc., in addition to decreased operating income
Automobile 2,160 2,480 -320 -12.9% Decrease in India, Japan, Pakistan, etc.
Motorcycle 1,344 1,307 +36 +2.8% Increase in India, the Philippines, etc.
WorldwideSales
Volume(Thousand
-units)
-36.4%
Decreased for the secod consecutive periodConsoli-dated
FinancialResults
(Billions ofyen)
First decrease in 8 periods (since Dec. 2011)
First decrease in 5 periods (since Dec. 2014)
Record
-64.2 -35.5%
Change
-86.1 -33.6%
-111.3
… Kept unchanged ・Kept unchanged from the previous forecast on 10 October
Third Quarter Results
*Net income attributable to owners of the parent
Full Year Forecast
… Lower earnings on lower sales

P 44 Trends in Operating Results by Quarters
85.1 87.8 86.9
114.4 116.5
82.0
58.0 67.9
62.7 55.9 51.8
869.3 961.8
893.8
1,032.3 987.5
941.9 909.4
1,032.7
907.5 847.9 870.7
0.0
40.0
80.0
120.0
160.0
1Q 2Q 3Q 4Q 1Q 2Q 3Q 4Q 1Q 2Q 3Q0.0
300.0
600.0
900.0
1,200.0Net Sales
Operating Income
(Net Sales)
FY2017 FY2018 FY2019
(Operating
Income) (Billions of yen) Trends in Operating Results by Quarters
Slowdown since 2Q of FY2018, partly owing to production decrease in Japan, in addition to slowdown in Indian automobile continuing from prev. year

P 45 Net Sales: 3Q FY19
FY2019
9 months
('19/4-12)
FY2018
9 months
('18/4-12)Change
FY2019
9 months
('19/4-12)
FY2018
9 months
('18/4-12)Change
FY2019
9 months
('19/4-12)
FY2018
9 months
('18/4-12)Change
FY2019
9 months
('19/4-12)
FY2018
9 months
('18/4-12)Change
Japan total 832.7 870.4 -37.7 15.4 14.7 +0.7 13.4 10.9 +2.5 861.5 896.0 -34.5
764.1 787.5 -23.4 15.4 14.7 +0.7 13.4 10.9 +2.5 792.9 813.1 -20.2
OEM 68.6 82.9 -14.3 68.6 82.9 -14.3
1,544.4 1,726.2 -181.8 166.8 167.5 -0.7 53.4 49.1 +4.3 1,764.6 1,942.8 -178.2 -78.2
Europe 315.8 329.4 -13.6 25.1 26.5 -1.4 13.2 11.2 +2.0 354.0 367.1 -13.1 -23.3
N. America 1.0 0.9 +0.1 20.4 21.1 -0.7 26.9 25.7 +1.2 48.4 47.7 +0.7 -1.2
Asia 1,069.2 1,230.4 -161.2 97.1 96.2 +0.9 5.7 4.8 +0.9 1,172.0 1,331.4 -159.4 -44.0
India 807.7 947.0 -139.3 47.7 40.7 +7.0 0.4 0.4 -0.0 855.8 988.1 -132.3 -27.4
Other 261.5 283.4 -21.9 49.4 55.5 -6.1 5.3 4.4 +0.9 316.2 343.3 -27.1 -16.6
Other 158.4 165.5 -7.1 24.2 23.7 +0.5 7.6 7.4 +0.2 190.2 196.6 -6.4 -9.7
Grandtotal 2,377.1 2,596.6 -219.5 182.2 182.2 -0.0 66.8 60.0 +6.8 2,626.1 2,838.8 -212.7 -78.2
of whicheffect of
ForEX ratesconversion
-6.0 -78.2-1.5-70.7
Total
Suzukibrand
Overseastotal
of whicheffect of
ForEX ratesconversion
MotorcycleAutomobile Marine, etc.(Billionsof yen)
Note: North America…United States and Canada Automobile in North America…sales of parts and accessories, etc.
Asia, esp. Indian automobile net sales largely decreased

P 46
% %
Net Sales 2,377.1 2,596.6 -219.5 -8.5% Net Sales 1,471.3 1,551.0 -79.7 -5.1%OperatingIncome 156.6 244.1 -87.5 -35.9%
OperatingIncome 91.9 112.6 -20.7 -18.3%
(%) (6.6%) (9.4%) (%) (6.2%) (7.3%)
Net Sales 182.2 182.2 0.0 - Net Sales 430.5 434.5 -4.0 -0.9%OperatingIncome 0.0 0.1 -0.1 -
OperatingIncome 15.1 14.7 0.4 +2.8%
(%) (0.0%) (0.1%) (%) (3.5%) (3.4%)
Net Sales 66.8 60.0 6.8 +11.3% Net Sales 1,266.9 1,419.7 -152.8 -10.8%
OperatingIncome 13.8 12.3 1.5 +12.9%
OperatingIncome 54.1 121.6 -67.5 -55.5%
(%) (20.7%) (20.4%) (%) (4.3%) (8.6%)
Net Sales 2,626.1 2,838.8 -212.7 -7.5% Net Sales 138.4 130.2 8.2 +6.3%OperatingIncome 170.4 256.5 -86.1 -33.6%
OperatingIncome 5.6 4.3 1.3 +30.8%
(%) (6.5%) (9.0%) (%) (4.1%) (3.3%)
Change
Mar
ine
Asi
a
Tota
l
Oth
ers
bln yenChange
Moto
rcyc
les
Japan
Auto
mobile
s
Euro
pe
FY20199 months
('19/4-12)
FY20189 months
('18/4-12)
FY20199 months
('19/4-12)
FY20189 months
('18/4-12)
Automobiles, Japan and Asia showed significant decrease 《Results by Geographical Areas》 《Results by Business Segment》
Operating Results by Segment: 3Q FY19
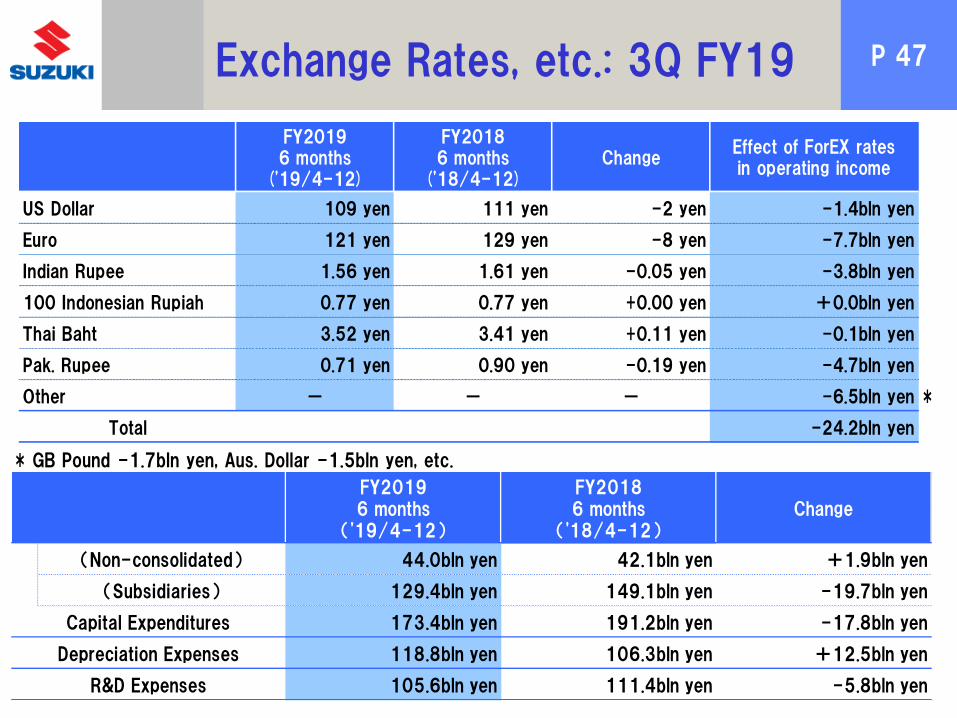
P 47
(Non-consolidated) 44.0bln yen 42.1bln yen +1.9bln yen
(Subsidiaries) 129.4bln yen 149.1bln yen -19.7bln yen
173.4bln yen 191.2bln yen -17.8bln yen
118.8bln yen 106.3bln yen +12.5bln yen
105.6bln yen 111.4bln yen -5.8bln yen
Depreciation Expenses
R&D Expenses
Change
Capital Expenditures
FY20196 months
('19/4-12)
FY20186 months
('18/4-12)
US Dollar 109 yen 111 yen -2 yen -1.4bln yen
Euro 121 yen 129 yen -8 yen -7.7bln yen
Indian Rupee 1.56 yen 1.61 yen -0.05 yen -3.8bln yen
100 Indonesian Rupiah 0.77 yen 0.77 yen +0.00 yen +0.0bln yen
Thai Baht 3.52 yen 3.41 yen +0.11 yen -0.1bln yen
Pak. Rupee 0.71 yen 0.90 yen -0.19 yen -4.7bln yen
Other - - - -6.5bln yen *
Total -24.2bln yen
Change
FY20186 months
('18/4-12)
FY20196 months
('19/4-12)
Effect of ForEX ratesin operating income
* GB Pound -1.7bln yen, Aus. Dollar -1.5bln yen, etc.
Exchange Rates, etc.: 3Q FY19

P 48
Production Sales
Change % Change %
<Automobiles>696 760 -64 -8.4% 485 514 -29 -5.7%
122 125 -2 -2.0% 215 201 +14 +6.7%
1,381 1,652 -271 -16.4% 1,325 1,623 -298 -18.4%
(1,167) (1,381) (-214) (-15.5%) (1,083) (1,325) (-242) (-18.3%)
1 2 -0 -21.1% 135 142 -6 -4.5%
2,200 2,539 -338 -13.3% 2,160 2,480 -320 -12.9%
<Motorcycles>68 83 -15 -18.0% 38 43 -5 -12.3%
- - - - 32 34 -2 -6.0%
2 3 -1 -21.8% 28 28 -0 -0.9%
1,209 1,185 +24 +2.0% 1,110 1,073 +37 +3.5%
46 39 +7 +18.3% 136 129 +7 +5.3%
1,324 1,309 +16 +1.2% 1,344 1,307 +36 +2.8%
Japan
(1,000units)
FY20199 months
('19/4-12)
FY20189 months
('18/4-12)
FY20199 months
('19/4-12)
FY20189 months
('18/4-12)
Japan
EuropeN. America
Asia
Others
Total
Europe
Asia(India)
Others
Total
Production and Sales: 3Q FY19
Decreased YoY owing to decrease in production and sales in India and Japan

P 49 Full year forecast (Overview)
Forecast('19/4-'20/3) ('18/4-'19/3) Change Ratio ('19/4-'20/3) Change Ratio
Net Sales 3,500.0 3,871.5 -371.5 -9.6% 3,900.0 -400.0 -10.3%
Operating Income 200.0 324.4 330.0
(Margin) (5.7%) (8.4%) (8.5%)
Ordinary Income 220.0 379.5 340.0
(Margin) (6.3%) (9.8%) (8.7%)
Net Income* 140.0 178.8 200.0
(Margin) (4.0%) (4.6%) (5.1%)
Automobile 2,849 3,327 -478 -14.4% 3,340 -491 -14.7%
Motorcycle 1,771 1,745 +26 +1.5% 1,825 -54 -3.0%
・Decrease in net sales… Decrease year-on-year and from original forecast owing to production decrease in Japan and decrease in automobile sales in India ・Decrease in operating income…Decrease partly owing to ForEX, in addition to decrease in net sales ・Decrease in ordinary income… Expansion of decrease amount year-on-year partly owing to decrease in interest income in India ・Decrease in net income*… Decrease amount shrinks year-on-year owing to accounting of \81.3 billion as extraordinary losses in the previous year
Comparison with FY 2018
-130.0 -39.4%
-120.0 -35.3%
-60.0 -30.0%
WorldwideSales
Volume(Thousand
units)
-42.0%
Consoli-dated
FinancialResult
(Billions ofyen)
Comparison with original forecast
-38.8 -21.7%
-124.4 -38.3%
-159.5
*Net income attributable to owners of the parent
Full Year Forecast … Kept unchanged from 10 October forecast
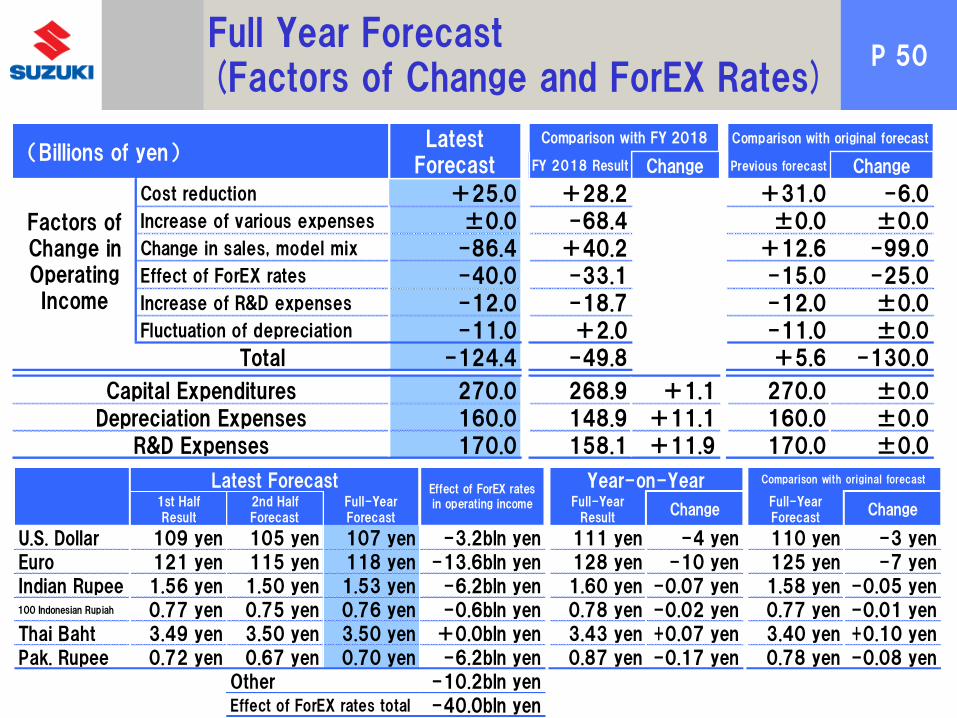
P 50 Full Year Forecast (Factors of Change and ForEX Rates)
1st HalfResult
2nd HalfForecast
Full-YearForecast
Full-YearResult
ChangeFull-YearForecast
Change
U.S. Dollar 109 yen 105 yen 107 yen -3.2bln yen 111 yen -4 yen 110 yen -3 yen
Euro 121 yen 115 yen 118 yen -13.6bln yen 128 yen -10 yen 125 yen -7 yen
Indian Rupee 1.56 yen 1.50 yen 1.53 yen -6.2bln yen 1.60 yen -0.07 yen 1.58 yen -0.05 yen100 Indonesian Rupiah 0.77 yen 0.75 yen 0.76 yen -0.6bln yen 0.78 yen -0.02 yen 0.77 yen -0.01 yen
Thai Baht 3.49 yen 3.50 yen 3.50 yen +0.0bln yen 3.43 yen +0.07 yen 3.40 yen +0.10 yen
Pak. Rupee 0.72 yen 0.67 yen 0.70 yen -6.2bln yen 0.87 yen -0.17 yen 0.78 yen -0.08 yen
-10.2bln yen
-40.0bln yenEffect of ForEX rates total
Comparison with original forecastLatest Forecast
Other
Year-on-YearEffect of ForEX rates
in operating income
FY 2018 Result Change Previous forecast Change
Cost reduction +25.0 +28.2 +31.0 -6.0Increase of various expenses ±0.0 -68.4 ±0.0 ±0.0Change in sales, model mix -86.4 +40.2 +12.6 -99.0Effect of ForEX rates -40.0 -33.1 -15.0 -25.0Increase of R&D expenses -12.0 -18.7 -12.0 ±0.0Fluctuation of depreciation -11.0 +2.0 -11.0 ±0.0
Total -124.4 -49.8 +5.6 -130.0
270.0 268.9 +1.1 270.0 ±0.0
160.0 148.9 +11.1 160.0 ±0.0
170.0 158.1 +11.9 170.0 ±0.0R&D Expenses
Comparison with FY 2018 Comparison with original forecast
Capital Expenditures
Depreciation Expenses
Factors ofChange inOperatingIncome
LatestForecast
(Billions of yen)

P 51
Forecast Forecast
(FY2019) (FY2018) Change Ratio (FY2019) (FY2018) Change Ratio
<Automobile>
Japan 956 1,011 -55 -5.4% -53 689 725 -36 -5.0% -31
Europe 166 180 -14 -7.8% -8 256 278 -22 -8.0% ±0
Asia 1,823 2,201 -378 -17.2% -449 1,738 2,138 -400 -18.7% -444
Other 2 2 -0 -7.4% ±0 166 186 -20 -10.8% -16
Total 2,947 3,394 -447 -13.2% -510 2,849 3,327 -478 -14.4% -491
<Motorcycle>
Japan 101 115 -14 -12.1% -10 52 57 -5 -8.0% -8
Europe - - - - - 45 44 +1 +1.2% -2
N.America 3 4 -1 -25.5% ±0 37 36 +1 +2.3% -2
Asia 1,629 1,576 +53 +3.4% -51 1,468 1,436 +32 +2.2% -68
Other 61 52 +9 +16.6% +9 169 171 -2 -1.3% +26
Total 1,794 1,747 +47 +2.7% -52 1,771 1,745 +26 +1.5% -54
(Thousandunits)
FY2018 ResultFY2018 Result Revisedunits fromoriginalforecast
Production SalesRevised
units fromoriginalforecast
Kept unchanged from 10 October forecast
Automobile sales in India forecasts -20%
Full Year Forecast (Production and Sales)
P 52 Caution with respect to Forward-Looking Statements
The forward-looking statements mentioned in this presentation are based
on currently available information and assumptions, contain risks and
uncertainty and do not constitute guarantees of future achievement.
Please note that the future results may greatly vary by the changes of
various factors.
Those factors, which may influence the future results, include economic conditions and the trend of demand in major markets and the fluctuations
of foreign exchange rates (mainly U.S. dollar/Yen rate, Euro/Yen rate,
Indian Rupee/Yen rate).