Embed Size (px)
Citation preview

NSIC – D&B – SMERA Rating Report
Date of Report : 28th January, 2014 * Valid Till : 27th January, 2015 Legal Form : Proprietorship Concern
* This rating is a one-time exercise and does not envisage automatic surveillance. This rating is valid for a period of one year; subject to however, no significant changes / events occur during that period which could materially affect the business and financial parameters of the organization / project. SMERA recommends that the user of the rating may seek a review of the rating, if the rated entity experiences significant changes / events in the business. Recommended for review in next financial year.
NSIC – D&B – SMERA Rating : SE 3B (Moderate Performance Capability and Moderate Financial Strength)
RATING INDICATORS
Financial Strength
High Moderate Low
Performance Capability
Highest SE 1A SE 1B SE 1C
High SE 2A SE 2B SE 2C
Moderate SE 3A SE 3B SE 3C
Weak SE 4A SE 4B SE 4C
Poor SE 5A SE 5B SE 5C
SWAMI PLAST INDUSTRIES
Plot No. 748/2, GIDC Industrial Estate, Makarpura,
Vadodara – 390 010 Gujarat India
SWAMI PLAST INDUSTRIES
1
SNAPSHOT
D&B D-U-N-S® Number 92-334-6709
Entity Name SWAMI PLAST INDUSTRIES
Administrative Office & Factory Address
Plot No. 748/2, GIDC Industrial Estate, Makarpura, Vadodara – 390 010 Gujarat India
Telephone (91) (265) (6533125) (91) (265) (3049125)
Telex (91) (265) (2646015)
Website www.swamiplast.com
Email ID [email protected] [email protected]
Line of Business Manufacturing of plastic Packaging Machinery & Plastic Packaging Material.
Chief Executive Mr. Sanjay Shukla Proprietor
NSIC - D&B - SMERA Rating SE 3B (Moderate Performance Capability and Moderate Financial Strength)
SSI Registration Number 041910015/PMT/SSI
Category of Promoter General
Establishment Date 17/Apr/1997
Total Employees 07
Sales Territory Domestic
SWAMI PLAST INDUSTRIES
2
COMPANY PROFILE BACKGROUND Swami Plast Industries (hereafter referred as subject) was established in the 1997 as a
proprietorship concern by Mr. Sanjay Shukla.
OPERATIONS Subject is engaged in manufacturing of plastic Packaging Machinery & Plastic Packaging Material.
SWAMI PLAST INDUSTRIES
3
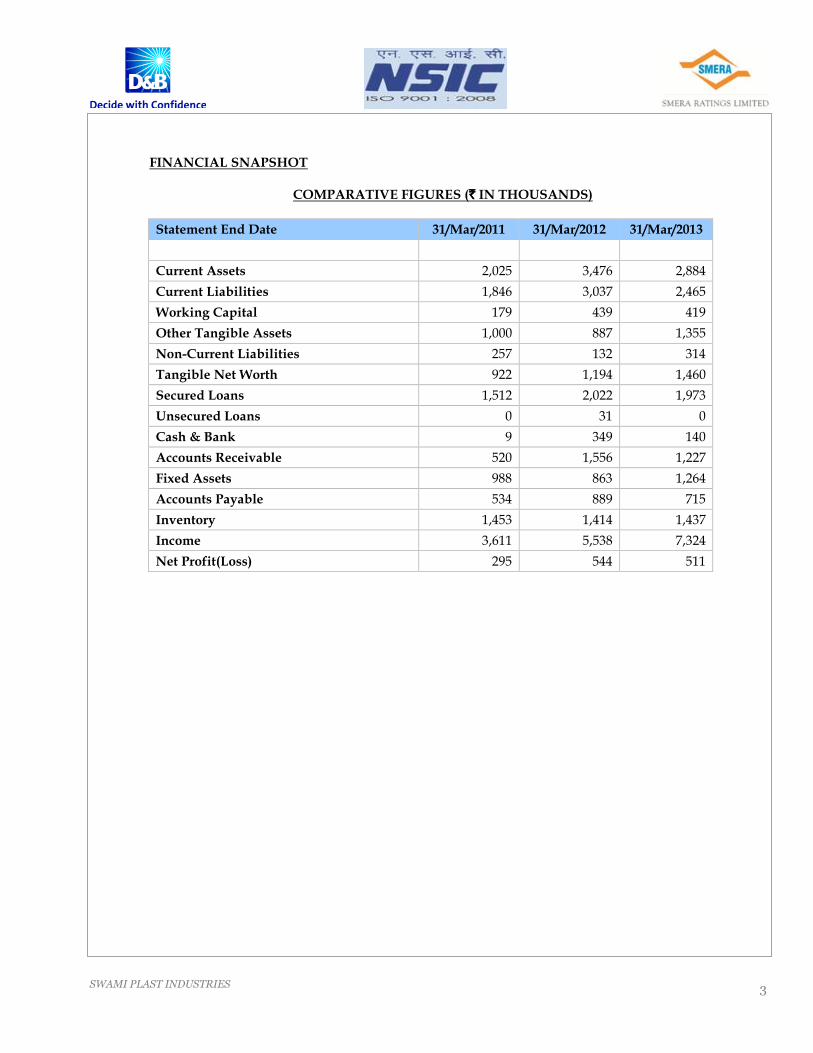
FINANCIAL SNAPSHOT
COMPARATIVE FIGURES (`̀̀̀ IN THOUSANDS)
Statement End Date 31/Mar/2011 31/Mar/2012 31/Mar/2013
Current Assets 2,025 3,476 2,884
Current Liabilities 1,846 3,037 2,465
Working Capital 179 439 419
Other Tangible Assets 1,000 887 1,355
Non-Current Liabilities 257 132 314
Tangible Net Worth 922 1,194 1,460
Secured Loans 1,512 2,022 1,973
Unsecured Loans 0 31 0
Cash & Bank 9 349 140
Accounts Receivable 520 1,556 1,227
Fixed Assets 988 863 1,264
Accounts Payable 534 889 715
Inventory 1,453 1,414 1,437
Income 3,611 5,538 7,324
Net Profit(Loss) 295 544 511
SWAMI PLAST INDUSTRIES
4
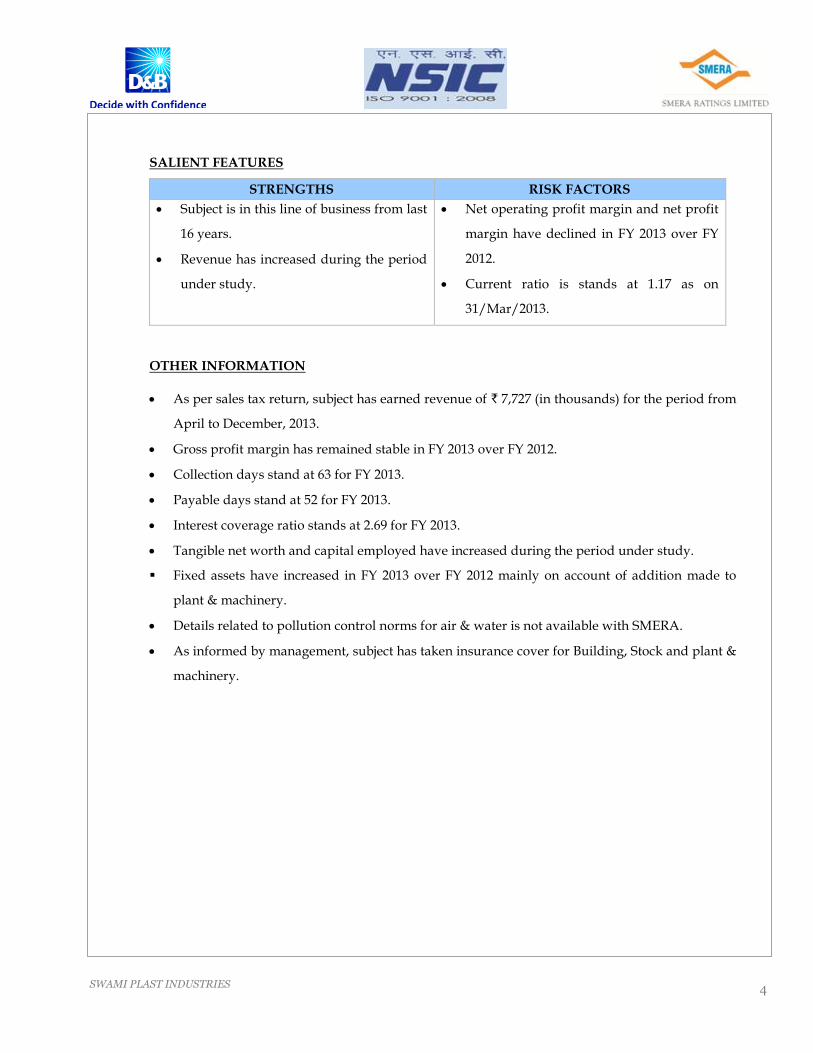
SALIENT FEATURES
STRENGTHS RISK FACTORS
• Subject is in this line of business from last
16 years.
• Revenue has increased during the period
under study.
• Net operating profit margin and net profit
margin have declined in FY 2013 over FY
2012.
• Current ratio is stands at 1.17 as on
31/Mar/2013.
OTHER INFORMATION
• As per sales tax return, subject has earned revenue of ` 7,727 (in thousands) for the period from
April to December, 2013.
• Gross profit margin has remained stable in FY 2013 over FY 2012.
• Collection days stand at 63 for FY 2013.
• Payable days stand at 52 for FY 2013.
• Interest coverage ratio stands at 2.69 for FY 2013.
• Tangible net worth and capital employed have increased during the period under study.
� Fixed assets have increased in FY 2013 over FY 2012 mainly on account of addition made to
plant & machinery.
• Details related to pollution control norms for air & water is not available with SMERA.
• As informed by management, subject has taken insurance cover for Building, Stock and plant &
machinery.
SWAMI PLAST INDUSTRIES
5
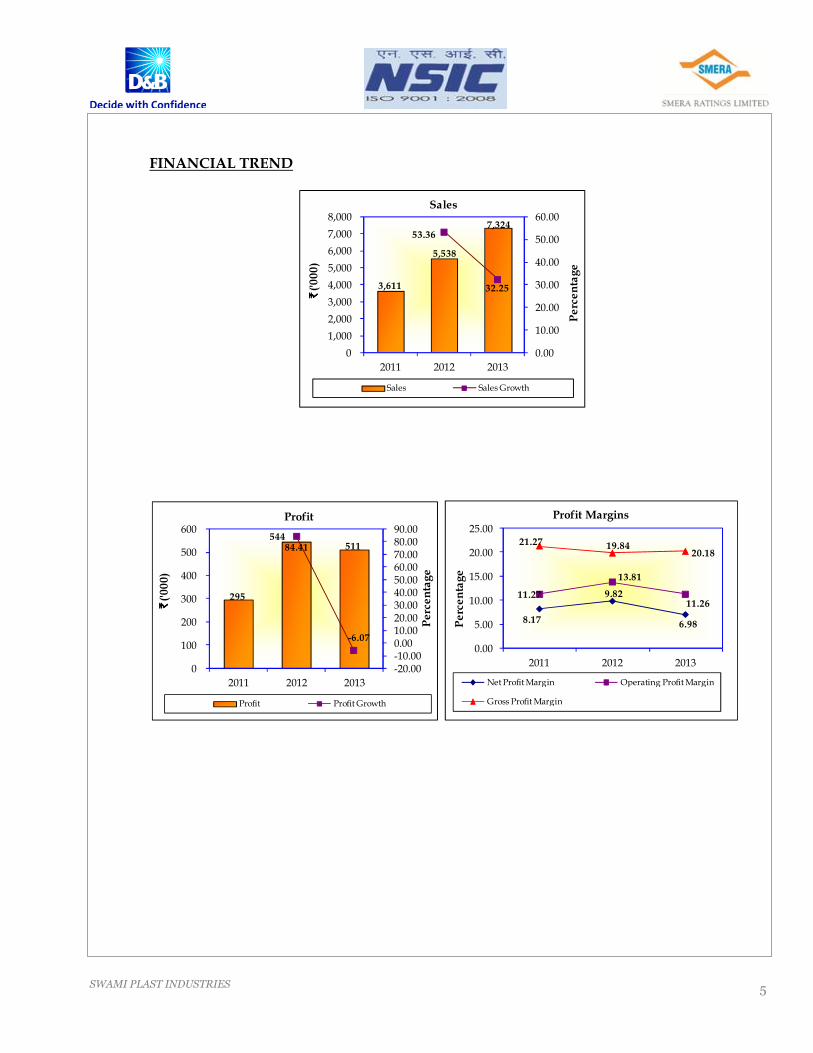
FINANCIAL TREND
3,611
5,538
7,32453.36
32.25
0.00
10.00
20.00
30.00
40.00
50.00
60.00
0
1,000
2,000
3,000
4,000
5,000
6,000
7,000
8,000
2011 2012 2013
Percentage
`̀̀̀('000)
Sales
Sales Sales Growth
295
54451184.41
-6.07
-20.00-10.000.0010.0020.0030.0040.0050.0060.0070.0080.0090.00
0
100
200
300
400
500
600
2011 2012 2013
Percentage
`̀̀̀('000)
Profit
Profit Profit Growth
8.17
9.82
6.98
11.27
13.81
11.26
21.27 19.8420.18
0.00
5.00
10.00
15.00
20.00
25.00
2011 2012 2013
Percentage
Profit Margins
Net Profit Margin Operating Profit Margin
Gross Profit Margin
SWAMI PLAST INDUSTRIES
6
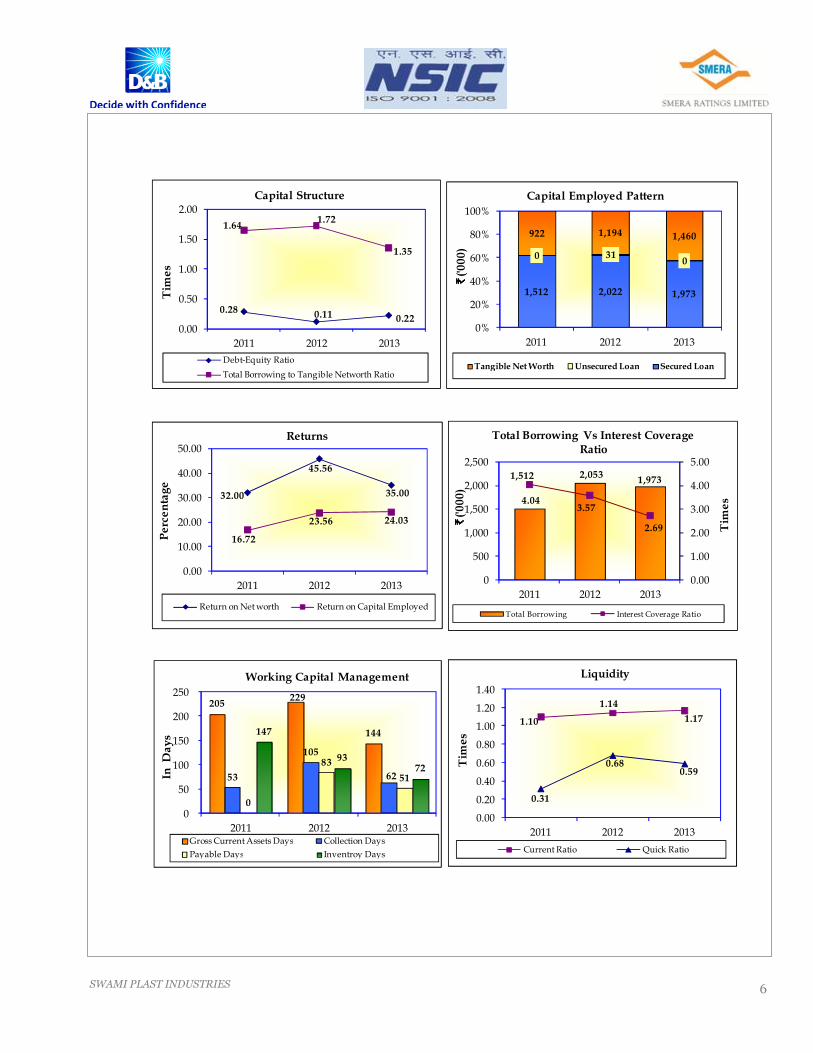
1,512 2,022 1,973
0 31 0
922 1,194 1,460
0%
20%
40%
60%
80%
100%
2011 2012 2013
`̀̀̀('000)
Capital Employed Pattern
Tangible Net Worth Unsecured Loan Secured Loan
0.28 0.11 0.22
1.641.72
1.35
0.00
0.50
1.00
1.50
2.00
2011 2012 2013
Tim
es
Capital Structure
Debt-Equity Ratio
Total Borrowing to Tangible Networth Ratio
32.00
45.56
35.00
16.72
23.56 24.03
0.00
10.00
20.00
30.00
40.00
50.00
2011 2012 2013
Percentage
Returns
Return on Net worth Return on Capital Employed
1.10
1.14
1.17
0.31
0.680.59
0.00
0.20
0.40
0.60
0.80
1.00
1.20
1.40
2011 2012 2013
Tim
es
Liquidity
Current Ratio Quick Ratio
1,512 2,0531,973
4.043.57
2.69
0.00
1.00
2.00
3.00
4.00
5.00
0
500
1,000
1,500
2,000
2,500
2011 2012 2013
Tim
es
`̀̀̀('000)
Total Borrowing Vs Interest Coverage Ratio
Total Borrowing Interest Coverage Ratio
205229
144
53
105
62
0
83
51
147
93 72
0
50
100
150
200
250
2011 2012 2013
In D
ays
Working Capital Management
Gross Current Assets Days Collection Days
Payable Days Inventroy Days
SWAMI PLAST INDUSTRIES
7
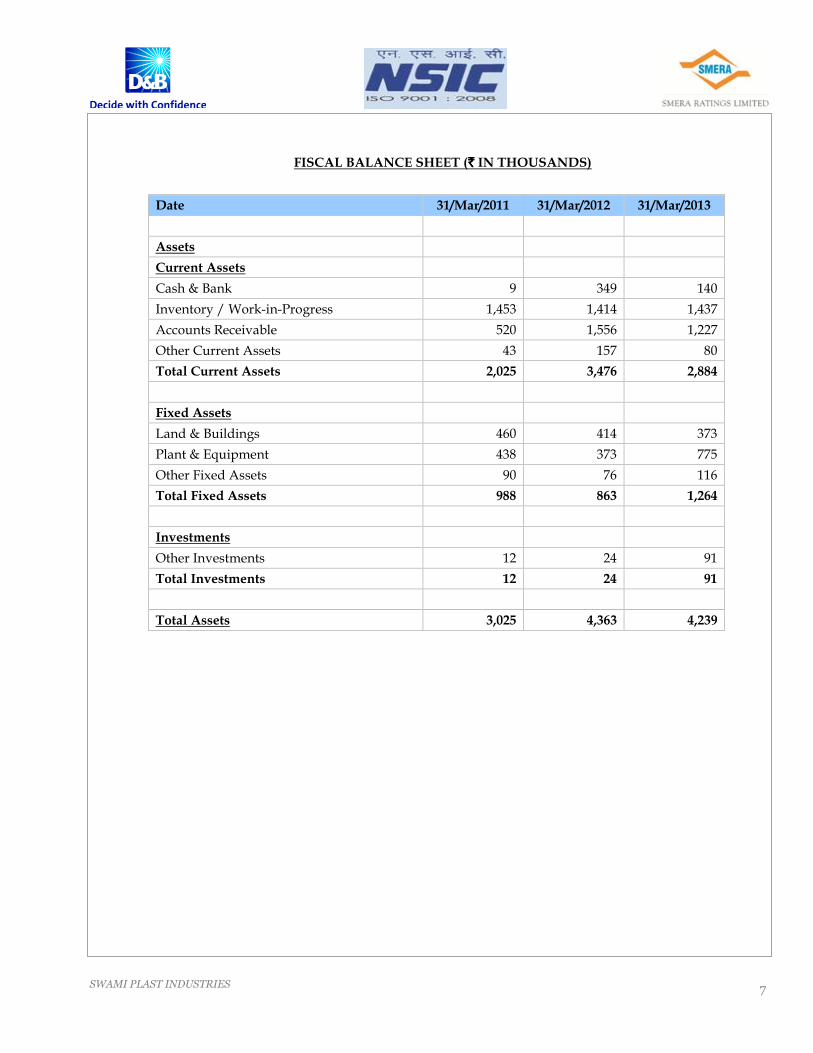
FISCAL BALANCE SHEET (`̀̀̀ IN THOUSANDS)
Date 31/Mar/2011 31/Mar/2012 31/Mar/2013
Assets
Current Assets
Cash & Bank 9 349 140
Inventory / Work-in-Progress 1,453 1,414 1,437
Accounts Receivable 520 1,556 1,227
Other Current Assets 43 157 80
Total Current Assets 2,025 3,476 2,884
Fixed Assets
Land & Buildings 460 414 373
Plant & Equipment 438 373 775
Other Fixed Assets 90 76 116
Total Fixed Assets 988 863 1,264
Investments
Other Investments 12 24 91
Total Investments 12 24 91
Total Assets 3,025 4,363 4,239
SWAMI PLAST INDUSTRIES
8
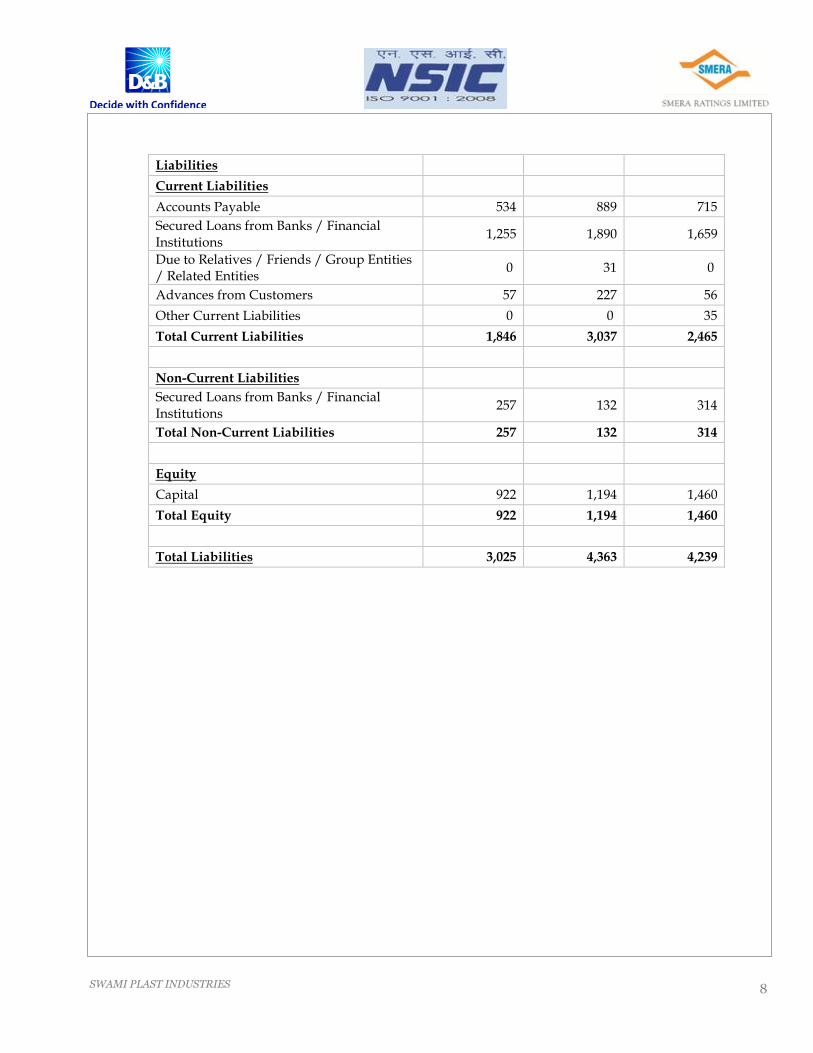
Liabilities
Current Liabilities
Accounts Payable 534 889 715
Secured Loans from Banks / Financial Institutions
1,255 1,890 1,659
Due to Relatives / Friends / Group Entities / Related Entities
0 31 0
Advances from Customers 57 227 56
Other Current Liabilities 0 0 35
Total Current Liabilities 1,846 3,037 2,465
Non-Current Liabilities
Secured Loans from Banks / Financial Institutions
257 132 314
Total Non-Current Liabilities 257 132 314
Equity
Capital 922 1,194 1,460
Total Equity 922 1,194 1,460
Total Liabilities 3,025 4,363 4,239
SWAMI PLAST INDUSTRIES
9
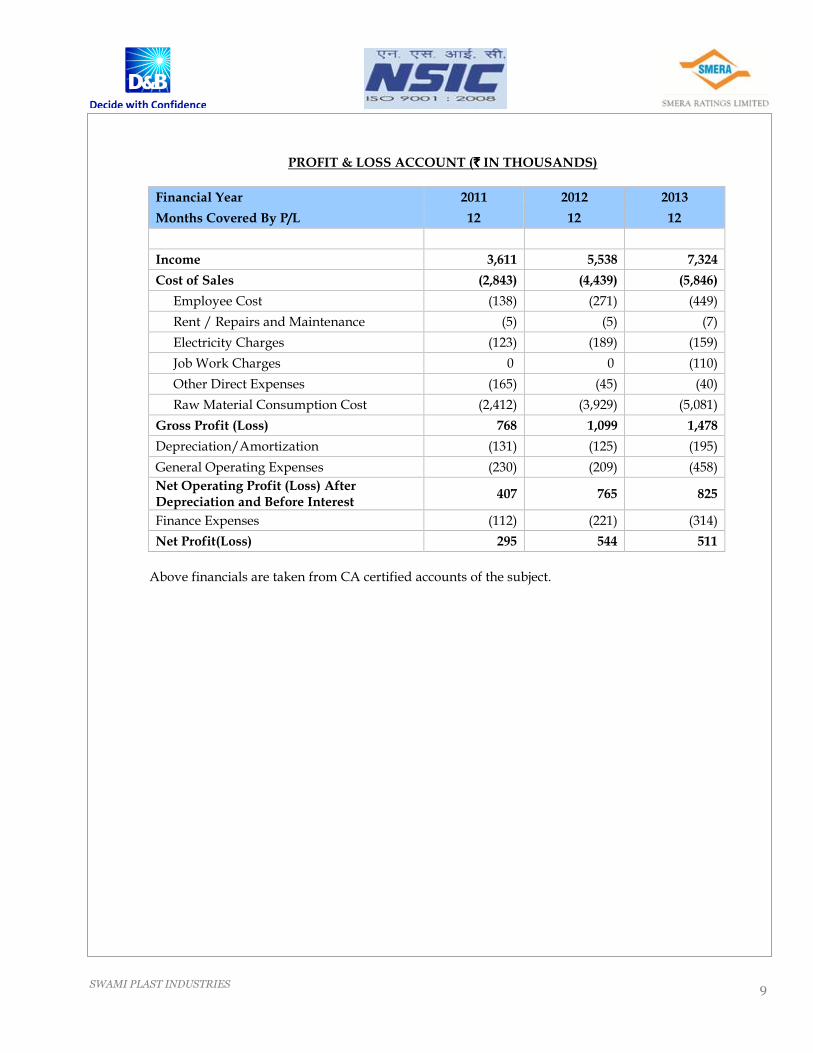
PROFIT & LOSS ACCOUNT (`̀̀̀ IN THOUSANDS)
Financial Year 2011 2012 2013
Months Covered By P/L 12 12 12
Income 3,611 5,538 7,324
Cost of Sales (2,843) (4,439) (5,846)
Employee Cost (138) (271) (449)
Rent / Repairs and Maintenance (5) (5) (7)
Electricity Charges (123) (189) (159)
Job Work Charges 0 0 (110)
Other Direct Expenses (165) (45) (40)
Raw Material Consumption Cost (2,412) (3,929) (5,081)
Gross Profit (Loss) 768 1,099 1,478
Depreciation/Amortization (131) (125) (195)
General Operating Expenses (230) (209) (458)
Net Operating Profit (Loss) After Depreciation and Before Interest
407 765 825
Finance Expenses (112) (221) (314)
Net Profit(Loss) 295 544 511
Above financials are taken from CA certified accounts of the subject.
SWAMI PLAST INDUSTRIES
10
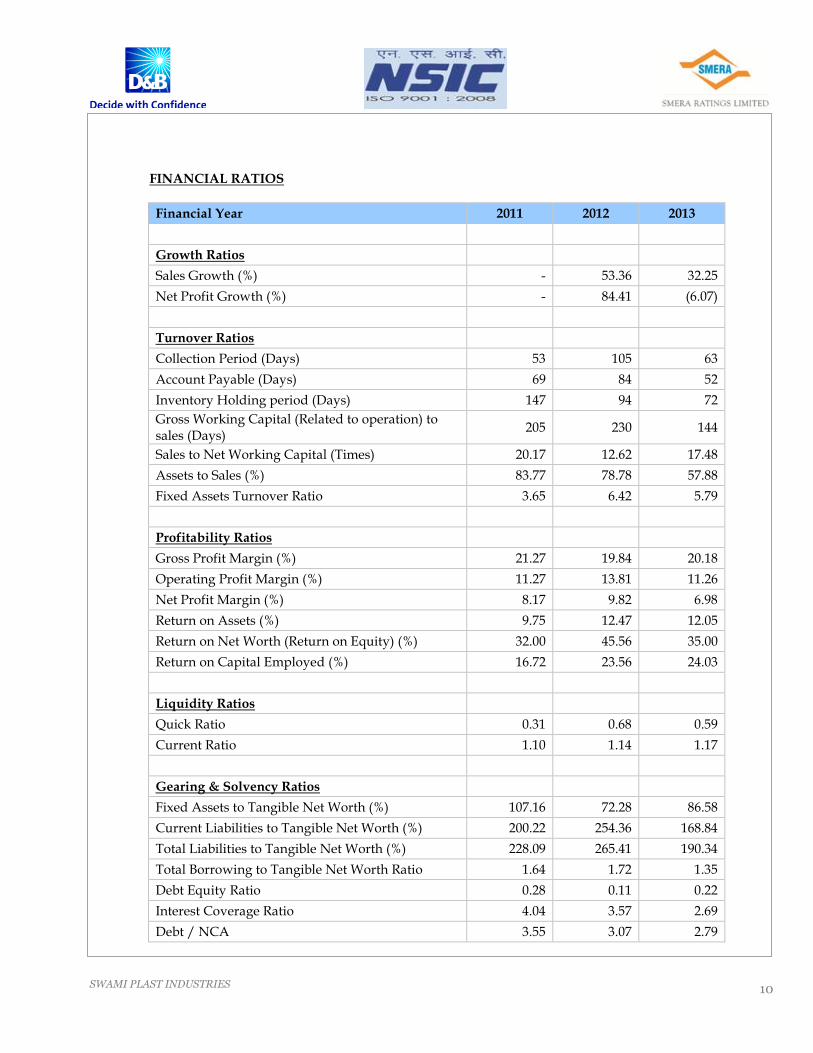
FINANCIAL RATIOS
Financial Year 2011 2012 2013
Growth Ratios
Sales Growth (%) - 53.36 32.25
Net Profit Growth (%) - 84.41 (6.07)
Turnover Ratios
Collection Period (Days) 53 105 63
Account Payable (Days) 69 84 52
Inventory Holding period (Days) 147 94 72
Gross Working Capital (Related to operation) to sales (Days)
205 230 144
Sales to Net Working Capital (Times) 20.17 12.62 17.48
Assets to Sales (%) 83.77 78.78 57.88
Fixed Assets Turnover Ratio 3.65 6.42 5.79
Profitability Ratios
Gross Profit Margin (%) 21.27 19.84 20.18
Operating Profit Margin (%) 11.27 13.81 11.26
Net Profit Margin (%) 8.17 9.82 6.98
Return on Assets (%) 9.75 12.47 12.05
Return on Net Worth (Return on Equity) (%) 32.00 45.56 35.00
Return on Capital Employed (%) 16.72 23.56 24.03
Liquidity Ratios
Quick Ratio 0.31 0.68 0.59
Current Ratio 1.10 1.14 1.17
Gearing & Solvency Ratios
Fixed Assets to Tangible Net Worth (%) 107.16 72.28 86.58
Current Liabilities to Tangible Net Worth (%) 200.22 254.36 168.84
Total Liabilities to Tangible Net Worth (%) 228.09 265.41 190.34
Total Borrowing to Tangible Net Worth Ratio 1.64 1.72 1.35
Debt Equity Ratio 0.28 0.11 0.22
Interest Coverage Ratio 4.04 3.57 2.69
Debt / NCA 3.55 3.07 2.79
SWAMI PLAST INDUSTRIES
11
AUDITOR
V.J. Amin & Co, (Chartered Accountants) 506, Gayatri Chambers, R C Dutt Road, Alkapuri, Vadodara – 390 007 Gujarat India
SWAMI PLAST INDUSTRIES
12
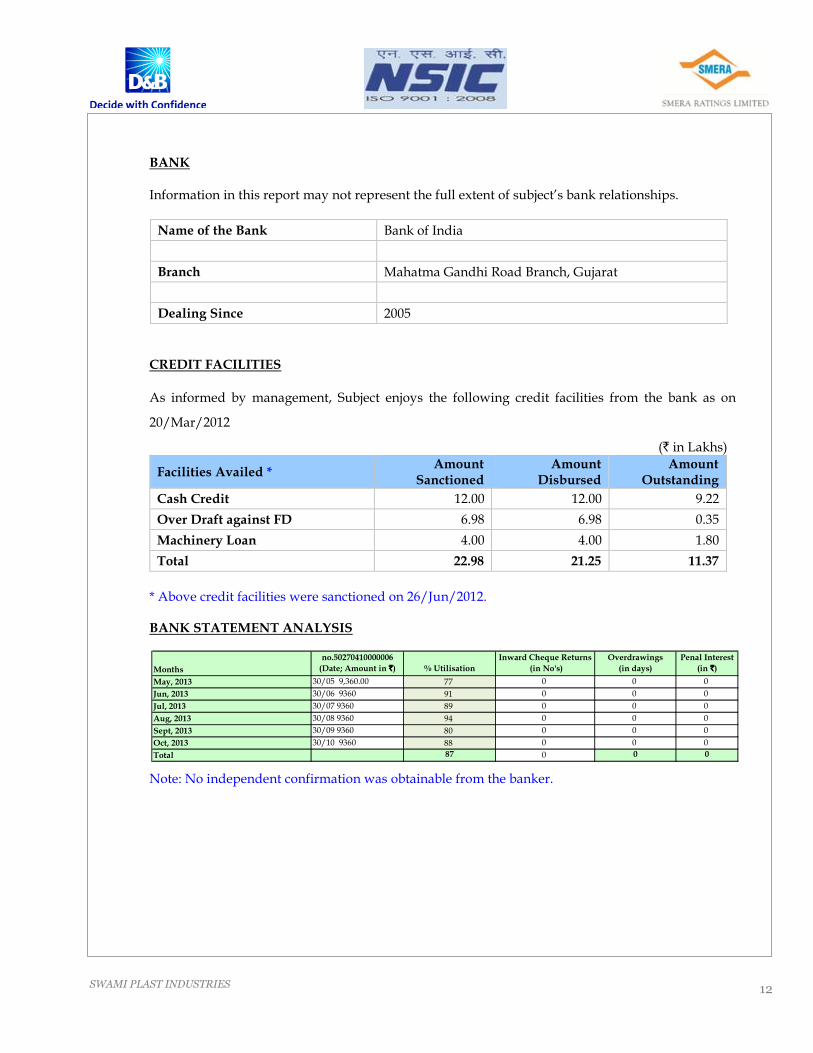
BANK Information in this report may not represent the full extent of subject’s bank relationships.
Name of the Bank Bank of India
Branch Mahatma Gandhi Road Branch, Gujarat
Dealing Since 2005
CREDIT FACILITIES As informed by management, Subject enjoys the following credit facilities from the bank as on
20/Mar/2012
(` in Lakhs)
Facilities Availed * Amount
Sanctioned Amount
Disbursed Amount
Outstanding
Cash Credit 12.00 12.00 9.22
Over Draft against FD 6.98 6.98 0.35
Machinery Loan 4.00 4.00 1.80
Total 22.98 21.25 11.37
* Above credit facilities were sanctioned on 26/Jun/2012.
BANK STATEMENT ANALYSIS
Note: No independent confirmation was obtainable from the banker.
Months
no.50270410000006
(Date; Amount in `̀̀̀) % Utilisation
Inward Cheque Returns
(in No's)
Overdrawings
(in days)
Penal Interest
(in `̀̀̀)
May, 2013 30/05 9,360.00 77 0 0 0
Jun, 2013 30/06 9360 91 0 0 0
Jul, 2013 30/07 9360 89 0 0 0
Aug, 2013 30/08 9360 94 0 0 0
Sept, 2013 30/09 9360 80 0 0 0
Oct, 2013 30/10 9360 88 0 0 0
Total 87 0 0 0
SWAMI PLAST INDUSTRIES
13
INSURANCE � As informed by management, Subject has taken insurance cover for building, stock and plant &
machinery.
SWAMI PLAST INDUSTRIES
14
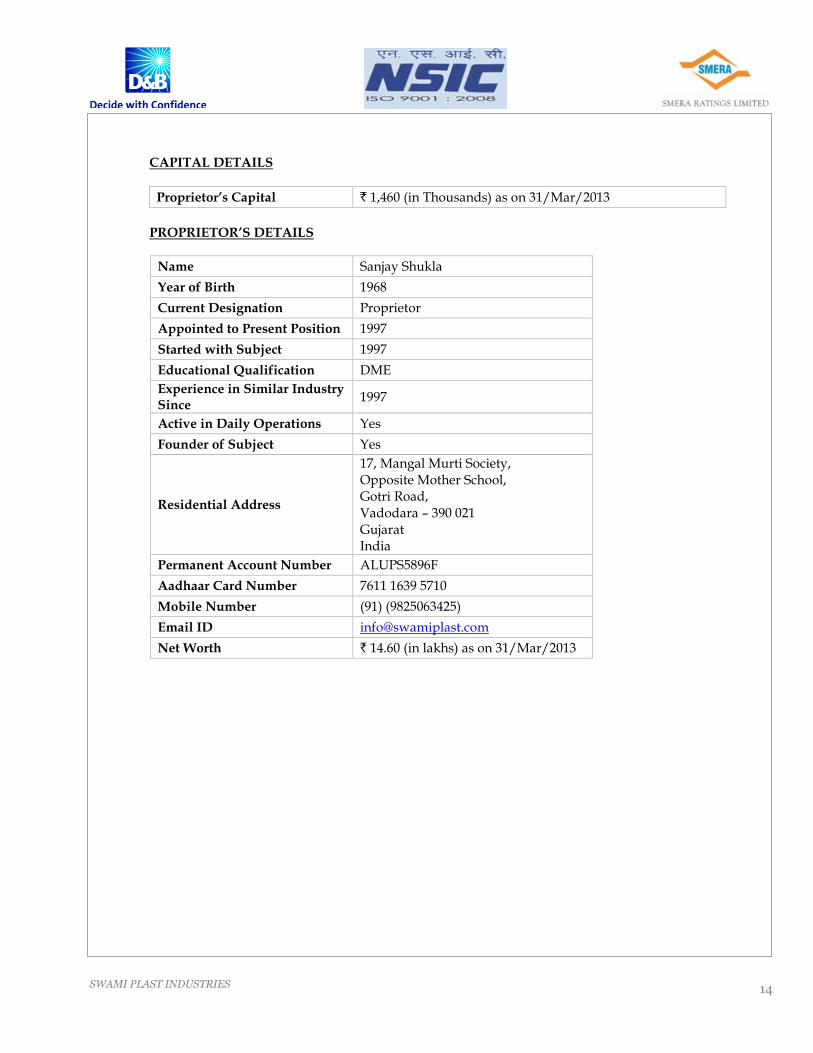
CAPITAL DETAILS
Proprietor’s Capital ` 1,460 (in Thousands) as on 31/Mar/2013
PROPRIETOR’S DETAILS
Name Sanjay Shukla
Year of Birth 1968
Current Designation Proprietor
Appointed to Present Position 1997
Started with Subject 1997
Educational Qualification DME
Experience in Similar Industry Since
1997
Active in Daily Operations Yes
Founder of Subject Yes
Residential Address
17, Mangal Murti Society, Opposite Mother School, Gotri Road, Vadodara – 390 021 Gujarat India
Permanent Account Number ALUPS5896F
Aadhaar Card Number 7611 1639 5710
Mobile Number (91) (9825063425)
Email ID [email protected]
Net Worth ` 14.60 (in lakhs) as on 31/Mar/2013
SWAMI PLAST INDUSTRIES
15
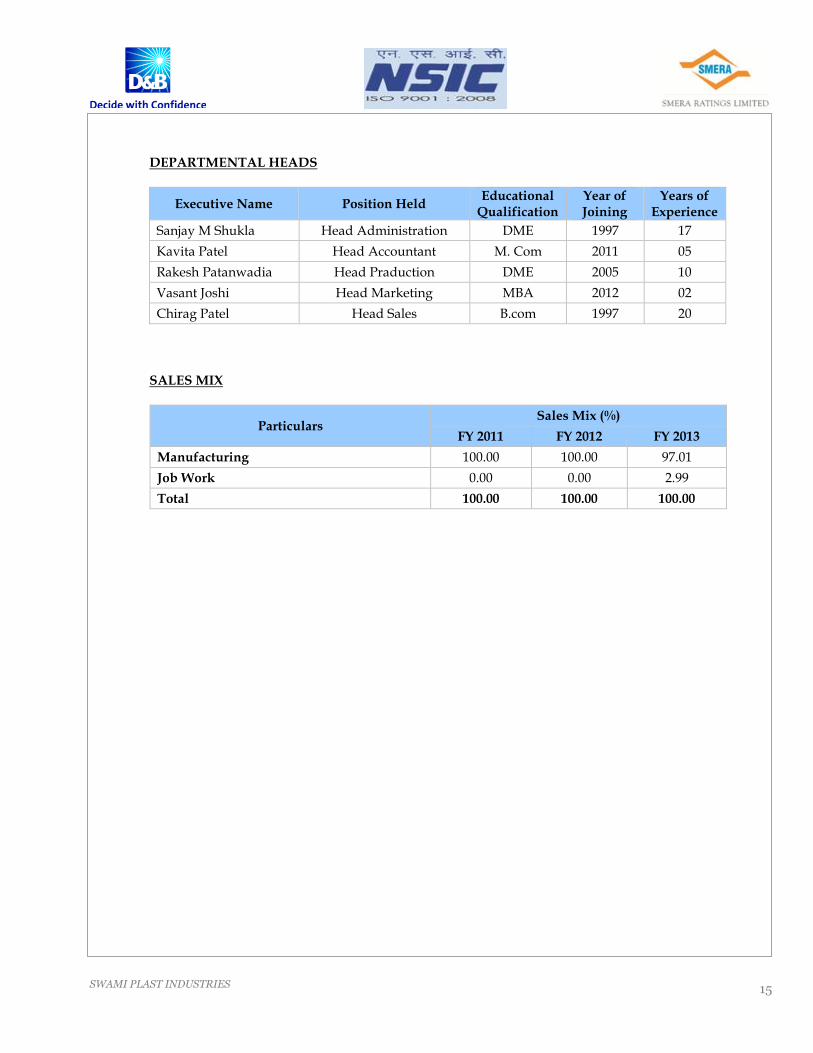
DEPARTMENTAL HEADS
Executive Name Position Held Educational Qualification
Year of Joining
Years of Experience
Sanjay M Shukla Head Administration DME 1997 17
Kavita Patel Head Accountant M. Com 2011 05
Rakesh Patanwadia Head Praduction DME 2005 10
Vasant Joshi Head Marketing MBA 2012 02
Chirag Patel Head Sales B.com 1997 20
SALES MIX
Particulars Sales Mix (%)
FY 2011 FY 2012 FY 2013
Manufacturing 100.00 100.00 97.01
Job Work 0.00 0.00 2.99
Total 100.00 100.00 100.00
SWAMI PLAST INDUSTRIES
16
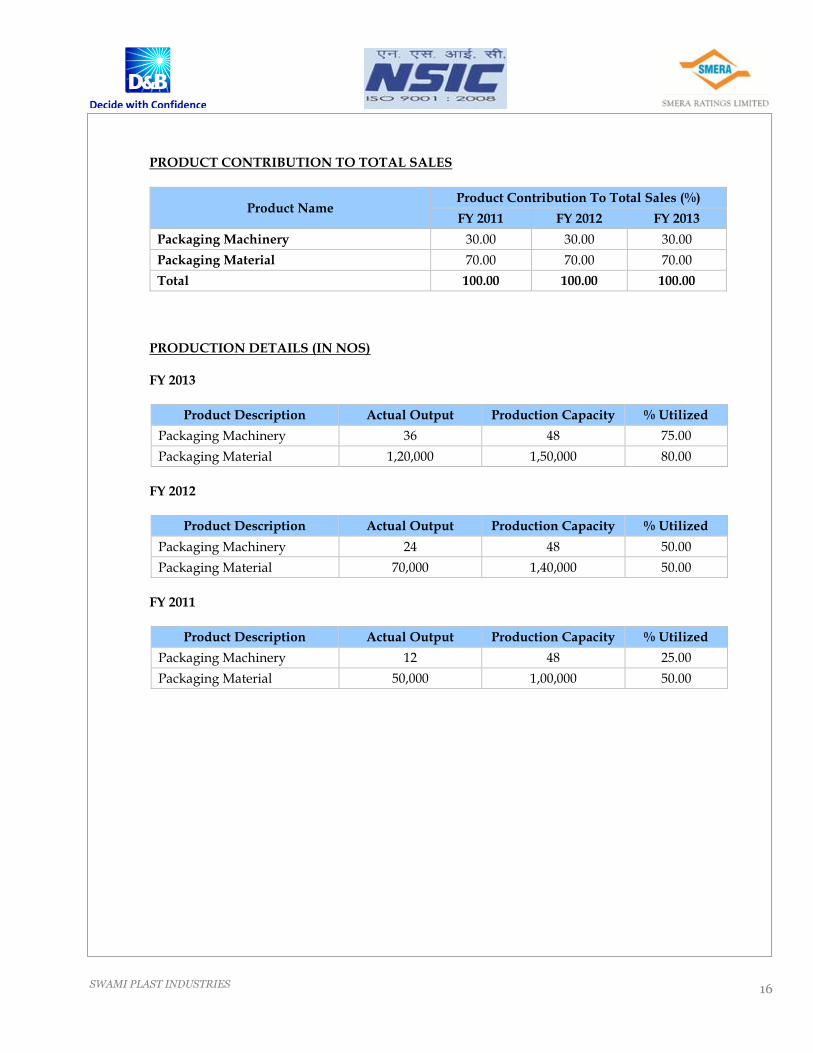
PRODUCT CONTRIBUTION TO TOTAL SALES
Product Name Product Contribution To Total Sales (%)
FY 2011 FY 2012 FY 2013
Packaging Machinery 30.00 30.00 30.00
Packaging Material 70.00 70.00 70.00
Total 100.00 100.00 100.00
PRODUCTION DETAILS (IN NOS) FY 2013
Product Description Actual Output Production Capacity % Utilized
Packaging Machinery 36 48 75.00
Packaging Material 1,20,000 1,50,000 80.00
FY 2012
Product Description Actual Output Production Capacity % Utilized
Packaging Machinery 24 48 50.00
Packaging Material 70,000 1,40,000 50.00
FY 2011
Product Description Actual Output Production Capacity % Utilized
Packaging Machinery 12 48 25.00
Packaging Material 50,000 1,00,000 50.00
SWAMI PLAST INDUSTRIES
17
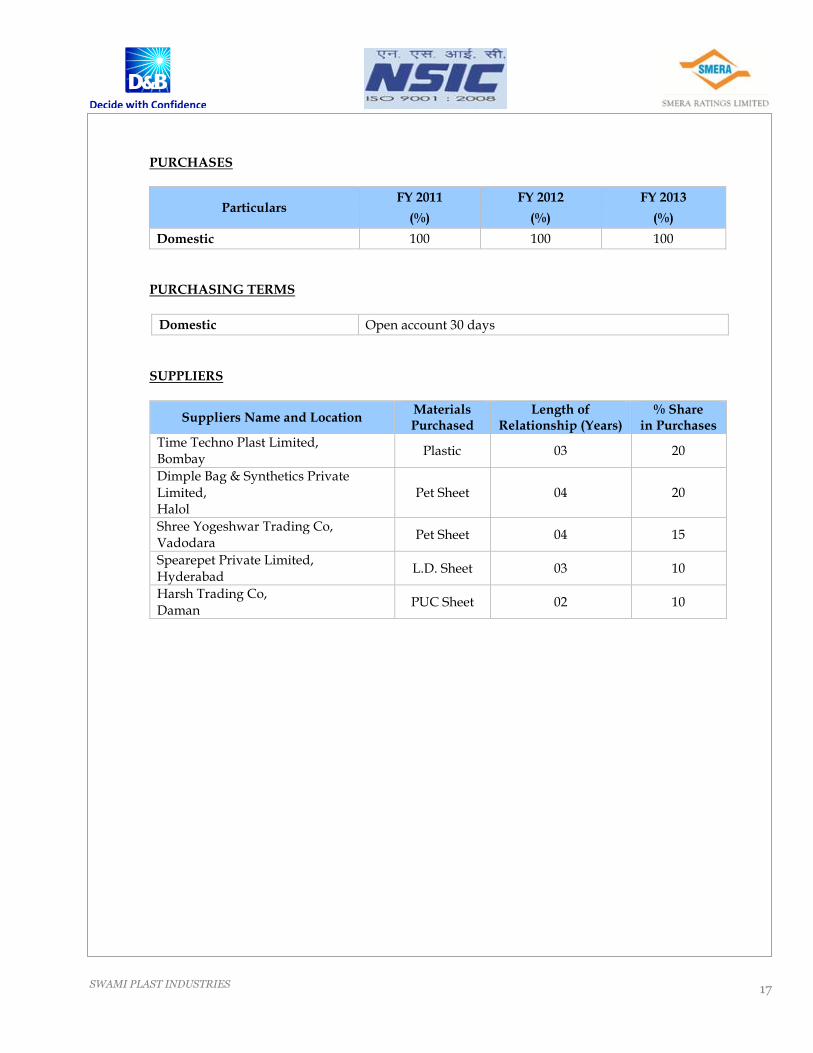
PURCHASES
Particulars FY 2011 FY 2012 FY 2013
(%) (%) (%)
Domestic 100 100 100
PURCHASING TERMS
Domestic Open account 30 days
SUPPLIERS
Suppliers Name and Location Materials Purchased
Length of Relationship (Years)
% Share in Purchases
Time Techno Plast Limited, Bombay
Plastic 03 20
Dimple Bag & Synthetics Private Limited, Halol
Pet Sheet 04 20
Shree Yogeshwar Trading Co, Vadodara
Pet Sheet 04 15
Spearepet Private Limited, Hyderabad
L.D. Sheet 03 10
Harsh Trading Co, Daman
PUC Sheet 02 10
SWAMI PLAST INDUSTRIES
18
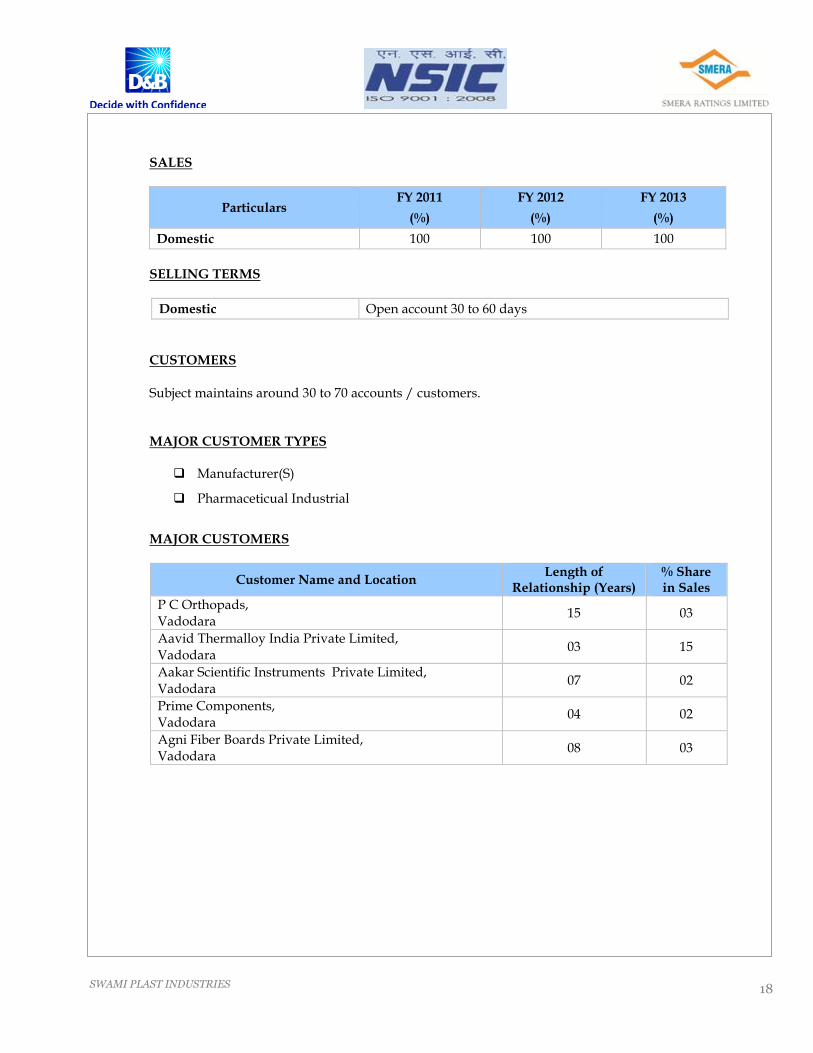
SALES
Particulars FY 2011 FY 2012 FY 2013
(%) (%) (%)
Domestic 100 100 100
SELLING TERMS
Domestic Open account 30 to 60 days
CUSTOMERS Subject maintains around 30 to 70 accounts / customers. MAJOR CUSTOMER TYPES
� Manufacturer(S)
� Pharmaceticual Industrial
MAJOR CUSTOMERS
Customer Name and Location Length of
Relationship (Years) % Share in Sales
P C Orthopads, Vadodara
15 03
Aavid Thermalloy India Private Limited, Vadodara
03 15
Aakar Scientific Instruments Private Limited, Vadodara
07 02
Prime Components, Vadodara
04 02
Agni Fiber Boards Private Limited, Vadodara
08 03
SWAMI PLAST INDUSTRIES
19
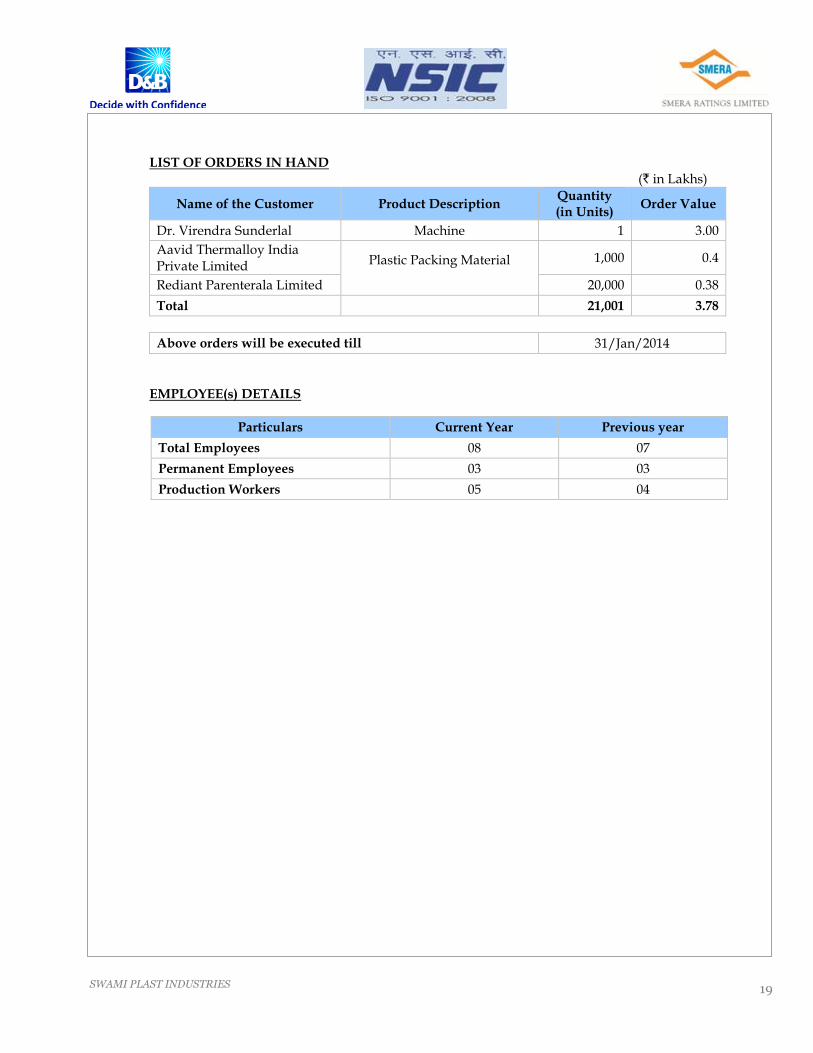
LIST OF ORDERS IN HAND (` in Lakhs)
Name of the Customer Product Description Quantity (in Units)
Order Value
Dr. Virendra Sunderlal Machine 1 3.00
Aavid Thermalloy India Private Limited Plastic Packing Material
1,000 0.4
Rediant Parenterala Limited 20,000 0.38
Total 21,001 3.78
Above orders will be executed till 31/Jan/2014
EMPLOYEE(s) DETAILS
Particulars Current Year Previous year
Total Employees 08 07
Permanent Employees 03 03
Production Workers 05 04
SWAMI PLAST INDUSTRIES
20
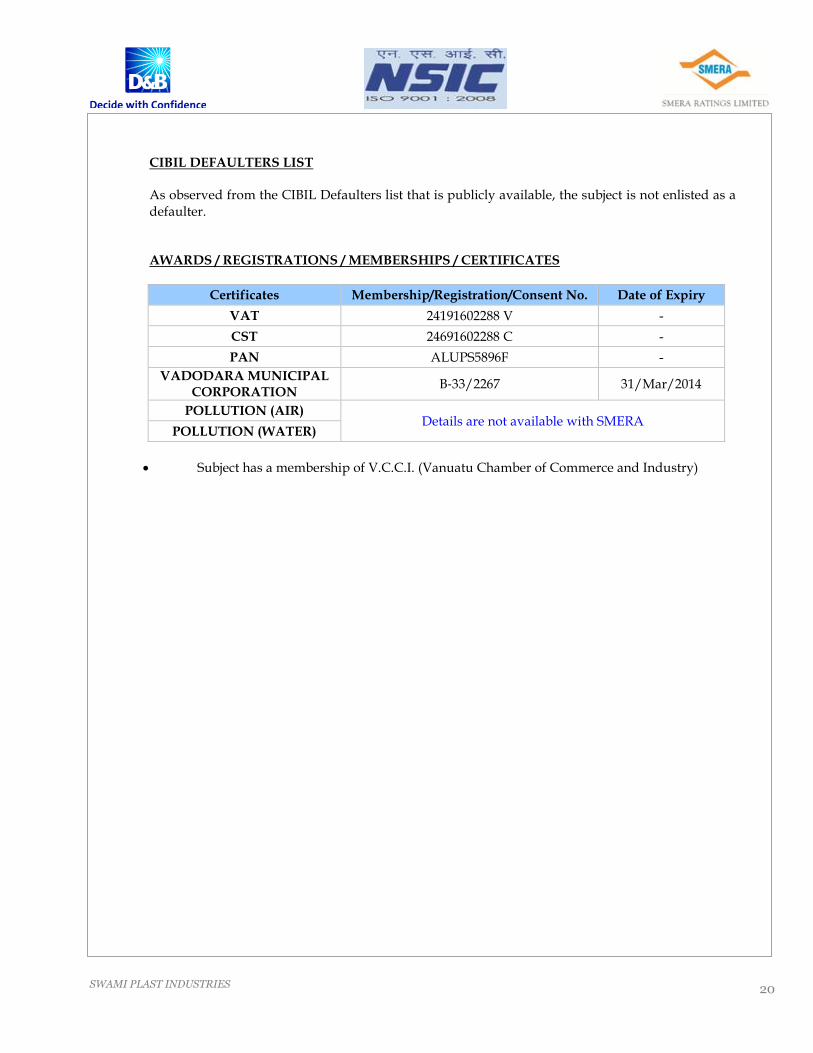
CIBIL DEFAULTERS LIST As observed from the CIBIL Defaulters list that is publicly available, the subject is not enlisted as a defaulter. AWARDS / REGISTRATIONS / MEMBERSHIPS / CERTIFICATES
Certificates Membership/Registration/Consent No. Date of Expiry
VAT 24191602288 V -
CST 24691602288 C -
PAN ALUPS5896F -
VADODARA MUNICIPAL CORPORATION
B‐33/2267 31/Mar/2014
POLLUTION (AIR) Details are not available with SMERA
POLLUTION (WATER)
• Subject has a membership of V.C.C.I. (Vanuatu Chamber of Commerce and Industry)
SWAMI PLAST INDUSTRIES
21
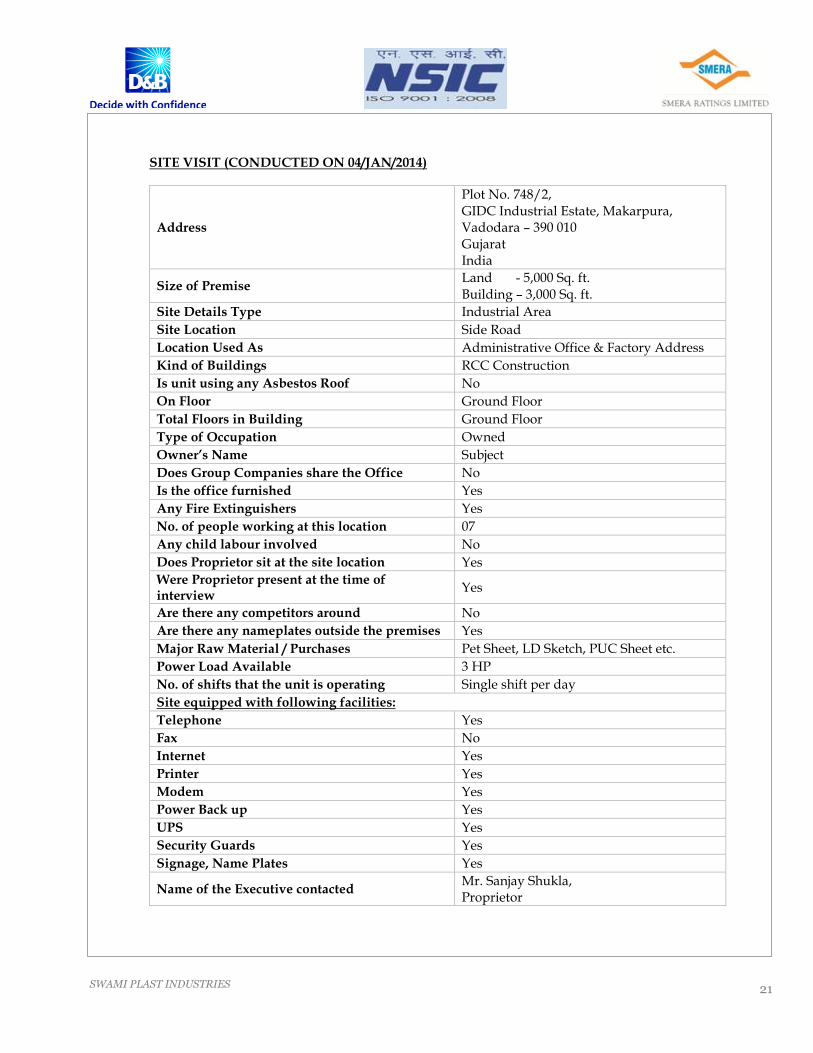
SITE VISIT (CONDUCTED ON 04/JAN/2014)
Address
Plot No. 748/2, GIDC Industrial Estate, Makarpura, Vadodara – 390 010 Gujarat India
Size of Premise Land - 5,000 Sq. ft. Building – 3,000 Sq. ft.
Site Details Type Industrial Area
Site Location Side Road
Location Used As Administrative Office & Factory Address
Kind of Buildings RCC Construction
Is unit using any Asbestos Roof No
On Floor Ground Floor
Total Floors in Building Ground Floor
Type of Occupation Owned
Owner’s Name Subject
Does Group Companies share the Office No
Is the office furnished Yes
Any Fire Extinguishers Yes
No. of people working at this location 07
Any child labour involved No
Does Proprietor sit at the site location Yes
Were Proprietor present at the time of interview
Yes
Are there any competitors around No
Are there any nameplates outside the premises Yes
Major Raw Material / Purchases Pet Sheet, LD Sketch, PUC Sheet etc.
Power Load Available 3 HP
No. of shifts that the unit is operating Single shift per day
Site equipped with following facilities:
Telephone Yes
Fax No
Internet Yes
Printer Yes
Modem Yes
Power Back up Yes
UPS Yes
Security Guards Yes
Signage, Name Plates Yes
Name of the Executive contacted Mr. Sanjay Shukla, Proprietor
SWAMI PLAST INDUSTRIES
22
ONGOING / FUTURE EXPANSION PROJECTS � As informed by management, subject does not have any ongoing expansion projects as on date.
SWAMI PLAST INDUSTRIES
23
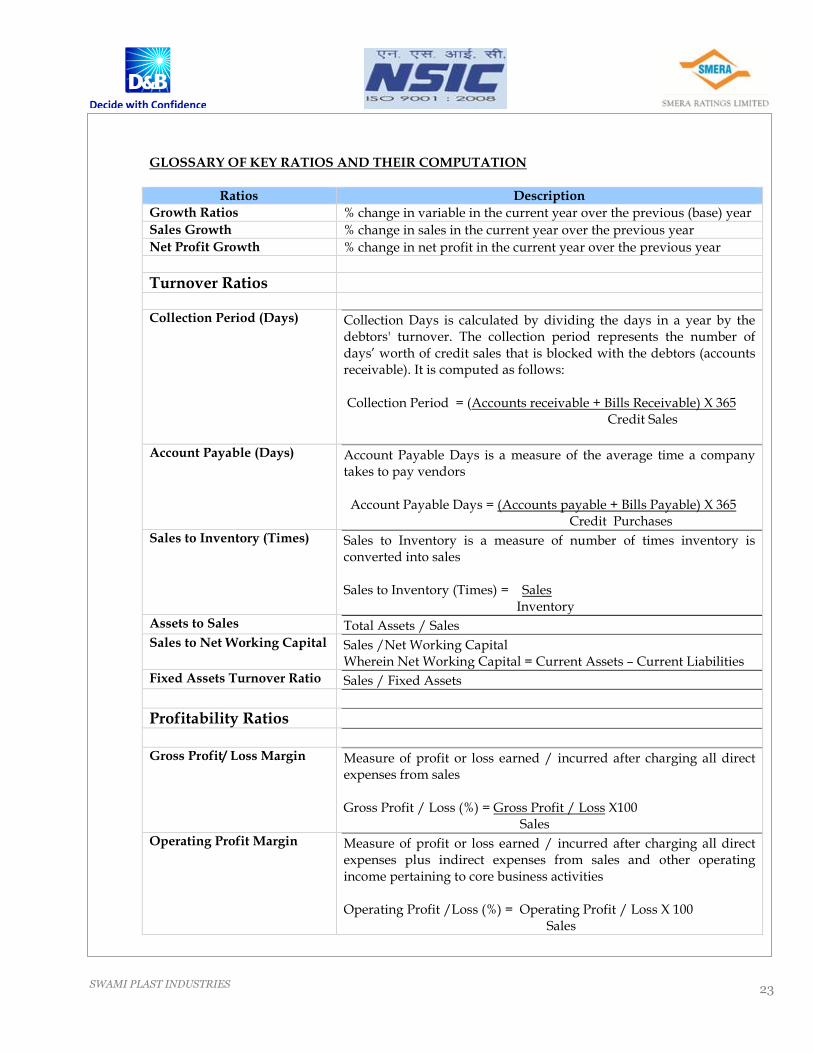
GLOSSARY OF KEY RATIOS AND THEIR COMPUTATION
Ratios Description
Growth Ratios % change in variable in the current year over the previous (base) year
Sales Growth % change in sales in the current year over the previous year
Net Profit Growth % change in net profit in the current year over the previous year
Turnover Ratios
Collection Period (Days) Collection Days is calculated by dividing the days in a year by the debtors' turnover. The collection period represents the number of days’ worth of credit sales that is blocked with the debtors (accounts receivable). It is computed as follows: Collection Period = (Accounts receivable + Bills Receivable) X 365
Credit Sales
Account Payable (Days) Account Payable Days is a measure of the average time a company takes to pay vendors Account Payable Days = (Accounts payable + Bills Payable) X 365
Credit Purchases
Sales to Inventory (Times) Sales to Inventory is a measure of number of times inventory is converted into sales Sales to Inventory (Times) = Sales Inventory
Assets to Sales Total Assets / Sales
Sales to Net Working Capital Sales /Net Working Capital Wherein Net Working Capital = Current Assets – Current Liabilities
Fixed Assets Turnover Ratio Sales / Fixed Assets
Profitability Ratios
Gross Profit/ Loss Margin Measure of profit or loss earned / incurred after charging all direct expenses from sales Gross Profit / Loss (%) = Gross Profit / Loss X100 Sales
Operating Profit Margin Measure of profit or loss earned / incurred after charging all direct expenses plus indirect expenses from sales and other operating income pertaining to core business activities Operating Profit /Loss (%) = Operating Profit / Loss X 100 Sales
SWAMI PLAST INDUSTRIES
24
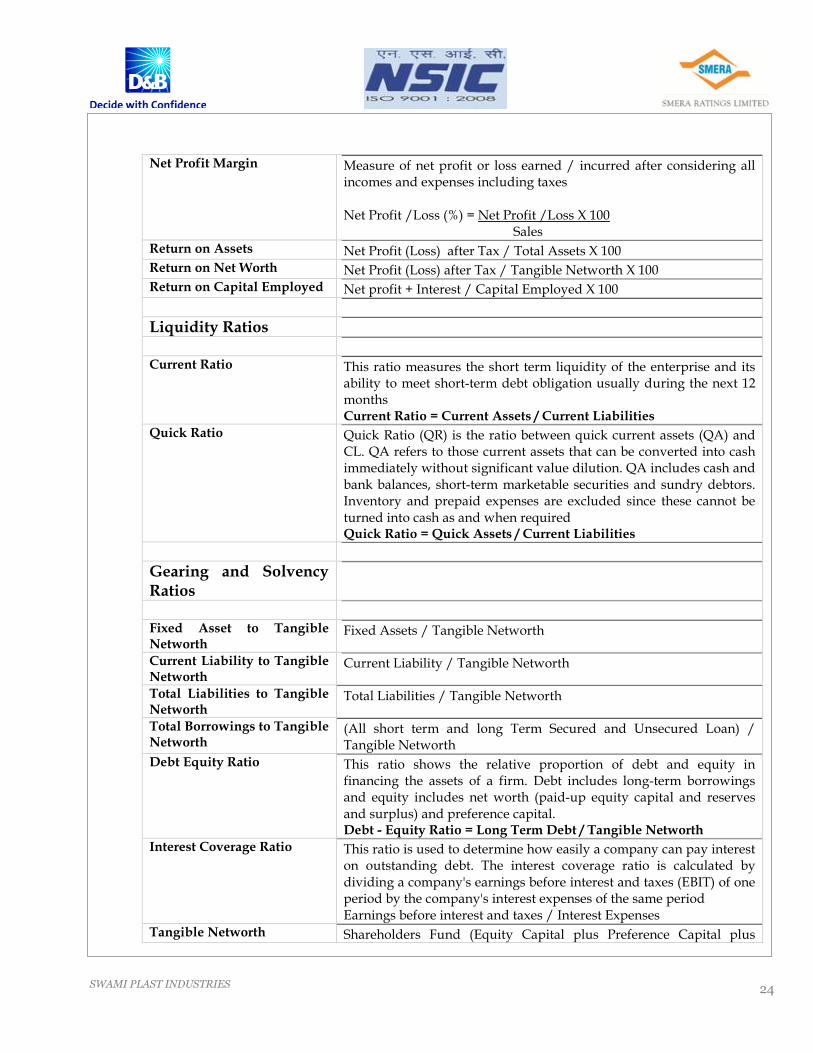
Net Profit Margin Measure of net profit or loss earned / incurred after considering all incomes and expenses including taxes Net Profit /Loss (%) = Net Profit /Loss X 100 Sales
Return on Assets Net Profit (Loss) after Tax / Total Assets X 100
Return on Net Worth Net Profit (Loss) after Tax / Tangible Networth X 100
Return on Capital Employed Net profit + Interest / Capital Employed X 100
Liquidity Ratios
Current Ratio This ratio measures the short term liquidity of the enterprise and its ability to meet short-term debt obligation usually during the next 12 months Current Ratio = Current Assets / Current Liabilities
Quick Ratio Quick Ratio (QR) is the ratio between quick current assets (QA) and CL. QA refers to those current assets that can be converted into cash immediately without significant value dilution. QA includes cash and bank balances, short-term marketable securities and sundry debtors. Inventory and prepaid expenses are excluded since these cannot be turned into cash as and when required Quick Ratio = Quick Assets / Current Liabilities
Gearing and Solvency Ratios
Fixed Asset to Tangible Networth
Fixed Assets / Tangible Networth
Current Liability to Tangible Networth
Current Liability / Tangible Networth
Total Liabilities to Tangible Networth
Total Liabilities / Tangible Networth
Total Borrowings to Tangible Networth
(All short term and long Term Secured and Unsecured Loan) / Tangible Networth
Debt Equity Ratio This ratio shows the relative proportion of debt and equity in financing the assets of a firm. Debt includes long-term borrowings and equity includes net worth (paid-up equity capital and reserves and surplus) and preference capital. Debt - Equity Ratio = Long Term Debt / Tangible Networth
Interest Coverage Ratio This ratio is used to determine how easily a company can pay interest on outstanding debt. The interest coverage ratio is calculated by dividing a company's earnings before interest and taxes (EBIT) of one period by the company's interest expenses of the same period Earnings before interest and taxes / Interest Expenses
Tangible Networth Shareholders Fund (Equity Capital plus Preference Capital plus
SWAMI PLAST INDUSTRIES
25
Reserves Less Intangibles Less Deferred Tax Asset)
Capital Employed Tangible Networth plus Secured Loans plus Unsecured loans plus Deferred Sales Tax Loan plus Deferred Tax Liability
For the purpose of deriving rating, combination of above mentioned ratios would be used and calculations of these ratios may change based on nature of entities and at the discretion of SMERA Analyst.
SWAMI PLAST INDUSTRIES
26
CURRENCY: All amounts in this report are in local currency unless otherwise stated. ------------------------------------------------------------------------------------------------------------------------------------
RIGHTS TO THE REPORT ARE WITH SMERA RATINGS LIMITED (SMERA). THIS REPORT MAY NOT BE REPRODUCED IN WHOLE OR IN
PART IN ANY FORM OR MANNER WHATSOEVER. ------------------------------------------------------------------------------------------------------------------------------------ The NSIC – D&B – SMERA Rating shall be read with the NSIC – D&B – SMERA Rating Report on the subject issued by SMERA. All information contained in the NSIC – D&B – SMERA Rating Report is obtained by SMERA from the subject and third party sources, and is believed to be accurate and reliable. Although reasonable care has been taken to ensure that the information in the Rating Report is true, such information is provided “as is” without any warranty of any kind and SMERA, in particular, makes no representation or warranty, express or implied, as to the accuracy, timeliness or completeness of any such information SMERA is not responsible for any errors in transmission and specifically states that SMERA shall have no financial liability whatsoever to the users of the Rating Report. The rating does not constitute an audit and SMERA’s work is significantly different from that of an audit and accordingly, cannot be relied upon to provide the same level of assurance as an audit. Please note that the NSIC – D&B – SMERA Rating Report is not a recommendation to purchase, sell or hold any securities and investors should take their own decision. In providing this Rating, SMERA does not underwrite the risks of any third party or that of the subject. SMERA is not liable to the Company or any third party in respect of any matter specified in the Rating Report. SMERA may revise, suspend or withdraw the rating at any time in the future as a result of information changes in circumstances or unavailability of information. The NSIC – D&B – SMERA Rating Report is not intended for distribution/ publication/ reproduction in any form without SMERA’s prior written approval.
-- End of Report --