Embed Size (px)
Citation preview

SWEET CORN REGULAR ANALYSISYEAR TO 04/10/2014

Copy
right
©20
12 T
he N
iels
en C
ompa
ny. C
onfid
entia
l and
pro
prie
tary
.
2
1. Market Overview
2. Demographics
3. Retail Health Situation by State
Agenda
This analysis is part of a vegetable consumer purchase data project funded by HAL using the vegetable levy and matched funds from the Australian Government.
Copy
right
©20
12 T
he N
iels
en C
ompa
ny. C
onfid
entia
l and
pro
prie
tary
.
4
HIGHLIGHTS
RECOMMENDATIONSApproximately half of Australian households don’t purchase Fresh Sweet Corn which highlights a big opportunity for growth. Households with no kids especially have much lower demographic reach than their Family counterparts. It would be good to understand barriers to purchase and whether these shoppers prefer the canned, frozen or packaged version of the vegetable .
Emphasis can be given on Coles to increase value sales of Sweet Corn. Monitor prices, potential over-supply or deep promotions. Non-supermarket’s decline could be related to sales shifting to modern trade channels. Improve value proposition in Green Grocers to remain competitive.
Sweet Corn represents 1.9% of the value and 2.0% of the volume market share. It’s buyer base has reduced this year, however their average spend has seen no change as compared to last year.
Families are important buyers for Sweet Corn; they account for more volume share than their share of buyers. Only Established Couples have witnessed an increase in their consumption.
Larger households (3 or more Members) are the core buyers for Sweet Corn and account for almost 57% of it’s volume sales. All household sizes have witnessed buyer leakage this year.
Both Value and Volume decline this year is mainly driven by Non Supermarkets and IGA. In contrast, Aldi posts excellent performance.
More than 56% Woolworths shoppers who buy Sweet Corn, prefer to purchase it at Woolworths stores, whereas this conversion rate is only 52% for Coles.
VIC accounts for 24% of national spend on Sweet Corn. Less households are buying and state buyers see a decline volume consumption this year.
Copy
right
©20
12 T
he N
iels
en C
ompa
ny. C
onfid
entia
l and
pro
prie
tary
.
5Copy
right
© 2
014
The
Nie
lsen
Com
pany
. Con
fiden
tial a
nd p
ropr
ieta
ry.
Market OverviewSweet Corn
Copy
right
©20
14 T
he N
iels
en C
ompa
ny. C
onfid
entia
l and
pro
prie
tary
.
6
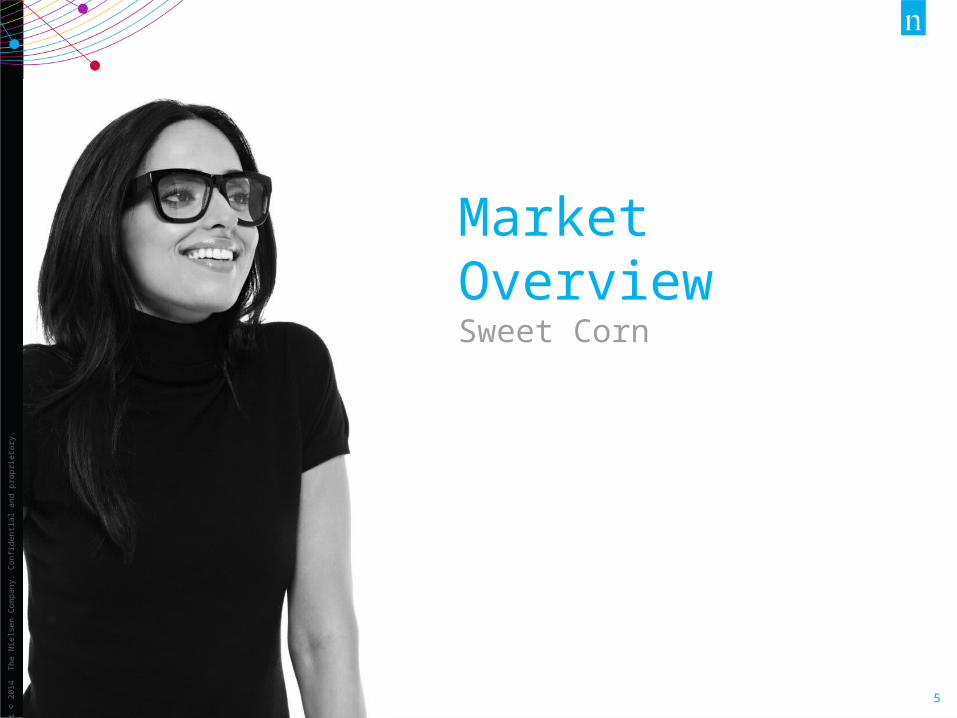
Share of Market VolumeOver Total VegetablesAustralia
Share of Market ValueOver Total VegetablesAustralia
Source: Nielsen Homescan
Last Year This Year
22.0% 21.9%
23.0% 22.5%
10.5% 10.9%
11.0% 10.7%
10.4% 10.1%
5.5% 5.4%
5.6% 5.8%
4.6% 5.2%3.1% 3.2%2.1% 2.3%2.0% 2.0%
Last Year This Year
38.3% 38.9%
12.1% 11.2%
4.8% 4.5%
13.9% 14.6%
4.4% 3.9%3.8% 4.2%3.0% 3.1%2.3% 2.5%7.9% 7.6%7.5% 7.4%
2.1% 1.9%
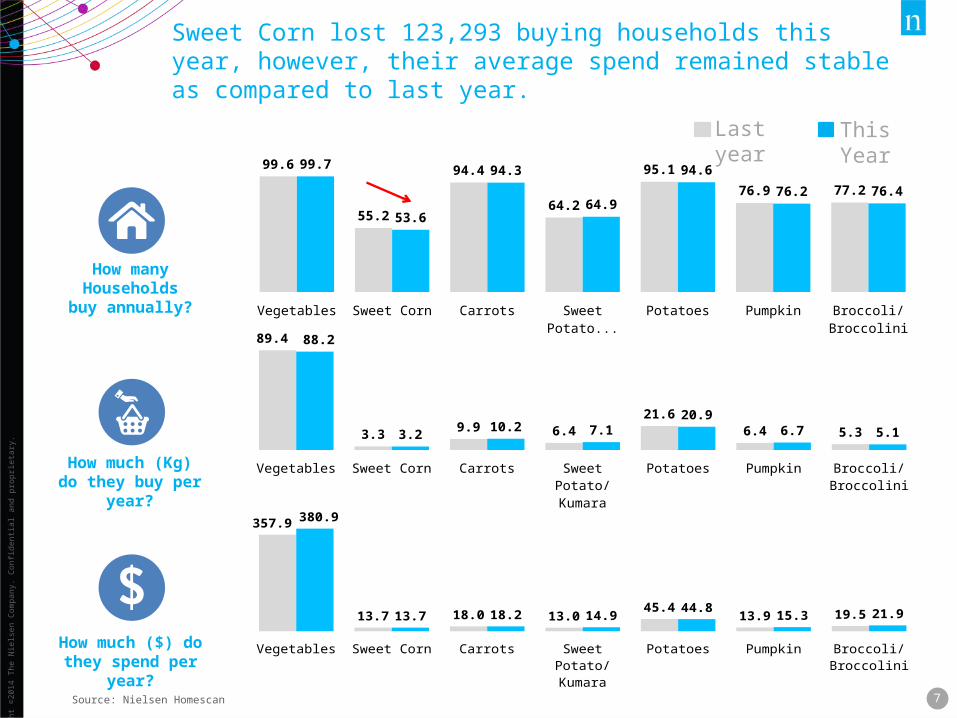
Sweet Corn represents 2.0% of the volume and 1.9% of the value share of vegetables sales this year. Slight decline in value market share is observed.
Copy
right
©20
14 T
he N
iels
en C
ompa
ny. C
onfid
entia
l and
pro
prie
tary
.
7
Vegetables Sweet Corn Carrots Sweet Potato/Ku-
mara
Potatoes Pumpkin Broccoli/Broccol-ini
357.9
13.7 18.0 13.045.4
13.9 19.5
380.9
13.7 18.2 14.944.8
15.3 21.9
Vegetables Sweet Corn Carrots Sweet Potato/Ku-
mara
Potatoes Pumpkin Broccoli/Broccol-ini
89.4
3.39.9 6.4
21.6
6.4 5.3
88.2
3.210.2 7.1
20.96.7 5.1
Vegetables Sweet Corn Carrots Sweet Potato/Ku-
mara
Potatoes Pumpkin Broccoli/Broccol-ini
99.6
55.2
94.4
64.2
95.1
76.9 77.2
99.7
53.6
94.3
64.9
94.6
76.2 76.4
How many Households buy
annually?
How much (Kg) do they buy per year?
How much ($) do they spend per year?
Source: Nielsen Homescan
This YearLast year
Sweet Corn lost 123,293 buying households this year, however, their average spend remained stable as compared to last year.
Copy
right
©20
14 T
he N
iels
en C
ompa
ny. C
onfid
entia
l and
pro
prie
tary
.
8
How much ($) do they spend per occasion?
How much (Kg) do they buy per occasion?
How often do they buy annually?
Source: Nielsen Homescan
Vegetables Sweet Corn Carrots Sweet Potato/Ku-
mara
Potatoes Pumpkin Broccoli/Broccol-ini
50.5
5.311.4
5.612.5
6.3 10.0
50.7
5.211.3 6.0
12.0 6.3 9.9
Vegetables Sweet Corn Carrots Sweet Potato/Ku-
mara
Potatoes Pumpkin Broccoli/Broccol-ini
1.77
0.630.88
1.15
1.73
1.02
0.53
1.74
0.620.90
1.18
1.74
1.06
0.52
Vegetables Sweet Corn Carrots Sweet Potato/Ku-
mara
Potatoes Pumpkin Broccoli/Broccol-ini
7.09
2.591.58
2.31
3.64
2.20 1.95
7.51
2.651.61
2.48
3.74
2.42 2.22
This YearLast year
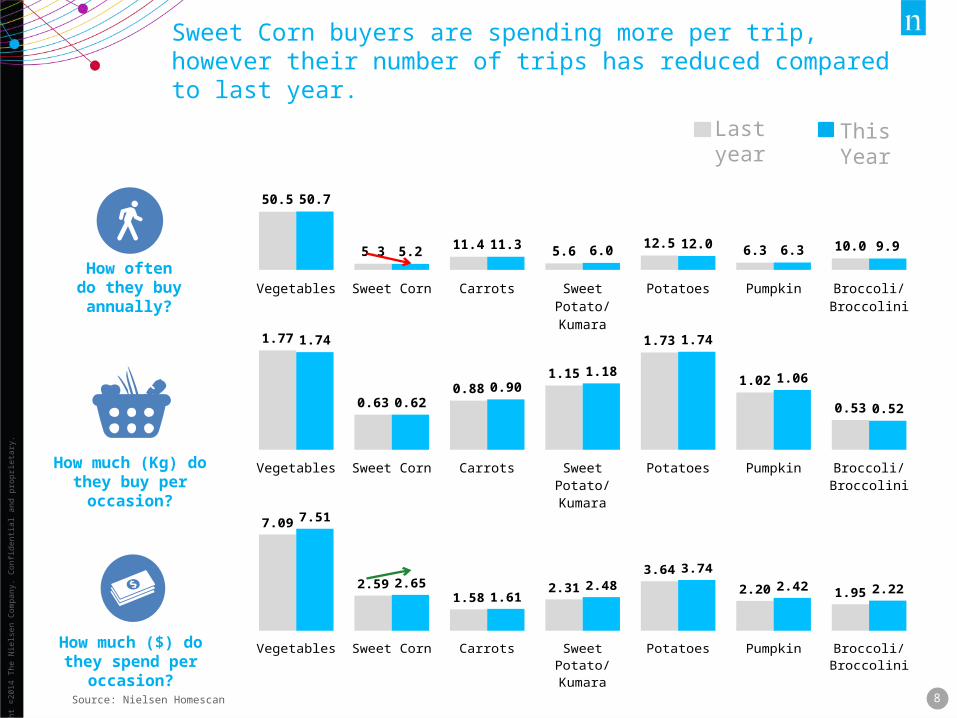
Sweet Corn buyers are spending more per trip, however their number of trips has reduced compared to last year.
Copy
right
©20
14 T
he N
iels
en C
ompa
ny. C
onfid
entia
l and
pro
prie
tary
.
9Source: Nielsen Homescan
4 W
/E 0
3/11
/201
2
4 W
/E 0
1/12
/201
2
4 W
/E 2
9/12
/201
2
4 W
/E 2
6/01
/201
3
4 W
/E 2
3/02
/201
3
4 W
/E 2
3/03
/201
3
4 W
/E 2
0/04
/201
3
4 W
/E 1
8/05
/201
3
4 W
/E 1
5/06
/201
3
4 W
/E 1
3/07
/201
3
4 W
/E 1
0/08
/201
3
4 W
/E 0
7/09
/201
3
4 W
/E 0
5/10
/201
3
4 W
/E 0
2/11
/201
3
4 W
/E 3
0/11
/201
3
4 W
/E 2
8/12
/201
3
4 W
/E 2
5/01
/201
4
4 W
/E 2
2/02
/201
4
4 W
/E 2
2/03
/201
4
4 W
/E 1
9/04
/201
4
4 W
/E 1
7/05
/201
4
4 W
/E 1
4/06
/201
4
4 W
/E 1
2/07
/201
4
4 W
/E 0
9/08
/201
4
4 W
/E 0
6/09
/201
4
4 W
/E 0
4/10
/201
4
15.2 14.5 14.1
17.816.2 16.3
17.5
14.8
17.516.0
17.9
15.317.4
15.7
12.5 12.915.0
16.918.7 19.3
17.9
13.9 14.7
12.0
15.4 14.9
0.9 0.9 0.8
0.9 1.0 0.9
0.8
0.90.8
0.8
0.9
0.8
0.9 0.9
0.8
0.90.8
1.01.0 1.0
0.80.8 0.8
0.8
0.9
0.8
Penetration of households Average volume per household every 4 weeks
Kg
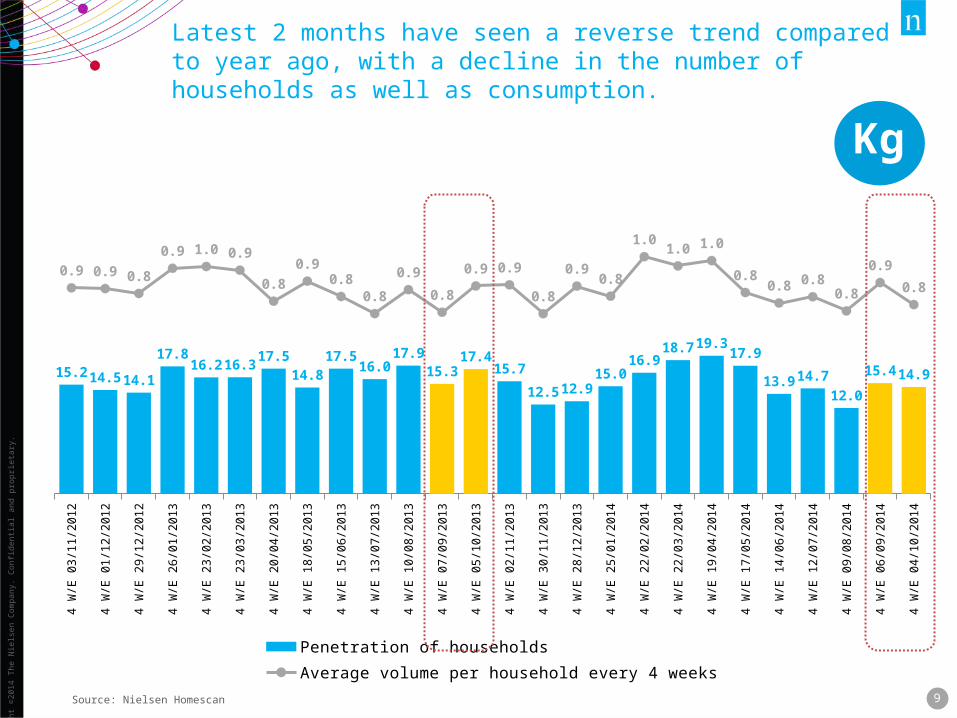
Latest 2 months have seen a reverse trend compared to year ago, with a decline in the number of households as well as consumption.
Copy
right
©20
14 T
he N
iels
en C
ompa
ny. C
onfid
entia
l and
pro
prie
tary
.
10Source: Nielsen Homescan
4 W
/E 0
3/11
/201
2
4 W
/E 0
1/12
/201
2
4 W
/E 2
9/12
/201
2
4 W
/E 2
6/01
/201
3
4 W
/E 2
3/02
/201
3
4 W
/E 2
3/03
/201
3
4 W
/E 2
0/04
/201
3
4 W
/E 1
8/05
/201
3
4 W
/E 1
5/06
/201
3
4 W
/E 1
3/07
/201
3
4 W
/E 1
0/08
/201
3
4 W
/E 0
7/09
/201
3
4 W
/E 0
5/10
/201
3
4 W
/E 0
2/11
/201
3
4 W
/E 3
0/11
/201
3
4 W
/E 2
8/12
/201
3
4 W
/E 2
5/01
/201
4
4 W
/E 2
2/02
/201
4
4 W
/E 2
2/03
/201
4
4 W
/E 1
9/04
/201
4
4 W
/E 1
7/05
/201
4
4 W
/E 1
4/06
/201
4
4 W
/E 1
2/07
/201
4
4 W
/E 0
9/08
/201
4
4 W
/E 0
6/09
/201
4
4 W
/E 0
4/10
/201
4
15.2 14.5 14.1
17.816.2 16.3
17.5
14.8
17.516.0
17.9
15.317.4
15.7
12.5 12.915.0
16.918.7 19.3
17.9
13.9 14.7
12.0
15.4 14.9
4.13.9
3.7
3.4 3.4 3.4 3.43.6
3.3
3.7 3.63.7
3.53.7 3.8 3.7 3.6
3.33.2 3.1
3.4
3.93.6
4.7
4.3 4.4
Penetration of households Average $ spend per household every 4 weeks
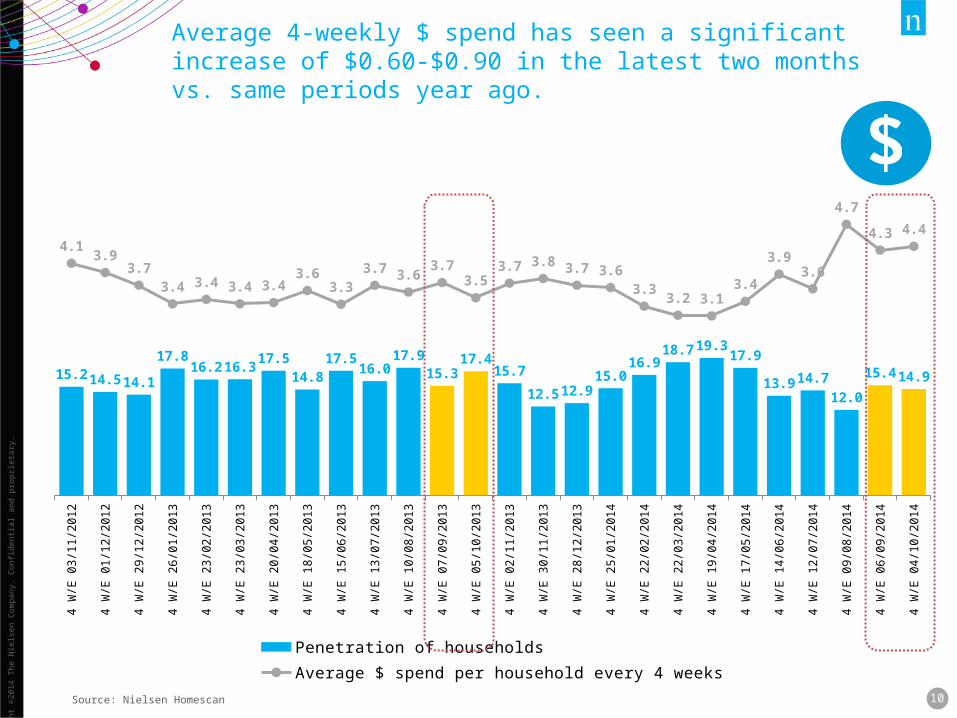
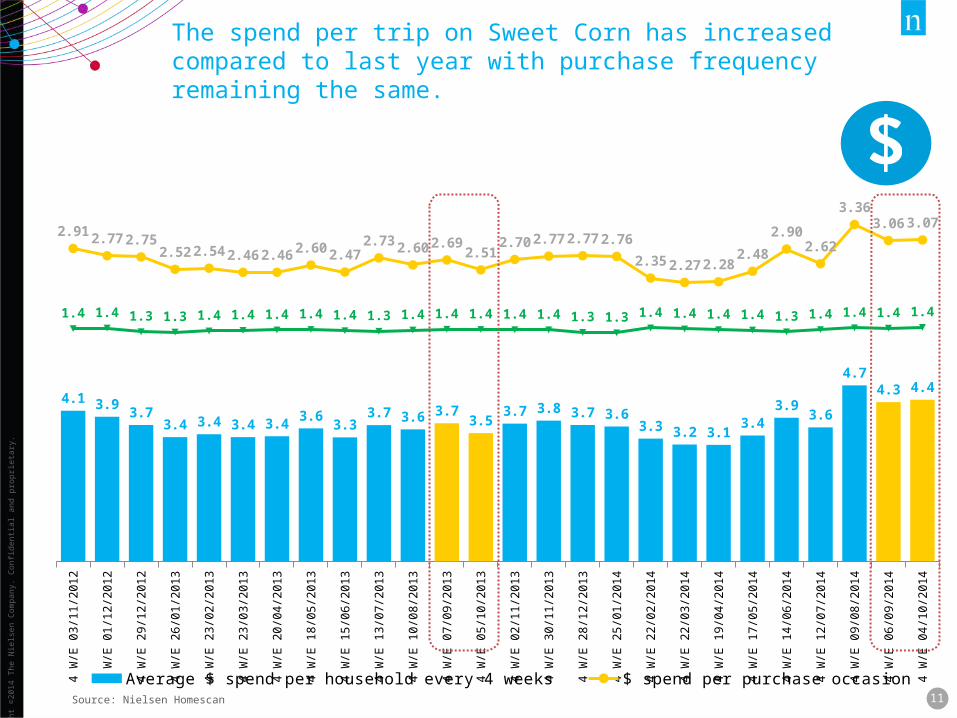
Average 4-weekly $ spend has seen a significant increase of $0.60-$0.90 in the latest two months vs. same periods year ago.
Copy
right
©20
14 T
he N
iels
en C
ompa
ny. C
onfid
entia
l and
pro
prie
tary
.
11Source: Nielsen Homescan
4 W
/E 0
3/11
/201
2
4 W
/E 0
1/12
/201
2
4 W
/E 2
9/12
/201
2
4 W
/E 2
6/01
/201
3
4 W
/E 2
3/02
/201
3
4 W
/E 2
3/03
/201
3
4 W
/E 2
0/04
/201
3
4 W
/E 1
8/05
/201
3
4 W
/E 1
5/06
/201
3
4 W
/E 1
3/07
/201
3
4 W
/E 1
0/08
/201
3
4 W
/E 0
7/09
/201
3
4 W
/E 0
5/10
/201
3
4 W
/E 0
2/11
/201
3
4 W
/E 3
0/11
/201
3
4 W
/E 2
8/12
/201
3
4 W
/E 2
5/01
/201
4
4 W
/E 2
2/02
/201
4
4 W
/E 2
2/03
/201
4
4 W
/E 1
9/04
/201
4
4 W
/E 1
7/05
/201
4
4 W
/E 1
4/06
/201
4
4 W
/E 1
2/07
/201
4
4 W
/E 0
9/08
/201
4
4 W
/E 0
6/09
/201
4
4 W
/E 0
4/10
/201
4
4.1 3.9 3.73.4 3.4 3.4 3.4 3.6
3.33.7 3.6 3.7
3.53.7 3.8 3.7 3.6
3.3 3.2 3.13.4
3.93.6
4.74.3 4.4
2.91 2.77 2.752.52 2.54 2.46 2.46 2.60 2.47
2.73 2.60 2.692.51
2.70 2.77 2.77 2.76
2.35 2.27 2.282.48
2.902.62
3.363.06 3.07
1.4 1.4 1.3 1.3 1.4 1.4 1.4 1.4 1.4 1.3 1.4 1.4 1.4 1.4 1.4 1.3 1.3 1.4 1.4 1.4 1.4 1.3 1.4 1.4 1.4 1.4
Average $ spend per household every 4 weeks $ spend per purchase occasionAverage purchase occasions every 4 weeks
The spend per trip on Sweet Corn has increased compared to last year with purchase frequency remaining the same.
Copy
right
©20
14 T
he N
iels
en C
ompa
ny. C
onfid
entia
l and
pro
prie
tary
.
12
DemographicsSweet Corn
Copy
right
©20
14 T
he N
iels
en C
ompa
ny. C
onfid
entia
l and
pro
prie
tary
.
14Source: Nielsen Homescan
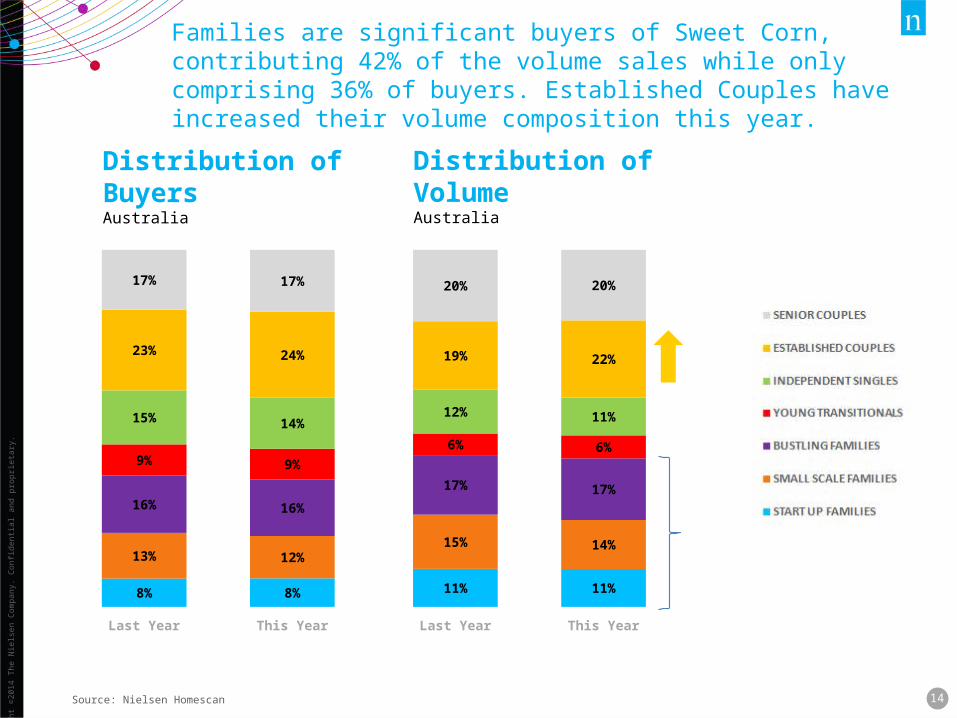
Distribution of BuyersAustralia
Distribution of VolumeAustralia
Last Year This Year
8% 8%
13% 12%
16% 16%
9% 9%
15% 14%
23% 24%
17% 17%
Last Year This Year
11% 11%
15% 14%
17% 17%
6% 6%
12% 11%
19% 22%
20% 20%
Families are significant buyers of Sweet Corn, contributing 42% of the volume sales while only comprising 36% of buyers. Established Couples have increased their volume composition this year.
Copy
right
©20
14 T
he N
iels
en C
ompa
ny. C
onfid
entia
l and
pro
prie
tary
.
15
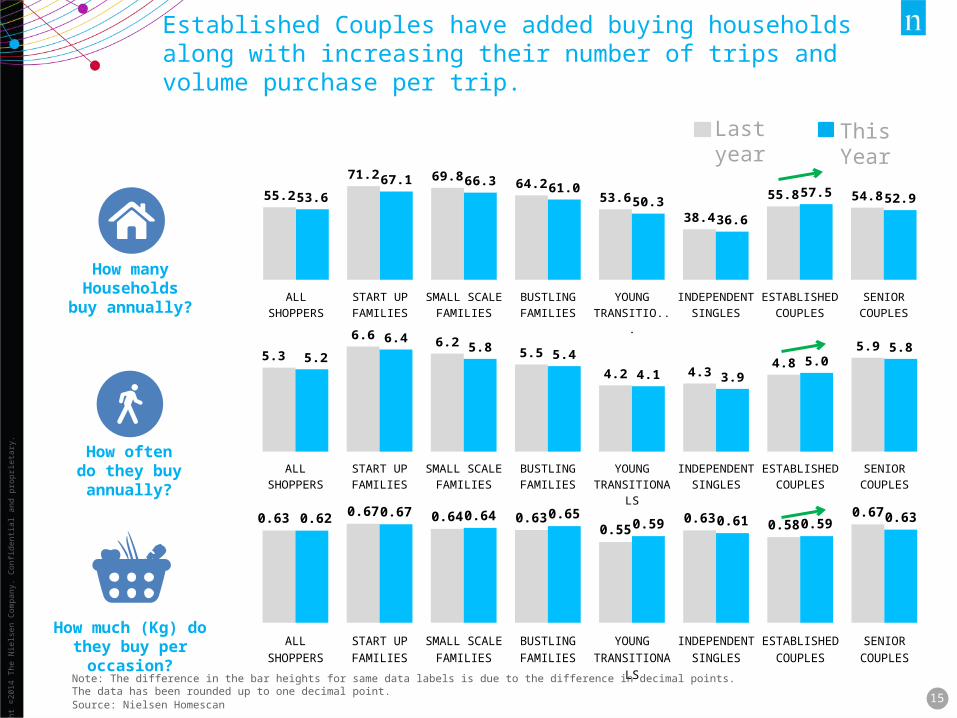
How many Households buy
annually?
How often do they buy annually?
How much (Kg) do they buy per occasion?
ALL SHOPPERS START UP FAM-ILIES
SMALL SCALE FAMILIES
BUSTLING FAMILIES
YOUNG TRANSITION-
ALS
INDEPENDENT SINGLES
ESTABLISHED COUPLES
SENIOR COUPLES
55.2
71.2 69.8 64.253.6
38.4
55.8 54.853.667.1 66.3 61.0
50.336.6
57.5 52.9
ALL SHOPPERS START UP FAM-ILIES
SMALL SCALE FAMILIES
BUSTLING FAM-ILIES
YOUNG TRANSITION-
ALS
INDEPENDENT SINGLES
ESTABLISHED COUPLES
SENIOR COUPLES
5.3
6.66.2
5.5
4.2 4.34.8
5.95.2
6.45.8
5.4
4.1 3.9
5.05.8
ALL SHOPPERS START UP FAM-ILIES
SMALL SCALE FAMILIES
BUSTLING FAM-ILIES
YOUNG TRANSITION-
ALS
INDEPENDENT SINGLES
ESTABLISHED COUPLES
SENIOR COUPLES
0.630.67 0.64 0.63
0.550.63
0.580.670.62 0.67 0.64 0.65
0.59 0.61 0.59 0.63
This YearLast year
Note: The difference in the bar heights for same data labels is due to the difference in decimal points. The data has been rounded up to one decimal point. Source: Nielsen Homescan
Established Couples have added buying households along with increasing their number of trips and volume purchase per trip.
Copy
right
©20
14 T
he N
iels
en C
ompa
ny. C
onfid
entia
l and
pro
prie
tary
.
16Source: Nielsen Homescan
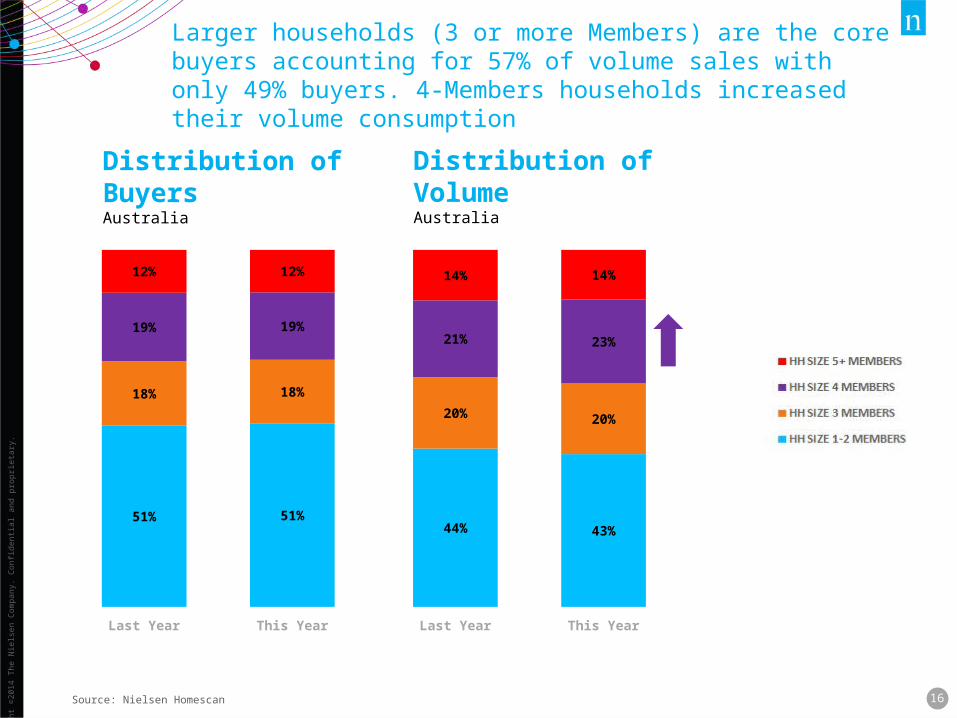
Distribution of BuyersAustralia
Distribution of VolumeAustralia
Last Year This Year
51% 51%
18% 18%
19% 19%
12% 12%
Last Year This Year
44% 43%
20% 20%
21% 23%
14% 14%
Larger households (3 or more Members) are the core buyers accounting for 57% of volume sales with only 49% buyers. 4-Members households increased their volume consumption
Copy
right
©20
14 T
he N
iels
en C
ompa
ny. C
onfid
entia
l and
pro
prie
tary
.
17
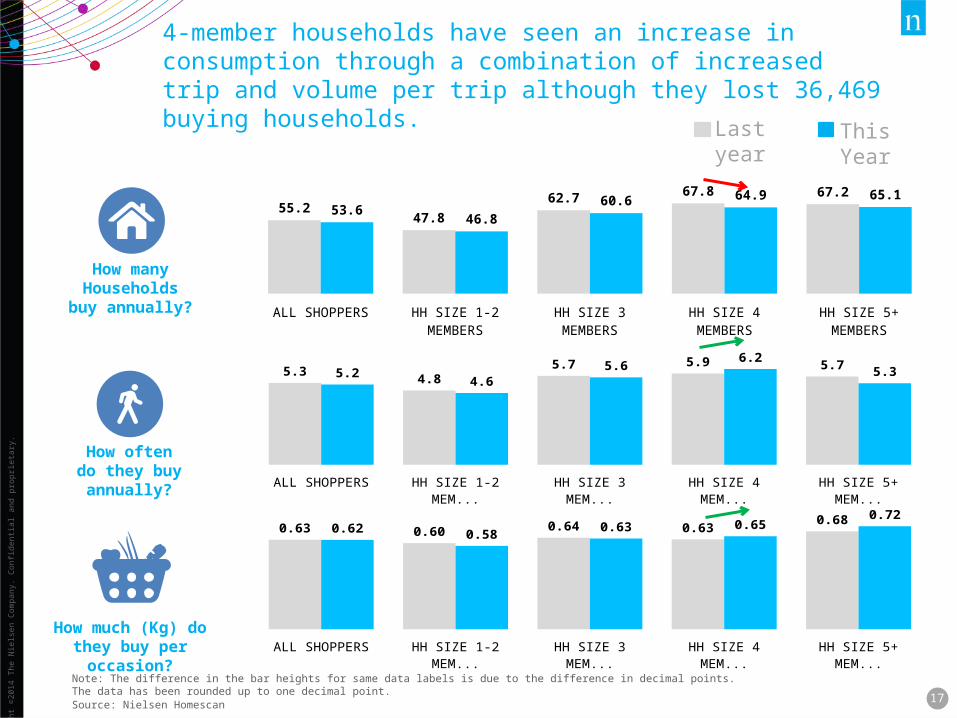
How many Households buy
annually?
How often do they buy annually?
How much (Kg) do they buy per occasion?
ALL SHOPPERS HH SIZE 1-2 MEMBERS HH SIZE 3 MEMBERS HH SIZE 4 MEMBERS HH SIZE 5+ MEMBERS
55.247.8
62.7 67.8 67.2
53.646.8
60.6 64.9 65.1
ALL SHOPPERS HH SIZE 1-2 MEMBERS HH SIZE 3 MEMBERS HH SIZE 4 MEMBERS HH SIZE 5+ MEMBERS
5.3 4.85.7 5.9 5.7
5.24.6
5.66.2
5.3
ALL SHOPPERS HH SIZE 1-2 MEMBERS HH SIZE 3 MEMBERS HH SIZE 4 MEMBERS HH SIZE 5+ MEMBERS
0.63 0.60 0.64 0.630.68
0.62 0.58 0.63 0.650.72
This YearLast year
Note: The difference in the bar heights for same data labels is due to the difference in decimal points. The data has been rounded up to one decimal point. Source: Nielsen Homescan
4-member households have seen an increase in consumption through a combination of increased trip and volume per trip although they lost 36,469 buying households.
Copy
right
©20
12 T
he N
iels
en C
ompa
ny. C
onfid
entia
l and
pro
prie
tary
.
18Copy
right
© 2
014
The
Nie
lsen
Com
pany
. Con
fiden
tial a
nd p
ropr
ieta
ry.
Retail HealthSituation by stateSweet Corn
Copy
right
©20
14 T
he N
iels
en C
ompa
ny. C
onfid
entia
l and
pro
prie
tary
.
19
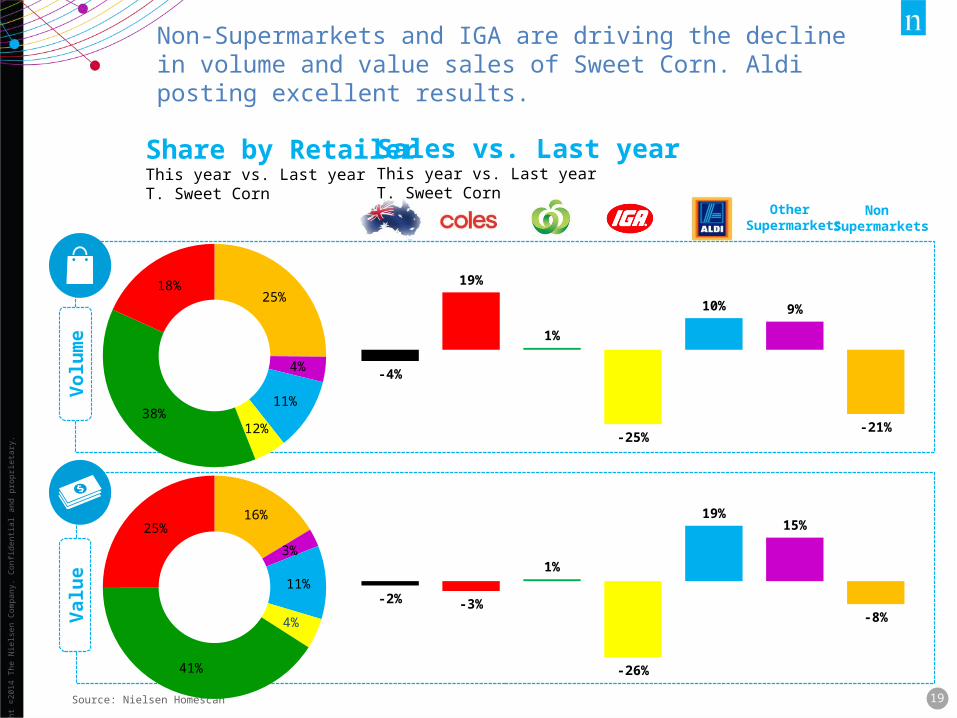
Share by RetailerThis year vs. Last yearT. Sweet Corn
Sales vs. Last yearThis year vs. Last yearT. Sweet Corn
Other Supermarkets
Non Supermarkets
Volu
me
Valu
e
Source: Nielsen Homescan
16%
3%
11%
4%
41%
25%
25%
4%
11%
12%38%
18%
-21%
9%10%
-25%
1%
19%
-4%
-8%
15%19%
-26%
1%
-3%-2%
Non-Supermarkets and IGA are driving the decline in volume and value sales of Sweet Corn. Aldi posting excellent results.
Copy
right
©20
14 T
he N
iels
en C
ompa
ny. C
onfid
entia
l and
pro
prie
tary
.
21
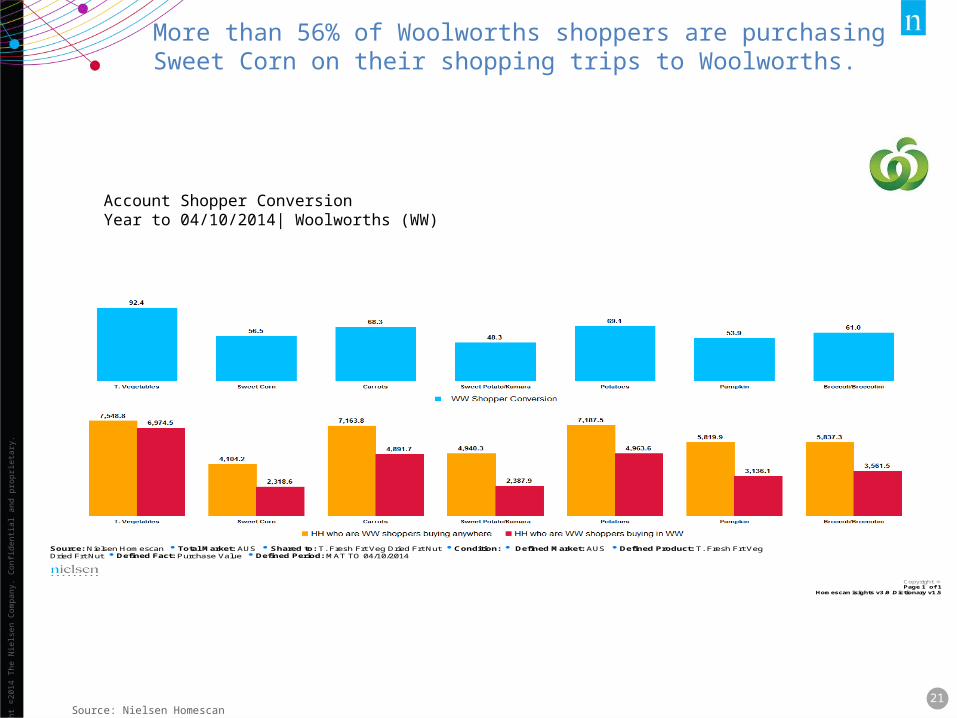
Source: Nielsen Homescan Total Market: AUS Shared to: T. Fresh Frt Veg Dried Frt Nut Condition: Defined Market: AUS Defined Product: T. Fresh Frt Veg Dried Frt Nut Defined Fact: Purchase Value Defined Period: MAT TO 04/10/2014
Copyright © Page 1 of 1
Homescan isights v3.0 .Dictionary v1.5
Source: Nielsen Homescan
Account Shopper ConversionYear to 04/10/2014| Woolworths (WW)
More than 56% of Woolworths shoppers are purchasing Sweet Corn on their shopping trips to Woolworths.
Copy
right
©20
14 T
he N
iels
en C
ompa
ny. C
onfid
entia
l and
pro
prie
tary
.
22
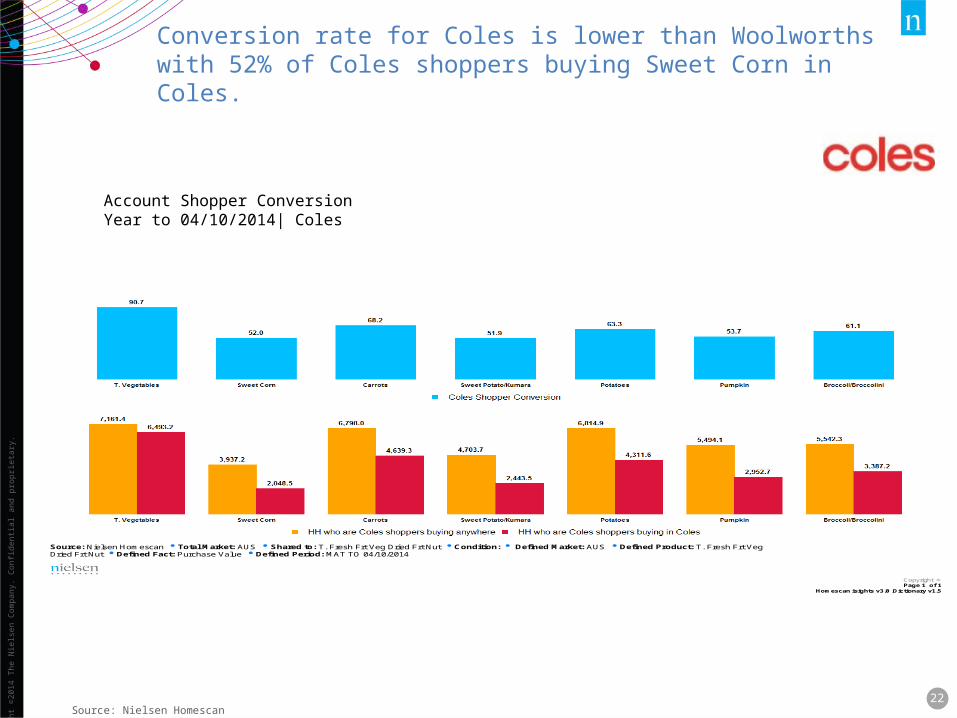
Source: Nielsen Homescan Total Market: AUS Shared to: T. Fresh Frt Veg Dried Frt Nut Condition: Defined Market: AUS Defined Product: T. Fresh Frt Veg Dried Frt Nut Defined Fact: Purchase Value Defined Period: MAT TO 04/10/2014
Copyright © Page 1 of 1
Homescan isights v3.0 .Dictionary v1.5
Source: Nielsen Homescan
Account Shopper ConversionYear to 04/10/2014| Coles
Conversion rate for Coles is lower than Woolworths with 52% of Coles shoppers buying Sweet Corn in Coles.
Copy
right
©20
14 T
he N
iels
en C
ompa
ny. C
onfid
entia
l and
pro
prie
tary
.
23
52.8 50.5
3.4
3.0
SA + NT (7%)
VIC (24%)
NSW (35%)
QLD (21%)
WA (10%)
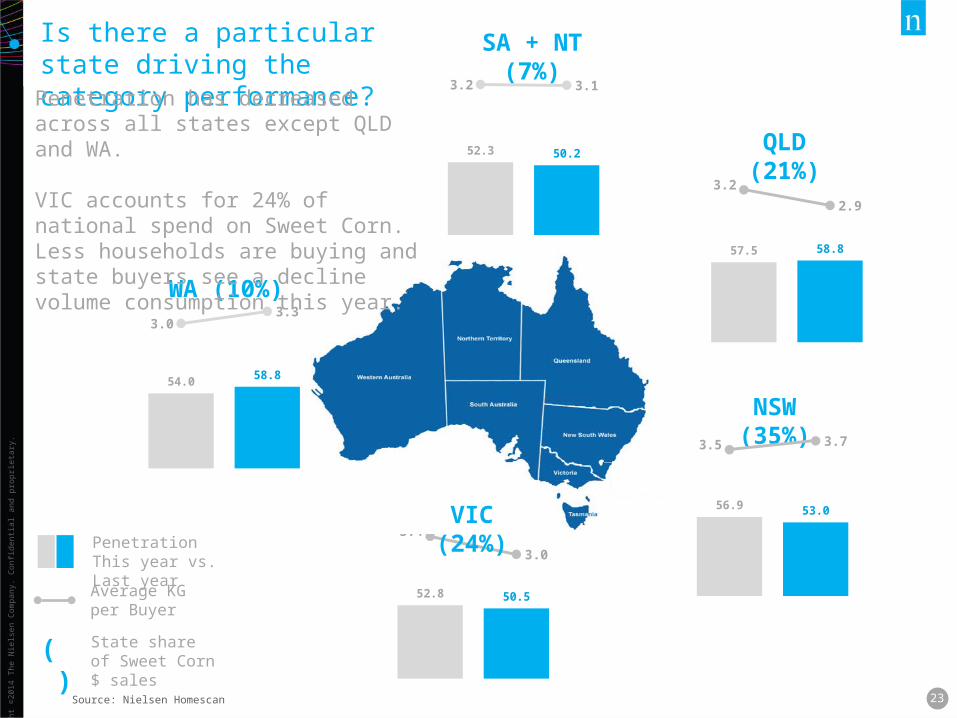
Average KG per Buyer
Penetration This year vs. Last year
( ) State share of Sweet Corn $ sales
Is there a particular state driving the category performance?
Penetration has decreased across all states except QLD and WA.
VIC accounts for 24% of national spend on Sweet Corn. Less households are buying and state buyers see a decline volume consumption this year.
Source: Nielsen Homescan
54.0 58.8
3.03.3
52.3 50.2
3.2 3.1
57.5 58.8
3.2
2.9
56.9 53.0
3.5 3.7

THANK YOU