Embed Size (px)
DESCRIPTION
Â
Citation preview
IAJPS, 2014, Volume1, Issue (6), 407- 419 Swetha et al ISSN 2349-7750
w w w . i a j p s . c o m
Page 407
ISSN 2349-7750
IINNDDOO AAMMEERRIICCAANN JJOOUURRNNAALL OOFF
PPHHAARRMMAACCEEUUTTIICCAALL SSCCIIEENNCCEESS
Available online at: http://www.iajps.com Research Article
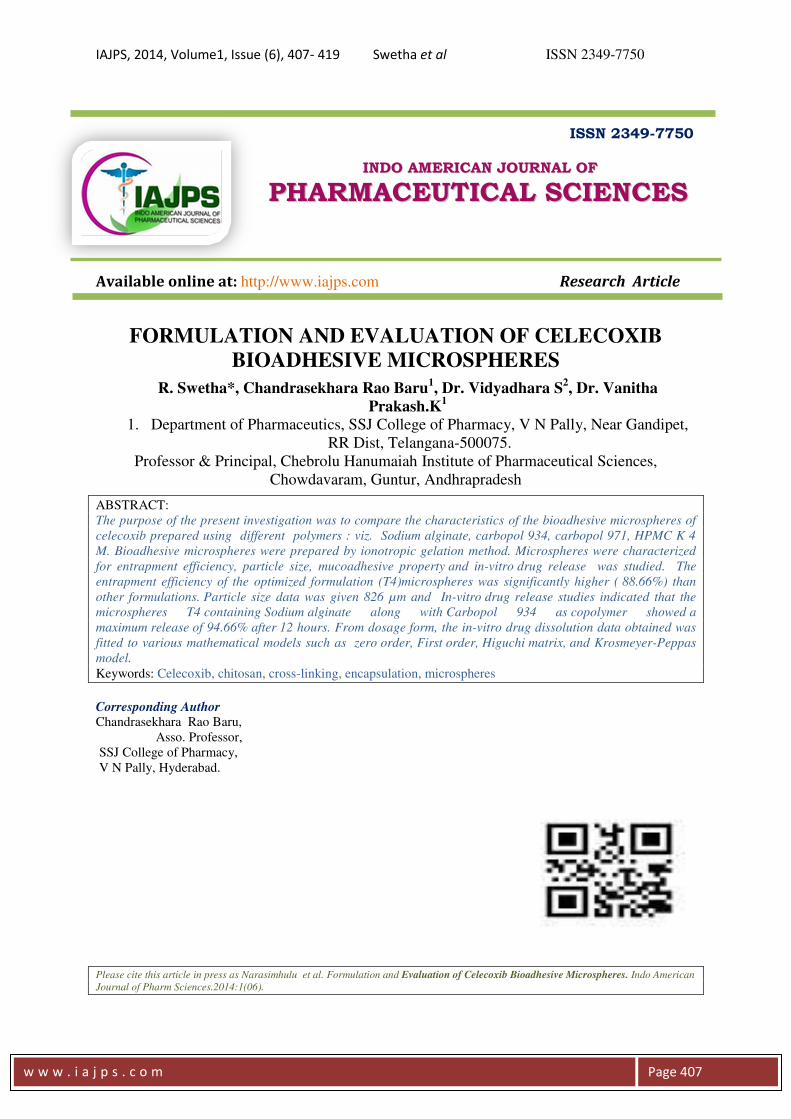
FORMULATION AND EVALUATION OF CELECOXIB
BIOADHESIVE MICROSPHERES
R. Swetha*, Chandrasekhara Rao Baru1, Dr. Vidyadhara S
2, Dr. Vanitha
Prakash.K1
1. Department of Pharmaceutics, SSJ College of Pharmacy, V N Pally, Near Gandipet,
RR Dist, Telangana-500075.
Professor & Principal, Chebrolu Hanumaiah Institute of Pharmaceutical Sciences,
Chowdavaram, Guntur, Andhrapradesh
ABSTRACT:
The purpose of the present investigation was to compare the characteristics of the bioadhesive microspheres of
celecoxib prepared using different polymers : viz. Sodium alginate, carbopol 934, carbopol 971, HPMC K 4
M. Bioadhesive microspheres were prepared by ionotropic gelation method. Microspheres were characterized
for entrapment efficiency, particle size, mucoadhesive property and in-vitro drug release was studied. The
entrapment efficiency of the optimized formulation (T4)microspheres was significantly higher ( 88.66%) than
other formulations. Particle size data was given 826 µm and In-vitro drug release studies indicated that the
microspheres T4 containing Sodium alginate along with Carbopol 934 as copolymer showed a
maximum release of 94.66% after 12 hours. From dosage form, the in-vitro drug dissolution data obtained was
fitted to various mathematical models such as zero order, First order, Higuchi matrix, and Krosmeyer-Peppas
model.
Keywords: Celecoxib, chitosan, cross-linking, encapsulation, microspheres
Corresponding Author
Chandrasekhara Rao Baru,
Asso. Professor,
SSJ College of Pharmacy,
V N Pally, Hyderabad.
Please cite this article in press as Narasimhulu et al. Formulation and Evaluation of Celecoxib Bioadhesive Microspheres. Indo American
Journal of Pharm Sciences.2014:1(06).
IAJPS, 2014, Volume1, Issue (6), 407- 419 Swetha et al ISSN 2349-7750
w w w . i a j p s . c o m
Page 408
INTRODUCTION:
For many decades, medication of an acute disease
or a chronic disease has been accomplished by
delivering drugs to the patients via various
pharmaceutical dosage forms like tablets, capsules,
pills, creams, ointments, liquids, aerosols,
injectables and suppositories as carriers. To achieve
and then to maintain the concentration of drug
administered within the therapeutically effective
range needed for medication, it is often necessary
to take this type of drug delivery systems several
times in a day. This results in a fluctuated drug
level and consequently undesirable toxicity and
poor efficiency. This factor as well as other factors
such as repetitive dosing and unpredictable
absorption leads to the concept of controlled drug
delivery systems[1,2]. The word new or novel in
the relation to drug delivery system is a search for
something out of necessity. An appropriately
designed sustained or controlled release drug
delivery system can be major advance toward
solving the problem associated with the existing
drug delivery system[3,4]. The objective of
controlled release drug delivery includes two
important aspects namely spatial placement and
temporal delivery of drug.
1.Spatial placement relates to targeting a drug to a
specific organ or tissue, while
2.Temporal delivery refers to controlling the rate of
drug delivery to the target tissue[5].
In the ionotropic gelation method polysaccharid
es (alginate, gellan and pectin) are dissolved
in water or in weak acidic medium (chitosan).
These solutions are then added
drpowise under constant stirring
to the solutions containing other counter ions.
Due to the complexation between oppositely charge
d species, polysaccharides
undergo ionic gelation and precipitate to form sp
herical particles.The beads are
removed by filtration, washed with distilled water a
nd dried. The method involves an all-aqueous
system and avoids residual solvents in
microspheres
Celecoxib is a newer anti-arthritic drug which is
selective cyclo-oxygenase-II (COX-II) inhibitor.
But, since COX-II is constitutively present in some
organs and can be induced in other organs,
selective COX-II inhibitors are not devoid of side
effects. The side effects can be avoided by
targeting the drug to the arthritic joints. One way of
achieving higher concentrations in the joint for
prolonged period of time is to inject the drug intra-
articularly. In our pervious report [6], we have
shown that post intra-articular injection, celecoxib
incorporated chitosan microspheres are able to
maintain significantly higher concentrations of the
drug in the arthritic joint than the celecoxib
solution. Thus, the present investigation was aimed
to prepare an optimized formulation for use as an
intra-articular injection. The effect of the different
cross-linking agents on the characteristics of the
microspheres was studied and a cross-linking agent
which gave the desirable properties of the
microspheres intended for intra-articular injection
was chosen for in-vivo studies as reported earlier.
MATERIALS AND METHODS
The drug Celecoxib was gifted by Natco Pharma
LtD.,Hyderabad, India. Sodium alginate, carbopol
934,carbopol 971,HPMC K 4 M was purchased
from SD fine chemicals limited, India. All other
chemicals and solvents were of analytical grade
and used without further purification.
Method of Preparation
Ionotropic Gelation Method:
Batches of microspheres were prepared by
ionotropic gelation method which involved reaction
between sodium alginate and polycationic ions like
calcium to produce a hydrogel network of calcium
alginate. Sodium alginate and the mucoadhesive
polymer were dispersed in purified water (10 ml) to
form a homogeneous polymer mixture. The API,
(100 mg) was added to the polymer premix and
mixed thoroughly with a stirrer to form a viscous
dispersion. The resulting dispersion was then added
through a 22G needle into calcium chloride (4%
w/v) solution. The addition was done with
continuous stirring at 200rpm. The added droplets
were retained in the calcium chloride solution for
30 minutes to complete the curing reaction and to
produce rigid spherical microspheres. The
microspheres were collected by decantation, and
the product thus separated was washed repeatedly
with purified water to remove excess calcium
impurity deposited on the surface of microspheres
and then air-dried.
IAJPS, 2014, Volume1, Issue (6), 407- 419 Swetha et al ISSN 2349-7750
w w w . i a j p s . c o m
Page 409
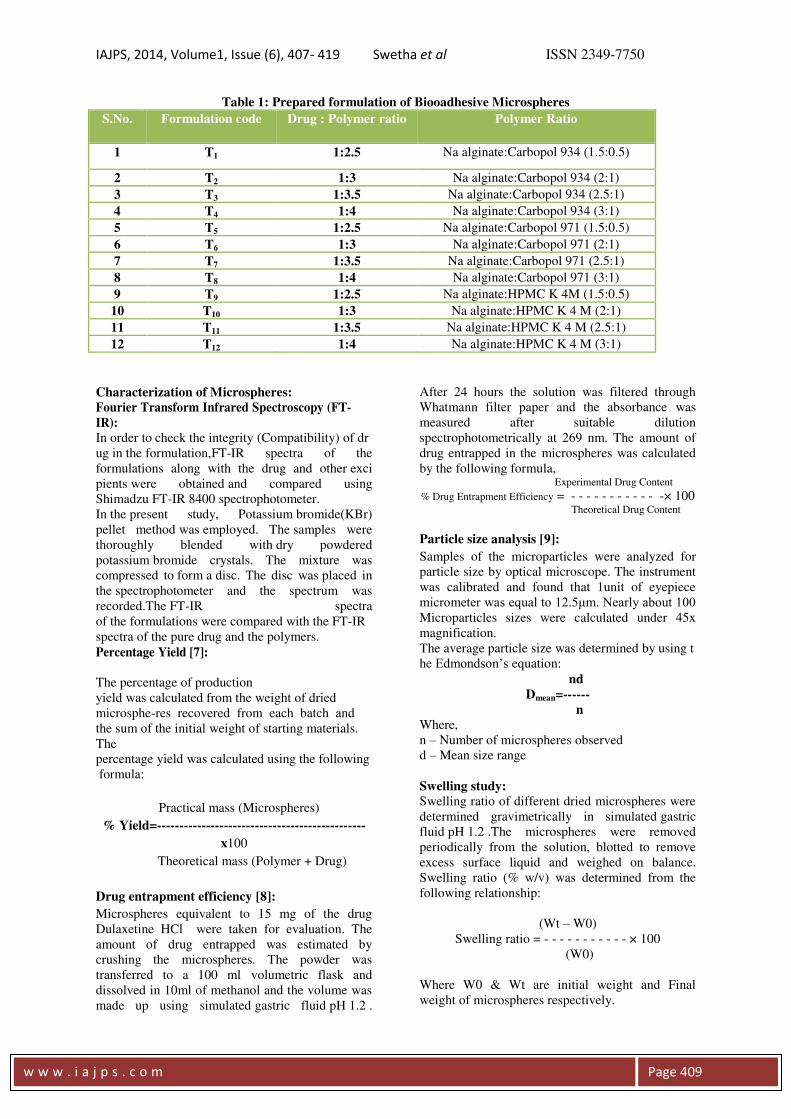
Table 1: Prepared formulation of Biooadhesive Microspheres
S.No. Formulation code Drug : Polymer ratio Polymer Ratio
1 T1 1:2.5 Na alginate:Carbopol 934 (1.5:0.5)
2 T2 1:3 Na alginate:Carbopol 934 (2:1)
3 T3 1:3.5 Na alginate:Carbopol 934 (2.5:1)
4 T4 1:4 Na alginate:Carbopol 934 (3:1)
5 T5 1:2.5 Na alginate:Carbopol 971 (1.5:0.5)
6 T6 1:3 Na alginate:Carbopol 971 (2:1)
7 T7 1:3.5 Na alginate:Carbopol 971 (2.5:1)
8 T8 1:4 Na alginate:Carbopol 971 (3:1)
9 T9 1:2.5 Na alginate:HPMC K 4M (1.5:0.5)
10 T10 1:3 Na alginate:HPMC K 4 M (2:1)
11 T11 1:3.5 Na alginate:HPMC K 4 M (2.5:1)
12 T12 1:4 Na alginate:HPMC K 4 M (3:1)
Characterization of Microspheres:
Fourier Transform Infrared Spectroscopy (FT-
IR): In order to check the integrity (Compatibility) of dr
ug in the formulation,FT-IR spectra of the
formulations along with the drug and other exci
pients were obtained and compared using
Shimadzu FT-IR 8400 spectrophotometer.
In the present study, Potassium bromide(KBr)
pellet method was employed. The samples were
thoroughly blended with dry powdered
potassium bromide crystals. The mixture was
compressed to form a disc. The disc was placed in
the spectrophotometer and the spectrum was
recorded.The FT-IR spectra
of the formulations were compared with the FT-IR
spectra of the pure drug and the polymers.
Percentage Yield [7]:
The percentage of production
yield was calculated from the weight of dried
microsphe-res recovered from each batch and
the sum of the initial weight of starting materials.
The
percentage yield was calculated using the following
formula:
Practical mass (Microspheres)
% Yield=-----------------------------------------------
x100
Theoretical mass (Polymer + Drug)
Drug entrapment efficiency [8]:
Microspheres equivalent to 15 mg of the drug
Dulaxetine HCl were taken for evaluation. The
amount of drug entrapped was estimated by
crushing the microspheres. The powder was
transferred to a 100 ml volumetric flask and
dissolved in 10ml of methanol and the volume was
made up using simulated gastric fluid pH 1.2 .
After 24 hours the solution was filtered through
Whatmann filter paper and the absorbance was
measured after suitable dilution
spectrophotometrically at 269 nm. The amount of
drug entrapped in the microspheres was calculated
by the following formula,
Experimental Drug Content
% Drug Entrapment Efficiency = - - - - - - - - - - - -× 100 Theoretical Drug Content
Particle size analysis [9]:
Samples of the microparticles were analyzed for
particle size by optical microscope. The instrument
was calibrated and found that 1unit of eyepiece
micrometer was equal to 12.5μm. Nearly about 100 Microparticles sizes were calculated under 45x
magnification.
The average particle size was determined by using t
he Edmondson’s equation:
nd
Dmean=------
n
Where,
n – Number of microspheres observed
d – Mean size range
Swelling study:
Swelling ratio of different dried microspheres were
determined gravimetrically in simulated gastric
fluid pH 1.2 .The microspheres were removed
periodically from the solution, blotted to remove
excess surface liquid and weighed on balance.
Swelling ratio (% w/v) was determined from the
following relationship:
(Wt – W0)
Swelling ratio = - - - - - - - - - - - × 100
(W0)
Where W0 & Wt are initial weight and Final
weight of microspheres respectively.
IAJPS, 2014, Volume1, Issue (6), 407- 419 Swetha et al ISSN 2349-7750
w w w . i a j p s . c o m
Page 410
Evaluation of mucoadhesive property:
The mucoadhesive property of microspheres was
evaluated by an in vitro adhesion testing method
known as wash-off method. Freshly excised pieces
of goat stomach mucous were mounted on to glass
slides with cotton thread. About 20 microspheres
were spread on to each prepared glass slide and
immediately thereafter the slides were hung to USP
II tablet disintegration test, when the test apparatus
was operated, the sample is subjected to slow up
and down movement in simulated gastric
fluid pH 1.2 at 370
C contained in a 1-litre vessel of
the apparatus. At an interval of 1 hour up to 8 hours
the machine is stopped and number of
microspheres still adhering to mucosal surface was
counted.
Number of microspheres adhered
% Mucoadhesion= ---------------------------------------
--- ×100
Number of microspheres applied
In vitro drug release study:
The dissolution studies were performed in a fully
calibrated eight station dissolution test apparatus
(37 ± 0.50C, 50 rpm) using the USP type – I
rotating basket method in simulated gastric
fluid pH 1.2 (900ml). A quantity of accurately
weighed microspher- es equivalent to 15mg
Dulaxetine HCl each formulation was employed in
all dissolution studies. Aliquots of sample were
withdrawn at predetermined intervals of time and
analyzed for drug release by measuring the
absorbance at 269nm. At the same time the volume
withdrawn at each time intervals were replenished
immediately with the same volume of fresh pre-
warmed simulated gastric fluid pH 1.2 maintaining
sink conditions throughout the experiment.
In-Vitro Drug Release Kinetics
The release data obtained was fitted into various ma
thematical models.The parameters ‘n’ and time component ‘k’,the release
rate constant and ‘R’,the regression coefficient
were determined by Korsmeyer-
Peppas equation to understand the release mechanis
m.
a. Zero Order
% R = kt
This model represents an ideal release in order to
achieve prolonged pharmacological
action.
This is applicable to dosage forms like transderm
al systems, coated forms, osmotic
systems, as well as Matrix tablets containing low so
luble drugs.
b. First Order
log (fraction unreleased) = kt/2.303
The model is applicable to hydrolysis kinetics a
nd to study the release profiles of pharmaceutical
dosage forms such as
those containing water soluble drugs in porous
matrices.
c. Matrix (Higuchi Matrix)
% R = kt 0.5
This model is applicable to systems with drug disp
ersed in uniform swellable polymer
matrix as in case of matrix tablets with water solubl
e drug.
d. Peppas Korsmeyer Equation
% R = kt n
log % R = logk + nlogt
This model is widely used when release mechanism
is well known or when more than one
type of release phenomenon could be involved.
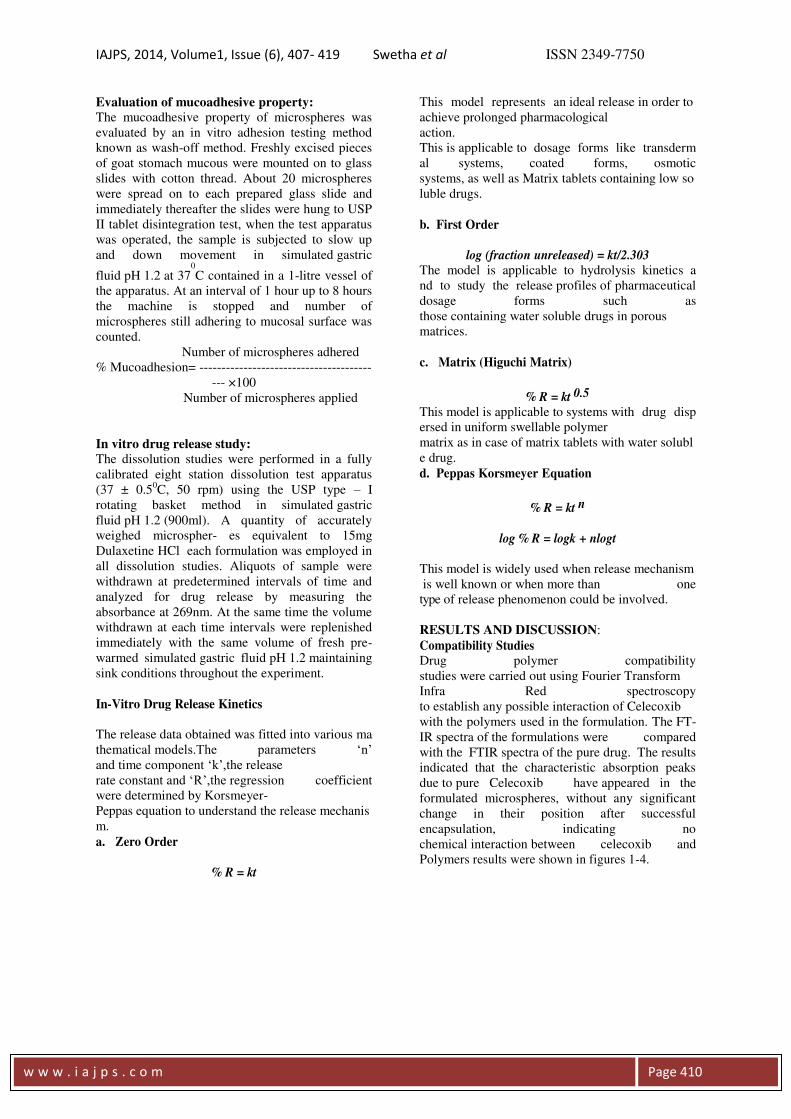
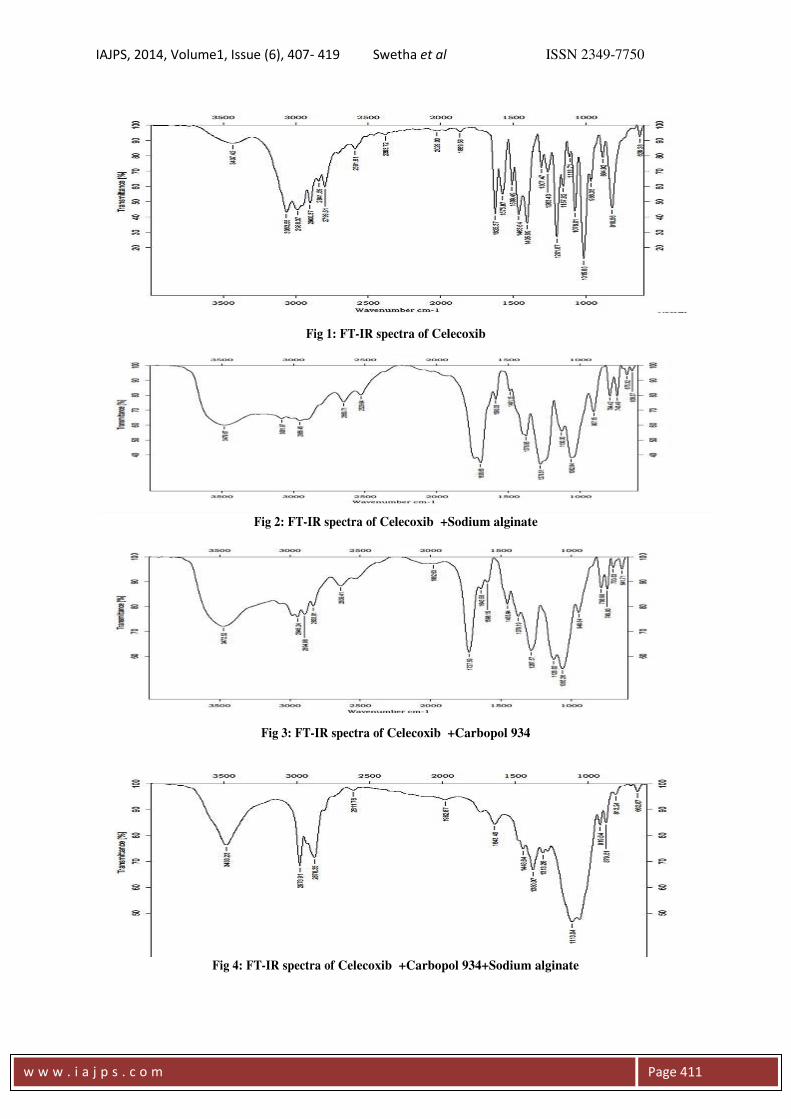
RESULTS AND DISCUSSION:
Compatibility Studies Drug polymer compatibility
studies were carried out using Fourier Transform
Infra Red spectroscopy
to establish any possible interaction of Celecoxib
with the polymers used in the formulation. The FT-
IR spectra of the formulations were compared
with the FTIR spectra of the pure drug. The results
indicated that the characteristic absorption peaks
due to pure Celecoxib have appeared in the
formulated microspheres, without any significant
change in their position after successful
encapsulation, indicating no
chemical interaction between celecoxib and
Polymers results were shown in figures 1-4.
IAJPS, 2014, Volume1, Issue (6), 407- 419 Swetha et al ISSN 2349-7750
w w w . i a j p s . c o m
Page 411
Fig 1: FT-IR spectra of Celecoxib
Fig 2: FT-IR spectra of Celecoxib +Sodium alginate
Fig 3: FT-IR spectra of Celecoxib +Carbopol 934
Fig 4: FT-IR spectra of Celecoxib +Carbopol 934+Sodium alginate
IAJPS, 2014, Volume1, Issue (6), 407- 419 Swetha et al ISSN 2349-7750
w w w . i a j p s . c o m
Page 412
Evaluation and Characterisation of Microspheres
Percentage Yield
It was observed that as the polymer ratio in the
formulation increases, the product yield also
increases. The low percentage yield in some
formulations may be due to blocking of needle and
wastage of the drug- polymer solution,
adhesion of polymer solution to the magnetic bead
and microspheres lost during the washing process.
The percentage yield was found to be in the range
of 80 to 88% for microspheres containing sodium
alginate along with carbopol 934 as copolymer,
62.22 to 87% for microspheres containing sodium
alginate along with carbopol 971 as copolymer and
80 to 87.5% for microspheres containing sodium
alginate along with HPMC K 4 M as copolymer.
The percentage yield of the prepared microspheres
is recorded in Table 6.3 and displayed in Figures
6.7 to 6.9.
Drug Entrapment Efficiency
Percentage Drug entrapment efficiency of
Celecoxib ranged from 82.66 to 88.66% for
microspheres containing sodium alginate along
with carbopol 934 as copolymer,
53.2 to 76.66% for microspheres containing sodium
alginate along with carbopol 971 as copolymer and
66.73 to 79.2% for microspheres containing sodium
alginate along with HPMC K 4 M as copolymer.
The drug entrapment efficiency of the prepared
microspheres increased progressively with an
increase in proportion of the respective polymers.
Increase in the polymer concentration increases the
viscosity of the dispersed phase. The particle size
increases exponentially with viscosity. The higher
viscosity of the polymer solution
at the highest polymer concentration would be
expected to decrease the diffusion of
the drug into the external phase which would result
in higher entrapment efficiency.
The % drug entrapment efficiency of the prepared
microspheres is displayed in Table 2.
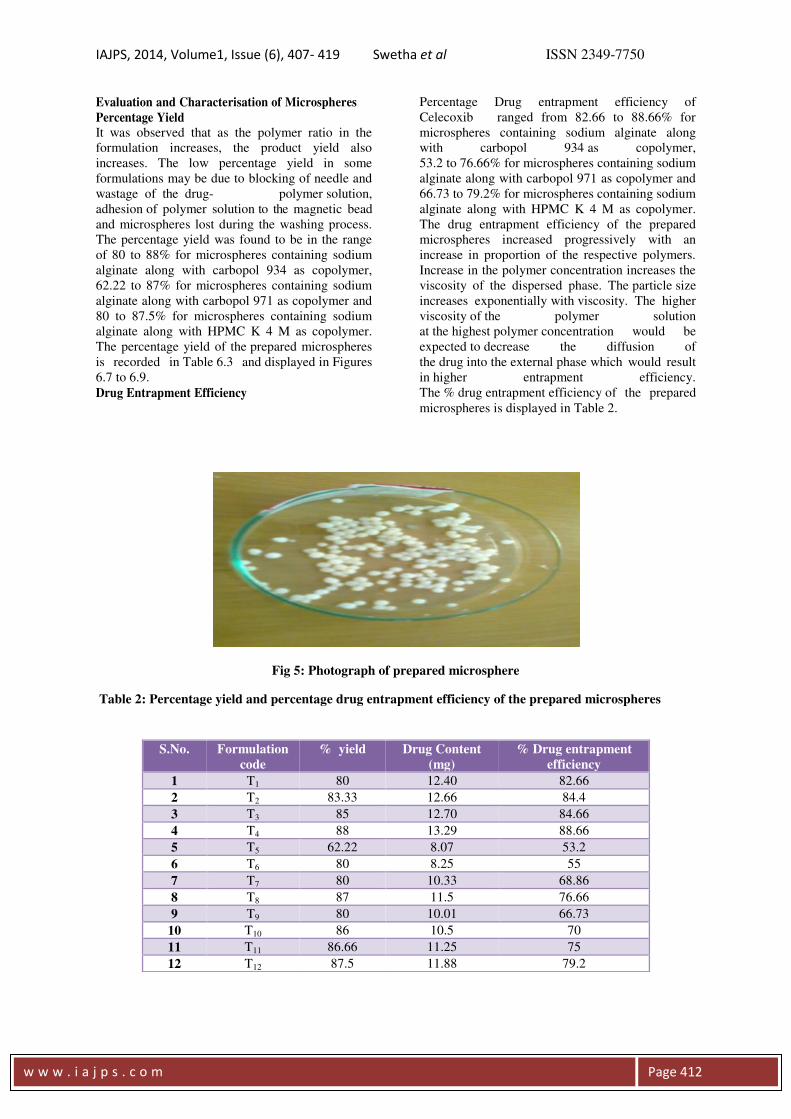
Fig 5: Photograph of prepared microsphere
Table 2: Percentage yield and percentage drug entrapment efficiency of the prepared microspheres
S.No. Formulation
code
% yield Drug Content
(mg)
% Drug entrapment
efficiency
1 T1 80 12.40 82.66
2 T2 83.33 12.66 84.4
3 T3 85 12.70 84.66
4 T4 88 13.29 88.66
5 T5 62.22 8.07 53.2
6 T6 80 8.25 55
7 T7 80 10.33 68.86
8 T8 87 11.5 76.66
9 T9 80 10.01 66.73
10 T10 86 10.5 70
11 T11 86.66 11.25 75
12 T12 87.5 11.88 79.2
IAJPS, 2014, Volume1, Issue (6), 407- 419 Swetha et al ISSN 2349-7750
w w w . i a j p s . c o m
Page 413
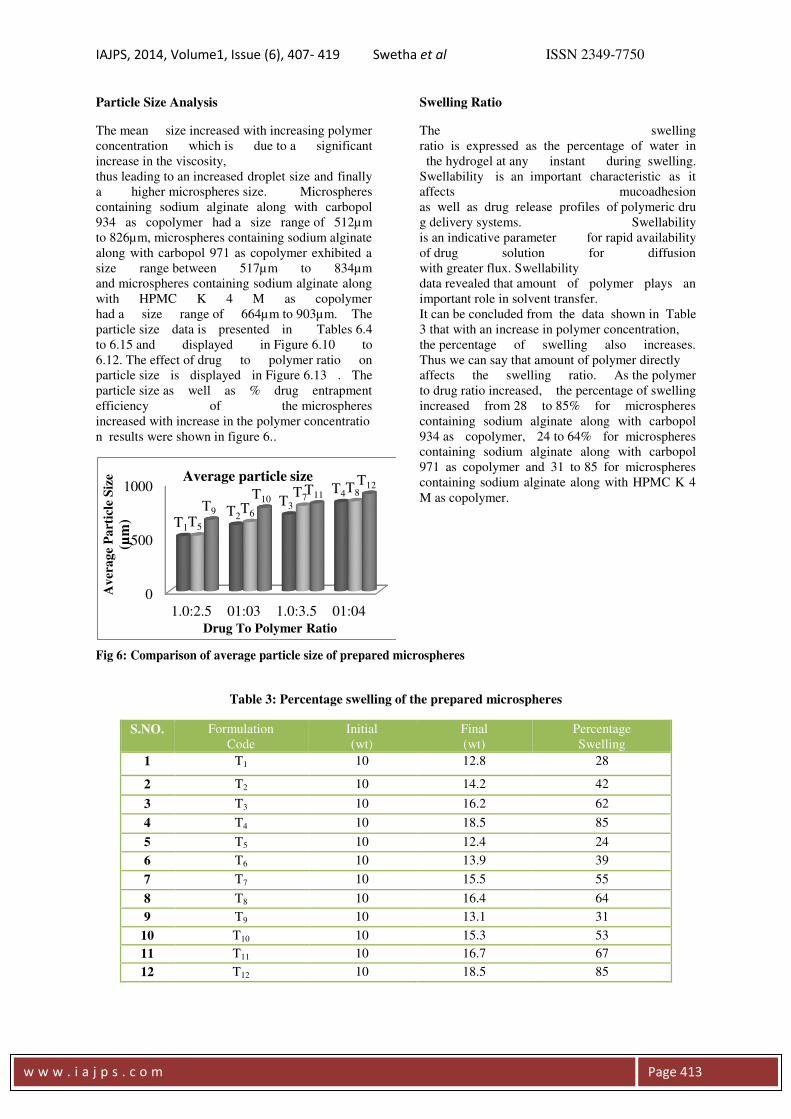
Particle Size Analysis
The mean size increased with increasing polymer
concentration which is due to a significant
increase in the viscosity,
thus leading to an increased droplet size and finally
a higher microspheres size. Microspheres
containing sodium alginate along with carbopol
934 as copolymer had a size range of 512µm
to 826µm, microspheres containing sodium alginate
along with carbopol 971 as copolymer exhibited a
size range between 517µm to 834µm
and microspheres containing sodium alginate along
with HPMC K 4 M as copolymer
had a size range of 664µm to 903µm. The
particle size data is presented in Tables 6.4
to 6.15 and displayed in Figure 6.10 to
6.12. The effect of drug to polymer ratio on
particle size is displayed in Figure 6.13 . The
particle size as well as % drug entrapment
efficiency of the microspheres
increased with increase in the polymer concentratio
n results were shown in figure 6..
Swelling Ratio
The swelling
ratio is expressed as the percentage of water in
the hydrogel at any instant during swelling.
Swellability is an important characteristic as it
affects mucoadhesion
as well as drug release profiles of polymeric dru
g delivery systems. Swellability
is an indicative parameter for rapid availability
of drug solution for diffusion
with greater flux. Swellability
data revealed that amount of polymer plays an
important role in solvent transfer.
It can be concluded from the data shown in Table
3 that with an increase in polymer concentration,
the percentage of swelling also increases.
Thus we can say that amount of polymer directly
affects the swelling ratio. As the polymer
to drug ratio increased, the percentage of swelling
increased from 28 to 85% for microspheres
containing sodium alginate along with carbopol
934 as copolymer, 24 to 64% for microspheres
containing sodium alginate along with carbopol
971 as copolymer and 31 to 85 for microspheres
containing sodium alginate along with HPMC K 4
M as copolymer.
Fig 6: Comparison of average particle size of prepared microspheres
Table 3: Percentage swelling of the prepared microspheres
S.NO. Formulation
Code
Initial
(wt)
Final
(wt)
Percentage
Swelling
1 T1 10 12.8 28
2 T2 10 14.2 42
3 T3 10 16.2 62
4 T4 10 18.5 85
5 T5 10 12.4 24
6 T6 10 13.9 39
7 T7 10 15.5 55
8 T8 10 16.4 64
9 T9 10 13.1 31
10 T10 10 15.3 53
11 T11 10 16.7 67
12 T12 10 18.5 85
0
500
1000
1.0:2.5 01:03 1.0:3.5 01:04
T1
T2 T3
T4
T5 T6
T7 T8
T9 T10
T11 T12
Av
era
ge
Pa
rtic
le S
ize
(µm
)
Drug To Polymer Ratio
Average particle size
IAJPS, 2014, Volume1, Issue (6), 407- 419 Swetha et al ISSN 2349-7750
w w w . i a j p s . c o m
Page 414
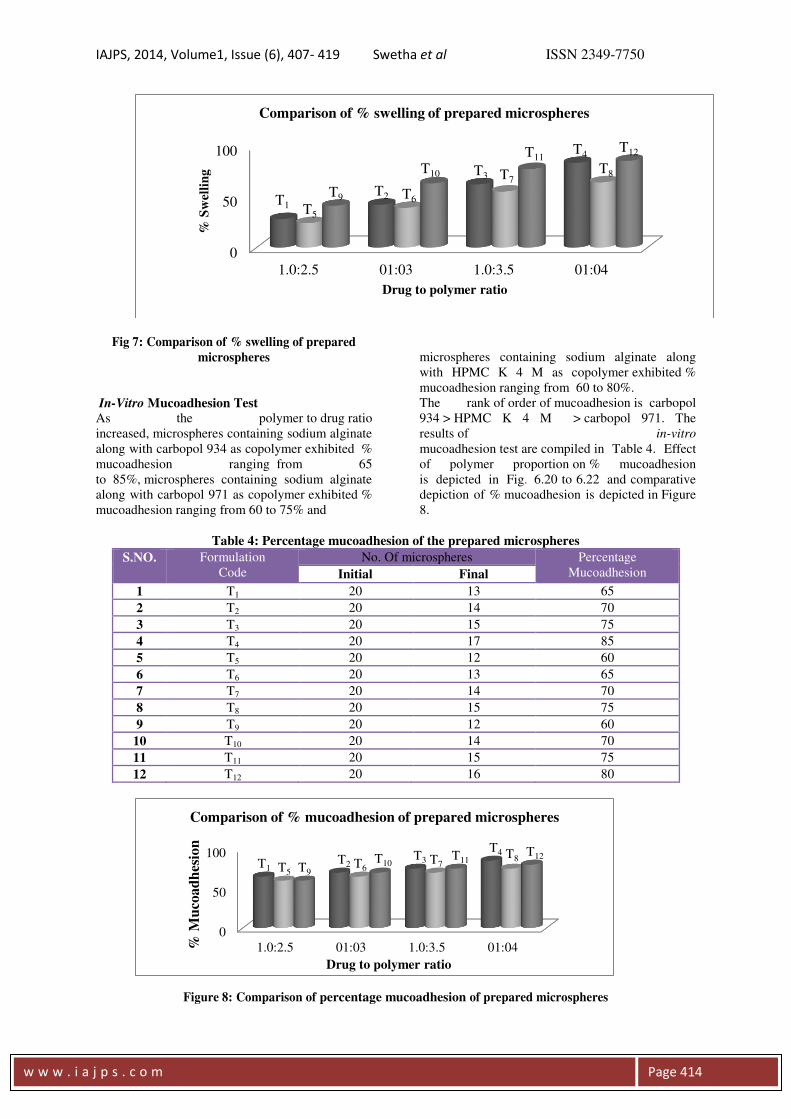
Fig 7: Comparison of % swelling of prepared
microspheres
In-Vitro Mucoadhesion Test
As the polymer to drug ratio
increased, microspheres containing sodium alginate
along with carbopol 934 as copolymer exhibited %
mucoadhesion ranging from 65
to 85%, microspheres containing sodium alginate
along with carbopol 971 as copolymer exhibited %
mucoadhesion ranging from 60 to 75% and
microspheres containing sodium alginate along
with HPMC K 4 M as copolymer exhibited %
mucoadhesion ranging from 60 to 80%.
The rank of order of mucoadhesion is carbopol
934 > HPMC K 4 M > carbopol 971. The
results of in-vitro
mucoadhesion test are compiled in Table 4. Effect
of polymer proportion on % mucoadhesion
is depicted in Fig. 6.20 to 6.22 and comparative
depiction of % mucoadhesion is depicted in Figure
8.
Table 4: Percentage mucoadhesion of the prepared microspheres
S.NO. Formulation
Code
No. Of microspheres Percentage
Mucoadhesion Initial Final
1 T1 20 13 65
2 T2 20 14 70
3 T3 20 15 75
4 T4 20 17 85
5 T5 20 12 60
6 T6 20 13 65
7 T7 20 14 70
8 T8 20 15 75
9 T9 20 12 60
10 T10 20 14 70
11 T11 20 15 75
12 T12 20 16 80
Figure 8: Comparison of percentage mucoadhesion of prepared microspheres
0
50
100
1.0:2.5 01:03 1.0:3.5 01:04
T1 T2
T3
T4
T5 T6
T7 T8
T9
T10 T11
T12
% S
wel
lin
g
Drug to polymer ratio
Comparison of % swelling of prepared microspheres
0
50
100
1.0:2.5 01:03 1.0:3.5 01:04
T1 T2
T3 T4
T5 T6
T7 T8
T9 T10
T11 T12
% M
uco
ad
hes
ion
Drug to polymer ratio
Comparison of % mucoadhesion of prepared microspheres
IAJPS, 2014, Volume1, Issue (6), 407- 419 Swetha et al ISSN 2349-7750
w w w . i a j p s . c o m
Page 415
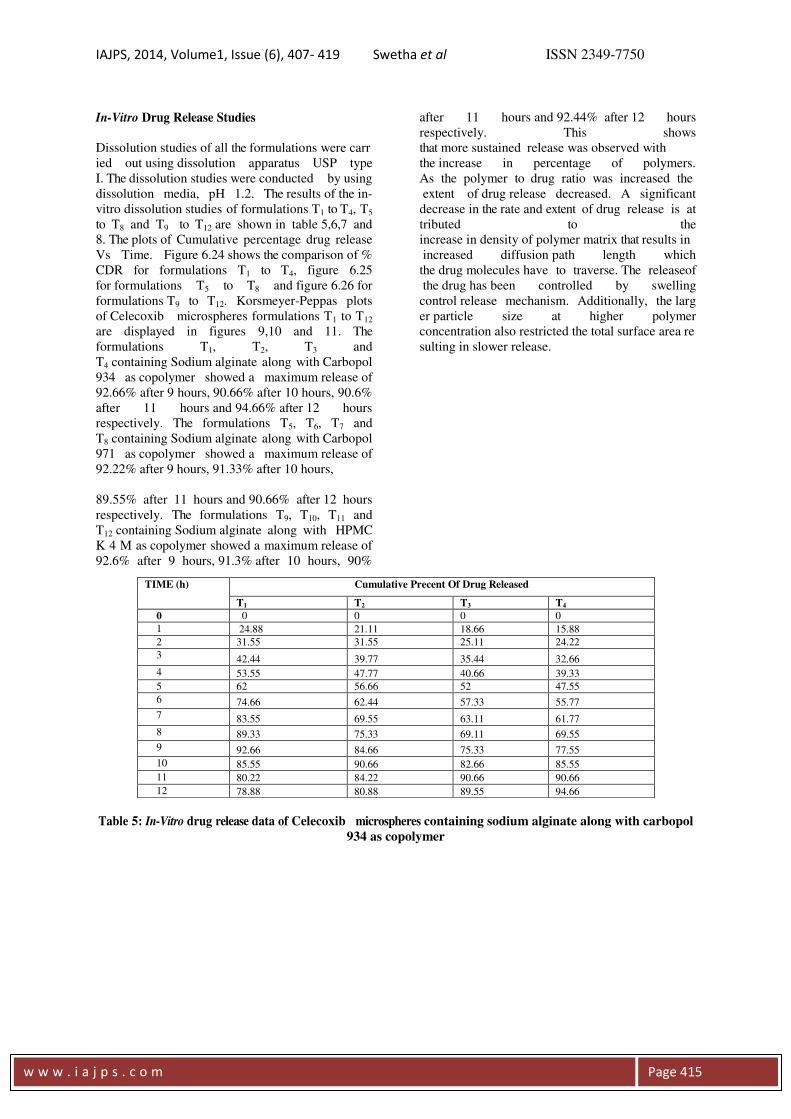
In-Vitro Drug Release Studies
Dissolution studies of all the formulations were carr
ied out using dissolution apparatus USP type
I. The dissolution studies were conducted by using
dissolution media, pH 1.2. The results of the in-
vitro dissolution studies of formulations T1 to T4, T5
to T8 and T9 to T12 are shown in table 5,6,7 and
8. The plots of Cumulative percentage drug release
Vs Time. Figure 6.24 shows the comparison of %
CDR for formulations T1 to T4, figure 6.25
for formulations T5 to T8 and figure 6.26 for
formulations T9 to T12. Korsmeyer-Peppas plots
of Celecoxib microspheres formulations T1 to T12
are displayed in figures 9,10 and 11. The
formulations T1, T2, T3 and
T4 containing Sodium alginate along with Carbopol
934 as copolymer showed a maximum release of
92.66% after 9 hours, 90.66% after 10 hours, 90.6%
after 11 hours and 94.66% after 12 hours
respectively. The formulations T5, T6, T7 and
T8 containing Sodium alginate along with Carbopol
971 as copolymer showed a maximum release of
92.22% after 9 hours, 91.33% after 10 hours,
89.55% after 11 hours and 90.66% after 12 hours
respectively. The formulations T9, T10, T11 and
T12 containing Sodium alginate along with HPMC
K 4 M as copolymer showed a maximum release of
92.6% after 9 hours, 91.3% after 10 hours, 90%
after 11 hours and 92.44% after 12 hours
respectively. This shows
that more sustained release was observed with
the increase in percentage of polymers.
As the polymer to drug ratio was increased the
extent of drug release decreased. A significant
decrease in the rate and extent of drug release is at
tributed to the
increase in density of polymer matrix that results in
increased diffusion path length which
the drug molecules have to traverse. The releaseof
the drug has been controlled by swelling
control release mechanism. Additionally, the larg
er particle size at higher polymer
concentration also restricted the total surface area re
sulting in slower release.
Table 5: In-Vitro drug release data of Celecoxib microspheres containing sodium alginate along with carbopol
934 as copolymer
TIME (h)
Cumulative Precent Of Drug Released
T1 T2 T3 T4
0 0 0 0 0
1 24.88 21.11 18.66 15.88
2 31.55 31.55 25.11 24.22
3 42.44 39.77 35.44 32.66
4 53.55 47.77 40.66 39.33
5 62 56.66 52 47.55
6 74.66 62.44 57.33 55.77
7 83.55 69.55 63.11 61.77
8 89.33 75.33 69.11 69.55
9 92.66 84.66 75.33 77.55
10 85.55 90.66 82.66 85.55
11 80.22 84.22 90.66 90.66
12 78.88 80.88 89.55 94.66
IAJPS, 2014, Volume1, Issue (6), 407- 419 Swetha et al ISSN 2349-7750
w w w . i a j p s . c o m
Page 416
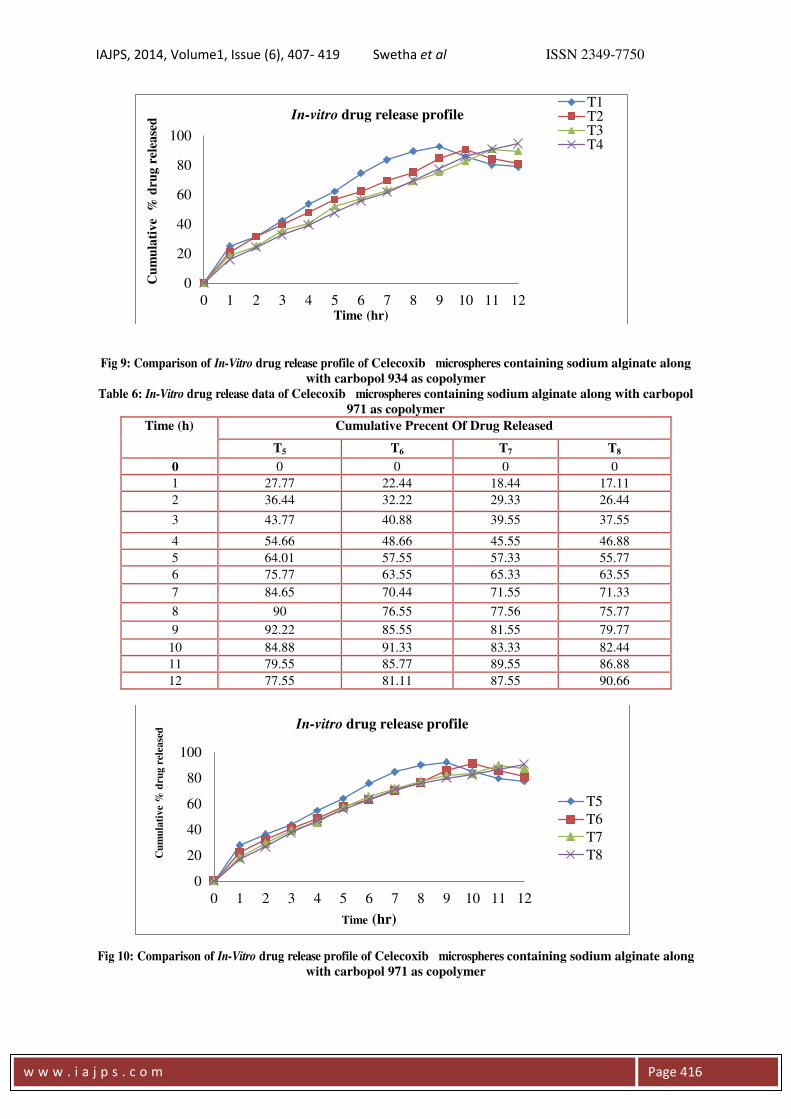
Fig 9: Comparison of In-Vitro drug release profile of Celecoxib microspheres containing sodium alginate along
with carbopol 934 as copolymer
Table 6: In-Vitro drug release data of Celecoxib microspheres containing sodium alginate along with carbopol
971 as copolymer
Time (h)
Cumulative Precent Of Drug Released
T5 T6 T7 T8
0 0 0 0 0
1 27.77 22.44 18.44 17.11
2 36.44 32.22 29.33 26.44
3 43.77 40.88 39.55 37.55
4 54.66 48.66 45.55 46.88
5 64.01 57.55 57.33 55.77
6 75.77 63.55 65.33 63.55
7 84.65 70.44 71.55 71.33
8 90 76.55 77.56 75.77
9 92.22 85.55 81.55 79.77
10 84.88 91.33 83.33 82.44
11 79.55 85.77 89.55 86.88
12 77.55 81.11 87.55 90.66
Fig 10: Comparison of In-Vitro drug release profile of Celecoxib microspheres containing sodium alginate along
with carbopol 971 as copolymer
0
20
40
60
80
100
0 1 2 3 4 5 6 7 8 9 10 11 12
Cu
mu
lati
ve
% d
rug
rel
ease
d
Time (hr)
In-vitro drug release profile T1T2T3T4
0
20
40
60
80
100
0 1 2 3 4 5 6 7 8 9 10 11 12
Cu
mu
lati
ve
% d
rug
rel
ease
d
Time (hr)
In-vitro drug release profile
T5
T6
T7
T8
IAJPS, 2014, Volume1, Issue (6), 407- 419 Swetha et al ISSN 2349-7750
w w w . i a j p s . c o m
Page 417
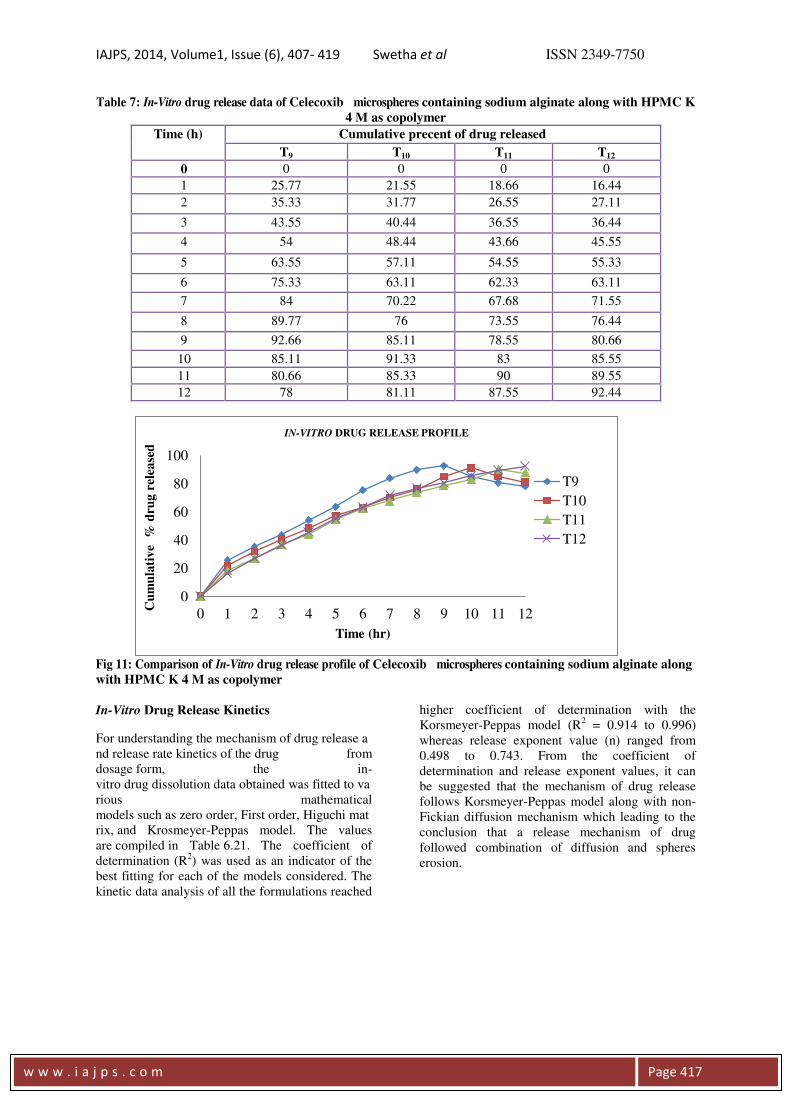
Table 7: In-Vitro drug release data of Celecoxib microspheres containing sodium alginate along with HPMC K
4 M as copolymer
Time (h) Cumulative precent of drug released
T9 T10 T11 T12
0 0 0 0 0
1 25.77 21.55 18.66 16.44
2 35.33 31.77 26.55 27.11
3 43.55 40.44 36.55 36.44
4 54 48.44 43.66 45.55
5 63.55 57.11 54.55 55.33
6 75.33 63.11 62.33 63.11
7 84 70.22 67.68 71.55
8 89.77 76 73.55 76.44
9 92.66 85.11 78.55 80.66
10 85.11 91.33 83 85.55
11 80.66 85.33 90 89.55
12 78 81.11 87.55 92.44
Fig 11: Comparison of In-Vitro drug release profile of Celecoxib microspheres containing sodium alginate along
with HPMC K 4 M as copolymer
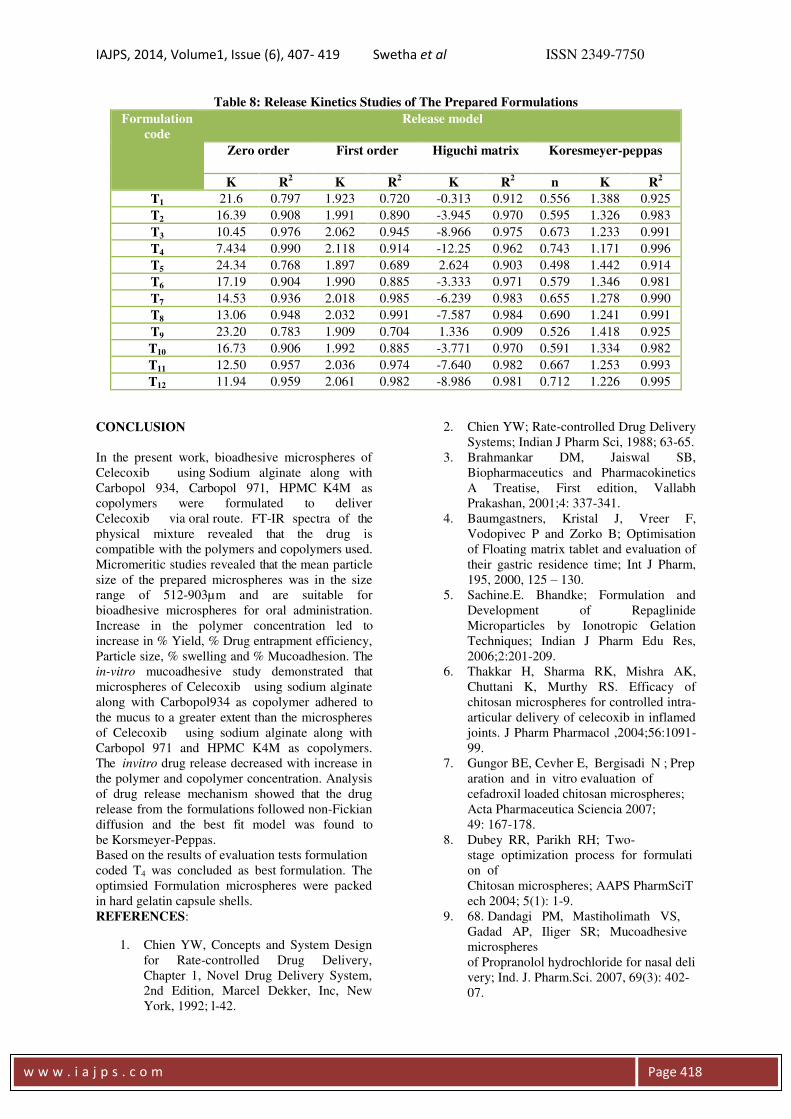
In-Vitro Drug Release Kinetics
For understanding the mechanism of drug release a
nd release rate kinetics of the drug from
dosage form, the in-
vitro drug dissolution data obtained was fitted to va
rious mathematical
models such as zero order, First order, Higuchi mat
rix, and Krosmeyer-Peppas model. The values
are compiled in Table 6.21. The coefficient of
determination (R2) was used as an indicator of the
best fitting for each of the models considered. The
kinetic data analysis of all the formulations reached
higher coefficient of determination with the
Korsmeyer-Peppas model (R2 = 0.914 to 0.996)
whereas release exponent value (n) ranged from
0.498 to 0.743. From the coefficient of
determination and release exponent values, it can
be suggested that the mechanism of drug release
follows Korsmeyer-Peppas model along with non-
Fickian diffusion mechanism which leading to the
conclusion that a release mechanism of drug
followed combination of diffusion and spheres
erosion.
0
20
40
60
80
100
0 1 2 3 4 5 6 7 8 9 10 11 12
Cu
mu
lati
ve
% d
rug
rel
ease
d
Time (hr)
IN-VITRO DRUG RELEASE PROFILE
T9
T10
T11
T12
IAJPS, 2014, Volume1, Issue (6), 407- 419 Swetha et al ISSN 2349-7750
w w w . i a j p s . c o m
Page 418
Table 8: Release Kinetics Studies of The Prepared Formulations
Formulation
code
Release model
Zero order First order Higuchi matrix Koresmeyer-peppas
K R2
K R2
K R2
n K R2
T1 21.6 0.797 1.923 0.720 -0.313 0.912 0.556 1.388 0.925
T2 16.39 0.908 1.991 0.890 -3.945 0.970 0.595 1.326 0.983
T3 10.45 0.976 2.062 0.945 -8.966 0.975 0.673 1.233 0.991
T4 7.434 0.990 2.118 0.914 -12.25 0.962 0.743 1.171 0.996
T5 24.34 0.768 1.897 0.689 2.624 0.903 0.498 1.442 0.914
T6 17.19 0.904 1.990 0.885 -3.333 0.971 0.579 1.346 0.981
T7 14.53 0.936 2.018 0.985 -6.239 0.983 0.655 1.278 0.990
T8 13.06 0.948 2.032 0.991 -7.587 0.984 0.690 1.241 0.991
T9 23.20 0.783 1.909 0.704 1.336 0.909 0.526 1.418 0.925
T10 16.73 0.906 1.992 0.885 -3.771 0.970 0.591 1.334 0.982
T11 12.50 0.957 2.036 0.974 -7.640 0.982 0.667 1.253 0.993
T12 11.94 0.959 2.061 0.982 -8.986 0.981 0.712 1.226 0.995
CONCLUSION
In the present work, bioadhesive microspheres of
Celecoxib using Sodium alginate along with
Carbopol 934, Carbopol 971, HPMC K4M as
copolymers were formulated to deliver
Celecoxib via oral route. FT-IR spectra of the
physical mixture revealed that the drug is
compatible with the polymers and copolymers used.
Micromeritic studies revealed that the mean particle
size of the prepared microspheres was in the size
range of 512-903µm and are suitable for
bioadhesive microspheres for oral administration.
Increase in the polymer concentration led to
increase in % Yield, % Drug entrapment efficiency,
Particle size, % swelling and % Mucoadhesion. The
in-vitro mucoadhesive study demonstrated that
microspheres of Celecoxib using sodium alginate
along with Carbopol934 as copolymer adhered to
the mucus to a greater extent than the microspheres
of Celecoxib using sodium alginate along with
Carbopol 971 and HPMC K4M as copolymers.
The invitro drug release decreased with increase in
the polymer and copolymer concentration. Analysis
of drug release mechanism showed that the drug
release from the formulations followed non-Fickian
diffusion and the best fit model was found to
be Korsmeyer-Peppas.
Based on the results of evaluation tests formulation
coded T4 was concluded as best formulation. The
optimsied Formulation microspheres were packed
in hard gelatin capsule shells.
REFERENCES:
1. Chien YW, Concepts and System Design
for Rate-controlled Drug Delivery,
Chapter 1, Novel Drug Delivery System,
2nd Edition, Marcel Dekker, Inc, New
York, 1992; l-42.
2. Chien YW; Rate-controlled Drug Delivery
Systems; Indian J Pharm Sci, 1988; 63-65.
3. Brahmankar DM, Jaiswal SB,
Biopharmaceutics and Pharmacokinetics
A Treatise, First edition, Vallabh
Prakashan, 2001;4: 337-341.
4. Baumgastners, Kristal J, Vreer F,
Vodopivec P and Zorko B; Optimisation
of Floating matrix tablet and evaluation of
their gastric residence time; Int J Pharm,
195, 2000, 125 – 130.
5. Sachine.E. Bhandke; Formulation and
Development of Repaglinide
Microparticles by Ionotropic Gelation
Techniques; Indian J Pharm Edu Res,
2006;2:201-209.
6. Thakkar H, Sharma RK, Mishra AK,
Chuttani K, Murthy RS. Efficacy of
chitosan microspheres for controlled intra-
articular delivery of celecoxib in inflamed
joints. J Pharm Pharmacol ,2004;56:1091-
99.
7. Gungor BE, Cevher E, Bergisadi N ; Prep
aration and in vitro evaluation of
cefadroxil loaded chitosan microspheres;
Acta Pharmaceutica Sciencia 2007;
49: 167-178.
8. Dubey RR, Parikh RH; Two-
stage optimization process for formulati
on of
Chitosan microspheres; AAPS PharmSciT
ech 2004; 5(1): 1-9.
9. 68. Dandagi PM, Mastiholimath VS,
Gadad AP, Iliger SR; Mucoadhesive
microspheres
of Propranolol hydrochloride for nasal deli
very; Ind. J. Pharm.Sci. 2007, 69(3): 402-
07.
IAJPS, 2014, Volume1, Issue (6), 407- 419 Swetha et al ISSN 2349-7750
w w w . i a j p s . c o m
Page 419