Embed Size (px)
Citation preview

FITFISH 2016Swimming
Respirometry
Alina AntacheCaroline Navjord
Núria Vilaİlkay Hüyüklü

Index● Preparing for the experiments
● Sea Bass Experiments and Results
● Pompano Experiments and Results
● Conclusions

Preparing for the experiments● Measurement of water velocity in all the
section of the swimming tunnel (flowmeter)water velocity (cm/s):
● Flow speed calibration
● Calibration of O2 sensors (0% with natrium sulfit and 100% with oxygenated water)
33 28 36
39 34 4045 40 45

The species we used
http://www.ag.auburn.edu/fish/mediagallery/files/2013/08/448.jpg
Trachinotus carolinus(Pompano)
Dicentrarchus labrax(European seabass)

Background respiration
● We measured the O2 consumption with empty tank respirometry to determine the background respiration
7.7 mgO2/kg/hr11.8 mgO2/kg/hr 7.3 mgO2/kg/hr2.2 mgO2/kg/hr
This was subtracted from all the measurements

Sea Bass 1 Weight:238,7 g Length:22,2 cm High (depth):3,35
cm Width:5,4 cm
● In the tunnel over night at 0.5 bl/s● Swam it until Ucrit

Dicentrarchus labrax (Sea Bass) Experiment 1: TEST

Dicentrarchus labrax (Sea Bass) Experiment 1: TEST
SMR 147.12 Uopt 2.64 Ucrit -
y = 147.12 e0.3774
x
SMRStandard Metabolic rate
UoptOptimal swimming
velocityUopt=1/0.3774=2.64

Dicentrarchus labrax (Sea Bass) Experiment 1: TEST
SMR 147.12 Uopt 2.64 Ucrit -
UoptOptimal swimming
velocityUopt=1/0.3774=2.64

Dicentrarchus labrax (Sea Bass) Experiment 1: TEST
SMR 147.12 Uopt 2.64 Ucrit -
We don’t calculate Ucrit because the loop repeats were not the apropriate

Sea Bass 2 Weight:241 g Length:26,5 cm High (depth):5,2
cm Width:2,7 cm
● Acclimate for 30 minutes at 0.5 bl/s.
● Swim it until Ucritical
● Over night at 0.5 bl/s
● Swam it until Ucrit

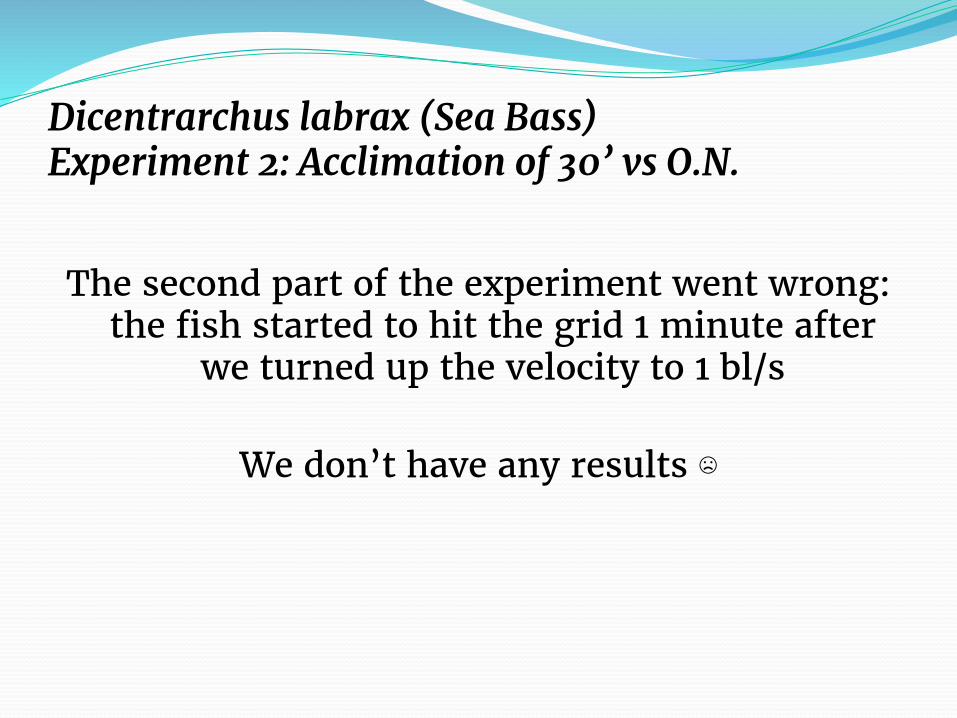
Dicentrarchus labrax (Sea Bass) Experiment 2: Acclimation of 30’ vs O.N.

Dicentrarchus labrax (Sea Bass) Experiment 2: Acclimation of 30’ vs O.N.
SMR = 257.59 mgO2/kg/hUopt = 3.48 BL/sUcrit = 3.6 BL/s
Dicentrarchus labrax (Sea Bass) Experiment 2: Acclimation of 30’ vs O.N.
The second part of the experiment went wrong: the fish started to hit the grid 1 minute after
we turned up the velocity to 1 bl/s
We don’t have any results ☹

Sea Bass 3 Weight:259,8 g Length:25,5 cm High (depth):6,2 cm Width:2,9 cm ● We chased the fish in
the bucket for 2 minutes.
● Acclimated for 30 minutes at 0.5 bl/s.
● Swim it until Ucrit● Over night at 0.5 bl/s ● Swam it until Ucrit

Dicentrarchus labrax (Sea bass)
Experiment 3 : Results

Dicentrarchus labrax (Sea bass)
Experiment 3 : Results
First part:
SMR = 261.29 mgO2/kg/hUopt = 4.10 BL/sUcrit = 3.27 BL/s
Second part:
SMR = 185.90 mgO2/kg/hUopt = 2.37 BL/sUcrit = 3.27 BL/s

Dicentrarchus labrax (Sea bass)
Experiment 3 : Results

Sea Bass 4 Weight:276,8 g Length:26 cm High (depth):5,9
cm Width:2,9 cm
● In the tunnel over night at 0.5 bl/s.● Swam it until Ucrit

Dicentrarchus labrax (Sea bass)
Experiment 4 : Results

SMR = 101.75 mgO2/kg/hUopt = 1.51 BL/sUcrit = 3.06 BL/s
Dicentrarchus labrax (Sea bass)
Experiment 4 : Results

Pompano Weight:197 g Length:19 cm High (depth):
11,7 cm Width:1,5 cm
● In the tunnel over night at 1 bl/s.● Swam it until
Ucrit.

Trachinatus ovatus (Pompano)
Experiment 5 : Results

SMR = 167.26 mgO2/kg/hUopt = 3.20 BL/sUcrit = 5.43BL/s
Trachinatus ovatus (Pompano)
Experiment 5 : Results

BL/sTail movements/second
Dicentrarchus labrax
Trachinatus ovatus
0.50 2.34 1.00 3.55 2.51.50 2.98 2.00 4.84 2.50 5.22 3.00 5.663.50 6.524.00 7.894.50 6.825.00 6.82
Tail movement/secondDicentrarchus labrax vs Trachinatus
ovatus

Conclusions
Experiment 1: Seabass (acclimation over night, swam once)Very much unconclusive, we did just about everything wrong!
Experiment 2: Seabass (acclimation 30 min, swam 2 times)Unconclusive, we probably let the fish swim with its tail against the grid for too long the first round (ca 45 min). New protocol: 5 minutes with tail against the grid = stop the experiment
Experiment 3: Seabass (chased in bucket, acclimation 30 min, swam 2 times)Unconclusive, Uopt = 4.10 BL/s VS Ucrit = 3.27 BL/s

ConclusionsExperiment 4: Seabass (acclimation over night, swam once)Clearly the best way to do it, the results were clear and it had the lowest SMR (101.75 mgO2/kg/h) = less stressed
Experiment 5: Pompano (acclimated over night, swam once)We let it rest for 5 hours on 1 bl/sec after swimming, it was as expected back to resting metabolism by that time. Ucrit = 5.43BL/s
Compared to the best Seabass which only had Ucrit= 3.6 BL/s it was a very good swimmer!
Tail movement compared: The Pompano had a higher frequency as expected

Thank you for the attention

Resting Respirometry Group
Jingwei SongJeppe Vismann
Miran Babic
5-19-2016

Overview
• General respirometry
• Comparing chasing methods
• Sensor positioning
• Comparing hypoxia methods
• Background respiration
• Low temperature

Resting respirometry

experiment 1: comparing the effect of different chasing methods on
SMR and MMR• Protocol• Chasing• MMR + SMR

2 methods for MMR

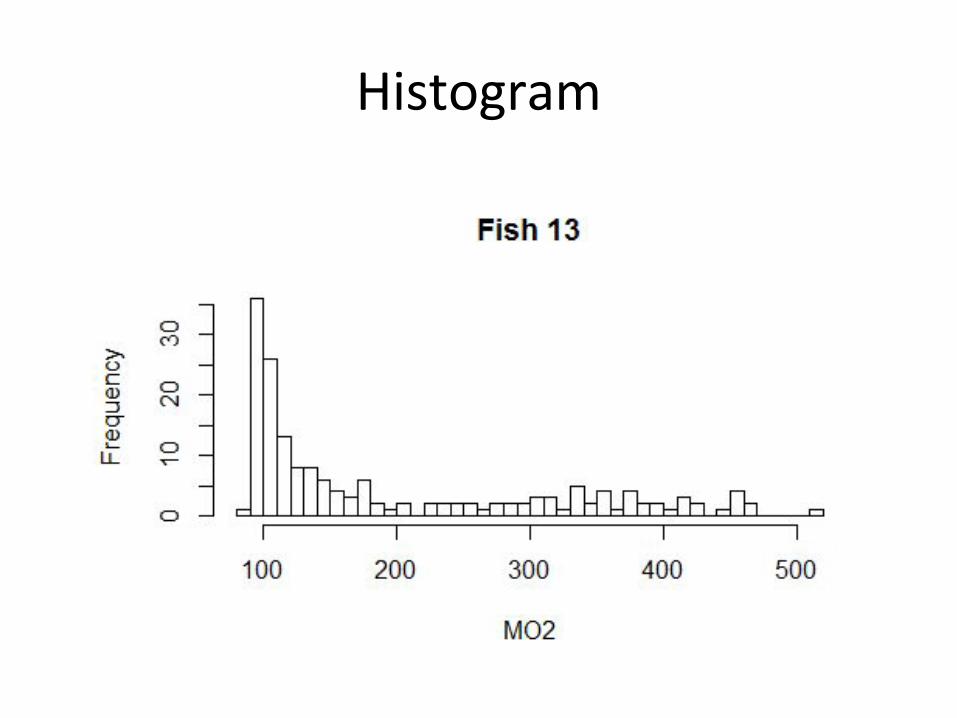
Histogram

Estimate SMR (fish 1)Mclust package in R

Different SMR estimations

Time to SMR


Does the positioning of sensors matter?
Average MO2
MO2

• Position 1, just put in the fish• sensor 1&2 are right before the pump
Deviation from average vs MO2
1
43
2

Deviation from average vs MO2• Position 4• sensor 2&3 are right before the pump
3
1 2
4


Background respiration

Background respiration

Low temperature

Resting all the way!


Tank group
Presented to you by:Gӧkhan TunçelliMaria João PeixotoPatrícia Ferreira

Tank5 Tank8 Tank12
Tvol ≈ 677 LTBM ≈ 4.2 kgN = 60 fish
Tvol ≈ 638 LTBM ≈ 4.9 kgN = 60 fish
Tvol ≈ 612 LTBM ≈ 11 kgN = 80 fish
1) Difusion Time vs Cover2) Cost of handling3) RMR4) SDA5) MMR6) Velocity vs Fish prefered velocity7) TailBeat/min vs Velocity

Basic Calculations
• Oxygen measurements (M: 20 min; F: 40 min)
• Use LoggerPro to calculate slopes for each measurement period
• Apply
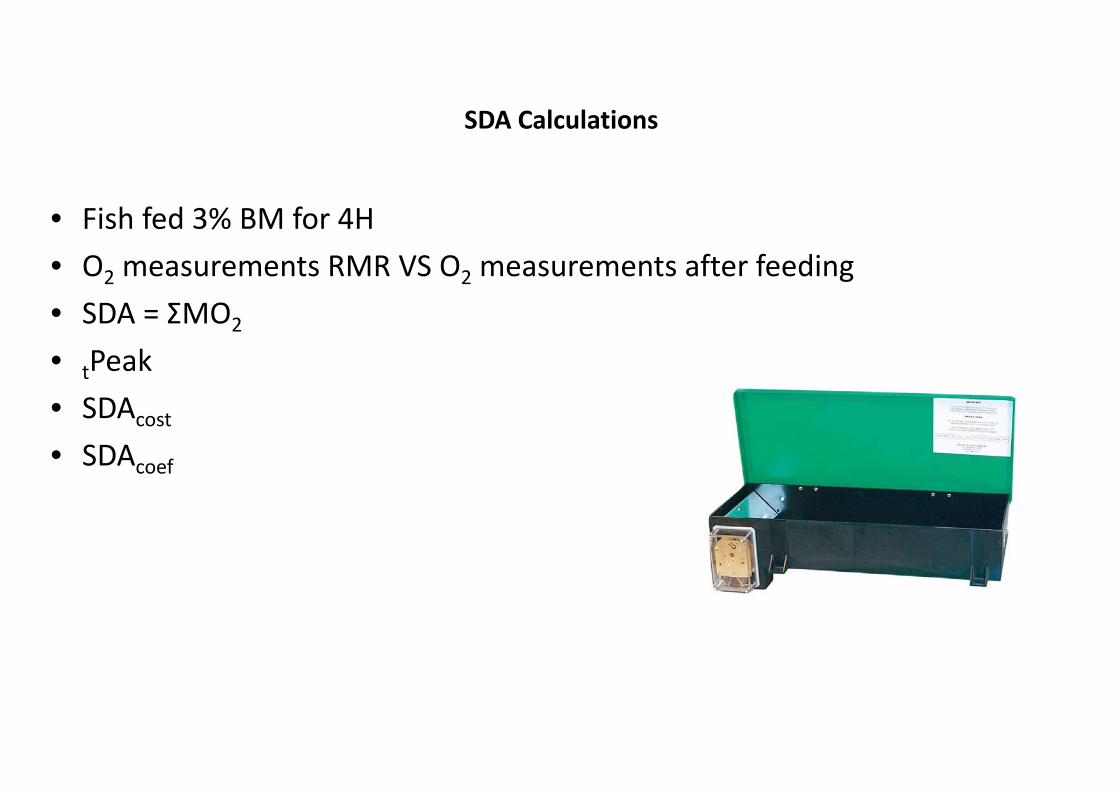
SDA Calculations
• Fish fed 3% BM for 4H • O2 measurements RMR VS O2 measurements after feeding• SDA = ΣMO2
• tPeak• SDAcost
• SDAcoef

0 1 2 3 4 5 64,4
4,5
4,6
4,7
4,8
4,9
5
5,1
5,2
5,3
5,4
TIME (HOURS)
MO2/KG
O2 DIFFUSIONTank5 Tank8 Tank9 Tank12

Acclimation of fishes

0 5 10 15 20 250
50
100
150
200
250
300
350
400
TIME (HOURS)
MO2/KG
TANK5
Dark Light
RMR: 172 mgO2/kg/h

0 5 10 15 20 250
50
100
150
200
250
300
350
400
TIME (HOURS)
MGO2/KG
TANK8
RMR: 128 mgO2/kg/h
Dark Light

0 2 4 6 8 10 12 140
50
100
150
200
250
300
TIME (H)
MO2 (M
G/KG/H)TK12_ACLIMATATION
Dark Light
RMR: 130 mgO2/kg/h

Cost of handling (when putting fish on tanks)

0 1 2 3 4 5 6 70
20
40
60
80
100
120
140
160
180
TIME (HOURS)
MO2/KG
TANK5
434 mgO2/kg/h

0 1 2 3 4 5 6 70
50
100
150
200
250
300
350
400
TIME (HOURS)
MO2/KG
Tank8
473 mgO2/kg/h
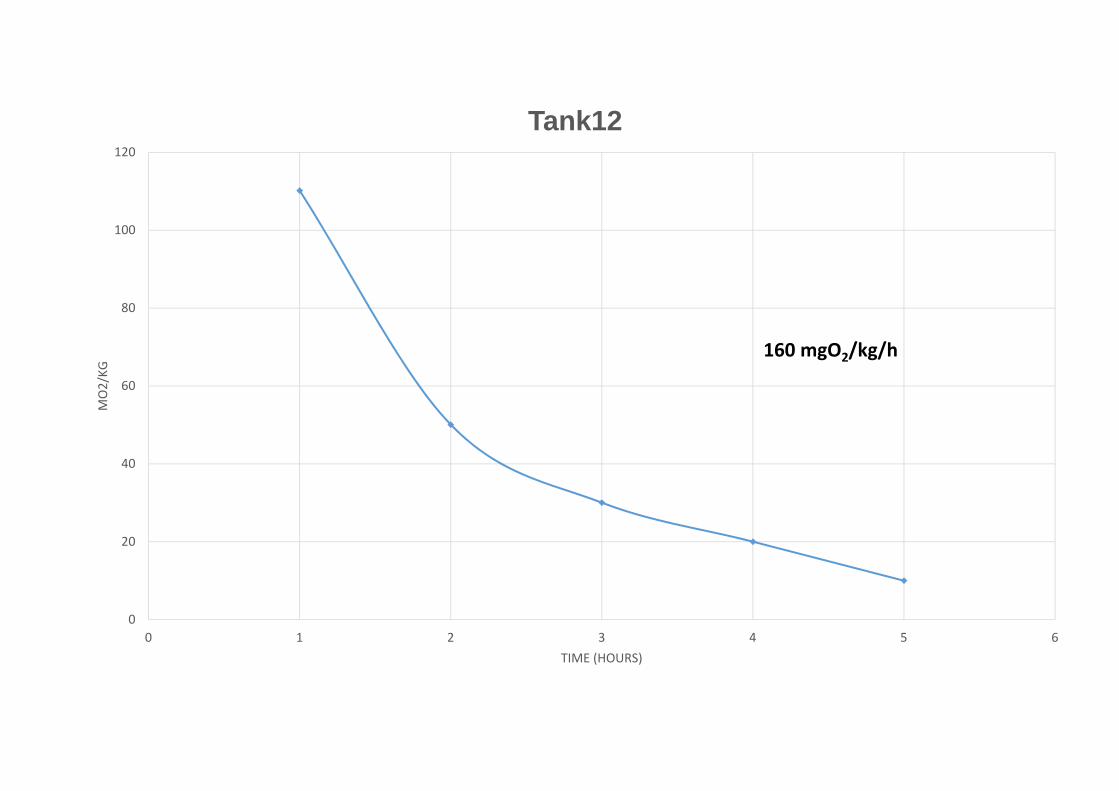
0 1 2 3 4 5 60
20
40
60
80
100
120
TIME (HOURS)
MO2/KG
Tank12
160 mgO2/kg/h

SDA experiment
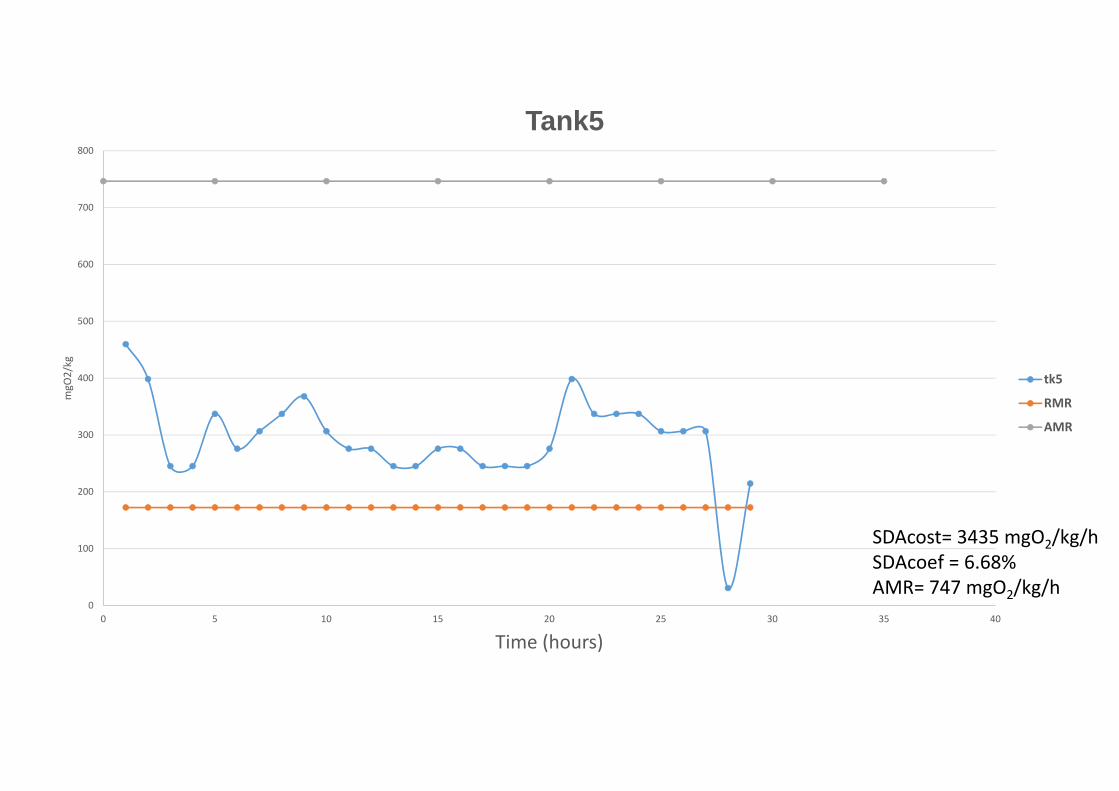
SDAcost= 3435 mgO2/kg/hSDAcoef = 6.68%AMR= 747 mgO2/kg/h
0 5 10 15 20 25 30 35 400
100
200
300
400
500
600
700
800
Time (hours)
mgO
2/kg
Tank5
tk5
RMR
AMR

0 5 10 15 20 25 30 35 400
100
200
300
400
500
600
Time (hours)
mgO
2/kg
Tank 8
tk8
RMR
AMR
SDAcost= 3632 mgO2/kg/hSDAcoef = 7.75%AMR= 494 mgO2/kg/h

SDAcost = 1687 mgO2/kg/hSDAcoef = 3.75%AMR = 381 mgO2/kg/h
0 5 10 15 20 25 30 35 400
50
100
150
200
250
300
350
400
Time (hours)
mgO
2/kg
Tank12
tk12
RMR
AMR

0 10 20 30 40 50 60 70 800
100
200
300
400
500
600
700
800
Time(hours)
mgO2/kg
TOTAL OXYGEN CONSUMPTION TANK 5
Light
SDA peak ‐> 8H after the beginning, 367mgO2/Kg
Feeding (11 a.m.)
Light Light Dark Dark Light Dark

0 10 20 30 40 50 60 70 800
100
200
300
400
500
600
Time(hours)
mgO
2/kg
Total oxygen consumption tank 8
Feeding (11 a.m.)SDA peak ‐> 4H after the beginning, 321mgO2/Kg
Light Light Light Light Dark Dark Dark

0 10 20 30 40 50 60 70 800
50
100
150
200
250
300
350
400
450
Axis Title
Axis Title
Total oxygen consumption tank 12
Feeding (11 a.m.) SDA peak ‐> 8H after the beginning, 210mgO2/Kg
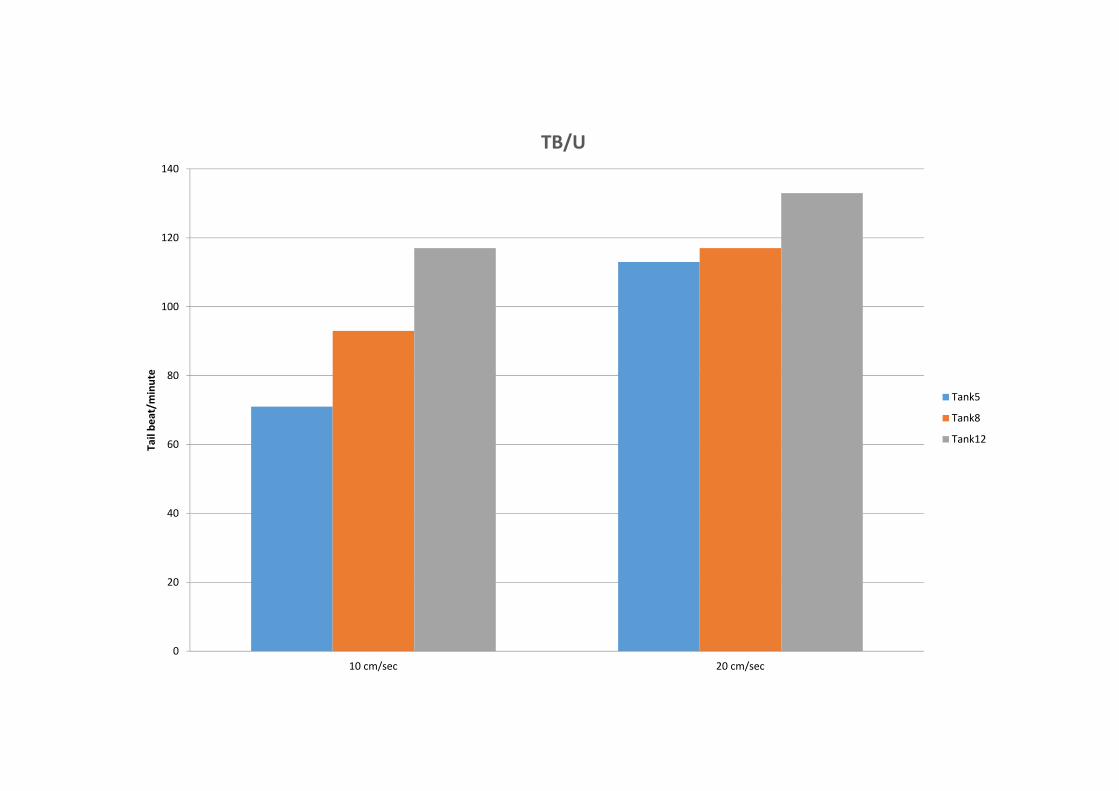
10 cm/sec 20 cm/sec0
20
40
60
80
100
120
140Tail be
at/m
inute
TB/U
Tank5
Tank8
Tank12

Swimming experiment

Fishes choice of velocity= (% of inner area x estimated* velocity) + (% of middle area * estimated* velocity)+(% of outer area * *20)
*: we measured one empty tank and its velocity distribution as follows:
11
14 148
6 8
2 3 4
12 5 3 7 8 11
5 4 7
8
11 5 8
14
11
Measured Velocity: 12,25 7 4,375Estimated Velocity: 10 5,71** 3,57**Estimated Velocity: 20 11,43** 7,14**
**: this values found by ratio and proportion example: (10x7)/12,25 = 5,71

Upper semidiameter
Bottom semidiameter
Middle semidiameter:=(upper + bottom)/2

y
x

1stCounting
2ndCounting
3rdCounting average in 1 min in 1 hour
Camera 2 (tank5)
20 cm/s 58 54 5756 113 6760
10 cm/s 40 32 3435 71 4240
Camera 3 (tank12)
20 cm/s 74 64 6267 133 8000
10 cm/s 58 62 5558 117 7000
Camera 1 (tank8)
20 cm/s 57 64 5559 117 7040
10 cm/s 50 47 4347 93 5600

fish number rate tank8 V20
fish number rate tank5 V20
fish number rate tank12 V20
fish number rate tank8 V10
fish number rate tank5 V10
fish number rate tank12 V10
0 10 20 30 40 50 60 70 80 90 100
Distance to the center of the tank
0‐1515‐3030‐49
Fish distribution in tanks

8,84
6,74
12,9
11,3
10,18
6,5
TANK 5 TANK 8 TANK12
PREDICTION OF FISH CHOICE OF VELOCITY10 cm/s 20 cm/s