Embed Size (px)
Citation preview

Swiss Reinsurance Company Consolidated2011 Annual Report

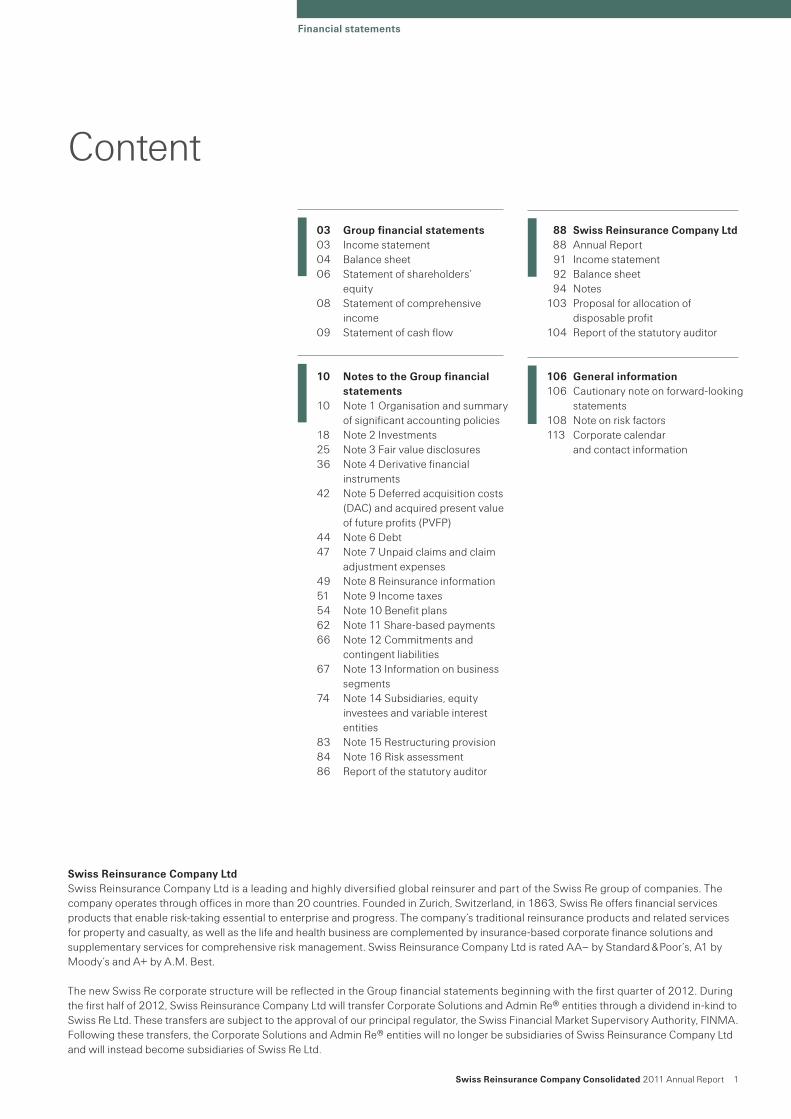
Content
03 Groupfinancialstatements03 Incomestatement04 Balancesheet06 Statementofshareholders’
equity08 Statementofcomprehensive
income09 Statementofcashflow
88 SwissReinsuranceCompanyLtd 88 AnnualReport 91 Incomestatement 92 Balancesheet 94 Notes103 Proposalforallocationof
disposableprofit104 Reportofthestatutoryauditor
106 Generalinformation106 Cautionarynoteonforward-looking
statements108 Noteonriskfactors113 Corporatecalendar
andcontactinformation
10 NotestotheGroupfinancialstatements
10 Note1Organisationandsummaryofsignificantaccountingpolicies
18 Note2Investments25 Note3Fairvaluedisclosures36 Note4Derivativefinancial
instruments42 Note5Deferredacquisitioncosts
(DAC)andacquiredpresentvalueoffutureprofits(PVFP)
44 Note6Debt47 Note7Unpaidclaimsandclaim
adjustmentexpenses49 Note8Reinsuranceinformation51 Note9Incometaxes54 Note10Benefitplans62 Note11Share-basedpayments66 Note12Commitmentsand
contingentliabilities67 Note13Informationonbusiness
segments74 Note14Subsidiaries,equity
investeesandvariableinterestentities
83 Note15Restructuringprovision84 Note16Riskassessment86 Reportofthestatutoryauditor
SwissReinsuranceCompanyConsolidated2011AnnualReport 1
Financialstatements
SwissReinsuranceCompanyLtdSwissReinsuranceCompanyLtdisaleadingandhighlydiversifiedglobalreinsurerandpartoftheSwissRegroupofcompanies.Thecompanyoperatesthroughofficesinmorethan20countries.FoundedinZurich,Switzerland,in1863,SwissReoffersfinancialservicesproductsthatenablerisk-takingessentialtoenterpriseandprogress.Thecompany’straditionalreinsuranceproductsandrelatedservicesforpropertyandcasualty,aswellasthelifeandhealthbusinessarecomplementedbyinsurance-basedcorporatefinancesolutionsandsupplementaryservicesforcomprehensiveriskmanagement.SwissReinsuranceCompanyLtdisratedAA–byStandard&Poor’s,A1byMoody’sandA+byA.M.Best.
ThenewSwissRecorporatestructurewillbereflectedintheGroupfinancialstatementsbeginningwiththefirstquarterof2012.Duringthefirsthalfof2012,SwissReinsuranceCompanyLtdwilltransferCorporateSolutionsandAdminRe®entitiesthroughadividendin-kindtoSwissReLtd.Thesetransfersaresubjecttotheapprovalofourprincipalregulator,theSwissFinancialMarketSupervisoryAuthority,FINMA.Followingthesetransfers,theCorporateSolutionsandAdminRe®entitieswillnolongerbesubsidiariesofSwissReinsuranceCompanyLtdandwillinsteadbecomesubsidiariesofSwissReLtd.

2 SwissReinsuranceCompanyConsolidated2011AnnualReport
Financialstatements|Groupfinancialstatements
Thispageintentionallyleftblank
SwissReinsuranceCompanyConsolidated2011AnnualReport 3
Financialstatements|Groupfinancialstatements
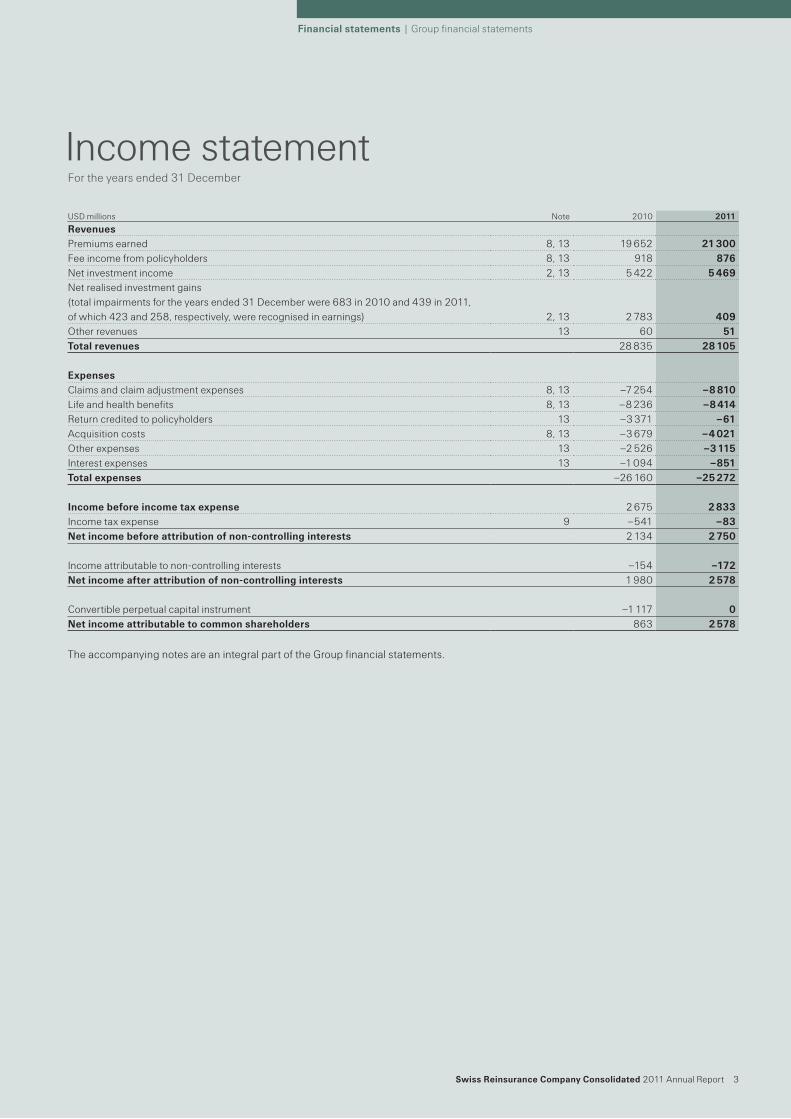
IncomestatementFortheyearsended31December
TheaccompanyingnotesareanintegralpartoftheGroupfinancialstatements.
USDmillions Note 2010 2011
RevenuesPremiumsearned 8,13 19652 21300Feeincomefrompolicyholders 8,13 918 876Netinvestmentincome 2,13 5422 5469Netrealisedinvestmentgains(totalimpairmentsfortheyearsended31Decemberwere683in2010and439in2011,ofwhich423and258,respectively,wererecognisedinearnings) 2,13 2783 409Otherrevenues 13 60 51Totalrevenues 28835 28105
ExpensesClaimsandclaimadjustmentexpenses 8,13 –7254 –8810Lifeandhealthbenefits 8,13 –8236 –8414Returncreditedtopolicyholders 13 –3371 –61Acquisitioncosts 8,13 –3679 –4021Otherexpenses 13 –2526 –3115Interestexpenses 13 –1094 –851Totalexpenses –26160 –25272
Incomebeforeincometaxexpense 2675 2833Incometaxexpense 9 –541 –83Netincomebeforeattributionofnon-controllinginterests 2134 2750
Incomeattributabletonon-controllinginterests –154 –172Netincomeafterattributionofnon-controllinginterests 1980 2578
Convertibleperpetualcapitalinstrument –1117 0Netincomeattributabletocommonshareholders 863 2578
4 SwissReinsuranceCompanyConsolidated2011AnnualReport
Financialstatements|Groupfinancialstatements
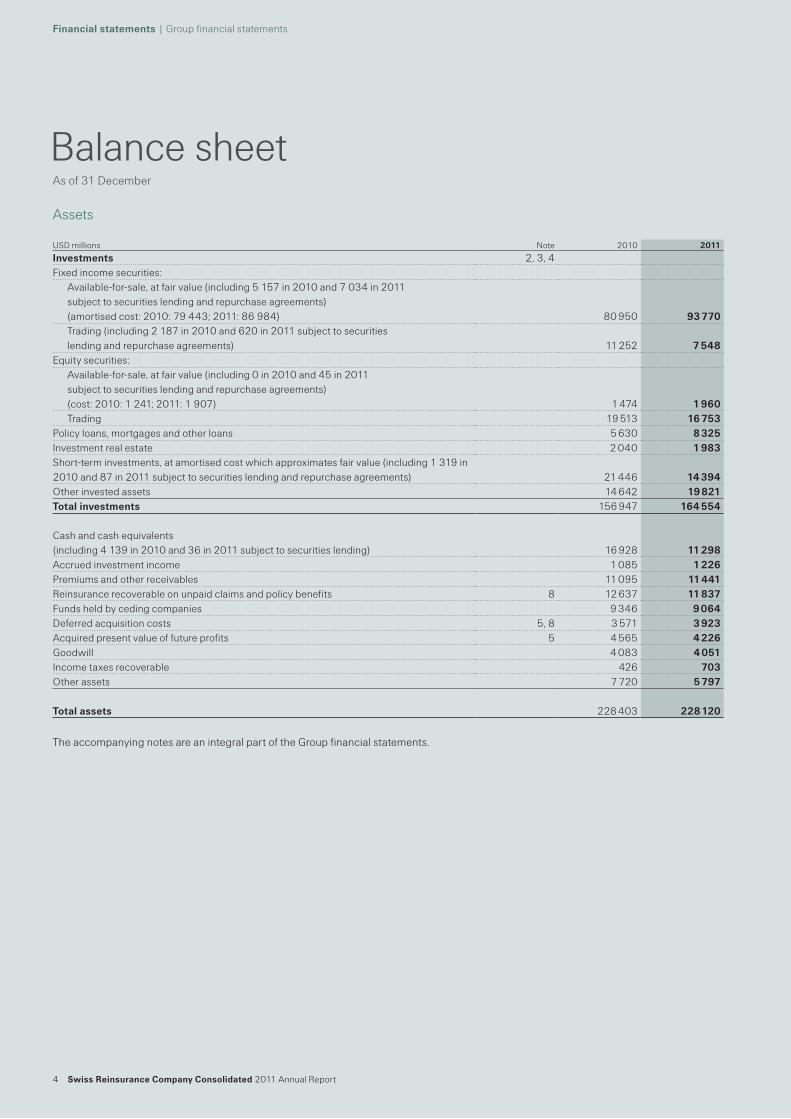
BalancesheetAsof31December
Assets
TheaccompanyingnotesareanintegralpartoftheGroupfinancialstatements.
USDmillions Note 2010 2011
Investments 2,3,4Fixedincomesecurities:
Available-for-sale,atfairvalue(including5157in2010and7034in2011subjecttosecuritieslendingandrepurchaseagreements)(amortisedcost:2010:79443;2011:86984) 80950 93770Trading(including2187in2010and620in2011subjecttosecuritieslendingandrepurchaseagreements) 11252 7548
Equitysecurities:Available-for-sale,atfairvalue(including0in2010and45in2011subjecttosecuritieslendingandrepurchaseagreements)(cost:2010:1241;2011:1907) 1474 1960Trading 19513 16753
Policyloans,mortgagesandotherloans 5630 8325Investmentrealestate 2040 1983Short-terminvestments,atamortisedcostwhichapproximatesfairvalue(including1319in2010and87in2011subjecttosecuritieslendingandrepurchaseagreements) 21446 14394Otherinvestedassets 14642 19821Totalinvestments 156947 164554
Cashandcashequivalents(including4139in2010and36in2011subjecttosecuritieslending) 16928 11298Accruedinvestmentincome 1085 1226Premiumsandotherreceivables 11095 11441Reinsurancerecoverableonunpaidclaimsandpolicybenefits 8 12637 11837Fundsheldbycedingcompanies 9346 9064Deferredacquisitioncosts 5,8 3571 3923Acquiredpresentvalueoffutureprofits 5 4565 4226Goodwill 4083 4051Incometaxesrecoverable 426 703Otherassets 7720 5797
Totalassets 228403 228120
SwissReinsuranceCompanyConsolidated2011AnnualReport 5
Financialstatements|Groupfinancialstatements
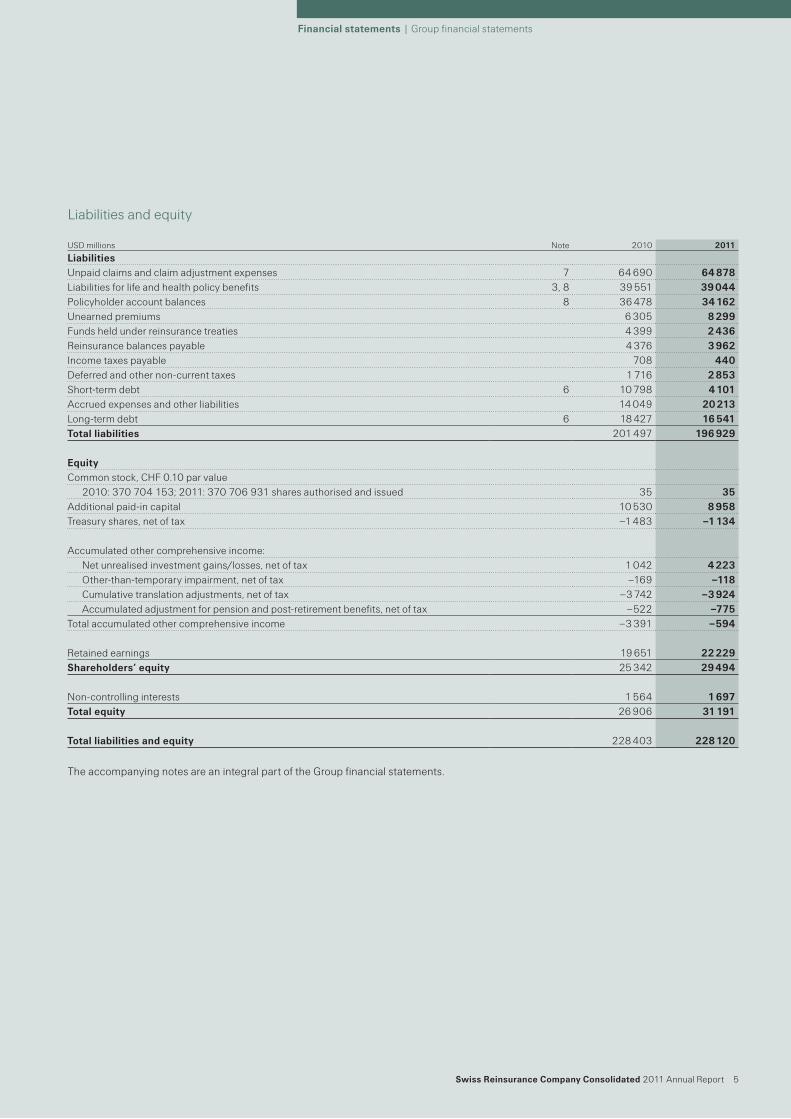
Liabilitiesandequity
TheaccompanyingnotesareanintegralpartoftheGroupfinancialstatements.
USDmillions Note 2010 2011
LiabilitiesUnpaidclaimsandclaimadjustmentexpenses 7 64690 64878Liabilitiesforlifeandhealthpolicybenefits 3,8 39551 39044Policyholderaccountbalances 8 36478 34162Unearnedpremiums 6305 8299Fundsheldunderreinsurancetreaties 4399 2436Reinsurancebalancespayable 4376 3962Incometaxespayable 708 440Deferredandothernon-currenttaxes 1716 2853Short-termdebt 6 10798 4101Accruedexpensesandotherliabilities 14049 20213Long-termdebt 6 18427 16541Totalliabilities 201497 196929
EquityCommonstock,CHF0.10parvalue
2010:370704153;2011:370706931sharesauthorisedandissued 35 35Additionalpaid-incapital 10530 8958Treasuryshares,netoftax –1483 –1134
Accumulatedothercomprehensiveincome:Netunrealisedinvestmentgains/losses,netoftax 1042 4223Other-than-temporaryimpairment,netoftax –169 –118Cumulativetranslationadjustments,netoftax –3742 –3924Accumulatedadjustmentforpensionandpost-retirementbenefits,netoftax –522 –775
Totalaccumulatedothercomprehensiveincome –3391 –594
Retainedearnings 19651 22229Shareholders’equity 25342 29494
Non-controllinginterests 1564 1697Totalequity 26906 31191
Totalliabilitiesandequity 228403 228120
6 SwissReinsuranceCompanyConsolidated2011AnnualReport
Financialstatements|Groupfinancialstatements
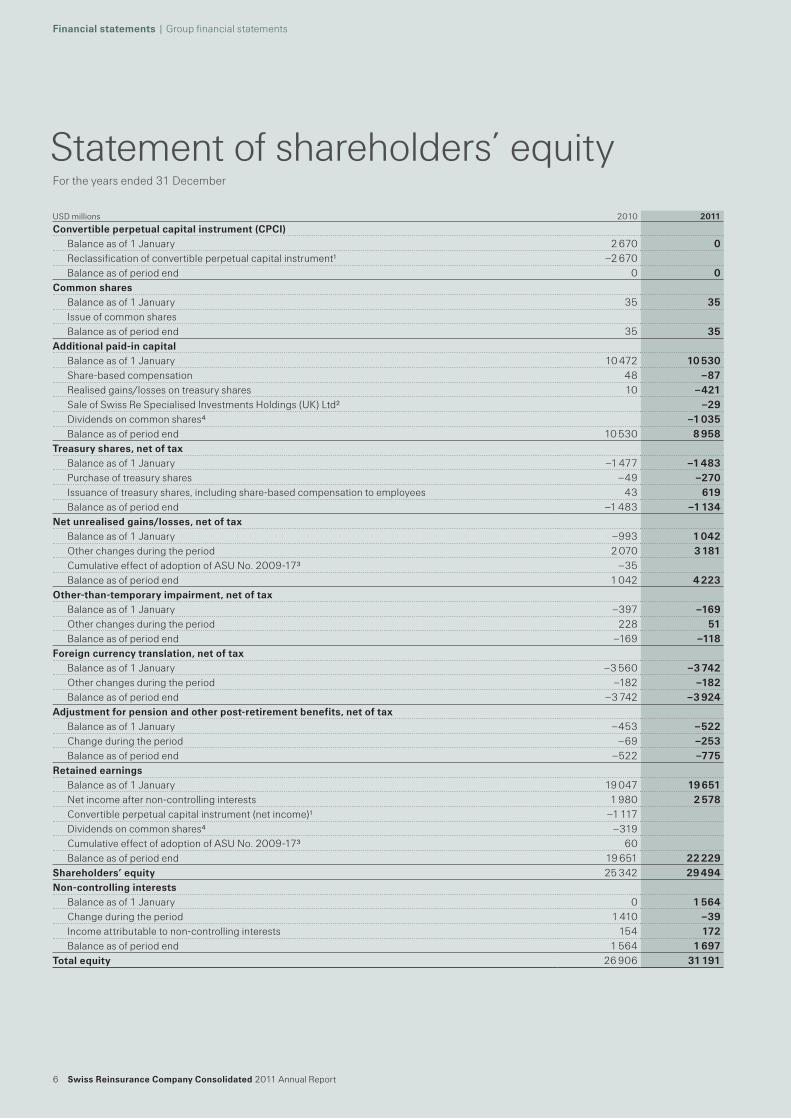
Statementofshareholders’equityFortheyearsended31December
USDmillions 2010 2011
Convertibleperpetualcapitalinstrument(CPCI)Balanceasof1January 2670 0Reclassificationofconvertibleperpetualcapitalinstrument1 –2670Balanceasofperiodend 0 0
CommonsharesBalanceasof1January 35 35IssueofcommonsharesBalanceasofperiodend 35 35
Additionalpaid-incapitalBalanceasof1January 10472 10530Share-basedcompensation 48 –87Realisedgains/lossesontreasuryshares 10 –421SaleofSwissReSpecialisedInvestmentsHoldings(UK)Ltd2 –29Dividendsoncommonshares4 –1035Balanceasofperiodend 10530 8958
Treasuryshares,netoftaxBalanceasof1January –1477 –1483Purchaseoftreasuryshares –49 –270Issuanceoftreasuryshares,includingshare-basedcompensationtoemployees 43 619Balanceasofperiodend –1483 –1134
Netunrealisedgains/losses,netoftaxBalanceasof1January –993 1042Otherchangesduringtheperiod 2070 3181CumulativeeffectofadoptionofASUNo.2009-173 –35Balanceasofperiodend 1042 4223
Other-than-temporaryimpairment,netoftaxBalanceasof1January –397 –169Otherchangesduringtheperiod 228 51Balanceasofperiodend –169 –118
Foreigncurrencytranslation,netoftaxBalanceasof1January –3560 –3742Otherchangesduringtheperiod –182 –182Balanceasofperiodend –3742 –3924
Adjustmentforpensionandotherpost-retirementbenefits,netoftaxBalanceasof1January –453 –522Changeduringtheperiod –69 –253Balanceasofperiodend –522 –775
RetainedearningsBalanceasof1January 19047 19651Netincomeafternon-controllinginterests 1980 2578Convertibleperpetualcapitalinstrument(netincome)1 –1117Dividendsoncommonshares4 –319CumulativeeffectofadoptionofASUNo.2009-173 60Balanceasofperiodend 19651 22229
Shareholders’equity 25342 29494Non-controllinginterests
Balanceasof1January 0 1564Changeduringtheperiod 1410 –39Incomeattributabletonon-controllinginterests 154 172Balanceasofperiodend 1564 1697
Totalequity 26906 31191

SwissReinsuranceCompanyConsolidated2011AnnualReport 7
Financialstatements|Groupfinancialstatements
TheaccompanyingnotesareanintegralpartoftheGroupfinancialstatements.
1TheCPCIwasreclassifiedfromequitytoshort-termdebtuponterminationon4November2010.ThefinalcashsettlementwasmadeinJanuary2011.2On3May2011,SwissReinsuranceCompanyLtdsolditssubsidiarySwissReSpecialisedInvestmentsHoldings(UK)LimitedtoSwissReLtd.Asthetransactionhasbeen
accountedforinamannersimilartoatransactionbetweenentitiesundercommoncontrol,thedifferencebetweentheproceedsreceivedandthebookvaluewasaccountedforasacapitaltransaction.
3TheGroupadoptedanewaccountingpronouncement,ASUNo.2009-17(FAS167),anupdatetoTopic810–Consolidation,asof1January2010,whichresultedinthefullconsolidationofcertainVIEs.ThisresultedinatransitionimpacttoretainedearningsofUSD60millionandtonetunrealisedgains/lossesofUSD–35million.
4In2011,dividendstoshareholderswerepaidintheformofawithholdingtaxexemptrepaymentoflegalreservesfromcapitalcontributions.
8 SwissReinsuranceCompanyConsolidated2011AnnualReport
Financialstatements|Groupfinancialstatements
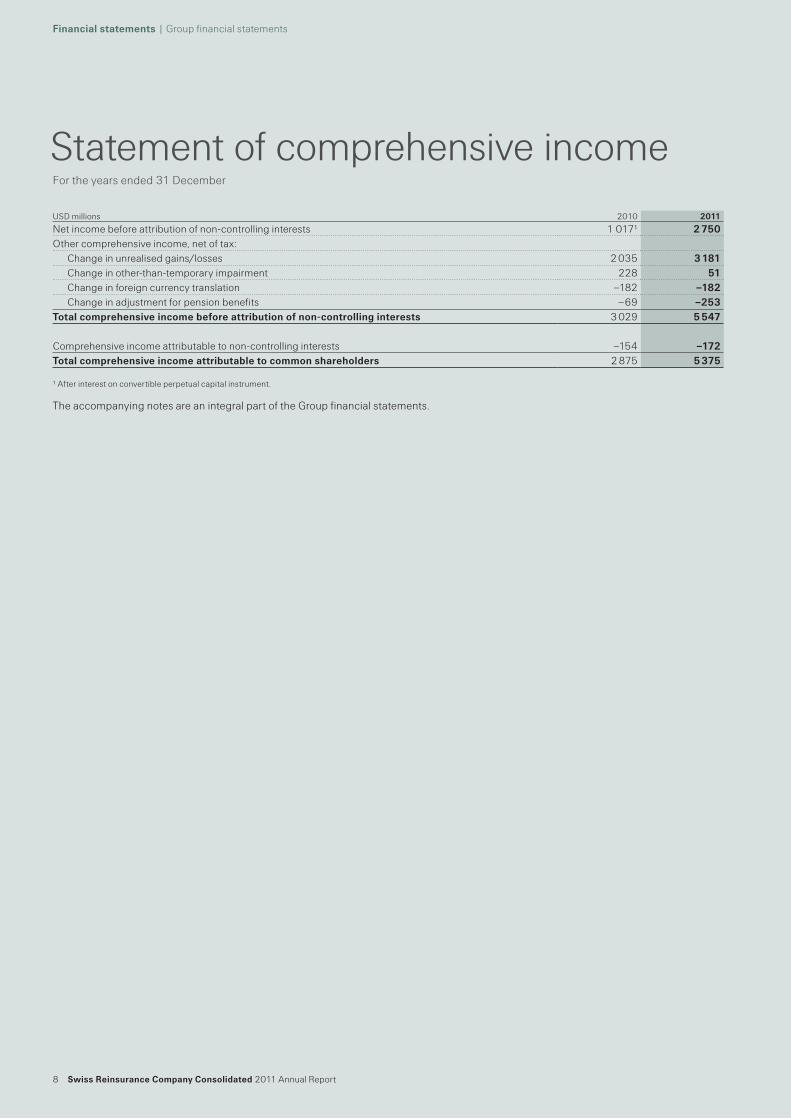
StatementofcomprehensiveincomeFortheyearsended31December
TheaccompanyingnotesareanintegralpartoftheGroupfinancialstatements.
USDmillions 2010 2011
Netincomebeforeattributionofnon-controllinginterests 10171 2750Othercomprehensiveincome,netoftax:
Changeinunrealisedgains/losses 2035 3181Changeinother-than-temporaryimpairment 228 51Changeinforeigncurrencytranslation –182 –182Changeinadjustmentforpensionbenefits –69 –253
Totalcomprehensiveincomebeforeattributionofnon-controllinginterests 3029 5547
Comprehensiveincomeattributabletonon-controllinginterests –154 –172Totalcomprehensiveincomeattributabletocommonshareholders 2875 5375
1Afterinterestonconvertibleperpetualcapitalinstrument.
SwissReinsuranceCompanyConsolidated2011AnnualReport 9
Financialstatements|Groupfinancialstatements
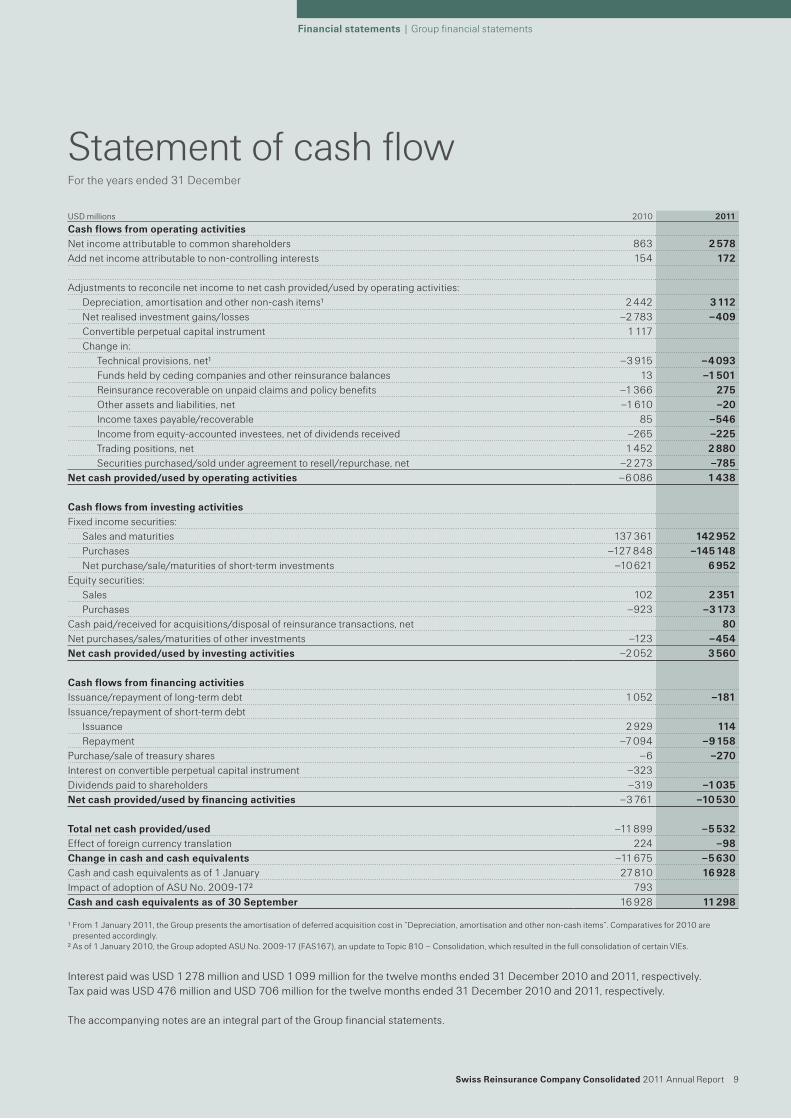
StatementofcashflowFortheyearsended31December
InterestpaidwasUSD1278millionandUSD1099millionforthetwelvemonthsended31December2010and2011,respectively.TaxpaidwasUSD476millionandUSD706millionforthetwelvemonthsended31December2010and2011,respectively.
TheaccompanyingnotesareanintegralpartoftheGroupfinancialstatements.
USDmillions 2010 2011
CashflowsfromoperatingactivitiesNetincomeattributabletocommonshareholders 863 2578Addnetincomeattributabletonon-controllinginterests 154 172
Adjustmentstoreconcilenetincometonetcashprovided/usedbyoperatingactivities:Depreciation,amortisationandothernon-cashitems1 2442 3112Netrealisedinvestmentgains/losses –2783 –409Convertibleperpetualcapitalinstrument 1117Changein:
Technicalprovisions,net1 –3915 –4093Fundsheldbycedingcompaniesandotherreinsurancebalances 13 –1501Reinsurancerecoverableonunpaidclaimsandpolicybenefits –1366 275Otherassetsandliabilities,net –1610 –20Incometaxespayable/recoverable 85 –546Incomefromequity-accountedinvestees,netofdividendsreceived –265 –225Tradingpositions,net 1452 2880Securitiespurchased/soldunderagreementtoresell/repurchase,net –2273 –785
Netcashprovided/usedbyoperatingactivities –6086 1438
CashflowsfrominvestingactivitiesFixedincomesecurities:
Salesandmaturities 137361 142952Purchases –127848 –145148Netpurchase/sale/maturitiesofshort-terminvestments –10621 6952
Equitysecurities:Sales 102 2351Purchases –923 –3173
Cashpaid/receivedforacquisitions/disposalofreinsurancetransactions,net 80Netpurchases/sales/maturitiesofotherinvestments –123 –454Netcashprovided/usedbyinvestingactivities –2052 3560
CashflowsfromfinancingactivitiesIssuance/repaymentoflong-termdebt 1052 –181Issuance/repaymentofshort-termdebt
Issuance 2929 114Repayment –7094 –9158
Purchase/saleoftreasuryshares –6 –270Interestonconvertibleperpetualcapitalinstrument –323Dividendspaidtoshareholders –319 –1035Netcashprovided/usedbyfinancingactivities –3761 –10530
Totalnetcashprovided/used –11899 –5532Effectofforeigncurrencytranslation 224 –98Changeincashandcashequivalents –11675 –5630Cashandcashequivalentsasof1January 27810 16928ImpactofadoptionofASUNo.2009-172 793Cashandcashequivalentsasof30September 16928 11298
1From1January2011,theGrouppresentstheamortisationofdeferredacquisitioncostin“Depreciation,amortisationandothernon-cashitems”.Comparativesfor2010arepresentedaccordingly.
2Asof1January2010,theGroupadoptedASUNo.2009-17(FAS167),anupdatetoTopic810–Consolidation,whichresultedinthefullconsolidationofcertainVIEs.
10 Swiss Reinsurance Company Consolidated 2011 Annual Report
Financial statements
Notes to the Group financial statements1 Organisation and summary of significant accounting policies
Nature of operationsThe Swiss Reinsurance Company Group, which is headquartered in Zurich, Switzerland, comprises Swiss Reinsurance Company Ltd (the parent company, referred to as “SRZ”) and its subsidiaries (collectively, the “Swiss Reinsurance Company Group” or the “Group”). The Swiss Reinsurance Company Group is a wholesale provider of reinsurance, insurance and other insurance-based forms of risk transfer. Working through brokers and a network of more than 60 offices around the globe, its client base consists of insurance companies, mid-to-large-sized corporations and public sector clients.
Basis of presentationThe accompanying consolidated financial statements have been prepared in accordance with accounting principles generally accepted in the United States of America (US GAAP) and comply with Swiss law. All significant inter-company transactions and balances have been eliminated on consolidation.
Effective 20 May 2011, SRZ became a subsidiary of Swiss Re Ltd, a new holding company formed through an exchange offer in which SRZ shareholders were offered the opportunity to exchange their SRZ shares for shares of Swiss Re Ltd. On 8 December 2011, SRZ shares were delisted from the SIX Swiss Exchange and effective 13 December 2011, SRZ became a wholly owned subsidiary of Swiss Re Ltd. Consequently, in accordance with the relevant US GAAP guidance, no earnings per share disclosures were included in these financial statements.
During the second quarter but prior to 20 May 2011, Swiss Re Specialised Investments Holdings (UK) Ltd (“SRSIH”) was transferred from SRZ to Swiss Re Ltd and became a related party of the Swiss Reinsurance Company Group. As a result of the transfer, contractual relationships between the Swiss Reinsurance Company Group and SRSIH (consisting mainly of other loans granted to SRSIH of USD 2 686 million and accrued expenses and other liabilities in respect of SRSIH of USD 2 331 million as of 31 December 2011) are presented as external party transactions in these financial statements.
The Swiss Re Group (Swiss Re Ltd and its consolidated subsidiaries) is implementing a new organisational structure which will be reflected in the financial statements of the Swiss Re Group beginning with the first quarter of 2012. During the first half of 2012, Swiss Reinsurance Company Ltd will transfer Corporate Solutions and Admin Re® entities through a dividend in-kind to Swiss Re Ltd. These transfers are subject to the approval of our principal regulator, FINMA. Following these transfers, the Corporate Solutions and Admin Re® entities will cease to be subsidiaries of Swiss Reinsurance Company Ltd and, therefore, will no longer be part of the Swiss Reinsurance Company Group; these entities will instead become subsidiaries of Swiss Re Ltd.
The new Group reporting structure will be reflected in the Group financial statements from the first quarter of 2012. It will consist of the Property & Casualty, the Life & Health and the Other segment. The Other segment will include mainly certain costs not allocated to the Reinsurance business segments, certain Treasury activities as well as the remaining non-core activities which have been in run-off since November 2007.
Principles of consolidationThe Group’s financial statements include the consolidated financial statements of Swiss Reinsurance Company Ltd and its subsidiaries. Voting entities which Swiss Re Reinsurance Company directly or indirectly controls through holding a majority of the voting rights are consolidated in the Group’s accounts. Variable interest entities (VIEs) are consolidated when the Group is the primary beneficiary. The Group is the primary beneficiary when it has power over the activities that impact the VIE’s economic performance and at the same time has the obligation to absorb losses or the right to receive benefits that could potentially be significant to the VIE. Companies which the Group does not control, but over which the Group directly or indirectly exercises significant influence, are accounted for using the equity method and are included in other invested assets. The Group’s share of net profit or loss in investments accounted for under the equity method is included in net investment income. Equity and net income of these companies are adjusted as necessary to be in line with the Group’s accounting policies. The results of consolidated subsidiaries and investments accounted for using the equity method are included in the financial statements for the period commencing from the date of acquisition.
Use of estimates in the preparation of financial statementsThe preparation of financial statements requires management to make significant estimates and assumptions that affect the reported amounts of assets, liabilities, revenues and expenses as well as the related disclosure including contingent assets and liabilities. The Group’s liabilities for unpaid claims and claim adjustment expenses and policy benefits for life and health include estimates for premium, claim and benefit data not received from ceding companies at the date of the financial statements. In addition, the Group uses certain financial instruments and invests in securities of certain entities for which exchange trading does not exist. The Group determines these estimates based on historical information, actuarial analyses, financial modelling and other analytical techniques. Actual results could differ significantly from the estimates described above.
Swiss Reinsurance Company Consolidated 2011 Annual Report 11
Financial statements | Notes to the Group financial statements
Foreign currency remeasurements and translationTransactions denominated in foreign currencies are remeasured to the respective subsidiary’s functional currency at average quarterly exchange rates. Monetary assets and liabilities are remeasured to the functional currency at closing exchange rates, whereas non-monetary assets and liabilities are remeasured to the functional currency at historical rates. Remeasurement gains and losses on monetary assets and liabilities and trading securities are reported in earnings. Remeasurement gains and losses on available-for-sale securities, investments in consolidated subsidiaries and investments accounted for using the equity method are reported in shareholders’ equity.
For consolidation purposes, assets and liabilities of subsidiaries with functional currencies other than US dollars are translated from the functional currency to US dollars at closing rates. Revenues and expenses are translated at average exchange rates. Translation adjustments are reported in shareholders’ equity.
Valuation of financial assetsThe fair value of the majority of the Group’s financial instruments is based on quoted prices in active markets or observable inputs. These instruments include government and agency securities, commercial paper, most investment-grade corporate debt, most high-yield debt securities, exchange-traded derivative instruments, most mortgage-backed and asset-backed securities and listed equity securities. In markets with reduced or no liquidity, spreads between bid and offer prices are normally wider compared to spreads in highly liquid markets. Such market conditions affect the valuation of certain asset classes of the Group, such as some asset-backed securities as well as certain derivative structures referencing such asset classes.
The Group considers both the credit risk of its counterparties and own risk of non-performance in the valuation of derivative instruments and other over-the-counter financial assets. In determining the fair value of these financial instruments, the assessment of the Group’s exposure to the credit risk of its counterparties incorporates consideration of existing collateral and netting arrangements entered into with each counterparty. The measure of the counterparty credit risk is estimated with incorporation of the observable credit spreads, where available, or credit spread estimates derived based on the benchmarking techniques where market data is not available. The impact of the Group’s own risk of non-performance is analysed in the manner consistent with the aforementioned approach, with consideration of the Group’s observable credit spreads. The value representing such risk is incorporated into the fair value of the financial instruments (primarily derivatives), in a liability position as of the measurement date. The change in this adjustment from period to period is reflected in realised gains and losses in the income statement.
For assets or derivative structures at fair value, the Group uses market prices or inputs derived from market prices. A separate internal price verification process, independent of the trading function, provides an additional control over the market prices or market input used to determine the fair values of such assets. Whilst management considers that appropriate values have been ascribed to such assets, there is always a level of uncertainty and judgment over these valuations. Subsequent valuations could differ significantly from the results of the process described above. The Group may become aware of counterparty valuations, either directly through the exchange of information or indirectly, for example, through collateral demands. Any implied differences are considered in the independent price verification process and may result in adjustments to initially indicated valuations. As of 31 December 2011, the Group had not provided any collateral on financial instruments in excess of its own market value estimates.
InvestmentsThe Group’s investments in fixed income and equity securities are classified as available-for-sale (AFS) or trading. Fixed income securities AFS and equity securities AFS are carried at fair value, based on quoted market prices, with the difference between original cost and fair value being recognised in shareholders’ equity. Trading fixed income and equity securities are carried at fair value with unrealised gains and losses being recognised in earnings.
The cost of equity securities AFS is reduced to fair value, with a corresponding charge to realised investment losses if the decline in value, expressed in functional currency terms, is other-than-temporary. Subsequent recoveries of previously recognised impairments are not recognised.
12 Swiss Reinsurance Company Consolidated 2011 Annual Report
Financial statements | Notes to the Group financial statements
For debt securities AFS which are other-than-temporary impaired and there is not an intention to sell, the impairment is separated into (i) the estimated amount relating to credit loss, and (ii) the amount relating to all other factors. The estimated credit loss amount is recognised in earnings, with the remainder of the loss amount recognised in other comprehensive income. In cases where there is an intention or requirement to sell, the accounting of the other-than-temporary impairment is the same as for equity securities AFS described above.
Interest on fixed income securities is recorded in net investment income when earned and is adjusted for the amortisation of any purchase premium or discount. Dividends on equity securities are recorded on the basis of the ex-dividend date. Realised gains and losses on sales are included in earnings and are calculated using the specific identification method.
Policy loans, mortgages and other loans are carried at amortised cost. Interest income is recognised in accordance with the effective yield method.
Investment in real estate that the Group intends to hold for the production of income is carried at depreciated cost, net of any write-downs for impairment in value. Impairment in value is recognised if the sum of the estimated future undiscounted cash flows from the use of the real estate is lower than its carrying value. Impairment in value, depreciation and other related charges or credits are included in net investment income. Investment in real estate held for sale is carried at the lower of cost or fair value, less estimated selling costs, and is not depreciated. Reductions in the carrying value of real estate held for sale are included in realised investment losses.
Short-term investments are carried at amortised cost, which approximates fair value. The Group considers highly liquid investments with a remaining maturity at the date of acquisition of one year or less, but greater than three months, to be short-term investments.
Other invested assets include affiliated companies, equity accounted companies, derivative financial instruments, collateral receivables, securities purchased under agreement to resell, and investments without readily determinable fair value (including limited partnership investments). Investments in limited partnerships where the Group’s interest equals or exceeds 3% are accounted for using the equity method. Investments in limited partnerships where the Group’s interest is below 3% and equity investments in corporate entities which are not publicly traded are accounted for at estimated fair value with changes in fair value recognised as unrealised gains/losses in shareholders’ equity.
The Group enters into security lending arrangements under which it loans certain securities in exchange for collateral and receives securities lending fees. The Group’s policy is to require collateral, consisting of cash or securities, equal to at least 102% of the carrying value of the securities loaned. In certain arrangements, the Group may accept collateral of less than 102% if the structure of the overall transaction offers an equivalent level of security. Cash received as collateral is recognised along with an obligation to return the cash. Securities received as collateral that can be sold or repledged are also recognised along with an obligation to return those securities. Security lending fees are recognised over the term of the related loans.
Derivative financial instruments and hedge accountingThe Group uses a variety of derivative financial instruments including swaps, options, forwards and exchange-traded financial futures for the Group’s trading and hedging strategy in line with the overall risk management strategy. Derivative financial instruments are primarily used as a means of managing exposure to price, foreign currency and/or interest rate risk on planned or anticipated investment purchases, existing assets or liabilities and also to lock in attractive investment conditions for funds which become available in the future. The Group recognises all of its derivative instruments on the balance sheet at fair value. Derivatives that are not designated as hedging instruments are adjusted to fair value through earnings.
If the derivative is designated as a hedge of the fair value of assets or liabilities, changes in the fair value of the derivative are recognised in earnings, together with changes in the fair value of the related hedged item. If the derivative is designated as a hedge of the variability in expected future cash flows related to a particular risk, changes in the fair value of the derivative are reported in other comprehensive income until the hedged item is recognised in earnings. The ineffective portion of the hedge is recognised in earnings. When hedge accounting is
Swiss Reinsurance Company Consolidated 2011 Annual Report 13
Financial statements | Notes to the Group financial statements
discontinued on a cash flow hedge, the net gain or loss remains in accumulated other comprehensive income and is reclassified to earnings in the period in which the formerly hedged transaction is reported in earnings. When the Group discontinues hedge accounting because it is no longer probable that a forecasted transaction will occur within the required time period, the derivative continues to be carried on the balance sheet at fair value, and gains and losses that were previously recorded in accumulated other comprehensive income are recognised in earnings.
The Group recognises separately derivatives that are embedded within other host instruments if the economic characteristics and risks are not clearly and closely related to the economic characteristics and risks of the host contract and if it meets the definition of a derivative if it were stand-alone.
Derivative financial instrument assets are generally included in other invested assets, and derivative financial instrument liabilities are generally included in accrued expenses and other liabilities.
The Group also designates non-derivative monetary financial instruments as a hedge of the foreign currency exposure of its net investment in certain foreign operations. From the inception of the hedging relationship, remeasurement gains and losses on the designated non-derivative monetary financial instruments and translation gains and losses on the hedged net investment are reported as translation gains and losses in shareholders’ equity.
Cash and cash equivalentsCash and cash equivalents include cash on hand, short-term deposits, certain short-term investments in money market funds, and highly liquid debt instruments with a remaining maturity at the date of acquisition of three months or less.
Deferred acquisition costsAcquisition costs, which vary with, and are primarily related to, the production of new insurance and reinsurance business, are deferred to the extent they are deemed recoverable from future gross profits. Deferred acquisition costs consist principally of commissions. Deferred acquisition costs for short-duration contracts are amortised in proportion to premiums earned. Future investment income is considered in determining the recoverability of deferred acquisition costs for short-duration contracts. Deferred acquisition costs for long-duration contracts are amortised over the life of underlying contracts. Deferred acquisition costs for universal-life and similar products are amortised based on the present value of estimated gross profits. Estimated gross profits are updated quarterly.
Business combinationsThe Group applies the purchase method of accounting for business combinations. This method allocates the cost of the acquired entity to the assets and liabilities assumed based on their estimated fair values at the date of acquisition.
Admin Re® blocks of business can be acquired in different legal forms, either through an acquisition of an entity’s share capital or through a reinsurance transaction. The Group’s policy is to treat these transactions consistently regardless of the form of acquisition. Accordingly, the Group records the acquired assets and liabilities directly to the balance sheet. Premiums, life and health benefits and other income statement items are not recorded in the income statement on the date of the acquisition.
The underlying liabilities and assets acquired are subsequently accounted for according to the relevant GAAP guidance, including specific guidance applicable to subsequent accounting for assets and liabilities recognised as part of the purchase method of accounting, including present value of future profit, goodwill and other intangible assets.
14 Swiss Reinsurance Company Consolidated 2011 Annual Report
Financial statements | Notes to the Group financial statements
Acquired present value of future profitsThe acquired present value of future profits (PVFP) of business in force is recorded in connection with the acquisition of life and/or health business. The initial value is determined actuarially by discounting estimated future gross profits as a measure of the value of business acquired. The resulting asset is amortised on a constant yield basis over the expected revenue recognition period of the business acquired, generally over periods ranging up to 30 years, with the accrual of interest added to the unamortised balance at the earned rate. For universal-life and similar products, PVFP is amortised in line with estimated gross profits, and estimated gross profits are updated quarterly. The carrying value of PVFP is reviewed periodically for indicators of impairment in value. Adjustments to reflect impairment in value are recognised in earnings during the period in which the determination of impairment is made.
GoodwillThe excess of the purchase price of acquired businesses over the estimated fair value of net assets acquired is recorded as goodwill, which is reviewed periodically for indicators of impairment in value. Adjustments to reflect impairment in value are recognised in earnings in the period in which the determination of impairment is made.
Other assetsOther assets include deferred expenses on retroactive reinsurance, separate account assets, prepaid reinsurance premiums, receivables related to investing activities, real estate for own use, property, plant and equipment, accrued income, certain intangible assets and prepaid assets.
The excess of estimated liabilities for claims and claim adjustment expenses payable over consideration received in respect of retroactive property and casualty reinsurance contracts is recorded as a deferred expense. The deferred expense on retroactive reinsurance contracts is amortised through earnings over the expected claims-paying period.
Separate account assets are carried at fair value. The investment performance (including interest, dividends, realised gains and losses and changes in unrealised gains and losses) of separate account assets and the corresponding amounts credited to the contract holder are offset to zero in the same line item in earnings.
Real estate for own use, property, plant and equipment are carried at depreciated cost.
Capitalised software costsExternal direct costs of materials and services incurred to develop or obtain software for internal use, payroll and payroll-related costs for employees directly associated with software development and interest cost incurred while developing software for internal use are capitalised and amortised on a straight-line basis through earnings over the estimated useful life.
Deferred income taxesDeferred income tax assets and liabilities are recognised based on the difference between financial statement carrying amounts and the corresponding income tax bases of assets and liabilities using enacted income tax rates and laws. A valuation allowance is recorded against deferred tax assets when it is deemed more likely than not that some or all of the deferred tax asset may not be realised.
Unpaid claims and claim adjustment expensesLiabilities for unpaid claims and claim adjustment expenses for property and casualty reinsurance contracts are accrued when insured events occur and are based on the estimated ultimate cost of settling the claims, using reports and individual case estimates received from ceding companies. A provision is also included for claims incurred but not reported, which is developed on the basis of past experience adjusted for current trends and other factors that modify past experience. The establishment of the appropriate level of reserves is an inherently uncertain process, involving estimates and judgments made by management, and therefore there can be no assurance that ultimate claims and claim adjustment expenses will not exceed the loss reserves currently established. These estimates are regularly reviewed, and adjustments for differences between estimates and actual payments for claims and for changes in estimates are reflected in income in the period in which the estimates are changed or payments are made.
Swiss Reinsurance Company Consolidated 2011 Annual Report 15
Financial statements | Notes to the Group financial statements
The Group does not discount liabilities arising from prospective property and casualty insurance and reinsurance contracts, including liabilities which are discounted for US statutory reporting purposes. Liabilities arising from property and casualty insurance and reinsurance contracts acquired in a business combination are initially recognised at fair value in accordance with the purchase method of accounting.
Experience features which are directly linked to a reinsurance asset or liability are classified in a manner that is consistent with the presentation of that asset or liability.
Liabilities for life and health policy benefitsLiabilities for life and health policy benefits from reinsurance business are generally calculated using the net level premium method, based on assumptions as to investment yields, mortality, withdrawals, lapses and policyholder dividends. Assumptions are set at the time the contract is issued or, in the case of contracts acquired by purchase, at the purchase date. The assumptions are based on projections from past experience, making allowance for possible adverse deviation. Interest assumptions for life and health reinsurance benefits liabilities range from 1% to 11%. Assumed mortality rates are generally based on experience multiples applied to the actuarial select and ultimate tables based on industry experience. Liabilities for policy benefits are increased if it is determined that future cash flows, including investment income, are insufficient to cover future benefits and expenses.
The liability for accident and health policy benefits consists of active life reserves and the estimated present value of the remaining ultimate net costs of incurred claims. The active life reserves include unearned premiums and additional reserves. The additional reserves are computed on the net level premium method using assumptions for future investment yield, mortality and morbidity experience. The assumptions are based on projections of past experience and include provisions for possible adverse deviation.
Policyholder account balancesPolicyholder account balances relate to universal life-type contracts and investment contracts. Interest crediting rates for policyholder account balances range from 2% to 9%.
Universal life-type contracts are long-duration insurance contracts, providing either death or annuity benefits, with terms that are not fixed and guaranteed.
Investment contracts are long-duration contracts that do not incorporate significant insurance risk, ie there is no mortality and morbidity risk, or the mortality and morbidity risk associated with the insurance benefit features offered in the contract is of insignificant amount or remote probability. Amounts received as payment for investment contracts are reported as policyholder account balances. Related assets are included in general account assets.
Amounts assessed against policyholders for mortality, administration and surrender are shown as fee income. Amounts credited to policyholders are shown as interest credited to policyholders. Investment income and realised investment gains and losses allocable to policyholders are included in net investment income and net realised investment gains/losses.
Funds held assets and liabilitiesFunds held assets and liabilities include amounts retained by the ceding company or the Group for business written on a funds withheld basis, and amounts arising from the application of the deposit method of accounting to insurance and reinsurance contracts that do not indemnify the ceding company or the Group against loss or liability relating to insurance risk.
Under the deposit method of accounting, the deposit asset or liability is initially measured based on the consideration paid or received. For contracts that transfer neither significant timing nor underwriting risk, and contracts that transfer only significant timing risk, changes in estimates of the timing or amounts of cash flows are accounted for by recalculating the effective yield. The deposit is then adjusted to the amount that would have existed had the new effective yield been applied since the inception of the contract. The revenue and expense recorded for such contracts is included in net investment income. For contracts that transfer only significant underwriting risk, once a loss is incurred, the deposit is adjusted by the present value of the incurred loss. At each subsequent balance sheet date, the portion of the deposit attributable to the incurred loss is recalculated by discounting the estimated future cash flows. The resulting changes in the carrying amount of the deposit are recognised in claims and claim adjustment expenses.
16 Swiss Reinsurance Company Consolidated 2011 Annual Report
Financial statements | Notes to the Group financial statements
PremiumsProperty and casualty reinsurance premiums are recorded when written and include an estimate for written premiums receivable at period end. Premiums earned are generally recognised in income over the contract period in proportion to the amount of reinsurance provided. Unearned premiums consist of the unexpired portion of reinsurance provided. Life reinsurance premiums are earned when due. Related policy benefits are recorded in relation to the associated premium or gross profits so that profits are recognised over the expected lives of the contracts.
Life and health reinsurance premiums for group coverages are generally earned over the term of the coverage. For group contracts that allow experience adjustments to premiums, such premiums are recognised as the related experience emerges.
Reinsurance cededThe Group uses retrocession arrangements to increase its aggregate underwriting capacity, to diversify its risk and to reduce the risk of catastrophic loss on reinsurance assumed. The ceding of risks to retrocessionaires does not relieve the Group of its obligations to its ceding companies. The Group regularly evaluates the financial condition of its retrocessionaires and monitors the concentration of credit risk to minimise its exposure to financial loss from retrocessionaires’ insolvency. Premiums and losses ceded under retrocession contracts are reported as reductions of premiums earned and claims and claim adjustment expenses. Amounts recoverable for ceded short- and long-duration contracts, including universal life-type and investment contracts, are reported as assets in the accompanying consolidated balance sheet.
The Group provides reserves for uncollectible amounts on reinsurance balances ceded, based on management’s assessment of the collectibility of the outstanding balances.
ReceivablesPremium and claims receivables which have been invoiced are accounted for at face value. Together with assets arising from the application of the deposit method of accounting that meet the definition of financing receivables they are regularly assessed for impairment. Evidence of impairment is ageing and financial difficulties of the counterparty. Allowances are set up on the net balance, meaning all balances related to the same counterparty are considered. The amount of the allowance is set up in relation to the time a receivable has been due and financial difficulties of the debtor, and can be as high as the outstanding net balance.
Pensions and other post-retirement benefitsThe Group accounts for its pension and other post-retirement benefit costs using the accrual method of accounting. Amounts charged to expense are based on periodic actuarial determinations.
Share-based payment transactionsThe Group has a long-term incentive plan, a fixed option plan, a restricted share plan, and an employee participation plan. These plans are described in more detail in Note 11. The Group accounts for share-based payment transactions with employees using the fair value method. Under the fair value method, the fair value of the awards is recognised in earnings over the vesting period.
For share-based compensation plans which are settled in cash, compensation costs are recognised as liabilities, whereas for equity-settled plans, compensation costs are recognised as an accrual to additional paid-in capital within shareholders’ equity.
Treasury sharesTreasury shares are reported at cost in shareholders’ equity. Treasury shares also include stand-alone derivative instruments indexed to the Group’s shares that meet the requirements for classification in shareholders’ equity.
Subsequent eventsSubsequent events for the current reporting period have been evaluated up to 15 March 2012. This is the date on which the financial statements are available to be issued.
Swiss Reinsurance Company Consolidated 2011 Annual Report 17
Financial statements | Notes to the Group financial statements
Recent accounting guidanceIn January 2010, the FASB issued “Improving Disclosures about Fair Value Measurements” (ASU No. 2010-06), an update to Topic 820 – Fair Value Measurements and Disclosures. This new standard implements additional disclosure requirements for the three fair value levels. As required by the update, the Group adopted some of the requirements as of 1 January 2010. The remaining requirements were adopted as of 1 January 2011 and can be found in Note 3.
In December 2010, the FASB issued “When to Perform Step 2 of the Goodwill Impairment Test for Reporting Units with Zero or Negative Carrying Amounts” (ASU No. 2010-28), an update to Topic 350 – Intangibles – Goodwill and Other. This update provides guidance under what circumstances a company is required to perform step 2 of the goodwill impairment test for reporting units with zero or negative carrying amounts. The Group adopted this guidance as of 1 January 2011. The adoption did not have an impact on the Group’s financial statements.
Also in December 2010, the FASB issued “Disclosure of Supplementary Pro Forma Information for Business Combinations” (ASU No. 2010-29), an update to Topic 805 – Business Combinations. This update specifies that an entity should disclose revenue and earnings of the combined entity as though the business combinations that occurred during the current year had occurred as of the beginning of the comparable prior annual reporting period only. The Group adopted this update as of 1 January 2011. The adoption did not have an impact on the Group’s financial statements.
In April 2011, the FASB issued “A Creditor’s Determination of Whether a Restructuring Is a Troubled Debt Restructuring” (ASU No. 2011-02), an update to Topic 310 – Receivables. This update provides clarifications on the determination whether a restructuring of debt constitutes a troubled debt restructuring. The Group adopted this guidance as of 1 July 2011. The adoption did not have an impact on the Group’s financial statements.
In October 2010, the FASB issued “Accounting for Costs Associated with Acquiring or Renewing Insurance Contracts” (ASU No. 2010-26), an update to Topic 944 – Financial Services – Insurance. This new guidance limits the definition of deferrable acquisition costs to costs directly related to the successful acquisition or renewal of insurance contracts. The Group will adopt ASU No. 2010-26 in the first quarter of 2012. We do not expect that the adoption will have a material impact on the Group’s financial statements.
18 Swiss Reinsurance Company Consolidated 2011 Annual Report
Financial statements | Notes to the Group financial statements
2 Investments
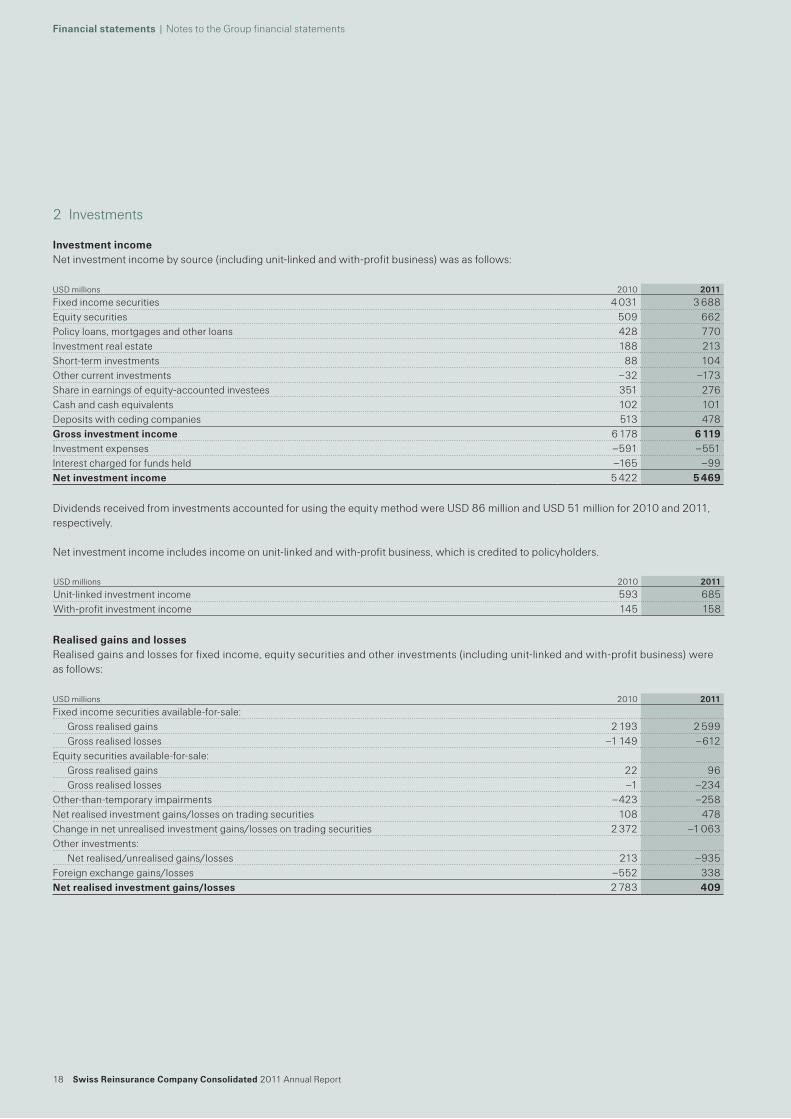
Investment incomeNet investment income by source (including unit-linked and with-profit business) was as follows:
Dividends received from investments accounted for using the equity method were USD 86 million and USD 51 million for 2010 and 2011, respectively.
Net investment income includes income on unit-linked and with-profit business, which is credited to policyholders.
Realised gains and lossesRealised gains and losses for fixed income, equity securities and other investments (including unit-linked and with-profit business) were as follows:
USD millions 2010 2011
Fixed income securities 4 031 3 688Equity securities 509 662Policy loans, mortgages and other loans 428 770Investment real estate 188 213Short-term investments 88 104Other current investments –32 –173Share in earnings of equity-accounted investees 351 276Cash and cash equivalents 102 101Deposits with ceding companies 513 478Gross investment income 6 178 6 119Investment expenses –591 –551Interest charged for funds held –165 –99Net investment income 5 422 5 469
USD millions 2010 2011
Unit-linked investment income 593 685With-profit investment income 145 158
USD millions 2010 2011
Fixed income securities available-for-sale:Gross realised gains 2 193 2 599Gross realised losses –1 149 –612
Equity securities available-for-sale:Gross realised gains 22 96Gross realised losses –1 –234
Other-than-temporary impairments –423 –258Net realised investment gains/losses on trading securities 108 478Change in net unrealised investment gains/losses on trading securities 2 372 –1 063Other investments:
Net realised/unrealised gains/losses 213 –935Foreign exchange gains/losses –552 338Net realised investment gains/losses 2 783 409
Swiss Reinsurance Company Consolidated 2011 Annual Report 19
Financial statements | Notes to the Group financial statements
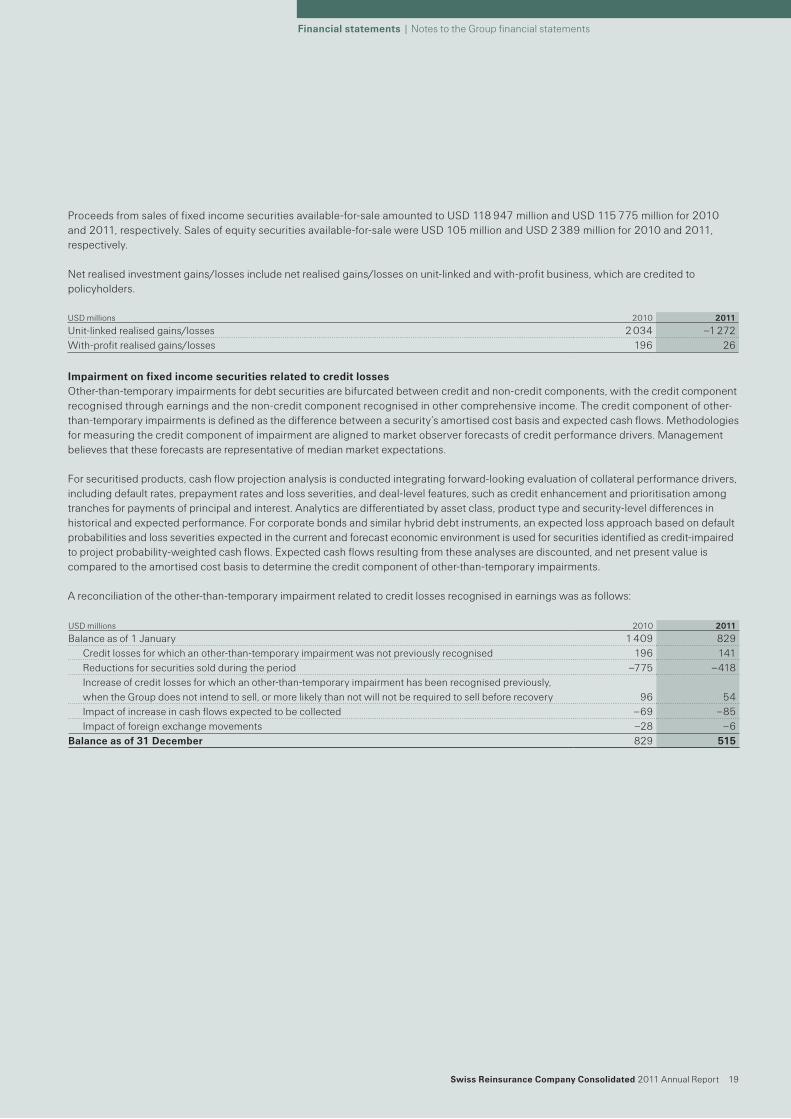
Proceeds from sales of fixed income securities available-for-sale amounted to USD 118 947 million and USD 115 775 million for 2010 and 2011, respectively. Sales of equity securities available-for-sale were USD 105 million and USD 2 389 million for 2010 and 2011, respectively.
Net realised investment gains/losses include net realised gains/losses on unit-linked and with-profit business, which are credited to policyholders.
Impairment on fixed income securities related to credit lossesOther-than-temporary impairments for debt securities are bifurcated between credit and non-credit components, with the credit component recognised through earnings and the non-credit component recognised in other comprehensive income. The credit component of other-than-temporary impairments is defined as the difference between a security’s amortised cost basis and expected cash flows. Methodologies for measuring the credit component of impairment are aligned to market observer forecasts of credit performance drivers. Management believes that these forecasts are representative of median market expectations.
For securitised products, cash flow projection analysis is conducted integrating forward-looking evaluation of collateral performance drivers, including default rates, prepayment rates and loss severities, and deal-level features, such as credit enhancement and prioritisation among tranches for payments of principal and interest. Analytics are differentiated by asset class, product type and security-level differences in historical and expected performance. For corporate bonds and similar hybrid debt instruments, an expected loss approach based on default probabilities and loss severities expected in the current and forecast economic environment is used for securities identified as credit-impaired to project probability-weighted cash flows. Expected cash flows resulting from these analyses are discounted, and net present value is compared to the amortised cost basis to determine the credit component of other-than-temporary impairments.
A reconciliation of the other-than-temporary impairment related to credit losses recognised in earnings was as follows:
USD millions 2010 2011
Unit-linked realised gains/losses 2 034 –1 272With-profit realised gains/losses 196 26
USD millions 2010 2011
Balance as of 1 January 1 409 829Credit losses for which an other-than-temporary impairment was not previously recognised 196 141Reductions for securities sold during the period –775 –418Increase of credit losses for which an other-than-temporary impairment has been recognised previously, when the Group does not intend to sell, or more likely than not will not be required to sell before recovery 96 54Impact of increase in cash flows expected to be collected –69 –85Impact of foreign exchange movements –28 –6
Balance as of 31 December 829 515
20 Swiss Reinsurance Company Consolidated 2011 Annual Report
Financial statements | Notes to the Group financial statements
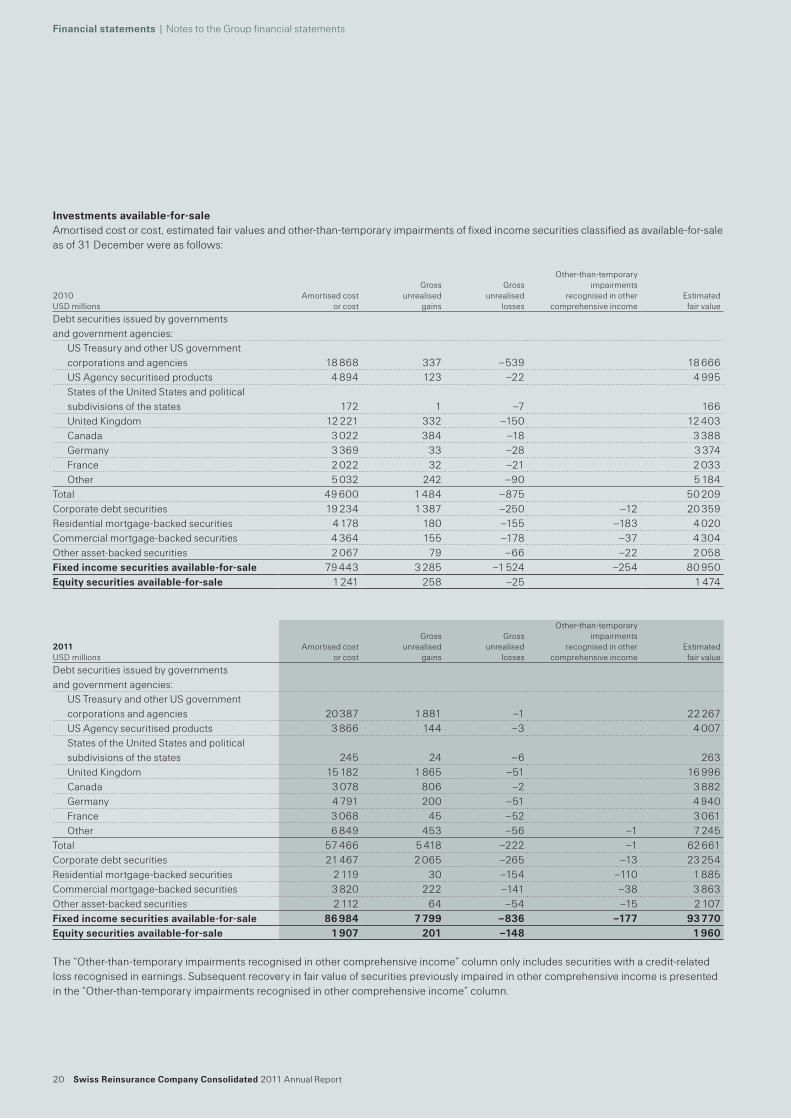
Investments available-for-saleAmortised cost or cost, estimated fair values and other-than-temporary impairments of fixed income securities classified as available-for-sale as of 31 December were as follows:
The “Other-than-temporary impairments recognised in other comprehensive income” column only includes securities with a credit-related loss recognised in earnings. Subsequent recovery in fair value of securities previously impaired in other comprehensive income is presented in the “Other-than-temporary impairments recognised in other comprehensive income” column.
2010 USD millions
Amortised cost or cost
Gross unrealised
gains
Gross unrealised
losses
Other-than-temporary impairments
recognised in other comprehensive income
Estimated fair value
Debt securities issued by governments and government agencies:
US Treasury and other US government corporations and agencies 18 868 337 –539 18 666US Agency securitised products 4 894 123 –22 4 995States of the United States and political subdivisions of the states 172 1 –7 166United Kingdom 12 221 332 –150 12 403Canada 3 022 384 –18 3 388Germany 3 369 33 –28 3 374France 2 022 32 –21 2 033Other 5 032 242 –90 5 184
Total 49 600 1 484 –875 50 209Corporate debt securities 19 234 1 387 –250 –12 20 359Residential mortgage-backed securities 4 178 180 –155 –183 4 020Commercial mortgage-backed securities 4 364 155 –178 –37 4 304Other asset-backed securities 2 067 79 –66 –22 2 058Fixed income securities available-for-sale 79 443 3 285 –1 524 –254 80 950Equity securities available-for-sale 1 241 258 –25 1 474
2011 USD millions
Amortised cost or cost
Gross unrealised
gains
Gross unrealised
losses
Other-than-temporary impairments
recognised in other comprehensive income
Estimated fair value
Debt securities issued by governments and government agencies:
US Treasury and other US government corporations and agencies 20 387 1 881 –1 22 267US Agency securitised products 3 866 144 –3 4 007States of the United States and political subdivisions of the states 245 24 –6 263United Kingdom 15 182 1 865 –51 16 996Canada 3 078 806 –2 3 882Germany 4 791 200 –51 4 940France 3 068 45 –52 3 061Other 6 849 453 –56 –1 7 245
Total 57 466 5 418 –222 –1 62 661Corporate debt securities 21 467 2 065 –265 –13 23 254Residential mortgage-backed securities 2 119 30 –154 –110 1 885Commercial mortgage-backed securities 3 820 222 –141 –38 3 863Other asset-backed securities 2 112 64 –54 –15 2 107Fixed income securities available-for-sale 86 984 7 799 –836 –177 93 770Equity securities available-for-sale 1 907 201 –148 1 960
Swiss Reinsurance Company Consolidated 2011 Annual Report 21
Financial statements | Notes to the Group financial statements
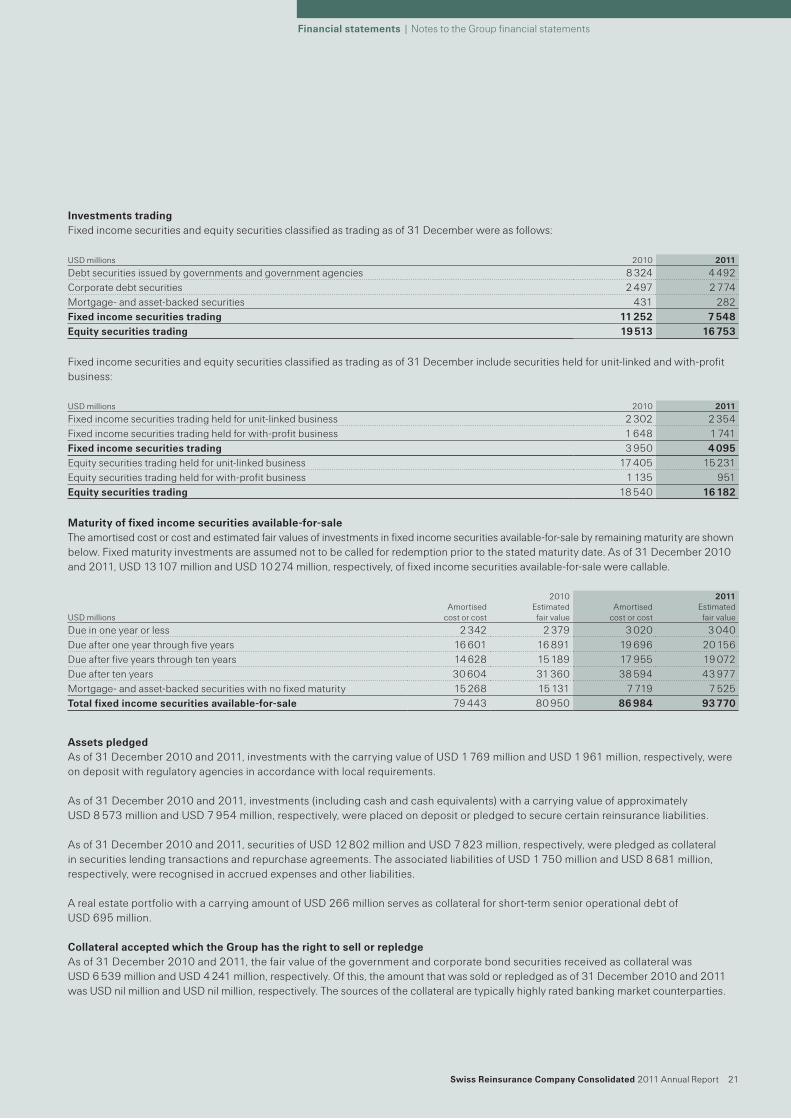
Investments tradingFixed income securities and equity securities classified as trading as of 31 December were as follows:
Fixed income securities and equity securities classified as trading as of 31 December include securities held for unit-linked and with-profit business:
Maturity of fixed income securities available-for-saleThe amortised cost or cost and estimated fair values of investments in fixed income securities available-for-sale by remaining maturity are shown below. Fixed maturity investments are assumed not to be called for redemption prior to the stated maturity date. As of 31 December 2010 and 2011, USD 13 107 million and USD 10 274 million, respectively, of fixed income securities available-for-sale were callable.
Assets pledgedAs of 31 December 2010 and 2011, investments with the carrying value of USD 1 769 million and USD 1 961 million, respectively, were on deposit with regulatory agencies in accordance with local requirements.
As of 31 December 2010 and 2011, investments (including cash and cash equivalents) with a carrying value of approximately USD 8 573 million and USD 7 954 million, respectively, were placed on deposit or pledged to secure certain reinsurance liabilities.
As of 31 December 2010 and 2011, securities of USD 12 802 million and USD 7 823 million, respectively, were pledged as collateral in securities lending transactions and repurchase agreements. The associated liabilities of USD 1 750 million and USD 8 681 million, respectively, were recognised in accrued expenses and other liabilities.
A real estate portfolio with a carrying amount of USD 266 million serves as collateral for short-term senior operational debt of USD 695 million.
Collateral accepted which the Group has the right to sell or repledgeAs of 31 December 2010 and 2011, the fair value of the government and corporate bond securities received as collateral was USD 6 539 million and USD 4 241 million, respectively. Of this, the amount that was sold or repledged as of 31 December 2010 and 2011 was USD nil million and USD nil million, respectively. The sources of the collateral are typically highly rated banking market counterparties.
USD millions 2010 2011
Debt securities issued by governments and government agencies 8 324 4 492Corporate debt securities 2 497 2 774Mortgage- and asset-backed securities 431 282Fixed income securities trading 11 252 7 548Equity securities trading 19 513 16 753
USD millions 2010 2011
Fixed income securities trading held for unit-linked business 2 302 2 354Fixed income securities trading held for with-profit business 1 648 1 741Fixed income securities trading 3 950 4 095Equity securities trading held for unit-linked business 17 405 15 231Equity securities trading held for with-profit business 1 135 951Equity securities trading 18 540 16 182
2010 2011 USD millions
Amortised cost or cost
Estimated fair value
Amortised cost or cost
Estimated fair value
Due in one year or less 2 342 2 379 3 020 3 040Due after one year through five years 16 601 16 891 19 696 20 156Due after five years through ten years 14 628 15 189 17 955 19 072Due after ten years 30 604 31 360 38 594 43 977Mortgage- and asset-backed securities with no fixed maturity 15 268 15 131 7 719 7 525Total fixed income securities available-for-sale 79 443 80 950 86 984 93 770
22 Swiss Reinsurance Company Consolidated 2011 Annual Report
Financial statements | Notes to the Group financial statements
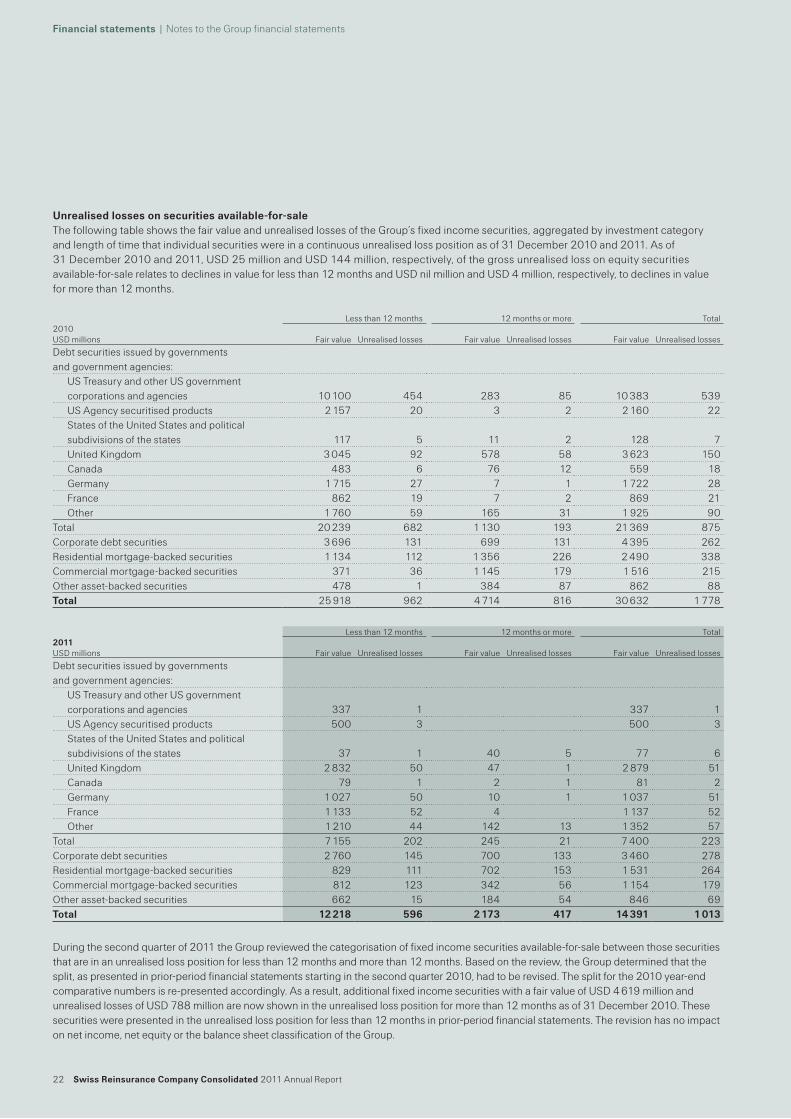
Unrealised losses on securities available-for-saleThe following table shows the fair value and unrealised losses of the Group’s fixed income securities, aggregated by investment category and length of time that individual securities were in a continuous unrealised loss position as of 31 December 2010 and 2011. As of 31 December 2010 and 2011, USD 25 million and USD 144 million, respectively, of the gross unrealised loss on equity securities available-for-sale relates to declines in value for less than 12 months and USD nil million and USD 4 million, respectively, to declines in value for more than 12 months.
Less than 12 months 12 months or more Total2010 USD millions Fair value Unrealised losses Fair value Unrealised losses Fair value Unrealised losses
Debt securities issued by governments and government agencies:
US Treasury and other US government corporations and agencies 10 100 454 283 85 10 383 539US Agency securitised products 2 157 20 3 2 2 160 22States of the United States and political subdivisions of the states 117 5 11 2 128 7United Kingdom 3 045 92 578 58 3 623 150Canada 483 6 76 12 559 18Germany 1 715 27 7 1 1 722 28France 862 19 7 2 869 21Other 1 760 59 165 31 1 925 90
Total 20 239 682 1 130 193 21 369 875Corporate debt securities 3 696 131 699 131 4 395 262Residential mortgage-backed securities 1 134 112 1 356 226 2 490 338Commercial mortgage-backed securities 371 36 1 145 179 1 516 215Other asset-backed securities 478 1 384 87 862 88Total 25 918 962 4 714 816 30 632 1 778
Less than 12 months 12 months or more Total2011USD millions Fair value Unrealised losses Fair value Unrealised losses Fair value Unrealised losses
Debt securities issued by governments and government agencies:
US Treasury and other US government corporations and agencies 337 1 337 1US Agency securitised products 500 3 500 3States of the United States and political subdivisions of the states 37 1 40 5 77 6United Kingdom 2 832 50 47 1 2 879 51Canada 79 1 2 1 81 2Germany 1 027 50 10 1 1 037 51France 1 133 52 4 1 137 52Other 1 210 44 142 13 1 352 57
Total 7 155 202 245 21 7 400 223Corporate debt securities 2 760 145 700 133 3 460 278Residential mortgage-backed securities 829 111 702 153 1 531 264Commercial mortgage-backed securities 812 123 342 56 1 154 179Other asset-backed securities 662 15 184 54 846 69Total 12 218 596 2 173 417 14 391 1 013
During the second quarter of 2011 the Group reviewed the categorisation of fixed income securities available-for-sale between those securities that are in an unrealised loss position for less than 12 months and more than 12 months. Based on the review, the Group determined that the split, as presented in prior-period financial statements starting in the second quarter 2010, had to be revised. The split for the 2010 year-end comparative numbers is re-presented accordingly. As a result, additional fixed income securities with a fair value of USD 4 619 million and unrealised losses of USD 788 million are now shown in the unrealised loss position for more than 12 months as of 31 December 2010. These securities were presented in the unrealised loss position for less than 12 months in prior-period financial statements. The revision has no impact on net income, net equity or the balance sheet classification of the Group.
Swiss Reinsurance Company Consolidated 2011 Annual Report 23
Financial statements | Notes to the Group financial statements
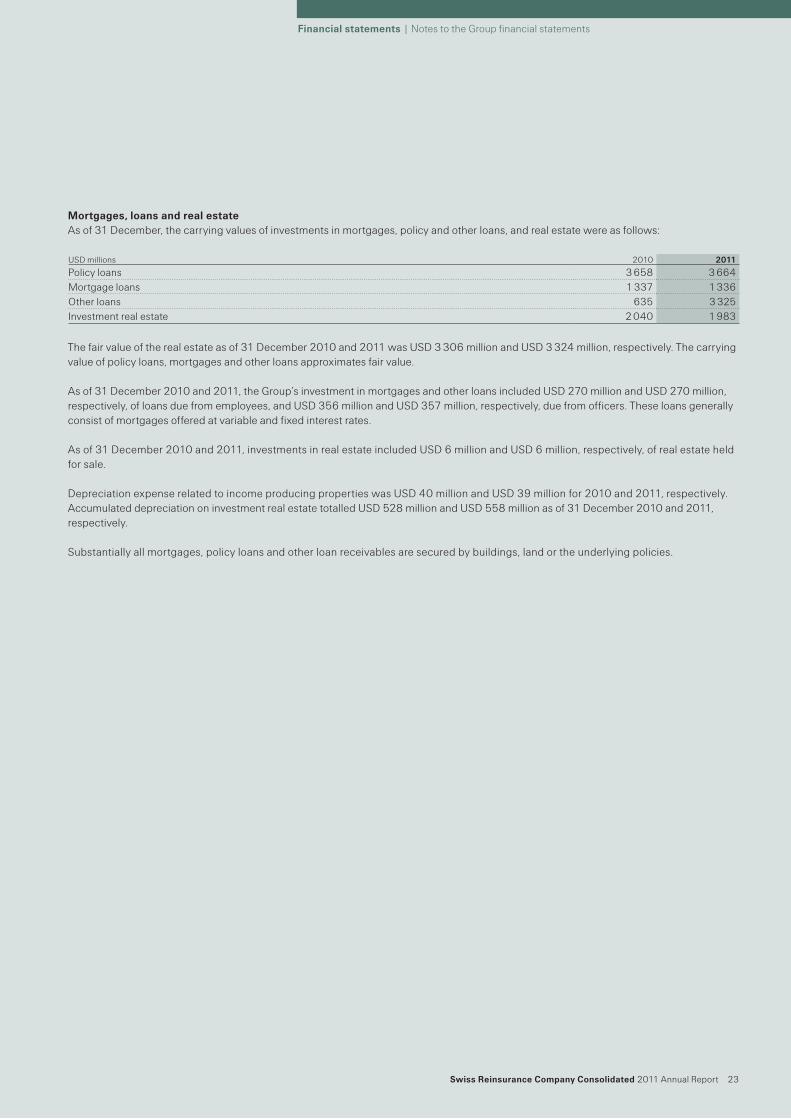
Mortgages, loans and real estateAs of 31 December, the carrying values of investments in mortgages, policy and other loans, and real estate were as follows:
The fair value of the real estate as of 31 December 2010 and 2011 was USD 3 306 million and USD 3 324 million, respectively. The carrying value of policy loans, mortgages and other loans approximates fair value.
As of 31 December 2010 and 2011, the Group’s investment in mortgages and other loans included USD 270 million and USD 270 million, respectively, of loans due from employees, and USD 356 million and USD 357 million, respectively, due from officers. These loans generally consist of mortgages offered at variable and fixed interest rates.
As of 31 December 2010 and 2011, investments in real estate included USD 6 million and USD 6 million, respectively, of real estate held for sale.
Depreciation expense related to income producing properties was USD 40 million and USD 39 million for 2010 and 2011, respectively. Accumulated depreciation on investment real estate totalled USD 528 million and USD 558 million as of 31 December 2010 and 2011, respectively.
Substantially all mortgages, policy loans and other loan receivables are secured by buildings, land or the underlying policies.
USD millions 2010 2011
Policy loans 3 658 3 664Mortgage loans 1 337 1 336Other loans 635 3 325Investment real estate 2 040 1 983

24 Swiss Reinsurance Company Consolidated 2011 Annual Report
Financial statements | Notes to the Group financial statements
This page intentionally left blank
Swiss Reinsurance Company Consolidated 2011 Annual Report 25
Financial statements | Notes to the Group financial statements
3 Fair value disclosures
Fair value, as defined by the Fair Value Measurements and Disclosures Topic, is the price that would be received to sell an asset or paid to transfer a liability in an orderly transaction between market participants at the measurement date.
The Fair Value Measurements and Disclosures Topic requires all assets and liabilities that are measured at fair value to be categorised within the fair value hierarchy. This three-level hierarchy is based on the observability of the inputs used in the fair value measurement. The levels of the fair value hierarchy are defined as follows:
Level 1 inputs are quoted prices in active markets for identical assets or liabilities that the Group has the ability to access. Level 1 inputs are the most persuasive evidence of fair value and are to be used whenever possible.
Level 2 inputs are market-based inputs that are directly or indirectly observable but not considered level 1 quoted prices. Level 2 inputs consist of (i) quoted prices for similar assets or liabilities in active markets; (ii) quoted prices for identical assets or liabilities in non-active markets (eg markets which have few transactions and where prices are not current or price quotations vary substantially); (iii) inputs other than quoted prices that are observable (eg interest rates, yield curves, volatilities, prepayment speeds, credit risks and default rates); and (iv) inputs derived from, or corroborated by, observable market data.
Level 3 inputs are unobservable inputs. These inputs reflect the Group’s own assumptions about market pricing using the best internal and external information available.
The types of instruments valued, based on quoted market prices in active markets, include most US government and sovereign obligations, active listed equities and most money market securities. Such instruments are generally classified within level 1 of the fair value hierarchy. The Group does not adjust the quoted price for such instruments, even in situations where it holds a large position and a sale could reasonably impact the quoted price.
The types of instruments that trade in markets that are not considered to be active, but are valued based on quoted market prices, broker or dealer quotations, or alternative pricing sources with reasonable levels of price transparency include most government agency securities, investment-grade corporate bonds, certain mortgage- and asset-backed products, less liquid listed equities, and state, municipal and provincial obligations. Such instruments are generally classified within level 2 of the fair value hierarchy.
Exchange-traded derivative instruments typically fall within level 1 or level 2 of the fair value hierarchy depending on whether they are considered to be actively traded or not.
Certain financial instruments are classified within level 3 of the fair value hierarchy, because they trade infrequently and therefore have little or no price transparency. Such instruments include private equity, less liquid corporate debt securities and certain asset-backed securities. Certain over-the-counter derivatives trade in less liquid markets with limited pricing information, and the determination of fair value for these derivatives is inherently more difficult. Such instruments are classified within level 3 of the fair value hierarchy. Pursuant to the election of the fair value option, the Group classifies certain Life & Health policy reserves to level 3 of the fair value hierarchy. When appropriate, valuations are adjusted for various factors such as liquidity, bid/offer spreads, and credit considerations. Such adjustments are generally based on available market evidence. In the absence of such evidence, management’s best estimate is used.
The fair values of assets are adjusted to incorporate the counterparty risk of non-performance. Similarly, the fair values of liabilities reflect the risk of non-performance of the Group, captured by the Group’s credit spread. These valuation adjustments from assets and liabilities measured at fair value using significant unobservable inputs are recognised in net realised gains and losses. For the year ended 31 December 2011, these adjustments were non-material. Whenever the underlying assets or liabilities are reported in a specific business segment, the valuation adjustment is allocated accordingly. Valuation adjustments not attributable to any business segment are reported in Group items.
In certain situations, the Group uses inputs to measure the fair value of asset or liability positions that fall into different levels of the fair value hierarchy. In these situations, the Group will determine the level in which the fair value falls based upon the lowest level input that is significant to the determination of the fair value.
26 Swiss Reinsurance Company Consolidated 2011 Annual Report
Financial statements | Notes to the Group financial statements
Valuation techniquesUS government securities typically have quoted market prices in active markets and are categorised as level 1 instruments in the fair value hierarchy. Non-US government holdings are generally classified as level 2 instruments and are valued on the basis of the quotes provided by pricing services, which are subject to the Group’s pricing validation reviews and pricing vendor challenge process. Valuations provided by pricing vendors are generally based on the actual trade information as substantially all of the Group’s non-US government holdings are traded in a transparent and liquid market.
Corporate debt securities mainly include US and European investment-grade positions, which are priced on the basis of quotes provided by third-party pricing vendors and first utilise valuation inputs from actively traded securities, such as bid prices, bid spreads to Treasury securities, Treasury curves, and same or comparable issuer curves and spreads. Issuer spreads are determined from actual quotes and traded prices and incorporate considerations of credit/default, sector composition, and liquidity and call features. Where market data is not available, valuations are developed based on the modelling techniques that utilise observable inputs and option-adjusted spreads and incorporate considerations of the security’s seniority, maturity and the issuer’s corporate structure.
Values of residential mortgage-backed securities (RMBS), commercial mortgage-backed securities (CMBS) and other asset-backed securities (Other ABS) are obtained both from third-party pricing vendors and through quoted prices, some of which may be based on the prices of comparable securities with similar structural and collateral features. Values of certain ABS for which there are no significant observable inputs are developed using benchmarks to similar transactions or indices. For both RMBS and CMBS, cash flows are derived based on the transaction-specific information which incorporates priority in the capital structure and are generally adjusted to reflect benchmark yields, market prepayment data, collateral performance (default rates and loss severity) for specific vintage and geography, credit enhancements, and ratings. For certain RMBS and CMBS with low levels of market liquidity, judgments may be required to determine comparable securities based on the loan type and deal-specific performance. CMBS terms may also incorporate lock-out periods that restrict borrowers from prepaying the loans or provide disincentives to prepay and therefore reduce prepayment risk of these securities, as compared to RMBS. The factors specifically considered in valuation of CMBS include borrower-specific statistics in a specific region, such as debt service coverage and loan-to-value ratios, as well as the type of commercial property.
The category Other ABS primarily includes debt securitised by credit card, student loan and auto loan receivables. Pricing inputs for these securities also focus on capturing, where relevant, collateral quality and performance, payment patterns, and delinquencies.
The Group uses third-party pricing vendor data to value agency securitised products, which mainly include collateralised mortgage obligations (CMO) and MBS government agency securities. The valuations generally utilise observable inputs consistent with those noted above for RMBS and CMBS.
Equity securities held by the Group for proprietary investment purposes are mainly classified in levels 1 and 2. Securities classified in level 1 are traded on public stock exchanges for which quoted prices are readily available. Level 2 equities include equity investments fair valued pursuant to the fair value option election and certain hedge fund positions; all valued based on primarily observable inputs.
The category Other assets mainly includes the Group’s private equity and hedge fund investments, which are made directly or via ownership of funds. Substantially all these investments are classified as level 3 due to the lack of observable prices and significant judgment required in valuation. Valuation of direct private equity investments requires significant management judgment due to the absence of quoted market prices and the lack of liquidity. Initial valuation is based on the acquisition cost, and is further refined based on the available market information for the public companies that are considered comparable to the Group’s holdings in the private companies being valued, and the private company-specific performance indicators, both historic and projected. Subsequent valuations also reflect business or asset appraisals, as well as market transaction data for private and public benchmark companies and the actual companies being valued, such as financing rounds and mergers and acquisitions activity. The Group’s holdings in the private equity and hedge funds are generally valued utilising net asset values (NAV), subject to adjustments, as deemed necessary, for restrictions on redemption (lock-up periods and amount limitations on redemptions).
Swiss Reinsurance Company Consolidated 2011 Annual Report 27
Financial statements | Notes to the Group financial statements
The Group holds both exchange-traded and over-the-counter (OTC) interest rate, foreign exchange, credit and equity derivative contracts for hedging and trading purposes. The fair values of exchange-traded derivatives measured using observable exchange prices are classified in level 1. Long-dated contracts may require adjustments to the exchange-traded prices which would trigger reclassification to level 2 in the fair value hierarchy. OTC derivatives are generally valued by the Group based on the internal models, which are consistent with industry standards and practices, and use both observable (dealer, broker or market consensus prices, spot and forward rates, interest rate and credit curves and volatility indices) and unobservable inputs (adjustments for liquidity, inputs derived from the observable data based on the Group’s judgments and assumptions).
The Group’s OTC interest rate derivatives primarily include interest rate swaps, futures, options, caps and floors, and are valued based on the cash flow discounting models which generally utilise as inputs observable market yield curves and volatility assumptions.
The Group’s OTC foreign exchange derivatives primarily include forward, spot and option contracts and are generally valued based on the cash flow discounting models utilising as main inputs observable foreign exchange forward curves.
The Group’s investments in equity derivatives primarily include OTC equity option contracts on single or baskets of market indices and equity options on individual or baskets of equity securities, which are valued using internally developed models (such as the Black-Scholes option pricing model, various simulation models) calibrated with the inputs, which include underlying spot prices, dividend curves, volatility surfaces, yield curves, and correlations between underlying assets.
The Group’s OTC credit derivatives include index and single name credit default swaps, as well as more complex structured credit derivatives. Plain vanilla credit derivatives, such as index and single-name credit default swaps, are valued by the Group based on the models consistent with the industry valuation standards for these credit contracts, and primarily utilising observable inputs published by market data sources, such as credit spreads and recovery rates. These valuation techniques warrant classification of plain vanilla OTC derivatives as level 2 financial instruments in the fair value hierarchy.
The Group also holds complex structured credit contracts, such as collateralised debt securities (CDS) referencing MBS, certain types of collateralised debt obligation (CDO) transactions, and the products sensitive to correlation between two or more underlying parameters (CDO-squared), all of which are classified within level 3 of the fair value hierarchy. A CDO is a debt instrument collateralised by various debt obligations, including bonds, loans and CDS of differing credit profiles. In a CDO-squared transaction, both the primary instrument and the underlying instruments are represented by CDOs. Generally, for CDO and CDO-squared transactions, the observable inputs such as CDS spreads and recovery rates are modified to adjust for correlation between the underlying debt instruments. The correlation levels are modelled at the portfolio level and calibrated at a transaction level to liquid benchmark rates.
28 Swiss Reinsurance Company Consolidated 2011 Annual Report
Financial statements | Notes to the Group financial statements
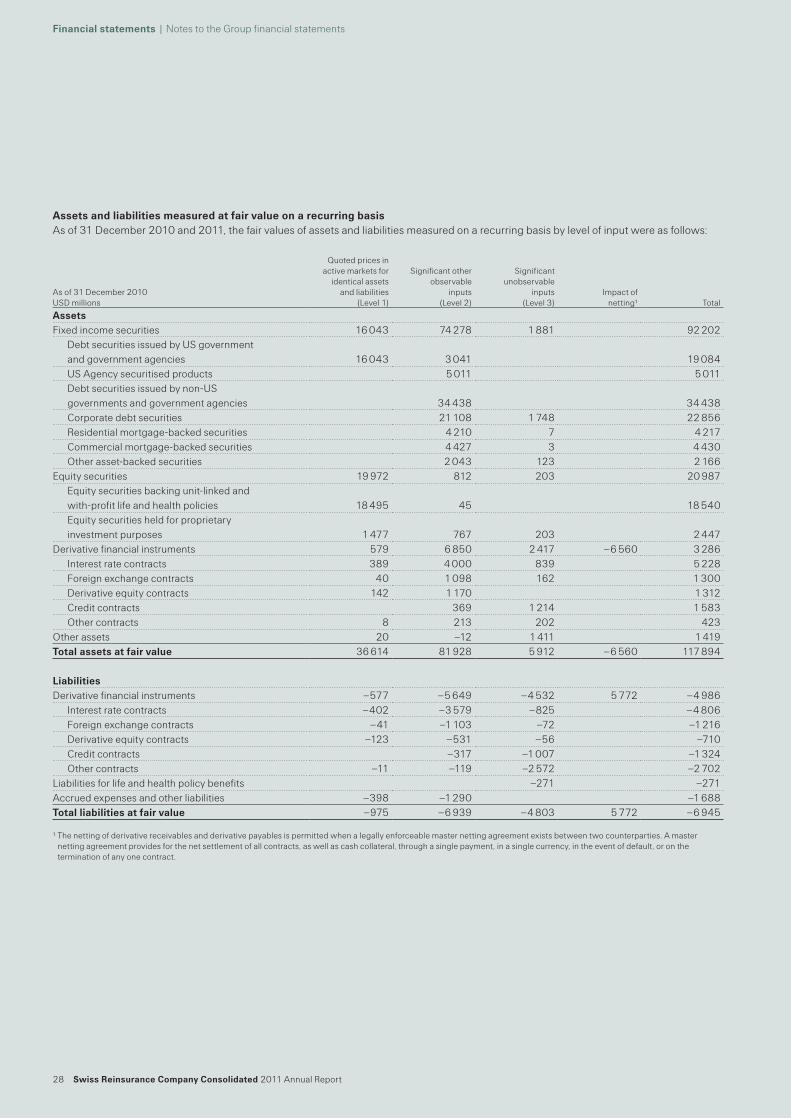
Assets and liabilities measured at fair value on a recurring basisAs of 31 December 2010 and 2011, the fair values of assets and liabilities measured on a recurring basis by level of input were as follows:
As of 31 December 2010 USD millions
Quoted prices in active markets for
identical assets and liabilities
(Level 1)
Significant other observable
inputs (Level 2)
Significant unobservable
inputs (Level 3)
Impact of netting1 Total
AssetsFixed income securities 16 043 74 278 1 881 92 202
Debt securities issued by US government and government agencies 16 043 3 041 19 084US Agency securitised products 5 011 5 011Debt securities issued by non-US governments and government agencies 34 438 34 438Corporate debt securities 21 108 1 748 22 856Residential mortgage-backed securities 4 210 7 4 217Commercial mortgage-backed securities 4 427 3 4 430Other asset-backed securities 2 043 123 2 166
Equity securities 19 972 812 203 20 987Equity securities backing unit-linked and with-profit life and health policies 18 495 45 18 540Equity securities held for proprietary investment purposes 1 477 767 203 2 447
Derivative financial instruments 579 6 850 2 417 –6 560 3 286Interest rate contracts 389 4 000 839 5 228Foreign exchange contracts 40 1 098 162 1 300Derivative equity contracts 142 1 170 1 312Credit contracts 369 1 214 1 583Other contracts 8 213 202 423
Other assets 20 –12 1 411 1 419Total assets at fair value 36 614 81 928 5 912 –6 560 117 894
LiabilitiesDerivative financial instruments –577 –5 649 –4 532 5 772 –4 986
Interest rate contracts –402 –3 579 –825 –4 806Foreign exchange contracts –41 –1 103 –72 –1 216Derivative equity contracts –123 –531 –56 –710Credit contracts –317 –1 007 –1 324Other contracts –11 –119 –2 572 –2 702
Liabilities for life and health policy benefits –271 –271Accrued expenses and other liabilities –398 –1 290 –1 688Total liabilities at fair value –975 –6 939 –4 803 5 772 –6 945
1 The netting of derivative receivables and derivative payables is permitted when a legally enforceable master netting agreement exists between two counterparties. A master netting agreement provides for the net settlement of all contracts, as well as cash collateral, through a single payment, in a single currency, in the event of default, or on the termination of any one contract.
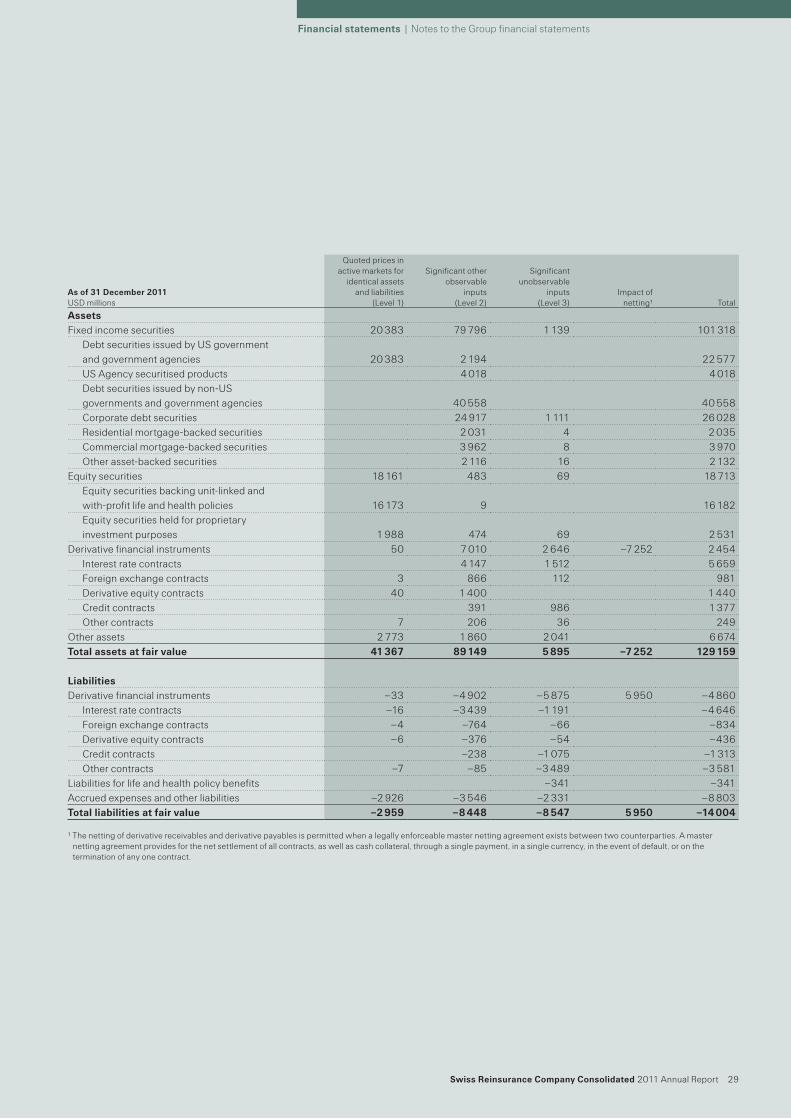
Swiss Reinsurance Company Consolidated 2011 Annual Report 29
Financial statements | Notes to the Group financial statements
As of 31 December 2011 USD millions
Quoted prices in active markets for
identical assets and liabilities
(Level 1)
Significant other observable
inputs (Level 2)
Significant unobservable
inputs (Level 3)
Impact of netting1 Total
AssetsFixed income securities 20 383 79 796 1 139 101 318
Debt securities issued by US government and government agencies 20 383 2 194 22 577US Agency securitised products 4 018 4 018Debt securities issued by non-US governments and government agencies 40 558 40 558Corporate debt securities 24 917 1 111 26 028Residential mortgage-backed securities 2 031 4 2 035Commercial mortgage-backed securities 3 962 8 3 970Other asset-backed securities 2 116 16 2 132
Equity securities 18 161 483 69 18 713Equity securities backing unit-linked and with-profit life and health policies 16 173 9 16 182Equity securities held for proprietary investment purposes 1 988 474 69 2 531
Derivative financial instruments 50 7 010 2 646 –7 252 2 454Interest rate contracts 4 147 1 512 5 659Foreign exchange contracts 3 866 112 981Derivative equity contracts 40 1 400 1 440Credit contracts 391 986 1 377Other contracts 7 206 36 249
Other assets 2 773 1 860 2 041 6 674Total assets at fair value 41 367 89 149 5 895 –7 252 129 159
LiabilitiesDerivative financial instruments –33 –4 902 –5 875 5 950 –4 860
Interest rate contracts –16 –3 439 –1 191 –4 646Foreign exchange contracts –4 –764 –66 –834Derivative equity contracts –6 –376 –54 –436Credit contracts –238 –1 075 –1 313Other contracts –7 –85 –3 489 –3 581
Liabilities for life and health policy benefits –341 –341Accrued expenses and other liabilities –2 926 –3 546 –2 331 –8 803Total liabilities at fair value –2 959 –8 448 –8 547 5 950 –14 004
1 The netting of derivative receivables and derivative payables is permitted when a legally enforceable master netting agreement exists between two counterparties. A master netting agreement provides for the net settlement of all contracts, as well as cash collateral, through a single payment, in a single currency, in the event of default, or on the termination of any one contract.
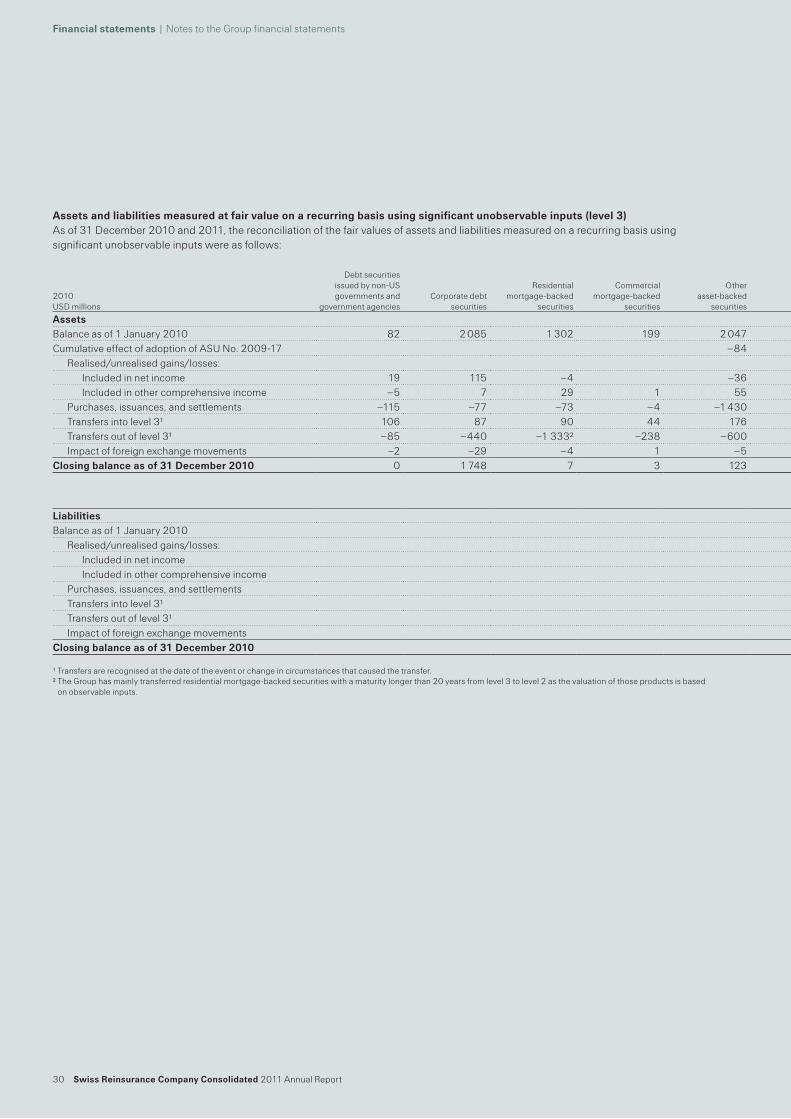
30 Swiss Reinsurance Company Consolidated 2011 Annual Report
Financial statements | Notes to the Group financial statements
2010 USD millions
Debt securities issued by non-US governments and
government agenciesCorporate debt
securities
Residential mortgage-backed
securities
Commercial mortgage-backed
securities
Other asset-backed
securities
Equity securities held for proprietary
investment purposesDerivative interest
rate contractsDerivative foreign
exchange contractsDerivative equity
contractsDerivative credit
contractsOther derivative
contracts Other assets Total
AssetsBalance as of 1 January 2010 82 2 085 1 302 199 2 047 170 1 162 3 57 2 316 283 1 321 11 027Cumulative effect of adoption of ASU No. 2009-17 –84 –84
Realised/unrealised gains/losses:Included in net income 19 115 –4 –36 –27 –58 54 21 –788 –45 –35 –784Included in other comprehensive income –5 7 29 1 55 –2 129 214
Purchases, issuances, and settlements –115 –77 –73 –4 –1 430 65 –206 48 –88 –314 19 64 –2 111Transfers into level 31 106 87 90 44 176 91 56 10 2 31 693Transfers out of level 31 –85 –440 –1 3332 –238 –600 –148 –48 –97 –2 989Impact of foreign exchange movements –2 –29 –4 1 –5 –3 –2 1 –9 –2 –54
Closing balance as of 31 December 2010 0 1 748 7 3 123 203 839 162 0 1 214 202 1 411 5 912
Liabilities for life and health policy benefits
Derivative interest rate contracts
Derivative foreign exchange contracts
Derivative equity contracts
Derivative credit contracts
Other derivative contracts Total
LiabilitiesBalance as of 1 January 2010 –293 –948 –41 –54 –1 738 –2 257 –5 331
Realised/unrealised gains/losses:Included in net income 22 123 –31 –2 731 –95 748Included in other comprehensive income
Purchases, issuances, and settlements –220 –220Transfers into level 31Transfers out of level 31Impact of foreign exchange movements
Closing balance as of 31 December 2010 –271 –825 –72 –56 –1 007 –2 572 –4 803
1 Transfers are recognised at the date of the event or change in circumstances that caused the transfer.2 The Group has mainly transferred residential mortgage-backed securities with a maturity longer than 20 years from level 3 to level 2 as the valuation of those products is based
on observable inputs.
Assets and liabilities measured at fair value on a recurring basis using significant unobservable inputs (level 3)As of 31 December 2010 and 2011, the reconciliation of the fair values of assets and liabilities measured on a recurring basis using significant unobservable inputs were as follows:
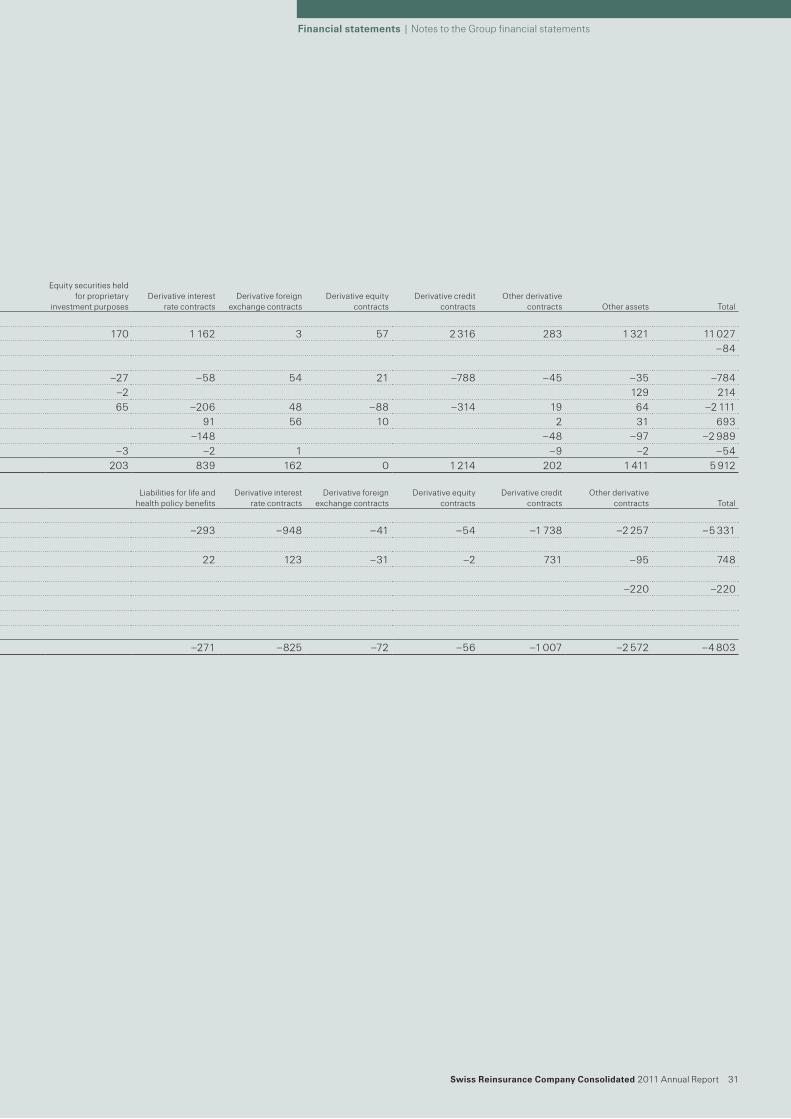
Swiss Reinsurance Company Consolidated 2011 Annual Report 31
Financial statements | Notes to the Group financial statements
2010 USD millions
Debt securities issued by non-US governments and
government agenciesCorporate debt
securities
Residential mortgage-backed
securities
Commercial mortgage-backed
securities
Other asset-backed
securities
Equity securities held for proprietary
investment purposesDerivative interest
rate contractsDerivative foreign
exchange contractsDerivative equity
contractsDerivative credit
contractsOther derivative
contracts Other assets Total
AssetsBalance as of 1 January 2010 82 2 085 1 302 199 2 047 170 1 162 3 57 2 316 283 1 321 11 027Cumulative effect of adoption of ASU No. 2009-17 –84 –84
Realised/unrealised gains/losses:Included in net income 19 115 –4 –36 –27 –58 54 21 –788 –45 –35 –784Included in other comprehensive income –5 7 29 1 55 –2 129 214
Purchases, issuances, and settlements –115 –77 –73 –4 –1 430 65 –206 48 –88 –314 19 64 –2 111Transfers into level 31 106 87 90 44 176 91 56 10 2 31 693Transfers out of level 31 –85 –440 –1 3332 –238 –600 –148 –48 –97 –2 989Impact of foreign exchange movements –2 –29 –4 1 –5 –3 –2 1 –9 –2 –54
Closing balance as of 31 December 2010 0 1 748 7 3 123 203 839 162 0 1 214 202 1 411 5 912
Liabilities for life and health policy benefits
Derivative interest rate contracts
Derivative foreign exchange contracts
Derivative equity contracts
Derivative credit contracts
Other derivative contracts Total
LiabilitiesBalance as of 1 January 2010 –293 –948 –41 –54 –1 738 –2 257 –5 331
Realised/unrealised gains/losses:Included in net income 22 123 –31 –2 731 –95 748Included in other comprehensive income
Purchases, issuances, and settlements –220 –220Transfers into level 31Transfers out of level 31Impact of foreign exchange movements
Closing balance as of 31 December 2010 –271 –825 –72 –56 –1 007 –2 572 –4 803
1 Transfers are recognised at the date of the event or change in circumstances that caused the transfer.2 The Group has mainly transferred residential mortgage-backed securities with a maturity longer than 20 years from level 3 to level 2 as the valuation of those products is based
on observable inputs.
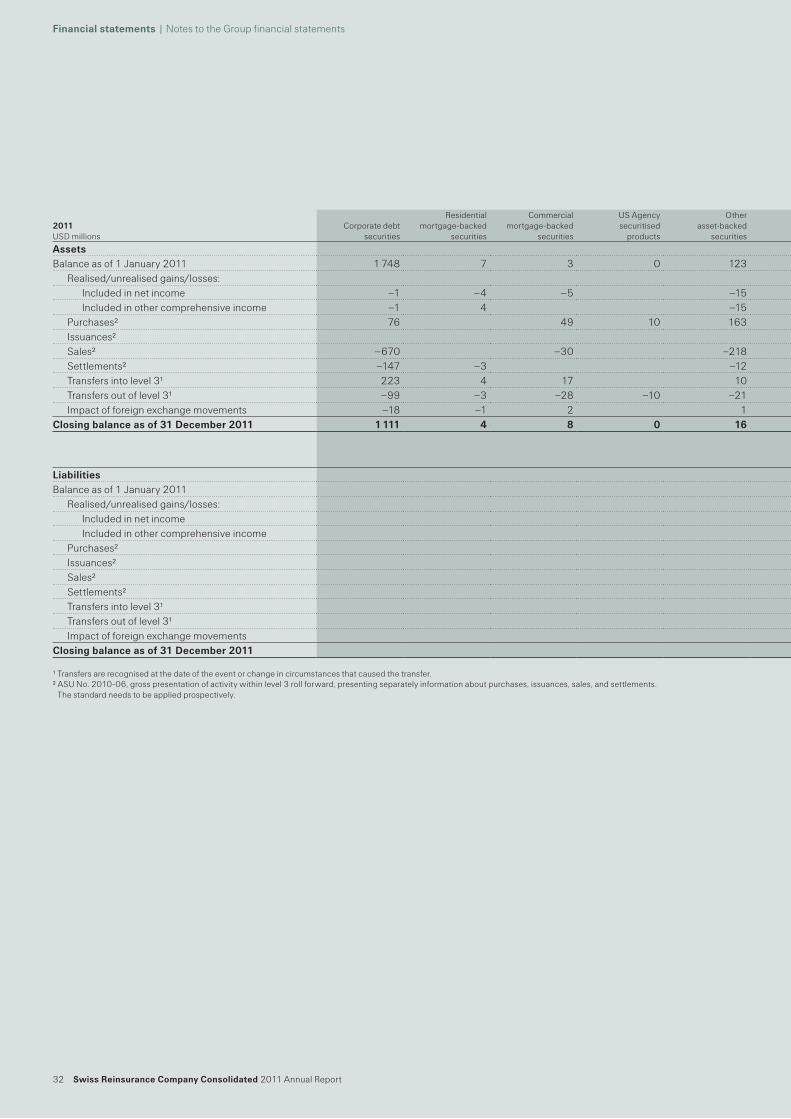
32 Swiss Reinsurance Company Consolidated 2011 Annual Report
Financial statements | Notes to the Group financial statements
2011USD millions
Corporate debt securities
Residential mortgage-backed
securities
Commercial mortgage-backed
securities
US Agency securitised
products
Other asset-backed
securities
Equity securities held for proprietary
investment purposesDerivative interest
rate contractsDerivative foreign
exchange contractsDerivative equity
contractsDerivative credit
contractsOther derivative
contracts Other assets Total
AssetsBalance as of 1 January 2011 1 748 7 3 0 123 203 839 162 0 1 214 202 1 411 5 912
Realised/unrealised gains/losses:Included in net income –1 –4 –5 –15 38 851 –63 1 –77 –48 39 716Included in other comprehensive income –1 4 –15 4 20 12
Purchases2 76 49 10 163 21 206 95 11 163 1 136 1 930Issuances2Sales2 –670 –30 –218 –196 –397 –85 –1 –239 –134 –501 –2 471Settlements2 –147 –3 –12 13 –23 20 –1 –153Transfers into level 31 223 4 17 10 1 9 264Transfers out of level 31 –99 –3 –28 –10 –21 –11 –52 –70 –294Impact of foreign exchange movements –18 –1 2 1 –2 3 –4 –2 –21
Closing balance as of 31 December 2011 1 111 4 8 0 16 69 1 512 112 0 986 36 2 041 5 895
Liabilities for life and health policy benefits
Derivative interest rate contracts
Derivative foreign exchange contracts
Derivative equity contracts
Derivative credit contracts
Other derivative contracts
Accrued expenses and other liabilities Total
LiabilitiesBalance as of 1 January 2011 –271 –825 –72 –56 –1 007 –2 572 –2 349 –7 152
Realised/unrealised gains/losses:Included in net income –69 –413 13 2 –158 –771 –1 396Included in other comprehensive income
Purchases2Issuances2 –7 –7Sales2 46 90 8 144Settlements2 1 1 –154 –152Transfers into level 31Transfers out of level 31Impact of foreign exchange movements –1 –1 18 16
Closing balance as of 31 December 2011 –341 –1 191 –66 –54 –1 075 –3 489 –2 331 –8 547
1 Transfers are recognised at the date of the event or change in circumstances that caused the transfer.2 ASU No. 2010-06, gross presentation of activity within level 3 roll forward, presenting separately information about purchases, issuances, sales, and settlements.
The standard needs to be applied prospectively.
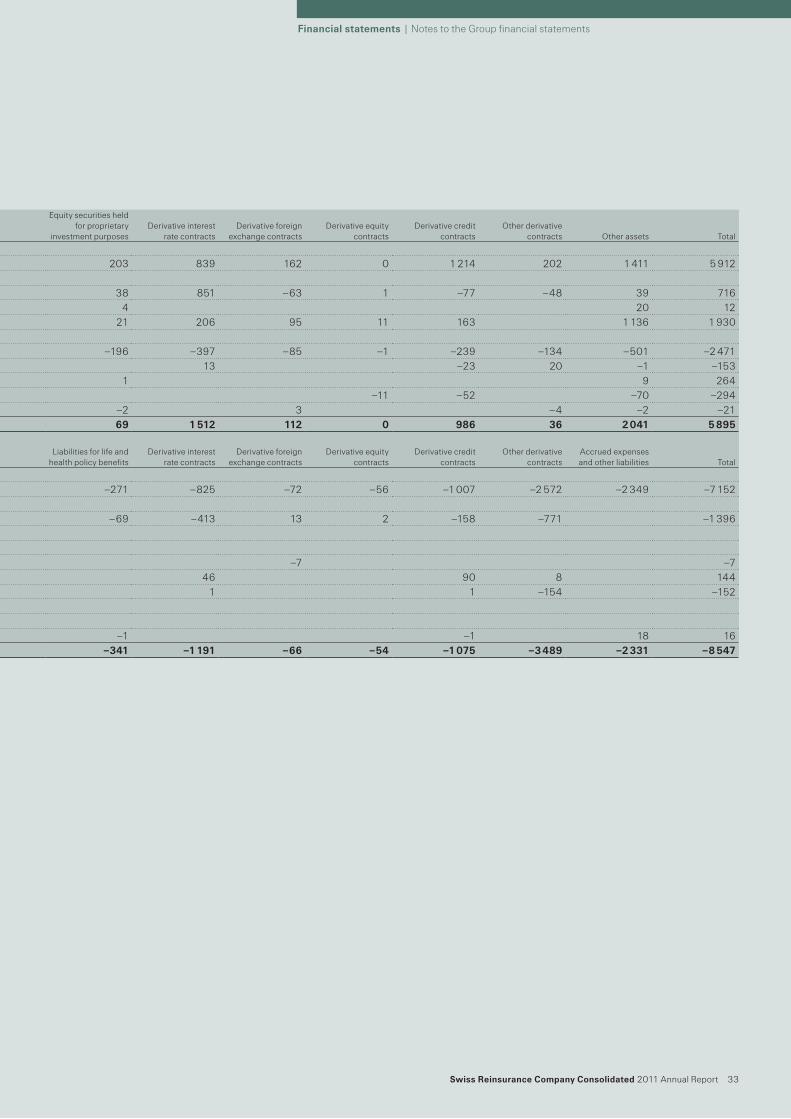
Swiss Reinsurance Company Consolidated 2011 Annual Report 33
Financial statements | Notes to the Group financial statements
2011USD millions
Corporate debt securities
Residential mortgage-backed
securities
Commercial mortgage-backed
securities
US Agency securitised
products
Other asset-backed
securities
Equity securities held for proprietary
investment purposesDerivative interest
rate contractsDerivative foreign
exchange contractsDerivative equity
contractsDerivative credit
contractsOther derivative
contracts Other assets Total
AssetsBalance as of 1 January 2011 1 748 7 3 0 123 203 839 162 0 1 214 202 1 411 5 912
Realised/unrealised gains/losses:Included in net income –1 –4 –5 –15 38 851 –63 1 –77 –48 39 716Included in other comprehensive income –1 4 –15 4 20 12
Purchases2 76 49 10 163 21 206 95 11 163 1 136 1 930Issuances2Sales2 –670 –30 –218 –196 –397 –85 –1 –239 –134 –501 –2 471Settlements2 –147 –3 –12 13 –23 20 –1 –153Transfers into level 31 223 4 17 10 1 9 264Transfers out of level 31 –99 –3 –28 –10 –21 –11 –52 –70 –294Impact of foreign exchange movements –18 –1 2 1 –2 3 –4 –2 –21
Closing balance as of 31 December 2011 1 111 4 8 0 16 69 1 512 112 0 986 36 2 041 5 895
Liabilities for life and health policy benefits
Derivative interest rate contracts
Derivative foreign exchange contracts
Derivative equity contracts
Derivative credit contracts
Other derivative contracts
Accrued expenses and other liabilities Total
LiabilitiesBalance as of 1 January 2011 –271 –825 –72 –56 –1 007 –2 572 –2 349 –7 152
Realised/unrealised gains/losses:Included in net income –69 –413 13 2 –158 –771 –1 396Included in other comprehensive income
Purchases2Issuances2 –7 –7Sales2 46 90 8 144Settlements2 1 1 –154 –152Transfers into level 31Transfers out of level 31Impact of foreign exchange movements –1 –1 18 16
Closing balance as of 31 December 2011 –341 –1 191 –66 –54 –1 075 –3 489 –2 331 –8 547
1 Transfers are recognised at the date of the event or change in circumstances that caused the transfer.2 ASU No. 2010-06, gross presentation of activity within level 3 roll forward, presenting separately information about purchases, issuances, sales, and settlements.
The standard needs to be applied prospectively.
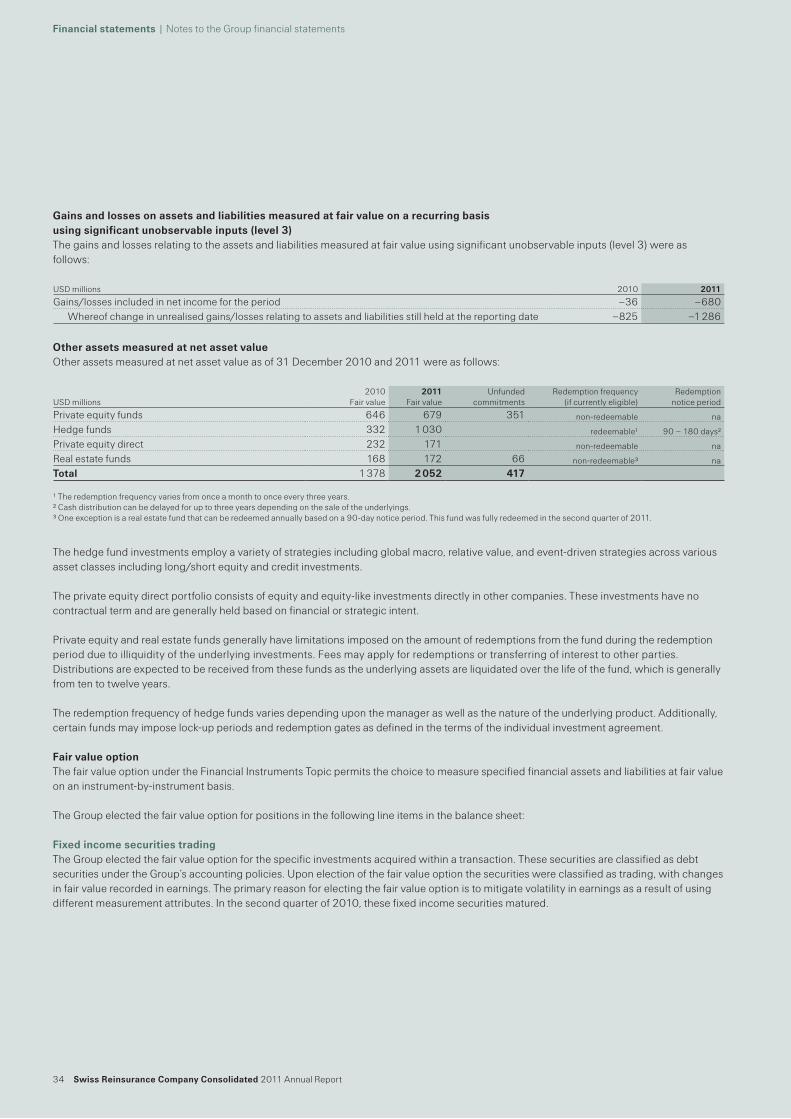
34 Swiss Reinsurance Company Consolidated 2011 Annual Report
Financial statements | Notes to the Group financial statements
Gains and losses on assets and liabilities measured at fair value on a recurring basis using significant unobservable inputs (level 3)The gains and losses relating to the assets and liabilities measured at fair value using significant unobservable inputs (level 3) were as follows:
Other assets measured at net asset valueOther assets measured at net asset value as of 31 December 2010 and 2011 were as follows:
The hedge fund investments employ a variety of strategies including global macro, relative value, and event-driven strategies across various asset classes including long/short equity and credit investments.
The private equity direct portfolio consists of equity and equity-like investments directly in other companies. These investments have no contractual term and are generally held based on financial or strategic intent.
Private equity and real estate funds generally have limitations imposed on the amount of redemptions from the fund during the redemption period due to illiquidity of the underlying investments. Fees may apply for redemptions or transferring of interest to other parties. Distributions are expected to be received from these funds as the underlying assets are liquidated over the life of the fund, which is generally from ten to twelve years.
The redemption frequency of hedge funds varies depending upon the manager as well as the nature of the underlying product. Additionally, certain funds may impose lock-up periods and redemption gates as defined in the terms of the individual investment agreement.
Fair value optionThe fair value option under the Financial Instruments Topic permits the choice to measure specified financial assets and liabilities at fair value on an instrument-by-instrument basis.
The Group elected the fair value option for positions in the following line items in the balance sheet:
Fixed income securities tradingThe Group elected the fair value option for the specific investments acquired within a transaction. These securities are classified as debt securities under the Group’s accounting policies. Upon election of the fair value option the securities were classified as trading, with changes in fair value recorded in earnings. The primary reason for electing the fair value option is to mitigate volatility in earnings as a result of using different measurement attributes. In the second quarter of 2010, these fixed income securities matured.
USD millions 2010 2011
Gains/losses included in net income for the period –36 –680Whereof change in unrealised gains/losses relating to assets and liabilities still held at the reporting date –825 –1 286
USD millions2010
Fair value2011
Fair valueUnfunded
commitmentsRedemption frequency
(if currently eligible)Redemption
notice period
Private equity funds 646 679 351 non-redeemable na
Hedge funds 332 1 030 redeemable1 90 – 180 days2
Private equity direct 232 171 non-redeemable na
Real estate funds 168 172 66 non-redeemable3 na
Total 1 378 2 052 417
1 The redemption frequency varies from once a month to once every three years.2 Cash distribution can be delayed for up to three years depending on the sale of the underlyings.3 One exception is a real estate fund that can be redeemed annually based on a 90-day notice period. This fund was fully redeemed in the second quarter of 2011.
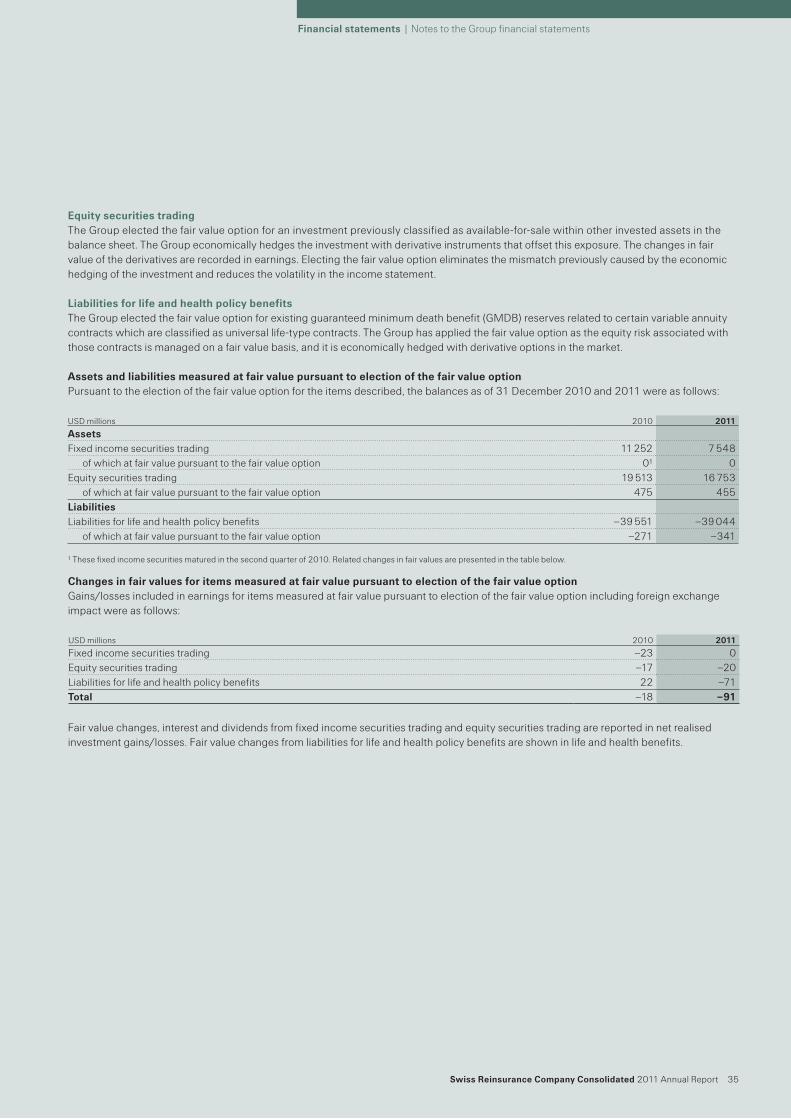
Swiss Reinsurance Company Consolidated 2011 Annual Report 35
Financial statements | Notes to the Group financial statements
Equity securities tradingThe Group elected the fair value option for an investment previously classified as available-for-sale within other invested assets in the balance sheet. The Group economically hedges the investment with derivative instruments that offset this exposure. The changes in fair value of the derivatives are recorded in earnings. Electing the fair value option eliminates the mismatch previously caused by the economic hedging of the investment and reduces the volatility in the income statement.
Liabilities for life and health policy benefitsThe Group elected the fair value option for existing guaranteed minimum death benefit (GMDB) reserves related to certain variable annuity contracts which are classified as universal life-type contracts. The Group has applied the fair value option as the equity risk associated with those contracts is managed on a fair value basis, and it is economically hedged with derivative options in the market.
Assets and liabilities measured at fair value pursuant to election of the fair value optionPursuant to the election of the fair value option for the items described, the balances as of 31 December 2010 and 2011 were as follows:
Changes in fair values for items measured at fair value pursuant to election of the fair value optionGains/losses included in earnings for items measured at fair value pursuant to election of the fair value option including foreign exchange impact were as follows:
Fair value changes, interest and dividends from fixed income securities trading and equity securities trading are reported in net realised investment gains/losses. Fair value changes from liabilities for life and health policy benefits are shown in life and health benefits.
USD millions 2010 2011
AssetsFixed income securities trading 11 252 7 548
of which at fair value pursuant to the fair value option 01 0Equity securities trading 19 513 16 753
of which at fair value pursuant to the fair value option 475 455LiabilitiesLiabilities for life and health policy benefits –39 551 –39 044
of which at fair value pursuant to the fair value option –271 –341
1 These fixed income securities matured in the second quarter of 2010. Related changes in fair values are presented in the table below.
USD millions 2010 2011
Fixed income securities trading –23 0Equity securities trading –17 –20Liabilities for life and health policy benefits 22 –71Total –18 –91
36 Swiss Reinsurance Company Consolidated 2011 Annual Report
Financial statements | Notes to the Group financial statements
4 Derivative financial instruments
The Group uses a variety of derivative financial instruments including swaps, options, forwards, credit derivatives, and exchange-traded financial futures in its trading and hedging strategies, in line with the Group’s overall risk management strategy. The objectives include managing exposure to price, foreign currency and/or interest rate risk on planned or anticipated investment purchases, existing assets or liabilities, as well as locking in attractive investment conditions for future available funds.
The fair values represent the gross carrying value amounts at the reporting date for each class of derivative contract held or issued by the Group. The gross fair values are not an indication of credit risk, as many over-the-counter transactions are contracted and documented under ISDA master agreements or their equivalent. Management believes that such agreements provide for legally enforceable setoff in the event of default, which substantially reduces credit exposure.
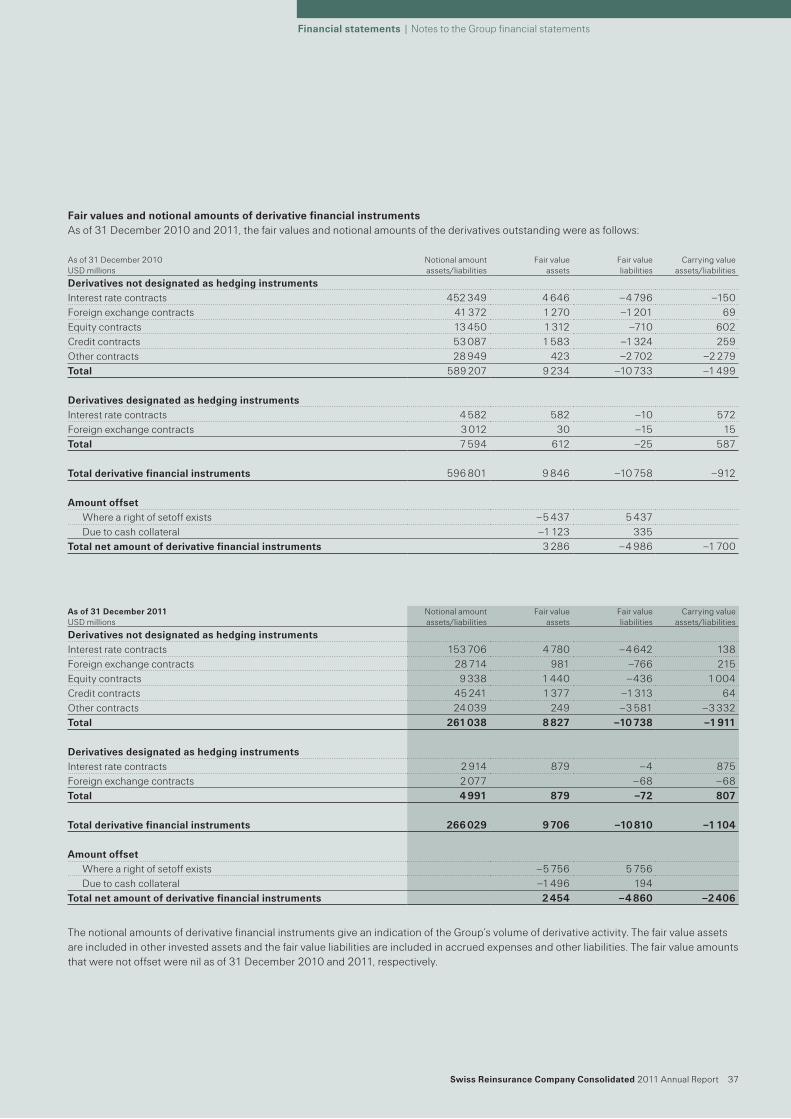
Swiss Reinsurance Company Consolidated 2011 Annual Report 37
Financial statements | Notes to the Group financial statements
Fair values and notional amounts of derivative financial instrumentsAs of 31 December 2010 and 2011, the fair values and notional amounts of the derivatives outstanding were as follows:
The notional amounts of derivative financial instruments give an indication of the Group’s volume of derivative activity. The fair value assets are included in other invested assets and the fair value liabilities are included in accrued expenses and other liabilities. The fair value amounts that were not offset were nil as of 31 December 2010 and 2011, respectively.
As of 31 December 2010 USD millions
Notional amount assets/liabilities
Fair value assets
Fair value liabilities
Carrying value assets/liabilities
Derivatives not designated as hedging instrumentsInterest rate contracts 452 349 4 646 –4 796 –150Foreign exchange contracts 41 372 1 270 –1 201 69Equity contracts 13 450 1 312 –710 602Credit contracts 53 087 1 583 –1 324 259Other contracts 28 949 423 –2 702 –2 279Total 589 207 9 234 –10 733 –1 499
Derivatives designated as hedging instrumentsInterest rate contracts 4 582 582 –10 572Foreign exchange contracts 3 012 30 –15 15Total 7 594 612 –25 587
Total derivative financial instruments 596 801 9 846 –10 758 –912
Amount offsetWhere a right of setoff exists –5 437 5 437Due to cash collateral –1 123 335
Total net amount of derivative financial instruments 3 286 –4 986 –1 700
As of 31 December 2011 USD millions
Notional amount assets/liabilities
Fair value assets
Fair value liabilities
Carrying value assets/liabilities
Derivatives not designated as hedging instrumentsInterest rate contracts 153 706 4 780 –4 642 138Foreign exchange contracts 28 714 981 –766 215Equity contracts 9 338 1 440 –436 1 004Credit contracts 45 241 1 377 –1 313 64Other contracts 24 039 249 –3 581 –3 332Total 261 038 8 827 –10 738 –1 911
Derivatives designated as hedging instrumentsInterest rate contracts 2 914 879 –4 875Foreign exchange contracts 2 077 –68 –68Total 4 991 879 –72 807
Total derivative financial instruments 266 029 9 706 –10 810 –1 104
Amount offsetWhere a right of setoff exists –5 756 5 756Due to cash collateral –1 496 194
Total net amount of derivative financial instruments 2 454 –4 860 –2 406
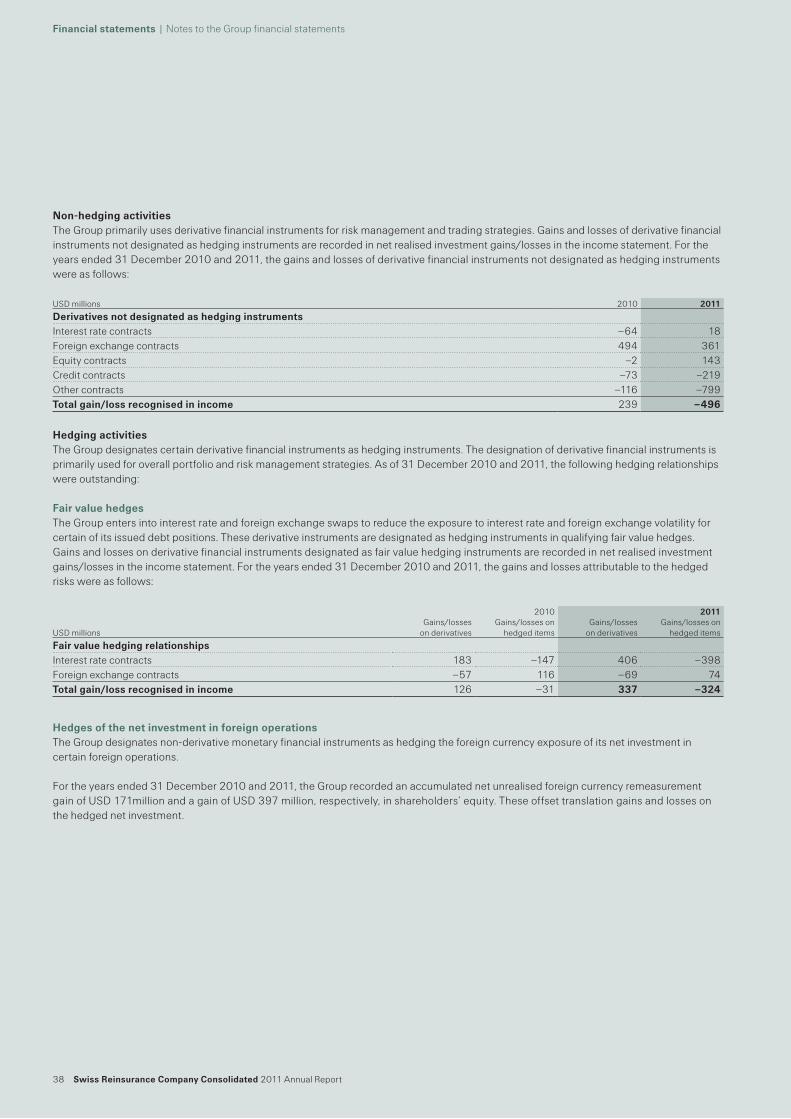
38 Swiss Reinsurance Company Consolidated 2011 Annual Report
Financial statements | Notes to the Group financial statements
Non-hedging activitiesThe Group primarily uses derivative financial instruments for risk management and trading strategies. Gains and losses of derivative financial instruments not designated as hedging instruments are recorded in net realised investment gains/losses in the income statement. For the years ended 31 December 2010 and 2011, the gains and losses of derivative financial instruments not designated as hedging instruments were as follows:
Hedging activitiesThe Group designates certain derivative financial instruments as hedging instruments. The designation of derivative financial instruments is primarily used for overall portfolio and risk management strategies. As of 31 December 2010 and 2011, the following hedging relationships were outstanding:
Fair value hedgesThe Group enters into interest rate and foreign exchange swaps to reduce the exposure to interest rate and foreign exchange volatility for certain of its issued debt positions. These derivative instruments are designated as hedging instruments in qualifying fair value hedges. Gains and losses on derivative financial instruments designated as fair value hedging instruments are recorded in net realised investment gains/losses in the income statement. For the years ended 31 December 2010 and 2011, the gains and losses attributable to the hedged risks were as follows:
Hedges of the net investment in foreign operationsThe Group designates non-derivative monetary financial instruments as hedging the foreign currency exposure of its net investment in certain foreign operations.
For the years ended 31 December 2010 and 2011, the Group recorded an accumulated net unrealised foreign currency remeasurement gain of USD 171million and a gain of USD 397 million, respectively, in shareholders’ equity. These offset translation gains and losses on the hedged net investment.
USD millions 2010 2011
Derivatives not designated as hedging instrumentsInterest rate contracts –64 18Foreign exchange contracts 494 361Equity contracts –2 143Credit contracts –73 –219Other contracts –116 –799Total gain/loss recognised in income 239 –496
2010 2011 USD millions
Gains/losses on derivatives
Gains/losses on hedged items
Gains/losses on derivatives
Gains/losses on hedged items
Fair value hedging relationshipsInterest rate contracts 183 –147 406 –398Foreign exchange contracts –57 116 –69 74Total gain/loss recognised in income 126 –31 337 –324
Swiss Reinsurance Company Consolidated 2011 Annual Report 39
Financial statements | Notes to the Group financial statements
Maximum potential lossIn consideration of the rights of setoff and the qualifying master netting arrangements with various counterparties, the maximum potential loss as of 31 December 2010 and 2011 was approximately USD 4 409 million and USD 3 950 million, respectively. The maximum potential loss is based on the positive market replacement cost, assuming non-performance of all counterparties, net of cash collateral.
Credit risk-related contingent featuresCertain derivative instruments held by the Group contain provisions that require its debt to maintain an investment-grade credit rating. If the Group’s credit rating were downgraded or no longer rated, the counterparties could request immediate payment, guarantee or an ongoing full overnight collateralisation on derivative instruments in net liability positions.
The total fair value of derivative financial instruments containing credit risk-related contingent features amounted to USD 1 975 million and USD 1 538 million as of 31 December 2010 and 2011, respectively. For derivative financial instruments containing credit risk-related contingent features, the Group posted collateral of USD 335 million and USD 194 million as of 31 December 2010 and 2011, respectively. In the event of a reduction of the Group’s credit rating to below investment grade, a fair value of USD 1 344 million additional collateral would have had to be posted as of 31 December 2011. The total equals the amount needed to settle the instruments immediately as of 31 December 2010 and 2011, respectively.
Credit derivatives written/soldThe Group writes/sells credit derivatives, including credit default swaps, credit spread options and credit index products, and total return swaps. The total return swaps, for which the Group assumes asset risk mainly of variable interest entities, qualify as guarantees under FASB ASC Topic 460. These activities are part of the Group’s overall portfolio and risk management strategies. The events that could require the Group to perform include bankruptcy, default, obligation acceleration or moratorium of the credit derivative’s underlying.
The following tables show the fair values and the maximum potential payout of the credit derivatives written/sold as of 31 December 2010 and 2011, categorised by the type of credit derivative and credit spreads, which were based on external market data. The fair values represent the gross carrying values, excluding the effects of netting under ISDA master agreements and cash collateral netting. The maximum potential payout is based on the notional values of the derivatives and represents the gross undiscounted future payments the Group would be required to make, assuming the default of all credit derivatives’ underlyings.
The fair values of the credit derivatives written/sold do not represent the Group’s effective net exposure as the ISDA master agreement and the cash collateral netting are excluded.
The Group has purchased protection to manage the performance/payment risks related to credit derivatives. As of 31 December 2010 and 2011, the total purchased credit protection based on notional values was USD 30 304 million and USD 26 367 million, respectively. Thereof USD 12 025 million and USD 8 159 million, respectively, were related to identical underlyings for which the Group sold credit protection. For tranched indexes and baskets, only matching tranches of the respective index were determined as identical. In addition to the purchased credit protection, the Group manages the performance/payment risks through a correlation hedge, which is established with non-identical offsetting positions.
The maximum potential payout is based on notional values of the credit derivatives. The Group enters into total return swaps mainly with variable interest entities which issue insurance-linked and credit-linked securities.
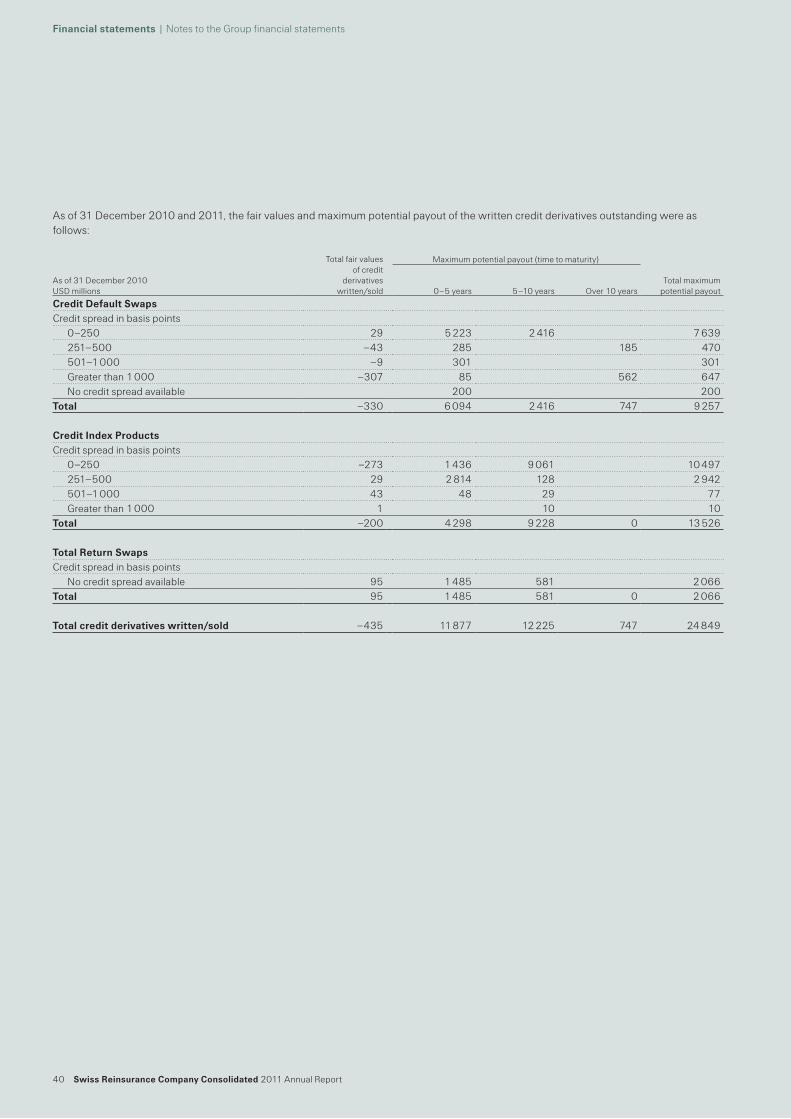
40 Swiss Reinsurance Company Consolidated 2011 Annual Report
Financial statements | Notes to the Group financial statements
As of 31 December 2010 and 2011, the fair values and maximum potential payout of the written credit derivatives outstanding were as follows:
Total fair values of credit
derivatives written/sold
Maximum potential payout (time to maturity)
Total maximum potential payout
As of 31 December 2010 USD millions 0–5 years 5–10 years Over 10 years
Credit Default SwapsCredit spread in basis points
0–250 29 5 223 2 416 7 639251–500 –43 285 185 470501–1 000 –9 301 301Greater than 1 000 –307 85 562 647No credit spread available 200 200
Total –330 6 094 2 416 747 9 257
Credit Index ProductsCredit spread in basis points
0–250 –273 1 436 9 061 10 497251–500 29 2 814 128 2 942501–1 000 43 48 29 77Greater than 1 000 1 10 10
Total –200 4 298 9 228 0 13 526
Total Return SwapsCredit spread in basis points
No credit spread available 95 1 485 581 2 066Total 95 1 485 581 0 2 066
Total credit derivatives written/sold –435 11 877 12 225 747 24 849
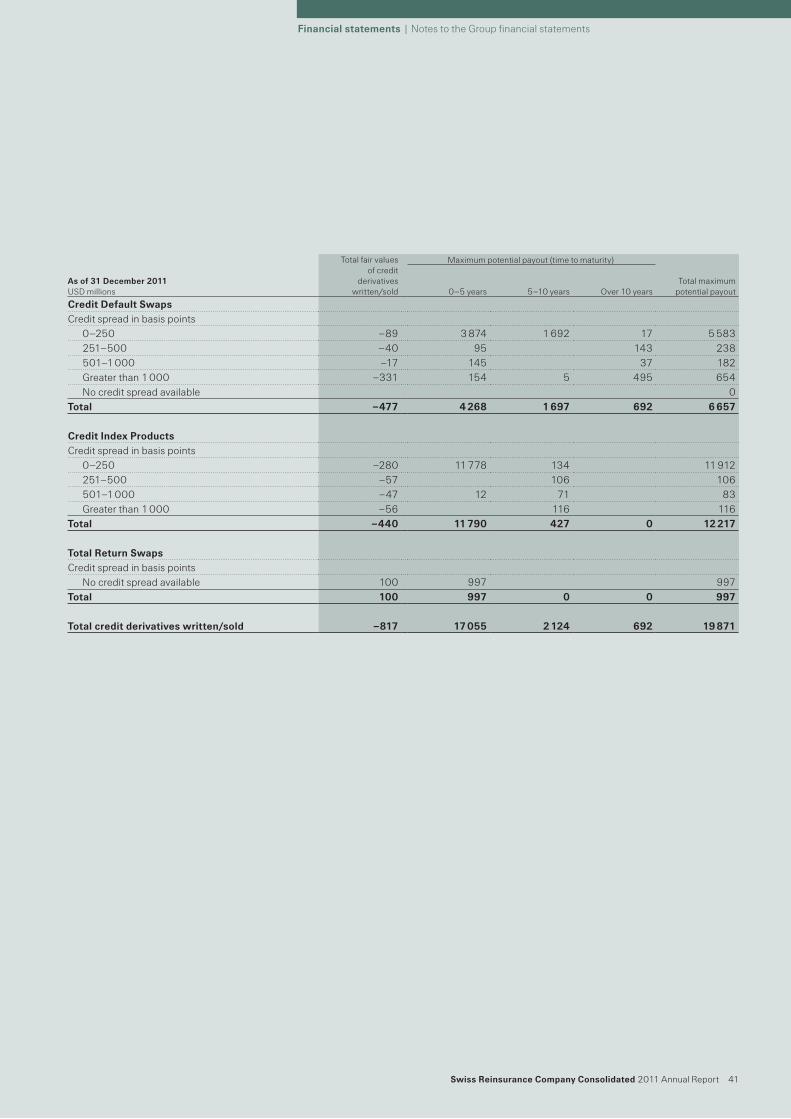
Swiss Reinsurance Company Consolidated 2011 Annual Report 41
Financial statements | Notes to the Group financial statements
Total fair values of credit
derivatives written/sold
Maximum potential payout (time to maturity)
Total maximum potential payout
As of 31 December 2011 USD millions 0–5 years 5–10 years Over 10 years
Credit Default SwapsCredit spread in basis points
0–250 –89 3 874 1 692 17 5 583251–500 –40 95 143 238501–1 000 –17 145 37 182Greater than 1 000 –331 154 5 495 654No credit spread available 0
Total –477 4 268 1 697 692 6 657
Credit Index ProductsCredit spread in basis points
0–250 –280 11 778 134 11 912251–500 –57 106 106501–1 000 –47 12 71 83Greater than 1 000 –56 116 116
Total –440 11 790 427 0 12 217
Total Return SwapsCredit spread in basis points
No credit spread available 100 997 997Total 100 997 0 0 997
Total credit derivatives written/sold –817 17 055 2 124 692 19 871
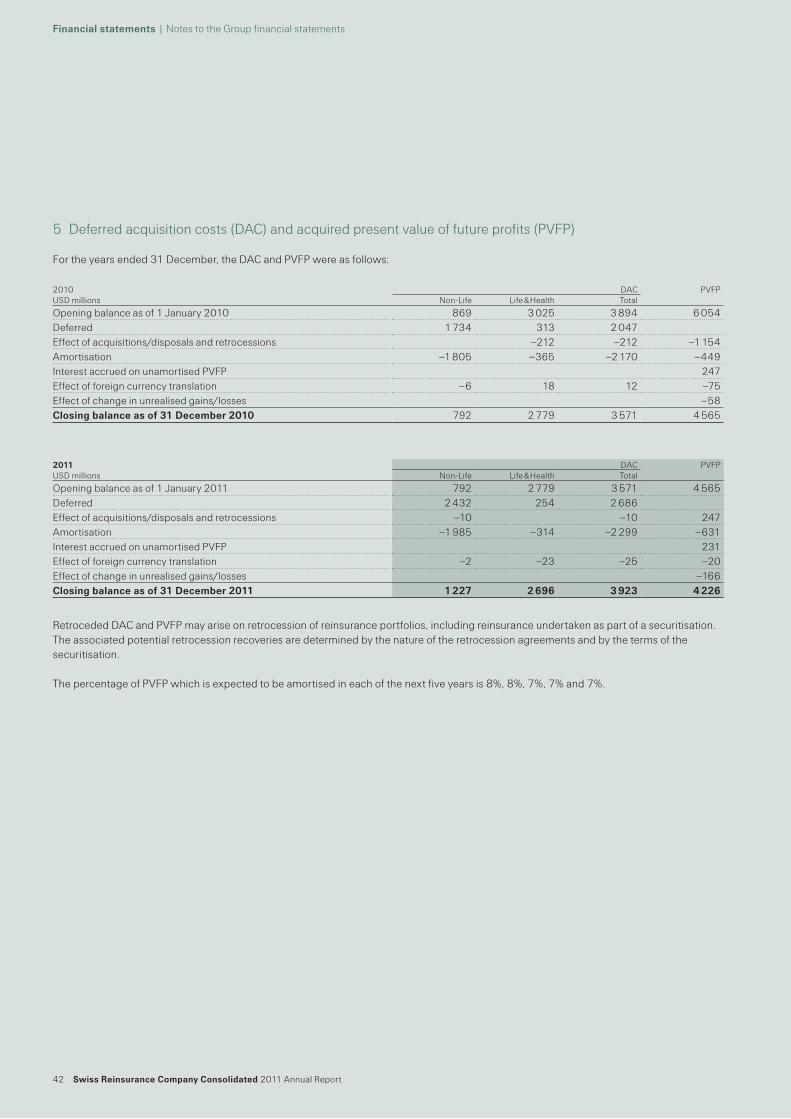
42 Swiss Reinsurance Company Consolidated 2011 Annual Report
Financial statements | Notes to the Group financial statements
5 Deferred acquisition costs (DAC) and acquired present value of future profits (PVFP)
For the years ended 31 December, the DAC and PVFP were as follows:
Retroceded DAC and PVFP may arise on retrocession of reinsurance portfolios, including reinsurance undertaken as part of a securitisation. The associated potential retrocession recoveries are determined by the nature of the retrocession agreements and by the terms of the securitisation.
The percentage of PVFP which is expected to be amortised in each of the next five years is 8%, 8%, 7%, 7% and 7%.
2010 DAC PVFPUSD millions Non-Life Life & Health Total
Opening balance as of 1 January 2010 869 3 025 3 894 6 054Deferred 1 734 313 2 047Effect of acquisitions/disposals and retrocessions –212 –212 –1 154Amortisation –1 805 –365 –2 170 –449Interest accrued on unamortised PVFP 247Effect of foreign currency translation –6 18 12 –75Effect of change in unrealised gains/losses –58Closing balance as of 31 December 2010 792 2 779 3 571 4 565
2011 DAC PVFPUSD millions Non-Life Life & Health Total
Opening balance as of 1 January 2011 792 2 779 3 571 4 565Deferred 2 432 254 2 686Effect of acquisitions/disposals and retrocessions –10 –10 247Amortisation –1 985 –314 –2 299 –631Interest accrued on unamortised PVFP 231Effect of foreign currency translation –2 –23 –25 –20Effect of change in unrealised gains/losses –166Closing balance as of 31 December 2011 1 227 2 696 3 923 4 226

Swiss Reinsurance Company Consolidated 2011 Annual Report 43
Financial statements | Notes to the Group financial statements
This page intentionally left blank
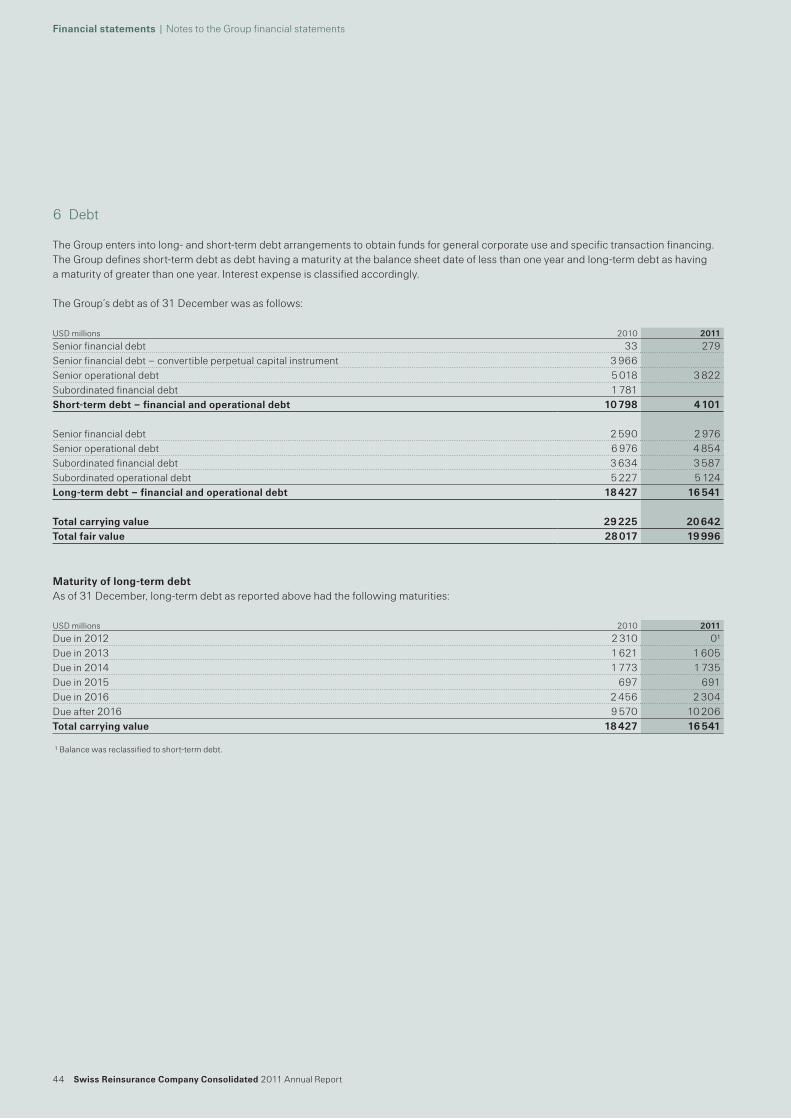
44 Swiss Reinsurance Company Consolidated 2011 Annual Report
Financial statements | Notes to the Group financial statements
6 Debt
The Group enters into long- and short-term debt arrangements to obtain funds for general corporate use and specific transaction financing. The Group defines short-term debt as debt having a maturity at the balance sheet date of less than one year and long-term debt as having a maturity of greater than one year. Interest expense is classified accordingly.
The Group’s debt as of 31 December was as follows:
Maturity of long-term debtAs of 31 December, long-term debt as reported above had the following maturities:
USD millions 2010 2011
Senior financial debt 33 279Senior financial debt – convertible perpetual capital instrument 3 966Senior operational debt 5 018 3 822Subordinated financial debt 1 781Short-term debt – financial and operational debt 10 798 4 101
Senior financial debt 2 590 2 976Senior operational debt 6 976 4 854Subordinated financial debt 3 634 3 587Subordinated operational debt 5 227 5 124Long-term debt – financial and operational debt 18 427 16 541
Total carrying value 29 225 20 642Total fair value 28 017 19 996
USD millions 2010 2011
Due in 2012 2 310 01Due in 2013 1 621 1 605Due in 2014 1 773 1 735Due in 2015 697 691Due in 2016 2 456 2 304Due after 2016 9 570 10 206Total carrying value 18 427 16 541
1 Balance was reclassified to short-term debt.
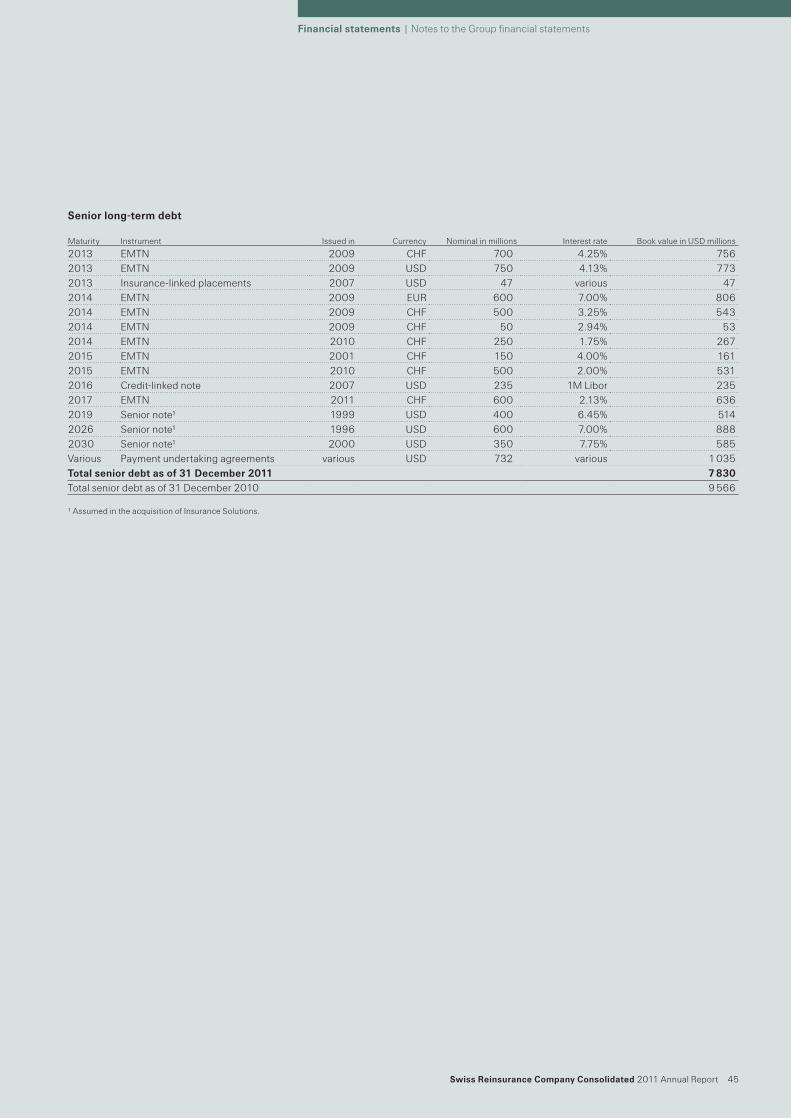
Swiss Reinsurance Company Consolidated 2011 Annual Report 45
Financial statements | Notes to the Group financial statements
Senior long-term debt
Maturity Instrument Issued in Currency Nominal in millions Interest rate Book value in USD millions
2013 EMTN 2009 CHF 700 4.25% 7562013 EMTN 2009 USD 750 4.13% 7732013 Insurance-linked placements 2007 USD 47 various 472014 EMTN 2009 EUR 600 7.00% 8062014 EMTN 2009 CHF 500 3.25% 5432014 EMTN 2009 CHF 50 2.94% 532014 EMTN 2010 CHF 250 1.75% 2672015 EMTN 2001 CHF 150 4.00% 1612015 EMTN 2010 CHF 500 2.00% 5312016 Credit-linked note 2007 USD 235 1M Libor 2352017 EMTN 2011 CHF 600 2.13% 6362019 Senior note1 1999 USD 400 6.45% 5142026 Senior note1 1996 USD 600 7.00% 8882030 Senior note1 2000 USD 350 7.75% 585Various Payment undertaking agreements various USD 732 various 1 035Total senior debt as of 31 December 2011 7 830Total senior debt as of 31 December 2010 9 566
1 Assumed in the acquisition of Insurance Solutions.
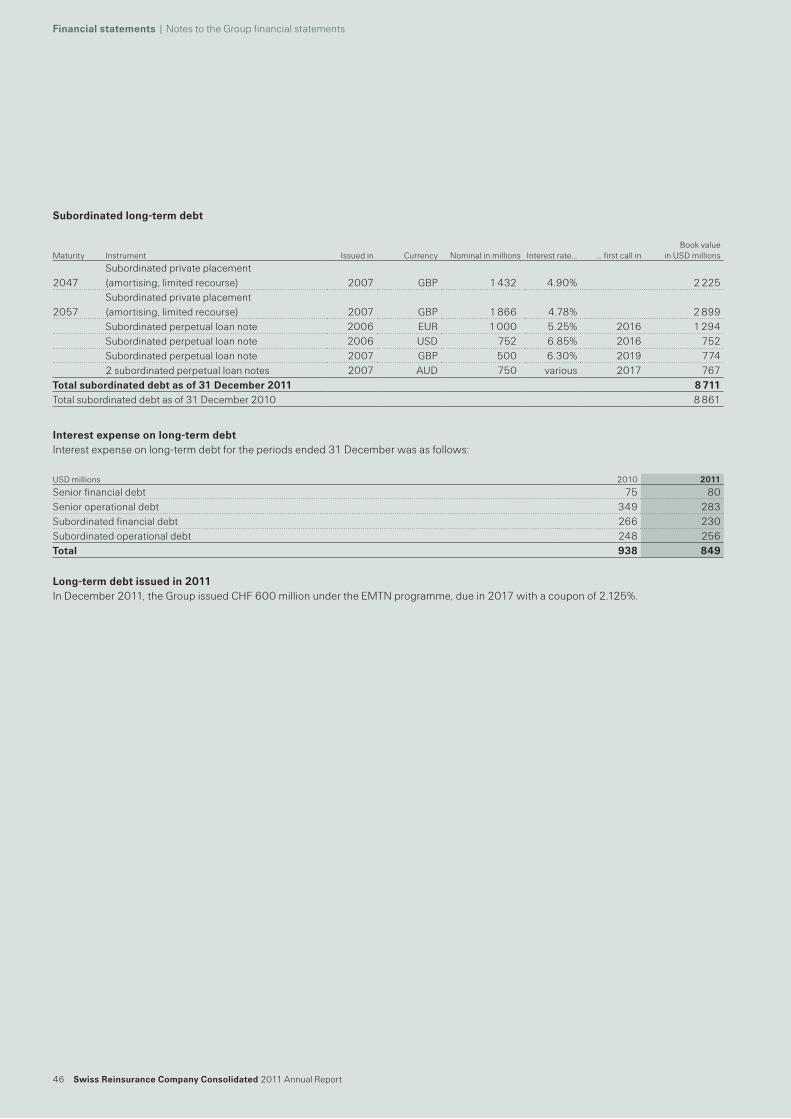
46 Swiss Reinsurance Company Consolidated 2011 Annual Report
Financial statements | Notes to the Group financial statements
Subordinated long-term debt
Interest expense on long-term debtInterest expense on long-term debt for the periods ended 31 December was as follows:
Long-term debt issued in 2011In December 2011, the Group issued CHF 600 million under the EMTN programme, due in 2017 with a coupon of 2.125%.
Maturity Instrument Issued in Currency Nominal in millions Interest rate… … first call inBook value
in USD millions
2047Subordinated private placement (amortising, limited recourse) 2007 GBP 1 432 4.90% 2 225
2057Subordinated private placement (amortising, limited recourse) 2007 GBP 1 866 4.78% 2 899Subordinated perpetual loan note 2006 EUR 1 000 5.25% 2016 1 294Subordinated perpetual loan note 2006 USD 752 6.85% 2016 752Subordinated perpetual loan note 2007 GBP 500 6.30% 2019 7742 subordinated perpetual loan notes 2007 AUD 750 various 2017 767
Total subordinated debt as of 31 December 2011 8 711Total subordinated debt as of 31 December 2010 8 861
USD millions 2010 2011
Senior financial debt 75 80Senior operational debt 349 283Subordinated financial debt 266 230Subordinated operational debt 248 256Total 938 849
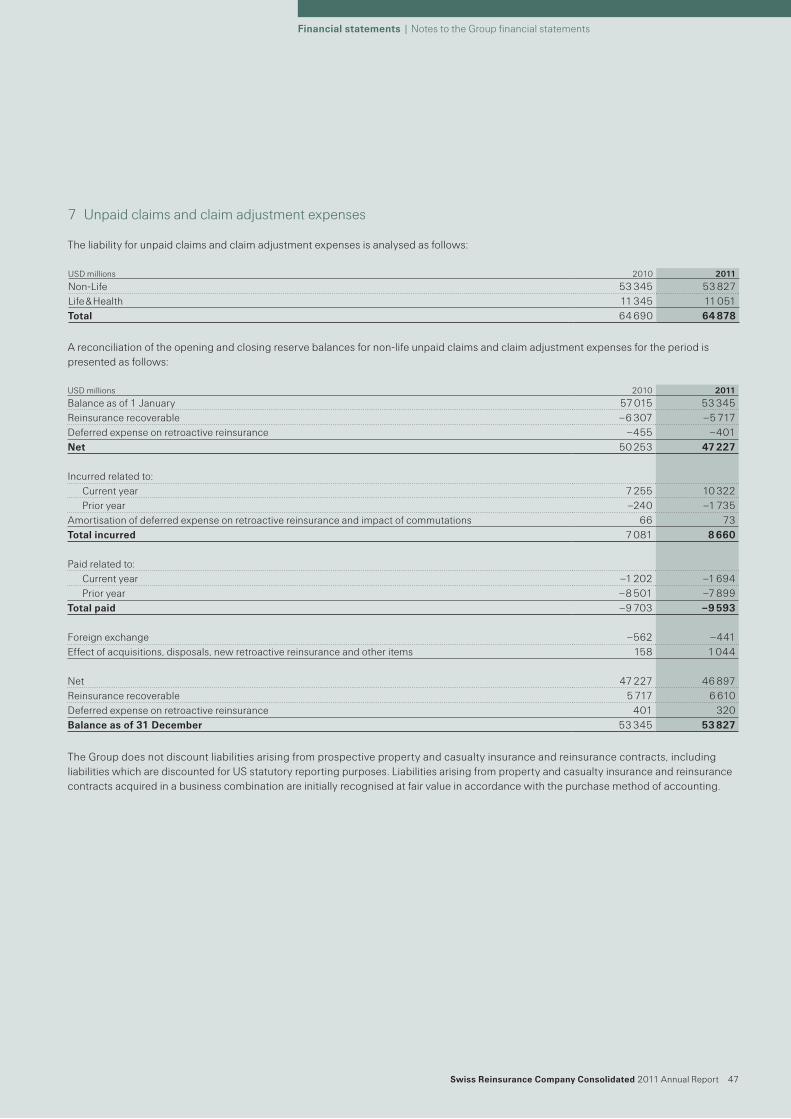
Swiss Reinsurance Company Consolidated 2011 Annual Report 47
Financial statements | Notes to the Group financial statements
7 Unpaid claims and claim adjustment expenses
The liability for unpaid claims and claim adjustment expenses is analysed as follows:
A reconciliation of the opening and closing reserve balances for non-life unpaid claims and claim adjustment expenses for the period is presented as follows:
The Group does not discount liabilities arising from prospective property and casualty insurance and reinsurance contracts, including liabilities which are discounted for US statutory reporting purposes. Liabilities arising from property and casualty insurance and reinsurance contracts acquired in a business combination are initially recognised at fair value in accordance with the purchase method of accounting.
USD millions 2010 2011
Non-Life 53 345 53 827Life & Health 11 345 11 051Total 64 690 64 878
USD millions 2010 2011
Balance as of 1 January 57 015 53 345Reinsurance recoverable –6 307 –5 717Deferred expense on retroactive reinsurance –455 –401Net 50 253 47 227
Incurred related to:Current year 7 255 10 322Prior year –240 –1 735
Amortisation of deferred expense on retroactive reinsurance and impact of commutations 66 73Total incurred 7 081 8 660
Paid related to:Current year –1 202 –1 694Prior year –8 501 –7 899
Total paid –9 703 –9 593
Foreign exchange –562 –441Effect of acquisitions, disposals, new retroactive reinsurance and other items 158 1 044
Net 47 227 46 897Reinsurance recoverable 5 717 6 610Deferred expense on retroactive reinsurance 401 320Balance as of 31 December 53 345 53 827
48 Swiss Reinsurance Company Consolidated 2011 Annual Report
Financial statements | Notes to the Group financial statements
Asbestos and environmental claims exposureThe Group’s obligation for claims payments and claims settlement charges also includes obligations for long-latent injury claims arising out of policies written prior to 1985, in particular in the area of US asbestos and environmental liability.
Due to the inherent uncertainties and assumptions on which these estimates are based, however, the Group cannot exclude the need to make further additions to these provisions in the future.
At the end of 2011, the Group carried net reserves for US asbestos, environmental and other long-latent health hazards equal to USD 2 214 million. During 2011, the Group incurred net losses of USD 128 million and paid net against these liabilities USD 183 million.
The Group maintains an active commutation strategy to reduce exposure. When commutation payments are made, the traditional “survival ratio” is artificially reduced by premature payments which should not imply a reduction in reserve adequacy.
Prior-year developmentClaims development on prior years were driven by favourable experience in property, liability, credit and other specialty lines. Some reserve strengthening was absorbed in the overall number, on US Workers’ Compensation business, UK Motor business and an increase for US asbestos and environmental losses. The adverse development cover with Berkshire Hathaway, which covers losses from 2008 or earlier, remains in place but had no impact on the result for 2011, as it was already recognised at the minimum commutation value at year-end 2010 and remains recognised at that value.
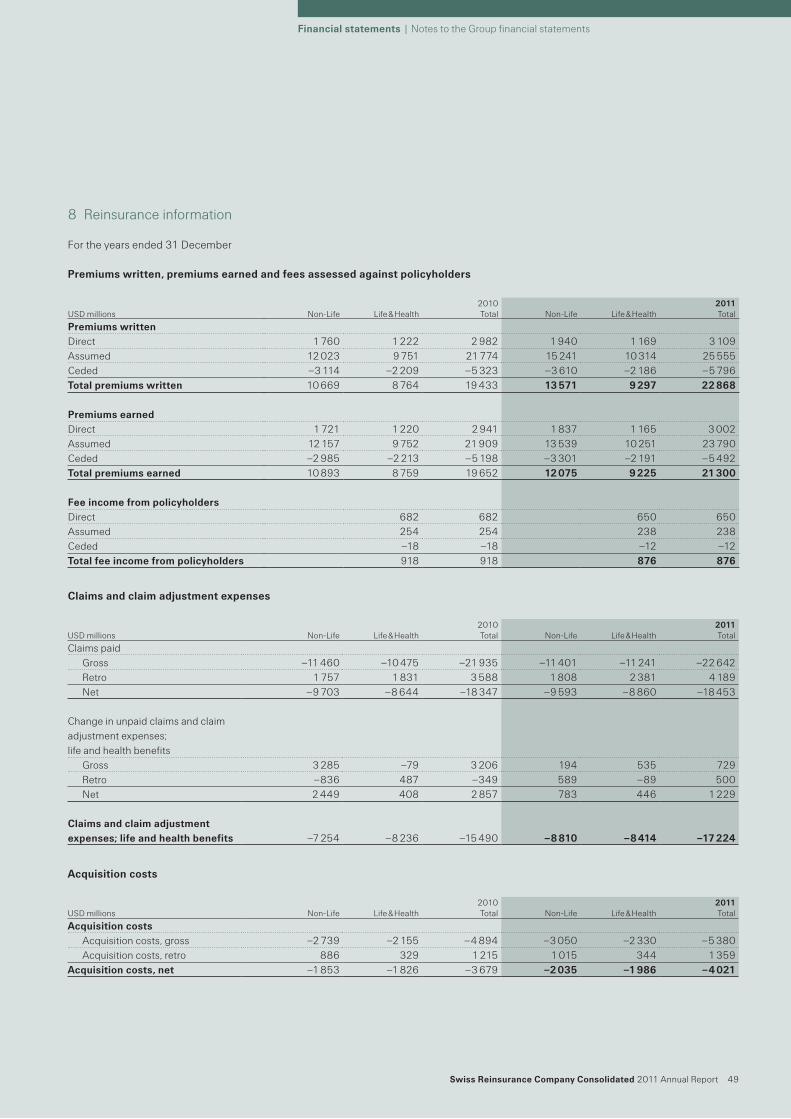
Swiss Reinsurance Company Consolidated 2011 Annual Report 49
Financial statements | Notes to the Group financial statements
8 Reinsurance information
For the years ended 31 December
Premiums written, premiums earned and fees assessed against policyholders
Claims and claim adjustment expenses
Acquisition costs
2010 2011USD millions Non-Life Life & Health Total Non-Life Life & Health Total
Premiums writtenDirect 1 760 1 222 2 982 1 940 1 169 3 109Assumed 12 023 9 751 21 774 15 241 10 314 25 555Ceded –3 114 –2 209 –5 323 –3 610 –2 186 –5 796Total premiums written 10 669 8 764 19 433 13 571 9 297 22 868
Premiums earnedDirect 1 721 1 220 2 941 1 837 1 165 3 002Assumed 12 157 9 752 21 909 13 539 10 251 23 790Ceded –2 985 –2 213 –5 198 –3 301 –2 191 –5 492Total premiums earned 10 893 8 759 19 652 12 075 9 225 21 300
Fee income from policyholdersDirect 682 682 650 650Assumed 254 254 238 238Ceded –18 –18 –12 –12Total fee income from policyholders 918 918 876 876
2010 2011USD millions Non-Life Life & Health Total Non-Life Life & Health Total
Claims paidGross –11 460 –10 475 –21 935 –11 401 –11 241 –22 642Retro 1 757 1 831 3 588 1 808 2 381 4 189Net –9 703 –8 644 –18 347 –9 593 –8 860 –18 453
Change in unpaid claims and claim adjustment expenses; life and health benefits
Gross 3 285 –79 3 206 194 535 729Retro –836 487 –349 589 –89 500Net 2 449 408 2 857 783 446 1 229
Claims and claim adjustment expenses; life and health benefits –7 254 –8 236 –15 490 –8 810 –8 414 –17 224
2010 2011USD millions Non-Life Life & Health Total Non-Life Life & Health Total
Acquisition costsAcquisition costs, gross –2 739 –2 155 –4 894 –3 050 –2 330 –5 380Acquisition costs, retro 886 329 1 215 1 015 344 1 359
Acquisition costs, net –1 853 –1 826 –3 679 –2 035 –1 986 –4 021
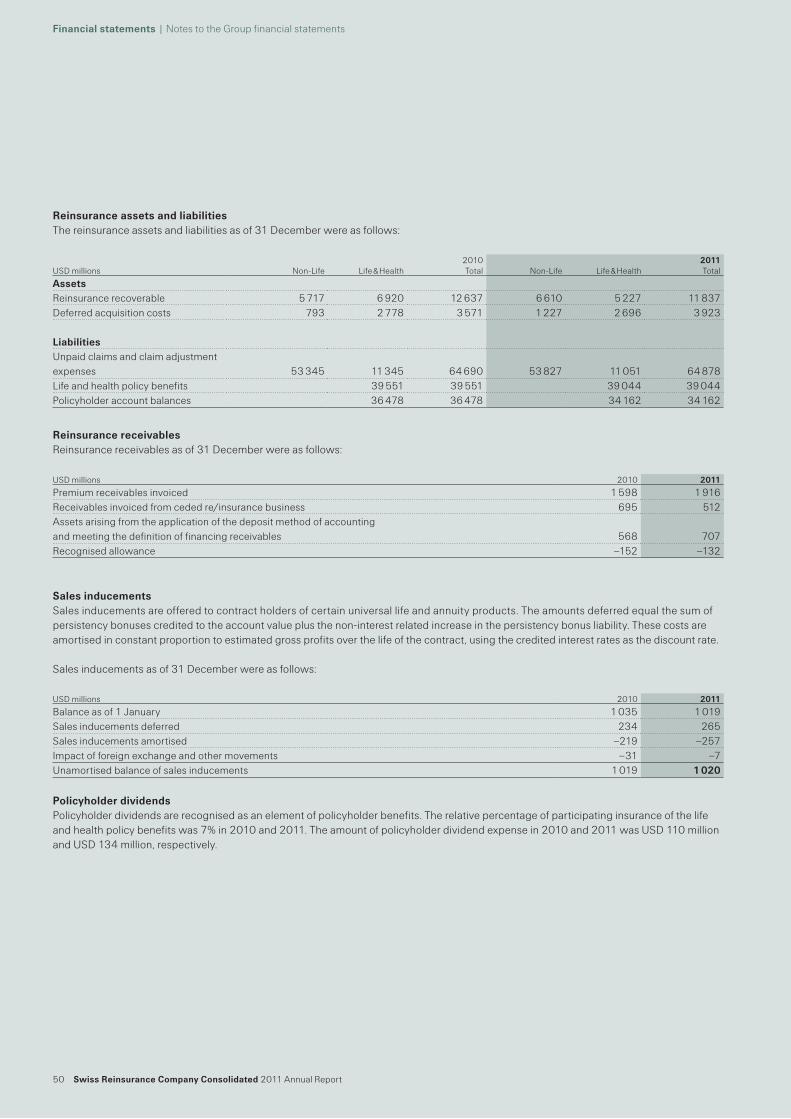
50 Swiss Reinsurance Company Consolidated 2011 Annual Report
Financial statements | Notes to the Group financial statements
Reinsurance assets and liabilitiesThe reinsurance assets and liabilities as of 31 December were as follows:
Reinsurance receivablesReinsurance receivables as of 31 December were as follows:
Sales inducementsSales inducements are offered to contract holders of certain universal life and annuity products. The amounts deferred equal the sum of persistency bonuses credited to the account value plus the non-interest related increase in the persistency bonus liability. These costs are amortised in constant proportion to estimated gross profits over the life of the contract, using the credited interest rates as the discount rate.
Sales inducements as of 31 December were as follows:
Policyholder dividendsPolicyholder dividends are recognised as an element of policyholder benefits. The relative percentage of participating insurance of the life and health policy benefits was 7% in 2010 and 2011. The amount of policyholder dividend expense in 2010 and 2011 was USD 110 million and USD 134 million, respectively.
2010 2011USD millions Non-Life Life & Health Total Non-Life Life & Health Total
AssetsReinsurance recoverable 5 717 6 920 12 637 6 610 5 227 11 837Deferred acquisition costs 793 2 778 3 571 1 227 2 696 3 923
LiabilitiesUnpaid claims and claim adjustment expenses 53 345 11 345 64 690 53 827 11 051 64 878Life and health policy benefits 39 551 39 551 39 044 39 044Policyholder account balances 36 478 36 478 34 162 34 162
USD millions 2010 2011
Premium receivables invoiced 1 598 1 916Receivables invoiced from ceded re/insurance business 695 512Assets arising from the application of the deposit method of accounting and meeting the definition of financing receivables 568 707Recognised allowance –152 –132
USD millions 2010 2011
Balance as of 1 January 1 035 1 019Sales inducements deferred 234 265Sales inducements amortised –219 –257Impact of foreign exchange and other movements –31 –7Unamortised balance of sales inducements 1 019 1 020
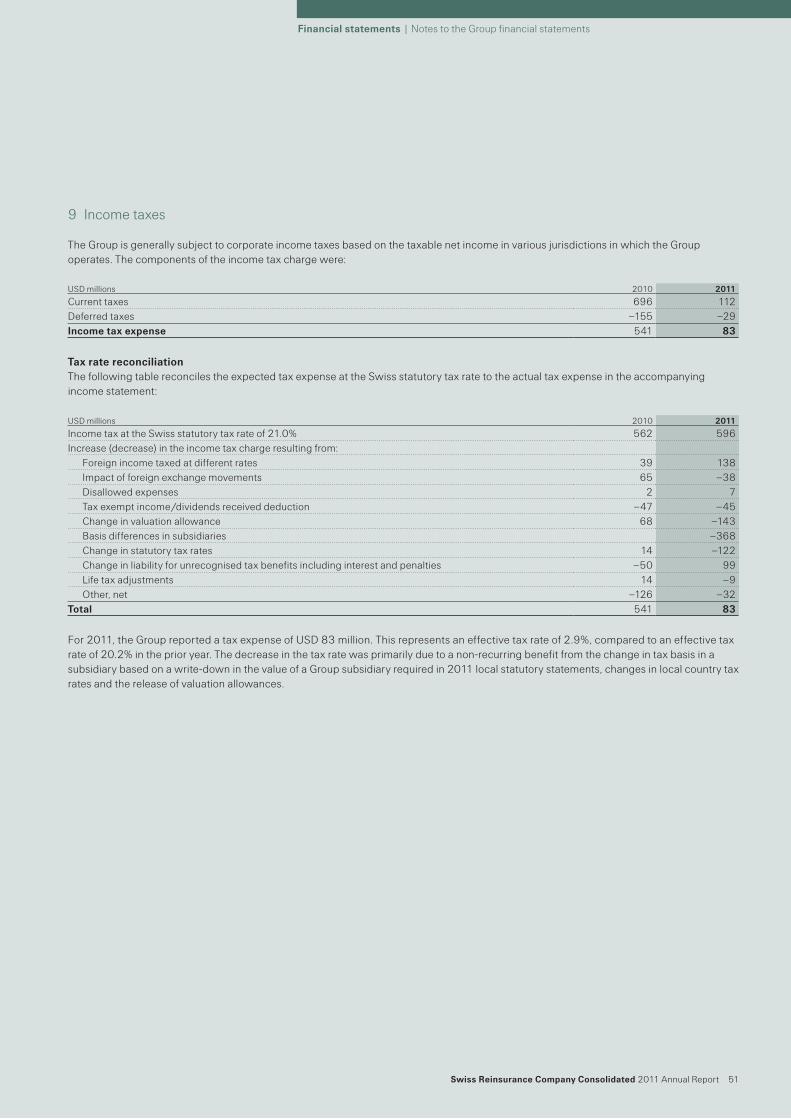
� Swiss�Reinsurance�Company�Consolidated�2011 Annual Report 51
Financial�statements�| Notes to the Group financial statements
9 Income taxes
The Group is generally subject to corporate income taxes based on the taxable net income in various jurisdictions in which the Group operates. The components of the income tax charge were:
Tax�rate�reconciliationThe following table reconciles the expected tax expense at the Swiss statutory tax rate to the actual tax expense in the accompanying income statement:
For 2011, the Group reported a tax expense of USD 83 million. This represents an effective tax rate of 2.9%, compared to an effective tax rate of 20.2% in the prior year. The decrease in the tax rate was primarily due to a non-recurring benefit from the change in tax basis in a subsidiary based on a write-down in the value of a Group subsidiary required in 2011 local statutory statements, changes in local country tax rates and the release of valuation allowances.
USD millions 2010 2011
Current taxes 696 112Deferred taxes –155 –29Income�tax�expense 541 83
USD millions 2010 2011
Income tax at the Swiss statutory tax rate of 21.0% 562 596Increase (decrease) in the income tax charge resulting from:
Foreign income taxed at different rates 39 138Impact of foreign exchange movements 65 –38Disallowed expenses 2 7Tax exempt income /dividends received deduction –47 –45Change in valuation allowance 68 –143Basis differences in subsidiaries –368Change in statutory tax rates 14 –122Change in liability for unrecognised tax benefits including interest and penalties –50 99Life tax adjustments 14 –9Other, net –126 –32
Total� 541 83
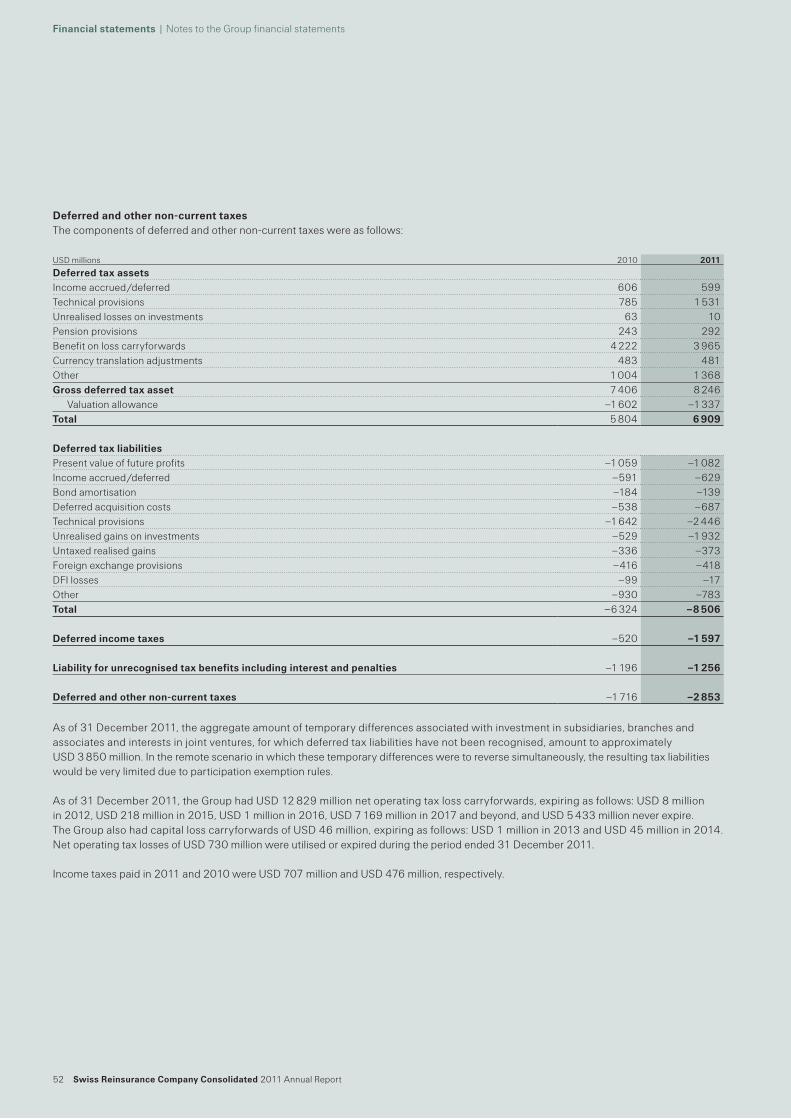
52 Swiss�Reinsurance�Company�Consolidated�2011 Annual Report
Financial�statements�| Notes to the Group financial statements
Deferred�and�other�non-current�taxesThe components of deferred and other non-current taxes were as follows:
As of 31 December 2011, the aggregate amount of temporary differences associated with investment in subsidiaries, branches and associates and interests in joint ventures, for which deferred tax liabilities have not been recognised, amount to approximately USD 3 850 million. In the remote scenario in which these temporary differences were to reverse simultaneously, the resulting tax liabilities would be very limited due to participation exemption rules.
As of 31 December 2011, the Group had USD 12 829 million net operating tax loss carryforwards, expiring as follows: USD 8 million in 2012, USD 218 million in 2015, USD 1 million in 2016, USD 7 169 million in 2017 and beyond, and USD 5 433 million never expire. The Group also had capital loss carryforwards of USD 46 million, expiring as follows: USD 1 million in 2013 and USD 45 million in 2014. Net operating tax losses of USD 730 million were utilised or expired during the period ended 31 December 2011.
Income taxes paid in 2011 and 2010 were USD 707 million and USD 476 million, respectively.
USD millions 2010 2011
Deferred�tax�assetsIncome accrued /deferred 606 599Technical provisions 785 1 531Unrealised losses on investments 63 10Pension provisions 243 292Benefit on loss carryforwards 4 222 3 965Currency translation adjustments 483 481Other 1 004 1 368Gross�deferred�tax�asset 7 406 8 246
Valuation allowance –1 602 –1 337Total� 5 804 6�909
Deferred�tax�liabilitiesPresent value of future profits –1 059 –1 082Income accrued /deferred –591 –629Bond amortisation –184 –139Deferred acquisition costs –538 –687Technical provisions –1 642 –2 446Unrealised gains on investments –529 –1 932Untaxed realised gains –336 –373Foreign exchange provisions –416 –418DFI losses –99 –17Other –930 –783Total� –6 324 –8�506
Deferred�income�taxes –520 –1�597
Liability�for�unrecognised�tax�benefits�including�interest�and�penalties –1 196 –1�256
Deferred�and�other�non-current�taxes –1 716 –2�853
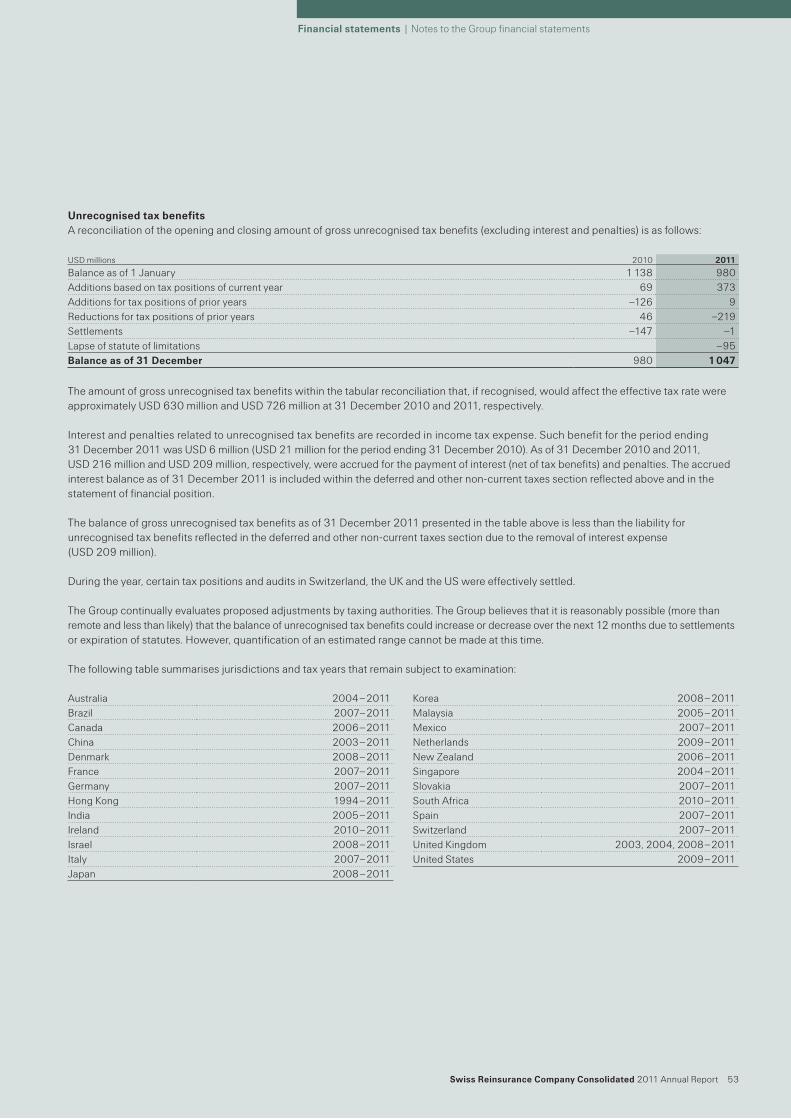
� Swiss�Reinsurance�Company�Consolidated�2011 Annual Report 53
Financial�statements�| Notes to the Group financial statements
Unrecognised�tax�benefits�A reconciliation of the opening and closing amount of gross unrecognised tax benefits (excluding interest and penalties) is as follows:
The amount of gross unrecognised tax benefits within the tabular reconciliation that, if recognised, would affect the effective tax rate were approximately USD 630 million and USD 726 million at 31 December 2010 and 2011, respectively.
Interest and penalties related to unrecognised tax benefits are recorded in income tax expense. Such benefit for the period ending 31 December 2011 was USD 6 million (USD 21 million for the period ending 31 December 2010). As of 31 December 2010 and 2011, USD 216 million and USD 209 million, respectively, were accrued for the payment of interest (net of tax benefits) and penalties. The accrued interest balance as of 31 December 2011 is included within the deferred and other non-current taxes section reflected above and in the statement of financial position.
The balance of gross unrecognised tax benefits as of 31 December 2011 presented in the table above is less than the liability for unrecognised tax benefits reflected in the deferred and other non-current taxes section due to the removal of interest expense (USD 209 million).
During the year, certain tax positions and audits in Switzerland, the UK and the US were effectively settled.
The Group continually evaluates proposed adjustments by taxing authorities. The Group believes that it is reasonably possible (more than remote and less than likely) that the balance of unrecognised tax benefits could increase or decrease over the next 12 months due to settlements or expiration of statutes. However, quantification of an estimated range cannot be made at this time.
The following table summarises jurisdictions and tax years that remain subject to examination:
USD millions 2010 2011
Balance as of 1 January 1 138 980Additions based on tax positions of current year 69 373Additions for tax positions of prior years –126 9Reductions for tax positions of prior years 46 –219Settlements –147 –1Lapse of statute of limitations –95Balance�as�of�31�December 980 1�047
Australia 2004 – 2011 Korea 2008 – 2011Brazil 2007– 2011 Malaysia 2005 – 2011Canada 2006 – 2011 Mexico 2007– 2011China 2003 – 2011 Netherlands 2009 – 2011Denmark 2008 – 2011 New Zealand 2006 – 2011France 2007– 2011 Singapore 2004 – 2011Germany 2007– 2011 Slovakia 2007– 2011Hong Kong 1994 – 2011 South Africa 2010 – 2011India 2005 – 2011 Spain 2007– 2011Ireland 2010 – 2011 Switzerland 2007– 2011Israel 2008 – 2011 United Kingdom 2003, 2004, 2008 – 2011Italy 2007– 2011 United States 2009 – 2011Japan 2008 – 2011
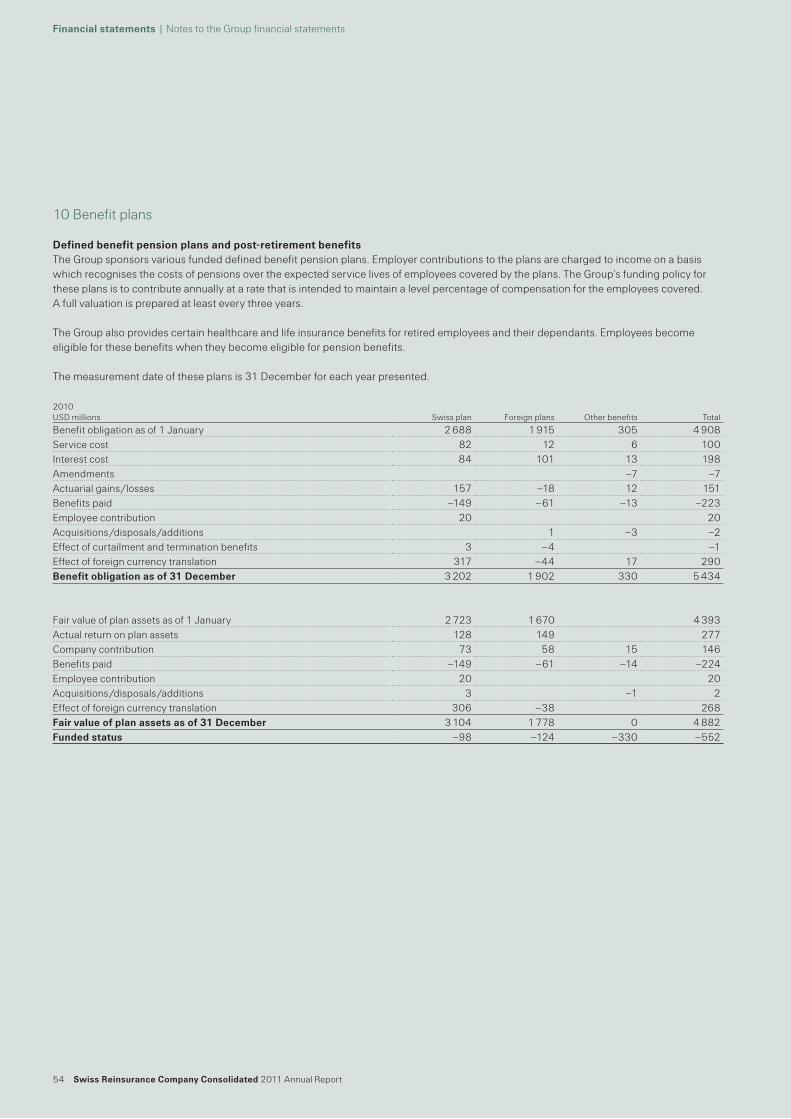
54 Swiss�Reinsurance�Company�Consolidated�2011 Annual Report
Financial�statements�| Notes to the Group financial statements
10 Benefit plans
Defined�benefit�pension�plans�and�post-retirement�benefitsThe Group sponsors various funded defined benefit pension plans. Employer contributions to the plans are charged to income on a basis which recognises the costs of pensions over the expected service lives of employees covered by the plans. The Group’s funding policy for these plans is to contribute annually at a rate that is intended to maintain a level percentage of compensation for the employees covered. A full valuation is prepared at least every three years.
The Group also provides certain healthcare and life insurance benefits for retired employees and their dependants. Employees become eligible for these benefits when they become eligible for pension benefits.
The measurement date of these plans is 31 December for each year presented.
2010 USD millions Swiss plan Foreign plans Other benefits Total
Benefit obligation as of 1 January 2 688 1 915 305 4 908Service cost 82 12 6 100Interest cost 84 101 13 198Amendments –7 –7Actuarial gains /losses 157 –18 12 151Benefits paid –149 –61 –13 –223Employee contribution 20 20Acquisitions /disposals /additions 1 –3 –2Effect of curtailment and termination benefits 3 –4 –1Effect of foreign currency translation 317 –44 17 290Benefit�obligation�as�of�31�December 3 202 1 902 330 5 434
Fair value of plan assets as of 1 January 2 723 1 670 4 393Actual return on plan assets 128 149 277Company contribution 73 58 15 146Benefits paid –149 –61 –14 –224Employee contribution 20 20Acquisitions /disposals /additions 3 –1 2Effect of foreign currency translation 306 –38 268Fair�value�of�plan�assets�as�of�31�December 3 104 1 778 0 4 882Funded�status –98 –124 –330 –552
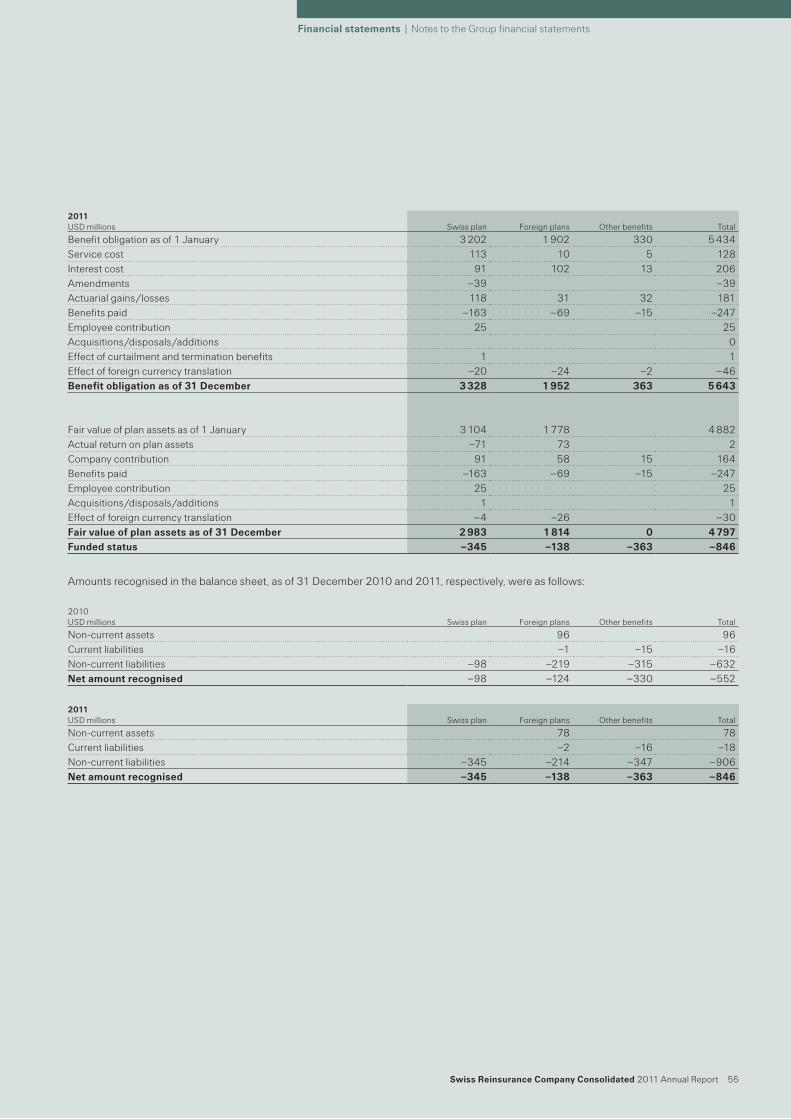
� Swiss�Reinsurance�Company�Consolidated�2011 Annual Report 55
Financial�statements�| Notes to the Group financial statements
Amounts recognised in the balance sheet, as of 31 December 2010 and 2011, respectively, were as follows:
2010 USD millions Swiss plan Foreign plans Other benefits Total
Non-current assets 96 96Current liabilities –1 –15 –16Non-current liabilities –98 –219 –315 –632Net�amount�recognised –98 –124 –330 –552
2011USD millions Swiss plan Foreign plans Other benefits Total
Non-current assets 78 78Current liabilities –2 –16 –18Non-current liabilities –345 –214 –347 –906Net�amount�recognised –345 –138 –363 –846
2011USD millions Swiss plan Foreign plans Other benefits Total
Benefit obligation as of 1 January 3 202 1 902 330 5 434Service cost 113 10 5 128Interest cost 91 102 13 206Amendments –39 –39Actuarial gains /losses 118 31 32 181Benefits paid –163 –69 –15 –247Employee contribution 25 25Acquisitions /disposals /additions 0Effect of curtailment and termination benefits 1 1Effect of foreign currency translation –20 –24 –2 –46Benefit�obligation�as�of�31�December 3�328 1�952 363 5�643
Fair value of plan assets as of 1 January 3 104 1 778 4 882Actual return on plan assets –71 73 2Company contribution 91 58 15 164Benefits paid –163 –69 –15 –247Employee contribution 25 25Acquisitions /disposals /additions 1 1Effect of foreign currency translation –4 –26 –30Fair�value�of�plan�assets�as�of�31�December 2�983 1�814 0 4�797Funded�status –345 –138 –363 –846
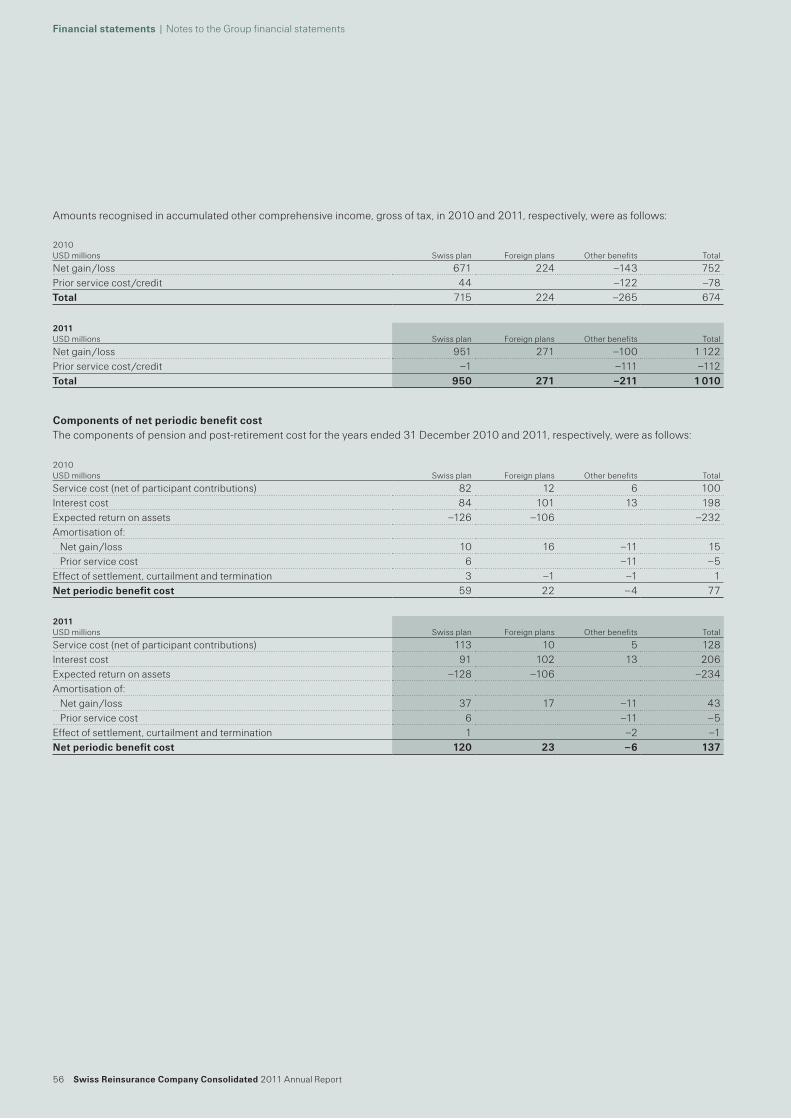
56 Swiss�Reinsurance�Company�Consolidated�2011 Annual Report
Financial�statements�| Notes to the Group financial statements
Amounts recognised in accumulated other comprehensive income, gross of tax, in 2010 and 2011, respectively, were as follows:
Components�of�net�periodic�benefit�costThe components of pension and post-retirement cost for the years ended 31 December 2010 and 2011, respectively, were as follows:
2010 USD millions Swiss plan Foreign plans Other benefits Total
Net gain /loss 671 224 –143 752Prior service cost /credit 44 –122 –78Total 715 224 –265 674
2011USD millions Swiss plan Foreign plans Other benefits Total
Net gain /loss 951 271 –100 1 122Prior service cost /credit –1 –111 –112Total 950 271 –211 1�010
2010 USD millions Swiss plan Foreign plans Other benefits Total
Service cost (net of participant contributions) 82 12 6 100Interest cost 84 101 13 198Expected return on assets –126 –106 –232Amortisation of: Net gain /loss 10 16 –11 15 Prior service cost 6 –11 –5Effect of settlement, curtailment and termination 3 –1 –1 1Net�periodic�benefit�cost 59 22 –4 77
2011USD millions Swiss plan Foreign plans Other benefits Total
Service cost (net of participant contributions) 113 10 5 128Interest cost 91 102 13 206Expected return on assets –128 –106 –234Amortisation of: Net gain /loss 37 17 –11 43 Prior service cost 6 –11 –5Effect of settlement, curtailment and termination 1 –2 –1Net�periodic�benefit�cost 120 23 –6 137
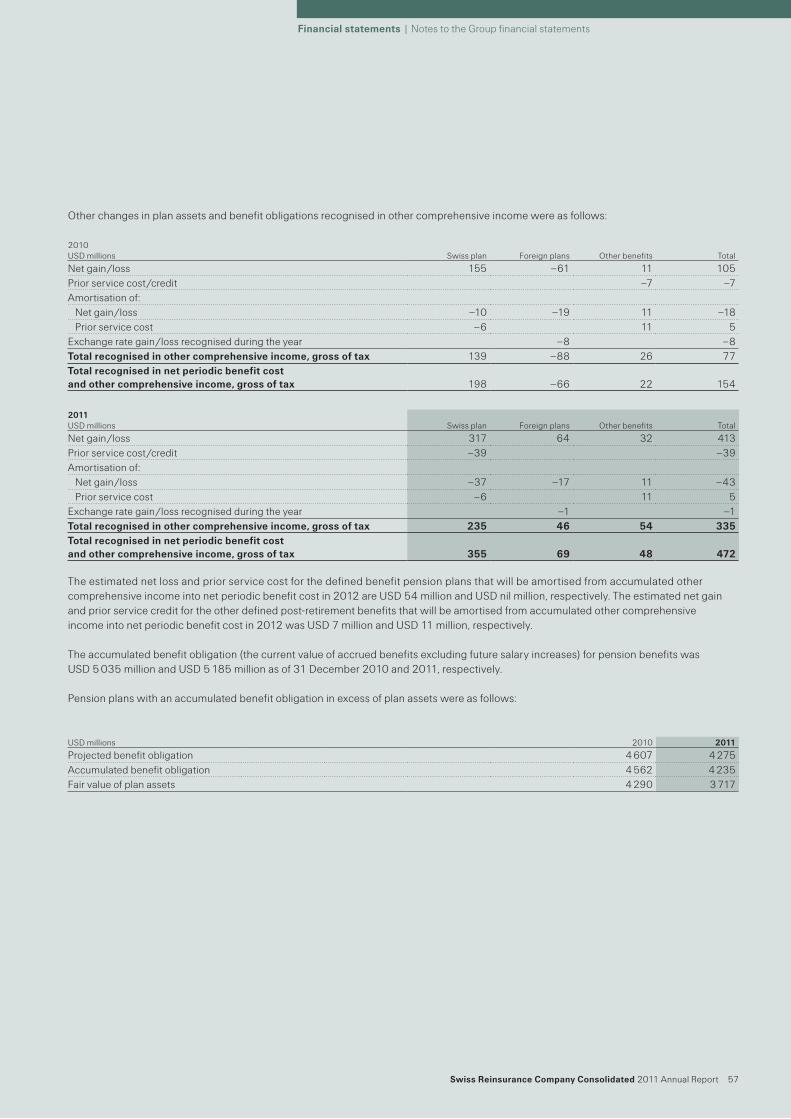
� Swiss�Reinsurance�Company�Consolidated�2011 Annual Report 57
Financial�statements�| Notes to the Group financial statements
Other changes in plan assets and benefit obligations recognised in other comprehensive income were as follows:
The estimated net loss and prior service cost for the defined benefit pension plans that will be amortised from accumulated other comprehensive income into net periodic benefit cost in 2012 are USD 54 million and USD nil million, respectively. The estimated net gain and prior service credit for the other defined post-retirement benefits that will be amortised from accumulated other comprehensive income into net periodic benefit cost in 2012 was USD 7 million and USD 11 million, respectively.
The accumulated benefit obligation (the current value of accrued benefits excluding future salary increases) for pension benefits was USD 5 035 million and USD 5 185 million as of 31 December 2010 and 2011, respectively.
Pension plans with an accumulated benefit obligation in excess of plan assets were as follows:
USD millions 2010 2011
Projected benefit obligation 4 607 4 275Accumulated benefit obligation 4 562 4 235Fair value of plan assets 4 290 3 717
2010 USD millions Swiss plan Foreign plans Other benefits Total
Net gain /loss 155 –61 11 105Prior service cost /credit –7 –7Amortisation of: Net gain /loss –10 –19 11 –18 Prior service cost –6 11 5Exchange rate gain /loss recognised during the year –8 –8Total�recognised�in�other�comprehensive�income,�gross�of�tax 139 –88 26 77Total�recognised�in�net�periodic�benefit�cost�and�other�comprehensive�income,�gross�of�tax 198 –66 22 154
2011USD millions Swiss plan Foreign plans Other benefits Total
Net gain /loss 317 64 32 413Prior service cost /credit –39 –39Amortisation of: Net gain /loss –37 –17 11 –43 Prior service cost –6 11 5Exchange rate gain /loss recognised during the year –1 –1Total�recognised�in�other�comprehensive�income,�gross�of�tax 235 46 54 335Total�recognised�in�net�periodic�benefit�cost�and�other�comprehensive�income,�gross�of�tax 355 69 48 472
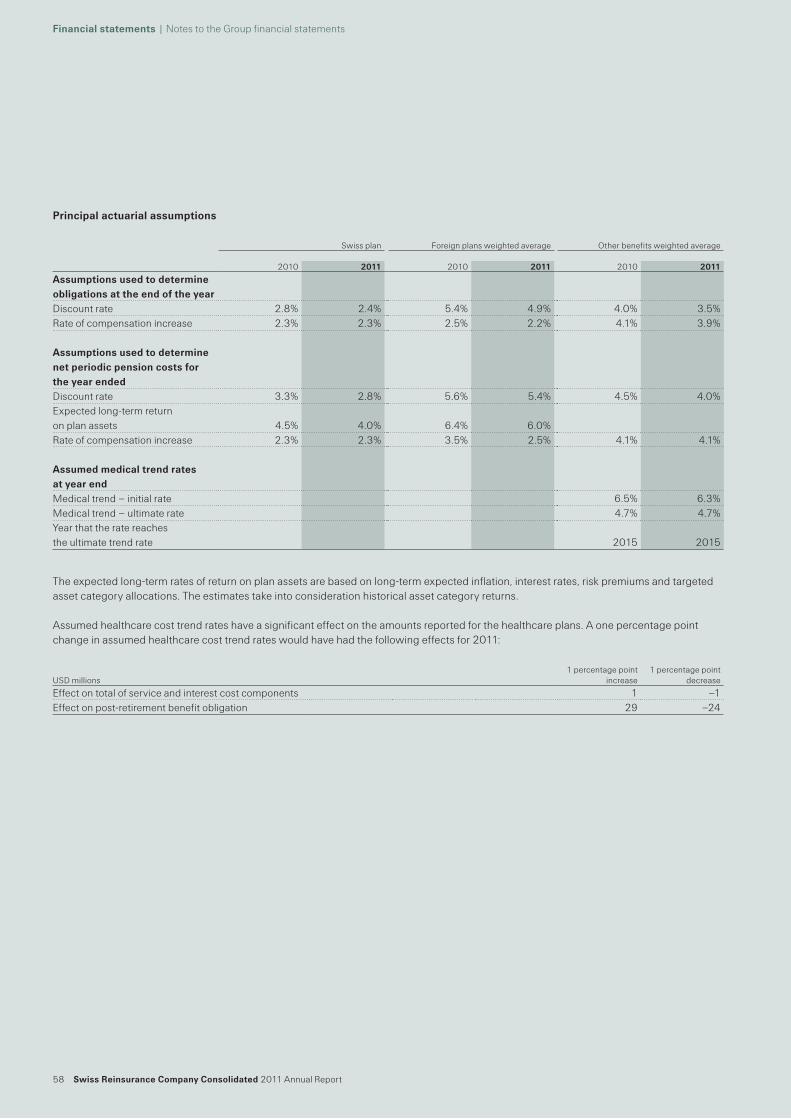
58 Swiss�Reinsurance�Company�Consolidated�2011 Annual Report
Financial�statements�| Notes to the Group financial statements
Principal�actuarial�assumptions
The expected long-term rates of return on plan assets are based on long-term expected inflation, interest rates, risk premiums and targeted asset category allocations. The estimates take into consideration historical asset category returns.
Assumed healthcare cost trend rates have a significant effect on the amounts reported for the healthcare plans. A one percentage point change in assumed healthcare cost trend rates would have had the following effects for 2011:
Swiss plan Foreign plans weighted average Other benefits weighted average
2010 2011 2010 2011 2010 2011
Assumptions�used�to�determine�obligations�at�the�end�of�the�yearDiscount rate 2.8% 2.4% 5.4% 4.9% 4.0% 3.5%Rate of compensation increase 2.3% 2.3% 2.5% 2.2% 4.1% 3.9%
Assumptions�used�to�determine�net�periodic�pension�costs�for�the�year�endedDiscount rate 3.3% 2.8% 5.6% 5.4% 4.5% 4.0%Expected long-term return on plan assets 4.5% 4.0% 6.4% 6.0%Rate of compensation increase 2.3% 2.3% 3.5% 2.5% 4.1% 4.1%
Assumed�medical�trend�rates�at�year�endMedical trend – initial rate 6.5% 6.3%Medical trend – ultimate rate 4.7% 4.7%Year that the rate reaches the ultimate trend rate 2015 2015
USD millions1 percentage point
increase1 percentage point
decrease
Effect on total of service and interest cost components 1 –1Effect on post-retirement benefit obligation 29 –24
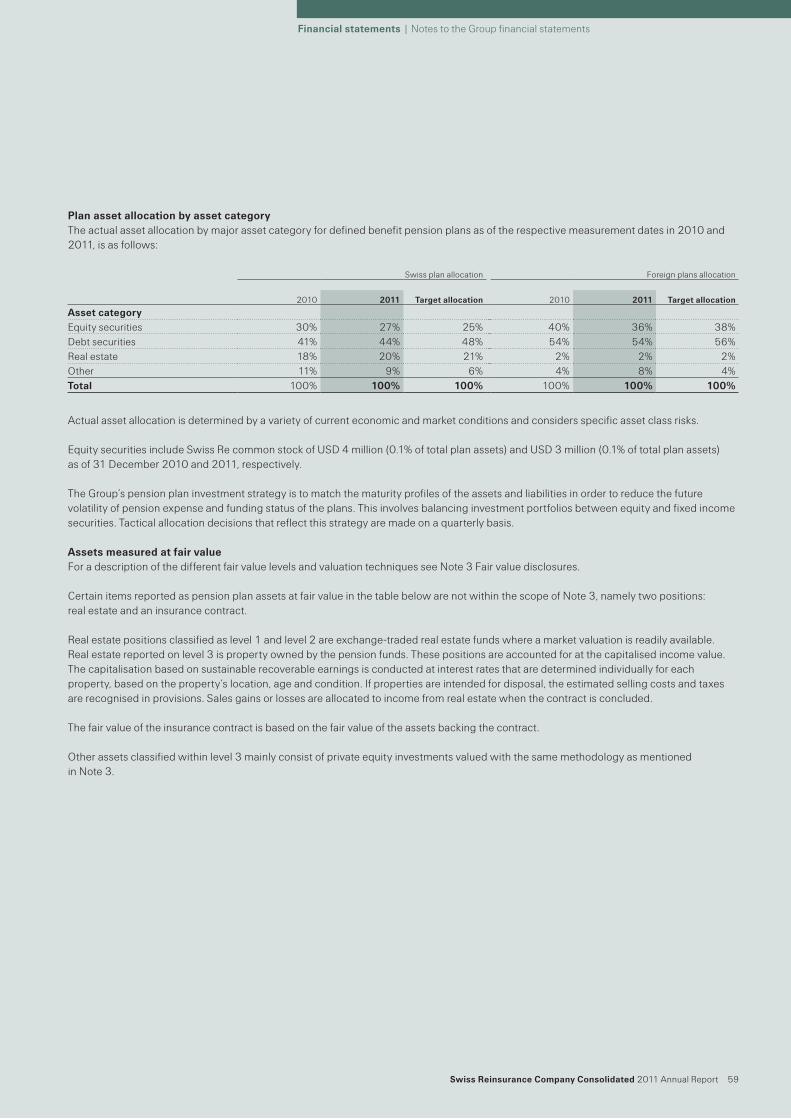
� Swiss�Reinsurance�Company�Consolidated�2011 Annual Report 59
Financial�statements�| Notes to the Group financial statements
Plan�asset�allocation�by�asset�categoryThe actual asset allocation by major asset category for defined benefit pension plans as of the respective measurement dates in 2010 and 2011, is as follows:
Actual asset allocation is determined by a variety of current economic and market conditions and considers specific asset class risks.
Equity securities include Swiss Re common stock of USD 4 million (0.1% of total plan assets) and USD 3 million (0.1% of total plan assets) as of 31 December 2010 and 2011, respectively.
The Group’s pension plan investment strategy is to match the maturity profiles of the assets and liabilities in order to reduce the future volatility of pension expense and funding status of the plans. This involves balancing investment portfolios between equity and fixed income securities. Tactical allocation decisions that reflect this strategy are made on a quarterly basis.
Assets�measured�at�fair�valueFor a description of the different fair value levels and valuation techniques see Note 3 Fair value disclosures.
Certain items reported as pension plan assets at fair value in the table below are not within the scope of Note 3, namely two positions: real estate and an insurance contract.
Real estate positions classified as level 1 and level 2 are exchange-traded real estate funds where a market valuation is readily available. Real estate reported on level 3 is property owned by the pension funds. These positions are accounted for at the capitalised income value. The capitalisation based on sustainable recoverable earnings is conducted at interest rates that are determined individually for each property, based on the property’s location, age and condition. If properties are intended for disposal, the estimated selling costs and taxes are recognised in provisions. Sales gains or losses are allocated to income from real estate when the contract is concluded.
The fair value of the insurance contract is based on the fair value of the assets backing the contract.
Other assets classified within level 3 mainly consist of private equity investments valued with the same methodology as mentioned in Note 3.
Swiss plan allocation Foreign plans allocation
2010 2011 Target�allocation 2010 2011 Target�allocation
Asset�categoryEquity securities 30% 27% 25% 40% 36% 38%Debt securities 41% 44% 48% 54% 54% 56%Real estate 18% 20% 21% 2% 2% 2%Other 11% 9% 6% 4% 8% 4%Total 100% 100% 100% 100% 100% 100%
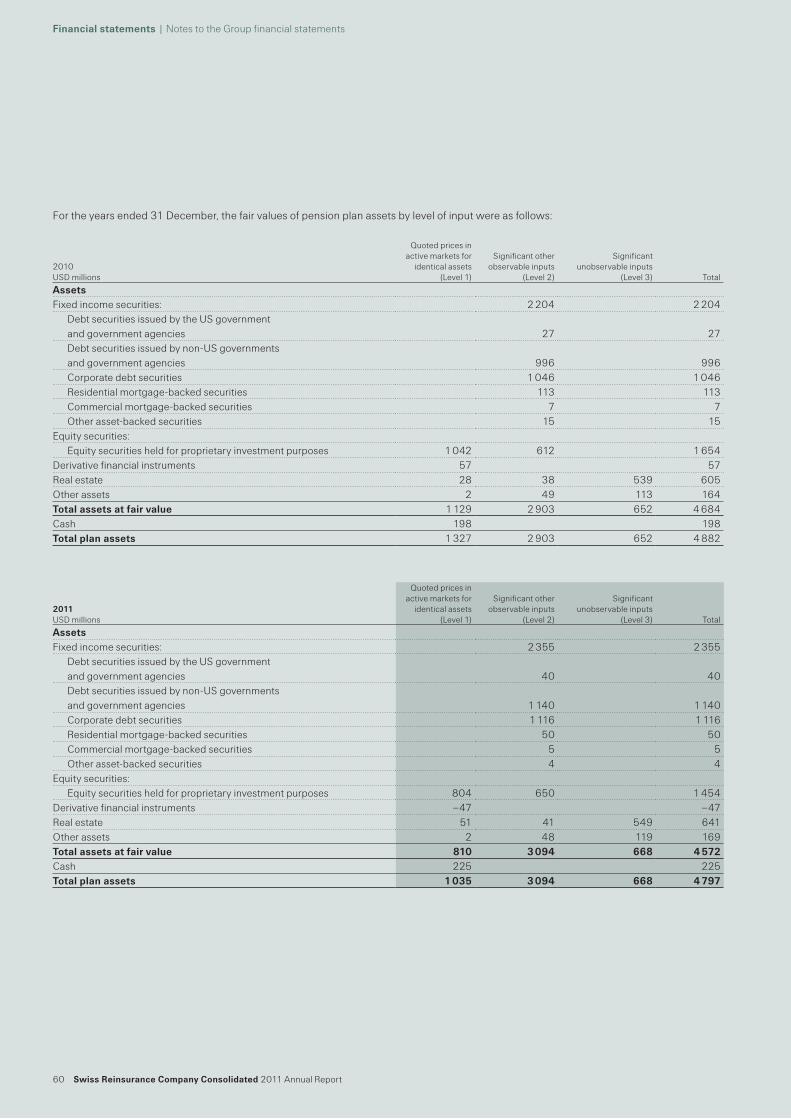
60 Swiss�Reinsurance�Company�Consolidated�2011 Annual Report
Financial�statements�| Notes to the Group financial statements
For the years ended 31 December, the fair values of pension plan assets by level of input were as follows:
2010 USD millions
Quoted prices in active markets for
identical assets (Level 1)
Significant other observable inputs
(Level 2)
Significant unobservable inputs
(Level 3) Total
AssetsFixed income securities: 2 204 2 204
Debt securities issued by the US government and government agencies 27 27Debt securities issued by non-US governments and government agencies 996 996Corporate debt securities 1 046 1 046Residential mortgage-backed securities 113 113Commercial mortgage-backed securities 7 7Other asset-backed securities 15 15
Equity securities:Equity securities held for proprietary investment purposes 1 042 612 1 654
Derivative financial instruments 57 57Real estate 28 38 539 605Other assets 2 49 113 164Total�assets�at�fair�value 1 129 2 903 652 4 684Cash 198 198Total�plan�assets 1 327 2 903 652 4 882
2011USD millions
Quoted prices in active markets for
identical assets (Level 1)
Significant other observable inputs
(Level 2)
Significant unobservable inputs
(Level 3) Total
AssetsFixed income securities: 2 355 2 355
Debt securities issued by the US government and government agencies 40 40Debt securities issued by non-US governments and government agencies 1 140 1 140Corporate debt securities 1 116 1 116Residential mortgage-backed securities 50 50Commercial mortgage-backed securities 5 5Other asset-backed securities 4 4
Equity securities:Equity securities held for proprietary investment purposes 804 650 1 454
Derivative financial instruments –47 –47Real estate 51 41 549 641Other assets 2 48 119 169Total�assets�at�fair�value 810 3�094 668 4�572Cash 225 225Total�plan�assets 1�035 3�094 668 4�797
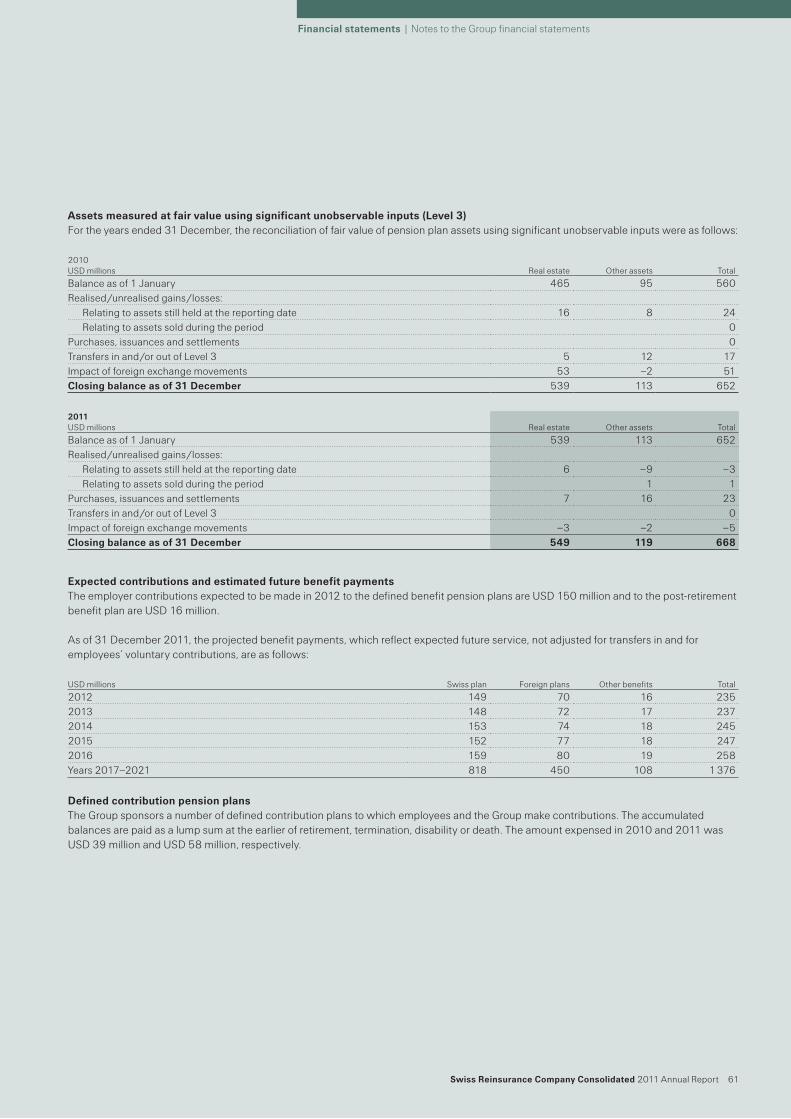
� Swiss�Reinsurance�Company�Consolidated�2011 Annual Report 61
Financial�statements�| Notes to the Group financial statements
Assets�measured�at�fair�value�using�significant�unobservable�inputs�(Level�3)For the years ended 31 December, the reconciliation of fair value of pension plan assets using significant unobservable inputs were as follows:
Expected�contributions�and�estimated�future�benefit�paymentsThe employer contributions expected to be made in 2012 to the defined benefit pension plans are USD 150 million and to the post-retirement benefit plan are USD 16 million.
As of 31 December 2011, the projected benefit payments, which reflect expected future service, not adjusted for transfers in and for employees’ voluntary contributions, are as follows:
Defined�contribution�pension�plansThe Group sponsors a number of defined contribution plans to which employees and the Group make contributions. The accumulated balances are paid as a lump sum at the earlier of retirement, termination, disability or death. The amount expensed in 2010 and 2011 was USD 39 million and USD 58 million, respectively.
2010 USD millions Real estate Other assets Total
Balance as of 1 January 465 95 560Realised /unrealised gains /losses:
Relating to assets still held at the reporting date 16 8 24Relating to assets sold during the period 0
Purchases, issuances and settlements 0Transfers in and /or out of Level 3 5 12 17Impact of foreign exchange movements 53 –2 51Closing�balance�as�of�31�December 539 113 652
2011USD millions Real estate Other assets Total
Balance as of 1 January 539 113 652Realised /unrealised gains /losses:
Relating to assets still held at the reporting date 6 –9 –3Relating to assets sold during the period 1 1
Purchases, issuances and settlements 7 16 23Transfers in and /or out of Level 3 0Impact of foreign exchange movements –3 –2 –5Closing�balance�as�of�31�December 549 119 668
USD millions Swiss plan Foreign plans Other benefits Total
2012 149 70 16 2352013 148 72 17 2372014 153 74 18 2452015 152 77 18 2472016 159 80 19 258Years 2017–2021 818 450 108 1 376
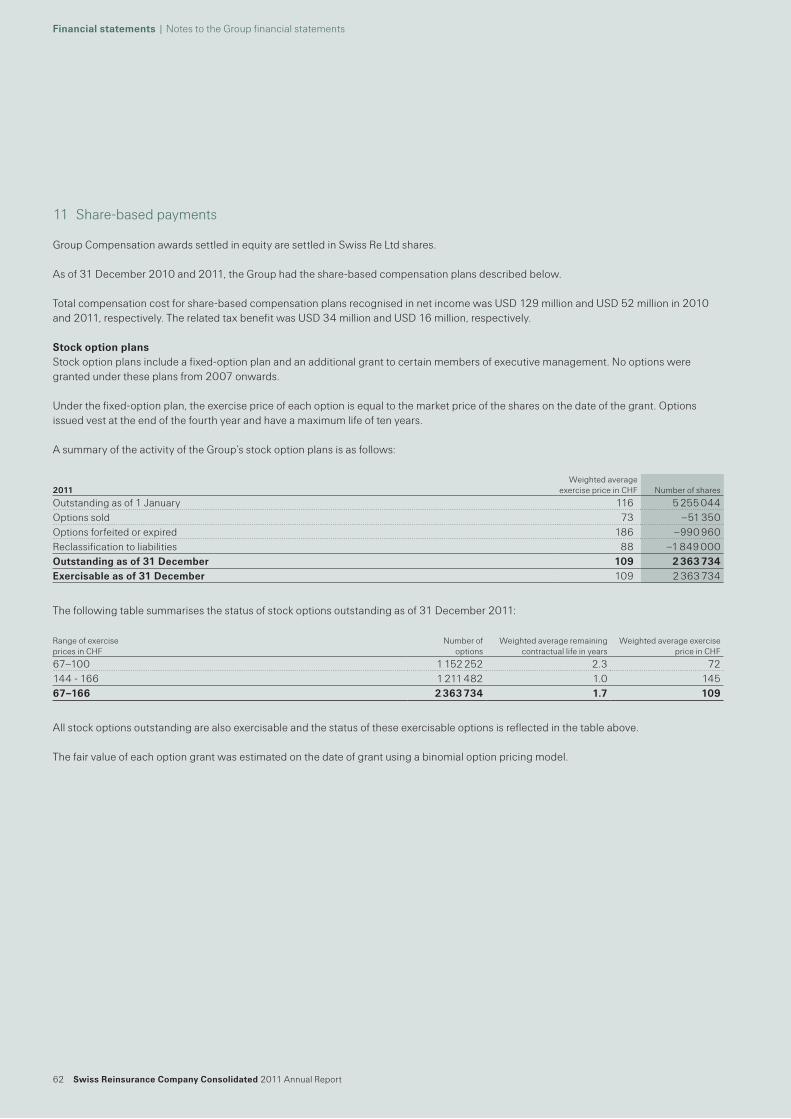
62 Swiss�Reinsurance�Company�Consolidated�2011 Annual Report
Financial�statements�| Notes to the Group financial statements
11 Share-based payments
Group Compensation awards settled in equity are settled in Swiss Re Ltd shares.
As of 31 December 2010 and 2011, the Group had the share-based compensation plans described below.
Total compensation cost for share-based compensation plans recognised in net income was USD 129 million and USD 52 million in 2010 and 2011, respectively. The related tax benefit was USD 34 million and USD 16 million, respectively.
Stock�option�plansStock option plans include a fixed-option plan and an additional grant to certain members of executive management. No options were granted under these plans from 2007 onwards.
Under the fixed-option plan, the exercise price of each option is equal to the market price of the shares on the date of the grant. Options issued vest at the end of the fourth year and have a maximum life of ten years.
A summary of the activity of the Group’s stock option plans is as follows:
The following table summarises the status of stock options outstanding as of 31 December 2011:
All stock options outstanding are also exercisable and the status of these exercisable options is reflected in the table above.
The fair value of each option grant was estimated on the date of grant using a binomial option pricing model.
2011Weighted average
exercise price in CHF
Number of shares
Outstanding as of 1 January 116 5 255 044Options sold 73 –51 350Options forfeited or expired 186 –990 960Reclassification to liabilities 88 –1 849 000Outstanding�as�of�31�December� 109 2�363�734Exercisable�as�of�31�December� 109 2 363 734
Range of exercise prices in CHF
Number of options
Weighted average remaining contractual life in years
Weighted average exercise price in CHF
67–100 1 152 252 2.3 72144 - 166 1 211 482 1.0 14567–166 2�363�734 1.7 109
� Swiss�Reinsurance�Company�Consolidated�2011 Annual Report 63
Financial�statements�| Notes to the Group financial statements
Restricted�sharesThe Group issued 3 727 and 14 834 restricted shares to selected employees in 2010 and 2011, respectively. Moreover, as an alternative to the Group’s cash bonus programme, 234 560 and 425 154 shares were issued during 2010 and 2011, respectively.
A summary of the movements in shares relating to outstanding awards granted under the restricted share plans as of 31 December 2011 is as follows:
The weighted average fair value of restricted shares, which equals the market price of the shares on the date of the grant, was CHF 65 and CHF 48 in 2010 and 2011, respectively.
Performance�share�planIn 2009 and 2010, the Group granted a share plan for the Chairman and Vice Chairman of the Board of Directors. The Group did not grant a further plan in 2011. The plans have a requisite service period of three years and are settled in shares. The plans are measured based on Swiss Re’s Total Shareholder Return (TSR), representing the share price performance plus paid dividend in any performance period, against a selected peer group. The final number of shares to be released upon vesting can vary between 0% and 150% of the original grant. The fair value of the 2009 and 2010 plans were based on the share price as of the date of grant, which was CHF 36.00 and CHF 53.60, respectively. 111 111 and 83 957 units were issued under these plans in 2009 and 2010, respectively, and the same number of units remains outstanding as of 31 December 2011.
Long-term�Incentive�planThe Group annually grants a Long-term Incentive plan (LTI) to selected employees with a three-year vesting period. The requisite service period as well as the maximum contractual term for each plan is three years and the final payment, if any, occurs at the end of this performance measurement period. The plan includes a payout factor which is derived from return on equity (ROE) and earnings per share (EPS) targets over the vesting period. The payout ratio can vary between 0 and 2 and the final payment for each plan will depend on whether the performance targets have been achieved over the plan period. The fair value of the plans are based on stochastic models which consider the likelihood of achieving performance targets and the impact of dividends. Each of the plan grants that were outstanding during 2011 is described below.
The 2008 LTI grant was expected to be settled in cash. The payout factors are driven by average ROE and EPS compound annual growth over the vesting period. The LTI grant from 2008 vested in March 2011 and there was no payout as the plan performance targets were not achieved.
The LTI plan granted in 2009 is expected to be settled in shares. The payout factor is driven by average ROE and EPS compound annual growth over the vesting period. At grant, the plan was expected to be settled in cash; however, the Group subsequently changed its intention to settle in shares. As a result, the share price used for measurement was CHF 42.40 which was set as of the date the share settlement decision was made in November 2009.
Number of sharesWeighted average
grant date fair value in CHF
Non-vested at 1 January 1 303 913 65Granted 439 988 58Delivery of restricted shares –963 713 76Outstanding�as�of�31�December� 780�188 48
64 Swiss�Reinsurance�Company�Consolidated�2011 Annual Report
Financial�statements�| Notes to the Group financial statements
The LTI plans granted in 2010 and 2011 are expected to be settled in shares. The payout factors are driven by average ROE and average EPS over the vesting period. The share price used for measurement is based on the date of grant and was CHF 48.15 and CHF 39.39 for the 2010 and 2011 plans, respectively.
Value�alignment�incentiveIn 2009, the Group issued a compensation plan to selected employees. The plan has a requisite service period of three years and is expected to be settled in cash and shares. The settlement is based on a three-year risk-free interest rate, the Swiss Re share price performance and dividend yield over the vesting period. The grant price was based on the closing share price as of 19 February 2009 of CHF 16.74. A total of 140 570 units were outstanding as of 1 January 2011, and after forfeitures during 2011, 131 361 units were outstanding as of 31 December 2011.
Stock�appreciation�rightsIn 2006, the Group issued 3 million stock appreciation rights (SAR) as an extraordinary grant following the Insurance Solutions acquisition. The plan was expected to be settled in cash. The requisite service period was two years, while the maximum contractual term was five years. The plan vested in 2008; however, holders of the award were still able to exercise their rights until the maximum contractual period expired, in 2011. The fair value of the appreciation rights were estimated at date of grant using a binomial option-pricing model and was revised at every balance sheet date until exercise. The plan expired in 2011 with no value.
Unrecognised�compensation�costsAs of 31 December 2011, the total unrecognised compensation cost (net of expected forfeitures) related to non-vested, share-based compensation awards was USD 31 million, and the weighted average period over which that cost is expected to be recognised was 1.7 years.
The number of shares authorised for the Group’s share-based payments to employees was 12 619 829 and 11 351 951 as of 31 December 2010 and 2011, respectively.
Employee�participation�planThe Group’s employee participation plan consists of a savings scheme lasting two or three years. Employees combine regular savings with the purchase of either actual or tracking options. The Group contributes to the employee savings over the period of the plan.
At maturity, either the employee receives shares or cash equal to the accumulated savings balance, or the employee may elect to exercise the options.
In 2010 and 2011, 656 569 and 1 878 895 options, respectively, were issued to employees and the Group contributed USD 67 million and USD 77 million, respectively, to the plan.

� Swiss�Reinsurance�Company�Consolidated�2011 Annual Report 65
Financial�statements�| Notes to the Group financial statements
This page intentionally left blank
66 Swiss Reinsurance Company Consolidated 2011 Annual Report
Financial statements | Notes to the Group financial statements
12 Commitments and contingent liabilities
Leasing commitmentsAs part of its normal business operations, the Group enters into a number of lease agreements. Such agreements, which are operating leases, total the following obligations for the next five years and thereafter:
The following schedule shows the composition of total rental expenses for all operating leases as of 31 December (except those with terms of a month or less that were not renewed):
Other commitmentsAs a participant in limited investment partnerships, the Group commits itself to making available certain amounts of investment funding, callable by the partnerships for periods of up to 10 years. The total commitments remaining uncalled as of 31 December 2011 were USD 1 243 million.
The Group enters into a number of contracts in the ordinary course of reinsurance and financial services business which, if the Group’s credit rating and /or defined statutory measures decline to certain levels, would require the Group to post collateral or obtain guarantees. The contracts typically provide alternatives for recapture of the associated business.
Legal proceedingsIn the normal course of business operations, the Group is involved in various claims, lawsuits and regulatory matters. In the opinion of management, the disposition of these or any other legal matters is not expected to have a material adverse effect on the Group’s business, consolidated financial position or results of operations.
As of 31 December 2011 USD millions
2012 752013 762014 712015 682016 60After 2016 395Total operating lease commitments 745Less minimum non-cancellable sublease rentals –63Total net future minimum lease commitments 682
USD millions 2010 2011
Minimum rentals 52 60Sublease rental income –3 –3Total 49 57
Swiss Reinsurance Company Consolidated 2011 Annual Report 67
Financial statements | Notes to the Group financial statements
13 Information on business segments
The Group provides reinsurance, insurance and capital market solutions for clients that complement its re /insurance offering throughout the world through its business segments. The business segments are determined by the organisational structure and by the way in which management reviews the operating result of the Group.
The Group presents three operating business segments: Property & Casualty, Life & Health and Asset Management. Items not allocated to these three business segments are included in the “Group items” column.
The Property & Casualty segment consists of the following sub-segments: Property traditional, Casualty traditional, Specialty traditional and Non-traditional business. The Property & Casualty business segment includes Property & Casualty insurance-linked securities, Environmental & Commodity Markets business and, in the Specialty traditional sub-segment, Credit Reinsurance, Bank Trade Finance, and Credit securitisations.
The Life & Health segment consists of the following sub-segments: Life traditional, Health traditional and Admin Re®. The Life & Health business segment includes variable annuity business and Life & Health insurance-linked securities.
The Asset Management business segment includes two separate sub-segments, Credit & Rates and Equity & Alternative Investments, resulting from the aggregation of Asset Management Risk Stripes. The Asset Management business segment includes proprietary returns on the Group’s invested fixed-income securities, equity securities and alternative investments.
Group items include certain costs of Corporate Centre functions not allocated to the business segments, certain foreign exchange items, interest expenses on operating and financial debt and other items not considered for the performance of the operating segments. From 1 January 2011 non-core activities which are largely in run-off (formerly presented in the business segment Legacy) are being reported within Group items. 2010 comparatives are presented accordingly.
Certain investment results, including investment income and realised gains on unit-linked business, with-profit business and reinsurance derivatives, are excluded from the performance of the Asset Management business segment and directly allocated to the Property & Casualty and Life & Health business segments.
The allocation of investment result to Property & Casualty and Life & Health is determined based on US GAAP re /insurance liabilities. The allocation methodology applies a risk-free return to the nominal net reserves at the end of the prior quarter. The risk-free interest rate applied to the reserves is determined by currency and duration of the underlying Property & Casualty and Life & Health reserves. The “Allocation” column eliminates the calculated investment result allocated to either the Property & Casualty or the Life & Health business segments.
The accounting policies of the business segments are in line with those described in the summary of significant accounting policies (see Note 1).
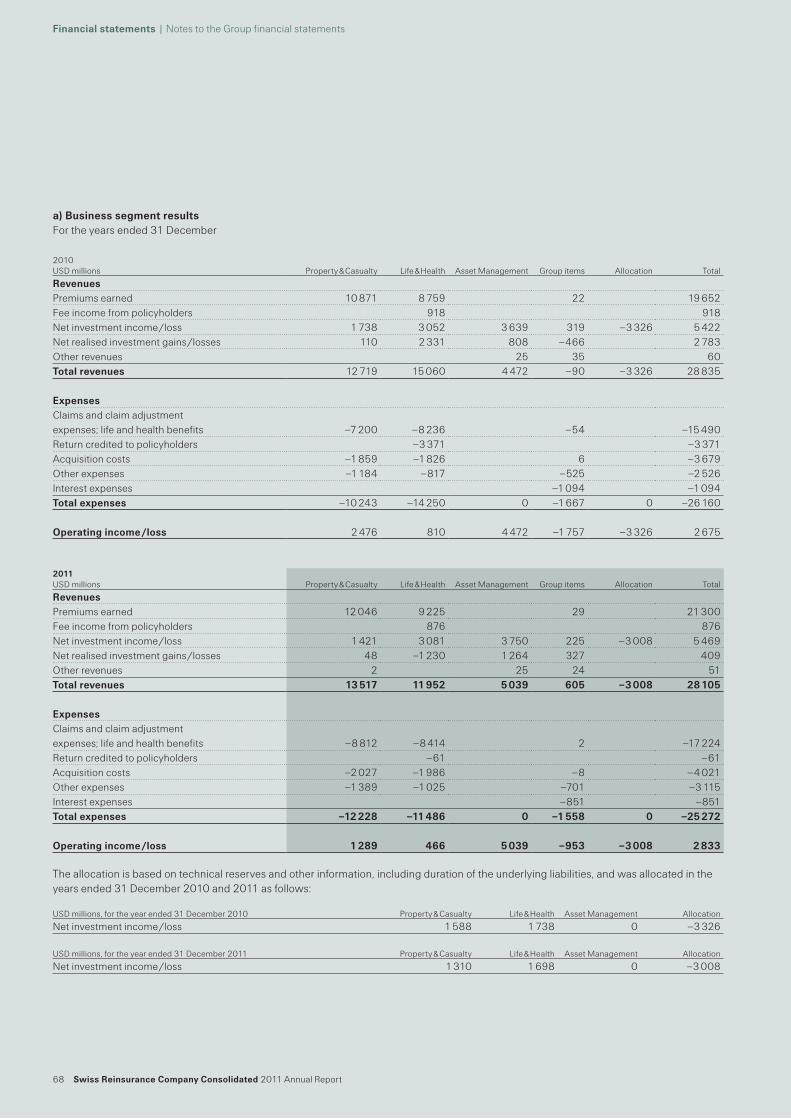
68 Swiss Reinsurance Company Consolidated 2011 Annual Report
Financial statements | Notes to the Group financial statements
a) Business segment resultsFor the years ended 31 December
2010 USD millions Property & Casualty Life & Health Asset Management Group items Allocation Total
RevenuesPremiums earned 10 871 8 759 22 19 652Fee income from policyholders 918 918Net investment income /loss 1 738 3 052 3 639 319 –3 326 5 422Net realised investment gains /losses 110 2 331 808 –466 2 783Other revenues 25 35 60Total revenues 12 719 15 060 4 472 –90 –3 326 28 835
ExpensesClaims and claim adjustment expenses; life and health benefits –7 200 –8 236 –54 –15 490Return credited to policyholders –3 371 –3 371Acquisition costs –1 859 –1 826 6 –3 679Other expenses –1 184 –817 –525 –2 526Interest expenses –1 094 –1 094Total expenses –10 243 –14 250 0 –1 667 0 –26 160
Operating income /loss 2 476 810 4 472 –1 757 –3 326 2 675
2011 USD millions Property & Casualty Life & Health Asset Management Group items Allocation Total
RevenuesPremiums earned 12 046 9 225 29 21 300Fee income from policyholders 876 876Net investment income /loss 1 421 3 081 3 750 225 –3 008 5 469Net realised investment gains /losses 48 –1 230 1 264 327 409Other revenues 2 25 24 51Total revenues 13 517 11 952 5 039 605 –3 008 28 105
ExpensesClaims and claim adjustment expenses; life and health benefits –8 812 –8 414 2 –17 224Return credited to policyholders –61 –61Acquisition costs –2 027 –1 986 –8 –4 021Other expenses –1 389 –1 025 –701 –3 115Interest expenses –851 –851Total expenses –12 228 –11 486 0 –1 558 0 –25 272
Operating income /loss 1 289 466 5 039 –953 –3 008 2 833
The allocation is based on technical reserves and other information, including duration of the underlying liabilities, and was allocated in the years ended 31 December 2010 and 2011 as follows:
USD millions, for the year ended 31 December 2010 Property & Casualty Life & Health Asset Management Allocation
Net investment income /loss 1 588 1 738 0 –3 326
USD millions, for the year ended 31 December 2011 Property & Casualty Life & Health Asset Management Allocation
Net investment income /loss 1 310 1 698 0 –3 008
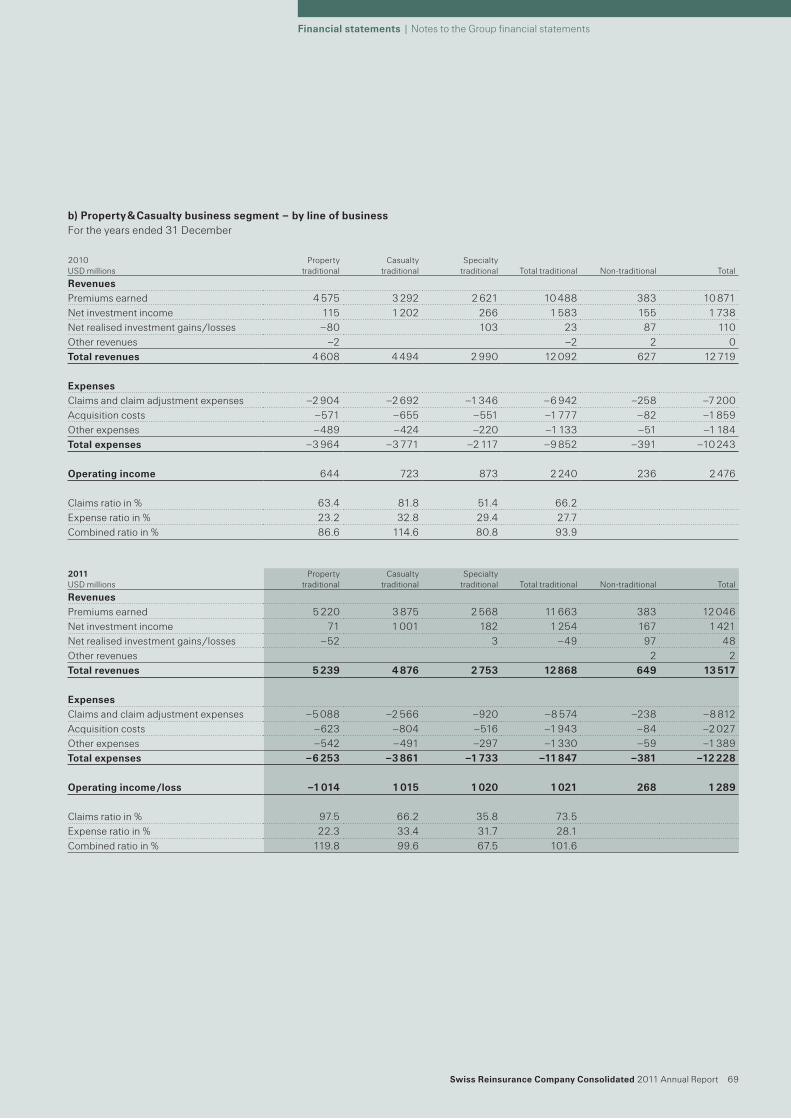
Swiss Reinsurance Company Consolidated 2011 Annual Report 69
Financial statements | Notes to the Group financial statements
b) Property & Casualty business segment – by line of businessFor the years ended 31 December
2010 USD millions
Property traditional
Casualty traditional
Specialty traditional Total traditional Non-traditional Total
RevenuesPremiums earned 4 575 3 292 2 621 10 488 383 10 871Net investment income 115 1 202 266 1 583 155 1 738Net realised investment gains /losses –80 103 23 87 110Other revenues –2 –2 2 0Total revenues 4 608 4 494 2 990 12 092 627 12 719
ExpensesClaims and claim adjustment expenses –2 904 –2 692 –1 346 –6 942 –258 –7 200Acquisition costs –571 –655 –551 –1 777 –82 –1 859Other expenses –489 –424 –220 –1 133 –51 –1 184Total expenses –3 964 –3 771 –2 117 –9 852 –391 –10 243
Operating income 644 723 873 2 240 236 2 476
Claims ratio in % 63.4 81.8 51.4 66.2Expense ratio in % 23.2 32.8 29.4 27.7Combined ratio in % 86.6 114.6 80.8 93.9
2011 USD millions
Property traditional
Casualty traditional
Specialty traditional Total traditional Non-traditional Total
RevenuesPremiums earned 5 220 3 875 2 568 11 663 383 12 046Net investment income 71 1 001 182 1 254 167 1 421Net realised investment gains /losses –52 3 –49 97 48Other revenues 2 2Total revenues 5 239 4 876 2 753 12 868 649 13 517
ExpensesClaims and claim adjustment expenses –5 088 –2 566 –920 –8 574 –238 –8 812Acquisition costs –623 –804 –516 –1 943 –84 –2 027Other expenses –542 –491 –297 –1 330 –59 –1 389Total expenses –6 253 –3 861 –1 733 –11 847 –381 –12 228
Operating income /loss –1 014 1 015 1 020 1 021 268 1 289
Claims ratio in % 97.5 66.2 35.8 73.5Expense ratio in % 22.3 33.4 31.7 28.1Combined ratio in % 119.8 99.6 67.5 101.6
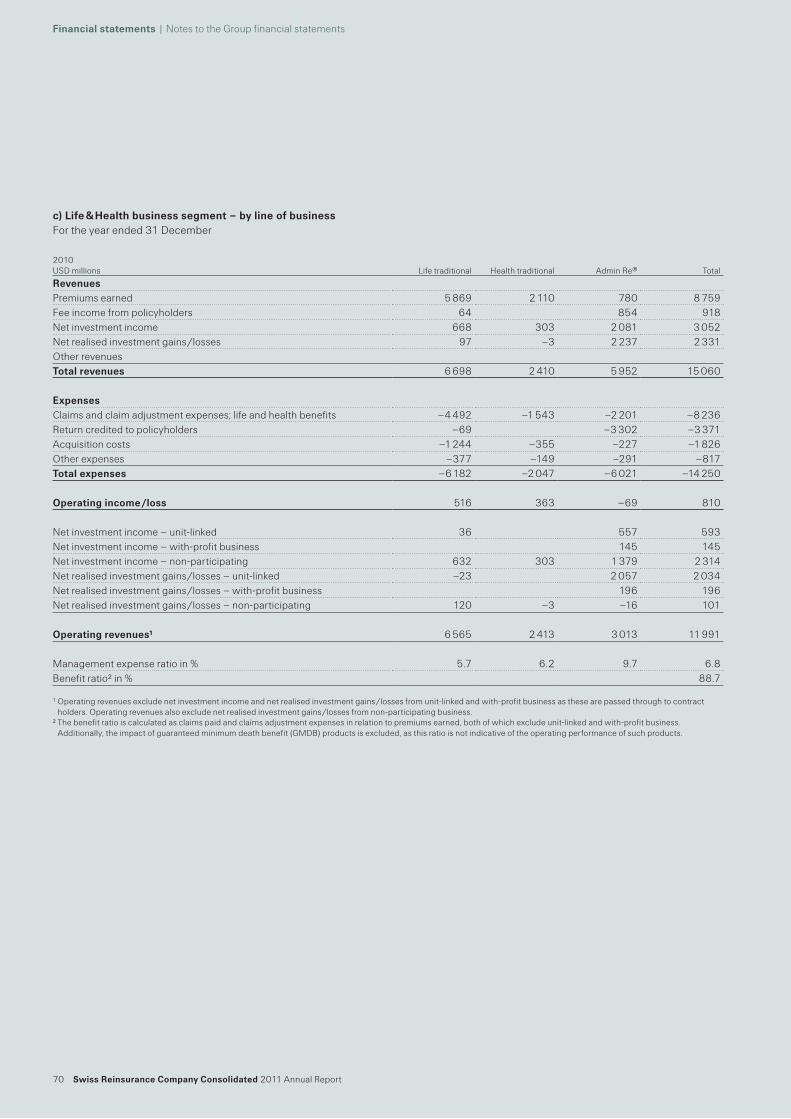
70 Swiss Reinsurance Company Consolidated 2011 Annual Report
Financial statements | Notes to the Group financial statements
c) Life & Health business segment – by line of business For the year ended 31 December
2010USD millions Life traditional Health traditional Admin Re® Total
RevenuesPremiums earned 5 869 2 110 780 8 759Fee income from policyholders 64 854 918Net investment income 668 303 2 081 3 052Net realised investment gains /losses 97 –3 2 237 2 331Other revenuesTotal revenues 6 698 2 410 5 952 15 060
ExpensesClaims and claim adjustment expenses; life and health benefits –4 492 –1 543 –2 201 –8 236Return credited to policyholders –69 –3 302 –3 371Acquisition costs –1 244 –355 –227 –1 826Other expenses –377 –149 –291 –817Total expenses –6 182 –2 047 –6 021 –14 250
Operating income /loss 516 363 –69 810
Net investment income – unit-linked 36 557 593Net investment income – with-profit business 145 145Net investment income – non-participating 632 303 1 379 2 314Net realised investment gains /losses – unit-linked –23 2 057 2 034Net realised investment gains /losses – with-profit business 196 196Net realised investment gains /losses – non-participating 120 –3 –16 101
Operating revenues1 6 565 2 413 3 013 11 991
Management expense ratio in % 5.7 6.2 9.7 6.8Benefit ratio2 in % 88.7
1 Operating revenues exclude net investment income and net realised investment gains /losses from unit-linked and with-profit business as these are passed through to contract holders. Operating revenues also exclude net realised investment gains /losses from non-participating business.
2 The benefit ratio is calculated as claims paid and claims adjustment expenses in relation to premiums earned, both of which exclude unit-linked and with-profit business. Additionally, the impact of guaranteed minimum death benefit (GMDB) products is excluded, as this ratio is not indicative of the operating performance of such products.
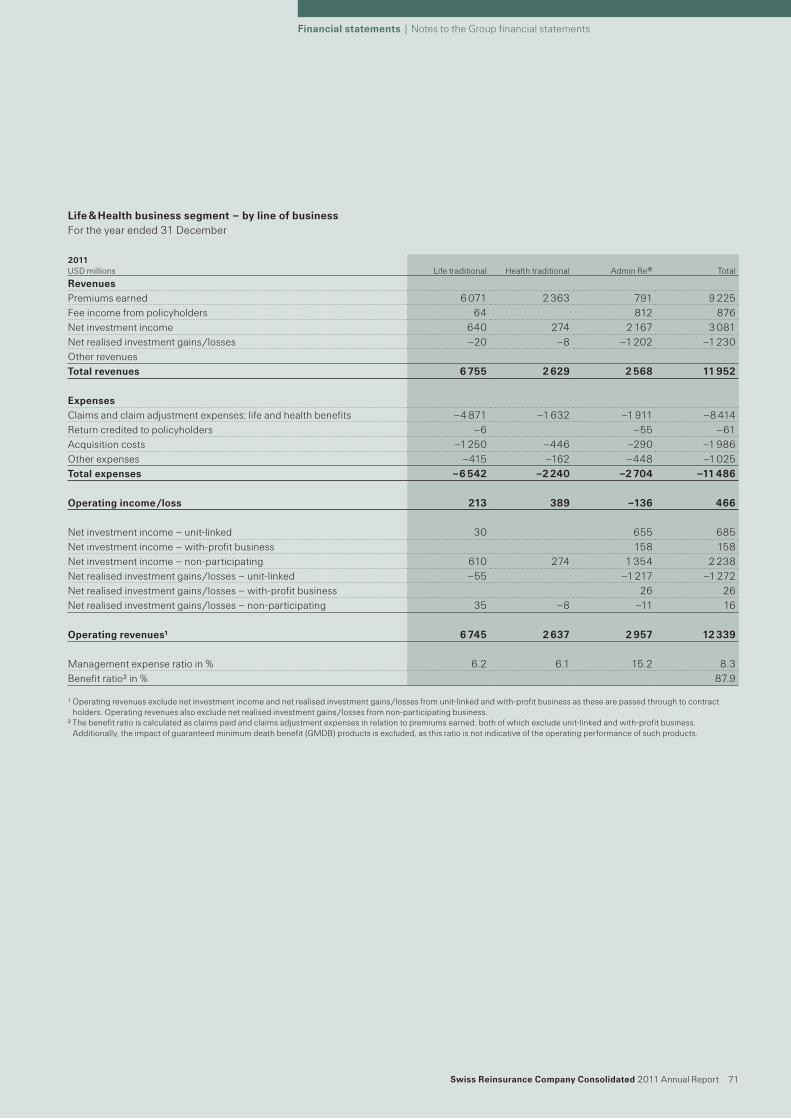
Swiss Reinsurance Company Consolidated 2011 Annual Report 71
Financial statements | Notes to the Group financial statements
Life & Health business segment – by line of business For the year ended 31 December
2011USD millions Life traditional Health traditional Admin Re® Total
RevenuesPremiums earned 6 071 2 363 791 9 225Fee income from policyholders 64 812 876Net investment income 640 274 2 167 3 081Net realised investment gains /losses –20 –8 –1 202 –1 230Other revenuesTotal revenues 6 755 2 629 2 568 11 952
ExpensesClaims and claim adjustment expenses; life and health benefits –4 871 –1 632 –1 911 –8 414Return credited to policyholders –6 –55 –61Acquisition costs –1 250 –446 –290 –1 986Other expenses –415 –162 –448 –1 025Total expenses –6 542 –2 240 –2 704 –11 486
Operating income /loss 213 389 –136 466
Net investment income – unit-linked 30 655 685Net investment income – with-profit business 158 158Net investment income – non-participating 610 274 1 354 2 238Net realised investment gains /losses – unit-linked –55 –1 217 –1 272Net realised investment gains /losses – with-profit business 26 26Net realised investment gains /losses – non-participating 35 –8 –11 16
Operating revenues1 6 745 2 637 2 957 12 339
Management expense ratio in % 6.2 6.1 15.2 8.3Benefit ratio2 in % 87.9
1 Operating revenues exclude net investment income and net realised investment gains /losses from unit-linked and with-profit business as these are passed through to contract holders. Operating revenues also exclude net realised investment gains /losses from non-participating business.
2 The benefit ratio is calculated as claims paid and claims adjustment expenses in relation to premiums earned, both of which exclude unit-linked and with-profit business. Additionally, the impact of guaranteed minimum death benefit (GMDB) products is excluded, as this ratio is not indicative of the operating performance of such products.
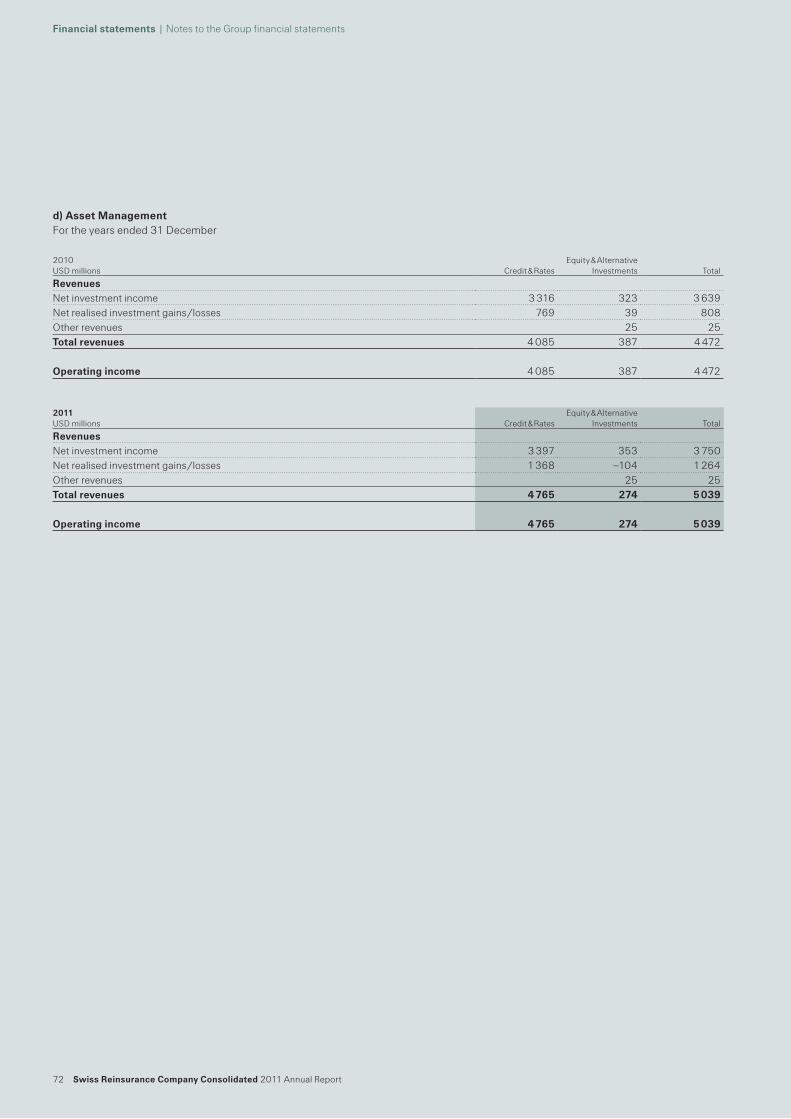
72 Swiss Reinsurance Company Consolidated 2011 Annual Report
Financial statements | Notes to the Group financial statements
d) Asset ManagementFor the years ended 31 December
2010 USD millions Credit & Rates
Equity & Alternative Investments Total
RevenuesNet investment income 3 316 323 3 639Net realised investment gains /losses 769 39 808Other revenues 25 25Total revenues 4 085 387 4 472
Operating income 4 085 387 4 472
2011 USD millions Credit & Rates
Equity & Alternative Investments Total
RevenuesNet investment income 3 397 353 3 750Net realised investment gains /losses 1 368 –104 1 264Other revenues 25 25Total revenues 4 765 274 5 039
Operating income 4 765 274 5 039
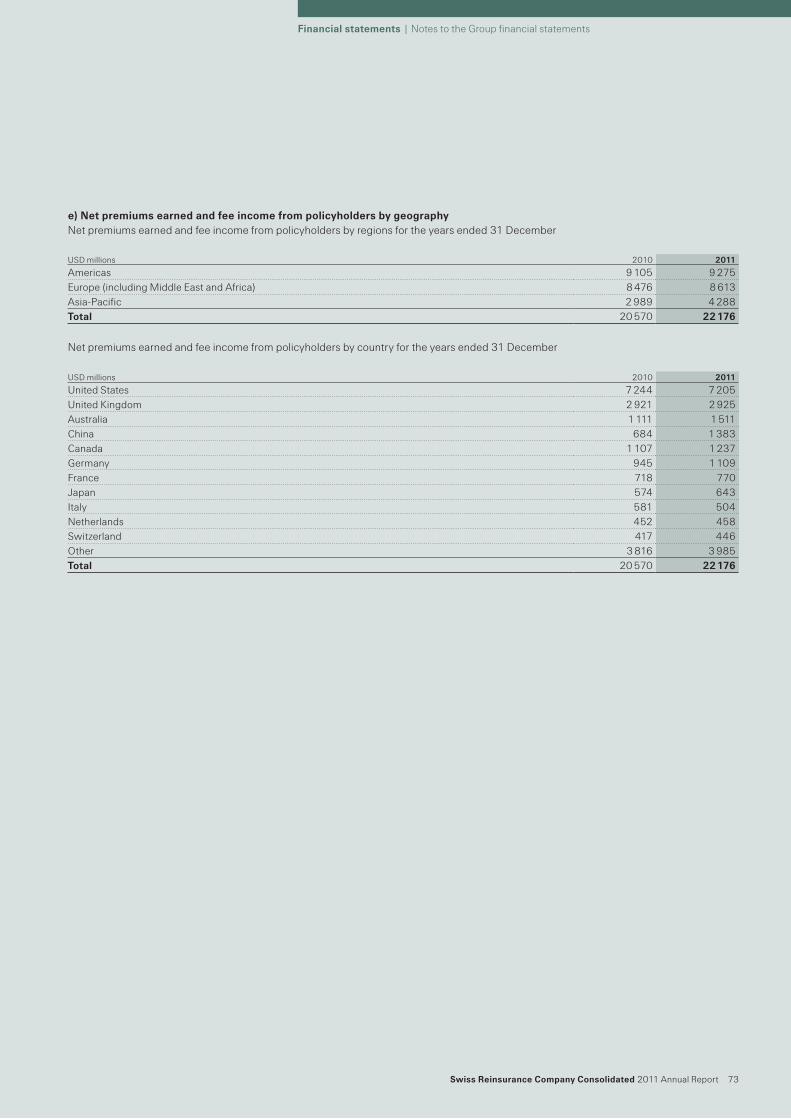
Swiss Reinsurance Company Consolidated 2011 Annual Report 73
Financial statements | Notes to the Group financial statements
e) Net premiums earned and fee income from policyholders by geographyNet premiums earned and fee income from policyholders by regions for the years ended 31 December
Net premiums earned and fee income from policyholders by country for the years ended 31 December
USD millions 2010 2011
United States 7 244 7 205United Kingdom 2 921 2 925Australia 1 111 1 511China 684 1 383Canada 1 107 1 237Germany 945 1 109France 718 770Japan 574 643Italy 581 504Netherlands 452 458Switzerland 417 446Other 3 816 3 985Total 20 570 22 176
USD millions 2010 2011
Americas 9 105 9 275Europe (including Middle East and Africa) 8 476 8 613Asia-Pacific 2 989 4 288Total 20 570 22 176
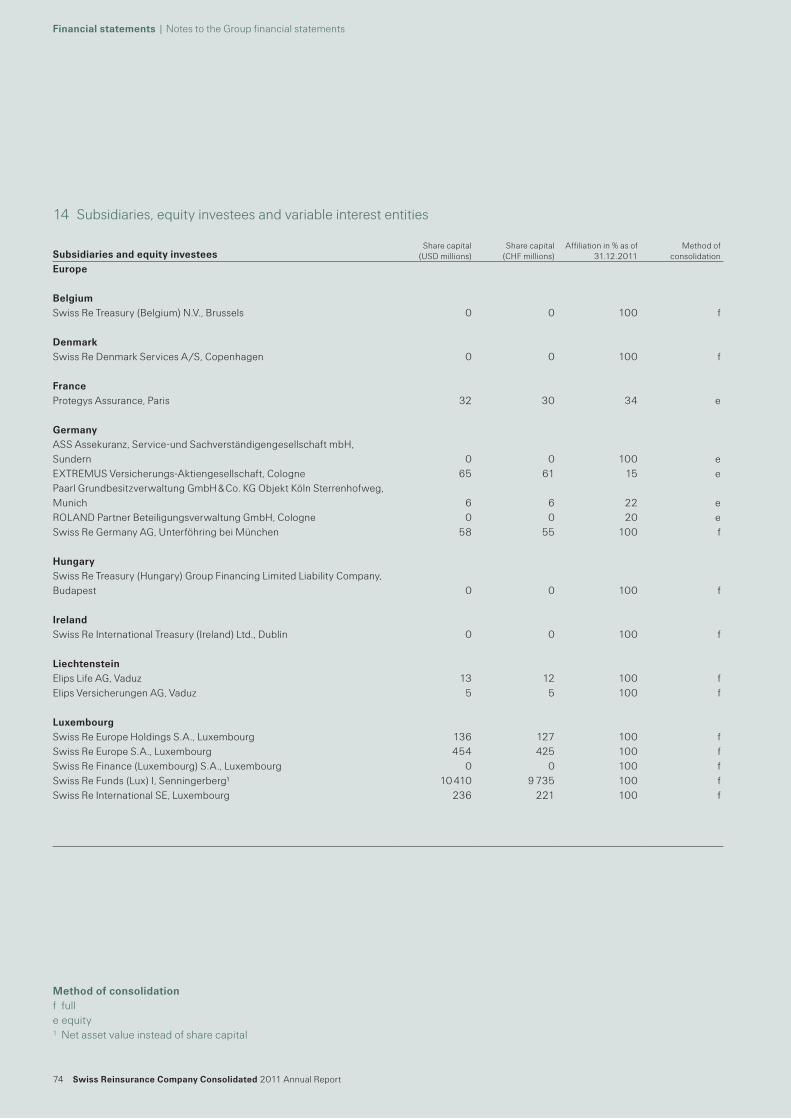
74 Swiss Reinsurance Company Consolidated 2011 Annual Report
Financial statements | Notes to the Group financial statements
14 Subsidiaries, equity investees and variable interest entities
Subsidiaries and equity investeesShare capital
(USD millions)Share capital
(CHF millions)Affiliation in % as of
31.12.2011Method of
consolidation
Europe
BelgiumSwiss Re Treasury (Belgium) N.V., Brussels 0 0 100 f
DenmarkSwiss Re Denmark Services A /S, Copenhagen 0 0 100 f
FranceProtegys Assurance, Paris 32 30 34 e
GermanyASS Assekuranz, Service-und Sachverständigengesellschaft mbH, Sundern 0 0 100 eEXTREMUS Versicherungs-Aktiengesellschaft, Cologne 65 61 15 ePaarl Grundbesitzverwaltung GmbH & Co. KG Objekt Köln Sterrenhofweg, Munich 6 6 22 eROLAND Partner Beteiligungsverwaltung GmbH, Cologne 0 0 20 eSwiss Re Germany AG, Unterföhring bei München 58 55 100 f
HungarySwiss Re Treasury (Hungary) Group Financing Limited Liability Company, Budapest 0 0 100 f
IrelandSwiss Re International Treasury (Ireland) Ltd., Dublin 0 0 100 f
LiechtensteinElips Life AG, Vaduz 13 12 100 fElips Versicherungen AG, Vaduz 5 5 100 f
LuxembourgSwiss Re Europe Holdings S.A., Luxembourg 136 127 100 fSwiss Re Europe S.A., Luxembourg 454 425 100 fSwiss Re Finance (Luxembourg) S.A., Luxembourg 0 0 100 fSwiss Re Funds (Lux) I, Senningerberg1 10 410 9 735 100 fSwiss Re International SE, Luxembourg 236 221 100 f
Method of consolidationf fulle equity1 Net asset value instead of share capital
14 Subsidiaries, equity investees and variable interest entities
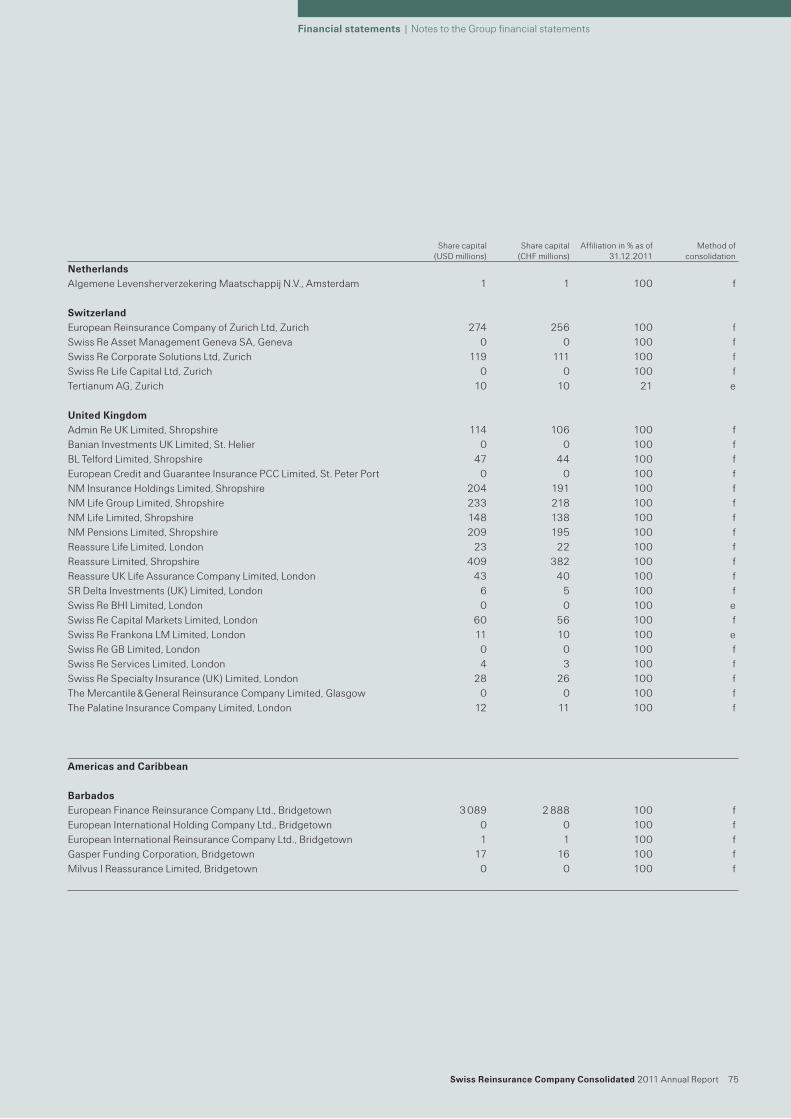
Swiss Reinsurance Company Consolidated 2011 Annual Report 75
Financial statements | Notes to the Group financial statements
Share capital (USD millions)
Share capital (CHF millions)
Affiliation in % as of 31.12.2011
Method of consolidation
NetherlandsAlgemene Levensherverzekering Maatschappij N.V., Amsterdam 1 1 100 f
SwitzerlandEuropean Reinsurance Company of Zurich Ltd, Zurich 274 256 100 fSwiss Re Asset Management Geneva SA, Geneva 0 0 100 fSwiss Re Corporate Solutions Ltd, Zurich 119 111 100 fSwiss Re Life Capital Ltd, Zurich 0 0 100 fTertianum AG, Zurich 10 10 21 e
United KingdomAdmin Re UK Limited, Shropshire 114 106 100 fBanian Investments UK Limited, St. Helier 0 0 100 fBL Telford Limited, Shropshire 47 44 100 fEuropean Credit and Guarantee Insurance PCC Limited, St. Peter Port 0 0 100 fNM Insurance Holdings Limited, Shropshire 204 191 100 fNM Life Group Limited, Shropshire 233 218 100 fNM Life Limited, Shropshire 148 138 100 fNM Pensions Limited, Shropshire 209 195 100 fReassure Life Limited, London 23 22 100 fReassure Limited, Shropshire 409 382 100 fReassure UK Life Assurance Company Limited, London 43 40 100 fSR Delta Investments (UK) Limited, London 6 5 100 fSwiss Re BHI Limited, London 0 0 100 eSwiss Re Capital Markets Limited, London 60 56 100 fSwiss Re Frankona LM Limited, London 11 10 100 eSwiss Re GB Limited, London 0 0 100 fSwiss Re Services Limited, London 4 3 100 fSwiss Re Specialty Insurance (UK) Limited, London 28 26 100 fThe Mercantile & General Reinsurance Company Limited, Glasgow 0 0 100 fThe Palatine Insurance Company Limited, London 12 11 100 f
Americas and Caribbean
BarbadosEuropean Finance Reinsurance Company Ltd., Bridgetown 3 089 2 888 100 fEuropean International Holding Company Ltd., Bridgetown 0 0 100 fEuropean International Reinsurance Company Ltd., Bridgetown 1 1 100 fGasper Funding Corporation, Bridgetown 17 16 100 fMilvus I Reassurance Limited, Bridgetown 0 0 100 f
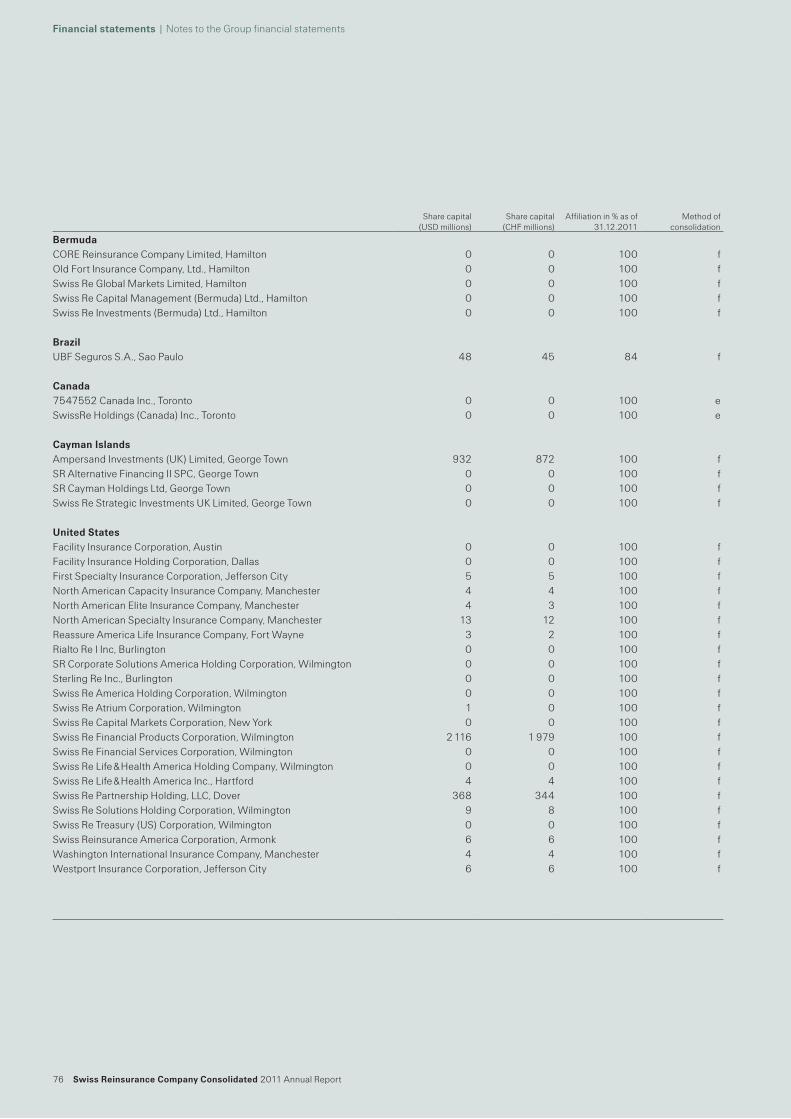
76 Swiss Reinsurance Company Consolidated 2011 Annual Report
Financial statements | Notes to the Group financial statements
Share capital (USD millions)
Share capital (CHF millions)
Affiliation in % as of 31.12.2011
Method of consolidation
BermudaCORE Reinsurance Company Limited, Hamilton 0 0 100 fOld Fort Insurance Company, Ltd., Hamilton 0 0 100 fSwiss Re Global Markets Limited, Hamilton 0 0 100 fSwiss Re Capital Management (Bermuda) Ltd., Hamilton 0 0 100 fSwiss Re Investments (Bermuda) Ltd., Hamilton 0 0 100 f
BrazilUBF Seguros S.A., Sao Paulo 48 45 84 f
Canada7547552 Canada Inc., Toronto 0 0 100 eSwissRe Holdings (Canada) Inc., Toronto 0 0 100 e
Cayman IslandsAmpersand Investments (UK) Limited, George Town 932 872 100 fSR Alternative Financing II SPC, George Town 0 0 100 fSR Cayman Holdings Ltd, George Town 0 0 100 fSwiss Re Strategic Investments UK Limited, George Town 0 0 100 f
United StatesFacility Insurance Corporation, Austin 0 0 100 fFacility Insurance Holding Corporation, Dallas 0 0 100 fFirst Specialty Insurance Corporation, Jefferson City 5 5 100 fNorth American Capacity Insurance Company, Manchester 4 4 100 fNorth American Elite Insurance Company, Manchester 4 3 100 fNorth American Specialty Insurance Company, Manchester 13 12 100 fReassure America Life Insurance Company, Fort Wayne 3 2 100 fRialto Re I Inc, Burlington 0 0 100 fSR Corporate Solutions America Holding Corporation, Wilmington 0 0 100 fSterling Re Inc., Burlington 0 0 100 fSwiss Re America Holding Corporation, Wilmington 0 0 100 fSwiss Re Atrium Corporation, Wilmington 1 0 100 fSwiss Re Capital Markets Corporation, New York 0 0 100 fSwiss Re Financial Products Corporation, Wilmington 2 116 1 979 100 fSwiss Re Financial Services Corporation, Wilmington 0 0 100 fSwiss Re Life & Health America Holding Company, Wilmington 0 0 100 fSwiss Re Life & Health America Inc., Hartford 4 4 100 fSwiss Re Partnership Holding, LLC, Dover 368 344 100 fSwiss Re Solutions Holding Corporation, Wilmington 9 8 100 fSwiss Re Treasury (US) Corporation, Wilmington 0 0 100 fSwiss Reinsurance America Corporation, Armonk 6 6 100 fWashington International Insurance Company, Manchester 4 4 100 fWestport Insurance Corporation, Jefferson City 6 6 100 f
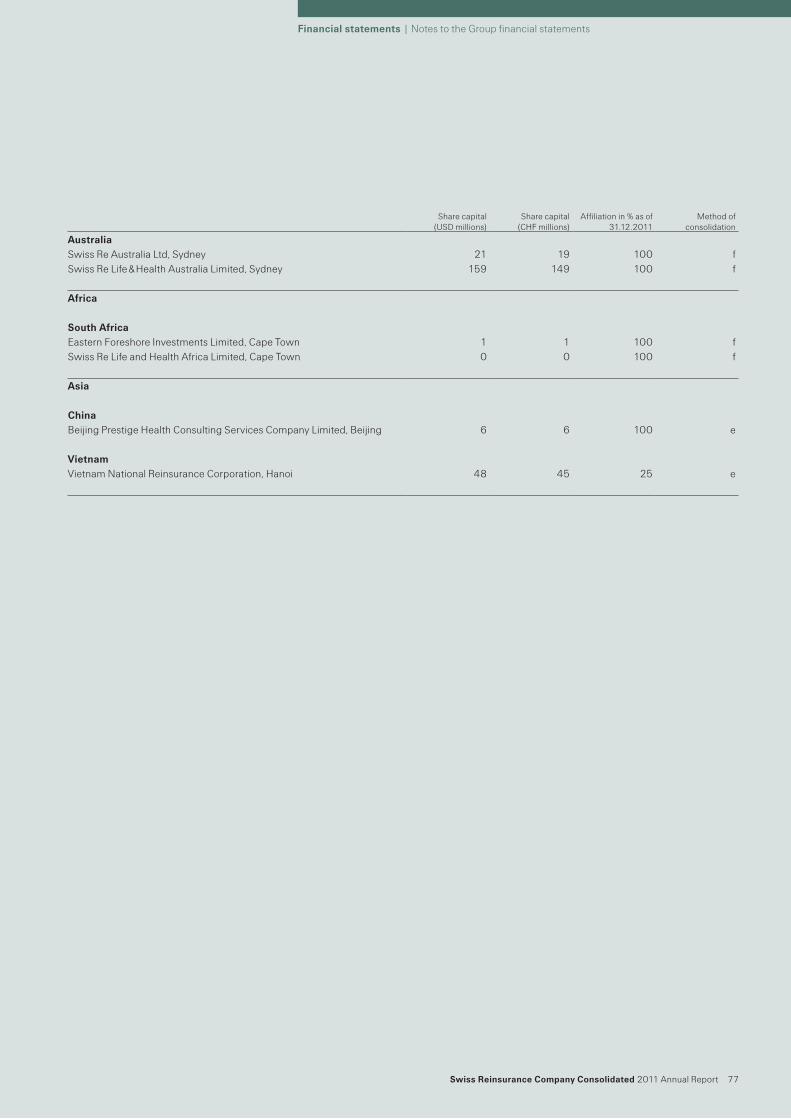
Swiss Reinsurance Company Consolidated 2011 Annual Report 77
Financial statements | Notes to the Group financial statements
Share capital (USD millions)
Share capital (CHF millions)
Affiliation in % as of 31.12.2011
Method of consolidation
AustraliaSwiss Re Australia Ltd, Sydney 21 19 100 fSwiss Re Life & Health Australia Limited, Sydney 159 149 100 f
Africa
South AfricaEastern Foreshore Investments Limited, Cape Town 1 1 100 fSwiss Re Life and Health Africa Limited, Cape Town 0 0 100 f
Asia
ChinaBeijing Prestige Health Consulting Services Company Limited, Beijing 6 6 100 e
VietnamVietnam National Reinsurance Corporation, Hanoi 48 45 25 e
78 Swiss Reinsurance Company Consolidated 2011 Annual Report
Financial statements | Notes to the Group financial statements
Variable interest entitiesThe Group enters into arrangements with variable interest entities (VIEs) in the normal course of business. The involvement ranges from being a passive investor to designing, structuring, and managing the VIEs. The variable interests held by the Group arise as a result of the Group’s involvement in a modified coinsurance agreement, certain insurance-linked and credit-linked securitisations, swaps in trusts, debt financing and other entities which meet the definition of a VIE.
When analysing the status of an entity, the Group mainly assesses if (1) the equity is sufficient to finance the entity’s activities without additional subordinated financial support, (2) the equity holders have the right to make significant decisions affecting the entity’s operations, and (3) the holders of the voting rights substantively participate in the gains and losses of the entity. When one of these criteria is not met, the entity is considered a VIE and needs to be assessed for consolidation under the VIE section of the Consolidation Topic.
The party that has a controlling financial interest is called the primary beneficiary and consolidates the VIE. An enterprise is deemed to have a controlling financial interest if it has both of the following: ̤ the power to direct the activities of the VIE that most significantly impact the entity’s economic performance; and ̤ the obligation to absorb losses of the entity that could potentially be significant to the VIE or the right to receive benefits from the entity
that could potentially be significant to the VIE.
The Group assesses for all its variable interests in VIEs whether it has a controlling financial interest in these entities and, thus, is the primary beneficiary. For this, the Group identifies the activities that most significantly impact the entity’s performance and determines whether the Group has the power to direct those activities. In conducting the analysis, the Group considers the purpose, the design, and the risks that the entity was designed to create and pass through to its variable interest holders. In a second step, the Group assesses if it has the obligation to absorb losses or if it has the right to receive benefits of the VIE that could potentially be significant to the entity. If both criteria are met, the Group has a controlling financial interest in the VIE and consolidates the entity.
Whenever facts and circumstances change, a review is undertaken of the impact these changes could have on the consolidation assessment previously performed. When the assessment might be impacted, a reassessment to determine the primary beneficiary is performed.
Swiss Reinsurance Company Consolidated 2011 Annual Report 79
Financial statements | Notes to the Group financial statements
Modified coinsurance agreementThe Group assumes insurance risk via a modified coinsurance agreement from a direct insurer which qualifies as a VIE. The Group assumes the majority of the mortality and investment risk in the VIE. In addition, the Group has the power over the investment management and policyholder administration. As these are the activities that most significantly impact the entity’s economic performance, the Group qualifies as the primary beneficiary and consolidates the entity. The Group will incur losses if mortality risk or the investment returns of the entity develop unfavourably.
The total assets of the modified coinsurance vehicles in which the Group is the primary beneficiary were USD 3 473 million as of 31 December 2011.
Insurance-linked and credit-linked securitisationsThe insurance-linked and credit-linked securitisations transfer pre-existing insurance or credit risk to the capital markets through the issuance of insurance-linked or credit-linked securities. In insurance-linked securitisations, the securitisation vehicle assumes the insurance risk through insurance or derivative contracts. In credit-linked securitisations, the securitisation vehicle assumes the credit risk through credit default swaps. The securitisation vehicle generally retains the issuance proceeds as collateral. The collateral held predominantly consists of investment-grade securities.
Typically, the variable interests held by the Group arise through ownership of insurance-linked and credit-linked securities, or through protection provided under a total return swap for the principal of the collateral held by the securitisation vehicle.
Generally, the activities of a securitisation vehicle are pre-determined at formation. There are substantially no ongoing activities during the life of the VIE that could significantly impact the economic performance of the vehicle. Consequently, the main focus to identify the primary beneficiary is on the activities performed and decisions made when the VIE was designed. Typically, the Group is considered the primary beneficiary of a securitisation vehicle when the Group acts as a sponsor of risk passed to the VIE and enters at the same time in a total return swap with the VIE to protect the VIE’s assets from market risk. Under the total return swap, the Group would incur losses when some or all of the securities held as collateral in the securitisation vehicle decline in value or default. Therefore, the Group’s maximum exposure to loss equals the principal amount of the collateral protected under the total return swap.
As of 31 December 2011, the total assets of the insurance-linked and credit-linked securitisation vehicles in which the Group holds variable interests but is not the primary beneficiary were USD 2 587 million. The total assets of the vehicles in which the Group is the primary beneficiary were USD 730 million.
Swaps in trustsThe Group provides risk management services to certain asset securitisation trusts which qualify as VIEs. As the involvement of the Group is limited to interest rate and foreign exchange derivatives, the Group does not have power to direct any activities of the trusts and therefore does not qualify as primary beneficiary of any of these trusts. These activities are in run-off.
Debt financing vehiclesDebt financing vehicles issue preference shares or loan notes to provide the Group with funding. The Group is partially exposed to the asset risk by holding equity rights or by protecting some of the assets held by the VIEs via guarantees or derivative contracts. The assets held by the VIEs consist of investment-grade securities, structured products, hedge fund units, derivatives and others.
The Group consolidates certain debt financing vehicles as it has power over the investment management in the vehicles, which is considered to be the activity that most significantly impacts the entities’ economic performance. In addition, the Group absorbs the variability of the investment return so that both criteria for a controlling financial interest are met.
The total assets of the debt financing vehicles in which the Group is the primary beneficiary were USD 7 051 million as of 31 December 2011.
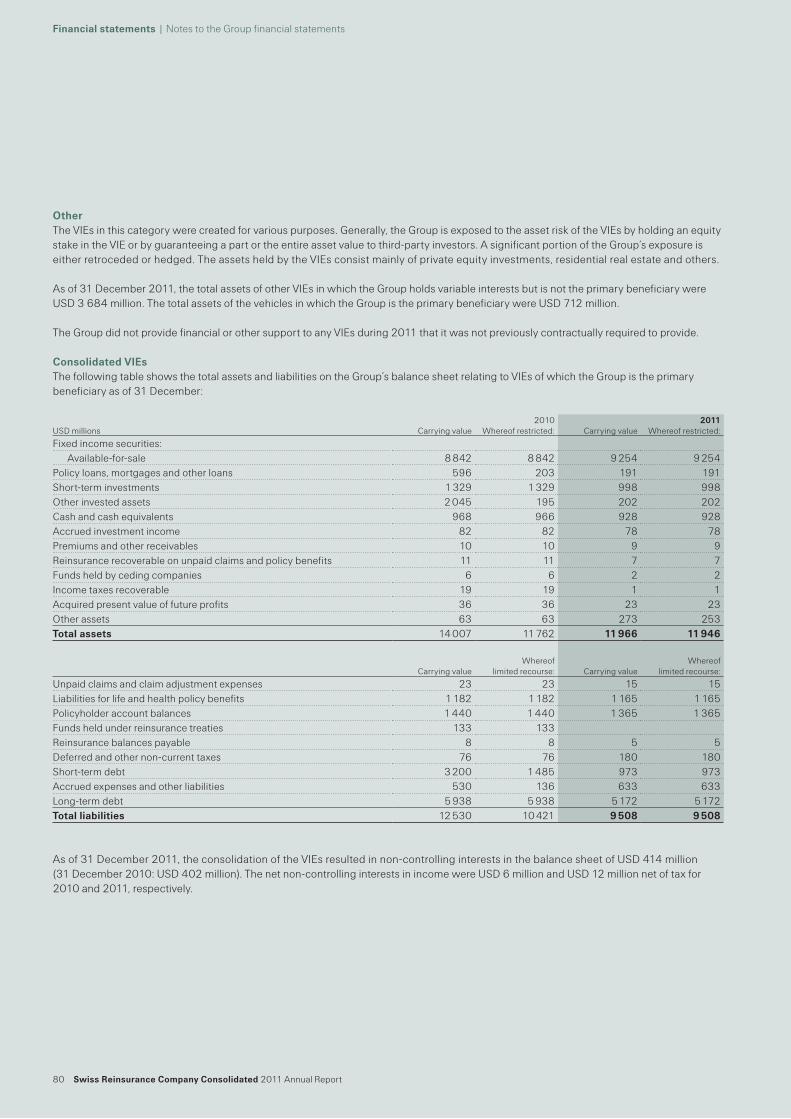
80 Swiss Reinsurance Company Consolidated 2011 Annual Report
Financial statements | Notes to the Group financial statements
2010 2011USD millions Carrying value Whereof restricted: Carrying value Whereof restricted:
Fixed income securities:Available-for-sale 8 842 8 842 9 254 9 254
Policy loans, mortgages and other loans 596 203 191 191Short-term investments 1 329 1 329 998 998Other invested assets 2 045 195 202 202Cash and cash equivalents 968 966 928 928Accrued investment income 82 82 78 78Premiums and other receivables 10 10 9 9Reinsurance recoverable on unpaid claims and policy benefits 11 11 7 7Funds held by ceding companies 6 6 2 2Income taxes recoverable 19 19 1 1Acquired present value of future profits 36 36 23 23Other assets 63 63 273 253Total assets 14 007 11 762 11 966 11 946
Carrying valueWhereof
limited recourse: Carrying valueWhereof
limited recourse:
Unpaid claims and claim adjustment expenses 23 23 15 15Liabilities for life and health policy benefits 1 182 1 182 1 165 1 165Policyholder account balances 1 440 1 440 1 365 1 365Funds held under reinsurance treaties 133 133Reinsurance balances payable 8 8 5 5Deferred and other non-current taxes 76 76 180 180Short-term debt 3 200 1 485 973 973Accrued expenses and other liabilities 530 136 633 633Long-term debt 5 938 5 938 5 172 5 172Total liabilities 12 530 10 421 9 508 9 508
OtherThe VIEs in this category were created for various purposes. Generally, the Group is exposed to the asset risk of the VIEs by holding an equity stake in the VIE or by guaranteeing a part or the entire asset value to third-party investors. A significant portion of the Group’s exposure is either retroceded or hedged. The assets held by the VIEs consist mainly of private equity investments, residential real estate and others.
As of 31 December 2011, the total assets of other VIEs in which the Group holds variable interests but is not the primary beneficiary were USD 3 684 million. The total assets of the vehicles in which the Group is the primary beneficiary were USD 712 million.
The Group did not provide financial or other support to any VIEs during 2011 that it was not previously contractually required to provide.
Consolidated VIEsThe following table shows the total assets and liabilities on the Group’s balance sheet relating to VIEs of which the Group is the primary beneficiary as of 31 December:
As of 31 December 2011, the consolidation of the VIEs resulted in non-controlling interests in the balance sheet of USD 414 million (31 December 2010: USD 402 million). The net non-controlling interests in income were USD 6 million and USD 12 million net of tax for 2010 and 2011, respectively.
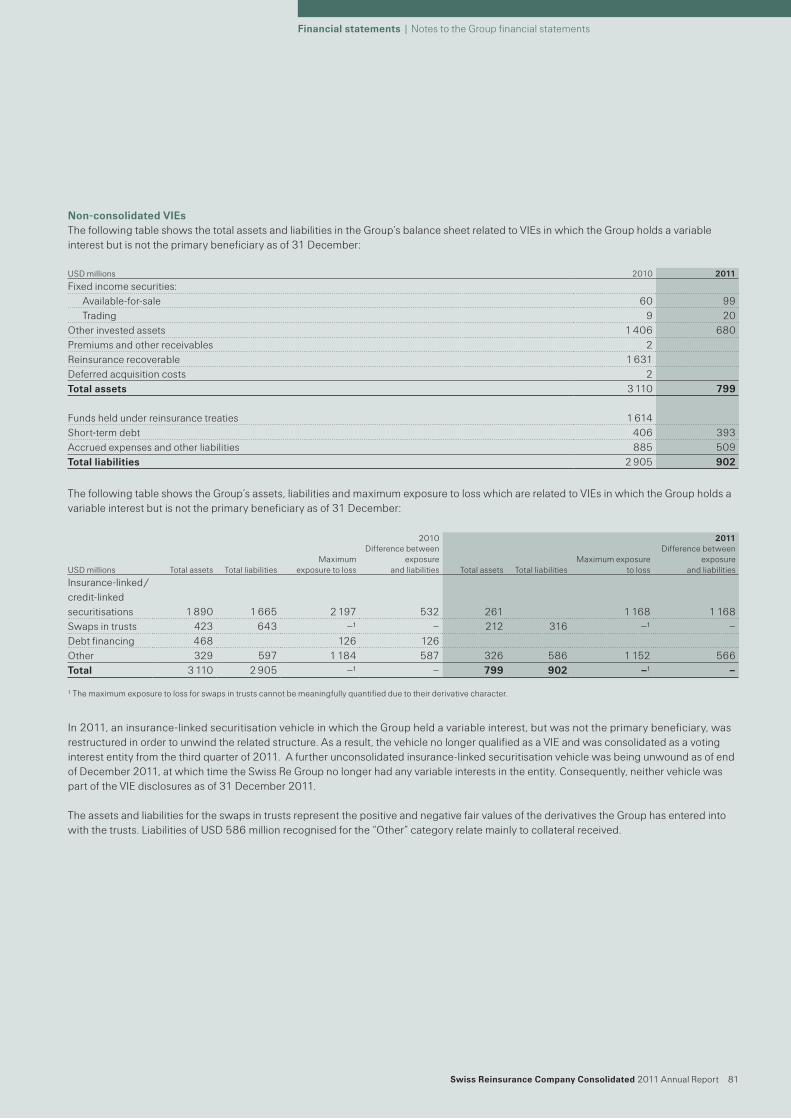
Swiss Reinsurance Company Consolidated 2011 Annual Report 81
Financial statements | Notes to the Group financial statements
Non-consolidated VIEsThe following table shows the total assets and liabilities in the Group’s balance sheet related to VIEs in which the Group holds a variable interest but is not the primary beneficiary as of 31 December:
The following table shows the Group’s assets, liabilities and maximum exposure to loss which are related to VIEs in which the Group holds a variable interest but is not the primary beneficiary as of 31 December:
In 2011, an insurance-linked securitisation vehicle in which the Group held a variable interest, but was not the primary beneficiary, was restructured in order to unwind the related structure. As a result, the vehicle no longer qualified as a VIE and was consolidated as a voting interest entity from the third quarter of 2011. A further unconsolidated insurance-linked securitisation vehicle was being unwound as of end of December 2011, at which time the Swiss Re Group no longer had any variable interests in the entity. Consequently, neither vehicle was part of the VIE disclosures as of 31 December 2011.
The assets and liabilities for the swaps in trusts represent the positive and negative fair values of the derivatives the Group has entered into with the trusts. Liabilities of USD 586 million recognised for the “Other” category relate mainly to collateral received.
USD millions 2010 2011
Fixed income securities:Available-for-sale 60 99Trading 9 20
Other invested assets 1 406 680Premiums and other receivables 2Reinsurance recoverable 1 631Deferred acquisition costs 2Total assets 3 110 799
Funds held under reinsurance treaties 1 614Short-term debt 406 393Accrued expenses and other liabilities 885 509Total liabilities 2 905 902
2010 2011
USD millions Total assets Total liabilities Maximum
exposure to loss
Difference between exposure
and liabilities Total assets Total liabilitiesMaximum exposure
to loss
Difference between exposure
and liabilities
Insurance-linked /credit-linked securitisations 1 890 1 665 2 197 532 261 1 168 1 168Swaps in trusts 423 643 –1 – 212 316 –1 –Debt financing 468 126 126Other 329 597 1 184 587 326 586 1 152 566Total 3 110 2 905 –1 – 799 902 –1 –
1 The maximum exposure to loss for swaps in trusts cannot be meaningfully quantified due to their derivative character.

82 Swiss Reinsurance Company Consolidated 2011 Annual Report
Financial statements | Notes to the Group financial statements
This page intentionally left blank
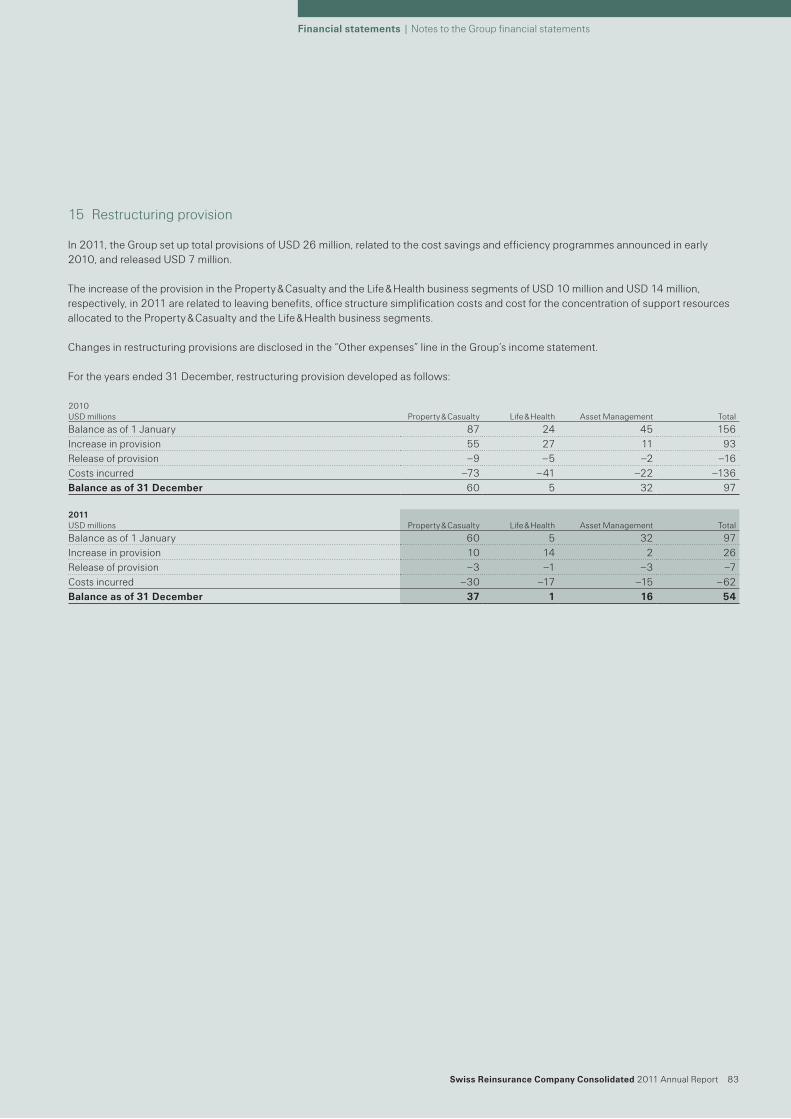
Swiss Reinsurance Company Consolidated 2011 Annual Report 83
Financial statements | Notes to the Group financial statements
15 Restructuring provision
In 2011, the Group set up total provisions of USD 26 million, related to the cost savings and efficiency programmes announced in early 2010, and released USD 7 million.
The increase of the provision in the Property & Casualty and the Life & Health business segments of USD 10 million and USD 14 million, respectively, in 2011 are related to leaving benefits, office structure simplification costs and cost for the concentration of support resources allocated to the Property & Casualty and the Life & Health business segments.
Changes in restructuring provisions are disclosed in the “Other expenses” line in the Group’s income statement.
For the years ended 31 December, restructuring provision developed as follows:
2010 USD millions Property & Casualty Life & Health Asset Management Total
Balance as of 1 January 87 24 45 156Increase in provision 55 27 11 93Release of provision –9 –5 –2 –16Costs incurred –73 –41 –22 –136Balance as of 31 December 60 5 32 97
2011 USD millions Property & Casualty Life & Health Asset Management Total
Balance as of 1 January 60 5 32 97Increase in provision 10 14 2 26Release of provision –3 –1 –3 –7Costs incurred –30 –17 –15 –62Balance as of 31 December 37 1 16 54
84 Swiss Reinsurance Company Consolidated 2011 Annual Report
Financial statements | Notes to the Group financial statements
16 Risk assessment
Article 663b sub-para. 12 of the Swiss Code of Obligations requires disclosure of information on the performance of a risk assessment.
The bodies and committees mentioned below belong to the Swiss Re Group as the identification, assessment and control of risk exposures of the Swiss Reinsurance Company Group is integrated in and covered by the Group risk management organisation and processes of Swiss Re Group.
The Board of Directors of Swiss Re Ltd is ultimately responsible for the Group’s governance principles and policies, including approval of the Group’s overall risk tolerance. The Board mainly deals with risk management through two committees: ̤ The Finance and Risk Committee is responsible for reviewing the Group Risk Policy and capacity limits, as well as for monitoring risk
tolerance and reviewing top risk issues and exposures. ̤ The Audit Committee is responsible for overseeing internal controls and compliance procedures.
The Group Executive Committee (Group EC) is responsible for implementing the risk management framework through fourfurther committees: ̤ The Group Risk and Capital Committee has responsibility for allocating capital and insurance risk capacity, approving investment risk
limits, and determining changes to the internal risk and capital methodology. ̤ The Group Asset-Liability Committee oversees the management of Swiss Re’s balance sheet, in particular its liquidity, capital and funding
positions and related policies. ̤ The Group Products and Limits Committee determines Swiss Re’s product policy and standards, sets reinsurance and counterparty credit
risk limits, and decides on large or non-standard transactions. ̤ The Group Regulatory Committee is the central information and coordination platform for regulatory matters and compliance. It ensures a
consistent approach to external communication on regulatory issues.
The Group Chief Risk Officer, who is a member of the Group EC, reports directly to the Group CEO as well as to the Board’s Finance and Risk Committee. The Group Chief Risk Officer participates in the four committees described above and chairs both the Group Risk and Capital Committee and the Group Regulatory Committee. In addition, the Group Chief Risk Officer leads the global Risk Management function, which is responsible for risk oversight and control across the Group.
The global Risk Management function operates through dedicated units for property and casualty risk, life and health risk, and financial market and credit risk. Each unit is entrusted with Group-wide responsibility for identifying, assessing and controlling their allocated risks and for risk governance at the risk category level. The units also work closely with each other, where necessary, on transaction reviews and other cross-category issues. Actuarial management is an integral part of the insurance risk units, ensuring reserving adequacy.
Senior managers of business and corporate units are responsible for managing operational risks in their area of activity, based on a centrally coordinated methodology. Their self-assessments are reviewed and challenged by operational risk specialists in partnership with the dedicated risk management units. Risk management experts also review the Group’s underwriting decision processes.
Liquidity risk, capital adequacy, and emerging risks are managed at Group level. Risk management activities that are also performed globally at Group level, across all risk categories include risk governance, risk modelling, risk reporting and the steering of the Group’s regulatory activities. Swiss Re’s Group Internal Audit department carries out independent, objective assessments of the adequacy and effectiveness of internal control systems. It evaluates the execution of processes within Swiss Re, including those within Risk Management.
The Compliance function is principally responsible for overseeing Swiss Re’s compliance with applicable laws, regulations, rules and the Code of Conduct, as well as management of Compliance Risk. It serves to assist the Board of Directors, the Executive Committee and Management in discharging their respective duties to effectively identify, mitigate and manage Compliance Risks.
The Risk Management function continuously reviews Swiss Re’s organisation in order to ensure alignment with the Group’s structure.

Swiss Reinsurance Company Consolidated 2011 Annual Report 85
Financial statements | Notes to the Group financial statements
This page intentionally left blank
86 Swiss Reinsurance Company Consolidated 2011 Annual Report
Financial statements | Notes to the Group financial statements
Report of the statutory auditorto the General Meeting ofSwiss Reinsurance Company LtdZurich
Report of the statutory auditor on the consolidated financial statementsAs statutory auditor, we have audited the consolidated financial statements of Swiss Re Group, which comprise the income statement, balance sheet, statement of shareholders’ equity, statement of comprehensive income, statement of cash flow, and notes (pages 3 to 85) for the year ended 31 December 2011.
Board of Directors’ responsibilityThe Board of Directors is responsible for the preparation and fair presentation of the consolidated financial statements in accordance with accounting principles generally accepted in the United States of America (US GAAP) and the requirements of Swiss law. This responsibility includes designing, implementing and maintaining an internal control system relevant to the preparation and fair presentation of consolidated financial statements that are free from material misstatement, whether due to fraud or error. The Board of Directors is further responsible for selecting and applying appropriate accounting policies and making accounting estimates that are reasonable in the circumstances.
Auditor’s responsibilityOur responsibility is to express an opinion on these consolidated financial statements based on our audit. We conducted our audit in accordance with Swiss law, Swiss Auditing Standards and auditing standards generally accepted in the United States of America. Those standards require that we plan and perform the audit to obtain reasonable assurance whether the consolidated financial statements are free from material misstatement.
An audit involves performing procedures to obtain audit evidence about the amounts and disclosures in the consolidated financial statements. The procedures selected depend on the auditor’s judgment, including the assessment of the risks of material misstatement of the consolidated financial statements, whether due to fraud or error. In making those risk assessments, the auditor considers the internal control system relevant to the entity’s preparation and fair presentation of the consolidated financial statements in order to design audit procedures that are appropriate in the circumstances, but not for the purpose of expressing an opinion on the effectiveness of the entity’s internal control system. An audit also includes evaluating the appropriateness of the accounting policies used and the reasonableness of accounting estimates made, as well as evaluating the overall presentation of the consolidated financial statements. We believe that the audit evidence we have obtained is sufficient and appropriate to provide a basis for our audit opinion.
OpinionIn our opinion, the consolidated financial statements for the year ended 31 December 2011 present fairly, in all material respects, the financial position, the results of operations and the cash flows in accordance with accounting principles generally accepted in the United States of America (US GAAP) and comply with Swiss law.
Report of the statutory auditor
Swiss Reinsurance Company Consolidated 2011 Annual Report 87
Financial statements | Notes to the Group financial statements
Report on other legal requirementsWe confirm that we meet the legal requirements on licensing according to the Auditor Oversight Act (AOA) and independence (article 728 CO and article 11 AOA) and that there are no circumstances incompatible with our independence.
In accordance with article 728a paragraph 1 item 3 CO and Swiss Auditing Standard 890, we confirm that an internal control system exists which has been designed for the preparation of consolidated financial statements according to the instructions of the Board of Directors.
We recommend that the consolidated financial statements submitted to you be approved.
PricewaterhouseCoopers AG
Alex Finn Dawn M Kink Audit expert Auditor in charge
Zurich, 15 March 2012
88 Swiss Reinsurance Company Ltd 2011 Annual Report
Financial statements
Reinsurance and sub-holding companySwiss Reinsurance Company Ltd (the Company), domiciled in Zurich, Switzerland, performs a dual role within the Swiss Re Group as both a reinsurance company and a sub-holding company. In conjunction with the restructuring of the Swiss Re Group, Swiss Re Ltd was incorporated on 2 February 2011 and established as the new ultimate holding company of the Swiss Re Group through an exchange offer. Swiss Reinsurance Company Ltd shareholders were offered the opportunity to exchange their shares in Swiss Reinsurance Company Ltd for shares in Swiss Re Ltd on a one-for-one basis. Effective 20 May 2011, Swiss Re Ltd became the ultimate holding company of the Swiss Re Group, and hence Swiss Reinsurance Company Ltd became a fully owned subsidiary of Swiss Re Ltd. The shares of Swiss Reinsurance Company Ltd were delisted from the SIX Swiss Exchange on 8 December 2011.
Financial year 2011The after-tax loss for the 2011 financial year amounted to CHF 63 million, compared to a profit of CHF 380 million in the previous year.
The business year under report was characterised by the establishment of the new corporate structure. Hence, the Company’s investment portfolio in subsidiaries and affiliated companies showed considerable movements, as well as impacted the corresponding income statement lines. Along with the restructuring, the technical result was impacted by various recaptures of reinsurance treaties by affiliated companies of the Company in the life and health business.
Property and casualty was significantly impacted by the extraordinary accumulation of natural catastrophe events but benefited from successful renewals and new business written following these losses.
In 2011, the Swiss franc fluctuated against the majority of the main currencies which markedly affected the comparison of year-on-year reported income statement and balance sheet figures.
Reinsurance resultThe total reinsurance result amounted to a gain of CHF 3.0 billion, compared to a gain of CHF 1.3 billion in 2010.
Premiums earned decreased from CHF 12.2 billion to CHF 8.8 billion in the year under report. Without the effect of foreign exchange movements, total premiums earned amounted to CHF 10.1 billion in 2011. Property and casualty premiums earned declined from CHF 6.3 billion in 2010 to CHF 5.6 billion in 2011, mainly driven by a weakening of most of our underlying business currencies against the Swiss franc resulting in a negative impact of CHF 0.8 billion. This deterioration was partially offset by successful renewals and new business written, notably with large clients in Asia.
Premium volume for life and health business decreased significantly from CHF 5.9 billion in 2010 to CHF 3.2 billion in 2011, driven by non-recurring initial premiums received in 2010 for the integration of the life and health portfolio of a subsidiary of the Company into a branch of Swiss Reinsurance Company Ltd. Excluding this one-off transaction and foreign exchange movements, life and health premiums earned increased by 4%.
Claims and claim adjustment expenses increased significantly from CHF 7.8 billion in 2010 to CHF 10.0 billion in 2011. Without the effect of foreign exchange movements, total claims and claim adjustment expenses amounted to CHF 11.6 billion in 2011. This financial year was driven by extraordinary natural catastrophe losses including floods and cyclones in Australia, earthquakes in New Zealand, earthquakes and tsunami in Japan, tornados and hurricane Irene in the US, and floods in Thailand. Nevertheless, claims and claim adjustment expenses for property and casualty decreased during 2011 by CHF 1.0 billion to CHF 3.1 billion benefiting from more retrocession coverage, positive claims experience as well as the deterioration of most currencies against the Swiss franc with an impact of CHF 0.5 billion.
Life and health claims and claim adjustment expenses rose by CHF 3.2 billion to CHF 6.9 billion in 2011, primarily driven by recaptures of reinsurance treaties with affiliated companies of the Company, but partially offset by the recapture of the external retrocession treaty with ALPSII. In return, these transactions reduced the Company’s liability for life and health benefits, partially offset by less favourable mortality, of CHF 6.4 billion. In the financial year 2010, life and health claims and claim adjustment expenses as well as life and health benefits, included in the result of the initial recognition of the technical provisions assumed at the inception of a portfolio from a subsidiary of the Company, offset the initial premium received.
Annual ReportSwiss Reinsurance Company Ltd
Swiss Reinsurance Company Ltd 2011 Annual Report 89
Financial statements | Swiss Reinsurance Company Ltd
Investment resultThe net investment result declined by CHF 2.6 billion to a loss of CHF 2.3 billion in 2011.
Investment income increased by CHF 1.6 billion to CHF 4.9 billion. This increase was mostly driven by higher dividend income and higher realised gains on derivative financial instruments which hedged the life and health variable annuity business.
In 2011, investment expenses increased by CHF 4.5 billion to CHF 6.6 billion, mainly as a result of valuation adjustments on investments in subsidiaries and affiliated companies in conjunction with the restructuring of the Swiss Re Group and higher valuation adjustments on derivative financial instruments related to reinsurance business.
Other income and expensesOther net expenses decreased by CHF 0.5 billion to CHF 0.6 billion in 2011. The decrease mainly consisted of the one-time termination expense in 2010 for the convertible perpetual capital instrument (CPCI) issued to National Indemnity Company, a subsidiary of Berkshire Hathaway Inc., and reduced trademark license fee income. Since the establishment of the new ultimate holding company, Swiss Reinsurance Company Ltd did not receive any trademark license fee income, but paid license fees to Swiss Re Ltd instead.
The Company has revised the classification between certain income statement categories. Specifically, the capital tax and indirect taxes of CHF 68 million were reclassified in 2011 from tax expense to other expenses. Therefore, the previously reported 2010 figures of tax expense and other expenses with a respective amount of CHF 60 million have been reclassified accordingly.
AssetsCompared to 2010, total assets decreased 12% to CHF 83.9 billion. Without the effect of foreign exchange movements, total assets amounted to CHF 84.1 billion.
As a result of the restructuring, investments in subsidiaries and affiliated companies increased by CHF 1.2 billion reflecting various capital contributions, partially offset by valuation adjustments as well as capital repayments.
The repayment of the CPCI to National Indemnity Company in early 2011 resulted in higher balances of cash and short-term investments as of 2010, compared to the year under report.
Various recaptures of reinsurance treaties in the life and health business caused the funds held to decrease by CHF 6.3 billion to CHF 11.4 billion. The increase in other assets related mostly to security lending collateral and reverse repurchase transactions.
LiabilitiesIn comparison to 2010, total liabilities decreased 13% to CHF 66.2 billion. Without the effect of foreign exchange movements, total liabilities amounted to CHF 66.4 billion.
Technical provisions declined 13% to CHF 37.9 billion. Life and health policy benefits decreased significantly, mainly as a result of the recaptures of reinsurance treaties by affiliated companies of the Company, partially offset by the recapture of the retrocession treaty with ALPSII. Life and health unpaid claims remained stable compared to 2010. Property and casualty gross unpaid claims increased by 8% mainly due to the 2011 natural catastrophe events. As a result of these losses the equalisation provision of CHF 0.6 billion was completely released in the year under report.
Debts decreased significantly to CHF 7.0 billion as a result of the redemption of the CPCI issued in 2009 to National Indemnity Company. The redemption agreement was signed effective 2010 with a repayment of CHF 3.7 billion in early 2011. Liabilities from derivative financial instruments increased mainly due to derivatives in connection with the life and health variable annuity business.
90 Swiss Reinsurance Company Ltd 2011 Annual Report
Financial statements | Swiss Reinsurance Company Ltd
Shareholder’s equityAs of 31 December 2010, shareholder’s equity amounted to CHF 18.8 billion before allocation of the disposable profit. After the dividend payment of CHF 943 million for 2010, and the inclusion of the loss for the 2011 financial year, shareholder’s equity decreased to CHF 17.8 billion at the end of 2011.
As a result of guidance issued by the Swiss Federal Tax Administration in connection with the capital contribution principle introduced in Swiss Tax Law, which became effective as of 1 January 2011, the Annual General Meeting on 15 April 2011 approved a reclassification of reserves of CHF 9 762 million from other reserves to legal reserves from capital contributions on the Company’s stand-alone balance sheet as of 31 December 2010.
As of 31 December 2011, legal reserves from capital contributions decreased to CHF 8 995 million due to the net effect of the dividend payment of CHF 943 million, the inclusion of additional reserves from newly issued shares and a reclassification from other reserves to legal reserves from capital contributions of issuance costs related to capital increases in previous years.
The nominal share capital of the Company increased slightly due to newly issued shares from the conditional capital for employee participation programmes. As of 31 December 2011, the nominal share capital amounted to CHF 37 million.
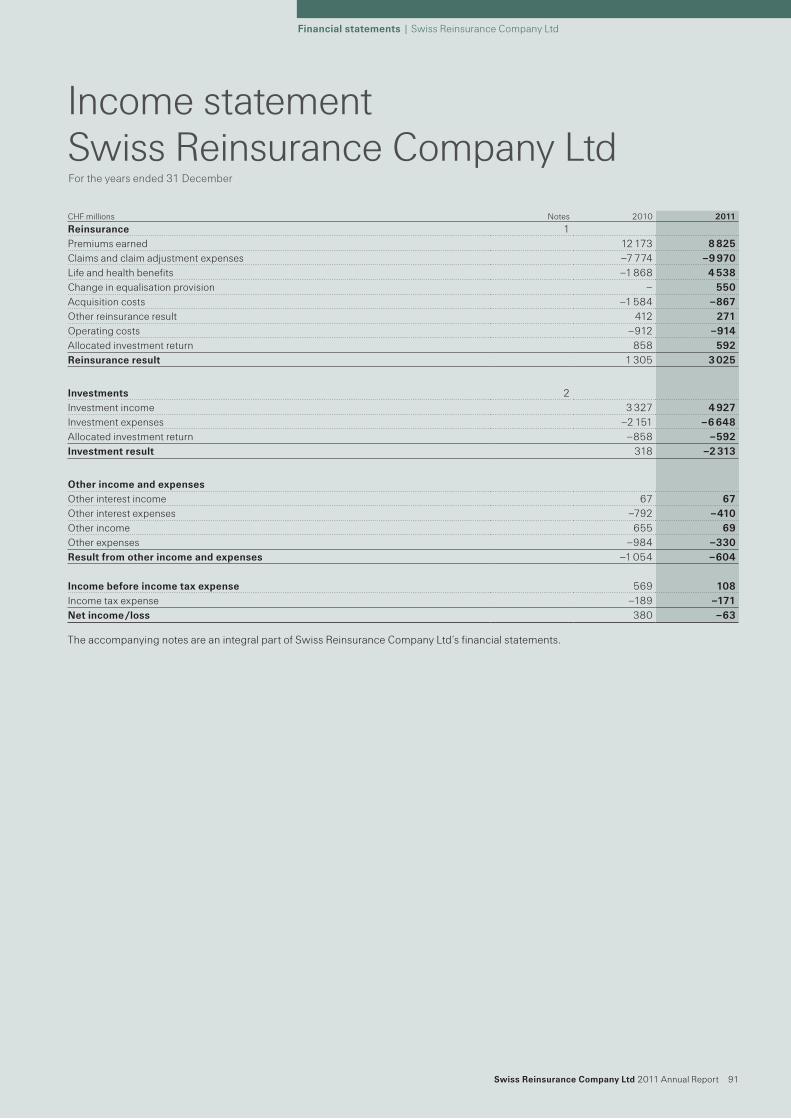
Swiss Reinsurance Company Ltd 2011 Annual Report 91
Financial statements | Swiss Reinsurance Company Ltd
The accompanying notes are an integral part of Swiss Reinsurance Company Ltd’s financial statements.
CHF millions Notes 2010 2011
Reinsurance 1 Premiums earned 12 173 8 825Claims and claim adjustment expenses –7 774 –9 970Life and health benefits –1 868 4 538Change in equalisation provision – 550Acquisition costs –1 584 –867Other reinsurance result 412 271Operating costs –912 –914Allocated investment return 858 592Reinsurance result 1 305 3 025
Investments 2Investment income 3 327 4 927Investment expenses –2 151 –6 648Allocated investment return –858 –592Investment result 318 –2 313
Other income and expenses Other interest income 67 67Other interest expenses –792 –410Other income 655 69Other expenses –984 –330Result from other income and expenses –1 054 –604 Income before income tax expense 569 108Income tax expense –189 –171Net income /loss 380 –63
Income statementSwiss Reinsurance Company LtdFor the years ended 31 December
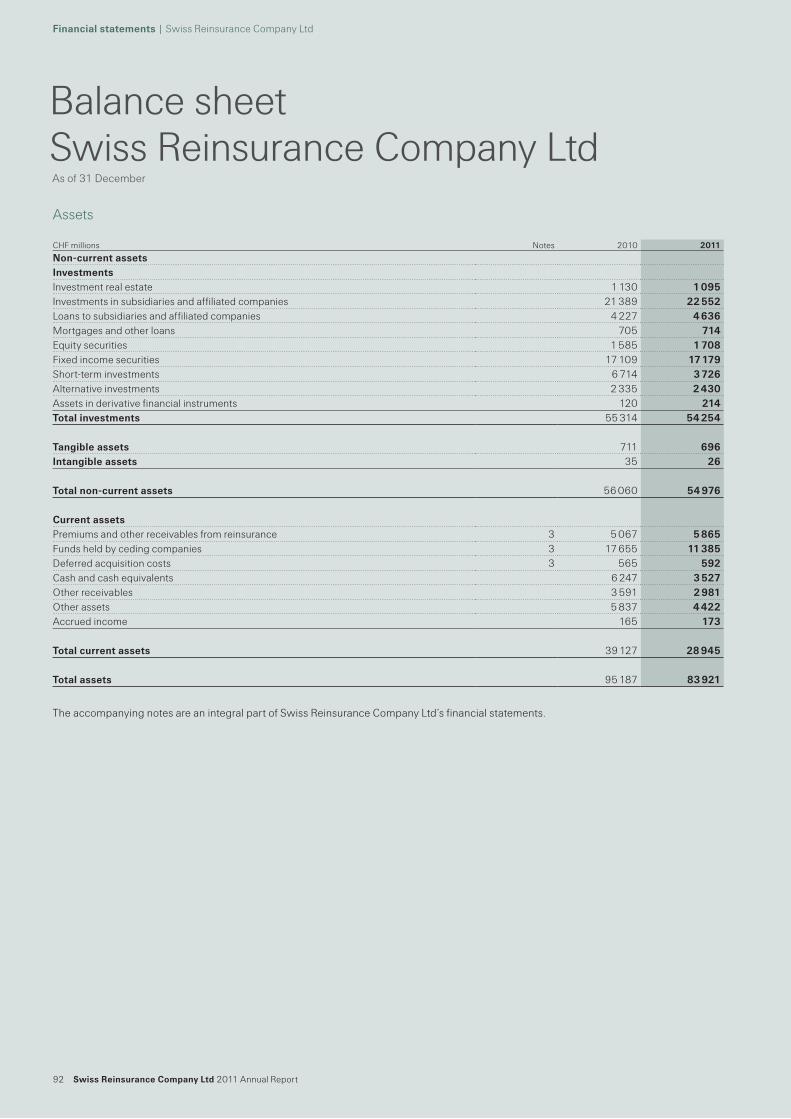
92 Swiss Reinsurance Company Ltd 2011 Annual Report
Financial statements | Swiss Reinsurance Company Ltd
Balance sheetSwiss Reinsurance Company Ltd As of 31 December
Assets
The accompanying notes are an integral part of Swiss Reinsurance Company Ltd’s financial statements.
CHF millions Notes 2010 2011
Non-current assets Investments Investment real estate 1 130 1 095Investments in subsidiaries and affiliated companies 21 389 22 552Loans to subsidiaries and affiliated companies 4 227 4 636Mortgages and other loans 705 714Equity securities 1 585 1 708Fixed income securities 17 109 17 179Short-term investments 6 714 3 726Alternative investments 2 335 2 430Assets in derivative financial instruments 120 214Total investments 55 314 54 254
Tangible assets 711 696Intangible assets 35 26 Total non-current assets 56 060 54 976
Current assets Premiums and other receivables from reinsurance 3 5 067 5 865Funds held by ceding companies 3 17 655 11 385Deferred acquisition costs 3 565 592Cash and cash equivalents 6 247 3 527Other receivables 3 591 2 981Other assets 5 837 4 422Accrued income 165 173 Total current assets 39 127 28 945 Total assets 95 187 83 921
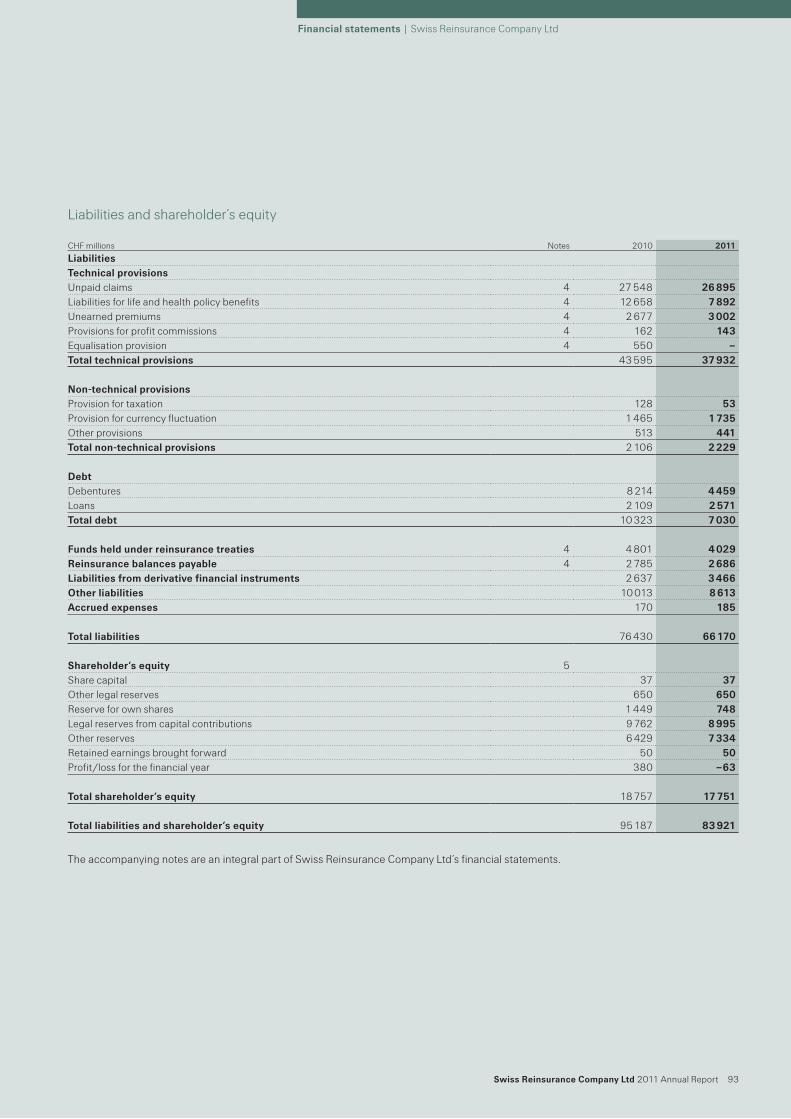
Swiss Reinsurance Company Ltd 2011 Annual Report 93
Financial statements | Swiss Reinsurance Company Ltd
Liabilities and shareholder’s equity
The accompanying notes are an integral part of Swiss Reinsurance Company Ltd’s financial statements.
CHF millions Notes 2010 2011
Liabilities Technical provisions Unpaid claims 4 27 548 26 895Liabilities for life and health policy benefits 4 12 658 7 892Unearned premiums 4 2 677 3 002Provisions for profit commissions 4 162 143Equalisation provision 4 550 –Total technical provisions 43 595 37 932
Non-technical provisions Provision for taxation 128 53Provision for currency fluctuation 1 465 1 735Other provisions 513 441Total non-technical provisions 2 106 2 229
Debt Debentures 8 214 4 459Loans 2 109 2 571Total debt 10 323 7 030
Funds held under reinsurance treaties 4 4 801 4 029Reinsurance balances payable 4 2 785 2 686Liabilities from derivative financial instruments 2 637 3 466Other liabilities 10 013 8 613Accrued expenses 170 185 Total liabilities 76 430 66 170
Shareholder’s equity 5Share capital 37 37Other legal reserves 650 650Reserve for own shares 1 449 748Legal reserves from capital contributions 9 762 8 995Other reserves 6 429 7 334Retained earnings brought forward 50 50Profit /loss for the financial year 380 –63 Total shareholder’s equity 18 757 17 751 Total liabilities and shareholder’s equity 95 187 83 921
94 Swiss Reinsurance Company Ltd 2011 Annual Report
Financial statements | Swiss Reinsurance Company Ltd
Basis of presentationThe financial statements are prepared in accordance with Swiss Company Law.
Time periodThe 2011 financial year comprises the accounting period from 1 January 2011 to 31 December 2011.
Use of estimates in the preparation of annual accountsThe preparation of the annual accounts requires management to make significant estimates and assumptions that affect the reported amounts of assets, liabilities, income and expenses as well as the related disclosures. Actual results could differ significantly from these estimates.
Foreign currency translationAssets and liabilities denominated in foreign currencies are converted into Swiss francs at year-end exchange rates with the exception of significant participations which are maintained in Swiss francs at historical exchange rates.
Income and expenses are converted into Swiss francs at average exchange rates for the reporting year.
All exchange rate differences arising from the revaluation of the opening balance sheet, the adjustments from application of year-end or average rates and foreign exchange transactions are booked to the provision for currency fluctuation. Recognition through the income statement only occurs when the provision is not sufficient to absorb a negative difference.
InvestmentsThe following assets are carried at cost, less necessary and legally permissible depreciation: ̤ Investment real estate ̤ Investments in subsidiaries and affiliated companies ̤ Equity securities ̤ Fixed income securities (other than zero bonds) ̤ Investments in funds ̤ Alternative investments ̤ Assets in derivative financial instruments
Subsequent recoveries of previously recorded downward value adjustments may be recognised up to the lower of historical cost or market value at the balance sheet date. The valuation rules prescribed by the Swiss Financial Market Supervisory Authority FINMA are observed.
Zero bonds reported under fixed income securities are valued at their amortised cost values.
Assets in derivative financial instruments include reinsurance contracts or features embedded in reinsurance contracts that fulfil the characteristics of derivative financial instruments.
Short-term investments contain investments with an original duration between three months and one year. Such investments are generally held until maturity and are maintained at their amortised cost values.
Loans to subsidiaries and affiliated companies, mortgages and other loans are carried at nominal value. Value adjustments are recorded where the expected recovery value is lower than the nominal value.
Tangible assetsProperty for own use is valued at the purchase or construction cost less necessary and legally permissible depreciation.
Other tangible assets are carried at cost, less individually scheduled straight-line depreciation over their useful lives. Items of minor value are not capitalised.
Intangible assetsIntangible assets, consisting of capitalised development costs for software for internal use, are stated at cost less straight-line amortisation over the estimated useful lives.
NotesSwiss Reinsurance Company LtdSignificant accounting principles
Swiss Reinsurance Company Ltd 2011 Annual Report 95
Financial statements | Swiss Reinsurance Company Ltd
Deferred acquisition costsDeferred acquisition costs consist principally of commissions and are related to the production of new reinsurance business. Deferred acquisition costs for short duration contracts are amortised in proportion to premiums earned. Deferred acquisition costs for long duration contracts are amortised over the life of the underlying contracts.
Other assetsOther assets include deferred expenses on retroactive reinsurance policies, which are amortised through earnings over the expected claims-paying period, as well as receivables in connection with securities lending collateral and reverse repurchase transactions, which are carried at nominal value.
Other current assetsOther current assets are carried at nominal value after deduction of known credit risks if applicable.
Technical provisionsUnpaid claims are based on information provided by clients and own estimates of expected claims experience, which are drawn from empirical statistics. These include provisions for claims incurred but not reported. Unpaid insurance obligations are set aside at the full expected amount of future payment.
Liabilities for life and health policy benefits are determined on the basis of actuarially calculated present values taking experience into account. For external business, liabilities are the greater of cedent-reported information and estimates of own experience drawn from internal studies. With respect to the business ceded by the Company’s life and health subsidiaries, a prospective gross premium valuation is applied, taking into account expected future cash flows inherent in the reinsurance contract from the valuation date until expiry of the contract obligations. Cash flows include premiums, claims, commissions, investment income and expenses, with a margin added for prudence to reflect the uncertainties of the underlying best estimates. The gross premium valuation approach could result in a negative liability provision, which is typically set to zero.
Accounting principles for life and health business require that no contract is treated as an asset on the balance sheet, with the exception of specific contracts where an offsetting amount has been paid and is recoverable from the ceding company.
Modified coinsurance arrangements are treated on a gross basis with the separate recognition of the funds withheld, as well as the liabilities for life and health policy benefits.
Premiums written relating to future periods are stated as unearned premiums and are normally calculated by statistical methods. The accrual of commissions is determined correspondingly and is reported under “Deferred acquisition costs”.
Provisions for profit commissions are based on contractual agreements with clients and depend on the results of reinsurance treaties.
The equalisation provision is established to achieve a protection of the balance sheet and to break peaks of incurred claims in individual financial years with an exceptionally high claims burden by releasing appropriate amounts from the provision.
The shares of technical provisions pertaining to retroceded business are determined or estimated according to the contractual agreement and the underlying gross business data per treaty.
Liabilities assumed and consideration provided in connection with portfolio transactions are established through the respective lines in the income statement. The initial recognition of assumed outstanding claims is recorded as change in unpaid claims, with the consideration being recognised as negative claims paid. The assumption of the provision for unearned premiums is established through the change in unearned premiums, with the respective consideration accounted for as premiums written. The liability for life and health policy benefits is established as a charge against life and health benefits, with the initial premium consideration recorded as premiums written.
The initial set up of assets and liabilities in respect of property and casualty retroactive treaties with external counterparties is accounted for as a balance sheet transaction.
96 Swiss Reinsurance Company Ltd 2011 Annual Report
Financial statements | Swiss Reinsurance Company Ltd
Non-technical provisionsThe provision for taxation reflects the related tax expense for the financial year under report.
The provision for currency fluctuation comprises all currency differences arising from the revaluation of the opening balance sheet, the adjustments from application of year-end or average rates and foreign exchange transactions.
Other provisions are determined according to business principles and are based on estimated needs and in accordance with tax regulations.
DebtDebt is held at redemption value.
Funds held under reinsurance treatiesFunds held under reinsurance treaties mainly contain cash deposits withheld from retrocessionaires, which are stated at redemption value.
Reinsurance balances payableReinsurance balances payable are held at redemption value.
Liabilities from derivative financial instrumentsLiabilities from derivative financial instruments are generally maintained at the highest commitment amount as per a balance sheet date during the life of the underlying contracts. Premiums received in respect of derivative financial instruments are not realised until expiration or settlement of the contract.
Included in this position are reinsurance contracts or features embedded in reinsurance contracts that fulfil the characteristics of derivative financial instruments. For such contracts, premiums received may be recognised as income prior to contract expiration or settlement, in cases where the recorded commitment has already reached the maximum liability amount potentially payable under the terms of the respective contracts. Decreases in the liability amounts prior to expiration or settlement are only recognised as income for contracts for which hedges are in place.
Other liabilitiesOther liabilities include payables in connection with repurchase agreements and securities lending transactions, which are held at redemption value.
Deposit arrangementsContracts which do not meet risk transfer requirements, defined as transferring a reasonable probability of a significant loss to the reinsurer, are accounted for as deposit arrangements. Deposit amounts are adjusted for payments received and made, as well as for amortisation or accretion of interest.
Allocated investment returnThe allocated investment return contains the calculated interest generated on the investments covering the technical provisions. The interest rate reflects the currency-weighted, five-year average yield on five-year government bonds.
Management expensesOverall management expenses are allocated to the reinsurance business, the investment business and to other expenses on an imputed basis.
Capital and indirect taxesCapital and indirect taxes related to the financial year are included in other expenses. Value-added taxes are included in the respective expense lines in the income statement.
Income tax expenseThe income tax expense relates to the financial year under report.
Income statement classificationThe Company has revised the classification between certain income statement categories. Specifically, the capital tax and indirect taxes were reclassified from tax expense to other expenses. Therefore, the previously reported 2010 figures of tax expense and other expenses have been changed accordingly.
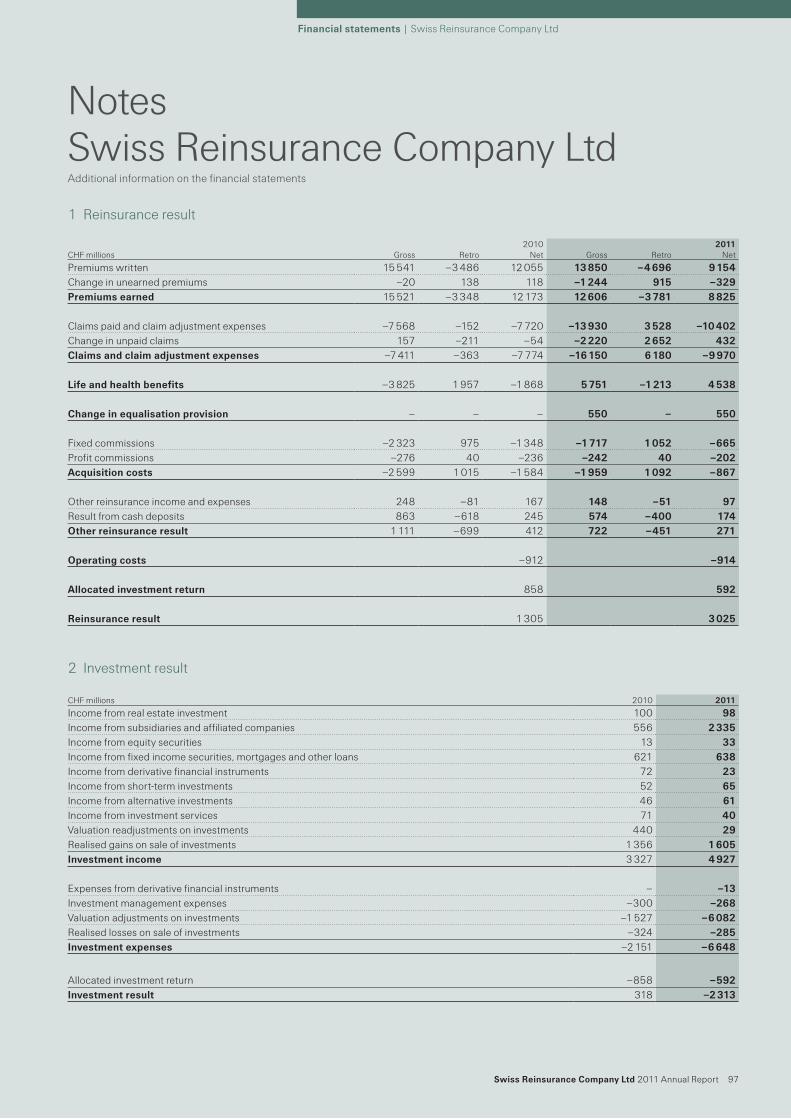
Swiss Reinsurance Company Ltd 2011 Annual Report 97
Financial statements | Swiss Reinsurance Company Ltd
NotesSwiss Reinsurance Company LtdAdditional information on the financial statements
1 Reinsurance result
2 Investment result
2010 2011CHF millions Gross Retro Net Gross Retro Net
Premiums written 15 541 –3 486 12 055 13 850 –4 696 9 154Change in unearned premiums –20 138 118 –1 244 915 –329Premiums earned 15 521 –3 348 12 173 12 606 –3 781 8 825
Claims paid and claim adjustment expenses –7 568 –152 –7 720 –13 930 3 528 –10 402Change in unpaid claims 157 –211 –54 –2 220 2 652 432Claims and claim adjustment expenses –7 411 –363 –7 774 –16 150 6 180 –9 970
Life and health benefits –3 825 1 957 –1 868 5 751 –1 213 4 538
Change in equalisation provision – – – 550 – 550
Fixed commissions –2 323 975 –1 348 –1 717 1 052 –665Profit commissions –276 40 –236 –242 40 –202Acquisition costs –2 599 1 015 –1 584 –1 959 1 092 –867
Other reinsurance income and expenses 248 –81 167 148 –51 97Result from cash deposits 863 –618 245 574 –400 174Other reinsurance result 1 111 –699 412 722 –451 271
Operating costs –912 –914
Allocated investment return 858 592
Reinsurance result 1 305 3 025
CHF millions 2010 2011
Income from real estate investment 100 98Income from subsidiaries and affiliated companies 556 2 335Income from equity securities 13 33Income from fixed income securities, mortgages and other loans 621 638Income from derivative financial instruments 72 23Income from short-term investments 52 65Income from alternative investments 46 61Income from investment services 71 40Valuation readjustments on investments 440 29Realised gains on sale of investments 1 356 1 605Investment income 3 327 4 927
Expenses from derivative financial instruments – –13Investment management expenses –300 –268Valuation adjustments on investments –1 527 –6 082Realised losses on sale of investments –324 –285Investment expenses –2 151 –6 648
Allocated investment return –858 –592Investment result 318 –2 313
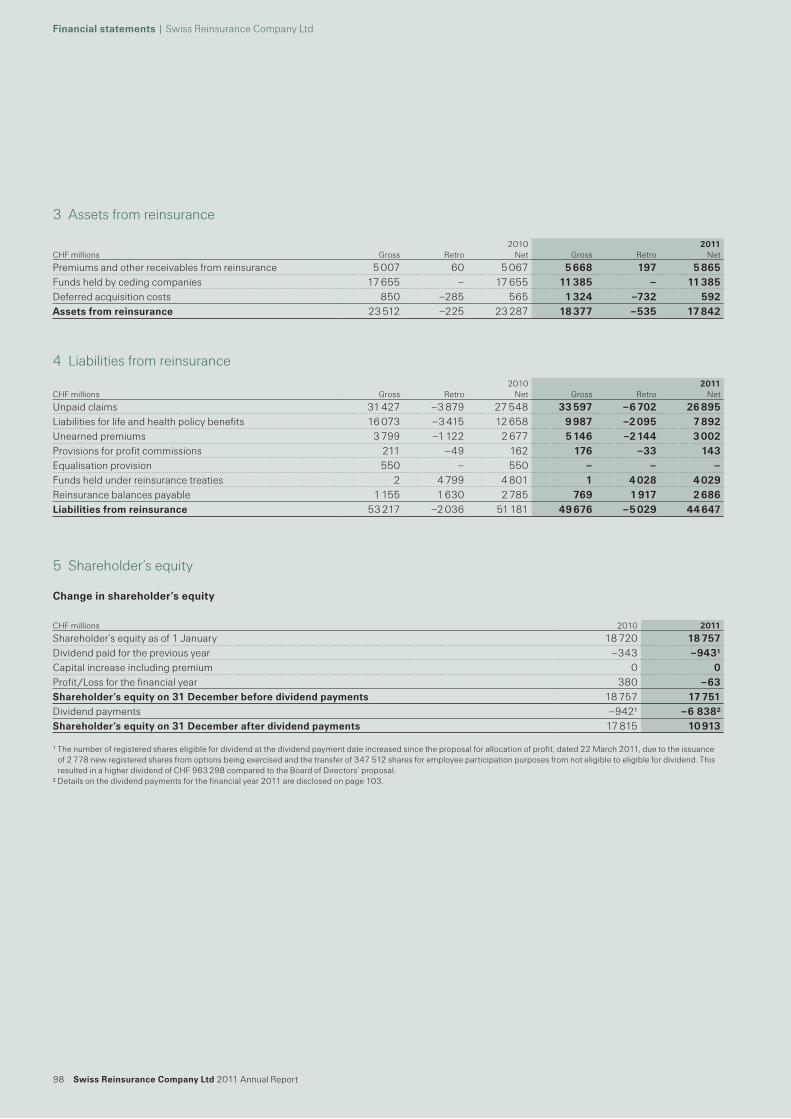
98 Swiss Reinsurance Company Ltd 2011 Annual Report
Financial statements | Swiss Reinsurance Company Ltd
3 Assets from reinsurance
4 Liabilities from reinsurance
5 Shareholder’s equity
Change in shareholder’s equity
2010 2011CHF millions Gross Retro Net Gross Retro Net
Premiums and other receivables from reinsurance 5 007 60 5 067 5 668 197 5 865Funds held by ceding companies 17 655 – 17 655 11 385 – 11 385Deferred acquisition costs 850 –285 565 1 324 –732 592Assets from reinsurance 23 512 –225 23 287 18 377 –535 17 842
2010 2011CHF millions Gross Retro Net Gross Retro Net
Unpaid claims 31 427 –3 879 27 548 33 597 –6 702 26 895Liabilities for life and health policy benefits 16 073 –3 415 12 658 9 987 –2 095 7 892Unearned premiums 3 799 –1 122 2 677 5 146 –2 144 3 002Provisions for profit commissions 211 –49 162 176 –33 143Equalisation provision 550 – 550 – – –Funds held under reinsurance treaties 2 4 799 4 801 1 4 028 4 029Reinsurance balances payable 1 155 1 630 2 785 769 1 917 2 686Liabilities from reinsurance 53 217 –2 036 51 181 49 676 –5 029 44 647
CHF millions 2010 2011
Shareholder’s equity as of 1 January 18 720 18 757Dividend paid for the previous year –343 –9431Capital increase including premium 0 0Profit /Loss for the financial year 380 –63Shareholder’s equity on 31 December before dividend payments 18 757 17 751Dividend payments –9421 –6 8382Shareholder’s equity on 31 December after dividend payments 17 815 10 913
1 The number of registered shares eligible for dividend at the dividend payment date increased since the proposal for allocation of profit, dated 22 March 2011, due to the issuance of 2 778 new registered shares from options being exercised and the transfer of 347 512 shares for employee participation purposes from not eligible to eligible for dividend. This resulted in a higher dividend of CHF 963 298 compared to the Board of Directors’ proposal.
2 Details on the dividend payments for the financial year 2011 are disclosed on page 103.
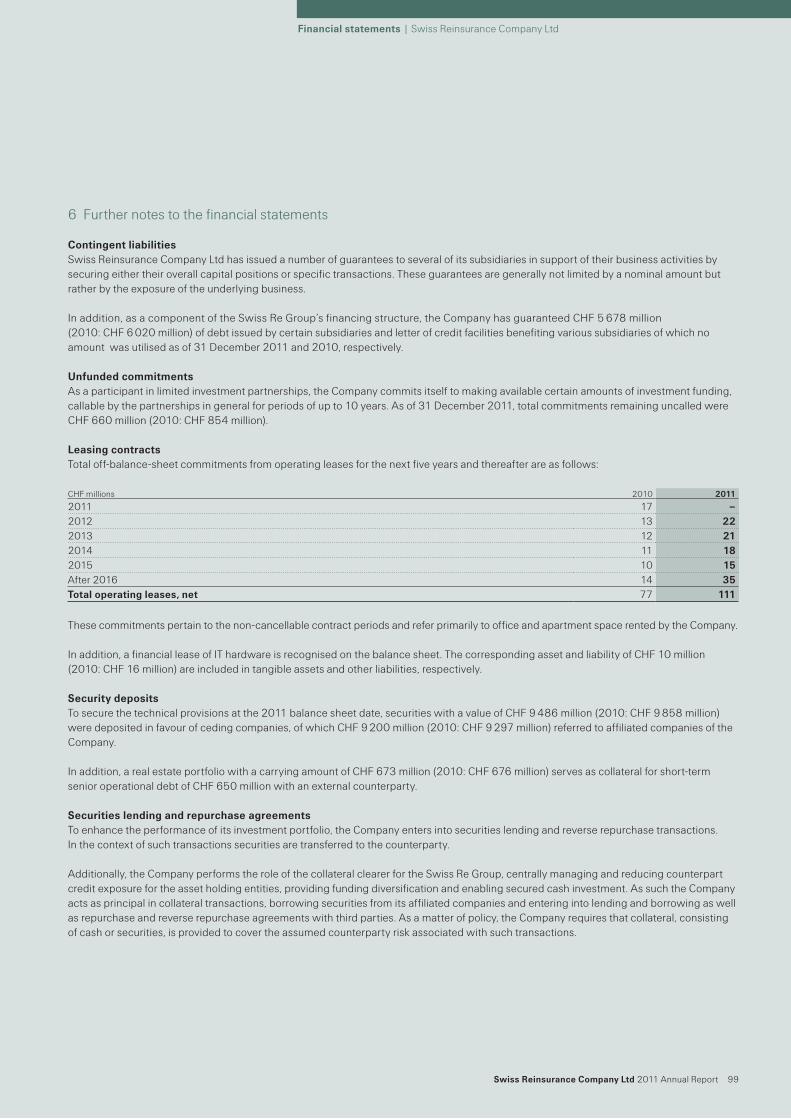
� Swiss�Reinsurance�Company�Ltd�2011 Annual Report 99
Financial�statements�| Swiss Reinsurance Company Ltd
6 Further notes to the financial statements
Contingent�liabilitiesSwiss Reinsurance Company Ltd has issued a number of guarantees to several of its subsidiaries in support of their business activities by securing either their overall capital positions or specific transactions. These guarantees are generally not limited by a nominal amount but rather by the exposure of the underlying business.
In addition, as a component of the Swiss Re Group’s financing structure, the Company has guaranteed CHF 5 678 million (2010: CHF 6 020 million) of debt issued by certain subsidiaries and letter of credit facilities benefiting various subsidiaries of which no amount was utilised as of 31 December 2011 and 2010, respectively.
Unfunded�commitmentsAs a participant in limited investment partnerships, the Company commits itself to making available certain amounts of investment funding, callable by the partnerships in general for periods of up to 10 years. As of 31 December 2011, total commitments remaining uncalled were CHF 660 million (2010: CHF 854 million).
Leasing�contractsTotal off-balance-sheet commitments from operating leases for the next five years and there after are as follows:
These commitments pertain to the non-cancellable contract periods and refer primarily to office and apartment space rented by the Company.
In addition, a financial lease of IT hardware is recognised on the balance sheet. The corresponding asset and liability of CHF 10 million (2010: CHF 16 million) are included in tangible assets and other liabilities, respectively.
Security�depositsTo secure the technical provisions at the 2011 balance sheet date, securities with a value of CHF 9 486 million (2010: CHF 9 858 million) were deposited in favour of ceding companies, of which CHF 9 200 million (2010: CHF 9 297 million) referred to affiliated companies of the Company.
In addition, a real estate portfolio with a carrying amount of CHF 673 million (2010: CHF 676 million) serves as collateral for short-term senior operational debt of CHF 650 million with an external counterparty.
Securities�lending�and�repurchase�agreementsTo enhance the performance of its investment portfolio, the Company enters into securities lending and reverse repurchase transactions. In the context of such transactions securities are transferred to the counterparty.
Additionally, the Company performs the role of the collateral clearer for the Swiss Re Group, centrally managing and reducing counterpart credit exposure for the asset holding entities, providing funding diversification and enabling secured cash investment. As such the Company acts as principal in collateral transactions, borrowing securities from its affiliated companies and entering into lending and borrowing as well as repurchase and reverse repurchase agreements with third parties. As a matter of policy, the Company requires that collateral, consisting of cash or securities, is provided to cover the assumed counterparty risk associated with such transactions.
CHF millions 2010 2011
2011 17 �–2012 13 222013 12 212014 11 182015 10 15After 2016 14 35Total�operating�leases,�net 77 111
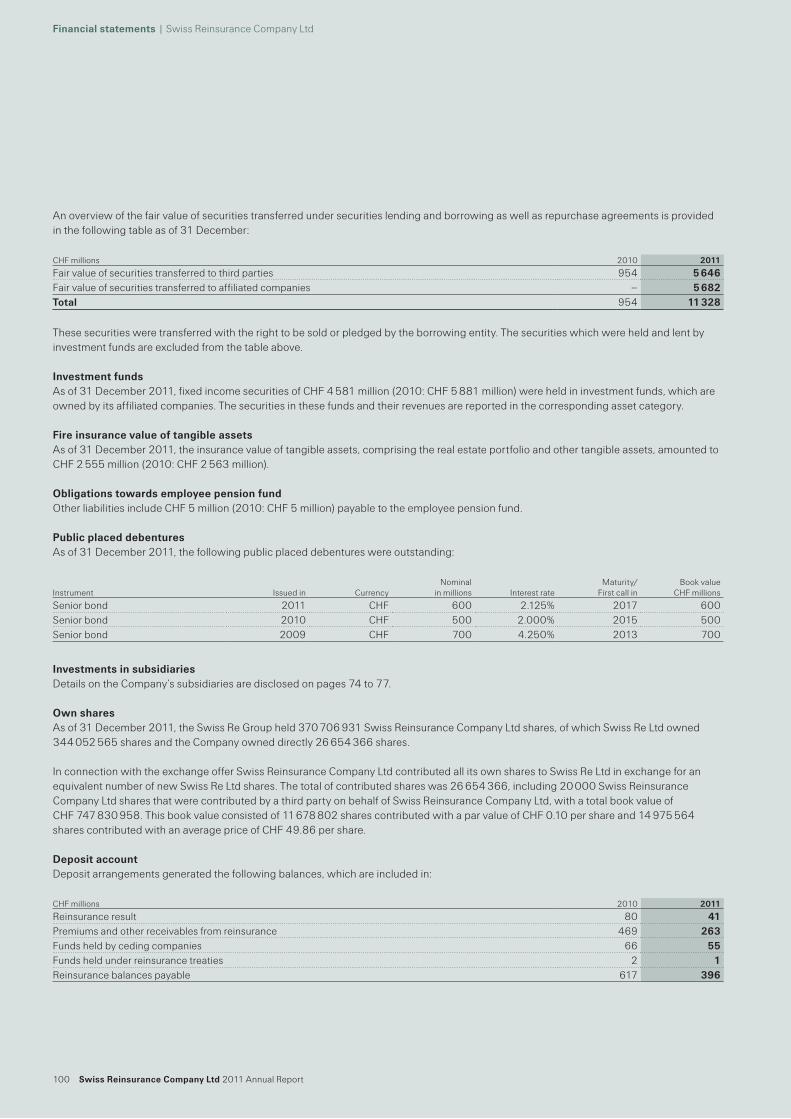
100 Swiss�Reinsurance�Company�Ltd�2011 Annual Report
Financial�statements�| Swiss Reinsurance Company Ltd
CHF millions 2010 2011
Reinsurance result 80 41Premiums and other receivables from reinsurance 469 263Funds held by ceding companies 66 55Funds held under reinsurance treaties 2 1Reinsurance balances payable 617 396
An overview of the fair value of securities transferred under securities lending and borrowing as well as repurchase agreements is provided in the following table as of 31 December:
These securities were transferred with the right to be sold or pledged by the borrowing entity. The securities which were held and lent by investment funds are excluded from the table above.
Investment�fundsAs of 31 December 2011, fixed income securities of CHF 4 581 million (2010: CHF 5 881 million) were held in investment funds, which are owned by its affiliated companies. The securities in these funds and their revenues are reported in the corresponding asset category.
Fire�insurance�value�of�tangible�assetsAs of 31 December 2011, the insurance value of tangible assets, comprising the real estate portfolio and other tangible assets, amounted to CHF 2 555 million (2010: CHF 2 563 million).
Obligations�towards�employee�pension�fundOther liabilities include CHF 5 million (2010: CHF 5 million) payable to the employee pension fund.
Public�placed�debenturesAs of 31 December 2011, the following public placed debentures were outstanding:
Investments�in�subsidiariesDetails on the Company’s subsidiaries are disclosed on pages 74 to 77.
Own�sharesAs of 31 December 2011, the Swiss Re Group held 370 706 931 Swiss Reinsurance Company Ltd shares, of which Swiss Re Ltd owned 344 052 565 shares and the Company owned directly 26 654 366 shares.
In connection with the exchange offer Swiss Reinsurance Company Ltd contributed all its own shares to Swiss Re Ltd in exchange for an equivalent number of new Swiss Re Ltd shares. The total of contributed shares was 26 654 366, including 20 000 Swiss Reinsurance Company Ltd shares that were contributed by a third party on behalf of Swiss Reinsurance Company Ltd, with a total book value of CHF 747 830 958. This book value consisted of 11 678 802 shares contributed with a par value of CHF 0.10 per share and 14 975 564 shares contributed with an average price of CHF 49.86 per share.
Deposit�accountDeposit arrangements generated the following balances, which are included in:
Instrument Issued in CurrencyNominal
in millions Interest rateMaturity/
First call inBook value
CHF millions
Senior bond 2011 CHF 600 2.125% 2017 600Senior bond 2010 CHF 500 2.000% 2015 500Senior bond 2009 CHF 700 4.250% 2013 700
CHF millions 2010 2011
Fair value of securities transferred to third parties 954 5�646Fair value of securities transferred to affiliated companies – 5�682Total 954 11�328
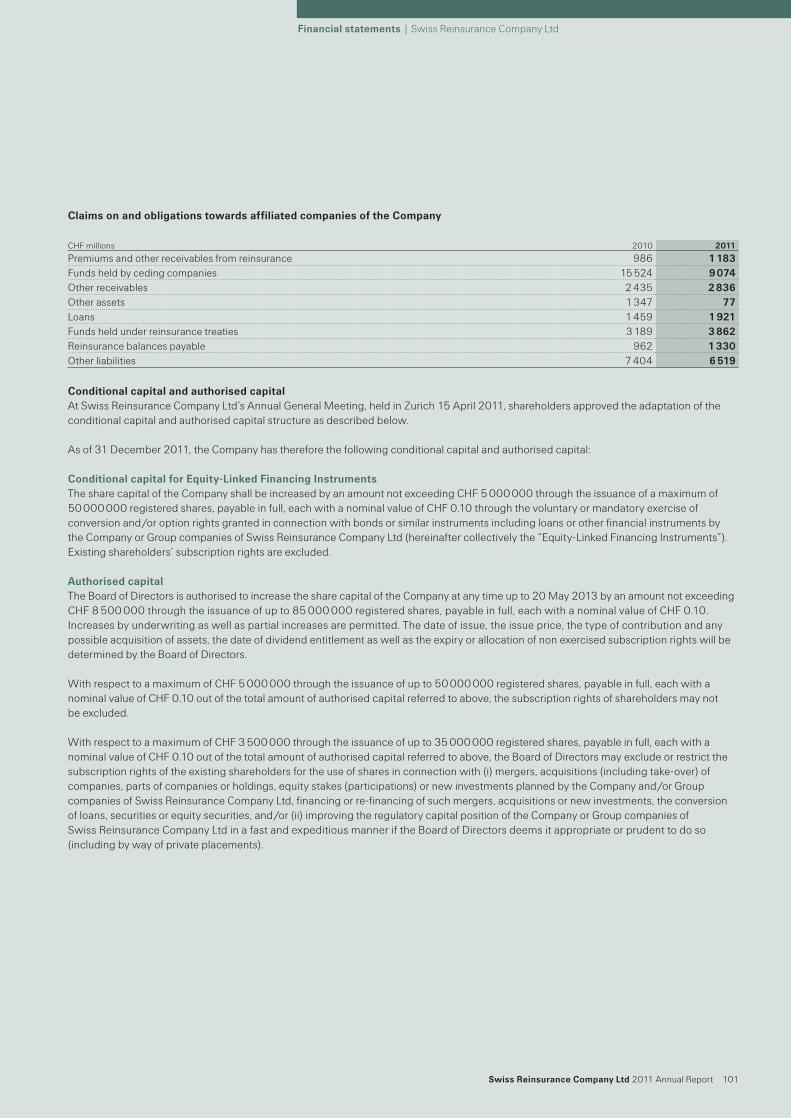
� Swiss�Reinsurance�Company�Ltd�2011 Annual Report 101
Financial�statements�| Swiss Reinsurance Company Ltd
Claims�on�and�obligations�towards�affiliated�companies�of�the�Company
Conditional�capital�and�authorised�capitalAt Swiss Reinsurance Company Ltd’s Annual General Meeting, held in Zurich 15 April 2011, shareholders approved the adaptation of the conditional capital and authorised capital structure as described below.
As of 31 December 2011, the Company has therefore the following conditional capital and authorised capital:
Conditional�capital�for�Equity-Linked�Financing�InstrumentsThe share capital of the Company shall be increased by an amount not exceeding CHF 5 000 000 through the issuance of a maximum of 50 000 000 registered shares, payable in full, each with a nominal value of CHF 0.10 through the voluntary or mandatory exercise of conversion and /or option rights granted in connection with bonds or similar instruments including loans or other financial instruments by the Company or Group companies of Swiss Reinsurance Company Ltd (hereinafter collectively the “Equity-Linked Financing Instruments”). Existing shareholders’ subscription rights are excluded.
Authorised�capitalThe Board of Directors is authorised to increase the share capital of the Company at any time up to 20 May 2013 by an amount not exceeding CHF 8 500 000 through the issuance of up to 85 000 000 registered shares, payable in full, each with a nominal value of CHF 0.10. Increases by underwriting as well as partial increases are permitted. The date of issue, the issue price, the type of contribution and any possible acquisition of assets, the date of dividend entitlement as well as the expiry or allocation of non exercised subscription rights will be determined by the Board of Directors.
With respect to a maximum of CHF 5 000 000 through the issuance of up to 50 000 000 registered shares, payable in full, each with a nominal value of CHF 0.10 out of the total amount of authorised capital referred to above, the subscription rights of shareholders may not be excluded.
With respect to a maximum of CHF 3 500 000 through the issuance of up to 35 000 000 registered shares, payable in full, each with a nominal value of CHF 0.10 out of the total amount of authorised capital referred to above, the Board of Directors may exclude or restrict the subscription rights of the existing shareholders for the use of shares in connection with (i) mergers, acquisitions (including take-over) of companies, parts of companies or holdings, equity stakes (participations) or new investments planned by the Company and /or Group companies of Swiss Reinsurance Company Ltd, financing or re-financing of such mergers, acquisitions or new investments, the conversion of loans, securities or equity securities, and /or (ii) improving the regulatory capital position of the Company or Group companies of Swiss Reinsurance Company Ltd in a fast and expeditious manner if the Board of Directors deems it appropriate or prudent to do so (including by way of private placements).
CHF millions 2010 2011
Premiums and other receivables from reinsurance 986 1�183Funds held by ceding companies 15 524 9�074Other receivables 2 435 2�836Other assets 1 347 77Loans 1 459 1�921Funds held under reinsurance treaties 3 189 3�862Reinsurance balances payable 962 1�330Other liabilities 7 404 6�519
102 Swiss�Reinsurance�Company�Ltd�2011 Annual Report
Financial�statements�| Swiss Reinsurance Company Ltd
Release�of�undisclosed�reservesIn the year under report, no net undisclosed reserves on investments or on provisions were released (2010: CHF 88 million).
Major�shareholdersAs of 31 December 2011, the Company was a fully owned subsidiary of Swiss Re Ltd.
Personnel�informationAs of 31 December 2011, Swiss Reinsurance Company Ltd employed a worldwide staff of 3 654 (2010: 3 513). Personnel expenses for the 2011 financial year amounted to CHF 885 million (2010: CHF 967 million).
Management�fee�contributionIn 2011, management expenses of CHF 282 million (2010: CHF 171 million) were recharged to affiliated companies of the Company and invoiced to third parties. These recharges were reported net under “Operating costs”, “Investment expenses” and “Other expenses”.
Risk�assessmentArticle 663b sub-para. 12 of the Swiss Code of Obligations requires disclosure of information on the performance of a risk assessment.
The identification, assessment and control of risk exposures of Swiss Reinsurance Company Ltd on a stand-alone basis are integrated in and covered by Swiss Re’s Group risk management organisation and processes.
Details are disclosed on page 84.
Outlook�2012As a result of the new Swiss Re Group corporate structure, during the first half of 2012, Swiss Reinsurance Company Ltd will transfer its investments in Swiss Re Corporate Solutions Ltd and Swiss Re Life Capital Ltd through a dividend in-kind to Swiss Re Ltd. These transfers are subject to the approval of Swiss Re’s principal regulator, Swiss Financial Market Supervisory Authority FINMA. Following these transfers, Swiss Re Corporate Solutions Ltd and Swiss Re Life Capital Ltd will no longer be subsidiaries of Swiss Reinsurance Company Ltd and will instead become direct subsidiaries of Swiss Re Ltd.
� Swiss�Reinsurance�Company�Ltd�2011 Annual Report 103
Financial�statements�| Swiss Reinsurance Company Ltd
Proposal for allocation of disposable profit/lossThe Annual General Meeting of Swiss Reinsurance Company Ltd to be held in Zurich on 19 March 2012 has at its disposal the following loss:
The Board of Directors proposes to the Annual General Meeting of Swiss Reinsurance Company Ltd to allocate the disposable loss and to pay dividends as follows:
DividendsIf this Board of Directors’ proposal for allocation is accepted, the following dividends will be paid: ̤ a cash dividend of CHF 1 028 209 497 out of other reserves ̤ a dividend in-kind of Swiss Re Corporate Solutions Ltd and Swiss Re Life Capital Ltd of total CHF 5 809 689 701 out of other reserves
Zurich, 15 March 2012
In CHF 2010 2011
Retained earnings brought forward 50 211 859 50�431�171Profit /loss for the financial year 380 219 312 –63�439�410Disposable�profit�/loss 430 431 171 –13�008�239
In CHF 2010 2011
Balance carried forward 50 431 171 –13�008�239Allocati on to other reserves 380 000 000 –Withdrawal from other reserves for dividend payments – –6�837�899�198Reclassification of legal reserves from capital contributions to other reserves –942 206 4381 –Dividend payment out of other reserves 942 206 4381 1�028�209�497Dividend in-kind of Swiss Re Corporate Solutions Ltd and Swiss Re Life Capital Ltd out of other reserves2 – 5�809�689�701Disposable�profit�/loss 430 431 171 –13�008�239
1 The number of registered shares eligible for dividend at the dividend payment date increased since the proposal for allocation of profit, dated 22 March 2011, due to the issuance of 2 778 new registered shares from options being exercised and the transfer of 347 512 shares for employee participation purposes from not eligible to eligible for dividend. This resulted in a higher dividend of CHF 963 298 compared to the Board of Directors’ proposal.
2 Subject to FINMA approval
104 Swiss�Reinsurance�Company�Ltd�2011 Annual Report
Financial�statements�| Swiss Reinsurance Company Ltd
Report of the statutory auditorReport of the statutory auditor to the General Meeting of Swiss Reinsurance Company Ltd Zurich
Report�of�the�statutory�auditor�on�the�Financial�StatementsAs statutory auditor, we have audited the financial statements of Swiss Reinsurance Company Ltd, which comprise the income statement, balance sheet and notes (pages 91 to 102), for the year ended 31 December 2011.
Board of Directors’ responsibilityThe Board of Directors is responsible for the preparation of the financial statements in accordance with the requirements of Swiss law and the company’s articles of incorporation. This responsibility includes designing, implementing and maintaining an internal control system relevant to the preparation of financial statements that are free from material misstatement, whether due to fraud or error. The Board of Directors is further responsible for selecting and applying appropriate accounting policies and making accounting estimates that are reasonable in the circumstances.
Auditor’s responsibilityOur responsibility is to express an opinion on these financial statements based on our audit. We conducted our audit in accordance with Swiss law and Swiss Auditing Standards. Those standards require that we plan and perform the audit to obtain reasonable assurance whether the financial statements are free from material misstatement.
An audit involves performing procedures to obtain audit evidence about the amounts and disclosures in the financial statements. The procedures selected depend on the auditor’s judgment, including the assessment of the risks of material misstatement of the financial statements, whether due to fraud or error. In making those risk assessments, the auditor considers the internal control system relevant to the entity’s preparation of the financial statements in order to design audit procedures that are appropriate in the circumstances, but not for the purpose of expressing an opinion on the effectiveness of the entity’s internal control system. An audit also includes evaluating the appropriateness of the accounting policies used and the reasonableness of accounting estimates made, as well as evaluating the overall presentation of the financial statements. We believe that the audit evidence we have obtained is sufficient and appropriate to provide a basis for our audit opinion.
OpinionIn our opinion, the financial statements for the year ended 31 December 2011 comply with Swiss law and the company’s articles of incorporation.
Report�on�other�legal�requirementsWe confirm that we meet the legal requirements on licensing according to the Auditor Oversight Act (AOA) and independence (article 728 CO and article 11 AOA) and that there are no circumstances incompatible with our independence.
In accordance with article 728a paragraph 1 item 3 CO and Swiss Auditing Standard 890, we confirm that an internal control system exists which has been designed for the preparation of financial statements according to the instructions of the Board of Directors.
We further confirm that the proposal for allocation of disposable profit/loss complies with Swiss law and the company’s articles of incorporation. We recommend that the financial statements submitted to you be approved.
PricewaterhouseCoopers AG
Alex Finn Dawn M KinkAudit expert Auditor in charge
Zurich, 15 March 2012

� Swiss�Reinsurance�Company�Ltd�2011 Annual Report 105
Financial�statements�| Swiss Reinsurance Company Ltd
This page is intentionally left blank
106 Swiss Reinsurance Company Consolidated 2011 Annual Report
General information
Cautionary note on forward-looking statements
Certain statements and illustrations contained herein are forward-looking. These statements and illustrations provide current expectations of future events based on certain assumptions and include any statement that does not directly relate to a historical fact or current fact.
Forward-looking statements typically are identified by words or phrases such as “anticipate”, “assume”, “believe”, “continue”, “estimate”, “expect”, “foresee”, “intend”, “may increase” and “may fluctuate” and similar expressions or by future or conditional verbs such as “will”, “should”, “would” and “could“. These forward-looking statements involve known and unknown risks, uncertainties and other factors, which may cause the Group’s actual results of operations, financial condition, solvency ratios, liquidity position or prospects to be materially different from any future results of operations, financial condition, solvency ratios, liquidity position or prospects expressed or implied by such statements. Such factors include, among others: ̤ further instability affecting the global financial system and developments related thereto,
including as a result of concerns over, or adverse developments relating to, sovereign debt of euro area countries;
̤ further deterioration in global economic conditions; ̤ the Group’s ability to maintain sufficient liquidity and access to capital markets, including
sufficient liquidity to cover potential recapture of reinsurance agreements, early calls of debt or debt-like arrangements and collateral calls due to actual or perceived deterioration of the Group’s financial strength or otherwise;
̤ the effect of market conditions, including the global equity and credit markets, and the level and volatility of equity prices, interest rates, credit spreads, currency values and other market indices, on the Group’s investment assets;
̤ changes in the Group’s investment result as a result of changes in its investment policy or the changed composition of its investment assets, and the impact of the timing of any such changes relative to changes in market conditions;
̤ uncertainties in valuing credit default swaps and other credit-related instruments; ̤ possible inability to realise amounts on sales of securities on the Group’s balance sheet
equivalent to their mark-to-market values recorded for accounting purposes; ̤ the outcome of tax audits, the ability to realise tax loss carryforwards and the ability to
realise deferred tax assets (including by reason of the mix of earnings in a jurisdiction or deemed change of control), which could negatively impact future earnings;
̤ the possibility that the Group’s hedging arrangements may not be effective; ̤ the lowering or loss of financial strength or other ratings of Group companies, and
developments adversely affecting the Group’s ability to achieve improved ratings;
Swiss Reinsurance Company Consolidated 2011 Annual Report 107
General information | Cautionary note on forward-looking statements
̤ the cyclicality of the reinsurance industry; ̤ uncertainties in estimating reserves; ̤ uncertainties in estimating future claims for purposes of financial reporting, particularly
with respect to large natural catastrophes, as significant uncertainties may be involved in estimating losses from such events and preliminary estimates may be subject to change as new information becomes available;
̤ the frequency, severity and development of insured claim events; ̤ acts of terrorism and acts of war; ̤ mortality and morbidity experience; ̤ policy renewal and lapse rates; ̤ extraordinary events affecting the Group’s clients and other counterparties, such as
bankruptcies, liquidations and other credit-related events; ̤ current, pending and future legislation and regulation affecting the Group or its ceding
companies; ̤ legal actions or regulatory investigations or actions, including those in respect of industry
requirements or business conduct rules of general applicability; ̤ changes in accounting standards; ̤ significant investments, acquisitions or dispositions, and any delays, unexpected costs or
other issues experienced in connection with any such transactions; ̤ changing levels of competition; ̤ operational factors, including the efficacy of risk management and other internal
procedures in managing the foregoing risks; and ̤ challenges in implementation, adverse responses of counterparties, regulators or rating
agencies, or other issues arising from, or otherwise relating to, the changes in the Group’s corporate structure.
These factors are not exhaustive. The Group operates in a continually changing environment and new risks emerge continually. Readers are cautioned not to place undue reliance on forward-looking statements. The Group undertakes no obligation to publicly revise or update any forward-looking statements, whether as a result of new information, future events or otherwise.
108 Swiss Reinsurance Company Consolidated 2011 Annual Report
General information
General impact of adverse market conditions and deterioration in global financial markets The euro area sovereign debt crisis, coupled with weak demand and mild fiscal contraction in the US, is slowing global growth. Recession cannot be ruled out for a number of developed economies, and emerging markets, while continuing to expand, are doing so at a slower pace than in 2011, or than expected. Economic developments, in the form of adverse growth trends, and the political environment, in the form of fiscal tightening, accommodative monetary policy and governance challenges, are resulting in low interest rates, threats to holders of sovereign debt and holders of debt of financial institutions with exposure to sovereign debt, and adverse trends in emerging markets.
Concerns are increasing about rising sovereign debt burdens, possible sovereign defaults and the future of the euro, which in turn could affect economic growth rates, interest rates and inflation. Failure to reach an early resolution of the euro area sovereign debt crisis, and continued uncertainty over the stability of the euro and the European Monetary Union, could increase the severity and duration of economic recession, cause more economic turmoil in the near term, cause further disruptions in the global financial markets and impact foreign currency exchange rates. These developments in turn could have an adverse impact on our investment results, our ability to access the capital markets and the bank funding market, the ability of counterparties to meet their obligations to us and the short-term outlook for the life insurance industry, particularly in North America and Europe, with a corresponding negative impact on our Life & Health business. Concerns over the stability of the euro could also have a broad effect on contractual arrangements denominated in, or otherwise tied to, the euro.
The foregoing developments could have material adverse effects on our industry and on us.
Regulatory changesSwiss Reinsurance Company Ltd (“Swiss Re”) and its subsidiaries (collectively, the “Group”) are regulated in a number of jurisdictions in which they conduct business. New legislation as well as changes to existing legislation have been proposed and/or recently adopted in a number of jurisdictions that are expected to alter, in a variety of ways, the manner in which the financial services industry is regulated. Although it is difficult to predict which proposals will become law and when and how new legislation ultimately will be implemented by regulators (including in respect of the extraterritorial effect of reforms), it is likely that significant aspects of existing regulatory regimes governing financial services will change. These may include changes as to which governmental bodies regulate financial institutions, changes in the way financial institutions generally are regulated, enhanced governmental authority to take control over operations of financial institutions, restrictions on the conduct of certain lines of business, changes in the way financial institutions account for transactions and securities positions, changes in disclosure obligations and changes in the way rating agencies rate the creditworthiness and financial strength of financial institutions.
Legislative initiatives directly impacting our industry include the establishment of a pan-European regulator for insurance companies, the European Insurance and Occupational Pension Authority, which gained its regulatory powers on 1 January 2011 and will be able to overrule national regulators in certain circumstances. In addition, Swiss Re is subject to the Swiss Solvency Test, and Solvency II is currently expected to be transposed into law in January 2013, but will not be binding on insurers until a year later in January 2014. In the US, as a possible step towards federal oversight of insurance, the US Congress created the Federal Insurance Office within the Department of Treasury.
Other changes are focused principally on banking institutions, but some could have direct applicability to insurance or reinsurance operations and others could have a general impact on the regulatory landscape for financial institutions, which might indirectly impact capital requirements and/or required reserve levels or have other direct or indirect effects on the Group. Changes are particularly likely to impact financial institutions designated as
Note on risk factors
Swiss Reinsurance Company Consolidated 2011 Annual Report 109
General information | Note on risk factors
“systemically important”, which designation is expected to result in enhanced regulatory supervision and heightened capital, liquidity and diversification requirements under evolving reforms. Although, to date, the focus of reforms in respect of systemically important financial institutions principally has been on banks, there is an emerging focus on insurance companies as well. Swiss Re could be designated as a global systemically important financial institution. In addition, there appears to be a trend towards a more coordinated, centralised and stricter approach to insurance regulation specifically, in both the EU and the US.
Regulatory changes may also occur in areas of broader application, such as competition policy and tax laws. Changes in tax laws could increase the taxes the Group pays, the attractiveness of products offered by the Group, the Group’s investment activities and the value of deferred tax assets. Any number of these changes could apply to the Group and its operations. These changes could increase the costs of doing business, reduce access to liquidity, limit the scope of business or affect the competitive balance, or could make reinsurance less attractive to primary insurers.
Market riskVolatility and disruption in the global financial markets can expose the Group to significant financial and capital markets risk, including changes in interest rates, credit spreads, equity prices and foreign currency exchange rates, which may adversely impact the Group’s financial condition, results of operations, liquidity and capital position. The Group’s exposure to interest rate risk is primarily related to the market price and cash flow variability associated with changes in interest rates. Exposure to credit spreads primarily relates to market price and cash flow variability associated with changes in credit spreads. When credit spreads widen, the net unrealised loss position of the Group’s investment portfolio can increase, as could other-than-temporary impairments. With respect to equity prices, the Group is exposed to changes in the level and volatility of equity prices, as they affect the value of equity securities themselves as well as the value of securities or instruments that derive their value from a particular equity security, a basket of equity securities or a stock index. The Group is also subject to equity price risk to the extent that the values of life-related benefits under certain products and life contracts, most notably variable annuity business, are tied to financial market values; to the extent market values fall, the financial exposure on guarantees related to these contracts would increase to the extent this exposure is not hedged. While the Group has discontinued writing new variable annuity business and has an extensive hedging programme covering its existing variable annuity business, certain risks cannot be hedged, including actuarial risks, basis risk and correlation risk. Exposure to foreign exchange risk arises from exposures to changes in spot prices and forward prices as well as to volatile movements in exchange rates.
These risks can have a significant effect on investment returns and market values of securities positions, which in turn may affect both the Group’s results of operations and financial condition. The Group continues to focus on asset-liability management for its investment portfolio, but pursuing even this strategy has its risks – including possible mismatch – that in turn can lead to reinvestment risk. The Group seeks to manage the risks inherent in its investment portfolio by repositioning the portfolio from time to time, as needed, and to reduce risk and fluctuations through the use of hedges and other risk management tools. The Group has reduced risk to the portfolio by repositioning the components of the portfolio and, as a result, profitability could potentially be impacted and, unless offset by underwriting returns, reduced.
Credit riskAlthough the Group has taken significant steps to de-risk its portfolio and reposition its assets, if the credit markets were again to deteriorate and further asset classes were to be impacted, the Group could experience further losses. Changes in the market value of the underlying securities and other factors impacting their price could give rise to market value losses. If the credit markets were to deteriorate again, the Group could also face further write-downs in other areas of its portfolio, including other structured instruments, and the
110 Swiss Reinsurance Company Consolidated 2011 Annual Report
General information | Note on risk factors
Group and its counterparties could once again face difficulties in valuing credit-related instruments. Differences in opinion with respect to valuations of credit-related instruments could result in legal disputes among the Group and its counterparties as to their respective obligations, the outcomes of which are difficult to predict and could be material.
Liquidity risksThe Group’s business requires, and its clients expect, that it has sufficient capital and sufficient liquidity to meet its reinsurance obligations, and that this would continue to be the case following the occurrence of any event or series of events, including extreme catastrophes, that would trigger insurance or reinsurance coverage obligations. The Group’s uses of funds include obligations arising in its reinsurance business (including claims and other payments as well as insurance provision repayments due to portfolio transfers, securitisations and commutations), which may include large and unpredictable claims (including catastrophe claims), funding of capital requirements and operating costs, payment of principal and interest on outstanding indebtedness and funding of acquisitions. The Group also enters into contracts or trading arrangements that could give rise to significant short-term funding obligations and, in connection with the Group’s trading operations, it could be subject to unexpected calls to deliver collateral or unwind trading positions at a net cost to it. The Group also has unfunded capital commitments in its private equity and hedge fund investments, which could result in funding obligations at a time when it is subject to liquidity constraints. The Group also has potential collateral requirements in connection with a number of reinsurance arrangements, the amounts of which may be material and the meeting of which could require the Group to liquidate cash equivalents or other securities.
The Group manages liquidity and funding risks by focusing on the liquidity stress that is likely to result from extreme capital markets scenarios or from extreme loss events or combinations of the two. Generally, the ability to meet liquidity needs could be adversely impacted by factors that the Group cannot control, such as market dislocations or interruptions, adverse economic conditions, severe disruption in the financial and worldwide credit markets and the related increased constraints on the availability of credit; changes in interest rates, foreign exchange rates and credit spreads, or by perceptions among market participants of the extent of the Group’s liquidity needs.
The Group may not be able to secure new sources of liquidity or funding, should projected or actual liquidity fall below levels it requires. The ability to meet liquidity needs through asset sales may be constrained by market conditions and the related stress on valuations, and through third-party funding may be limited by constraints on the general availability of credit and willingness of lenders to lend. In addition, the Group’s ability to meet liquidity needs may also be constrained by regulatory requirements that require regulated entities to maintain or increase regulatory capital, or that restrict intra-Group transactions, the timing of dividend payments from subsidiaries or the fact that certain assets may be encumbered or otherwise non-tradable. Failure to meet covenants in lending arrangements could give rise to collateral-posting or defaults, and further constrain access to liquidity. Finally, any adverse ratings action could trigger a need for further liquidity (for example, by triggering termination provisions or collateral delivery requirements in contracts to which the Group is a party) at a time when the Group’s ability to obtain liquidity from external sources is limited by such ratings action.
Counterparty risksThe Group’s general exposure to counterparty risk was heightened during the credit crisis, and this risk could still be exacerbated to the extent defaults, or concerns about possible defaults, by certain market participants trigger more systemic concerns about liquidity. Losses due to defaults by counterparties, including issuers of investment securities (which include structured securities) or derivative instrument counterparties, could adversely affect the Group. In addition, trading counterparties, counterparties under swaps and other derivative contracts, and financial intermediaries may default on their obligations due to bankruptcy, insolvency, lack of liquidity, adverse economic conditions, operational failure, fraud or other reasons, which could also have a material adverse impact on the Group.

Swiss Reinsurance Company Consolidated 2011 Annual Report 111
General information | Note on risk factors
The Group could also be adversely affected by the insolvency of, or other credit constraints affecting, counterparties in its reinsurance operations. Moreover, the Group could be adversely affected by liquidity issues at ceding companies or at third parties to whom the Group has retroceded risk, and such risk could be exacerbated to the extent any such exposures are concentrated. The Group’s most significant single counterparty risk is in respect of Berkshire Hathaway Inc., with which it has a quota share arrangement, an adverse development cover and a retrocession arrangement in respect of a closed block of US individual life reinsurance business.
Risks relating to credit rating downgradesRatings are an important factor in establishing the competitive position of reinsurance companies, and market conditions could increase the risk of downgrade. Third-party rating agencies assess and rate the financial strength of reinsurers and insurers such as Swiss Re. These ratings are intended to measure a company’s ability to repay its obligations and are based upon criteria established by the rating agencies.
The Group’s ratings reflect the current opinion of the relevant rating agencies. One or more of its ratings could be downgraded or withdrawn in the future. Rating agencies may increase the frequency and scope of ratings reviews, revise their criteria or take other actions that may negatively impact the Group’s ratings. In addition, changes to the process or methodology of issuing ratings, or the occurrence of events or developments affecting the Group, could make it more difficult for the Group to achieve improved ratings which it would otherwise have expected.
As claims paying and financial strength ratings are key factors in establishing the competitive position of reinsurers, a decline in ratings alone could make reinsurance provided by the Group less attractive to clients relative to reinsurance from competitors with similar or stronger ratings. A decline in ratings could also cause the loss of clients who are required by either policy or regulation to purchase reinsurance only from reinsurers with certain ratings. A decline in ratings could also impact the availability and terms of unsecured financing and obligate the Group to provide collateral or other guarantees in the course of its reinsurance business or trigger early termination of funding arrangements. Any rating downgrades could also have a material adverse impact on the Group’s costs of borrowing and limit its access to the capital markets. Further negative ratings action could also impact reinsurance contracts.
Legal and regulatory risksThe Group has been named, from time to time, as a defendant in various legal actions in connection with its operations. The Group is also involved, from time to time, in investigations and regulatory proceedings, certain of which could result in adverse judgments, settlements, fines and other outcomes. The number of these investigations and proceedings involving the financial services industry has increased in recent years, and the potential scope of these investigations and proceedings has also increased, not only in respect of matters covered by our direct regulators, but also in respect of compliance with broader business conduct rules such as market abuse regulations, anti-bribery legislation, anti-money laundering legislation and trade sanctions legislation. The Group could be subject to risks arising from alleged, or actual, violations of any of the foregoing, and could also be subject to risks arising from potential employee misconduct, including non-compliance with internal policies and procedures. Substantial legal liability could materially adversely affect the Group’s business, financial condition or results of operations or could cause significant reputational harm, which could seriously harm its business.
Insurance, operational and other risksAs part of the Group’s ordinary course operations, the Group is subject to a variety of risks, including risks that reserves may not adequately cover future claims and benefits, risks that catastrophic events (including hurricanes, windstorms, floods, earthquakes, industrial accidents, explosions, industrial actions, fires and pandemics) may expose the Group to
112 Swiss Reinsurance Company Consolidated 2011 Annual Report
General information | Note on risk factors
unexpected large losses, changes in the insurance industry that affect ceding companies, competitive conditions, cyclicality of the industry, risks related to emerging claims and coverage issues, risks arising from the Group’s dependence on policies, procedures and expertise of ceding companies, risks related to investments in emerging markets, and risks related to the failure of operational systems and infrastructure. In addition, the occurrence of future risks that the Group’s risk management procedures fail to identify or anticipate could have a material adverse effect on the Group. Any of the foregoing, as well as other concerns in respect of the Group’s business, could also give rise to reputational risk.
Use of models; accounting mattersThe Group is subject to risks relating to the preparation of estimates and assumptions that management uses, for example, as part of its risk models as well as those that affect the reported amounts of assets, liabilities, revenues and expenses in the Group’s financial statements, including assumed and ceded business. For example, the Group estimates premiums pending receipt of actual data from ceding companies, which actual data could deviate from the estimates. In addition, particularly with respect to large natural catastrophes, it may be difficult to estimate losses, and preliminary estimates may be subject to a high degree of uncertainty and change as new information becomes available. Deterioration in market conditions could have an adverse impact on assumptions used for financial reporting purposes, which could affect possible impairment of present value of future profits, fair value of assets and liabilities, deferred acquisition costs or goodwill. To the extent that management’s estimates or assumptions prove to be incorrect, it could have a material impact on underwriting results (in the case of risk models) or on reported financial condition or results of operations, and such impact could be material.
The Group’s results may be impacted by changes in accounting standards, or changes in the interpretation of accounting standards. The Group’s results may also be impacted if regulatory authorities take issue with any conclusions the Group may reach in respect of accounting matters. Changes in accounting standards could impact future reported results or require restatement of past reported results.
The Group uses non-GAAP financial measures in its external reporting, including in this report. These measures are not prepared in accordance with US GAAP or any other comprehensive set of accounting rules or principles, and should not be viewed as a substitute for measures prepared in accordance with US GAAP. Moreover, these may be different from or otherwise inconsistent with non-GAAP financial measures used by other companies. These measures have inherent limitations, are not required to be uniformly applied and are not audited.
Risks related to realignment of the Swiss Re corporate structure As Swiss Re Ltd moves to fully implement the realignment of its corporate structure in 2012 by separating the Corporate Solutions business unit and the Admin Re® business unit from the Reinsurance business unit, the Reinsurance business unit (comprised of Swiss Re and the legal entities remaining in the Group following the separation) could face operational risks relating to the implementation of the new structure. Following full implementation, with a changed legal entity profile, the Reinsurance business unit and its constituent subsidiaries will be impacted differently than would have been the case under Swiss Re’s historical structure, including, without limitation, in respect of legal and regulatory requirements (including as to capital and liquidity), ratings considerations, and lender and other counterparty considerations. Among other things, the realigned Group’s asset base will change, and capital, funding, reserve and cost allocations will be adjusted across the three business units, as a result of which the realigned Group’s liquidity and capital profiles will likely change and Swiss Re’s SST risk ratio may change.
General information
© 2012 Swiss Re. All rights reserved.
Title:Swiss Reinsurance Company Consolidated2011 Annual Report
Production:Logistics /Media Production
This report is available only at: www.swissre.com
Corporate calendar and contact informationCorporate calendar13 April 2012 Annual General Meeting Swiss Re Ltd
4 May 2012 First quarter 2012 results
9 August 2012 Second quarter 2012 results
8 November 2012 Third quarter 2012 results
Contact informationInvestor RelationsTelephone +41 43 285 4444Fax +41 43 282 [email protected]
Media RelationsTelephone +41 43 285 7171Fax +41 43 282 [email protected]
Share RegisterTelephone +41 43 285 3294Fax +41 43 282 [email protected]

Swiss Reinsurance Company Ltd Mythenquai 50 /60 P.O. Box 8022 Zurich Switzerland
Telephone +41 43 285 2121 Fax +41 43 285 2999 www.swissre.com