Embed Size (px)
Citation preview

See important disclosures, including any required research certifications, beginning on page 81
China Consumer Staples
What's new: We are cutting 2016-17E EPS for 9 of the 12 China
Consumer Staples companies by 2-33%. On our new numbers, the stocks
under Daiwa coverage are trading at PER discounts to international peers
(16x 2016E PER vs. 21x), despite the peers having slower EPS growth
(9% vs. 16% for packaged food companies, per Bloomberg). We believe
this disparity indicates the risk of an EPS growth slowdown for the China
players is priced in. In 2016E, we expect: 1) the revenue of most staples
players to slow further YoY from a relatively high base, and 2) gross-margin
expansion to slow as cost tailwinds ease. We remain Neutral on the sector.
What's the impact: Shift from big to small, old to new. We cut 2015-
17E revenue for 11 of the 12 companies by 1-14%, due mainly to: 1) shifts
in market share and channels, which often favour small players with new hit
products and foreign brands, and 2) a high consumption base for items like
beer and noodles, which means that market-share leaders can no longer
rely on their strengths (traditional distribution networks, dominant shares in
key categories), whereas small players are well placed because of their
flexibility in product launches. For example, we forecast Vinda to see a
revenue CAGR of 23% over 2015-17 due to its increasing exposure to
online channels, as well as acquisitions, vs. a flat (0%) CAGR for Hengan.
Cost tailwinds to subside: We still expect slight gross-margin expansion
for most of the staples downstream companies in 2016E (up <1pp YoY),
driven mainly by product-mix changes. Our growth forecasts are much
weaker than the surge seen in 2015E (2-4pp), as we believe some
commodity costs will rebound from a low base. At the same time, the weak
CNY:USD will likely weigh on companies with large proportions of USD
debt and/or imported raw materials. Hengan and Vinda have the most USD
exposure in terms of their COGS (30-60%).
What we recommend: We like relatively small companies with the potential
for revenue growth on market-share gains and/or product-mix
improvements. Hence, we upgrade Uni-President China (UPCH) (220 HK,
HKD5.20) to Buy (1), from Underperform (4); we also like Vinda (3331 HK,
HKD13.0, Outperform [2]). Want Want (151 HK, HKD4.96, Buy [1]) is our
sole Buy (1) among the large-cap staples companies (strong cash flow,
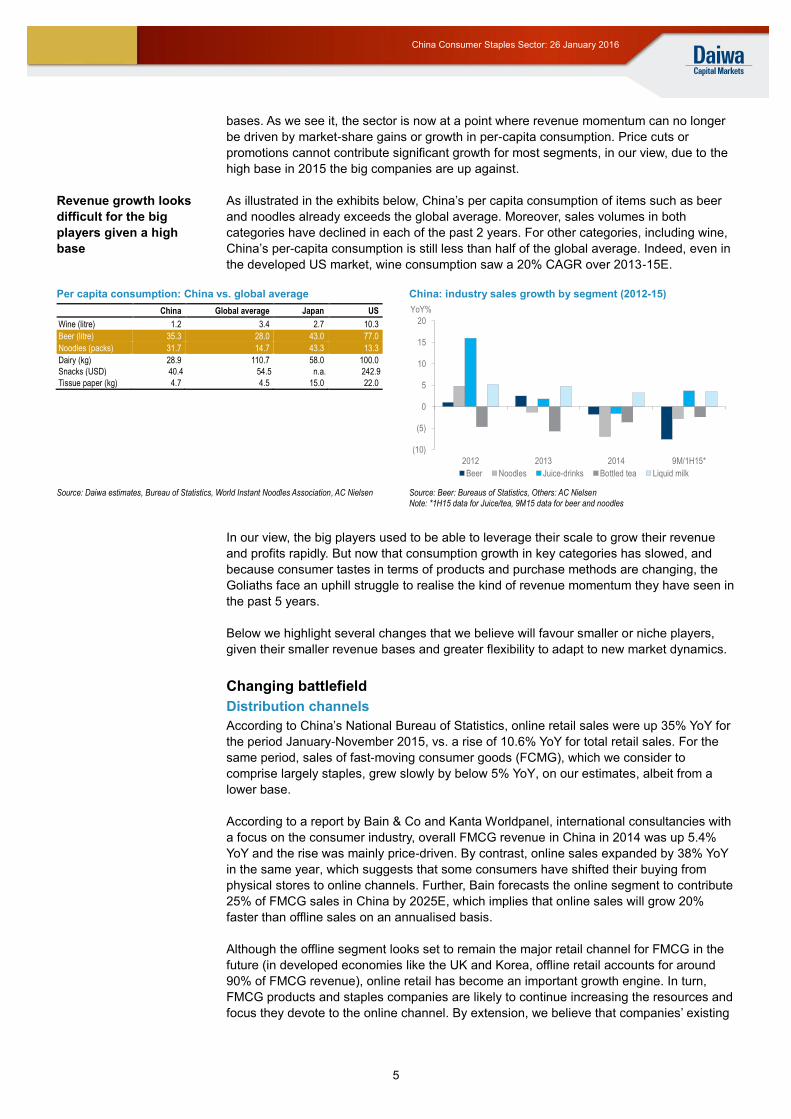
share buyback support). Meanwhile, we downgrade Hengan (1044 HK,
HKD67.75), Tingyi (322 HK, HKD9.07) and Fufeng (546 HK, HKD2.61) to
Hold (3) on price competition and potentially slow volume growth.
How we differ: Our 2016-17E revenue and EPS are 1-9% and 2-39%,
respectively, lower than consensus, reflecting our concern about market-
share losses among the big players, and our bearish CNY assumptions.
26 January 2016
China Consumer Staples Sector
Switch focus to the small wonders
With cost tailwinds likely to ease in 2016, we recommend focusing on fast-growing categories and premium products
We prefer small companies with revenue upside (“Davids”) over giants that can’t respond quickly to changing market dynamics (“Goliaths”)
Buy selectively: we like Vinda and upgrade UPCH to Buy (1); we downgrade Hengan, Tingyi and Fufeng to Hold (3)
Key stock calls
Source: Daiwa forecasts
Daiwa’s China Staples Sector coverage
Recommendation
The Davids
Vinda Outperform (2)
Modern Dairy Buy (1)
Huishan Sell (5)
Uni-President China Buy (1)
The Goliaths
Hengan Hold (3)
Mengniu Hold (3)
Tingyi Hold (3)
Tsingtao Underperform (4)
China Resources Beer Hold (3)
Fufeng Hold (3)
The Somewhere in betweens
Want Want Buy (1)
WH Group Outperform (2)
Source: Daiwa
Anson Chan, CFA(852) 2532 4350
New Prev.
Uni-President China (220 HK)Rating Buy Underperform
Target 6.20 7.00
Upside p 19.2%
Vinda International (3331 HK)Rating Outperform Outperform
Target 14.30 17.40
Upside p 10%
Want Want China (151 HK)Rating Buy Buy
Target 7.30 8.50
Upside p 47.2%
Hengan International Group (1044 HK)Rating Hold Outperform
Target 66.00 87.00
Downside q 2.6%
Tingyi Cayman Islands (322 HK)Rating Hold Outperform
Target 9.60 12.90
Upside p 5.8%

2
China Consumer Staples Sector: 26 January 2016
Sector stocks: key indicators
Source: Bloomberg, Daiwa forecasts
Daiwa’s China Staples Sector coverage: the Davids, the Goliaths, and the somewhere in-betweens
Recommendation Product Revenue YoY% Gross profit margin %
2015E 2016E 2017E 2015E 2016E 2017E
The Davids
Vinda Outperform (2) Tissue paper and personal hygiene products 18.0% 31.0% 16.2% 31.5% 32.1% 32.1%
Modern Dairy Buy (1) Raw milk and dairy products -0.9% 8.5% 7.8% 34.4% 35.5% 40.6%
Huishan # Sell (5) Raw milk and dairy products 13.9% 24.3% 13.8% 57.5% 55.9% 56.5%
Uni-President China Buy (1) Instant noodles and bottled drinks 5.1% 8.0% 4.9% 35.4% 36.2% 36.1%
The Goliaths
Hengan Hold (3) Tissue paper and personal hygiene products 2.0% -0.8% 1.1% 48.8% 49.5% 49.3%
Mengniu Hold (3) Dairy products -1.9% 3.7% 2.5% 32.2% 31.2% 31.5%
Tingyi Hold (3) Instant noodles and bottled drinks -9.4% 0.6% 2.5% 32.5% 32.3% 32.8%
Tsingtao Underperform (4) Beer -3.3% -4.2% 1.4% 31.4% 32.0% 32.7%
China Resources Beer Hold (3) Beer n.a. 3.8% 4.5% 34.6% 35.8% 36.4%
Fufeng Hold (3) MSG 4.1% 9.4% 1.0% 16.2% 14.7% 15.5%
The Somewhere in betweens
Want Want Buy (1) Snacks, dairy products -6.5% 6.1% 6.9% 43.6% 43.9% 43.8%
WH Group Outperform (2) Fresh and processed pork -1.0% 6.1% 5.4% 15.9% 15.6% 15.6%
Source: Daiwa forecasts Note: #FY16-18E numbers for Huishan as the company’s year-end is on 31 March
China Consumer Staples Sector: contribution of commodities to 2016E COGS (downstream) and revenue (upstream) (%)
Industry Snacks/
Soft drinks and noodles Dairy products Brewery Personal-care products Packaged meat dairy beverage
Company Want Want Tingyi UPC Mengniu Huishan Modern Dairy Tsingtao/CRB Hengan Vinda WH Group
Locally sourced /sourced in non-USD currencies
Palm oil <2 7 7
Flour <3 8 8
Sugar 5 5 5 3-5%
PET chips <5 30 30 <10 <5%
Pork
China: 70-80% of COGS
Raw Milk <3
30-40 ~30% of revenue
~80% of revenue
Corn
Feed: 70% of upstream operation
Sourced overseas
Milk powder 15%
10%
Wood pulp – short fibre
~10-15% 50-60%
Wood pulp – long fibre
Source: Daiwa estimates
Share
Company Name Stock code Price New Prev. New Prev. % chg New Prev. % chg New Prev. % chg
China Huishan Dairy Holdings 6863 HK 2.95 Sell Sell 1.87 1.60 16.9% 0.055 0.056 (1.9%) 0.073 0.088 (17.9%)
China Mengniu Dairy 2319 HK 11.08 Hold Hold 11.70 14.50 (19.3%) 0.663 0.695 (4.5%) 0.636 0.752 (15.4%)
China Modern Dairy Holdings 1117 HK 1.45 Buy Buy 3.00 3.30 (9.1%) 0.126 0.156 (19.5%) 0.172 0.214 (19.6%)
China Resources Beer 291 HK 12.30 Hold Hold 12.40 13.40 (7.5%) 0.361 0.399 (9.6%) 0.530 0.517 2.5%
Fufeng Group 546 HK 2.61 Hold Buy 2.55 5.00 (49.0%) 0.241 0.254 (5.0%) 0.260 0.348 (25.1%)
Hengan International Group 1044 HK 67.75 Hold Outperform 66.00 87.00 (24.1%) 3.487 3.742 (6.8%) 3.675 4.195 (12.4%)
Tingyi Cayman Islands 322 HK 9.07 Hold Outperform 9.60 12.90 (25.6%) 0.067 0.069 (3.9%) 0.069 0.079 (12.4%)
Tsingtao Brewery 168 HK 28.80 Underperform Underperform 26.80 32.00 (16.3%) 1.211 1.305 (7.2%) 1.191 1.330 (10.4%)
Uni-President China 220 HK 5.20 Buy Underperform 6.20 7.00 (11.4%) 0.195 0.197 (0.9%) 0.232 0.219 6.2%
Vinda International 3331 HK 13.00 Outperform Outperform 14.30 17.40 (17.8%) 0.479 0.641 (25.3%) 0.570 0.851 (33.1%)
Want Want China 151 HK 4.96 Buy Buy 7.30 8.50 (14.1%) 0.042 0.046 (9.7%) 0.050 0.054 (7.8%)
WH Group 288 HK 4.40 Outperform Outperform 4.80 5.50 (12.7%) 0.042 0.041 1.8% 0.056 0.054 2.6%
Rating Target price (local curr.) FY1
EPS (local curr.)
FY2

3
China Consumer Staples Sector: 26 January 2016
Table of contents
2016: the year when strengths become weaknesses ............................................ 4
Big players are likely to underperform this year..................................................................4
Prefer the Davids to the Goliaths ..................................................................................... 10
Cost tailwinds to subside .......................................................................................13
Cost trends turned neutral on gross margins ................................................................... 13
Impact of CNY depreciation – mainly on the debt side ..................................................... 18
Valuations and recommendations .........................................................................20
Rerating opportunity for selected stocks .......................................................................... 20
The Davids ...................................................................................................................... 22
The Goliaths .................................................................................................................... 24
The somewhere in-betweens ........................................................................................... 27
Risk ..................................................................................................................................... 28
Commodity prices – main risks, upside or downside ........................................................ 28
Downside ........................................................................................................................ 28
Company Section
Uni-President China ......................................................................................................... 29
Vinda International ........................................................................................................... 33
Want Want China ............................................................................................................. 37
China Modern Dairy Holdings .......................................................................................... 41
WH Group ........................................................................................................................ 46
China Resources Beer ..................................................................................................... 50
Hengan International Group ............................................................................................. 54
Tingyi Cayman Islands ..................................................................................................... 58
China Mengniu Dairy ....................................................................................................... 62
Fufeng Group .................................................................................................................. 66
Tsingtao Brewery ............................................................................................................. 70
China Huishan Dairy Holdings ......................................................................................... 74

4
China Consumer Staples Sector: 26 January 2016
2016: the year when strengths become weaknesses
We believe a combination of consumers’ changing preferences and macro headwinds led
to a slowdown in revenue growth (and in some cases declines in revenue) for the big
China staples players in 2015, and we see this situation persisting into 2016.
Amid cost normalisation, we think promotions in commodity-like segments such as UHT
milk and bottled water will weigh on companies’ gross margins in 2016E. Hence, we prefer
the small players, which we see as more nimble and quicker to adapt to changes in the
macro picture through product premiumisation and new business initiatives (eg, M&A and
from a low revenue base). By contrast, we believe the big players will struggle to expand
their top lines from a high base.
For example, we expect Modern Dairy’s gross margin to expand significantly over 2015-
17E despite its exposure to pricing risks, as we forecast an increasing revenue and profit
contribution from its downstream operation.
We show below our coverage universe split into 3 groups: the big players (the Goliaths),
the small players (the Davids), and then those in between. For the purposes of this report,
‘big’ means a company with a dominant or near-dominant market share and/or a national
presence with its distribution network. Among the Goliaths, we note that, since 2014,
revenue growth has turned negative or at best has been flat.
However, among the Davids, we see potential for even faster revenue growth and ASP
hikes (vs. the Goliaths) on the back of improving penetration and expanding production/
distribution scale. We think the Davids have also shown more flexible sales and marketing
strategies than the Goliaths, as evidenced by their accelerated revenue growth in 2015.
Our third group, those companies “somewhere in between”, are involved in a few sub-
segments (some fast-growing, others slow-growing) or are the leading players in
fragmented industries with low per-capita consumption.
Daiwa’s China Staples Sector coverage: the Davids, Goliaths, and somewhere in-betweens
Recommendation Product Revenue YoY% Gross-profit margin %
2015E 2016E 2017E 2015E 2016E 2017E
The Davids
Vinda Outperform (2) Tissue paper and personal hygiene products 18.0% 31.0% 16.2% 31.5% 32.1% 32.1%
Modern Dairy Buy (1) Raw milk and dairy products -0.9% 8.5% 7.8% 34.4% 35.5% 40.6%
Huishan # Sell (5) Raw milk and dairy products 13.9% 24.3% 13.8% 57.5% 55.9% 56.5%
Uni-President China Buy (1) Instant noodles and bottled drinks 5.1% 8.0% 4.9% 35.4% 36.2% 36.1%
The Goliaths
Hengan Hold (3) Tissue paper and personal hygiene products 2.0% -0.8% 1.1% 48.8% 49.5% 49.3%
Mengniu Hold (3) Dairy products -1.9% 3.7% 2.5% 32.2% 31.2% 31.5%
Tingyi Hold (3) Instant noodles and bottled drinks -9.4% 0.6% 2.5% 32.5% 32.3% 32.8%
Tsingtao Underperform (4) Beer -3.3% -4.2% 1.4% 31.4% 32.0% 32.7%
China Resources Beer Hold (3) Beer n.a. 3.8% 4.5% 34.6% 35.8% 36.4%
Fufeng Hold (3) MSG 4.1% 9.4% 1.0% 16.2% 14.7% 15.5%
The somewhere in betweens
Want Want Buy (1) Snacks, dairy products -6.5% 6.1% 6.9% 43.6% 43.9% 43.8%
WH Group Outperform (2) Fresh and processed pork -1.0% 6.1% 5.4% 15.9% 15.6% 15.6%
Source: Daiwa Note: #FY16-18E numbers for Huishan as the company’s year-end is on 31 March
Big players are likely to underperform this year
Challenging conditions for big players to realise revenue growth
In a fast-growing economy and consumer market like China, it is natural for the revenue
growth of large companies with significant market shares (say, 25-50%) to track the
revenue growth of the broader sector. At the same time, given the high bases for
comparison, it becomes ever more difficult for giant companies to expand their revenue
Most staples categories
in China have seen flat
revenue, if not YoY
declines, since 2014
5
China Consumer Staples Sector: 26 January 2016
bases. As we see it, the sector is now at a point where revenue momentum can no longer
be driven by market-share gains or growth in per-capita consumption. Price cuts or
promotions cannot contribute significant growth for most segments, in our view, due to the
high base in 2015 the big companies are up against.
As illustrated in the exhibits below, China’s per capita consumption of items such as beer
and noodles already exceeds the global average. Moreover, sales volumes in both
categories have declined in each of the past 2 years. For other categories, including wine,
China’s per-capita consumption is still less than half of the global average. Indeed, even in
the developed US market, wine consumption saw a 20% CAGR over 2013-15E.
Per capita consumption: China vs. global average China: industry sales growth by segment (2012-15)
China Global average Japan US
Wine (litre) 1.2 3.4 2.7 10.3
Beer (litre) 35.3 28.0 43.0 77.0
Noodles (packs) 31.7 14.7 43.3 13.3
Dairy (kg) 28.9 110.7 58.0 100.0
Snacks (USD) 40.4 54.5 n.a. 242.9
Tissue paper (kg) 4.7 4.5 15.0 22.0
Source: Daiwa estimates, Bureau of Statistics, World Instant Noodles Association, AC Nielsen
Source: Beer: Bureaus of Statistics, Others: AC Nielsen
Note: *1H15 data for Juice/tea, 9M15 data for beer and noodles
In our view, the big players used to be able to leverage their scale to grow their revenue
and profits rapidly. But now that consumption growth in key categories has slowed, and
because consumer tastes in terms of products and purchase methods are changing, the
Goliaths face an uphill struggle to realise the kind of revenue momentum they have seen in
the past 5 years.
Below we highlight several changes that we believe will favour smaller or niche players,
given their smaller revenue bases and greater flexibility to adapt to new market dynamics.
Changing battlefield
Distribution channels
According to China’s National Bureau of Statistics, online retail sales were up 35% YoY for
the period January-November 2015, vs. a rise of 10.6% YoY for total retail sales. For the
same period, sales of fast-moving consumer goods (FCMG), which we consider to
comprise largely staples, grew slowly by below 5% YoY, on our estimates, albeit from a
lower base.
According to a report by Bain & Co and Kanta Worldpanel, international consultancies with
a focus on the consumer industry, overall FMCG revenue in China in 2014 was up 5.4%
YoY and the rise was mainly price-driven. By contrast, online sales expanded by 38% YoY
in the same year, which suggests that some consumers have shifted their buying from
physical stores to online channels. Further, Bain forecasts the online segment to contribute
25% of FMCG sales in China by 2025E, which implies that online sales will grow 20%
faster than offline sales on an annualised basis.
Although the offline segment looks set to remain the major retail channel for FMCG in the
future (in developed economies like the UK and Korea, offline retail accounts for around
90% of FMCG revenue), online retail has become an important growth engine. In turn,
FMCG products and staples companies are likely to continue increasing the resources and
focus they devote to the online channel. By extension, we believe that companies’ existing
(10)
(5)
0
5
10
15
20
2012 2013 2014 9M/1H15*
Beer Noodles Juice-drinks Bottled tea Liquid milk
YoY%
Revenue growth looks
difficult for the big
players given a high
base

6
China Consumer Staples Sector: 26 January 2016
strengths in the traditional channel will be less effective in driving revenue growth and
defending their market share going forward.
Staples items now sold online in China include infant formula (>15% of total sales in China
by channel) and nappies/diapers (>30%), relatively high-value products (per item) for
which international brands tend to be the most popular. But we are also seeing rapid
growth in online revenue for daily-use items such as tissue paper (less than 5% YoY
growth by volume in hypermarket channels in 2015, vs. 20%-plus growth online, on our
estimates).
We believe the disparity in sales growth between online and offline channels will continue,
underlining the need for staples brands to expand their presence online. On our estimates,
most of the staples companies under our coverage currently derive less than 3% of their
revenue from online platforms. The one exception is Vinda, which derived 10% of its
revenue from online retail channels in 1H15.
In 2016E, we believe revenue growth from online platforms for personal hygiene products
will outpace that for other staples segments, since consumers seem to have adapted
quickly to buying such products online.
FMCG: online market share by country China FMCG: market share by channel
Source: Kanta Worldpanel Source: Kanta Worldpanel
Demographics
Consumers are still price-sensitive, but many are now starting to consider food quality,
safety and taste when purchasing FMCGs. As shown below, the income levels of urban
citizens increased by a 13% CAGR between 2004 and 2014 (10% on an inflation-adjusted
base), showing real consumption power increased. Moreover, the dependency ratio also
declined to 36% in 2014 from 41% in 2004 according to government statistics, meaning
that the new consumption class (from students to working class) has more money than
their parents did to spend on themselves.
China: income levels – 10 years ago vs now, adjusted for CPI Chine: no. of households by monthly income (CNY 000)
Source: : Bureau of Statistics, Daiwa estimate Source: Boston Consulting Group report
1.6 2.2
15
0
5
10
15
20
25
30
35
2012 2014 2025E
China France Korea UK
0%
20%
40%
60%
80%
100%
2012 2013 2014
Other Convenience store
Grocery stores Hypermarket
Supermarkets and minimarts E-commerce
0
10
20
30
40
50
0
10,000
20,000
30,000
40,000
50,000
2000
2001
2002
2003
2004
2005
2006
2007
2008
2009
2010
2011
2012
2013
2014
Annual salary of urban employee (inflation-adjusted)
Dependency ratio (RHS)
CNY %
6 2160
0
100
200
300
400
500
2014 2020E 2030E
Affluent (>23) Upper middle ( 12- 23)Middle ( 8 - 12) Emerging Middle ( 5 -8 )Aspirant (2.8 - 5) Poor <2.8
Chinese consumption
power is still growing

7
China Consumer Staples Sector: 26 January 2016
During 2H15, we met the managements of a number of consumer companies across
different segments – packaged food, beverages, sportswear distribution, personal care
products, etc. Many of them said they had developed a product mix and marketing
strategies to target the top 20-30% of the household/income class. We note that Tingyi and
UPCH launched new products in high-end categories in 2Q-4Q15 (at retail ASPs at least
20% above their mass-market products). Their new products have also focused on the
value of nutrients and health (eg, MSG free instant noodles, sugar-free tea, nectars, etc).
Faster category shift and shorter product life cycle
However, the life cycles for new products are becoming shorter, a trend that is particularly
obvious for beverage products. Over the past 5 years, we have seen revenue growth for
pear juice accelerate and then slow down (up 50% YoY in 2012, then flat/declining over
2013-15), the market size for milk tea almost double (revenue rising by 82% YoY for 2012,
falling to 9% YoY in 2013), and revenue growth for room temperature yoghurt drinks rise by
more than 100% pa over 2011-13, then slow to 35% in 2014. In other words, these new
beverage categories experienced fast revenue growth within the first 2-3 years of launch,
but most saw revenue growth slow significantly, or even reverse to a decline, thereafter.
For new beverage categories, it’s easier for newcomers and small players to compete
against the big players as new and niche markets are fast-growing and have few historical
price-reference points. We observe that, in the past 5 years, it has not usually been the
No.1 player in the market that has launched a new niche product that has seen fast
revenue growth. For example, milk tea and room-temperature yoghurt drinks were
launched by 2nd
or lower ranked players, like UPCH and Bright Dairy (600597 CH, not
rated), with less than 20% nationwide market share.
We believe big players are less keen to launch new flavours for fear of them causing
product cannibalisation (ie, leading to a sales shift among different divisions rather than
gaining market share from competitors. For example, Mengniu’s sales growth for its
premium UHT milk and room temperature yoghurt in 1H15 was largely offset by the sales
decline for milk beverages as well as mass market UHT milk). Even if a big player
launches a new product successfully and posts fast revenue growth initially, the impact on
the company’s revenue and profit is likely to be lower than that for a small player due to the
bigger company’s higher revenue base.
China: beverage consumption breakdown 2010 vs. 2012 vs. 2014
China: growth rates of various “start products” (2011-15)
Source: AC Nielsen, Tingyi Source: Companies, Daiwa estimates Note: Juice-drinks – estimated from Tingyi financials; Milk tea/Laotan noodles: from UPCH, Hot-
kid milk – Want Want. Room-temperature yoghurt: Bright Dairy numbers
Price promotions not effective in driving bottom lines
Due to the distribution and production scale advantages of the Goliaths, they usually enjoy
lower production costs (as a result of economies of scale, bulk purchases of raw materials,
etc.) and are more keen on price cuts to promote sales volumes (reference Hengan’s
reduction of its tissue paper prices in 2014; Tsingtao’s expansion in the mass-market
segment since 2013 by selling more mid-to-low end sub-brand products). However, since
19.1 16.9 15.5
30.9 31.2 33.1
28.523.6 22.1
1817.8 15.4
3.5 10.5 13.9
0%
20%
40%
60%
80%
100%
2010 2012 2014
RTD tea Bottled water
carbonated drinks Juice
Sportsdrink, herbal tea and others
(50%)
0%
50%
100%
150%
200%
2011 2012 2013 2014 2015E
Juice-drinks Hot-kid milk
Milk tea Room-temperature yogurt
Laotan noodles
New products can attract
new customers but also
lead to cannibalisation
Price cuts offset volume
growth and lead to
gross-margin pressure

8
China Consumer Staples Sector: 26 January 2016
the beginning of 2015, price competition does not seem to have been such an effective
tool for gaining market share, as evidenced by Hengan and Tsingtao’s YoY revenue
declines in 1H15.
We believe that health consciousness, variety and image are now important factors
determining consumer purchases, as affordability of FMCG items increases (supported by
increasing income levels). Consumers seem willing to pay a premium if the products can
provide value such as quality, safety (eg, personal hygiene products) or are purchased at
high-profile locations (eg, entertainment clubs or high-end restaurants). Moreover, in some
categories like the dairy segment, the number of brands available to Chinese consumers
has expanded rapidly over the past 5 years due to dairy farms moving into downstream
production, and foreign companies aggressively promoting their products in China (in
particular through e-commerce). As a result, existing domestic players have not been able
to grow their sales volumes by cutting prices because many competitors have followed the
same strategy.
To follow are some trends we see in a variety of markets:
Rice crackers: in 1H15, Want Want’s rice cracker sales rose by 10% YoY, driven mainly
by gift packs (up 41% YoY) and core brands (up 8% YoY); while revenue for the sub-
brands, which are at least 30% cheaper than the core brands, was up only 5% YoY. We
believe consumers continue to favour Want Want’s core brand products due to their better
quality and brand image, in particular if they are purchased as gift items.
Dairy: for both Yili and Mengniu, their premium UHT milk products and star product sales
exceeded their total revenue growth in 1H15. Those products’ ASPs are at least 50%
above mass-market product prices, but they are perceived to have better nutrient value.
According to Frost and Sullivan, high-end UHT milk retail sales in China will reach
CNY89bn by 2017E, representing a 3-year CAGR of 21% (vs. 5% for mass-market
products) and the revenue contribution of high-end UHT milk to the total UHT market will
reach 45% in 2017E, from 31% at present.
Want Want: rice cracker sales YoY – sub-brands vs. core brands (1H15)
China: premium UHT milk sales vs. mass-market sales
Source: Want Want Source: Frost and Sullivan
Bottled water: We believe Tingyi’s loss of bottled water market share since 1Q15 is
evidence of consumers’ increasing awareness of brand image and the difficulty of
companies remaining competitive on price alone. According to AC Nielsen, Tingyi’s bottled
water market share slid by 2pp YoY in 1Q15, when it raised its bottled water retail ASP by
about 20% (from CNY1 for a 500ml bottle, the cheapest national brand we found in the
market, to CNY1.2, in line with most peers, based on our estimates). Although Tingyi at the
same time has increased the weight of its bottle to make it look more high-quality, and
rebranded the product “Youyue” (meaning excellent and joy, in English), we believe Tingyi
has long been regarded as a cheap brand in the eyes of consumers due to its below-peer
pricing since launching its bottled-water product in 2004. In our view, it will take more effort
on the part of the company to step up its advertising and marketing to build brand loyalty.
0%
5%
10%
15%
20%
25%
30%
35%
40%
45%
Core brands Gift brands Sub-brands
YoY
64.9 71.3 76.1 78.9 92 97 103 109.7 116 121.7 126.9 131.112.2 16.1 17.9 20.829 34.6 41.7
50.661.2
73.889
107.2
0
50
100
150
200
250
300
2007
2008
2009
2010
2011
2012
2013
2014
2015
E
2016
E
2017
E
2018
E
Mass market Premium
CNY bn
Brand loyalty has
become a more
important factor in
beverage purchasing
decisions

9
China Consumer Staples Sector: 26 January 2016
Tingyi: market share (%) and revenue (USDm) of bottled water segment
Source: Company
International brands more attractive than local brands, mainly in personal-care products
According to Kantar Worldpanel, most domestic players gained market share in major F&B
categories in China in 2014. We believe that since 2014 domestic players have been, and
are still, responding more quickly than international players to adapt to changes in local
preferences and to accommodate the appetite of Chinese consumers. Exceptions include
beer (which we believe is due to ABInBev’s successful penetration of the high-end market
segment in China), instant noodles (from a low base) and chocolate (more imported goods
available).
Foreign players though have gained market share in personal-care products, particularly
facial and toilet tissue. Foreign brands also gained share in the baby diaper market in
2014, according to Euromonitor, while Hengan (the biggest domestic player) lost market
share. The Japanese players seemed to take market share in sanitary napkins in 2014
(around 7%) albeit at a gradual pace – Unicharm’s market share was up 0.8pp YoY to
5.7% in volume terms, slightly faster than market leader Hengan.
We attribute the better performance of foreign brands in personal care products than in
F&B items to: 1) their production technology and raw-material quality (Japanese brands in
particular) being perceived as better than domestic peers’; consumers are more concerned
about quality (convenience and hygiene) than prices in those products, and 2) lower
logistical costs (smaller size and lower weight of diapers and sanitary napkins vs. F&B)
which makes personal care products high-margin and frequently purchased products for e-
commerce retail platforms. For staples companies to ride on that trend they would need to
cooperate with strategic investors/JVs to introduce foreign products in China, in particular
personal hygiene products.
We believe Vinda has been aggressively promoting its premium foreign brand, Tempo,
after obtaining its licensing and distribution rights in China in 2013, while Hengan has not
sought any international partnership yet. While both Davids and Goliaths can seek co-
operation with international partners, there have been successful cases for Goliaths in the
past 2 years (eg, both Tingyi and Tsingtao ended their co-operation with Japanese partners
in 2015).
20%22% 22%
19%18% 18%
19%
0%
5%
10%
15%
20%
25%
0
100
200
300
400
500
1Q14 2Q14 3Q14 4Q14 1Q15 2Q15 3Q15
Revenue Market share
USD m

10
China Consumer Staples Sector: 26 January 2016
International brands: market-share changes (2014)
Foreign brands are
gaining market share in
beer, chocolate and
instant noodles, as well
as personal care
products
Source: Kanta Worldpanel
Prefer the Davids over the Goliaths
In consideration of the above demographic and consumption pattern changes, we prefer
the Davids (small players) to the Goliaths (big players) in most staples sub-segments, as
we believe it is easier for the Davids to grow revenue (volume) from a low base compared
with the Goliaths. In our view, it is difficult for Goliaths to leverage on their past strengths
(eg, strong traditional channels, cost advantage, etc.) to grow revenue or expand gross
margins, as many are already operating amid optimal conditions (in terms of utilization
rates, cost reduction through bulk-purchases, etc.). We discuss below what Goliaths and
Davids are doing.
The Goliaths’ strategy – co-operation with foreign players
In our opinion, the Goliaths need to think about how to tap their existing assets (consumer
bases, brands and networks) by finding new revenue sources, such as new product
categories (through partnerships with foreign brands or in-house development), upgrading
their existing products (for higher ASPs and gross margins) or engaging in more R&D in
order to reduce costs. Some examples are shown below.
Tingyi formed JVs with a number of foreign players (Calibee, Wakado and Prima) in 2013
to launch snacks and other new products. Tingyi eyed the product development and brand
recognition of those partners overseas and wanted to distribute such new products by
leveraging on its own distribution network in China. However, all those JVs still contribute
less than 2% of the company’s revenue at present based on our estimates, and Tingyi
terminated one of the co-operation agreements (with Calibee) in 4Q15, as it had remained
unprofitable for years and Calibee wanted to seek other opportunities to grow in China.
Tsingtao formed a JV with Suntory in 2013 to expand in eastern China. Suntory is
responsible for production and Tsingtao for distribution and marketing. However, Suntory
sold its stake in the JV to Tsingtao in 4Q15 after years of loss-making, leaving Tsingtao
with the losses to deal with.
Mengniu formed a JV with strategic investor Danone in 2014 to develop yoghurt and other
cold-chain products in China. We estimate Danone’s yoghurt products gained 1pp market
share for Mengniu in 2015E and helped upgrade Mengniu’s production technology and
brand recognition. In December 2015, Yashili (1230 HK, not rated), Mengniu’s infant
formula subsidiary, also announced that it planned to acquire Danone’s infant formula
business in China for HKD1.2bn. However, we are cautious on Mengniu’s co-operation
with Danone in the infant formula business, as it is not an exclusive partnership. Danone is
developing an imported and premium infant formula brand, Nutricia, on its own in China,
and because of the non-exclusive nature of its partnership, Mengniu will not benefit from
the fast growth of this high-end infant formula segment.
2.1 1.8 1.6 1.6 1.3 1.2 1.20.2
-0.1 -0.2 -0.3 -0.6 -0.6 -0.9 -1 -1.1 -1.1 -1.4 -1.7 -1.8-2.4 -2.8 -3.1
-3.8 -3.8-4.8(6)
(5)(4)(3)(2)(1)
0123
Tol
iet t
issu
e
Bee
r
Hai
r co
nditi
oner
Inst
ant n
oodl
es
Che
win
g gu
m
Cho
cola
te
Car
bona
ted
drin
ks
Fac
il tis
sue
Sha
mpo
o
Bab
y di
aper
s
Yog
urt
Milk
Per
sona
l was
h
Fab
ric d
eter
gent
s
Bot
tled
tea
toot
hbru
sh
cand
y
bottl
ed w
ater
toot
hpas
te
kitc
hen
clea
ner
Bis
cuits
Juic
e
Infa
nt fo
rmul
a
Col
or c
osm
ecits
fabr
ic s
ofte
ner
Ski
ncar
e
Market share changes (%)

11
China Consumer Staples Sector: 26 January 2016
Want Want co-operated with Morinaga to launch pudding products in 1H15. We estimate
the products contribute only about 0.5% of the company’s revenue at present, but this
figure should expand further in 2016E.
The Davids’ strategy – niche products, new distribution channels
Davids – based on our observations, the Davids are more flexible and quicker in terms of
decision-making and responding to changes in the market. For example, in provinces or
cities where there are no direct distributors of their products, the Davids can make use of
the e-commerce channel without cannibalising the benefits of distributors, while big players
with national distributors may find it difficult to provide incentives for new (online)
distributors to promote products without jeopardising existing distributors. The risk of
cannibalization between old and new products is also lower for Davids due to their
relatively smaller product portfolios.
Vinda has been the No.1 household paper brand on the e-commerce platform in China
since mid-June 2015 (No. 3 in the total market). It has developed different packaging for its
online platform to differentiate these items from its offline items. E-commerce transactions
accounted for about 10% of its revenue in 1H15 (vs. <5% for its closest competitor,
Hengan) and were profitable. Moreover, competitor Hengan has low exposure to e-
commerce (3% of revenue in 2015E). With the acquisition impact, we expect Vinda’s
revenue growth to rise at a 23% CAGR over 2015-17E, on our forecasts, due to its
increasing exposure to online channels and acquisitions, vs. a flat (0%) CAGR for Hengan
over the same period.
Modern Dairy was a late-comer to the China dairy downstream market, launching its own-
branded products only in 2010 (pasteurized milk) on a small scale, followed by its first UHT
product in 2013. To differentiate itself from market leaders like Mengniu and Yili, Modern
Dairy focuses on premium products and selected regions only. The company also seldom
uses TV commercials for advertising and promotions. Modern Dairy has around an 8%
market share in the premium UHT milk market in China (AC Nielsen data in 3Q15), and its
downstream net margin (of 12%) is higher than the large players’ (6-10%), thanks to its
vertically-integrated model.
Vinda: revenue breakdown by channel Modern Dairy: revenue contribution from downstream
Source: Company, Daiwa estimates Source: Company, Daiwa forecasts
Uni-President China (UPCH) regained market share in instant noodles in China (from
around 11% in 2011 to ~18% in 2015E, according to AC Nielsen) through introducing new
flavours and categories (eg, Laotan pickled vegetable noodles, Soup Daren brand, etc.)
and had successfully turned the business around in 2H14. The company also launched a
number of new beverages in 2014-15 targeting the high-end market and consumers in top-
tier Chinese cities.
Want Want has a strong record of product diversification (>600 SKUs of snack items,
based on our estimates) and product development capability, such that it resembles a
group of Davids rather than a big Goliath. We are confident that WW’s snack business can
1.6% 3.6% 5.1% 8.6% 9.8%
0%
10%
20%
30%
40%
50%
60%
70%
80%
90%
100%
1H13 2H13 1H14 2H14 1H15
Traditonal KA Corporate clients E-Commerce
0%
5%
10%
15%
20%
25%
30%
35%
40%
0
500
1,000
1,500
2,000
2,500
3,000
2012 2013 2014 2015F 2016E 2017E
Downstream revenue as a ratio of total
CNY m
The Davids and Goliaths
have to adopt different
strategies — and we
believe the Davids stand
a better chance of
growth

12
China Consumer Staples Sector: 26 January 2016
still grow in volume terms as the market is still fragmented. According to Frost and Sullivan,
the top-10 players only accounted for 30% of the market in 2014, while WW stood out at
No. 1 with a 5% share. The market is divided up amongst the big and small Davids, each
with its niche (eg, WW’s rice cracker is No.1 with a c70% market share).
UPCH: products launched in the past 24 months
Beverage No. of flavours Suggested retail price Launch date What's special about the product?
Xiaoming classmate tea 4 CNY 5 Mar-15 Special bottle design and cold-brewed
Haizhiyen 3 CNY 5 Apr-14 Sea-salted low-sugar fruit juice
Chinese mixed fruit drinks 2 CNY 5 May-15 Mixed Chinese fruit juice for health
Nectars 3 n.a. Soon Nutritious and Western-style
Asamu in little bottles 2 CNY 6 3Q15 Using chilled milk instead of milk powder
Xiaoye milk tea 3 CNY 3 1H15 Targets primary and secondary students
Noodles No. of flavours Suggested retail price Launch date What's special about the product?
Champion 2 CNY 10-12 Nov-14
Soup Dairen 4 (2 more to come) CNY 8 Re-launched with new flavours 2 years ago
Vege-light Noodles 3 CNY 5 Oct-15
Gemien 2 CNY 5 4Q14
Noodles No. of flavours Suggested retail price Launch date What's special about the product?
Champion 2 CNY 10-12 Nov-14
Soup Dairen 4 (2 more to come) CNY 8 Re-launched with new flavours 2 years ago
Vege-light Noodles 3 CNY 5 Oct-15
Source: Company, Daiwa

13
China Consumer Staples Sector: 26 January 2016
Cost tailwinds to subside
Cost trends turned neutral on gross margins
Most of the downstream staples companies that we cover are likely to see significant gross
margin expansion over 2014-15E, on the back of lower raw-material costs. However, this
trend could reverse in 2016E as the prices of some raw materials rebounded in 4Q15, and
those of many others turned steady in 2H15. Furthermore, CNY depreciation against the
USD is also likely to have a negative impact on the cost of imported raw materials (eg,
wood pulp).
As shown in the following chart, we expect the gross margins of the downstream staples
companies to have expanded by 1.3-3.4pp YoY for 2015E. For the upstream dairy farm
and grain processing companies, we forecast their gross margins to have declined for the
same period due to lower ASPs. For 2016E, we expect the gross margins for the upstream
companies to change by only 1pp (plus or minus), mainly due to price promotions or
product mix upgrades, rather than changing raw material costs. For the upstream
companies, we expect a slight improvement in their gross margins due to a slight increase
in ASP.
China Consumer Staples Sector: gross margins
Gross-margin expansion
could slow in 2016E
Source: Company, Daiwa forecasts
Outlook for raw-material costs
The following table shows the contribution to COGS of various raw materials for the
consumer staples companies for 2015E. Most of the necessary raw materials can be
sourced locally in China or the rest of Asia (not denominated in USDs and hence, are
cushioned from the rising USD). The personal-care product companies have the highest
exposure to imported raw materials.
China Consumer Staples Sector: contribution of commodities to 2016E COGS (downstream) and the revenue (upstream) (%)
Industry Snacks/
Soft drinks and noodles Dairy products Brewery Personal-care products Packaged meat dairy beverage
Company Want Want Tingyi UPC Mengniu Huishan Modern Dairy Tsingtao/CRB Hengan Vinda WH Group
Locally sourced /sourced in non-USD currencies
Palm oil <2 7 7
Flour <3 8 8
Sugar 5 5 5 3-5%
PET chips <5 30 30 <10 <5%
Pork
China: 70-80% of COGS
Raw Milk <3
30-40 ~30% of revenue
~80% of revenue
Corn
Feed: 70% of upstream operation
Sourced overseas
Milk powder 15%
10%
Wood pulp – short fibre
~10-15% 50-60%
Wood pulp – long fibre
Source: Daiwa estimates
35.4%
43.6%
32.6%
16.2%
34.9%30.9% 32.2%
48.8%
31.5%
58.6%
32.3%
16.9%
10%
20%
30%
40%
50%
60%
UPCH Want Want Tingyi WH Group CRB Tsingtao Mengniu Hengan Vinda Huishan ModernDairy
Fufeng
2014 2015 2016E 2017E

14
China Consumer Staples Sector: 26 January 2016
Milk powder
We believe the price of milk powder imported into China will bottom out in 1Q16 and
gradually pick up throughout 2016E. In December 2015, Fonterra, the operator of the
largest dairy-product trading platform globally and the key co-operative for dairy farms in
New Zealand, maintained its milk payout rate to its suppliers until May 2016 (at
NZD4.6/kg). Fonterra expects the price of milk powder to rise in 2016 as the global glut
dissipates and the China manufacturers (food processing companies and dairy beverage
producers) start to purchase more after the milk powder inventory has normalised.
The milk powder spot price on the international market has risen by 42% from its trough of
USD1,560/tonne in August 2015, while China’s powder import price (the actual cost for
producers in China) declined by an average of 17% in 2015. As the import price at China
customs typically lags the international spot price by 4-6 months due to transportation
factors, we expect the powder price in China to be relatively low in 1H16 before trending
up in 2H16.
Raw milk (China)
According to the Ministry of Agriculture, the price of raw milk price increased by 3%QoQ for
4Q15 vs. September 2015. However, we now turn more cautious on the raw milk price
outlook for 2016E, due to the declining feed cost, some of the large raw milk suppliers
could lower their ASPs to expand their sales volume, implying pricing pressure in the
industry. Moreover, despite the recent rebound in milk powder prices globally, the cost of
milk powder is still near its past-5-year low globally. This means imported milk powder
remains a cheap substitute for raw milk in 2016E. We assume a flat YoY raw milk ASP for
Modern Dairy and Huishan Dairy in 2016E.
Milk powder prices: imported prices (at China Customs) and the international spot price
China: raw milk price
Source: Global Dairy Trade, China Custom Source: Companies, Ministry of Agriculture
Palm oil and wheat/flour
Ong Keng Wee, a plantation analyst at Daiwa’s alliance partner in Malaysia, Affin Hwang,
forecasts an ASP for palm oil (in Malaysia) of MYR2,400/tonne for 2016E (+12% YoY),
supported by a decline in inventory and possible lower production in 2016E. We believe
the noodle players in China will be the key victims of the rising palm oil price in 2016E, as
we estimate that palm oil accounts for about 15% of their COGS.
Wheat is another major cost item for the instant-noodle makers (~15% of COGS), and we
expect the price of wheat to remain steady or increase slightly in 2016E, as the price the
government pays is likely to remain stable, which should give farmers the incentive to
produce wheat. Hence the noodle-makers are unlikely to make any cost saving when it
comes to the wheat input cost for noodles, in our view.
0
1,000
2,000
3,000
4,000
5,000
6,000
Apr-09 Feb-10 Dec-10 Oct-11 Aug-12 Jun-13 Apr-14 Feb-15 Dec-15
Import price Auction price
(USD/tonne)
3.0
3.5
4.0
4.5
5.0
5.5
Jan-13 Jun-13 Nov-13 Apr-14 Sep-14 Feb-15 Jul-15 Dec-15
National average CMD Huishan
CNY/kg
Downstream dairy
players likely to see cost
of milk rebound in 2016E

15
China Consumer Staples Sector: 26 January 2016
Palm oil prices: imported price of China (Tianjin port, LHS) China: wheat price
Source: Bloomberg Source: Bloomberg
Sugar
We expect the price of sugar to increase by 5-10% YoY in 2016 in China due to the tighter
supply. In December 2015, the Guangxi Provincial Government increased its guidance
price for sugar cane, from CNY400/tonne for the 2014/15 harvest to CNY440/tonne for the
2015/16 harvest due to a decrease in acreage, implying lower production costs for cane
sugar in China. On the international market, the price of sugar rose by 23% in 2H15 in
Brazil, the largest exporter of sugar in the world. According to a USDA report released in
November 2015, global sugar production for 2015/16 was forecast to decline by 3m
tonnes, at 172m, with declines in Brazil, India, the EU, and Ukraine more than offsetting
gains in Australia, Russia, and Turkey. The report projects consumption to reach a record
173m tonnes, pulling down the global inventory level by 4m tonnes to 40m tonnes in
November 2016E.
PET chips
According to data from Wind, the price of PET chips declined by 4% YoY in 4Q15 and 21%
YoY for 2015 on average due to the weak price of crude oil, which should be positive for
the gross margins of the beverage producers. However, as the PET chip price has almost
reached its past-10-year trough of some CNY5,800 (in 2008; currently: CNY6,000/tonne),
and given the strong USD, we don’t believe PET chip costs will decline by much in 2016E
in China (in CNY terms). This, together with rising sugar costs, implies to us that there is
limited room for the gross margins of the bottled-drink producers Tingyi and UPCH to
expand this year.
China: PET-chip prices (vs. oil price) China: global sugar price
Source: Wind Source: Bloomberg
0
200
400
600
800
1000
1200
1400
4,000
5,000
6,000
7,000
8,000
9,000
10,000
11,000
M-09 M-10 J-11 N-11 A-12 J-13 A-14 F-15 N-15
"Malaysia" "Tianjin"
CNY/m tonnes USD/m tonnes
1,000
1,500
2,000
2,500
3,000
3,500
Dec
-08
Apr
-09
Aug
-09
Dec
-09
Apr
-10
Aug
-10
Dec
-10
Apr
-11
Aug
-11
Dec
-11
Apr
-12
Aug
-12
Dec
-12
Apr
-13
Aug
-13
Dec
-13
Apr
-14
Aug
-14
Dec
-14
Apr
-15
Aug
-15
Dec
-15
Flour Wheat
CNY/m tonnes
0
20
40
60
80
100
120
4,000
5,000
6,000
7,000
8,000
9,000
10,000
11,000
12,000
13,000
Dec
-11
Mar
-12
Jun-
12
Sep
-12
Dec
-12
Mar
-13
Jun-
13
Sep
-13
Dec
-13
Mar
-14
Jun-
14
Sep
-14
Dec
-14
Mar
-15
Jun-
15
Sep
-15
PET (CNY/mt, LHS) Brent oil (USD/barrel, RHS)
CNY/m tonnes USD/Barrel
0
1
2
3
4
5
6
0
1,000
2,000
3,000
4,000
5,000
6,000
7,000
8,000
9,000
Jan-08 Apr-09 Jul-10 Oct-11 Jan-13 Apr-14 Jul-15
Nanning Brazil
CNY/m tonnes USD/lb
In 2016E, we expect the
price of sugar to reverse
its downtrend since 2013

16
China Consumer Staples Sector: 26 January 2016
Wood pulp – (short and long-fibre)
Mercer Int. (Not rated), a global pulp supplier of wood pulp, and Hawkins Wright, a global
research firm on forest, pulp and paper industry, offer the following insight into the global
supply outlook:
Softwood (northern bleached softwood kraft pulp [NBSK]): global capacity is expected
to grow by 0.7m tpa in 2016E (<4% of total demand, based on our estimates), and
according to Mercer, such growth is consistent with growth in demand. Wright forecasts
softwood pulp demand to increase by 0.127m tpa over 2014-18, versus 0.19m tpa rises
per year in capacity.
Hardwood (bleached hardwood kraft pulp [BHKP]): global capacity growth should be
fast for 2016, at c. 3% on our estimates, but should match demand growth. Hawkins Wright
forecasts hardwood pulp capacity to rise by 1.5m tpa over 2016E, versus demand growth
of 1.38m tpa in 2015E.
Based on Bloomberg data, BHKP and NBSK pulp averaged USD803/tonne and
USD832/tonne for 2H15, up 5% and down 5% YoY, respectively. We estimate normal wood
pulp inventory for tissue producers is currently at about 4-6 months (including raw
materials being shipped to China); and over 60% of the pulp used for tissue paper is
NBSK. Hence, we expect pulp costs in 1H16 to be flat or decline slightly for wood pulp
users in USD terms. However, if we take CNY depreciation into consideration (-4.5%
against USD in 2015 per Bloomberg), wood pulp costs would remain flat YoY in terms of
CNY in 1H16E, and risk rising in 2H16E.
Wood pulp prices
Source: Bloomberg
Rice, corn and other grains (sourced in China)
We believe prices of domestically sourced grains (corn, wheat, rice) will stop increasing or
reverse their uptrends seen over the past 6 years as a result of changes to policies that
used to support grain prices through government purchasing. For grains that are
domestically produced and sourced in China (ie, corn, rice), prices have gone up slowly
since 2009, supported by favourable policies. We believe the prices of major crops in
China are supported by government incentives encouraging farmers to produce more. The
China government has already cut its guaranteed purchase price for corn for the 2015/16
harvest period by c.11% YoY due to the high reserves level in the country. The government
has also stated, that while it will continue to purchase wheat and rice in 2016, it hasn’t
decided whether to continue to purchase corn or not.
Government purchase price of major grains in China (CNY/50kg
2015 2014 2013 2012 2011 2010
Corn 100 111-113 111-113 105-107 n.a.
Wheat 118 118 112 102 93 86
Early rice 135 135 132 120 102 93
Later rice 138 138 135 125 107 97
Hard rice 155 155 150 140 126 103
Source: Ministry of Agriculture
300
400
500
600
700
800
900
1,000
1,100
Jan-05 Jan-06 Jan-07 Jan-08 Jan-09 Jan-10 Jan-11 Jan-12 Jan-13 Jan-14 Jan-15 Jan-16
NBSK BHKP
USD/tonne
Lower USD pulp costs
offset by CNY
depreciation vs. USD

17
China Consumer Staples Sector: 26 January 2016
We estimate that grain prices in China are about 20% higher than international prices at
present (except soybean, whose imports accounted for over 60% of the consumption in the
past 5 years) due to supportive government policies. We expect this gap to continue to
trigger imports of grains into China or a reduction in domestic grain prices, in particular for
corn. As shown below, international corn and wheat prices trended up in 4Q15, by 1% and
13% QoQ on average, based on Bloomberg data, respectively.
Corn price in the US spot market Corn price in China price
Source: Bloomberg Source: Bloomberg
Hogs and pork
Hog inventory as of November 2015 was 388m heads in China, according to the Ministry
of Agriculture (down 1% MoM, but down 10% YoY). The number of reproductive sows in
China declined to 38.3m heads in November 2015 (-12% YoY), implying that supply is
continuing to tighten. We expect pork prices to rise by less than 5% YoY on average in
2016E, due to the low base in 1H15 followed by a slight tightening of supply in 2H15-2016.
However, as of December 2015, the hog-corn cost ratio was already 8.6x, per the Ministry
of Agriculture, near the high-end of the guidance range for hog raisers (6x-9x) as indicated
by the government. If such a ratio rose above 9x the government may have to sell pork
reserves to stabilise prices. Moreover, with the recent decline in corn costs (a major feed
for hogs), we see limited upside for hog costs in 2016E. Hence we see limited upside to
our hog and pork price forecast for in 2016.
China: pork and hog prices Hog-corn cost ratio
Source: Wind, Bloomberg Source: CEIC
0
100
200
300
400
500
600
700
800
900
Jan-
11
Apr
-11
Jul-1
1
Oct
-11
Jan-
12
Apr
-12
Jul-1
2
Oct
-12
Jan-
13
Apr
-13
Jul-1
3
Oct
-13
Jan-
14
Apr
-14
Jul-1
4
Oct
-14
Jan-
15
Apr
-15
Jul-1
5
Oct
-15
USD/5000 bushel
1,000
1,500
2,000
2,500
3,000
Jan-
09
May
-09
Oct
-09
Mar
-10
Aug
-10
Jan-
11
Jun-
11
Nov
-11
Mar
-12
Aug
-12
Jan-
13
Jun-
13
Nov
-13
Apr
-14
Sep
-14
Jan-
15
Jun-
15
Nov
-15
Heilongjiang Jilin Shandong
(CNY/m tonnes)
5
10
15
20
25
30
J-08 J-08 D-08 J-09 D-09 J-10 D-10 J-11 D-11 J-12 D-12 J-13 D-13 J-14 N-14M-15N-15
Pork wholesale price Hog cost
CNY/kg
2013 Ave.6.22
2014Ave, 5.50
2015Ave, 6.55
4
5
6
7
8
9
10
Jan-
09
May
-09
Sep
-09
Jan-
10
May
-10
Sep
-10
Jan-
11
May
-11
Sep
-11
Jan-
12
May
-12
Sep
-12
Jan-
13
May
-13
Sep
-13
Jan-
14
May
-14
Sep
-14
Jan-
15
May
-15
Sep
-15
(x)
We expect grain prices
to stay flat or decline in
China in 2016E due to
policy changes
Any increase in the cost
of hogs and pork in
2016E will be lower than
we previously expected

18
China Consumer Staples Sector: 26 January 2016
Impact of CNY depreciation – mainly on the debt side
Debt and financial costs – the key factor. Before 2014, most staples companies enjoyed
low interest rates and the benefits of CNY appreciation against foreign currencies by using
foreign debt (mainly USD or HKD). However, with the CNY starting to depreciate against
the USD in 1H15, most companies reported forex losses for that period. Most of them did
not use derivatives to hedge against currency rate changes. To lessen the impact of CNY
depreciation, some companies have already started replacing USD/HKD-debt with CNY-
debt wherever possible:
In this report, we are revising down our 2016-17 EPS forecasts for 6 of the 12 companies
we cover in the staples sector as a result of FX losses. We see companies with higher net
gearing being slower to cut their USD/HKD debt to reduce FX losses, since they may not
have sufficient resources to pay down their USD-debt quickly.
(1) Companies with net cash: Want Want and Hengan have the highest exposure to
USD/HKD denominated debt (99-100%) among our coverage universe. They are in a
net cash position, which enables them to pay down debt quickly if necessary.
(2) Companies with net debt may have to raise CNY debt locally before settling their
USD debt. Among the big caps, we expect Mengniu to work on replacing its non-CNY
debt previously raised for acquisitions by leveraging on its relationship with COFCO
Group (as an SOE) to secure more local debt in CNY and reduce its exposure to CNY.
Also, for Tingyi, the debt borrowers (bond issuers) are Hong Kong entities (functional
currency is HKD), so there is no mark-to-market loss for USD debt incurred by its
Hong Kong entity. Translation losses on balance sheet items are debited to equity
reserves, instead of the P&L. For Tingyi, we believe the FX loss in 2015 was due
mainly to its EUR-denominated debt (for the purchase of machines), which is non-
recurring in 2016E. Hence for both, we believe the impact of CNY depreciation in
2016-17E will not be higher than it likely was in 2015E. Vinda faces the biggest impact
from further CNY depreciation due to its high gearing. However, we believe this factor
has been priced in its recent share-price correction.
(3) Some companies like Modern Dairy and Fufeng reported slight positive FX gains in
1H15, which we believe was due to non-CNY cash and other assets they have (eg,
receivables). Going forward, we expect the impact of FX to be even smaller as they
raise CNY-debt and reduce USD-denominated loans.
Exposure and impact of FX exchange rate changes on net profit
USD/HKD debt as %
of total
USD/HKD debt as %
of book equity
HKD/USD cash as % of equity
net HKD/USD debt as % of equity
Report. currency
FX loss (m reporting
currency)
as % of pre-FX
net profit COGS %
contribution in USD
2014 2014 2014 2014
1H15 2015E 2016E 1H15 2015E 2016E
Tsingtao Brewery c.0% n.a. n.a. n.a. CNY 3.0 negligible -0.3 negligible <10%
Fufeng 40% 26% 2% 24% CNY 5.5 negligible 1.1 negligible <10%
UPCH 41% 19% 3% 17% CNY 1.7 negligible 0.2 negligible <10%
Modern Dairy 41% 36% 5% 31% CNY 2.9 negligible 0.6 negligible <20%
Mengniu 85% 39% 7% 32% CNY -22.0 -50 -50 -1.6 -1.9 -1.9 <10%
Tingyi 87% 84% 4% 80% USD -49.2* -49 -50 -11* -12 -11 <10%
Vinda 91% 82% 2% 80% HKD -30.0 -280 -300 -8 -37 -32 c.50%
WH Group 97% 75% n.a. n.a. USD n.a. n.a. n.a. n.a. n.a. n.a. <50%.
Want Want 99% 68% 2% 66% USD -0.9 -2 -5 -0.3 -0.3 -0.7 <20%
Hengan 100% 85% 11% 74% HKD -139.0 -270 -240 -7 -6 -5 >30%
Huishan Dairy 12% 7% 5% 2% CNY -124.6 negligible -13.8 negligible <10%
Source: Company, Daiwa estimates for 2015-16E Note: * for nine months ended Sep-15; # including impact from FX change in non USD/HKD currency exchange rate against CNY, 1due to its US operation
Revenue: CNY depreciation mainly weighs on companies that report in USD or HKD. Of
the 6 companies we cover that report in USD or HKD, WH Group should be least
impacted, as we estimate that over 50% of its revenue came from the US in 2015. We also
estimate that about 25% of Vinda’s revenue comes from outside China (Hong Kong and
ASEAN countries) after its acquisition of SCA’s pan-Asian hygiene products business in
1Q16.
CNY depreciation
against USD weighed
more on financial costs
than raw materials

19
China Consumer Staples Sector: 26 January 2016
Cost of production: Except wood pulp, soybean and milk powder, most raw materials
used by staples companies in China are locally sourced. As such, a depreciating CNY is
negative for the gross margins of users. But as discussed before, wood pulp prices have
been trending down since 4Q15 on an abundant global supply, which we believe could
help offset the pressure of a depreciating CNY. For milk powder, we also believe a
weakening NZD against USD could help mitigate the pressure of increasing milk powder
costs, as New Zealand accounts for more than 50% of the milk powder imported into China
(in fact, the NZD has depreciated from NZD1:CNY4.8 a year ago to NZD1:CNY4.2 in
January 2016).

20
China Consumer Staples Sector: 26 January 2016
Valuations and recommendations
Rerating opportunity for selected stocks
The China Consumer Staples sector has been derated since 2013 on the back of slowing
revenue and earnings momentum. In 2015, the MSCI China Staples Index fell by 17.1%,
vs. declines of 14.6% in the MSCI China and 8.2% in the HSI. Our coverage universe of
downstream staples companies is trading currently at a 16x 2016E PER on a market-cap
weighted average, based on our forecasts, and most are trading below their past-5-year
12-month-forward PER bands.
MSCI China Staples and MSCI China Indices (2015)
The staples stocks have
underperformed the
MSCI China for the past 2
years
Source: Bloomberg
China players already trading at discounts to international peers
The China Consumer Staples stocks are currently trading at PER discounts to their
international downstream peers. Based on the Bloomberg consensus forecasts, the China
Consumer Staples stocks under our coverage are trading at 16x 2016E PER on average,
vs. 21x for the main US and Europe F&B players. As a result of our now less favourable
outlook for net-profit growth in 2016 in China due to a high base, macro headwinds, and
CNY depreciation, we see little potential for a PER rerating of the Chinese players towards
international peers’ valuations at this juncture. But at the same time, given that growth in
nominal GDP and personal income in China eclipses the growth rates for most developed
countries, as evidenced by the China players’ prospect of faster EPS growth in 2016E vs.
their international peers, we also see limited room for a further derating.
Davids’ premium to Goliaths justified, in our view
The Davids we highlighted in this report (Vinda, UPCH, etc) are trading at premiums to
their peers (Hengan, Tingyi) in terms of PER. We believe these premiums are justified by
the Davids’ higher prospective EPS growth in 2016-17E, on our forecasts, and their long-
term revenue growth potential. The key rerating catalysts we see are: 1) M&A within the
same industry/segment or strategic investments in new businesses, 2) successful new
product launches, and 3) share buybacks or debt reductions.
The only exception is Modern Dairy, which is trading currently at a 7.1x 2016E PER, a
significant discount to its peers Mengniu (15x) and Huishan (FY17E PER of 34x, March
year end). We believe this discount is due to investors’ concerns about flat raw milk ASPs
in 2016E. Nevertheless, we expect Modern Dairy shares to be rerated on the back of an
increasing revenue and earnings contribution from its downstream operation, and gross-
margin improvement from lower feed costs.
50
55
60
65
70
75
80
85
90
800
900
1,000
1,100
1,200
1,300
1,400
Jan-
14
Feb
-14
Mar
-14
Apr
-14
May
-14
Jun-
14
Jul-1
4
Aug
-14
Sep
-14
Oct
-14
Nov
-14
Dec
-14
Jan-
15
Feb
-15
Mar
-15
Apr
-15
May
-15
Jun-
15
Jul-1
5
Aug
-15
Sep
-15
Oct
-15
Nov
-15
Dec
-15
MSCI China Staples MSCI China
MSCI China Staples MSCI China

21
China Consumer Staples Sector: 26 January 2016
China Staples Sector: valuation comparison (as of 25 Jan 2016)
Market cap
Share price
(HKD)
PER (X) EPS growth YoY (%) EV/EBITDA Sales growth YoY
(%) EBIT margin
(%) ROE
Company Ticker Rating (USDm) 2014 2015E 2016E 2017E 2014 15E 16E 17E 15E 16E 2014 15E 16E 2014 15E 16E 15E
Food and beverage players
Want Want China 151 HK Buy 8,174 4.96 13.7 15.4 12.7 11.5 -10 -11 21 10 9.1 7.4 -1 -6 6 20.6 20.9 23.5 27.1
Tingyi 322 HK Hold 6,512 9.07 16.4 17.6 16.9 15.4 1 -7 4 10 7.5 6.7 -6 -9 1 7.2 8.1 8.7 12.0
WH Group 288 HK Outperform 8,247 4.40 8.5 13.6 10.2 9.1 48 -37 34 12 6.6 5.7 98 -1 6 8.1 6.4 6.9 11.3
Mengniu Dairy 2319 HK Hold 5,516 11.08 14.8 13.5 14.7 13.2 32 9 -8 11 8.8 9.1 15 -2 4 5.1 6.4 5.7 11.5
Tsingtao Brewery 168 HK Underperform 4,988 28.80 15.5 19.3 20.4 19.2 13 -20 -6 6 8.5 8.9 3 -3 -4 6.6 6.3 6.0 10.3
China Resources Beer 291 HK Hold 3,818 12.30 n.a. 34.1 23.2 18.5 -chg +chg 47 25 5.8 12.8 16 -79 4 1.1 7.9 8.6 2.7
Uni-President China 220 HK Buy 2,880 5.20 129.1 21.6 18.9 17.0 -74 499 14 11 8.0 7.1 -3 5 8 0.9 4.4 5.2 7.5
Market cap. Weighted average
20.4 17.8 15.6 13.9 9 24 15 12 7.8 7.9 23 -11 4 8.7 9.6 10.3 13.4
Dairy farm operators
Modern Dairy 1117 HK Buy 985 1.45 7.2 9.4 7.1 5.0 108 -23 31 41 5.5 6.4 53 -1 8 27.2 27.5 25.8 8.3
Huishan Dairy # 6863 HK Sell 5,095 2.95 43.0 43.5 34.4 29.6 -43 1 31 16 28.0 24.3 11 14 24 32.0 29.4 27.1 5.8
Market cap. Weighted average
37.2 38.0 29.9 25.6 -19 -3 31 20 24.3 21.4 18 12 21 31.2 29.1 26.9 6.2
Personal healthcare
Hengan Int 1044 HK Hold 10,621 67.75 21.2 19.4 18.4 18.2 8 9 5 1 11.7 11.3 12 2 -1 24.1 25.1 25.7 23.5
Vinda Int 3331 HK Outperform 1,664 13.00 21.9 27.2 22.8 15.0 9 -19 19 52 11.9 10.9 17 18 31 10.5 10.5 10.1 8.9
Market cap. Weighted average
21.3 20.5 19.0 17.7 8 5 7 8 11.8 11.2 13 4 4 22.3 23.2 23.6 21.5
Others
Fufeng 546 HK Hold 707 2.61 6.9 8.7 8.4 7.8 15 -21 4 8 4.6 4.4 -1 4 9 9.9 7.6 6.4 9.0
Source: Bloomberg, Daiwa forecasts Note: #FY15-18E numbers for Huishan are used as the company year-end is on 31 March;
International Staples Sector: valuation comparison (as of 22 January 2016)
Bloomberg Mkt.Cap. Price PER (x) EPS Growth EV/EBITDA x Revenue YoY % EBIT margin
Name Code LCY USDm
14 15E 16E 17E 14 15E 16E 17E 15E 16E 2014 15E 16E 15E 16E 16E
US major F&B players
Kraft-Heinz KHC US USD 90,269 74.39 55.5 34.2 25.1 20.6 n.a. 62 36 22 18.3 16.3 n.a. -6 -1 15.1 19.9 23.7
Coca Cola KO US USD 182,918 42.06 26.0 21.1 20.5 19.1 -16 23 3 7 17.0 16.5 -2 -4 0 21.1 23.0 23.6
Pepsi PEP US USD 139,639 95.85 22.2 21.0 19.9 18.5 -1 6 5 8 12.9 12.5 0 -5 1 14.4 15.9 16.2
General Mills GIS US USD 32,830 55.33 27.4 19.3 18.1 17.0 -30 42 7 7 12.2 11.9 -2 -5 1 11.8 16.6 17.0
Mondelez MDLz US USD 66,109 41.6 32.2 23.4 20.8 18.7 -1 38 13 11 16.3 15.2 -3 -17 0 9.5 15.9 15.0
Kellogg K US USD 25,378 71.61 40.7 20.5 19.5 18.3 -65 99 5 6 13.6 13.2 -1 -7 -1 7.0 14.1 14.7
Nestle NSRGY US USD 226,472 71.03 n.a. 21.1 20.0 18.8 45 n.a. 5 7 n.a. n.a. -1 -1 3 11.9 15.8 16.3
Market cap. weighted average
22.2 22.7 20.7 18.9 6 22 9 9 11.0 10.4 -1 -5 1 14.5 18.0 18.8
Global Dairy companies
Fonterra FCG NZ NZD 7,641 5.86 n.a. 13.6 12.2 11.3 190 n.a. 12 8 9.2 8.5 -15 6 13 4.3 7.1 n.a.
Danone BN FP EUR 55,794 59.61 31.7 20.6 19.3 17.7 -22 54 7 9 12.4 11.8 -1 6 3 10.2 12.7 13.3
Mead Johnson MJN US USD 13,831 70.16 19.8 20.7 20.0 18.6 5 -5 5 8 13.5 13.5 5 -8 -2 22.4 23.7 23.9
ABBOTT ABT US USD 59,714 40.03 26.7 18.6 17.2 15.3 -11 44 10 11 12.3 11.5 3 1 5 12.8 18.4 19.6
Market cap. weighted average
26.5 19.4 18.1 16.4 -3 40 8 10 12.3 11.6 1 3 4 12.2 16.0 16.4
International hog processors
TYSON FOODS-A TSN US USD 20,276 51.22 17.0 14.3 13.0 11.6 21 19 10 11 8.3 7.9 10 -4 2 5.2 6.2 6.5
SANDERSON FARMS SAFM US USD 1,750 77.54 8.1 14.4 13.3 15.9 -12 -43 8 -16 5.6 5.4 1 -3 9 12.0 7.2 5.2
PILGRIM'S PRIDE PPC US USD 5,526 21.66 7.9 7.9 10.8 12.3 30 1 -27 -12 4.8 6.3 2 -5 -1 14.0 13.7 9.9
HORMEL FOODS CRP HRL US USD 20,076 75.98 29.2 26.0 24.3 22.3 14 12 7 9 15.1 14.2 -1 4 4 11.5 12.3 12.8
INDUS BACHOC-B BACHOCOB MM MXN 2,164 66.55 10.2 9.4 12.1 11.5 93 9 -22 5 4.6 5.7 5 10 3 12.8 12.1 9.5
JBS JBSS3 BZ BRL 7,425 10.64 15.1 5.6 6.7 5.7 119 170 -15 17 5.2 4.2 30 37 26 6.5 6.4 6.2
Market cap. weighted average
19.6 16.5 15.9 14.8 35 33 1 8 9.7 9.3 8 5 6 9.0 9.3 9.1
Japanese player
ITOHAM FOODS INC 2284 JP JPY 1,304 625 11.5 20.9 19.7 17.6 143 -45 6 9 14.1 11.0 4 31 17 0.8 n.a. n.a.
NH FOODS LTD 2282 JP JPY 3,719 2,163 14.2 15.5 14.5 13.4 25 -8 5 8 8.5 8.0 8 4 2 4.0 3.5 3.8
Market cap. weighted average
13.5 16.9 15.9 14.5 57 -18 6 8 10.0 8.8 7 11 6 3.1 2.6 2.8
International personal hygiene products
9
PROCTER & GAMBLE PG US USD 210,464 77.36 30.9 20.6 18.3 16.8 -22 50 13 12 13.3 12.7 -5 -13 3 15.5 21.5 22.3
KIMBERLY-CLARK KMB US USD 45,999 126.72 31.1 22.0 20.6 19.1 -22 42 7 9 13.4 12.8 1 -6 2 12.8 17.3 17.9
Sven ska Cellulosa AB SCAB SS SEK 20,083 244.4 26.0 19.9 18.3 17.2 19 30 9 24 11.3 10.3 12 11 4 9.9 11.2 11.6
KAO CORP 4452 JP JPY 24,610 5,793 37.0 30.5 24.8 22.7 24 21 23 8 11.8 11.0 7 5 4 9.5 10.8 11.9
UNICHARM CORP 8113 JP JPY 11,285 2,156.50 33.6 35.6 27.2 24.2 -18 -5 29 8 12.7 11.5 21 25 9 11.2 10.3 10.8
Market cap. weighted average
31.2 22.1 19.5 17.9 -15 43 13 9 13.1 12.4 -1 -8 3 14.1 19 19.8
Source: Bloomberg

22
China Consumer Staples Sector: 26 January 2016
The Davids
Uni-President China (220 HK, HKD5.20): New products shine - upgrading to Buy (1)
In this report, we are upgrading our rating for UPCH to Buy (1), from Underperform (4), as
we expect its revenue growth to resume (5-8% YoY in 2015-17E, after a 4% decline in
2014) on likely market-share gains in the noodle segment and an increasing revenue
contribution from high-end beverage products. We believe UPCH can realise revenue
growth more easily than its biggest competitor, Tingyi, by improving its market-penetration
rate and focusing on high-value items. As a result of doing so, we expect its operating
margin to expand by 0.7pp and 0.3pp in 2016-17E to 5.2% and 5.5%, respectively, on our
forecasts, after a jump of 3.4pp in 2015E. UPCH’s share price is down by 27% from its 52-
week peak and is now trading at 19x 2016E PER, below its past-3-year average 12-month-
forward PER of 26x, which see as a good entry point. We have a new 12-month target
price of HKD6.20 (from HKD7.00), which is based on a 2016E PER of 22.6x (UPCH’s
average forward PER since its IPO in 2007).
UPCH: financial summary UPCH: share price and past-7-year PER band chart
2013 2014 2015E 2016E 2017E
Revenue (CNY m)
23,329 22,488 23,642 25,524 26,783
YoY (%)
9 -4 5 8 5
Our forecast vs. consensus (%) n.a. n.a. 5 5 8
Net profit (CNY m)
446 127 844 1,004 1,114
Net profit growth (%)
-48 -72 566 19 11
EPS (CNY)
0.12 0.03 0.20 0.23 0.26
EPS growth YoY (%)
-48 -74 511 19 11
Operating margin
2.0% 0.9% 4.4% 5.2% 5.5%
ROE
5.6% 1.3% 7.5% 8.3% 8.6%
Source: Company, Daiwa forecasts Source: Bloomberg
Vinda (3331 HK, HKD13.0): An emerging Asian play - reiterating Outperform (2)
We reiterate our Outperform (2) rating on Vinda. We argue that the stock should be rerated
on: 1) its transformation from a pure China tissue-paper manufacturer to a regional
personal care product company following its acquisition of assets from its parent company,
and 2) a solid revenue-growth outlook in China through ongoing market-share gains in the
tissue-paper and incontinence-product segments. We believe the recent share-price
correction was a result of foreign-exchange losses on the CNY depreciation. In this report
we cut our 2015-17E EPS by 13-33%, due mainly to the forex losses. Our target price is
now based on a 2016E PER of 25x (previously 20.4x), where we peg Vinda’s valuation to
international peers’ (average: 20x 2016E PER) after its acquisition of the SCA Group’s
hygiene operation, which we see turning it into a Pan-Asia business, and then apply a 25%
premium due to our stronger EPS-growth forecast for Vinda vs. peers (including/excluding
FX losses). We have a new 12-month target price of HKD14.30 (previously HKD17.40).
Vinda: financial summary Vinda: share price and past-5-year PER band chart
2013 2014 2015E 2016E 2017E
Revenue (HKD m) 6,798 7,985 9,421 12,341 14,340
YoY (%) 13% 17% 18% 31% 16%
Our forecast vs. consensus (%) n.a. n..a -4 5 6
Net profit (HKD m) 543 593 478 609 979
Net profit growth (%) 1% 9% -19 27 61
EPS (HKD) 0.5434 0.5944 0.4787 0.5698 0.8670
Recurring EPS growth (%) 1% 9% -19% 19% 52%
Operating margin 9.6 10.5 10.5 10.1 11.2
ROE 12.4 12.2 8.9 8.7 11.1
Source: Company, Daiwa forecasts Source: Bloomberg
2
4
6
8
10
Jan-09 Mar-10 May-11 Jul-12 Sep-13 Nov-14 Jan-16
220 HK 16 20
24 28 32
(HKD)
0
5
10
15
20
25
Jan 11 Jan 12 Jan 13 Jan 14 Jan 15 Jan 16
3331 HK 12x 15x
18x 21x 24x
HKD
We upgrade UPCH to
Buy (1)

23
China Consumer Staples Sector: 26 January 2016
China Modern Dairy (1117 HK, HKD1.45): Downstream expansion- reiterate Buy (1)
We reiterate our Buy (1) call on Modern Dairy, with a new 12-month DCF-based target
price of HKD3.00 (formerly HKD3.30). We expect Modern Dairy’s earnings growth to
recover in 2016-17E after a 17% YoY decline in 2015E on the stabilisation of raw-milk
prices in China and rising imports of milk powder. The stock is trading currently at a 7x
2016E PER and a 0.7x 2016E PBR, on our forecasts, putting it at around a 54% discount
to downstream peer Mengniu. Modern Dairy is on track to expand its downstream
business, which is targeted to contribute 50% of the company’s revenue by 2020 (currently
25%), and progress on this front should support a rerating of the stock as a consumer
brand company in our view. Moreover, we continue to favour Modern Dairy as a beneficiary
of the long-term structural shortage of quality raw milk in China.
Modern Dairy: financial summary Modern Dairy: share price and past-5-year PER band chart
Year end Dec 2013 2014 2015E 2016E 2017E
Revenue (CNY m) 3,289 5,027 4,980 5,402 5,821
YoY (%) 62% 53% -1% 8% 8%
Our forecast vs. consensus (%) n.a. n.a. 0% -4% -7%
Net profit (CNY m) 373 735 632 912 1,287
YoY (%) -28% 97% -14% 44% 41%
Reported EPS 0.077 0.160 0.126 0.172 0.243
YoY (%) -29% 108% -21% 37% 41%
Operating margin 21.3% 27.2% 27.5% 25.8% 30.4%
ROE (%) 6.8% 12.7% 8.3% 10.0% 12.7%
Source: Company, Daiwa forecasts Source: Bloomberg
Huishan (6863 HK, HKD2.95): More competition for downstream - reiterating Sell (5)
We reiterate our Sell (5) rating on Huishan on valuation grounds. However, our SOTP-
based 12-month target price rises to HKD1.87 from HKD1.60, due to a reduction in the
number of shares outstanding after a share buyback in 2H15. The stock is now trading far
above its peers’ average PER range of 3-7x (upstream) and 14-27x (downstream). We
believe management’s share buybacks are the main reason for the stock’s increased PER
multiple and we do not think that the company’s currently weak fundamentals justify such a
hike. Nor do we consider the company’s share repurchases to be positive for its business
development or balance sheet. We expect the downstream dairy industry in China to
continue to see significant price competition and discounts across all segments (from
premium-to-mass market), particularly for room-temperature products.
Huishan: financial summary Huishan: share price and PER band since listing
(Year-end Mar) FY14 FY15 FY16E FY17E FY18E
Revenue (CNY m) 3,530 3,923 4,470 5,558 6,327
YoY growth (%) 38% 11% 14% 24% 14%
vs consensus n.a. n.a. -2% -2% -5%
Reported net profit (CNY m) 1,249 790 768 977 1,133
YoY growth (%) 32% -37% -3% 27% 16%
Reported EPS (CNY) 0.096 0.055 0.055 0.073 0.084
YoY growth (%) 17% -43% 1% 31% 16%
ROE 13.1% 5.9% 5.8% 7.5% 8.1%
Operating margin (%) 42.2% 32.0% 29.4% 27.1% 28.6%
Source: Company, Daiwa forecasts Source: Bloomberg
0
1
2
3
4
5
6
7
8
9
Mar
11
Jun
11
Sep
11
Dec
11
Mar
12
Jun
12
Sep
12
Dec
12
Mar
13
Jun
13
Sep
13
Dec
13
Mar
14
Jun
14
Sep
14
Dec
14
Mar
15
Jun
15
Sep
15
Dec
15
1117 HK 11x 15x
19x 23x 27x
0
1
2
3
4
5
6
Sep
13
Nov
13
Jan
14
Mar
14
May
14
Jul 1
4
Sep
14
Nov
14
Jan
15
Mar
15
May
15
Jul 1
5
Sep
15
Nov
15
6863 HK 12x 16x
20x 24x 28x
We prefer Modern Dairy
over Huishan Dairy
among the upstream
dairy companies
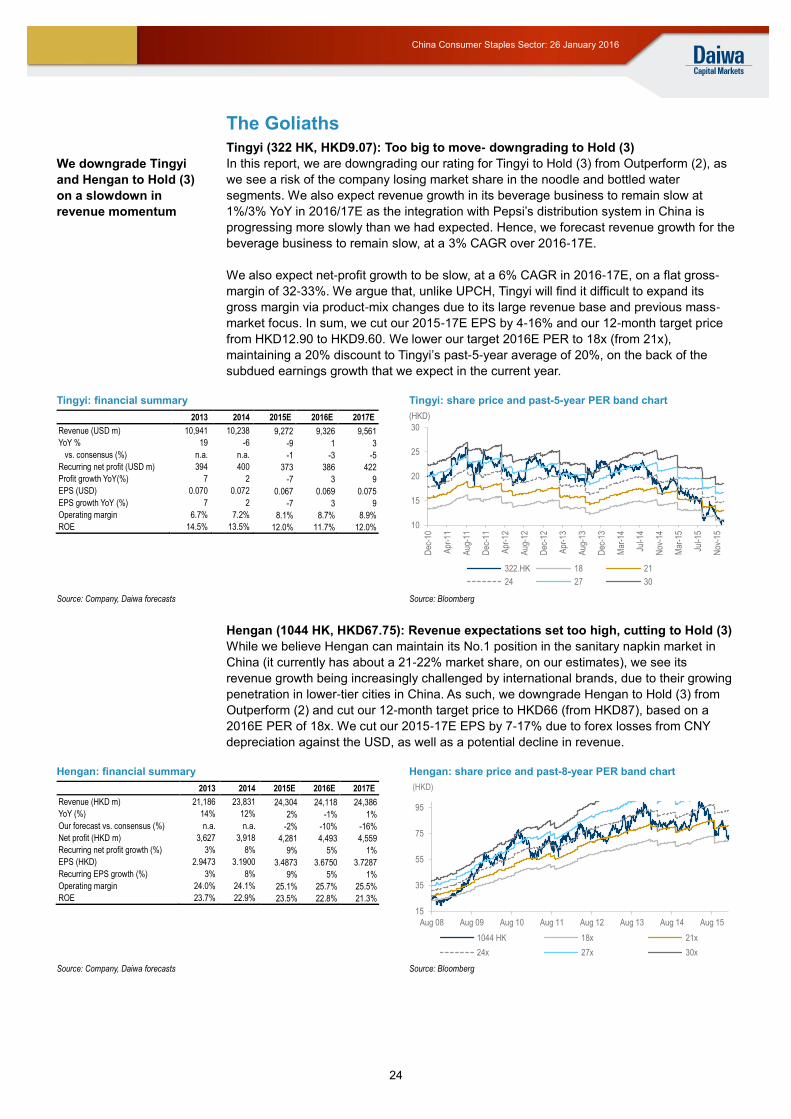
24
China Consumer Staples Sector: 26 January 2016
The Goliaths
Tingyi (322 HK, HKD9.07): Too big to move- downgrading to Hold (3)
In this report, we are downgrading our rating for Tingyi to Hold (3) from Outperform (2), as
we see a risk of the company losing market share in the noodle and bottled water
segments. We also expect revenue growth in its beverage business to remain slow at
1%/3% YoY in 2016/17E as the integration with Pepsi’s distribution system in China is
progressing more slowly than we had expected. Hence, we forecast revenue growth for the
beverage business to remain slow, at a 3% CAGR over 2016-17E.
We also expect net-profit growth to be slow, at a 6% CAGR in 2016-17E, on a flat gross-
margin of 32-33%. We argue that, unlike UPCH, Tingyi will find it difficult to expand its
gross margin via product-mix changes due to its large revenue base and previous mass-
market focus. In sum, we cut our 2015-17E EPS by 4-16% and our 12-month target price
from HKD12.90 to HKD9.60. We lower our target 2016E PER to 18x (from 21x),
maintaining a 20% discount to Tingyi’s past-5-year average of 20%, on the back of the
subdued earnings growth that we expect in the current year.
Tingyi: financial summary Tingyi: share price and past-5-year PER band chart
2013 2014 2015E 2016E 2017E
Revenue (USD m) 10,941 10,238 9,272 9,326 9,561
YoY % 19 -6 -9 1 3
vs. consensus (%) n.a. n.a. -1 -3 -5
Recurring net profit (USD m) 394 400 373 386 422
Profit growth YoY(%) 7 2 -7 3 9
EPS (USD) 0.070 0.072 0.067 0.069 0.075
EPS growth YoY (%) 7 2 -7 3 9
Operating margin 6.7% 7.2% 8.1% 8.7% 8.9%
ROE 14.5% 13.5% 12.0% 11.7% 12.0%
Source: Company, Daiwa forecasts Source: Bloomberg
Hengan (1044 HK, HKD67.75): Revenue expectations set too high, cutting to Hold (3)
While we believe Hengan can maintain its No.1 position in the sanitary napkin market in
China (it currently has about a 21-22% market share, on our estimates), we see its
revenue growth being increasingly challenged by international brands, due to their growing
penetration in lower-tier cities in China. As such, we downgrade Hengan to Hold (3) from
Outperform (2) and cut our 12-month target price to HKD66 (from HKD87), based on a
2016E PER of 18x. We cut our 2015-17E EPS by 7-17% due to forex losses from CNY
depreciation against the USD, as well as a potential decline in revenue.
Hengan: financial summary Hengan: share price and past-8-year PER band chart
2013 2014 2015E 2016E 2017E
Revenue (HKD m) 21,186 23,831 24,304 24,118 24,386
YoY (%) 14% 12% 2% -1% 1%
Our forecast vs. consensus (%) n.a. n.a. -2% -10% -16%
Net profit (HKD m) 3,627 3,918 4,281 4,493 4,559
Recurring net profit growth (%) 3% 8% 9% 5% 1%
EPS (HKD) 2.9473 3.1900 3.4873 3.6750 3.7287
Recurring EPS growth (%) 3% 8% 9% 5% 1%
Operating margin 24.0% 24.1% 25.1% 25.7% 25.5%
ROE 23.7% 22.9% 23.5% 22.8% 21.3%
Source: Company, Daiwa forecasts Source: Bloomberg
10
15
20
25
30D
ec-1
0
Apr
-11
Aug
-11
Dec
-11
Apr
-12
Aug
-12
Dec
-12
Apr
-13
Aug
-13
Dec
-13
Mar
-14
Jul-1
4
Nov
-14
Mar
-15
Jul-1
5
Nov
-15
322.HK 18 21
24 27 30
(HKD)
15
35
55
75
95
Aug 08 Aug 09 Aug 10 Aug 11 Aug 12 Aug 13 Aug 14 Aug 15
1044 HK 18x 21x
24x 27x 30x
(HKD)
We downgrade Tingyi
and Hengan to Hold (3)
on a slowdown in
revenue momentum

25
China Consumer Staples Sector: 26 January 2016
Mengniu (2319 HK, HKD11.08): Competition remains stiff - maintaining Hold (3)
We maintain our Hold (3) rating and remain cautious on Mengniu’s revenue-growth
prospects over 2016-17E given the risks of: 1) market-share contraction in the premium
milk segment, and 2) product cannibalisation On our revised-down revenue forecasts, as
well as our concern that marketing expenses will increase, we cut our EPS forecasts by 5-
15% over 2015-17E. In turn, our 12-month target price falls to HKD11.70 (from HKD14.50),
based on 2016E PER of 15.2x (was 16x). We now apply a bigger discount (from 15% to
20%) to the stock’s past-3-year average 12-month forward PER prior to 2013 (19x) to
derive our target PER, as we see an increasing risk of market-share loss in the premium
milk segment.
Mengniu: financial summary Mengniu: share price and past-5-year PER band chart
2013 2014 2015E 2016E 2017E
Revenue (CNY m) 43,357 50,049 49,103 50,942 52,203
YoY (%) 20% 15% -2% 4% 2%
vs consensus (%) n.a. n.a. (3) (6) (11)
Net profit (CNY m) 1,607 2,233 2,577 2,471 2,745
YoY (%) 16% 39% 15% -4% 11%
EPS (CNY) 0.450 0.595 0.663 0.636 0.707
YoY (%) 14% 32% 12% -4% 11%
Operating margin 4.3% 5.1% 6.4% 5.7% 5.9%
ROE (%) 11.6% 12.1% 11.5% 10.1% 10.4%
Source: Company, Daiwa forecasts Source: Bloomberg
China Resources Beer (291 HK, HKD12.30, Hold [3]): Best-case scenario priced in
CRB’s share price rose by 15% in 4Q15, which we believe fully prices in the earnings
upside from the company’s planned acquisition of a 49% stake in the CR-Snow JV (subject
to various conditions, eg, anti-trust approval by the China government for SABMiller’s
merger with AB-InBev). In this report, we raise our 2016-17E EPS by 3-19%, assuming
that CRB will acquire a minority stake in CR-Snow via bank financing in 2016.
We maintain our Hold (3) rating but lower our 12-month target price to HKD12.40 (from
HKD13.40). We now value CRB at 23x 2016E PER (previously 26x 2016E), which marks a
ca.15% premium to its closest peers’ (Tsingtao and Yanjing) average (20.2x), given our
forecast for CRE to see faster EPS growth than its peers and its further potential earnings
upside (via co-operation with an international peer, including strategic investment).
China Resources Beer: financial summary
Key Financials 2013 2014 2015E 2016E 2017E
Revenue (HKD m) 146,254 169,678 34,823 36,141 37,770
YoY 15.9% 16.0% -79.5% 3.8% 4.5%
vs consensus n.a. n.a. n.a. -7.0% -8.7%
Net profit (HKD m) 1,642 -794 874 1,282 1,606
YoY (%) n.a. n.a. n.a. 47% 25%
EPS (HKD) 0.68 -0.33 0.36 0.53 0.66
YoY (%) n.a. n.a. n.a. 46.7% 25.2%
ROE (%) 3.9% n.a. 2.7% 8.1% 9.6%
Operating margin 3.5% 1.1% 7.9% 8.6% 10.0%
Source: Company, Daiwa forecasts; note: 2013-14 financials include CRB’s non-beer business, which was disposed of in September 2015
5
10
15
20
25
Jan-11 Jul-11 Jan-12 Jul-12 Jan-13 Jul-13 Jan-14 Jul-14 Jan-15 Jul-15
Mengniu 13 17
21 25 29
(HKD)
We believe increasing
selling expenses won’t
lead to rapid revenue
growth for Mengniu

26
China Consumer Staples Sector: 26 January 2016
Tsingtao Brewery (168 HK, HKD28.80, Underperform [4]): Still a market-share loser
We are concerned: 1) that Tsingtao’s market-share gains look to have come to an end in
2015E, while the other top-2 players gained market share during the period, and 2) about
continuously declining industry sales (-5.7% in 9M15). Hence, we cut our revenue
forecasts by 1-9% over 2015-17E. Feeding in our lower EPS forecasts, we pare our 12-
month TP to HKD26.80 (from HKD32.0). Our target PER of 19x (lowered from 20x) still
marks a 10% discount to the stock’s past-3-year average 12-month forward PER, as
Tsingtao’s EPS CAGR has declined from 8% for 2010-14 to almost 0% over 2015-17E (on
our forecasts). Accordingly, we reaffirm our Underperform (4) rating.
Tsingtao: financial summary Tsingtao Brewery: share price and [past-5-year] PER band
chart
Key Financials 2013 2014 FY15E 2016E 2017E
Revenue (CNY m) 28,291 29,049 28,092 26,912 27,286
YoY 9.7% 2.7% -3.3% -4.2% 1.4%
vs consensus n.a. n..a 2.1% -5.0% -7.0%
Reported net profit (CNY m) 1,971 1,994 1,636 1,610 1,714
YoY 12.1% 1.1% -17.9% -1.6% 6.5%
EPS (CNY) 1.30 1.48 1.21 1.19 1.27
YoY 0.2% 13.2% -17.9% -1.6% 6.5%
Operating margin % 7.4 6.6 6.3% 6.0% 6.5%
ROE% 13.3 13.6 10.3% 9.4% 9.4%
Source: Company, Daiwa forecasts Source: Bloomberg
Fufeng (546 HK, HKD2.61): Price headwinds strengthening - downgrading to Hold (3)
Given the product ASP declines, we are cutting: 1) Fufeng’s EPS forecasts over 2015-17E
by 5-25%, and 2) our target PER from 12x to 9x (from the stock’s high end to the past-5-
year average). Our new 12-month target price of HKD2.55 (previously HKD5.0) suggests
limited upside; we have cut our target PER multiple from 12x to 9x as the product ASP
uptrend looks to have come to an end and we believe Fufeng should now trade at its
historical average PER (vs high-end when we had previously expected a product price
upcycle). Hence, we downgrade our rating from Buy (1) to Hold (3). Shares are trading
currently at a 8.5x 2016E PER. We believe the ASP and operating-profit margin decline for
the xanthan gum business (10% of 2016E operating profit) has been priced in, while the
shares will likely be supported by EPS growth at 8%/8% YoY over 2016/17E, respectively.
Fufeng: financial summary Fufeng: share price and past-5-year PER band
Valuation 2013 2014 2015E 2016E 2017E
Revenue (CNY m) 11,367 11,298 11,761 12,869 12,992
YoY 2 -1 4 9 1
Our forecast vs. consensus (%) n..a n..a -1 -2 -6
Net profit (CNY m) 506 626 510 550 596
YoY 19 24 -19 8 8
EPS (CNY) 0.26 0.30 0.31 0.26 0.28
Recurring EPS growth (%) 5 16 -20 8 8
Operating margin (%) 8.1% 9.9% 7.6% 6.4% 6.8%
ROE (%) 11.8% 12.3% 9.0% 9.0% 9.2%
Source: Company, Daiwa forecasts Source: Bloomberg
20
30
40
50
60
70
80
Jan-
11
Apr
-11
Jul-1
1
Oct
-11
Jan-
12
Apr
-12
Jul-1
2
Oct
-12
Jan-
13
Apr
-13
Jul-1
3
Oct
-13
Jan-
14
Apr
-14
Jul-1
4
Oct
-14
Jan-
15
Apr
-15
Jul-1
5
Oct
-15
Jan-
16
168 HK 18 21
24 27 30
HKD
0
2
4
6
8
10
Nov
-07
Apr
-08
Sep
-08
Feb
-09
Jul-0
9
Dec
-09
May
-10
Oct
-10
Mar
-11
Aug
-11
Jan-
12
Jun-
12
Nov
-12
Apr
-13
Sep
-13
Feb
-14
Jul-1
4
Dec
-14
May
-15
Oct
-15
564.HK 3x 4.5x
6x 7.5x 9x
(HKD)
Huishan and Tsingtao
remain our least
preferred stocks

27
China Consumer Staples Sector: 26 January 2016
The somewhere in-betweens
Want Want (151 HK, HKD4.96, Buy [1])- Sales and earnings growth recovery in sight
We reiterate our Buy (1) rating on Want Want, but lower our 12-month target price to
HKD7.30 (set at 18.5x 2016E PER) from HKD8.50 (formerly 20x PER) after incorporating
downward revisions to our earnings of 8-10% over 2015-17E. Our target PER marks a
20% discount to the stock’s past-5-year average 12-month forward PER, as we expect
earnings growth to decelerate over 2015-17E vs the previous five years (15%). We
forecast Want Want’s earnings growth to recover in 2016-17E as we expect revenue from
its food business to see a 5% CAGR over 2015-17E, driven by new products and revenue
growth in the snack segment. We prefer Want Want over the other large-cap China staples
companies due to its stronger balance sheet and cash flow-supporting dividends and share
buybacks (USD288m spent in 2015).
Want Want: financial summary Want Want: share price and past-5-year PER band
2013 2014 2015E 2016E 2017E
Revenue (USD m) 3,818 3,775 3,532 3,748 4,008
YoY (%) 14% -1% -6% 6% 7%
Our forecast vs. consensus (%) n.a. n.a. -5.5% -3.0% -1.1%
Net profit (USD m) 686 619 547 643 709
Recurring net profit growth (%) 24% -10% -12% 18% 10%
EPS (USD) 0.0519 0.0468 0.0416 0.0501 0.0552
Recurring EPS growth (%) 24% -10% -11% 20% 10%
Operating margin 23.1% 20.6% 20.9% 23.5% 24.3%
ROE 38.8% 31.0% 27.1% 29.5% 27.6%
Source: Company, Daiwa forecasts
Source: Bloomberg
WH Group (288 HK, HKD4.40, Outperform [2]): Benefits from having a US brand
On our forecasts, WH Group is trading at a 10x 2016E PER and we expect the company to
deliver net-profit growth of 33% YoY for 2016. Its market cap now is almost equivalent to
the market value of its 73% stake in Henan Shuanghui (000895 SZ, Not Rated). Hence,
holders of the stock are effectively getting WH Group’s business outside China “for free”.
On our revised EPS forecasts and lower peer valuation benchmarks, we cut our 12-month
target price to HKD4.80 from HKD5.50, based on a 2016E PER of 11x (previously 13.4x).
Our target PER comprises 11.8x for the China operation (kept at a 20% discount to the
peer average on slower prospective EPS growth) and a 10.2x PER for the US operation (in
line with its US peers’ average).
WH Group: financial summary WH Group: share price and past-5-year PER band
2013 2014 2015E 2016E 2017E
Revenue (USD m) 11,253 22,243 22,017 23,362 24,623
YoY (%) 80% 98% -1% 6% 5%
Our forecast vs. consensus (%) n.a. n.a. 1% 1% 2%
Net profit (USD m) -263 766 611 814 908
Reported net profit growth (%) 38% 66% -28% 33% 12%
EPS (USD) 0.0452 0.0666 0.0417 0.0557 0.0621
Recurring EPS growth (%) 38% 48% -37% 33% 12%
Operating margin (%) 9.3 8.1 6.4 6.9 7.0
ROE(%) 25.0 22.8 11.3 13.5 13.4
Source: Company, Daiwa forecasts Source: Bloomberg
2
4
6
8
10
12
14
Jan-11 Jul-11 Feb-12 Aug-12 Mar-13 Sep-13 Apr-14 Nov-14 May-15 Dec-15
151.HK 15x 18x
21x 24x 27x
(HKD)
3
4
5
6
7
8
9
Aug
-14
Sep
-14
Oct
-14
Nov
-14
Dec
-14
Jan-
15
Feb
-15
Mar
-15
Apr
-15
May
-15
Jun-
15
Jul-1
5
Aug
-15
Sep
-15
Oct
-15
Nov
-15
Dec
-15
Jan-
16
288.HK 7x 8.5x
10x 11.5x 13x
(HKD)
Want Want is our only
Buy-rated stock among
the big-cap staples
names

28
China Consumer Staples Sector: 26 January 2016
Risks
Commodity prices – main risks, upside or downside
As raw materials (including many types of agricultural products and packaging) account for
over 80% of the COGS of the China staples companies in general, our profit-margin
assumptions for the companies that we cover factor in commodity-price risks. Many of the
raw materials they use, such as juice concentrates and palm oil, are imported to China,
and, hence, the companies are exposed to fluctuations in the global supply of these
commodities.
We expect the gross margins of many of the staples companies we cover to expand
slightly in 2016. Worse-than-expected depreciation of the CNY against USD, stronger
global economy, or large rebound in the oil price could create unexpected cost pressures
for the companies under our coverage. On the other hand, abundant supply of raw
materials (ie, good harvest of grains) may lead to lower production costs and, hence, better
gross margins for staple companies we covered.
Downside
Product safety
Food-safety hazards or negative talk in the market about the companies’ products could
have an adverse effect on their sales volumes, causing the latter to fall below our current
forecasts. Reports of food-safety issues, regardless of whether the China packaged food
and beverage companies are responsible, could undermine their brand value and sales
volumes.
Extreme weather changes
A cooler-than-expected winter could be a slight positive for selected items (ie, noodles,
meat). Also, a cooler-than-expected summer could dampen demand for bottled drinks.
Heavy rainfall could curb outdoor activities, which in turn could weigh on demand and thus
consumption of bottled drinks and packaged food.
Changes in regulations and price intervention
Direct price interventions by the China Government could put pressure on ASPs and
subsequently on the revenue of the packaged food and beverage companies. We believe
the risk of this is greater for the instant-noodle players than for the other packaged-food
segments, as instant noodles are a basic food item and any price hikes could create more
public concern than a price increase for non-essential items such as snacks.

See important disclosures, including any required research certifications, beginning on page 81
China Consumer Staples
What's new: After the recent pullback in the share price (-20% in 4Q15),
we upgrade UPCH to Buy (1) from Underperform (4). During our recent
retailer visits, we noted the increasing presence of UPCH’s new products,
in particular beverages. We expect the company’s earnings and revenue
growth to outperform its peers in 2016E, as a result of its increasing
contribution from new products, which carry high gross margins.
What's the impact: Adopting a diverse and differentiated approach to
increase market share. UPCH was able to consistently gain market share
over 2012-15E (+1.7/2.9pp for noodles/juice drinks, to 18%/20%,
respectively) in those segments through product diversification. We expect
such a trend to continue to drive revenue growth over 2016-17E, despite
the sluggish industry outlook for beverages (as highlighted in our industry
section), and this view was reaffirmed by our recent market research which
saw increasing presence of UPCH’s products in hypermarkets and
convenience stores, including, small-bottles of milk tea (fresh-milk brewed
to justify the higher ASPs), “vege-light” bow noodles, and sugar-free tea.
EPS growth of 19-11% YoY for 2016-17E. We raise our EPS for 2016-17E by
6-18% after revising up our gross margin assumptions. We also lift our revenue
forecasts for the beverage segment by 2%, as we believe UPCH will be able to
regain market share in both the juice and bottled-tea segments (+0.5pp-1pp
per year over 2016-17E). For noodles, we are cutting our revenue forecasts by
1% as the market is still shrinking. But we expect UPCH’s gross margin to
reach 36% in 2016, and remain flat for 2017E, as the contribution of high-
margin products rises while that for old products falls (vs. our previous forecast
of a slight decline). As UPCH’s operating margin is thin (at 5.2% in 2016E, vs.
8.7% for Tingyi), a 0.1pp improvement in the 2016 operating margin (led by
gross margin expansion) would lift its reported net profit by 1.8% (and vice
versa), on our estimates. As evidenced by the 1H15 results, such gross-margin
expansion was enough to offset the rise in selling expenses (for marketing new
products).
What we recommend: We cut our 12-month TP to HKD6.20 (from
HKD7.00) on a lower valuation benchmark, now based on a 22.6x 2016E
PER (previously 26.5x for 2016E), in line with the company’s average since
its IPO in 2007. Upgrade to Buy (1). Risk to our call: lower-than-expected
new product revenue contribution.
How we differ: Our 2016-17 revenue forecasts are 2-8% above consensus
as we are more optimistic on the revenue contribution from new products.
Our 2015-17E EPS are below due to our lower expectations for the
earnings contribution from the non-core business (Jinmailong JV).
26 January 2016
Uni-Presi dent Chi na
Upgrading to Buy; new beverage products shine
New beverage products to boost gross margins and market share
Recent share price pull-back provides buying opportunity
Upgrade to Buy (1) on market-share gains; TP now HKD6.20
Source: Daiwa forecasts
Source: FactSet, Daiwa forecasts
Uni-President China (220 HK)
Target price: HKD6.20 (from HKD7.00)
Share price (25 Jan): HKD5.20 | Up/downside: +19.2%
Anson Chan, CFA(852) 2532 4350
Forecast revisions (%)
Year to 31 Dec 15E 16E 17E
Revenue change (0.4) (0.1) 0.1
Net profit change (0.9) 6.2 17.6
Core EPS (FD) change (0.9) 6.2 17.6
70
86
103
119
135
4.5
5.5
6.5
7.5
8.5
Jan-15 Apr-15 Jul-15 Oct-15
Share price performance
Uni-Pres C (LHS) Relative to HSI (RHS)
(HKD) (%)
12-month range 4.98-8.13
Market cap (USDbn) 2.88
3m avg daily turnover (USDm) 3.27
Shares outstanding (m) 4,319
Major shareholder Uni-President Enterprise (1216.TT) (70.3%)
Financial summary (CNY)
Year to 31 Dec 15E 16E 17E
Revenue (m) 23,642 25,524 26,783
Operating profit (m) 1,042 1,334 1,465
Net profit (m) 844 1,004 1,114
Core EPS (fully-diluted) 0.195 0.232 0.258
EPS change (%) 510.7 18.9 11.0
Daiwa vs Cons. EPS (%) (2.8) (2.0) (7.6)
PER (x) 22.5 18.9 17.0
Dividend yield (%) 0.9 1.1 1.2
DPS 0.039 0.046 0.052
PBR (x) 1.6 1.5 1.4
EV/EBITDA (x) 8.3 7.1 6.4
ROE (%) 7.5 8.3 8.6

30
Uni-President China (220 HK): 26 January 2016
How do we justify our view?
Growth outlook Valuation Earnings revisions
Growth outlook UPCH: reported and recurring net profit, YoY %
We forecast UPCH’s net profit to rebound strongly by
566% YoY for 2015E (January-September 2015: +162%
YoY) mainly on gross margin expansion, driven by lower
raw-material costs (non-recurring in 2016-17E) and a
product mix upgrade (long-term catalyst). We continue to
see gross margin expansion as the key earnings catalyst
driving net profit to increase by 19% YoY for 2016E and
11% YoY for 2017E.
Source: Company, Daiwa forecasts
Valuation UPCH: 12-month forward PER bands since 2008
Over the past 5 years, UPCH has traded in a wide 12-
month forward PER range of 16-35x. Successful new
products were an important earnings and PER rerating
catalyst in 2012-13. Our new target PER of 22.6x for
2016E is based on the company’s average valuation since
2007 (vs. its past-5-year average of 26.5x that we used
previously), which we believe is more in line with the trough
valuation we saw in 2008-09. It also represents a premium
to the Chinese staples companies’ average (16x), as
UPCH is one of the few staple stocks able to offer mid-
teens EPS growth in 2016-17E, based on our estimates.
Source: Bloomberg
Earnings revisions UPCH: Bloomberg consensus EPS forecasts
UPCH’s 2016E consensus estimates trended up slightly in
2H15, due we believe to the launch of more new products
and it successfully gaining greater product penetration,
such as its Haizhiyen and Xiaoming classmates. We would
revisit our EPS forecasts if gross margin expansion from
new products launched was better than expected.
Source: Bloomberg
-40%
174%
-48% -72%
566%
19% 11%
(200%)
(100%)
0%
100%
200%
300%
400%
500%
600%
0
200
400
600
800
1,000
1,200
2011 2012 2013 2014 2015E 2016E 2017E
Reported net profit Recurring net profit
Reported net profit YoY %
2
4
6
8
10
Jan-09 Mar-10 May-11 Jul-12 Sep-13 Nov-14 Jan-16
220 HK 16 20
24 28 32
(HKD)
0.100
0.150
0.200
0.250
0.300
J-15 F-15 M-15 A-15 M-15 J-15 J-15 A-15 S-15 O-15 N-15 D-15
2015E 2016E
HKD

31
Uni-President China (220 HK): 26 January 2016
Financial summary
Key assumptions
Profit and loss (CNYm)
Cash flow (CNYm)
Source: FactSet, Daiwa forecasts
Year to 31 Dec 2010 2011 2012 2013 2014 2015E 2016E 2017E
Sales growth YoY - Instant noodles 67.4 67.3 22.5 7.7 1.7 (2.4) 1.0 1.0
Sales growth YoY - Beverage 27.0 21.5 30.2 8.9 (7.6) 9.6 11.8 6.9
Gross margin % - instant noodles 28.1 29.3 33.2 29.2 28.7 31.9 31.5 30.8
Gross margin % - beverage 34.1 29.8 35.6 35.8 35.3 38.3 39.5 39.4
Sellling and distribution expense ratio
(%)26.1 25.4 28.2 29.3 28.0 27.0 26.9 26.5
Advertising and promotion expense 11.3 10.0 13.0 12.3 10.5 10.5 10.2 10.0
Year to 31 Dec 2010 2011 2012 2013 2014 2015E 2016E 2017E
Instant noodles 3,549 5,936 7,270 7,826 7,960 7,773 7,851 7,929
Tea beverage 5,005 4,992 5,597 6,143 5,526 5,293 5,561 5,728
Other Revenue 4,037 6,047 8,539 9,328 9,002 10,575 12,112 13,125
Total Revenue 12,591 16,975 21,406 23,297 22,488 23,642 25,524 26,783
Other income 131 159 246 343 167 167 167 167
COGS (8,548) (12,032) (14,004) (15,518) (15,179) (15,281) (16,277) (17,113)
SG&A (3,616) (4,841) (6,766) (7,665) (7,263) (7,486) (8,079) (8,371)
Other op.expenses 0 0 0 0 0 0 0 0
Operating profit 558 261 882 458 213 1,042 1,334 1,465
Net-interest inc./(exp.) 55 95 64 99 (42) 40 10 22
Assoc/forex/extraord./others 69 63 146 563 244 75 50 60
Pre-tax profit 682 419 1,091 1,120 415 1,157 1,394 1,547
Tax (163) (84) (221) (200) (129) (312) (390) (433)
Min. int./pref. div./others 0 0 0 0 0 0 0 0
Net profit (reported) 519 335 870 920 286 844 1,004 1,114
Net profit (adjusted) 519 312 856 446 127 844 1,004 1,114
EPS (reported)(CNY) 0.144 0.093 0.242 0.256 0.072 0.195 0.232 0.258
EPS (adjusted)(CNY) 0.144 0.087 0.238 0.124 0.032 0.195 0.232 0.258
EPS (adjusted fully-diluted)(CNY) 0.144 0.087 0.238 0.124 0.032 0.195 0.232 0.258
DPS (CNY) 0.043 0.026 0.048 0.051 0.013 0.039 0.046 0.052
EBIT 558 261 882 458 213 1,042 1,334 1,465
EBITDA 930 800 1,693 1,522 1,568 2,531 2,923 3,154
Year to 31 Dec 2010 2011 2012 2013 2014 2015E 2016E 2017E
Profit before tax 682 419 1,091 1,120 415 1,157 1,394 1,547
Depreciation and amortisation 372 538 811 1,064 1,355 1,489 1,589 1,689
Tax paid (157) 37 (202) (259) (210) (312) (390) (433)
Change in working capital 197 503 646 (572) (142) (177) (41) (27)
Other operational CF items (124) (135) (195) (188) (43) (115) (60) (82)
Cash flow from operations 971 1,363 2,151 1,165 1,375 2,041 2,492 2,694
Capex (1,412) (4,162) (3,578) (4,746) (3,346) (2,000) (2,000) (2,000)
Net (acquisitions)/disposals 0 0 0 950 520 0 0 0
Other investing CF items 0 0 0 0 0 0 0 0
Cash flow from investing (1,412) (4,162) (3,578) (3,796) (2,826) (2,000) (2,000) (2,000)
Change in debt 166 2,930 875 2,033 (168) 444 (780) (1,000)
Net share issues/(repurchases) 0 0 0 0 2,665 0 0 0
Dividends paid (352) (156) (97) (171) (183) (57) (169) (201)
Other financing CF items (354) (37) 470 55 (102) (70) (106) (73)
Cash flow from financing (540) 2,738 1,247 1,917 2,212 316 (1,055) (1,274)
Forex effect/others 0 0 0 0 0 0 0 0
Change in cash (981) (61) (180) (714) 762 358 (562) (580)
Free cash flow (441) (2,799) (1,427) (3,581) (1,970) 41 492 694

32
Uni-President China (220 HK): 26 January 2016
Financial summary continued …
Balance sheet (CNYm)
Key ratios (%)
Source: FactSet, Daiwa forecasts
As at 31 Dec 2010 2011 2012 2013 2014 2015E 2016E 2017E
Cash & short-term investment 2,432 2,387 2,295 1,420 2,128 2,666 2,263 1,833
Inventory 1,139 1,274 1,285 1,514 1,129 1,256 1,338 1,407
Accounts receivable 401 513 513 548 487 512 553 581
Other current assets 429 443 824 1,026 1,343 1,343 1,343 1,343
Total current assets 4,402 4,617 4,917 4,508 5,088 5,778 5,498 5,164
Fixed assets 3,121 5,579 7,912 10,186 11,642 12,158 12,574 12,890
Goodwill & intangibles 11 8 7 17 29 29 29 29
Other non-current assets 2,047 3,533 3,704 4,258 4,506 4,506 4,506 4,506
Total assets 9,581 13,737 16,540 18,968 21,264 22,470 22,606 22,588
Short-term debt 166 1,584 409 902 1,556 2,000 2,000 2,000
Accounts payable 1,020 1,196 1,442 1,410 1,054 1,256 1,338 1,407
Other current liabilities 1,718 2,307 3,098 3,024 3,110 2,883 2,883 2,883
Total current liabilities 2,904 5,087 4,948 5,336 5,721 6,139 6,221 6,290
Long-term debt 0 1,512 3,562 5,102 4,280 4,280 3,500 2,500
Other non-current liabilities 17 328 358 388 427 427 427 427
Total liabilities 2,921 6,926 8,869 10,826 10,428 10,846 10,148 9,216
Share capital 34 34 34 34 40 40 40 40
Reserves/R.E./others 6,625 6,777 7,637 8,108 10,797 11,584 12,419 13,332
Shareholders' equity 6,660 6,811 7,671 8,142 10,837 11,624 12,459 13,372
Minority interests 0 0 0 0 0 0 0 0
Total equity & liabilities 9,581 13,737 16,540 18,968 21,264 22,470 22,606 22,588
EV 15,880 18,502 19,321 22,059 21,137 21,043 20,666 20,096
Net debt/(cash) (2,266) 709 1,675 4,584 3,708 3,614 3,237 2,667
BVPS (CNY) 1.850 1.892 2.131 2.262 2.509 2.691 2.884 3.096
Year to 31 Dec 2010 2011 2012 2013 2014 2015E 2016E 2017E
Sales (YoY) 38.2 34.8 26.1 8.8 (3.5) 5.1 8.0 4.9
EBITDA (YoY) (14.6) (14.0) 111.7 (10.1) 3.1 61.3 15.5 7.9
Operating profit (YoY) (27.2) (53.2) 237.4 (48.0) (53.5) 388.9 28.1 9.8
Net profit (YoY) (26.4) (39.9) 174.4 (47.9) (71.6) 566.2 18.9 11.0
Core EPS (fully-diluted) (YoY) (19.0) (39.9) 174.4 (47.9) (74.2) 510.7 18.9 11.0
Gross-profit margin 32.1 29.1 34.6 33.4 32.5 35.4 36.2 36.1
EBITDA margin 7.4 4.7 7.9 6.5 7.0 10.7 11.5 11.8
Operating-profit margin 4.4 1.5 4.1 2.0 0.9 4.4 5.2 5.5
Net profit margin 4.1 1.8 4.0 1.9 0.6 3.6 3.9 4.2
ROAE 7.9 4.6 11.8 5.6 1.3 7.5 8.3 8.6
ROAA 5.9 2.7 5.7 2.5 0.6 3.9 4.5 4.9
ROCE 8.4 3.1 8.2 3.6 1.4 6.0 7.4 8.2
ROIC 11.4 3.5 8.3 3.4 1.1 5.1 6.2 6.6
Net debt to equity n.a. 10.4 21.8 56.3 34.2 31.1 26.0 19.9
Effective tax rate 23.9 20.1 20.3 17.8 31.1 27.0 28.0 28.0
Accounts receivable (days) 9.8 9.8 8.7 8.3 8.4 7.7 7.6 7.7
Current ratio (x) 1.5 0.9 1.0 0.8 0.9 0.9 0.9 0.8
Net interest cover (x) n.a. n.a. n.a. n.a. 5.1 n.a. n.a. n.a.
Net dividend payout 30.0 27.9 19.7 19.9 18.3 20.0 20.0 20.0
Free cash flow yield n.a. n.a. n.a. n.a. n.a. 0.2 2.6 3.7
Company profile
Listed in Hong Kong in 2007, Uni-President China (UPCH) is the second-largest instant-noodle
manufacturer in China, with a 17.9% market share (2014), according to AC Nielsen. In addition, it
was the second-largest ready-to-drink tea brand (c.29% market share) and the largest milk tea
brand (c.62%) in the domestic market in 2014.

See important disclosures, including any required research certifications, beginning on page 81
Hong Kong Consumer Staples
What's new: We remain positive on Vinda’s earnings growth prospects in
view of its increasing sales of personal care products and expansion
outside China. We estimate the pan-Asian business being acquired will
contribute c.10% of Vinda’s revenue in 2016E (9 months’ contribution) and
see the operating margin for this unit improving gradually as scale builds.
We reiterate our Outperform (2) rating given: 1) the recent share-price
weakness, which we think has priced in the impact of CNY depreciation
against the USD, and 2) strong EPS growth in 2016-17E despite our cuts.
What's the impact: Emerging as an Asian play. Vinda is due to complete
the acquisition of its parent’s personal care product businesses in Malaysia,
Singapore, Taiwan and Korea (“acquired business”) by March 2016. Thus,
we are raising our 2016-17E revenue by 9-14% (see our Memo, Acquisition
of Pan-Asia business, 28 December 2015 for details). Due to a lack of
economies of scale, the acquired business’s operating margin was 5.7% in
9M15, vs. 9.7% for Vinda. As such, we expect Vinda’s reported operating
margin to be dragged down to 10% in 2016E (2014-15E: 10.5%). However,
we look for: 1) the operating margin for the China operations to still trend
up slightly in 2016E (by 0.4pp YoY to 11%) on an increase in personal care
product sales, and 2) the acquired business’s operating margin to improve
gradually as products sourced from China lead to lower production costs.
Earnings cut due to CNY depreciation. We are revising down our 2015E
revenue after a slight slowdown in tissue market revenue growth in China
in 2H15E. However, we are cutting our 2016-17E EPS by 13-33%, as we
assume a: 1) FX loss of HKD200-300m over 2015-17E (17-36% of
recurring net profit) due to CNY weakness (using Daiwa’s USD/CNY rate of
7.5 by end-2016E), and 2) 13% EPS dilution from the new share issue for
the acquisition. While Vinda is the most negatively impacted by CNY
weakness in our coverage universe due to its USD debt exposure (>90% in
2015E), we believe its underlying growth remains robust, and hence
forecast EPS growth of 19%/52% YoY for 2016-17E, or 20%/30% YoY on
an ex-FX impact basis.
What we recommend: We reaffirm our Outperform (2) rating, but cut our
12-month TP to HKD14.30 from HKD17.40, now based on a 25x 2016E
PER (vs. 20.4x before). After the acquisition of its parent’s Asian business,
we now peg Vinda’s valuation to international peers’ (average 20x 2016E
PER), and apply a 25% premium for its better EPS-growth profile (2016E:
19% vs. 9% for peers). Key risk: a surge in pulp or selling expenses.
How we differ: Our 2016-17E EPS are 11-29% below consensus, which
we attribute to Daiwa’s more bearish view on the CNY/USD exchange rate.
26 January 2016
Vinda International
Look beyond CNY issues; emerging Asian play
EPS and TP cut after building in higher FX loss assumptions
Asia business acquisition likely to complete in 1Q16 and drive revenue
Reiterate Outperform on valuation and stronger-than-peer EPS growth
Source: Daiwa forecasts
Source: FactSet, Daiwa forecasts
Vinda International (3331 HK)
Target price: HKD14.30 (from HKD17.40)
Share price (25 Jan): HKD13.00 | Up/downside: +10.0%
Anson Chan, CFA(852) 2532 4350
Forecast revisions (%)
Year to 31 Dec 15E 16E 17E
Revenue change (4.2) 9.0 13.6
Net profit change (25.3) (28.3) (2.1)
Core EPS (FD) change (25.3) (33.1) (13.4)
100
118
135
153
170
11
13
15
17
20
Jan-15 Apr-15 Jul-15 Oct-15
Share price performance
Vinda Intl (LHS) Relative to HSI (RHS)
(HKD) (%)
12-month range 11.80-19.32
Market cap (USDbn) 1.66
3m avg daily turnover (USDm) 0.97
Shares outstanding (m) 998
Major shareholder SCA (51.4%)
Financial summary (HKD)
Year to 31 Dec 15E 16E 17E
Revenue (m) 9,421 12,341 14,340
Operating profit (m) 990 1,242 1,605
Net profit (m) 478 609 979
Core EPS (fully-diluted) 0.479 0.570 0.867
EPS change (%) (19.5) 19.0 52.2
Daiwa vs Cons. EPS (%) (22.9) (29.1) (10.9)
PER (x) 27.2 22.8 15.0
Dividend yield (%) 1.5 1.5 2.0
DPS 0.190 0.201 0.261
PBR (x) 2.3 1.7 1.6
EV/EBITDA (x) 11.9 10.9 8.7
ROE (%) 8.9 8.7 11.1

34
Vinda International (3331 HK): 26 January 2016
How do we justify our view?
Growth outlook Valuation Earnings revisions
Growth outlook Vinda: net profit and net-profit growth
We forecast Vinda’s net profit to decline by 19.5% YoY for
2015E as we assume a HKD280m FX loss on the CNY’s
depreciation vs. the HKD. We look for EPS growth of 19%
YoY for 2016E against net profit growth of 27.5% YoY, due
to new share issue dilution as a result of its acquisition. Net
profit growth will accelerate to 61% YoY for 2017E, on our
forecasts, due to: 1) a reduction in FX losses, and 2) 16%
YoY organic revenue growth on the back of increasing
tissue sales and slight operating margin expansion. Our
sensitivity analysis shows that a 1% depreciation in the
CNY:USD exchange rate would lead to a 4% decline in the
company’s reported net profit for 2016E.
Source: Company, Daiwa forecasts
Valuation Vinda: 12-month forward PER bands
Vinda was rerated between September 2013 and
September 2015 after Sweden’s SCA became its major
shareholder through Vinda acquiring SCA’s personal care
product business in China. We believe the recent share-
price drop already factors in the negative impact of CNY
depreciation. We look for Vinda to be rerated over 2016-
17E as synergies with the acquired pan-Asia business kick
in, and penetration of Vinda/SCA’s personal care products
improves in China. We believe our target 2016E PER of
25x is undemanding given we forecast the company’s EPS
to grow at 35% CAGR over 2015-17, including 19% YoY in
2016. Our target price also implies a 2017E PER of 16.5x,
which is at a slight discount to the peers’ average of 18x.
Source: Bloomberg
Earnings revisions Vinda: Bloomberg consensus EPS (2015-16E)
We see downside to the Bloomberg consensus 2015-16
EPS forecasts due to our higher FX loss assumptions from
CNY depreciation (2015E: HKD280m; 2016E: HKD300m;
2017E: HKD200m). However, on an ex-FX loss basis, our
forecasts call for earnings growth of 24%/20%/30% YoY
over 2015-17E driven by its acquisition of the Asian
business and expansion of its tissue sales volume growth
in China.
Source: Bloomberg
(30%)
(20%)
(10%)
0%
10%
20%
30%
40%
50%
60%
70%
(400)
(200)
0
200
400
600
800
1,000
1,200
2011 2012 2013 2014 2015E 2016E 2017E
Reported pro fit FX loss YoY
(HKDm)
0
5
10
15
20
25
Jan 11 Jan 12 Jan 13 Jan 14 Jan 15 Jan 16
3331 HK 12x 15x
18x 21x 24x
(HKD)
0.3
0.4
0.5
0.6
0.7
0.8
0.9
1.0
Jan-
15
Feb
-15
Ma
r-15
Apr
-15
Ma
y-15
Jun-
15
Jul-1
5
Aug
-15
Sep
-15
Oct
-15
Nov
-15
Dec
-15
2015E 2016E
(HKD)

35
Vinda International (3331 HK): 26 January 2016
Financial summary
Key assumptions
Profit and loss (HKDm)
Cash flow (HKDm)
Source: FactSet, Daiwa forecasts
Year to 31 Dec 2010 2011 2012 2013 2014 2015E 2016E 2017E
Volume YoY % 26 19 27 14 15 15 8 8
ASP YoY % 2.2 10.9 (0.2) (0.7) 0.4 0.2 2.5 2.2
Selling cost ratio % 12.4 12.1 12.8 13.9 14.9 15.3 16.2 16.0
Wood pulp cost change YoY % 34 (2) (12) 8 (2) (1) (2) 0
Year to 31 Dec 2010 2011 2012 2013 2014 2015E 2016E 2017E
Toilet roll 2,201 2,926 3,669 3,970 4,293 4,568 4,568 4,796
Other tissue papers 1,401 1,839 2,355 2,828 3,577 4,503 5,478 6,290
Other Revenue 0 0 0 0 115 350 2,295 3,254
Total Revenue 3,602 4,765 6,024 6,798 7,985 9,421 12,341 14,340
Other income 22 18 55 40 91 60 60 60
COGS (2,540) (3,469) (4,169) (4,826) (5,577) (6,458) (8,384) (9,739)
SG&A (626) (814) (1,138) (1,317) (1,661) (2,034) (2,775) (3,057)
Other op.expenses 0 0 0 0 0 0 0 0
Operating profit 458 501 772 694 839 990 1,242 1,605
Net-interest inc./(exp.) (3) 19 (41) (57) (79) (116) (171) (165)
Assoc/forex/extraord./others 6 2 (12) 35 (23) (280) (300) (200)
Pre-tax profit 460 522 719 672 737 594 771 1,239
Tax (91) (116) (182) (130) (144) (116) (162) (260)
Min. int./pref. div./others 0 0 0 0 0 0 0 0
Net profit (reported) 369 406 537 543 593 478 609 979
Net profit (adjusted) 369 406 537 543 593 478 609 979
EPS (reported)(HKD) 0.394 0.432 0.537 0.543 0.594 0.479 0.570 0.867
EPS (adjusted)(HKD) 0.394 0.432 0.537 0.543 0.594 0.479 0.570 0.867
EPS (adjusted fully-diluted)(HKD) 0.394 0.432 0.537 0.543 0.594 0.479 0.570 0.867
DPS (HKD) 0.118 0.120 0.156 0.156 0.160 0.190 0.201 0.261
EBIT 458 501 772 694 839 990 1,242 1,605
EBITDA 588 664 972 968 1,218 1,436 1,754 2,184
Year to 31 Dec 2010 2011 2012 2013 2014 2015E 2016E 2017E
Profit before tax 460 522 719 672 737 594 771 1,239
Depreciation and amortisation 130 163 200 274 379 446 512 579
Tax paid (101) (140) (217) (205) (44) (116) (162) (260)
Change in working capital (339) (150) (15) (1) (53) (363) (488) (332)
Other operational CF items (3) (21) 53 81 82 115 171 165
Cash flow from operations 147 373 740 821 1,100 676 804 1,391
Capex (473) (833) (1,264) (1,386) (1,009) (1,000) (1,000) (1,000)
Net (acquisitions)/disposals 1 7 36 (21) (1,366) 0 (3,776) 0
Other investing CF items 0 0 0 0 0 0 0 0
Cash flow from investing (472) (826) (1,228) (1,407) (2,375) (1,000) (4,776) (1,000)
Change in debt 224 882 114 653 1,727 144 2,002 0
Net share issues/(repurchases) 33 5 531 (9) 0 (9) 2,077 0
Dividends paid (112) (112) (130) (161) (148) (189) (227) (295)
Other financing CF items 212 (77) (17) 34 (299) (43) (47) (96)
Cash flow from financing 357 697 498 517 1,281 (97) 3,805 (391)
Forex effect/others (6) (4) (4) (62) 18 280 300 200
Change in cash 27 241 5 (131) 24 (141) 133 200
Free cash flow (326) (460) (525) (565) 91 (324) (196) 391

36
Vinda International (3331 HK): 26 January 2016
Financial summary continued …
Balance sheet (HKDm)
Key ratios (%)
Source: FactSet, Daiwa forecasts
As at 31 Dec 2010 2011 2012 2013 2014 2015E 2016E 2017E
Cash & short-term investment 390 716 760 693 722 486 472 581
Inventory 1,322 1,372 1,447 1,643 2,029 2,350 3,051 3,544
Accounts receivable 647 939 1,116 1,286 1,524 1,888 2,472 2,873
Other current assets 1 43 42 41 62 90 90 90
Total current assets 2,359 3,071 3,365 3,663 4,336 4,813 6,085 7,087
Fixed assets 2,273 3,022 3,987 5,102 5,902 6,478 9,795 10,238
Goodwill & intangibles 11 10 13 21 1,400 1,400 1,400 1,400
Other non-current assets 248 360 458 586 565 565 1,535 1,535
Total assets 4,891 6,464 7,823 9,373 12,203 13,257 18,815 20,260
Short-term debt 557 801 1,219 1,032 1,556 1,700 2,000 2,000
Accounts payable 980 1,210 1,423 1,820 2,309 2,674 3,472 4,033
Other current liabilities 64 69 91 58 154 139 139 139
Total current liabilities 1,601 2,080 2,733 2,911 4,020 4,514 5,611 6,173
Long-term debt 530 1,169 865 1,705 2,909 2,909 4,611 4,611
Other non-current liabilities 72 76 105 110 194 194 194 194
Total liabilities 2,203 3,325 3,704 4,726 7,122 7,616 10,416 10,977
Share capital 94 94 100 100 100 100 100 100
Reserves/R.E./others 2,594 3,045 4,019 4,547 4,981 5,541 8,299 9,184
Shareholders' equity 2,688 3,139 4,119 4,647 5,081 5,641 8,399 9,284
Minority interests 0 0 0 0 0 0 0 0
Total equity & liabilities 4,891 6,464 7,823 9,373 12,203 13,257 18,815 20,260
EV 13,677 14,173 14,207 14,932 16,722 17,102 19,117 19,009
Net debt/(cash) 698 1,254 1,325 2,044 3,743 4,123 6,139 6,030
BVPS (HKD) 2.870 3.345 4.121 4.654 5.089 5.650 7.438 8.221
Year to 31 Dec 2010 2011 2012 2013 2014 2015E 2016E 2017E
Sales (YoY) 29.8 32.3 26.4 12.8 17.5 18.0 31.0 16.2
EBITDA (YoY) (8.6) 13.0 46.3 (0.4) 25.8 17.9 22.2 24.5
Operating profit (YoY) (12.2) 9.5 53.9 (10.1) 20.9 18.0 25.4 29.2
Net profit (YoY) (7.3) 10.0 32.3 1.1 9.3 (19.5) 27.5 60.7
Core EPS (fully-diluted) (YoY) (10.5) 9.8 24.2 1.2 9.4 (19.5) 19.0 52.2
Gross-profit margin 29.5 27.2 30.8 29.0 30.2 31.5 32.1 32.1
EBITDA margin 16.3 13.9 16.1 14.2 15.3 15.2 14.2 15.2
Operating-profit margin 12.7 10.5 12.8 10.2 10.5 10.5 10.1 11.2
Net profit margin 10.2 8.5 8.9 8.0 7.4 5.1 4.9 6.8
ROAE 15.5 13.9 14.8 12.4 12.2 8.9 8.7 11.1
ROAA 8.6 7.1 7.5 6.3 5.5 3.8 3.8 5.0
ROCE 13.6 11.3 13.6 10.2 9.9 10.0 9.8 10.4
ROIC 12.3 10.0 11.7 9.2 8.7 8.6 8.1 8.5
Net debt to equity 26.0 40.0 32.2 44.0 73.7 73.1 73.1 65.0
Effective tax rate 19.8 22.3 25.3 19.3 19.5 19.5 21.0 21.0
Accounts receivable (days) 53.5 60.8 62.3 64.5 64.2 66.1 64.5 68.0
Current ratio (x) 1.5 1.5 1.2 1.3 1.1 1.1 1.1 1.1
Net interest cover (x) 139.2 n.a. 19.0 12.2 10.6 8.5 7.3 9.7
Net dividend payout 30.0 27.7 29.0 28.7 26.9 39.6 35.3 30.1
Free cash flow yield n.a. n.a. n.a. n.a. 0.7 n.a. n.a. 3.0
Company profile
Vinda is the 3rd-largest tissue paper brand in China, with a market share of approximately 13% in
2014, according to AC Nielsen. Its major products include toilet rolls, box tissues, handkerchiefs,
and soft-pack tissues.

See important disclosures, including any required research certifications, beginning on page 81
China Consumer Staples
What's new: Unlike other dairy processors, Want Want’s milk-powder cost
trend should remain favourable in 1H16 as it uses up its reserves of low-
cost inventory, whose unit cost we estimate is still c.20% below the current
milk powder spot price on the international market. Moreover, we expect
the ASP of Want Want’s rice crackers to continue to rise due to product-mix
adjustments (with the company planning more seasonal products/festive
items), and we see Want Want maintaining its strategy of avoiding price
competition to protect its brand and pricing power. Reiterate Buy (1) rating.
What's the impact: Gross margin poised to improve. We are cutting our
2015-17E EPS by 8-10%: 1) as we expect FX losses over 2015-17 due to
CNY depreciation against the USD, and 2) after revising down our 2015-
17E revenue by 4-5% on rising competition in the dairy industry. That said,
we look for Want Want’s revenue growth to resume in 2016-17E at 6-7%
YoY (vs. a 1-6% YoY decline in 2014 and 2015) on the new products
launched in 2014-15E continuing to gain market share, and a recovery in
revenue growth for snacks in 2016E. This, coupled with lower raw-material
costs, should see the gross margin improve slightly by 0.3pp to around
44% for 2016E, after a 3.4pp YoY jump in 2015E.
Still our top pick. We still prefer Want Want over the other big-cap staple
companies due to: 1) our expectation that its EPS growth will resume in
2016-17E, and 2) its stronger balance sheet and cash flow, and 3) our
preference for the snacks segment over other key food & beverage
categories due to its potentially relatively faster segment revenue growth.
What we recommend: We trim our 12-month target price to HKD7.30
(from HKD8.50), which is now based on an 18.5x 2016E PER (from 20x)
post our EPS revisions. Our target PER is based on a 20% discount to the
stock’s past-5-year average 12-month forward PER (now 23.2x vs. 25x
previously with the same 20% discount), as we expect a slowdown in dairy
market growth over 2015-17E vs. the previous 5 years. However, we see
continuous share buybacks, armed with its FCF of USD550m/year over
2016-17E (it spent c.USD288m in 2015) as a potential catalyst. With EPS
growth heading back towards positive territory in 2016-17E, we reaffirm our
Buy (1) call. The key risk: a surge in promotion costs.
How we differ: Our 2015E EPS is 11% below consensus due to our lower
dairy revenue assumptions. We are more optimistic on Want Want’s dry
food business (rice crackers, snacks) in 2016-17E and beyond, given the
low per-capita consumption base in China, as evidenced by our above-
consensus 2016-17 EPS forecasts.
26 January 2016
Want Want Chi na
Revenue and earnings growth recovery in sight
Remains our only Buy among big-caps due to strong balance sheet
Focus on snacks segment to support pricing power
EPS growth to resume in 2016-17E; reiterate Buy (1) rating
Source: Daiwa forecasts
Source: FactSet, Daiwa forecasts
Want Want China (151 HK)
Target price: HKD7.30 (from HKD8.50)
Share price (25 Jan): HKD4.96 | Up/downside: +47.1%
Anson Chan, CFA(852) 2532 4350
Forecast revisions (%)
Year to 31 Dec 15E 16E 17E
Revenue change (5.5) (4.5) (4.4)
Net profit change (9.4) (8.8) (10.1)
Core EPS (FD) change (9.7) (7.8) (9.1)
65
75
85
95
105
4.5
5.8
7.0
8.3
9.5
Jan-15 Apr-15 Jul-15 Oct-15
Share price performance
Want Want (LHS) Relative to HSI (RHS)
(HKD) (%)
12-month range 4.79-9.32
Market cap (USDbn) 8.18
3m avg daily turnover (USDm) 16.45
Shares outstanding (m) 12,855
Major shareholder Eng-meng Tsai (48.0%)
Financial summary (USD)
Year to 31 Dec 15E 16E 17E
Revenue (m) 3,532 3,748 4,008
Operating profit (m) 739 880 974
Net profit (m) 547 643 709
Core EPS (fully-diluted) 0.042 0.050 0.055
EPS change (%) (11.1) 20.2 10.3
Daiwa vs Cons. EPS (%) (9.5) 2.2 8.2
PER (x) 15.3 12.7 11.5
Dividend yield (%) 3.0 3.9 4.3
DPS 0.019 0.025 0.028
PBR (x) 4.1 3.4 3.0
EV/EBITDA (x) 9.1 7.4 6.4
ROE (%) 27.1 29.5 27.6

38
Want Want China (151 HK): 26 January 2016
How do we justify our view?
Growth outlook Valuation Earnings revisions
Growth outlook Want Want: net profit net-profit growth
We forecast Want Want’s net profit to recover to 18% YoY
and 10% YoY in 2016-17E, after 2 consecutive years of
decline. The key drivers would be: 1) a recovery in revenue
to a 6% CAGR over 2015-17E (-7% in 2015E) supported
by snacks segment growth, and 2) slight operating margin
expansion from a higher contribution from high-margin new
products and streamlining of the sales team (completed in
2H15).
Source: Company, Daiwa forecasts
Valuation Want Want: 12-month forward PER bands
Want Want is trading near the low-end of its past 5-year
12M forward PER band (15-28x). It has the strongest free
cash flow and balance sheet among the staples companies
we cover, which could support share buybacks (it spent
USD288m in 2015 on buying shares back). We expect
Want Want to rerate towards its past-5-year average PER
of 23x as earnings growth gradually resumes from 2016E.
Source: Bloomberg
Earnings revisions Want Want: 2015-16E Bloomberg EPS consensus
The Bloomberg-consensus 2015-16 EPS forecasts for
Want Want trended down in 2015 on a slowdown in
revenue momentum, in particular for dairy beverages.
However, we expect earnings growth to recover on
improving snacks revenue growth as a result of the new
products launched in 2014-15. Our 2016E EPS is 2%
above the Bloomberg-consensus forecasts.
Source: Bloomberg
17%
32%
24%
-10% -12%
18%
10%
(20%)
(10%)
0%
10%
20%
30%
40%
0
100
200
300
400
500
600
700
800
2011 2012 2013 2014E 2015E 2016E 2017E
Net profit (LHS) YoY (RHS)
(USDm)
2
4
6
8
10
12
14
Jan-11 Jul-11 Feb-12 Aug-12 Mar-13 Sep-13 Apr-14 Nov-14 May-15 Dec-15
151.HK 15x 18x
21x 24x 27x
(HKD)
0.04
0.05
0.05
0.06
0.06
0.07
0.07
0.08
Jan
15
Feb
15
Mar
15
Apr
15
May
15
Jun
15
Jul 1
5
Aug
15
Sep
15
Oct
15
Nov
15
Dec
15
2015E 2016E
(USD)

39
Want Want China (151 HK): 26 January 2016
Financial summary
Key assumptions
Profit and loss (USDm)
Cash flow (USDm)
Source: FactSet, Daiwa forecasts
Year to 31 Dec 2010 2011 2012 2013 2014 2015E 2016E 2017E
Sales growth YoY - rice crackers 34.3 30.0 (0.6) 12.0 (10.8) 8.2 6.6 7.5
Sales growth YoY - beverages 33.8 30.6 22.6 17.0 (0.3) (14.1) 2.5 3.4
Sales growth YoY - snacks 22.0 36.1 14.8 8.4 7.0 (3.6) 12.4 12.5
Gross margin % - rice crackers 40.8 37.6 39.0 40.8 39.9 41.9 42.6 43.3
Gross margin % - beverages 34.6 33.4 39.5 41.3 38.4 43.7 44.1 43.5
Gross margin % - snacks 40.7 34.5 40.4 43.0 44.9 45.2 44.8 44.9
Year to 31 Dec 2010 2011 2012 2013 2014 2015E 2016E 2017E
Rice crackers 629 817 812 910 812 879 937 1,007
Beverages 1,067 1,394 1,709 1,999 1,993 1,712 1,755 1,815
Other Revenue 548 736 838 909 970 941 1,056 1,186
Total Revenue 2,244 2,947 3,359 3,818 3,775 3,532 3,748 4,008
Other income 41 61 46 78 73 73 73 73
COGS (1,400) (1,922) (2,031) (2,232) (2,256) (1,991) (2,104) (2,251)
SG&A (447) (564) (664) (781) (816) (875) (837) (856)
Other op.expenses 0 0 0 0 0 0 0 0
Operating profit 439 522 711 883 777 739 880 974
Net-interest inc./(exp.) 4 16 38 49 53 45 21 26
Assoc/forex/extraord./others 0 0 1 2 (1) (1) (1) (1)
Pre-tax profit 443 538 749 934 830 782 900 1,000
Tax (84) (119) (195) (247) (210) (235) (257) (290)
Min. int./pref. div./others 0 0 0 (1) (1) (1) (1) (1)
Net profit (reported) 359 420 554 686 619 547 643 709
Net profit (adjusted) 359 420 554 686 619 547 643 709
EPS (reported)(USD) 0.027 0.032 0.042 0.052 0.047 0.042 0.050 0.055
EPS (adjusted)(USD) 0.027 0.032 0.042 0.052 0.047 0.042 0.050 0.055
EPS (adjusted fully-diluted)(USD) 0.027 0.032 0.042 0.052 0.047 0.042 0.050 0.055
DPS (USD) 0.023 0.020 0.029 0.035 0.024 0.019 0.025 0.028
EBIT 439 522 711 883 777 739 880 974
EBITDA 500 596 798 988 899 876 1,029 1,133
Year to 31 Dec 2010 2011 2012 2013 2014 2015E 2016E 2017E
Profit before tax 443 538 749 934 830 782 900 1,000
Depreciation and amortisation 61 74 88 105 122 137 148 158
Tax paid (72) (82) (186) (222) (210) (235) (257) (290)
Change in working capital (16) 54 (14) 191 (418) 181 (24) 6
Other operational CF items (4) (16) (38) (50) (53) (44) (20) (25)
Cash flow from operations 412 568 598 958 271 822 749 849
Capex (171) (224) (243) (273) (354) (250) (200) (200)
Net (acquisitions)/disposals 0 0 0 0 0 0 0 0
Other investing CF items 0 0 0 0 0 0 0 0
Cash flow from investing (171) (224) (243) (273) (354) (250) (200) (200)
Change in debt 287 381 (22) 255 158 (272) 0 0
Net share issues/(repurchases) (8) 0 0 (5) (38) (290) (14) 0
Dividends paid (317) (259) (299) (419) (460) (295) (272) (333)
Other financing CF items (4) 67 26 49 12 15 37 28
Cash flow from financing (41) 189 (294) (121) (327) (843) (249) (305)
Forex effect/others 0 0 0 0 0 0 0 0
Change in cash 200 533 61 564 (410) (271) 300 344
Free cash flow 241 345 355 685 (83) 572 549 649

40
Want Want China (151 HK): 26 January 2016
Financial summary continued …
Balance sheet (USDm)
Key ratios (%)
Source: FactSet, Daiwa forecasts
As at 31 Dec 2010 2011 2012 2013 2014 2015E 2016E 2017E
Cash & short-term investment 906 1,437 1,499 2,060 1,650 1,381 1,686 2,035
Inventory 339 410 461 534 667 436 490 524
Accounts receivable 101 160 166 164 132 124 131 140
Other current assets 107 96 142 152 140 140 140 140
Total current assets 1,454 2,103 2,268 2,911 2,589 2,081 2,447 2,839
Fixed assets 758 891 1,046 1,236 1,448 1,564 1,620 1,665
Goodwill & intangibles 1 1 1 1 1 1 1 1
Other non-current assets 77 128 146 201 246 246 246 246
Total assets 2,290 3,123 3,461 4,348 4,284 3,892 4,313 4,751
Short-term debt 294 775 350 410 518 246 246 246
Accounts payable 184 211 231 281 197 200 211 226
Other current liabilities 386 531 599 823 578 516 543 577
Total current liabilities 864 1,517 1,181 1,515 1,293 962 1,000 1,049
Long-term debt 350 250 653 847 898 898 898 898
Other non-current liabilities 0 24 24 34 35 35 35 35
Total liabilities 1,214 1,791 1,858 2,396 2,226 1,895 1,932 1,981
Share capital 264 264 265 265 264 264 264 264
Reserves/R.E./others 809 1,065 1,331 1,679 1,786 1,725 2,109 2,498
Shareholders' equity 1,073 1,330 1,595 1,943 2,050 1,989 2,373 2,762
Minority interests 3 3 8 9 8 8 8 8
Total equity & liabilities 2,290 3,123 3,461 4,348 4,284 3,892 4,313 4,751
EV 7,924 7,774 7,693 7,384 7,952 7,949 7,644 7,295
Net debt/(cash) (262) (413) (496) (802) (234) (237) (542) (891)
BVPS (USD) 0.081 0.101 0.121 0.147 0.155 0.155 0.185 0.215
Year to 31 Dec 2010 2011 2012 2013 2014 2015E 2016E 2017E
Sales (YoY) 31.2 31.3 14.0 13.7 (1.1) (6.5) 6.1 6.9
EBITDA (YoY) 22.7 19.3 33.9 23.8 (9.1) (2.6) 17.5 10.1
Operating profit (YoY) 23.4 19.0 36.0 24.3 (12.0) (4.9) 19.2 10.7
Net profit (YoY) 14.5 16.9 32.0 23.8 (9.8) (11.6) 17.6 10.3
Core EPS (fully-diluted) (YoY) 14.5 16.9 31.9 23.7 (9.7) (11.1) 20.2 10.3
Gross-profit margin 37.6 34.8 39.5 41.5 40.2 43.6 43.9 43.8
EBITDA margin 22.3 20.2 23.8 25.9 23.8 24.8 27.4 28.3
Operating-profit margin 19.6 17.7 21.2 23.1 20.6 20.9 23.5 24.3
Net profit margin 16.0 14.2 16.5 18.0 16.4 15.5 17.1 17.7
ROAE 34.8 34.9 37.9 38.8 31.0 27.1 29.5 27.6
ROAA 17.7 15.5 16.8 17.6 14.3 13.4 15.7 15.6
ROCE 28.6 25.6 28.6 30.4 23.2 22.3 26.4 26.2
ROIC 48.8 47.0 51.9 57.5 39.0 28.8 35.0 37.2
Net debt to equity n.a. n.a. n.a. n.a. n.a. n.a. n.a. n.a.
Effective tax rate 19.0 22.0 26.0 26.5 25.3 30.0 28.5 29.0
Accounts receivable (days) 14.2 16.2 17.7 15.8 14.3 13.2 12.4 12.4
Current ratio (x) 1.7 1.4 1.9 1.9 2.0 2.2 2.4 2.7
Net interest cover (x) n.a. n.a. n.a. n.a. n.a. n.a. n.a. n.a.
Net dividend payout 83.2 61.6 68.3 67.1 51.6 46.1 50.2 50.1
Free cash flow yield 2.9 4.2 4.3 8.4 n.a. 7.0 6.7 7.9
Company profile
Want Want China is the leading producer of rice crackers and flavoured milk drinks in China, with
market shares of about 70% and 40%, respectively, in terms of revenue for 2013, based on our
estimates. The company also makes dairy products and savoury and sweet snack foods.

See important disclosures, including any required research certifications, beginning on page 81
China Consumer Staples
What's new: We are now more conservative on the outlook for raw-milk
prices in 2016, but see CMD as a beneficiary of a long-term structural
shortage of high-quality raw milk in China. Also, the company stands to
benefit significantly from a rise in downstream revenue. Reiterate Buy (1).
What's the impact: Downstream: ambitious but feasible target.
Management targets downstream revenue to contribute 50% to total
revenue by 2020, vs. 25% in 2015E. We believe this goal is achievable and
would be highly profitable given it focuses on premium products. CMD’s
market share in the premium UHT milk segment in China already rose to
8% in 3Q15 (+2.9pp YoY). By adding new products and focusing on brand
building (highlighting its high quality and 100% in-house raw-milk source),
we believe a 24% revenue CAGR is achievable over 2015-17E.
Lower feed costs could largely offset raw-milk-price pressure. With
declining feed costs, some large competitors may lower their ASPs to boost
sales volume, driving pricing pressure in the industry. Moreover, despite the
recent rebound in milk-powder prices globally (+42% YoY in the 1st week of
December, from a trough of USD1,560/tonne in August 2015, as per
Fonterra, the dominant producer/exporter of milk powder in New Zealand),
milk-powder prices are still near a 5-year low globally. This implies imported
milk powder could remain a cheap substitute for liquid raw milk in 2016E.
But lower feed (mainly corn) costs, could see CMD’s gross margin improve
by 1.1pp YoY in 2016E, despite our revised forecast for flat raw-milk prices
(previously a 3% YoY rise per year) over 2016-17E.
What we recommend: We cut our 2015E EPS by 20% due to a higher-
than-expected loss from the revaluation of biological assets announced in
the profit warning issued in December 2015. We also cut our 2016-17E
EPS by 20% each after lowering our raw-milk-price assumptions to flat
(from 3-4% rises previously). (See Takeaways from conference call on
2015 profit warning, 21 December 2015.) We lower our 12-month SOTP-
based target price to HKD3.0 (from HKD 3.30). We now value the upstream
business (dairy farms) at HKD2.30 (previously HKD2.60) using a DCF
model, and the downstream business at HKD0.70, based on a 15x 2016E
PER (unchanged and in line with the average of its China peers). We
reiterate our Buy (1) rating. Key risks: an unexpected outbreak of bovine
disease and/or a surge in feed costs.
How we differ: Our 2015-16E EPS are 5-18% below consensus due to our
higher revaluation-loss forecasts from biological asset revaluation. Our
2017E EPS is 20% above consensus as we are more optimistic than the
market on CMD’s downstream expansion.
26 January 2016
China M odern Dair y H ol dings
Downstream expansion to offset upstream weakness
EPS forecasts lowered after profit warning in December 2015
But expect a long-term rerating as downstream contribution rises
Reiterate Buy (1); target price cut to HKD3.0
Source: Daiwa forecasts
Source: FactSet, Daiwa forecasts
China Modern Dairy Holdings (1117 HK)
Target price: HKD3.00 (from HKD3.30)
Share price (25 Jan): HKD1.45 | Up/downside: +106.8%
Anson Chan, CFA(852) 2532 4350
Forecast revisions (%)
Year to 31 Dec 15E 16E 17E
Revenue change (2.2) (12.6) (13.9)
Net profit change (19.5) (19.6) (19.6)
Core EPS (FD) change (19.5) (19.6) (19.6)
70
84
98
111
125
1.2
1.7
2.3
2.8
3.3
Jan-15 Apr-15 Jul-15 Oct-15
Share price performance
CMDH (LHS) Relative to HSI (RHS)
(HKD) (%)
12-month range 1.40-3.28
Market cap (USDbn) 0.98
3m avg daily turnover (USDm) 2.26
Shares outstanding (m) 5,298
Major shareholder Mengniu (28.0%)
Financial summary (CNY)
Year to 31 Dec 15E 16E 17E
Revenue (m) 4,980 5,402 5,821
Operating profit (m) 1,368 1,392 1,771
Net profit (m) 632 912 1,287
Core EPS (fully-diluted) 0.126 0.172 0.243
EPS change (%) (21.3) 37.0 41.1
Daiwa vs Cons. EPS (%) (18.4) (5.4) 19.7
PER (x) 9.7 7.1 5.0
Dividend yield (%) 0.8 0.8 0.8
DPS 0.010 0.010 0.010
PBR (x) 0.7 0.7 0.6
EV/EBITDA (x) 5.7 6.4 5.0
ROE (%) 8.3 10.0 12.7

42
China Modern Dairy Holdings (1117 HK): 26 January 2016
How do we justify our view?
Growth outlook Valuation Earnings revisions
Growth outlook Modern Dairy: net profit and cash earnings and YoY%
We forecast CMD’s net profit to decline by 19% YoY for
2015 due to a CNY400m loss from the revaluation of
biological assets (2014: CNY330m). On fewer revaluation
losses and an increasing revenue contribution from its
downstream operation, we look for reported net-profit
growth to recover to 44% YoY and 41% YoY for 2016E and
2017E, respectively.
Source: Company, Daiwa forecast
Valuation Modern Dairy: 12-month-forward PER
Modern Dairy stock is trading currently at a PER of 7.1x for
2016E, compared to its closet peer, China Huishan’s 34x
FY17E (fiscal year ending March 2017) (both on our EPS
forecasts). Yet, we believe Modern Dairy’s execution risk
for expansion is lower than Huishan’s. We believe the
recent sell-off of Modern Dairy shares has already priced
our flat raw-milk-price outlook and we believe Modern
Dairy deserves a rerating if its downstream business
successfully expands in revenue and maintains a high
gross margin (>22%).
Source: Bloomberg
Earnings revisions Modern Dairy: Bloomberg consensus EPS (2015-16E)
We see downside risk to the street’s 2015E EPS as some
analysts may have not factored in the profit warning
announced recently. The Bloomberg-consensus 2015-16E
EPS forecasts trended down in 2015 on increasing losses
from the revaluation of biological assets.
Source: Bloomberg
34%
-28%
108%
-19%
44% 41%
-40%
-20%
0%
20%
40%
60%
80%
100%
120%
0
200
400
600
800
1,000
1,200
1,400
2012 2013 2014 2015E 2016E 2017E
Reported net profit (LHS) Reported profit YoY (RHS, %)
((CNYm))
0
2
4
6
8
10
Mar
11
Jun
11
Sep
11
Dec
11
Mar
12
Jun
12
Sep
12
Dec
12
Mar
13
Jun
13
Sep
13
Dec
13
Mar
14
Jun
14
Sep
14
Dec
14
Mar
15
Jun
15
Sep
15
Dec
15
1117 HK 11x 15x
19x 23x 27x
(HKD)
0.10
0.15
0.20
0.25
0.30
0.35
Dec
14
Feb
15
Apr
15
Jun
15
Aug
15
Oct
15
Dec
15
2015E 2016E
(HKD)

43
China Modern Dairy Holdings (1117 HK): 26 January 2016
Financial summary
Key assumptions
Profit and loss (CNYm)
Cash flow (CNYm)
Source: FactSet, Daiwa forecasts
Year to 31 Dec 2010 2011 2012 2013 2014 2015E 2016E 2017E
Milk Yield (tonne/cow/year) 7.8 7.8 8.0 8.4 8.9 9.1 8.9 8.7
Sales volume of raw milk (tonnes) 201,958 366,656 496,979 679,722 931,334 930,284 1,007,953 1,052,848
Raw milk ASP (CNY/kg) 3.9 3.8 4.1 4.6 5.0 4.4 4.2 4.2
Number of cows 87,496 128,759 176,264 186,838 201,507 210,537 213,296 219,329
Year to 31 Dec 2010 2011 2012 2013 2014 2015E 2016E 2017E
Raw milk 782 1,384 1,971 2,968 4,194 3,327 3,319 3,325
Self-own brand 0 7 64 321 833 1,620 2,045 2,454
Other Revenue 0 0 0 0 0 33 38 42
Total Revenue 782 1,392 2,035 3,289 5,027 4,980 5,402 5,821
Other income 56 127 124 70 40 55 55 55
COGS (587) (1,065) (1,531) (2,412) (3,161) (3,268) (3,486) (3,460)
SG&A (53) (45) (94) (246) (541) (398) (580) (645)
Other op.expenses 0 0 0 0 0 0 0 0
Operating profit 198 409 533 701 1,365 1,368 1,392 1,771
Net-interest inc./(exp.) (47) (60) (101) (208) (266) (293) (302) (296)
Assoc/forex/extraord./others 62 50 105 (83) (329) (390) (100) (100)
Pre-tax profit 214 399 537 410 770 685 990 1,375
Tax (0) 0 (3) (11) (7) (25) (50) (60)
Min. int./pref. div./others (50) (10) (14) (26) (28) (28) (28) (28)
Net profit (reported) 163 389 520 373 735 632 912 1,287
Net profit (adjusted) 163 389 520 373 778 632 912 1,287
EPS (reported)(CNY) 0.040 0.080 0.107 0.077 0.151 0.126 0.172 0.243
EPS (adjusted)(CNY) 0.040 0.080 0.107 0.077 0.160 0.126 0.172 0.243
EPS (adjusted fully-diluted)(CNY) 0.040 0.080 0.107 0.077 0.160 0.126 0.172 0.243
DPS (CNY) 0.000 0.000 0.000 0.000 0.010 0.010 0.010 0.010
EBIT 198 409 533 701 1,365 1,368 1,392 1,771
EBITDA 202 428 573 997 2,096 2,014 1,756 2,153
Year to 31 Dec 2010 2011 2012 2013 2014 2015E 2016E 2017E
Profit before tax 214 399 537 410 770 685 990 1,375
Depreciation and amortisation 67 95 135 169 226 246 265 282
Tax paid (0) (0) (8) (11) (7) (25) (50) (60)
Change in working capital (3) 253 177 (441) (309) 148 196 280
Other operational CF items (8) (45) 131 291 594 683 402 396
Cash flow from operations 269 701 972 419 1,274 1,737 1,802 2,274
Capex (1,498) (2,258) (2,271) (1,960) (1,785) (1,341) (1,193) (1,346)
Net (acquisitions)/disposals 0 (14) 0 (78) 0 (1,583) 0 0
Other investing CF items 0 0 0 0 0 0 0 0
Cash flow from investing (1,498) (2,272) (2,271) (2,038) (1,785) (2,925) (1,193) (1,346)
Change in debt (212) 680 1,104 1,641 839 212 0 (400)
Net share issues/(repurchases) 2,876 0 0 0 0 1,583 0 0
Dividends paid 0 0 0 0 0 (48) (48) (48)
Other financing CF items (953) (137) (44) 201 42 (732) (432) (426)
Cash flow from financing 1,711 544 1,061 1,842 881 1,016 (480) (874)
Forex effect/others 0 0 0 0 0 0 0 0
Change in cash 482 (1,027) (238) 222 370 (172) 130 54
Free cash flow (1,229) (1,557) (1,299) (1,542) (511) 396 609 927

44
China Modern Dairy Holdings (1117 HK): 26 January 2016
Financial summary continued …
Balance sheet (CNYm)
Key ratios (%)
Source: FactSet, Daiwa forecasts
As at 31 Dec 2010 2011 2012 2013 2014 2015E 2016E 2017E
Cash & short-term investment 2,069 1,017 470 800 1,170 1,008 1,138 1,192
Inventory 319 338 440 691 641 606 639 642
Accounts receivable 132 211 283 545 827 909 1,000 1,100
Other current assets 1 2 2 2 2 2 2 2
Total current assets 2,521 1,568 1,195 2,037 2,639 2,525 2,779 2,936
Fixed assets 1,924 2,660 3,583 4,033 4,458 5,040 4,925 4,793
Goodwill & intangibles 310 310 310 310 310 310 310 310
Other non-current assets 2,256 3,378 5,070 6,114 6,804 8,912 9,967 11,176
Total assets 7,011 7,916 10,159 12,494 14,211 16,788 17,982 19,215
Short-term debt 559 510 1,666 2,989 2,958 2,800 2,800 2,400
Accounts payable 206 354 716 813 842 926 1,112 1,334
Other current liabilities 316 397 706 681 575 687 822 983
Total current liabilities 1,081 1,261 3,089 4,483 4,376 4,414 4,734 4,717
Long-term debt 1,176 1,693 1,641 1,960 2,829 3,200 3,200 3,200
Other non-current liabilities 188 73 100 190 350 341 341 341
Total liabilities 2,445 3,028 4,830 6,633 7,555 7,955 8,274 8,258
Share capital 415 413 415 415 415 415 415 415
Reserves/R.E./others 4,096 4,415 4,822 5,328 6,096 8,263 9,127 10,367
Shareholders' equity 4,511 4,828 5,237 5,743 6,510 8,678 9,542 10,781
Minority interests 56 61 92 118 146 156 166 176
Total equity & liabilities 7,011 7,916 10,159 12,494 14,211 16,788 17,982 19,215
EV 6,212 7,724 9,393 10,664 11,046 11,429 11,310 10,866
Net debt/(cash) (333) 1,186 2,837 4,149 4,618 4,992 4,862 4,408
BVPS (CNY) 0.940 1.006 1.091 1.191 1.351 1.638 1.801 2.035
Year to 31 Dec 2010 2011 2012 2013 2014 2015E 2016E 2017E
Sales (YoY) n.a. 78.0 46.2 61.7 52.8 (0.9) 8.5 7.8
EBITDA (YoY) n.a. 111.9 34.0 73.9 110.4 (3.9) (12.8) 22.6
Operating profit (YoY) n.a. 106.8 30.4 31.5 94.6 0.2 1.7 27.3
Net profit (YoY) n.a. 138.0 33.6 (28.2) 108.4 (18.7) 44.2 41.1
Core EPS (fully-diluted) (YoY) n.a. 102.9 33.6 (28.5) 108.4 (21.3) 37.0 41.1
Gross-profit margin 24.9 23.5 24.7 26.7 37.1 34.4 35.5 40.6
EBITDA margin 25.8 30.7 28.2 30.3 41.7 40.4 32.5 37.0
Operating-profit margin 25.3 29.4 26.2 21.3 27.2 27.5 25.8 30.4
Net profit margin 20.9 28.0 25.5 11.4 15.5 12.7 16.9 22.1
ROAE 7.2 8.3 10.3 6.8 12.7 8.3 10.0 12.7
ROAA 4.7 5.2 5.8 3.3 5.8 4.1 5.2 6.9
ROCE 6.3 6.1 6.8 7.2 11.7 10.0 9.1 11.0
ROIC 4.7 7.9 7.4 7.5 12.7 10.5 9.3 11.3
Net debt to equity n.a. 24.6 54.2 72.2 70.9 57.5 51.0 40.9
Effective tax rate 0.0 0.0 0.6 2.6 1.0 3.6 5.1 4.4
Accounts receivable (days) 30.8 44.9 44.3 45.9 49.8 63.6 64.5 65.9
Current ratio (x) 2.3 1.2 0.4 0.5 0.6 0.6 0.6 0.6
Net interest cover (x) 4.2 6.8 5.3 3.4 5.1 4.7 4.6 6.0
Net dividend payout 0.0 0.0 0.0 0.0 6.6 8.0 5.8 4.1
Free cash flow yield n.a. n.a. n.a. n.a. n.a. 6.1 9.4 14.3
Company profile
China Modern Dairy (CMD) is the largest dairy-farm operator in China and the first in the country to
operate large-scale dairy farms (herd size: 10,000 heads). More than 70% of its raw milk is sold to
Mengniu, while the remainder is sold to regional milk-powder producers, and as fresh milk under
CMD’s own brand. A group of individual shareholders (including management) and Mengniu own
31% and 28% of CMD, respectively.

45
China Modern Dairy Holdings (1117 HK): 26 January 2016
CMD: DCF sensitivity Key assumption for our DCF calculation
Equity Value
Discount NPV of Enterprise Equity Per Share
Rate FCF (CNY m) Value (CNY m) Value (CNY m) (HKD)
5.6% 26,923 29,990 25,372 5.70
6.6% 22,380 25,448 20,830 4.68
7.6% 19,079 22,147 17,529 3.94
8.6% 16,580 19,648 15,030 3.38
9.6% 14,681 17,749 13,131 3.00
10.6% 13,063 16,131 11,513 2.59
11.6% 11,784 14,852 10,234 2.30
12.6% 10,720 13,788 9,170 2.06
13.6% 9,823 12,891 8,273 1.86
Assumptions (%)
Equity Beta (X) Terminal growth rate 0
Equity risk premium Cost of debt 7.8
Risk free rate Debt-weighting 40
Cost of equity WACC* 9.6
Source: Daiwa estimates Source: Daiwa estimates
CMD: DCF valuation of upstream business
2015F 2016F 2017F 2018F 2019F 2020F 2021F 2022F 2023F 2024F 2025F 2026F 2027F 2028F 2029F 2030F >FY2031E
Milk volume (000 tons) 930 1,066 1,176 1,209 1,230 1,245 1,264 1,284 1,306 1,313 1,320 1,328 1,335 1,343 1,350 1,357
ASP (CNY/kg) 4.40 4.20 4.28 4.33 4.37 4.41 4.46 4.50 4.55 4.59 4.64 4.69 4.73 4.78 4.83 4.88
Sales of milk (CNY mil) 4,947 4,476 5,036 5,231 5,376 5,497 5,633 5,783 5,938 6,031 6,125 6,221 6,318 6,417 6,518 6,614
EBIT (CNY mil) 1,368 1,392 1,771 1,591 1,613 1,654 1,701 1,754 1,777 1,801 1,825 1,850 1,874 1,899 1,925 1,948
EBITDA (CNY mil) 1,614 1,656 2,053 1,890 1,931 1,988 2,053 2,123 2,165 2,206 2,248 2,289 2,332 2,374 2,417 2,458 Terminal Value
Interest and tax expenses -318 -318 -318 -318 -318 -318 -318 -318 -318 -318 -318 -318 -318 -318 -318 -318
Capex (CNY mil) -350 -350 -350 -350 -350 -350 -350 -350 -350 -350 -350 -350 -350 -350 -350 -350
Cashflow (CNY mil) 946 988 1,385 1,222 1,262 1,320 1,385 1,455 1,497 1,538 1,579 1,621 1,663 1,706 1,749 1,790 18,602
Discount factor 1.096 1.202 1.317 1.444 1.583 1.735 1.902 2.085 2.286 2.506 2.747 3.011 3.300 3.618 3.966 4.347 4.766
Discounted FCF 862.5 822.4 1051.4 846.4 797.5 760.8 728.2 697.9 654.8 613.9 575.1 538.5 504.0 471.5 441.0 411.6 3903.4
Total discounted FCF (from 2015F onward) 14,681
NAV/share (CNY) 1.90
Net cash as of 2014
-4,618
Total value 10,063 NAV/share (HK$) 2.30
Source: Daiwa estimates

See important disclosures, including any required research certifications, beginning on page 81
Hong Kong Consumer Staples
What's new: We are positive on WH Group starting operations of its new
American-style packaged-meat factory in Zhengzhou in December 2015,
producing American and Smithfield branded cold-chain products that carry
a higher ASP vs. its Chinese products. This product-mix upgrade should
bode well for the company. Reiterate Outperform (2) rating.
What's the impact: Commodity cost trends look favourable in China,
but mixed in the US: as we highlighted in the sector portion of this report,
we see limited upside to hog costs in 2016E due to lower corn (feed) costs
in China. But for the US, the upstream segment’s margins may remain
volatile due to commodity cost changes (grain and hog prices), and
Smithfield plans to diversify the risk by increasing its export business, in
particular to China (+40% YoY for 9M15).
Get the US operation for free: Shuanghui, WH Group’s major operating
subsidiary in China, is now trading at a 10x 2016E PER (Bloomberg
consensus), implying that WH Group’s 73% stake translates into HKD3.7
per WH Group share. This means Smithfield, WH Group’s US operation
expected to contribute c.50% of its 2015E operating profit, accounts for
only about USD873m in WH Group’s current market cap (vs. the USD4.5bn
WH Group paid for it in 2013).
Sluggish demand in 2H15 is likely temporary: For 2015-17E, we are
cutting revenue by 4-5%, as we lower our packaged-meat sales volume
assumption by 6-10% for both China and the US, due to the sluggish
demand we saw in 2H15E. But we now expect a slight increase in its
packaged-meat ASP (+5% YoY in China and 2% in the US in 2016E, vs.
flat previously) on the product mix improvement. Hence, we are revising up
our EPS for the company by 1-3% for the same period.
What we recommend: We cut our 12-month TP to HKD4.80 from
HKD5.50, now based on a 2016E PER of 11x (was 13.4x), to bring it in line
with its peers. Our target PER comprises 11.8x for the China operation
(kept at a 20% discount to peers’ average on its lower operating margin vs
other staple companies) and 10.2x PER for the US operation (in line with
its US peers’ average). The key risk: unexpected hedging losses for the US
operation.
How we differ: Our 2015-17E EPS are 6-21% below consensus as we
assume the absence of gains from the revaluation of its biological assets.
26 January 2016
WH Group
Benefits from having a US brand
Raising core 2016-17E EPS on higher ASP but lower sales volume
Smithfield operation trading at 3.1x 2016E PER at current share price
Reaffirm Outperform (2) rating; 33% YoY EPS growth for 2016E
Source: Daiwa forecasts
Source: FactSet, Daiwa forecasts
Valuation of WH Group’s business
USD m
Market cap of Shuanghui (000895.SS) (25 Jan 16) 9,206
WH's stake (%) 73.3
WH's stake worth 6,744
WH Group's market cap 8,284
Smithfield's valuation (USD m) 1,549
Implied 2016E PER for Smithfield (x) 3.1
Source: Bloomberg, Daiwa estimates
WH Group (288 HK)
Target price: HKD4.80 (from HKD5.50)
Share price (25 Jan): HKD4.40 | Up/downside: +9.0%
Anson Chan, CFA(852) 2532 4350
Forecast revisions (%)
Year to 31 Dec 15E 16E 17E
Revenue change (3.7) (4.7) (5.3)
Net profit change 1.8 2.6 1.2
Core EPS (FD) change 1.8 2.6 1.2
90
100
110
120
130
3.5
4.3
5.0
5.8
6.5
Jan-15 Apr-15 Jul-15 Oct-15
Share price performance
WH Group (LHS) Relative to HSI (RHS)
(HKD) (%)
12-month range 3.84-6.06
Market cap (USDbn) 8.25
3m avg daily turnover (USDm) 9.48
Shares outstanding (m) 14,620
Major shareholder Management (34.0%)
Financial summary (USD)
Year to 31 Dec 15E 16E 17E
Revenue (m) 22,017 23,362 24,623
Operating profit (m) 1,412 1,623 1,733
Net profit (m) 611 814 908
Core EPS (fully-diluted) 0.042 0.056 0.062
EPS change (%) (37.4) 33.4 11.6
Daiwa vs Cons. EPS (%) (21.3) (5.7) (7.3)
PER (x) 13.5 10.2 9.1
Dividend yield (%) 2.8 3.6 4.0
DPS 0.016 0.021 0.023
PBR (x) 1.5 1.3 1.2
EV/EBITDA (x) 6.6 5.7 5.0
ROE (%) 11.3 13.5 13.4

47
WH Group (288 HK): 26 January 2016
How do we justify our view?
Growth outlook Valuation Earnings revisions
Growth outlook WH Group: Net profit (USD m) and YoY (%)
We forecast WH Group’s net profit to decline by 28% YoY
in 2015E due to an absence of gains from the revaluation
of its agriculture produce at its US hog-raising operation
(2014: about USD 300m). We expect net profit growth to
resume in 2016-17E, on a recovery in the company’s sales
volume growth in both China and the US through its
improved packaged-meat product mix.
Source: Company, Daiwa forecasts
Valuation WH Group: 12-month forward PER bands since listing
The stock is now trading at 2016E PER of 10x, which looks
attractive to us compared with the other major China
staples companies (trading at an average 2016E PER of
18x on our forecasts). In our view, WH Group’s discount to
its peers has priced in the risks of: 1) volatile hedging gains
or losses in its agriculture product future contracts for its
US hog production business, and 2) potential share sales
by some financial investors after their lock-ups expire (6-12
months after the August 2014 IPO).
Source: Bloomberg
Earnings revisions WH Group: Bloomberg 2015 and 2016 consensus EPS (USD)
The Bloomberg consensus 2015-16E EPS forecasts for
WH Group have trended down since 2015 due to rising
pork prices. While our 2015-17 forecasts are below the
consensus, due to the likely absence of revaluation gains,
we would see an upside risk to our EPS numbers if pork
costs in China were to rise by less than we expect due to
lower feed costs.
Source: Bloomberg
38%
66%
-28%
33%
12%
-30%
-10%
10%
30%
50%
70%
90%
(300)
(100)
100
300
500
700
900
1,100
1,300
1,500
2011 2012 2013 2014 2015E 2016E 2017E
Reported net p rof it (LHS) Recurring net profit (LHS)
Reported net prof it YoY %
(USDm) (% )
3
4
5
6
7
8
9
Aug
-14
Sep
-14
Oct
-14
Nov
-14
Dec
-14
Jan-
15
Feb
-15
Ma
r-15
Apr
-15
Ma
y-15
Jun-
15
Jul-1
5
Aug
-15
Sep
-15
Oct
-15
Nov
-15
Dec
-15
Jan-
16
288.HK 7x 8.5x
10x 11.5x 13x
(HKD)
0.050
0.055
0.060
0.065
0.070
0.075
Jan
15
Ma
r 15
Ma
y 15
Jul 1
5
Sep
15
Nov
15
2015E 2016E
(USD)

48
WH Group (288 HK): 26 January 2016
Financial summary
Key assumptions
Profit and loss (USDm)
Cash flow (USDm)
Source: FactSet, Daiwa forecasts
Year to 31 Dec 2010 2011 2012 2013 2014 2015E 2016E 2017E
Packaged meat revenue YoY - China
(%) n.a. n.a. 16.3 12.0 (0.9) (8.5) 11.9 12.2
Packaged meat revenue YoY - U.S. (%) n.a. n.a. n.a. n.a. 14.3 (2.2) 4.0 3.0
Fresh meat revenue YoY - China (%) n.a. n.a. 15.5 24.4 5.4 8.5 12.4 10.2
Fresh meat revenue YoY - U.S. (%) n.a. n.a. n.a. n.a. 20.5 5.0 1.0 1.0
Operating margin - China (%) n.a. 5.8 9.8 10.6 11.8 10.9 10.8 10.8
Operating margin - U.S. (%) n.a. n.a. n.a. 2.4 6.0 5.9 5.5 5.5
Year to 31 Dec 2010 2011 2012 2013 2014 2015E 2016E 2017E
Hog production 0 14 13 191 252 435 478 461
Fresh pork 0 2,095 2,419 4,543 9,368 9,861 10,413 10,939
Other Revenue 0 3,346 3,811 6,519 12,623 11,721 12,471 13,223
Total Revenue 0 5,455 6,243 11,253 22,243 22,017 23,362 24,623
Other income n.a. 132 105 167 843 88 168 178
COGS n.a. (4,902) (5,272) (9,480) (18,979) (18,525) (19,719) (20,782)
SG&A n.a. (356) (454) (874) (2,269) (2,120) (2,140) (2,238)
Other op.expenses n.a. (15) (8) (787) (110) (48) (48) (48)
Operating profit 0 314 614 279 1,728 1,412 1,623 1,733
Net-interest inc./(exp.) 0 (57) (15) (120) (371) (216) (171) (139)
Assoc/forex/extraord./others n.a. 2 3 3 63 12 0 0
Pre-tax profit 0 259 602 162 1,420 1,208 1,452 1,593
Tax n.a. (71) (134) (229) (448) (406) (429) (456)
Min. int./pref. div./others n.a. (59) (143) (196) (206) (191) (210) (230)
Net profit (reported) 0 129 325 (263) 766 611 814 908
Net profit (adjusted) 0 129 367 508 844 611 814 908
EPS (reported)(USD) n.a. 0.011 0.029 (0.023) 0.060 0.042 0.056 0.062
EPS (adjusted)(USD) n.a. 0.011 0.033 0.045 0.067 0.042 0.056 0.062
EPS (adjusted fully-diluted)(USD) n.a. 0.011 0.033 0.045 0.067 0.042 0.056 0.062
DPS (USD) n.a. 0.000 0.000 0.000 0.000 0.016 0.021 0.023
EBIT 0 314 656 1,050 1,806 1,412 1,623 1,733
EBITDA 0 402 769 1,223 2,165 1,795 2,031 2,160
Year to 31 Dec 2010 2011 2012 2013 2014 2015E 2016E 2017E
Profit before tax 0 259 602 162 1,420 1,208 1,452 1,593
Depreciation and amortisation n.a. 88 113 173 359 383 408 428
Tax paid n.a. (101) (126) (250) (476) (406) (429) (456)
Change in working capital n.a. 5 57 (48) 327 (147) (253) (276)
Other operational CF items n.a. 55 20 53 (419) 204 111 79
Cash flow from operations 0 306 666 90 1,211 1,242 1,289 1,368
Capex n.a. (309) (151) (295) (699) (500) (500) (300)
Net (acquisitions)/disposals n.a. (40) (16) (4,678) (10) (10) (10) (10)
Other investing CF items n.a. 0 0 0 0 0 0 0
Cash flow from investing 0 (349) (167) (4,973) (709) (510) (510) (310)
Change in debt n.a. 864 (670) 7,238 (2,762) (1,000) (700) (500)
Net share issues/(repurchases) n.a. 0 0 0 2,284 0 0 0
Dividends paid n.a. (38) (105) (90) 0 (235) (300) (333)
Other financing CF items n.a. 59 312 (2,636) (127) (215) (196) (169)
Cash flow from financing 0 885 (463) 4,512 (605) (1,450) (1,196) (1,003)
Forex effect/others 0 0 0 0 0 0 0 0
Change in cash 0 842 36 (371) (103) (718) (417) 56
Free cash flow 0 (3) 515 (205) 512 742 789 1,068

49
WH Group (288 HK): 26 January 2016
Financial summary continued …
Balance sheet (USDm)
Key ratios (%)
Source: FactSet, Daiwa forecasts
As at 31 Dec 2010 2011 2012 2013 2014 2015E 2016E 2017E
Cash & short-term investment 0 1,032 796 1,083 1,209 965 764 1,053
Inventory n.a. 529 328 1,808 1,900 2,090 2,299 2,529
Accounts receivable n.a. 38 50 870 845 887 932 978
Other current assets n.a. 104 96 1,406 1,420 1,420 1,420 1,420
Total current assets 0 1,703 1,270 5,167 5,374 5,362 5,415 5,980
Fixed assets n.a. 1,387 1,411 4,132 4,582 4,699 4,791 4,663
Goodwill & intangibles n.a. 565 566 3,615 3,561 3,561 3,561 3,561
Other non-current assets n.a. 227 250 1,242 1,203 871 881 891
Total assets 0 3,882 3,497 14,156 14,720 14,493 14,648 15,095
Short-term debt n.a. 855 164 760 719 719 719 719
Accounts payable n.a. 300 225 851 850 935 935 935
Other current liabilities n.a. 464 399 1,211 1,553 1,553 1,553 1,553
Total current liabilities 0 1,619 788 2,822 3,122 3,207 3,207 3,207
Long-term debt n.a. 9 30 6,672 3,951 2,951 2,251 1,751
Other non-current liabilities n.a. 121 129 1,524 1,597 1,597 1,597 1,597
Total liabilities 0 1,749 947 11,018 8,670 7,755 7,055 6,555
Share capital 0 1 1 1 1 1 1 1
Reserves/R.E./others n.a. 1,547 1,788 2,269 5,129 5,676 6,376 7,154
Shareholders' equity 0 1,548 1,789 2,270 5,130 5,677 6,377 7,155
Minority interests n.a. 585 761 868 920 1,061 1,216 1,386
Total equity & liabilities 0 3,882 3,497 14,156 14,720 14,493 14,648 15,096
EV n.a. 8,644 8,386 14,941 12,102 11,829 11,485 10,866
Net debt/(cash) n.a. (168) (602) 6,349 3,461 2,705 2,206 1,417
BVPS (USD) n.a. 0.138 0.159 0.202 0.350 0.388 0.436 0.489
Year to 31 Dec 2010 2011 2012 2013 2014 2015E 2016E 2017E
Sales (YoY) n.a. n.a. 14.4 80.2 97.7 (1.0) 6.1 5.4
EBITDA (YoY) n.a. n.a. 91.3 59.0 77.0 (17.1) 13.2 6.4
Operating profit (YoY) n.a. n.a. 108.9 60.1 72.0 (21.8) 15.0 6.7
Net profit (YoY) n.a. n.a. 184.5 38.4 66.1 (27.6) 33.1 11.6
Core EPS (fully-diluted) (YoY) n.a. n.a. 184.5 38.4 47.6 (37.4) 33.4 11.6
Gross-profit margin n.a. 10.1 15.6 15.8 14.7 15.9 15.6 15.6
EBITDA margin n.a. 7.4 12.3 10.9 9.7 8.2 8.7 8.8
Operating-profit margin n.a. 5.8 10.5 9.3 8.1 6.4 6.9 7.0
Net profit margin n.a. 2.4 5.9 4.5 3.8 2.8 3.5 3.7
ROAE n.a. 16.7 22.0 25.0 22.8 11.3 13.5 13.4
ROAA n.a. 6.6 9.9 5.8 5.8 4.2 5.6 6.1
ROCE n.a. 21.0 22.9 15.8 17.0 13.4 15.5 16.1
ROIC n.a. 23.2 24.4 (2.0) 12.5 9.9 11.9 12.5
Net debt to equity n.a. n.a. n.a. 279.7 67.5 47.6 34.6 19.8
Effective tax rate n.a. 27.4 22.3 141.4 31.5 33.6 29.5 28.6
Accounts receivable (days) n.a. 1.3 2.6 14.9 14.1 14.4 14.2 14.2
Current ratio (x) n.a. 1.1 1.6 1.8 1.7 1.7 1.7 1.9
Net interest cover (x) n.a. 5.5 43.7 8.8 4.9 6.5 9.5 12.4
Net dividend payout n.a. 0.0 0.0 n.a. 0.0 38.4 36.9 36.7
Free cash flow yield 0.0 n.a. 6.2 n.a. 6.2 9.0 9.6 12.9
Company profile
WH Group is the largest pork-processing company in the world, and has the largest market share in
pork processing in China and the US, which together account for 60% of global pork consumption.
It is also a leader in key markets in Europe. The company raises and slaughters hogs, and
produces fresh pork and packaged-meat products. It also owns the largest cold-chain logistics
network in China. Its brands include Shuanghui, Smithfield, Farmland, Eckrich, and Armour.

See important disclosures, including any required research certifications, beginning on page 81
China Consumer Staples
What's new: Acquisition already priced in? According to a Hong Kong
Economic Journal report in December 2015, China Resources Beer (CRB)
(the former China Resources Enterprise) is seeking an investment bank to
act as a financial advisor to assist in the acquisition of the remaining 49%
stake in the CR-Snow JV, a venture between CRB and UK-based
SABMiller. Assuming SABMiller merges with Anheuser-Busch InBev, it is
likely SABMiller would sell its 49% holding in the CR-Snow JV (CRB has a
51% stake already) (also see What if AB-InBev merges with SABMiller, 17
September 2015). We would see this scenario playing out in mid-2016. We
keep our Hold (3) rating on CRB as we believe its valuation is fair.
What's the impact: Key assumptions for a stake acquisition. We are
revising up our 2016-17E EPS by 3-19% assuming: 1) the acquisition is
done at a c.22x 2016E PER (our target PER for CRB) and is fully funded by
bank financing at an interest rate of 4% per year, and 2) CRB maintains its
ASP and market-share gains over 2016-17E without the support of
SABMiller (we see this as a likely scenario, as CRB has accumulated a lot
of technology and production experience from SABMiller over the past 20
years, while its sales team has been run independently). Arguably the only
negative would be the subsequent increase in net gearing (which we
estimate would reach 239% by end-2016, vs. 65% if the acquisition does
not go ahead).
Another scenario: 1) If CRB does not go ahead with the stake acquisition,
we estimate its net profit would still grow by 16% YoY for 2016, driven by
market-share gains. We expect the beer market to continue to shrink in
2016 (-5.7% in volume in 11M15), but believe CRB will still report flat sales
volume. 2) After acquiring the stake from SABMiller, we would not rule out
the possibility of CRB seeking co-operation with another international brand
to expand its share of China’s high-end beer market.
What we recommend: We maintain our Hold (3) rating and lower our 12-
month TP to HKD12.4 (from HKD13.4). We now value CRB at a 23x 2016E
PER (previously 26x for 2016E). We continue to set our target PER at a
c.15% premium to the 20x average of its closest peers, due to CRB’s faster
EPS growth and potential for further earnings upside. Nevertheless, we are
cutting 2015-17E revenue and 2015E EPS due to the likelihood of a further
slowdown in industry volume. The key upside and downside risks to our
call: better or worse-than-expected product-mix upgrades.
How we differ: Our 2016-17E EPS are 18-29% above the Bloomberg
consensus as we factor in the earnings enhancement from an acquisition of
the CR-Snow JV minority stake and higher operating-margin assumptions.
26 January 2016
China R esources Beer
Best-case scenario looks priced in
Forecasts raised on prospect of CRB acquiring stake in CR-Snow JV
CRB continues to gain market share
Maintain Hold (3) as acquisition seems to have been priced in
Source: Daiwa forecasts
Source: FactSet, Daiwa forecasts
China Resources Beer (291 HK)
Target price: HKD12.40 (from HKD13.40)
Share price (25 Jan): HKD12.30 | Up/downside: +0.8%
Anson Chan, CFA(852) 2532 4350
Forecast revisions (%)
Year to 31 Dec 15E 16E 17E
Revenue change (4.7) (6.5) (6.2)
Net profit change (9.6) 2.5 18.9
Core EPS (FD) change (9.6) 2.5 18.9
70
93
115
138
160
12
16
19
23
26
Jan-15 Apr-15 Jul-15 Oct-15
Share price performance
China Reso (LHS) Relative to HSI (RHS)
(HKD) (%)
12-month range 12.30-25.80
Market cap (USDbn) 3.82
3m avg daily turnover (USDm) 10.03
Shares outstanding (m) 2,421
Major shareholder CRNC (51.9%)
Financial summary (HKD)
Year to 31 Dec 15E 16E 17E
Revenue (m) 34,823 36,141 37,770
Operating profit (m) 2,746 3,116 3,760
Net profit (m) 874 1,282 1,606
Core EPS (fully-diluted) 0.361 0.530 0.663
EPS change (%) n.a. 46.7 25.2
Daiwa vs Cons. EPS (%) (10.0) 17.9 29.0
PER (x) 34.1 23.2 18.5
Dividend yield (%) 100.0 0.4 0.9
DPS 12.300 0.054 0.116
PBR (x) 1.9 1.8 1.7
EV/EBITDA (x) 5.8 12.8 11.3
ROE (%) 2.7 8.1 9.6

51
China Resources Beer (291 HK): 26 January 2016
How do we justify our view?
Growth outlook Valuation Earnings revisions
Growth outlook CRB: net profit and net-profit growth
We now forecast CRB’s net profit to increase by 47% YoY
for 2016 and 25% YoY for 2017, assuming its acquisition of
the remaining stake in CR-Snow JV goes ahead. The
acquisition would almost double CRB’s profit-after tax (as
its stake in the JV would increase from 51% to 100%, and
the JV owns all CRB’s beer business in China). Even if the
acquisition does not proceed, we forecast CRB’s net profit
to increase by 16% YoY for 2016 and 15% YoY for 2017,
driven by product-mix upgrades that would drive up the
operating margin by 0.7pp and 1.4pp, respectively.
Source: Company, Daiwa forecasts
Valuation CRB: 12-month forward PER band
CRB’s valuation has been rerated since April 2015 after the
former China Resources Enterprise announced plans to
dispose of its non-beer businesses pay a special dividend
and rename the company China Resources Beer (all
completed in September 2015). Going forward, we believe
CRB should trade at a premium to its pre-restructuring
valuation due to its now higher earnings visibility through
focusing on the beer business only.
Our target valuation is now based on a 15% premium to
peers’ average, based on CRB’s expected operating-
margin expansion over 2016-17 and No.1 position in
China’s competitive beer market.
Source: Bloomberg
Earnings revisions CRB: Bloomberg consensus 2015-16E EPS
Our 2016-17E EPS are far above those of the Bloomberg
consensus as we have factored in the impact of the
prospective acquisition. We expect the consensus to revise
up its EPS forecast for the company if the acquisition takes
place. But we do believe the street’s EPS forecasts already
factor in a potential rise in ASPs over 2016-17 due to the
company’s ongoing product-mix upgrades.
Source: Bloomberg
-19%
15%
47%
25%
(30%)
(20%)
(10%)
0%
10%
20%
30%
40%
50%
60%
0
200
400
600
800
1,000
1,200
1,400
1,600
1,800
2013 2014 2015E 2016E 2017E
Net profit (LHS) YoY (RHS)
(HKDm)
0
10
20
30
40
50
Jan
11
Apr
11
Jul 1
1
Oct
11
Jan
12
Apr
12
Jul 1
2
Oct
12
Jan
13
Apr
13
Jul 1
3
Oct
13
Jan
14
Apr
14
Jul 1
4
Oct
14
Jan
15
Apr
15
Jul 1
5
Oct
15
Jan
16
291.HK 15x 20x
25x 30x 35x
(HKD)
0.15
0.20
0.25
0.30
0.35
0.40
0.45
0.50
0.55
May
15
May
15
Jun
15
Jun
15
Jul 1
5
Jul 1
5
Aug
15
Aug
15
Sep
15
Sep
15
Oct
15
Oct
15
Oct
15
Nov
15
Nov
15
Dec
15
Dec
15
Jan
16
2015E 2016E
(HKD)

52
China Resources Beer (291 HK): 26 January 2016
Financial summary
Key assumptions
Profit and loss (HKDm)
Cash flow (HKDm)
Source: FactSet, Daiwa forecasts
Year to 31 Dec 2010 2011 2012 2013 2014 2015E 2016E 2017E
Beer sales volume YoY (%) 10.9 10.3 3.9 10.2 1.0 (1.8) 0.0 0.0
Beer ASP (YoY %) 2.9 12.4 1.2 6.2 4.0 2.8 3.8 4.5
Beer EBITDA margin (%) 14.59 13.10 13.63 13.45 12.62 12.82 13.93 14.51
Sales volume contribution fromhigh-end
products20.8 25.0 28.4 36.0 40.3 43.5 47.9 53.2
Year to 31 Dec 2010 2011 2012 2013 2014 2015E 2016E 2017E
Retail 55,140 70,088 83,506 95,174 109,500 n.a. n.a. n.a.
Beer 21,535 26,689 28,064 32,835 34,482 34,823 36,141 37,770
Other Revenue 10,053 13,387 14,666 18,245 25,696 n.a. n.a. n.a.
Total Revenue 86,728 110,164 126,236 146,254 169,678 34,823 36,141 37,770
Other income 1,976 1,683 2,041 2,381 2,836 436 643 959
COGS (64,404) (82,807) (95,835) (108,881) (127,233) (22,763) (23,188) (24,016)
SG&A (19,919) (24,524) (27,894) (34,697) (43,483) (9,750) (10,481) (10,953)
Other op.expenses 0 0 0 0 0 0 0 0
Operating profit 4,381 4,516 4,548 5,057 1,798 2,746 3,116 3,760
Net-interest inc./(exp.) (175) (224) (361) (304) (526) (294) (335) (1,530)
Assoc/forex/extraord./others 806 1,134 2,466 293 569 (4,400) 0 0
Pre-tax profit 5,012 5,426 6,653 5,046 1,841 (1,948) 2,780 2,230
Tax (1,395) (1,375) (1,631) (1,894) (1,550) (736) (751) (624)
Min. int./pref. div./others (965) (1,038) (1,077) (1,244) (452) (843) (747) 0
Net profit (reported) 2,652 3,013 3,945 1,908 (161) (3,526) 1,282 1,606
Net profit (adjusted) 1,873 1,889 1,527 1,642 (794) 874 1,282 1,606
EPS (reported)(HKD) 1.106 1.256 1.644 0.794 (0.067) (1.456) 0.530 0.663
EPS (adjusted)(HKD) 0.781 0.787 0.636 0.683 (0.331) 0.361 0.530 0.663
EPS (adjusted fully-diluted)(HKD) 0.781 0.787 0.636 0.683 (0.331) 0.361 0.530 0.663
DPS (HKD) 0.520 0.470 0.300 0.270 0.270 12.300 0.054 0.116
EBIT 4,381 4,516 4,548 5,057 1,798 2,746 3,116 3,760
EBITDA 6,946 7,393 7,840 8,946 6,681 9,366 5,336 5,980
Year to 31 Dec 2010 2011 2012 2013 2014 2015E 2016E 2017E
Profit before tax 5,012 5,426 6,653 5,046 1,841 (1,948) 2,780 2,230
Depreciation and amortisation 2,565 2,877 3,292 3,889 4,883 2,220 2,220 2,220
Tax paid (991) (1,680) (1,683) (2,047) (1,636) (736) (751) (624)
Change in working capital 1,575 2,233 3,775 4,850 4,147 (600) (407) (432)
Other operational CF items (1,182) (829) (3,098) (958) (8,091) 294 335 1,530
Cash flow from operations 6,979 8,027 8,939 10,780 1,144 (770) 4,178 4,923
Capex (4,037) (7,097) (9,505) (7,204) (7,900) (2,438) (2,168) (2,077)
Net (acquisitions)/disposals 3,747 (1,541) 990 (4,308) 109 30,000 (29,000) 0
Other investing CF items 360 401 (2,386) 1,671 1,199 0 0 0
Cash flow from investing 70 (8,237) (10,901) (9,841) (6,592) 27,562 (31,168) (2,077)
Change in debt 86 3,049 1,363 4,685 6,194 n.a. n.a. n.a.
Net share issues/(repurchases) 26 11 21 18 0 0 0 0
Dividends paid (1,175) (1,271) (1,128) (673) (649) (29,520) (175) (256)
Other financing CF items (392) 2,909 (522) (39) (650) (3,556) (1,490) (1,854)
Cash flow from financing (1,455) 4,698 (266) 3,991 4,895 (33,076) (1,665) (2,110)
Forex effect/others (51) (303) (23) 265 0 0 0 0
Change in cash 5,543 4,185 (2,251) 5,195 (553) (6,283) (28,655) 736
Free cash flow 2,942 930 (566) 3,576 (6,756) (3,207) 2,010 2,846

53
China Resources Beer (291 HK): 26 January 2016
Financial summary continued …
Balance sheet (HKDm)
Key ratios (%)
Source: FactSet, Daiwa forecasts
As at 31 Dec 2010 2011 2012 2013 2014 2015E 2016E 2017E
Cash & short-term investment 14,305 18,514 16,396 21,536 20,834 4,104 2,449 3,184
Inventory 15,626 20,715 21,242 25,021 27,690 9,170 9,341 9,675
Accounts receivable 6,843 11,534 13,744 16,428 16,555 1,952 2,187 2,286
Other current assets 46 51 125 251 157 72 72 72
Total current assets 36,820 50,814 51,507 63,236 65,236 15,298 14,049 15,217
Fixed assets 41,443 50,240 56,971 69,117 88,060 26,739 26,687 26,544
Goodwill & intangibles 9,873 11,065 15,243 19,990 23,364 10,708 24,664 24,664
Other non-current assets 1,266 1,530 3,767 2,946 4,704 17,483 17,483 17,483
Total assets 89,402 113,649 127,488 155,289 181,364 70,228 82,883 83,908
Short-term debt 4,151 7,092 4,374 3,357 9,025 4,050 4,050 4,050
Accounts payable 32,476 45,487 53,104 69,178 76,260 24,311 24,311 24,311
Other current liabilities 871 618 706 1,155 1,069 190 190 190
Total current liabilities 37,498 53,197 58,184 73,690 86,354 28,551 28,551 28,551
Long-term debt 8,158 8,442 13,352 19,346 19,872 10,000 37,000 37,000
Other non-current liabilities 1,148 1,538 2,168 2,642 5,515 1,158 1,158 1,158
Total liabilities 46,804 63,177 73,704 95,678 111,741 39,709 66,709 66,709
Share capital 2,396 2,399 2,399 2,399 2,399 2,402 2,402 2,402
Reserves/R.E./others 29,727 35,440 38,343 41,674 46,348 13,073 13,772 14,798
Shareholders' equity 32,123 37,839 40,742 44,073 48,747 15,475 16,174 17,200
Minority interests 10,475 12,633 13,042 15,538 20,876 15,044 0 0
Total equity & liabilities 89,402 113,649 127,488 155,289 181,364 70,228 82,883 83,909
EV 37,886 39,004 43,766 46,100 57,340 54,773 68,384 67,649
Net debt/(cash) (1,996) (2,980) 1,330 1,167 8,063 9,946 38,601 37,866
BVPS (HKD) 13.366 15.770 16.969 18.348 20.294 6.391 6.680 7.103
Year to 31 Dec 2010 2011 2012 2013 2014 2015E 2016E 2017E
Sales (YoY) 35.2 27.0 14.6 15.9 16.0 (79.5) 3.8 4.5
EBITDA (YoY) 28.8 6.4 6.0 14.1 (25.3) 40.2 (43.0) 12.1
Operating profit (YoY) 49.6 3.1 0.7 11.2 (64.4) 52.7 13.5 20.7
Net profit (YoY) 47.2 0.9 (19.2) 7.5 n.a. n.a. 46.7 25.2
Core EPS (fully-diluted) (YoY) 46.8 0.8 (19.2) 7.4 n.a. n.a. 46.7 25.2
Gross-profit margin 25.7 24.8 24.1 25.6 25.0 34.6 35.8 36.4
EBITDA margin 8.0 6.7 6.2 6.1 3.9 26.9 14.8 15.8
Operating-profit margin 5.1 4.1 3.6 3.5 1.1 7.9 8.6 10.0
Net profit margin 2.2 1.7 1.2 1.1 (0.5) 2.5 3.5 4.3
ROAE 6.5 5.4 3.9 3.9 n.a. 2.7 8.1 9.6
ROAA 2.3 1.9 1.3 1.2 n.a. 0.7 1.7 1.9
ROCE 8.5 7.5 6.6 6.6 2.0 3.8 6.1 6.5
ROIC 8.1 7.7 6.7 5.5 0.4 4.6 4.8 4.9
Net debt to equity n.a. n.a. 3.3 2.6 16.5 64.3 238.7 220.2
Effective tax rate 27.8 25.3 24.5 37.5 84.2 n.a. 27.0 28.0
Accounts receivable (days) 25.4 30.4 36.5 37.6 35.5 97.0 20.9 21.6
Current ratio (x) 1.0 1.0 0.9 0.9 0.8 0.5 0.5 0.5
Net interest cover (x) 25.0 20.2 12.6 16.6 3.4 9.3 9.3 2.5
Net dividend payout 47.0 37.4 18.3 34.0 n.a. n.a. 10.2 17.5
Free cash flow yield 9.9 3.1 n.a. 12.0 n.a. n.a. 6.7 9.6
Company profile
China Resources Beer is a subsidiary of China Resources National Corporation (CRNC), a state-
owned enterprise. The company’s 51%-owned joint venture with SABMiller, CRE-Snow, is the
largest beer maker in China with a 23% market share by volume for 2014.

See important disclosures, including any required research certifications, beginning on page 81
Hong Kong Consumer Staples
What's new: As highlighted in our industry section: 1) foreign brands
continue to gain share in China’s personal hygiene product market, and 2)
revenue from the e-commerce channel has been growing quicker than that
from traditional channels. We believe Hengan will be a victim of such
trends. However, as the stock is already trading near its trough valuation
since 2008, we see limited downside to its share price at the current level.
Downgrade to Hold (3) from Outperform (2).
What's the impact: Personal care products. While we believe Hengan will
maintain its No.1 position in China’s sanitary napkin market (21-22% market
share, on our estimates), we see its growth prospects being increasingly
challenged as international brands deepen their market presence in lower-tier
cities. Hengan has become less competitive on price relative to Japan brands
given import tariff reductions and increased cross-border purchases. At the
same time, we believe its modest presence in online channels (c3% of total
revenue for 2014) will weigh on its revenue-growth prospects. As such, we cut
2015-17E revenue for diapers and sanitary napkins by 11-15% and now
assume no volume growth in these segments.
Tissue paper: In 1H15, Hengan reported a 2% YoY decline in revenue in
the tissue paper segment. Going forward, we expect increasing headwinds
and price competition. Hengan has little exposure to the e-commerce
channel, where tissue paper sales are expanding rapidly (20%-plus YoY in
2015E for Hengan’s closest domestic competitor, Vinda (3331 HK,
HKD13.00, Outperform [2]). Also, since most players are aggressively
cutting prices and going for market share, we think Hengan is unlikely to
raise product ASPs in 2015-17E. Our revised forecasts call for only 1% per
year growth in sales volume for Hengan in this segment over 2016-17E.
What we recommend: We cut 2015-17E EPS by 7-17% after factoring in:
1) lower revenue forecasts assuming Hengan fails to gain further market
share, and 2) higher financial costs associated with its HKD debt due to
CNY depreciation. In turn, we lower our TP to HKD66, from HKD87, based
on a target PER of 18x (previously 20x) applied to our revised 2016E EPS.
Our target PER marks a slight discount to international peers’ average
(20x) given Hengan’s slower EPS growth prospects for 2016E (5% vs. 13%
([Bloomberg consensus for peers]). We downgrade our rating to Hold (3),
from Outperform (2). The main upside risk to our call: product-mix
upgrades. The main downside risk: a further surge in raw-material costs.
How we differ: Our 2016-17E EPS estimates are 3-11% below the
Bloomberg consensus, likely as we are more bearish on Hengan’s revenue
outlook in the sanitary napkin segment.
26 January 2016
Heng an Inter national Gr oup
Revenue expectations set too high
Increasingly challenged in disposable diapers, sanitary napkin markets
Cutting 2015-17E EPS by 7-17% on lower sales, forex losses
Downgrading rating and TP; share-price downside looks limited
Source: Daiwa forecasts
Source: FactSet, Daiwa forecasts
Hengan International Group (1044 HK)
Target price: HKD66.00 (from HKD87.00)
Share price (25 Jan): HKD67.75 | Up/downside: -2.5%
Anson Chan, CFA(852) 2532 4350
Forecast revisions (%)
Year to 31 Dec 15E 16E 17E
Revenue change (2.1) (7.5) (11.1)
Net profit change (6.9) (12.8) (17.1)
Core EPS (FD) change (6.8) (12.4) (16.6)
90
96
103
109
115
65
75
85
95
105
Jan-15 Apr-15 Jul-15 Oct-15
Share price performance
Hengan (LHS) Relative to HSI (RHS)
(HKD) (%)
12-month range 65.05-100.10
Market cap (USDbn) 10.63
3m avg daily turnover (USDm) 23.79
Shares outstanding (m) 1,223
Major shareholder Sze Man Bok (18.6%)
Financial summary (HKD)
Year to 31 Dec 15E 16E 17E
Revenue (m) 24,304 24,118 24,386
Operating profit (m) 6,111 6,202 6,210
Net profit (m) 4,281 4,493 4,559
Core EPS (fully-diluted) 3.487 3.675 3.729
EPS change (%) 9.3 5.4 1.5
Daiwa vs Cons. EPS (%) 2.2 (2.5) (10.7)
PER (x) 19.4 18.4 18.2
Dividend yield (%) 3.0 3.2 3.3
DPS 2.042 2.148 2.214
PBR (x) 4.4 4.0 3.7
EV/EBITDA (x) 11.7 11.3 10.9
ROE (%) 23.5 22.8 21.3

55
Hengan International Group (1044 HK): 26 January 2016
How do we justify our view?
Growth outlook Valuation Earnings revisions
Growth outlook Hengan: net profit and net-profit growth
We forecast Hengan’s net profit growth to slow significantly
from 9% YoY in 2015E to 5% YoY in 2016E and 2% YoY in
2017E, on revenue growth of -1% and 1% YoY in 2016-
17E, with tissue paper likely to be the only segment to
record growth. Also, we assume forex losses of HKD150m
and HKD120m, respectively, as part of its financial costs, in
2015-16E due to the CNY’s depreciation against HKD.
Favourable petrochem costs should support a slight rise in
Hengan’s gross margin in 2016E, but the impact is likely to
be tempered by the increased revenue contribution of
tissue paper, on which the operating margin is relatively
low.
Source: Company, Daiwa forecasts
Valuation Hengan: 12-month forward PER band
The stock is trading currently at an 18x 2016E PER on our
EPS forecast, near the bottom of its PER band since 2008.
We see the risk of a further derating in the long term, since
we expect EPS growth to decelerate again in 2017E
However, that risk may not eventuate in 2016 following the
recent sell-off and as the potential disposal of non-core
businesses could boost investors’ confidence in
management. Hence, we see limited valuation downside in
2016E.
Source: Bloomberg
Earnings revisions Hengan: Bloomberg consensus EPS (2015-16E)
The Bloomberg-consensus 2015E and 2016E EPS
forecasts for Hengan have trended down slowly since
2015, and we see further downside to the market’s
forecasts on the back of lower-than-expected revenue
growth.
Our 2016E EPS is 3% below that of the consensus.
Source: Bloomberg
0%
5%
10%
15%
20%
25%
30%
35%
40%
(1,000)
0
1,000
2,000
3,000
4,000
5,000
2011 2012 2013 2014 2015E 2016E 2017E
Net profit (HKD m) Forex gain / loss YoY %
(HKDm)
15
35
55
75
95
Aug 08 Aug 09 Aug 10 Aug 11 Aug 12 Aug 13 Aug 14 Aug 15
1044 HK 18x 21x
24x 27x 30x
(HKD)
3.0
3.2
3.4
3.6
3.8
4.0
4.2
4.4
4.6
Jan-
15
Jan-
15
Feb
-15
Ma
r-15
Ma
r-15
Apr
-15
Ma
y-15
Ma
y-15
Jun-
15
Jul-1
5
Aug
-15
Aug
-15
Sep
-15
Oct
-15
Oct
-15
Nov
-15
Dec
-15
2015E 2016E
(HKD)

56
Hengan International Group (1044 HK): 26 January 2016
Financial summary
Key assumptions
Profit and loss (HKDm)
Cash flow (HKDm)
Source: FactSet, Daiwa forecasts
Year to 31 Dec 2010 2011 2012 2013 2014 2015E 2016E 2017E
Sanitary napkin volume YoY 10 64 16 12 18 0 0 0
Diapers volume YoY 13 10 (4) 3 (4) (3) (1) (1)
Tissue paper volume YoY 33 26 25 12 8 0 (1) 0
Sanitary napkin ASP YoY 0.0 1.5 3.1 7.1 6.6 3.0 0.0 0.0
Diapers ASP YoY 0.0 1.5 3.1 5.8 9.5 2.0 2.0 0.0
Tissue paper ASP change YoY 3.2 4.1 (8.7) (0.0) (1.9) 0.0 2.0 2.0
Year to 31 Dec 2010 2011 2012 2013 2014 2015E 2016E 2017E
Sanitary napkins 3,170 4,114 4,915 5,898 7,428 7,651 7,651 7,651
Diposable diapers 2,447 2,723 2,685 2,938 3,095 3,062 3,092 3,061
Other Revenue 7,815 10,213 10,923 12,350 13,308 13,592 13,375 13,675
Total Revenue 13,432 17,051 18,524 21,186 23,831 24,304 24,118 24,386
Other income 249 456 565 776 1,164 880 859 834
COGS (7,487) (10,250) (10,209) (11,627) (12,843) (12,443) (12,186) (12,363)
SG&A (3,194) (3,963) (4,139) (5,248) (6,402) (6,630) (6,589) (6,648)
Other op.expenses 0 0 0 0 0 0 0 0
Operating profit 3,000 3,294 4,741 5,088 5,750 6,111 6,202 6,210
Net-interest inc./(exp.) 39 (38) (202) (72) (407) (483) (277) (98)
Assoc/forex/extraord./others 0 0 0 185 (130) (150) (120) 0
Pre-tax profit 3,038 3,255 4,539 5,201 5,213 5,478 5,805 6,112
Tax (552) (570) (1,001) (1,245) (1,369) (1,407) (1,481) (1,528)
Min. int./pref. div./others (48) (37) (19) (50) (58) (60) (70) (75)
Net profit (reported) 2,438 2,649 3,519 3,906 3,785 4,011 4,253 4,509
Net profit (adjusted) 2,370 2,605 3,531 3,627 3,918 4,281 4,493 4,559
EPS (reported)(HKD) 2.000 2.156 2.861 3.174 3.082 3.267 3.479 3.688
EPS (adjusted)(HKD) 1.944 2.120 2.871 2.947 3.190 3.487 3.675 3.729
EPS (adjusted fully-diluted)(HKD) 1.944 2.120 2.871 2.947 3.190 3.487 3.675 3.729
DPS (HKD) 1.305 1.350 1.700 1.850 1.994 2.042 2.148 2.214
EBIT 3,000 3,294 4,741 5,088 5,750 6,111 6,202 6,210
EBITDA 3,384 3,727 5,291 5,791 6,505 6,969 7,153 7,254
Year to 31 Dec 2010 2011 2012 2013 2014 2015E 2016E 2017E
Profit before tax 3,038 3,255 4,539 5,201 5,213 5,478 5,805 6,112
Depreciation and amortisation 385 433 550 703 755 858 951 1,044
Tax paid (552) (570) (1,001) (1,245) (1,369) (1,407) (1,481) (1,528)
Change in working capital (1,099) 221 (1,046) (809) 488 48 107 19
Other operational CF items (39) 38 202 72 407 483 277 98
Cash flow from operations 1,733 3,378 3,244 3,922 5,494 5,460 5,659 5,745
Capex (1,117) (2,428) (2,469) (1,407) (1,696) (1,400) (1,400) (1,400)
Net (acquisitions)/disposals 0 0 0 13 257 0 0 0
Other investing CF items 0 0 0 0 0 0 0 0
Cash flow from investing (1,117) (2,428) (2,469) (1,395) (1,438) (1,400) (1,400) (1,400)
Change in debt 2,582 1,906 4,009 8,192 1,135 0 (5,000) (5,000)
Net share issues/(repurchases) 123 120 0 103 (546) (471) (52) 0
Dividends paid (1,466) (1,594) (1,844) (2,216) (4,368) (2,571) (2,548) (2,657)
Other financing CF items (72) (148) (240) (364) (640) (648) (452) (315)
Cash flow from financing 1,167 284 1,926 5,714 (4,418) (3,690) (8,052) (7,971)
Forex effect/others (68) (44) 12 (279) 132 270 240 50
Change in cash 1,716 1,190 2,713 7,962 (230) 640 (3,553) (3,576)
Free cash flow 617 950 775 2,515 3,798 4,060 4,259 4,345
57
Hengan International Group (1044 HK): 26 January 2016
Financial summary continued …
Balance sheet (HKDm)
Key ratios (%)
Source: FactSet, Daiwa forecasts
As at 31 Dec 2010 2011 2012 2013 2014 2015E 2016E 2017E
Cash & short-term investment 6,048 8,327 9,607 19,624 21,336 21,995 18,308 14,735
Inventory 2,760 2,934 3,831 4,386 3,695 3,580 3,506 3,557
Accounts receivable 1,396 1,893 1,870 2,184 2,455 2,504 2,485 2,512
Other current assets 546 590 883 1,127 1,220 1,281 1,345 1,412
Total current assets 10,750 13,744 16,191 27,321 28,706 29,360 25,643 22,216
Fixed assets 5,184 7,257 9,117 9,832 10,245 10,729 11,120 11,417
Goodwill & intangibles 607 601 591 581 357 357 357 357
Other non-current assets 2,036 1,717 3,306 2,456 3,269 3,369 3,469 3,569
Total assets 18,577 23,319 29,205 40,190 42,577 43,814 40,588 37,558
Short-term debt 3,815 6,815 7,441 13,233 15,164 15,164 10,164 5,164
Accounts payable 1,319 1,881 1,803 2,097 2,300 2,228 2,182 2,214
Other current liabilities 943 1,316 1,578 1,585 1,522 1,637 1,761 1,894
Total current liabilities 6,077 10,012 10,821 16,915 18,986 19,029 14,107 9,272
Long-term debt 1,497 404 3,787 6,187 5,390 5,390 5,390 5,390
Other non-current liabilities 178 185 188 170 138 138 138 138
Total liabilities 7,752 10,600 14,797 23,272 24,514 24,557 19,635 14,800
Share capital 122 123 123 123 122 118 117 117
Reserves/R.E./others 10,381 12,219 13,955 16,410 17,515 18,713 20,411 22,215
Shareholders' equity 10,503 12,341 14,078 16,534 17,638 18,831 20,528 22,332
Minority interests 322 377 330 385 425 425 425 425
Total equity & liabilities 18,577 23,319 29,205 40,190 42,578 43,814 40,589 37,558
EV 82,429 82,112 84,794 83,024 82,487 81,828 80,515 79,088
Net debt/(cash) (736) (1,108) 1,621 (204) (782) (1,441) (2,754) (4,180)
BVPS (HKD) 8.614 10.042 11.455 13.427 14.350 15.400 16.801 18.277
Year to 31 Dec 2010 2011 2012 2013 2014 2015E 2016E 2017E
Sales (YoY) 24.0 26.9 8.6 14.4 12.5 2.0 (0.8) 1.1
EBITDA (YoY) 15.0 10.1 42.0 9.4 12.3 7.1 2.6 1.4
Operating profit (YoY) 15.3 9.8 43.9 7.3 13.0 6.3 1.5 0.1
Net profit (YoY) 11.5 9.9 35.6 2.7 8.0 9.3 5.0 1.5
Core EPS (fully-diluted) (YoY) 5.2 9.1 35.4 2.7 8.2 9.3 5.4 1.5
Gross-profit margin 44.3 39.9 44.9 45.1 46.1 48.8 49.5 49.3
EBITDA margin 25.2 21.9 28.6 27.3 27.3 28.7 29.7 29.7
Operating-profit margin 22.3 19.3 25.6 24.0 24.1 25.1 25.7 25.5
Net profit margin 17.6 15.3 19.1 17.1 16.4 17.6 18.6 18.7
ROAE 24.3 22.8 26.7 23.7 22.9 23.5 22.8 21.3
ROAA 14.5 12.4 13.4 10.5 9.5 9.9 10.6 11.7
ROCE 21.3 18.3 20.8 16.4 15.3 15.6 16.3 17.8
ROIC 27.8 25.0 26.7 23.6 24.9 25.9 25.7 25.3
Net debt to equity n.a. n.a. 11.5 n.a. n.a. n.a. n.a. n.a.
Effective tax rate 18.2 17.5 22.1 23.9 26.3 25.7 25.5 25.0
Accounts receivable (days) 31.0 35.2 37.1 34.9 35.5 37.2 37.7 37.4
Current ratio (x) 1.8 1.4 1.5 1.6 1.5 1.5 1.8 2.4
Net interest cover (x) n.a. 85.8 23.5 70.3 14.1 12.6 22.4 63.7
Net dividend payout 65.3 62.6 59.4 58.3 64.7 62.5 61.7 60.0
Free cash flow yield 0.7 1.1 0.9 3.0 4.6 4.9 5.1 5.2
Company profile
Hengan International Group (Hengan) is the largest supplier of sanitary napkins and household
tissue paper in China in terms of sales, with market shares of around 10.9% and 11.4%,
respectively, in 2013 according to Euromonitor. Hengan also produces diapers (for babies and
adults) and snack products.

See important disclosures, including any required research certifications, beginning on page 81
China Consumer Staples
What's new: Given our concerns on Tingyi’s product mix changes since
October 2015 and the likely negative impact on both its market share and
long-term revenue outlook as a local Goliath, we downgrade the stock to
Hold (3) from Outperform (2). For 2016, we do not see much potential
downside for its share price, and would advise investors to sit on the stock
for now.
What's the impact: Risk of noodle market-share loss: In Oct 2015, Tingyi
adjusted its product mix (content upgrade + ASP hike) for noodles. Unlike other
price hikes over the past 5 years, none of its major competitors has followed
suit. Hence, Tingyi may lose market share among price sensitive consumers
and in the traditional channels. We expect its noodle business revenue to fall
by 11%/2% YoY in 2015/16E (previously: 10%/+3%), with a 1pp decline in the
gross margin over 2015-17E on growing raw-material costs and a lower-than-
expected utilisation rate (previously: 2pp gross-margin expansion).
New beverage products: Assuming a revenue decline in the bottled-water
business but increasing revenue contribution from functional drinks (ie,
vitamin drinks), we cut our revenue-growth forecast to 3% per year over
2016-17E (from 4%), after a 9% YoY decline in 2015E. We expect: 1)
negative impact from termination benefits due to layoffs at the Pepsi unit
lingering into 2016E as Tingyi will need to restructure this division further to
drive long-term revenue, and 2) sugar costs to rebound in 2016E,
impacting COGS. Accordingly, we expect Tingyi’s gross margin to be flat
over 2016-17E despite product-mix upgrades.
Cutting 2015-17E EPS by 4-16%, on: 1) a 1-5% cut in our revenue forecasts
on our concern of market-share loss in the noodles segment, 2) FX losses of
USD50m in 2016E (accounting for 13% of 2016E net profit) due to the CNY
depreciation vs. the USD, and 3) gross-margin erosion from rising palm oil
prices and a falling utilisation rate for the noodles segment.
What we recommend: We cut our 12-month TP to HKD9.60 from
HKD12.9 on our 2016 EPS revisions. We also lower our 2016E target PER
to 18x from 21x, as we now assign a slight discount to Tingyi’s target
valuation vs. the average of its international peers, on the back of its likely
lower earnings growth. Key upside risk: new product revenue contribution
exceeding our expectations; key downside risks: food safety issues.
How we differ: Our 2016-17E EPS are 11-12% below consensus as we
expect Tingyi’s revenue to miss market expectations due to market-share
loss in the noodles segment.
26 January 2016
Tingyi Cayman Isl ands
Too big to move; downgrading to Hold
Noodle sales volume under pressure in the near term due to price hike
Beverage segment to resume earnings growth on new products
Downgrading to Hold (3); cut TP to HKD9.6; 2015-17E EPS lowered
Source: Daiwa forecasts
Source: FactSet, Daiwa forecasts
Tingyi Cayman Islands (322 HK)
Target price: HKD9.60 (from HKD12.90)
Share price (25 Jan): HKD9.07 | Up/downside: +5.8%
Anson Chan, CFA(852) 2532 4350
Forecast revisions (%)
Year to 31 Dec 15E 16E 17E
Revenue change (1.4) (3.7) (5.3)
Net profit change (3.9) (12.4) (16.3)
Core EPS (FD) change (3.9) (12.4) (16.3)
60
73
85
98
110
8
11
14
17
20
Jan-15 Apr-15 Jul-15 Oct-15
Share price performance
Tingyi Hdg (LHS) Relative to HSI (RHS)
(HKD) (%)
12-month range 8.89-19.74
Market cap (USDbn) 6.52
3m avg daily turnover (USDm) 11.16
Shares outstanding (m) 5,600
Major shareholder Wei Ing-chou (33.8%)
Financial summary (USD)
Year to 31 Dec 15E 16E 17E
Revenue (m) 9,272 9,326 9,561
Operating profit (m) 750 807 851
Net profit (m) 373 386 422
Core EPS (fully-diluted) 0.067 0.069 0.075
EPS change (%) (6.8) 3.4 9.5
Daiwa vs Cons. EPS (%) (0.5) (11.7) (11.2)
PER (x) 17.5 16.9 15.4
Dividend yield (%) 2.9 3.0 3.2
DPS 0.033 0.034 0.038
PBR (x) 2.0 1.9 1.8
EV/EBITDA (x) 7.4 6.7 6.2
ROE (%) 12.0 11.7 12.0

59
Tingyi Cayman Islands (322 HK): 26 January 2016
How do we justify our view?
Growth outlook Valuation Earnings revisions
Growth outlook Tingyi: net profit (USDm) and YoY (%)
We expect Tingyi’s net profit only grow by 3% and 10%
YoY over 2016-17E, mainly driven by operating-margin
expansion in the beverage unit from cost savings (absence
of termination-benefit expenses and operating leverage in
the Pepsi unit). For the noodles business (about 70% of
net profit over 2015-17E), we expect a 13% YoY net-profit
decline in 2015E, then forecast it to remain flat over 2016-
17 on market-share losses. We believe the beverage
segment’s gross margin will be largely steady YoY in
2016E as product-mix upgrades could offset the increase
in sugar costs. We expect the ASP hike in the noodle
segment to offset the increased flour and palm oil costs as
well as the lower utilisation rate due to falling sales volume.
Source: Company, Daiwa forecasts
Valuation Tingyi: 12-month forward PER bands since 2008
The stock is currently trading at 17x 2016E PER. We see
the risk of a major derating of the stock in the long run as
we expect Tingyi’s EPS growth to be structurally lower
compared to the past. But this risk may have already been
factored in by the market after the recent sell-off. Thus, we
see limited downside to the share price from current levels,
as: 1) we expect EPS growth to recover to 6% CAGR over
2016-17E after declining in 2015E, and 2) the stock is
already trading near its trough valuation, seen in 2008.
Source: Bloomberg
Earnings revisions Tingyi: Bloomberg consensus EPS forecast (2015-16E)
Although the Bloomberg consensus EPS estimates for
2015-16 have continued to trend down over the past 12
months due the results for the past 3 quarters missing
consensus expectations, we still see downside risk to
consensus revenue estimates for 2016-17. We would
consider making further revenue cuts if new products in the
beverage segment failed to drive revenue growth.
Source: Bloomberg
-2.9%
6.7%
1.6%
-6.8%
3.4%
9.5%
(10%)
(5%)
0%
5%
10%
15%
(100)
0
100
200
300
400
500
2012 2013 2014 2015E 2016E 2017E
Noodles Beverage Others Recurring profit g rowth YoY %
(USDm)
5
10
15
20
25
Jan-
08
Ma
y-08
Aug
-08
Dec
-08
Apr
-09
Aug
-09
Dec
-09
Apr
-10
Aug
-10
Dec
-10
Apr
-11
Aug
-11
Dec
-11
Apr
-12
Aug
-12
Dec
-12
Apr
-13
Aug
-13
Dec
-13
Ma
r-14
Jul-1
4
Nov
-14
Ma
r-15
Jul-1
5
Nov
-15
322.HK 18 21
24 27 30
(HKD)
0.04
0.05
0.06
0.07
0.08
0.09
0.10
0.11
0.12
Jan-
15
Jan-
15
Feb
-15
Ma
r-15
Apr
-15
Apr
-15
Ma
y-15
Jun-
15
Jun-
15
Jul-1
5
Aug
-15
Aug
-15
Sep
-15
Oct
-15
Oct
-15
Nov
-15
Dec
-15
Dec
-15
2015E 2016E
(USD)

60
Tingyi Cayman Islands (322 HK): 26 January 2016
Financial summary
Key assumptions
Profit and loss (USDm)
Cash flow (USDm)
Source: FactSet, Daiwa forecasts
Year to 31 Dec 2010 2011 2012 2013 2014 2015E 2016E 2017E
Sales growth YoY - instant noodles 27.0 22.5 10.2 9.4 (4.5) (10.7) (2.2) 1.4
Sales growth YoY - beverages 38.9 13.2 23.3 27.1 (7.5) (8.7) 2.7 3.1
Gross margin % - instant noodles 28.8 27.2 30.0 29.2 28.3 29.9 29.3 28.9
Gross margin % - beverages 28.5 25.7 29.6 30.8 31.9 34.0 33.9 35.1
Sellling and distribution expense ratio
(%)16.8 16.8 20.3 21.1 20.9 20.1 20.2 20.6
Year to 31 Dec 2010 2011 2012 2013 2014 2015E 2016E 2017E
Instant noodles 2,932 3,592 3,960 4,332 4,138 3,697 3,614 3,666
Beverage 3,532 3,999 4,931 6,268 5,800 5,294 5,435 5,605
Other Revenue 218 266 321 341 300 281 276 289
Total Revenue 6,681 7,857 9,212 10,941 10,238 9,272 9,326 9,561
Other income 46 131 255 201 209 160 180 180
COGS (4,782) (5,770) (6,457) (7,631) (7,120) (6,257) (6,316) (6,424)
SG&A (1,247) (1,512) (2,164) (2,663) (2,438) (2,206) (2,213) (2,296)
Other op.expenses (92) (73) (75) (118) (156) (220) (170) (170)
Operating profit 606 633 771 730 733 750 807 851
Net-interest inc./(exp.) (7) (9) (33) (37) (47) (75) (92) (61)
Assoc/forex/extraord./others 147 39 94 30 7 11 11 11
Pre-tax profit 747 663 832 723 694 686 726 801
Tax (134) (163) (228) (229) (209) (213) (211) (224)
Min. int./pref. div./others (136) (80) (145) (86) (84) (100) (130) (154)
Net profit (reported) 477 420 460 409 400 373 386 422
Net profit (adjusted) 340 380 369 394 400 373 386 422
EPS (reported)(USD) 0.085 0.075 0.082 0.073 0.072 0.067 0.069 0.075
EPS (adjusted)(USD) 0.061 0.068 0.066 0.070 0.072 0.067 0.069 0.075
EPS (adjusted fully-diluted)(USD) 0.061 0.068 0.066 0.070 0.072 0.067 0.069 0.075
DPS (USD) 0.043 0.038 0.032 0.035 0.036 0.033 0.034 0.038
EBIT 606 633 771 730 733 750 807 851
EBITDA 810 911 1,092 1,118 1,186 1,213 1,313 1,385
Year to 31 Dec 2010 2011 2012 2013 2014 2015E 2016E 2017E
Profit before tax 747 663 832 723 694 686 726 801
Depreciation and amortisation 203 278 321 388 452 463 506 535
Tax paid (96) (130) (138) 386 (223) (232) (194) (191)
Change in working capital 215 464 (158) 273 284 (354) (185) 18
Other operational CF items (1,050) 4 25 18 38 63 81 50
Cash flow from operations 19 1,279 882 1,788 1,245 626 935 1,212
Capex (966) (1,349) (882) (896) (1,100) (600) (550) (550)
Net (acquisitions)/disposals 0 0 0 0 (380) 0 0 0
Other investing CF items 0 0 0 0 0 0 0 0
Cash flow from investing (966) (1,349) (882) (896) (1,480) (600) (550) (550)
Change in debt 299 616 234 192 952 (382) (447) 0
Net share issues/(repurchases) 0 0 0 0 0 0 0 0
Dividends paid (192) (239) (210) (180) (197) (200) (187) (193)
Other financing CF items 93 (38) (85) 57 47 (113) (142) (121)
Cash flow from financing 201 339 (61) 69 802 (696) (776) (314)
Forex effect/others 0 0 0 0 0 0 0 0
Change in cash (746) 269 (60) 961 568 (669) (391) 348
Free cash flow (947) (70) 1 892 145 26 385 662

61
Tingyi Cayman Islands (322 HK): 26 January 2016
Financial summary continued …
Balance sheet (USDm)
Key ratios (%)
Source: FactSet, Daiwa forecasts
As at 31 Dec 2010 2011 2012 2013 2014 2015E 2016E 2017E
Cash & short-term investment 893 600 838 1,250 1,183 765 608 979
Inventory 310 313 478 481 387 340 343 349
Accounts receivable 128 155 233 260 238 211 208 209
Other current assets 357 368 419 419 535 535 535 535
Total current assets 1,688 1,436 1,968 2,410 2,343 1,851 1,694 2,073
Fixed assets 2,923 4,030 5,002 5,485 5,860 6,382 6,406 6,403
Goodwill & intangibles 0 0 29 28 27 27 27 27
Other non-current assets 281 343 474 501 976 557 557 557
Total assets 4,891 5,809 7,473 8,424 9,206 8,817 8,685 9,061
Short-term debt 457 701 500 1,017 1,382 1,000 800 800
Accounts payable 1,084 974 1,043 1,252 896 787 795 809
Other current liabilities 687 753 1,252 1,357 1,358 1,209 1,219 1,238
Total current liabilities 2,228 2,428 2,795 3,625 3,636 2,996 2,814 2,846
Long-term debt 177 549 985 660 1,247 1,247 1,000 1,000
Other non-current liabilities 117 145 197 213 227 246 265 286
Total liabilities 2,522 3,123 3,976 4,498 5,110 4,489 4,079 4,133
Share capital 27 28 28 28 28 28 28 28
Reserves/R.E./others 1,794 2,072 2,523 2,852 3,006 3,179 3,378 3,607
Shareholders' equity 1,821 2,100 2,551 2,880 3,034 3,207 3,406 3,635
Minority interests 548 587 946 1,046 1,062 1,122 1,200 1,293
Total equity & liabilities 4,891 5,809 7,473 8,424 9,206 8,817 8,685 9,061
EV 6,811 7,759 8,031 7,886 8,924 9,020 8,809 8,530
Net debt/(cash) (259) 650 647 426 1,446 1,482 1,192 821
BVPS (USD) 0.326 0.376 0.457 0.515 0.542 0.573 0.608 0.649
Year to 31 Dec 2010 2011 2012 2013 2014 2015E 2016E 2017E
Sales (YoY) 31.5 17.6 17.2 18.8 (6.4) (9.4) 0.6 2.5
EBITDA (YoY) (2.8) 12.5 19.9 2.3 6.1 2.3 8.3 5.5
Operating profit (YoY) (3.5) 4.4 21.8 (5.3) 0.5 2.2 7.7 5.4
Net profit (YoY) (11.3) 11.9 (2.9) 6.7 1.6 (6.8) 3.4 9.5
Core EPS (fully-diluted) (YoY) (11.3) 11.9 (2.9) 6.6 1.5 (6.8) 3.4 9.5
Gross-profit margin 28.4 26.6 29.9 30.3 30.5 32.5 32.3 32.8
EBITDA margin 12.1 11.6 11.9 10.2 11.6 13.1 14.1 14.5
Operating-profit margin 9.1 8.1 8.4 6.7 7.2 8.1 8.7 8.9
Net profit margin 5.1 4.8 4.0 3.6 3.9 4.0 4.1 4.4
ROAE 20.7 19.4 15.9 14.5 13.5 12.0 11.7 12.0
ROAA 8.2 7.1 5.6 5.0 4.5 4.1 4.4 4.8
ROCE 23.1 18.2 17.3 13.8 11.9 11.3 12.4 13.0
ROIC 26.0 17.5 15.0 11.7 10.4 9.1 9.9 10.6
Net debt to equity n.a. 31.0 25.3 14.8 47.7 46.2 35.0 22.6
Effective tax rate 18.0 24.6 27.4 31.6 30.1 31.0 29.0 28.0
Accounts receivable (days) 6.6 6.6 7.7 8.2 8.9 8.9 8.2 8.0
Current ratio (x) 0.8 0.6 0.7 0.7 0.6 0.6 0.6 0.7
Net interest cover (x) 93.1 67.6 23.6 19.5 15.6 10.0 8.8 13.9
Net dividend payout 50.0 50.0 39.2 48.2 49.9 50.0 50.0 50.0
Free cash flow yield n.a. n.a. 0.0 13.7 2.2 0.4 5.9 10.1
Company profile
Tingyi Cayman Islands (Tingyi) is the world’s largest producer of largest instant noodles, and has a
leading 56% market share in China (in terms of revenue for 2014). The company’s beverage unit,
owned jointly with Pepsi and Asahi Group, has shares of 55%, 27% and 21% of the China markets
for ready-to-drink (RTD) tea, juice drinks and bottled water, respectively, by revenue, for 2014.

See important disclosures, including any required research certifications, beginning on page 81
China Consumer Staples
What's new: We recently visited the food retailers and learned that
Mengniu’s dominant position in the premium UHT milk market is now being
challenged by the small players that can differentiate themselves from
Mengniu in terms of the origins of the milk that they sell (100% in-house
made raw milk or sourced overseas). We maintain our Hold (3) as
competition remains fierce in the dairy downstream market.
What's the impact: Key concerns: 1) Internal product cannibalisation.
We are concerned that the rapidly growing demand for Mengniu’s yogurt
products (+74% YoY revenue growth for 1H15) will continue to take sales
volume away from its premium milk business, due to the substitution effect.
And, we now expect more new rivals in the UHT segments (imported
substitutes and UHT yogurt in particular). Accordingly, for 2015E, we
estimate that Mengniu’s share of the premium milk market was 50% (vs.
our estimate of 55% for 2014) and that the revenue growth of its Milk
Deluxe (premium UHT milk) is likely to have decelerated by 5-10% YoY for
2015E (vs. c.20% for 2014). 2) Infant formula: Mengniu recently injected
its Oushi Mengniu infant formula business into its subsidiary, Yashili. And
subject to shareholder approval, we expect it to acquire Danone’s infant
formula brand in China, Dumex, in 1H16E. But we are concerned that
Yashili’s weak online distribution will not improve after the acquisition, and
that the brand will continue to lose market share to foreign brands and face
increasing selling costs in 2016E.
Cutting 2015-17E EPS by 5-15%. 1) Due to the loss of market share in the
premium milk segment, we are cutting our 2015-17E revenue by 1-2%. We
still expect selling costs, as a percentage of revenue, to remain high, at 21-
21.5% over 2016-17E (previous forecast: 20%) due to the lower revenue
base and price promotions for new products, 2) on ASP pressure, we
expect Mengniu’s gross margin to decline by 1pp for 2016E, to 31.2%.
What we recommend: Given our lower EPS forecasts, we are cutting our
12-month TP to HKD11.70 from HKD14.50, based on a 2016E PER of
15.2x (previously 16x). We now assign a bigger discount (20%, from 15%)
to the stock’s 2011-13 average 12-month forward PER (19x; excluding the
impact of M&A, as we see an increasing risk of further market-share losses
in the premium milk market. Our Hold (3) rating stands. The key upside
risk: further reduction in selling costs; the key downside risk: rebound in the
milk cost.
How we differ: Unlike the market, we prefer the upstream dairy-farm
operators to the downstream players like Mengniu, due to the structural
shortage of quality and safe raw milk in China.
26 January 2016
China M eng niu D air y
Competition remains stiff
Cutting 2015-17E EPS by 5-15% on higher selling cost, slower revenue
Limited share price downside as trading near 2011-15 low PER
Hence, we maintain Hold (3) on valuation grounds
Source: Daiwa forecasts
Source: FactSet, Daiwa forecasts
China Mengniu Dairy (2319 HK)
Target price: HKD11.70 (from HKD14.50)
Share price (25 Jan): HKD11.08 | Up/downside: +5.5%
Anson Chan, CFA(852) 2532 4350
Forecast revisions (%)
Year to 31 Dec 15E 16E 17E
Revenue change (1.0) (1.2) (1.6)
Net profit change (4.5) (15.4) (15.2)
Core EPS (FD) change (4.5) (15.4) (15.2)
75
88
100
113
125
10
13
17
20
23
Jan-15 Apr-15 Jul-15 Oct-15
Share price performance
CMD (LHS) Relative to HSI (RHS)
(HKD) (%)
12-month range 10.80-22.60
Market cap (USDbn) 5.52
3m avg daily turnover (USDm) 22.14
Shares outstanding (m) 3,883
Major shareholder COFCO (16.3%)
Financial summary (CNY)
Year to 31 Dec 15E 16E 17E
Revenue (m) 49,103 50,942 52,203
Operating profit (m) 3,122 2,908 3,105
Net profit (m) 2,577 2,471 2,745
Core EPS (fully-diluted) 0.663 0.636 0.707
EPS change (%) 11.6 (4.1) 11.1
Daiwa vs Cons. EPS (%) 2.9 (9.9) (14.1)
PER (x) 14.1 14.7 13.2
Dividend yield (%) 1.4 1.3 1.4
DPS 0.128 0.121 0.135
PBR (x) 1.6 1.4 1.3
EV/EBITDA (x) 9.1 9.2 8.3
ROE (%) 11.5 10.1 10.4

63
China Mengniu Dairy (2319 HK): 26 January 2016
How do we justify our view?
Growth outlook Valuation Earnings revisions
Growth outlook Mengniu: net profit and YoY growth
Reflecting the structural slowdown in China’s dairy market
and the more intense competition, we expect Mengniu’s
revenue growth to recover only slightly, to 4% and 3% for
2016-17E, respectively, versus a decline of 2% for 2015E.
But this will likely come at the expense of rising selling
expenses and price promotions. Hence, we expect the
EBITDA margin to decline to 8.8% for 2016E, from 9.3%
for 2015E. We forecast EPS to decline by 4% YoY for
2016E, before rebounding to 11% YoY growth for 2017E on
a slight improvement in operating leverage.
Source: Company, Daiwa forecasts
Valuation Mengniu: past-5-year 12-month forward PER bands
The stock is trading currently at a 2016E PER of 15x. This
is in line with the average of its major China food and
beverage peers, on our forecasts. We believe the stock is
fairly valued given what we see as its lacklustre revenue
outlook. We would need to see successful M&A activity in
its infant formula business and a successful product-mix
upgrade in order for the stock to be rerated. However, as
the stock is already trading near the low-end of its past-5-
year 12-month forward PER (13x), we see limited potential
share-price downside.
Source: Bloomberg
Earnings revisions Mengniu: Bloomberg 2015-16E EPS forecasts
Our 2015 EPS forecast is in line with that of the Bloomberg
consensus but our 2016 and 2017 EPS forecasts are 10%
and 14% below, as we have built in the intensifying
competition and slower domestic dairy market revenue
growth. We would also see downside to our and the
street’s EPS forecasts if Mengniu’s infant formula business
were to turn loss-making in 2016-17E, after acquiring
Dumex.
Source:: Bloomberg
28%
-13%
16%
39%
15%
-4%
11%
-20%
-10%
0%
10%
20%
30%
40%
50%
0
500
1,000
1,500
2,000
2,500
3,000
2011 2012 2013 2014E 2015E 2016E 2017E
Net profit (LHS) YoY (RHS)
(CNYm)
5
10
15
20
25
Jan-11 Jul-11 Jan-12 Jul-12 Jan-13 Jul-13 Jan-14 Jul-14 Jan-15 Jul-15
Mengniu 13 17
21 25 29
(HKD)
0.50
0.60
0.70
0.80
0.90
1.00
1.10
Jan
15
Feb
15
Mar
15
Apr
15
May
15
Jun
15
Jul 1
5
Aug
15
Sep
15
Oct
15
Nov
15
Dec
15
Jan
16
2015E 2016E
(HKD)

64
China Mengniu Dairy (2319 HK): 26 January 2016
Financial summary
Key assumptions
Profit and loss (CNYm)
Cash flow (CNYm)
Source: FactSet, Daiwa forecasts
Year to 31 Dec 2010 2011 2012 2013 2014 2015E 2016E 2017E
Sales growth YoY % - Liquid Milk n.a. 25 (4) 17 14 (1) 3 3
Sales growth YoY %- Infant formula n.a. n.a. n.a. 6 82 (11) 11 2
ASP hike % n.a. 3.2 2.0 4.5 9.5 (2.0) (1.8) (1.2)
SG&A cost ratio % n.a. 20.9 20.5 22.5 25.0 25.6 25.1 25.1
Year to 31 Dec 2010 2011 2012 2013 2014 2015E 2016E 2017E
Liquid Milk 26,872 33,701 32,336 37,903 43,036 42,800 44,250 45,369
Ice-cream 3,112 3,259 3,171 3,023 2,716 2,444 2,444 2,493
Other Revenue 282 428 572 2,431 4,297 3,859 4,248 4,341
Total Revenue 30,265 37,388 36,079 43,357 50,049 49,103 50,942 52,203
Other income 193 296 249 289 449 347 217 217
COGS (22,479) (27,796) (27,050) (31,660) (34,616) (33,303) (35,034) (35,782)
SG&A (6,465) (7,805) (7,398) (9,774) (12,505) (12,570) (12,787) (13,103)
Other op.expenses n.a. n.a. n.a. n.a. n.a. n.a. n.a. n.a.
Operating profit 1,455 1,896 1,687 1,852 2,665 3,122 2,908 3,105
Net-interest inc./(exp.) 43 112 179 199 208 75 121 132
Assoc/forex/extraord./others 40 52 (53) 154 160 162 247 385
Pre-tax profit 1,538 2,061 1,813 2,205 3,032 3,359 3,276 3,622
Tax (182) (276) (245) (367) (459) (605) (590) (652)
Min. int./pref. div./others (119) (195) (186) (231) (340) (178) (216) (225)
Net profit (reported) 1,237 1,589 1,382 1,607 2,233 2,577 2,471 2,745
Net profit (adjusted) 1,237 1,589 1,382 1,607 2,233 2,577 2,471 2,745
EPS (reported)(CNY) 0.356 0.454 0.395 0.450 0.595 0.663 0.636 0.707
EPS (adjusted)(CNY) 0.356 0.454 0.395 0.450 0.595 0.663 0.636 0.707
EPS (adjusted fully-diluted)(CNY) 0.356 0.454 0.395 0.450 0.595 0.663 0.636 0.707
DPS (CNY) 0.080 0.099 0.080 0.101 0.141 0.128 0.121 0.135
EBIT 1,455 1,896 1,687 1,852 2,547 3,122 2,908 3,105
EBITDA 2,168 2,760 2,728 3,069 3,956 4,552 4,463 4,784
Year to 31 Dec 2010 2011 2012 2013 2014 2015E 2016E 2017E
Profit before tax 1,538 2,061 1,813 2,205 3,032 3,359 3,276 3,622
Depreciation and amortisation 713 864 1,041 1,218 1,291 1,430 1,555 1,680
Tax paid (49) (218) (285) (307) (351) (605) (590) (652)
Change in working capital 193 300 (133) (1,106) (910) (551) (225) (35)
Other operational CF items (83) (164) (126) (353) (485) (237) (368) (517)
Cash flow from operations 2,312 2,842 2,310 1,656 2,578 3,396 3,648 4,098
Capex (1,426) (2,696) (2,267) (3,101) (2,906) (2,500) (2,500) (2,500)
Net (acquisitions)/disposals 0 0 0 (9,495) (372) (2,506) 0 0
Other investing CF items 0 0 0 0 0 0 0 0
Cash flow from investing (1,426) (2,696) (2,267) (12,597) (3,278) (5,006) (2,500) (2,500)
Change in debt 60 (184) (58) 11,191 (1,847) (1,986) (497) (487)
Net share issues/(repurchases) 0 0 0 0 4,089 0 0 0
Dividends paid (245) (278) (350) (283) (367) (548) (497) (471)
Other financing CF items (282) 317 (127) 1,466 (4,198) 995 (230) (225)
Cash flow from financing (467) (145) (535) 12,374 (2,323) (1,539) (1,224) (1,183)
Forex effect/others 0 0 0 0 0 0 0 0
Change in cash 419 1 (492) 1,434 (3,023) (3,149) (76) 415
Free cash flow 886 146 43 (1,445) (329) 896 1,148 1,598

65
China Mengniu Dairy (2319 HK): 26 January 2016
Financial summary continued …
Balance sheet (CNYm)
Key ratios (%)
Source: FactSet, Daiwa forecasts
As at 31 Dec 2010 2011 2012 2013 2014 2015E 2016E 2017E
Cash & short-term investment 6,800 6,801 6,230 7,663 4,902 1,753 1,677 2,092
Inventory 1,176 1,685 1,420 2,577 4,342 4,178 4,395 4,489
Accounts receivable 575 836 801 754 1,148 1,915 2,185 2,240
Other current assets 1,112 1,064 1,310 5,327 9,940 9,940 9,940 9,940
Total current assets 9,664 10,387 9,761 16,321 20,333 17,786 18,197 18,760
Fixed assets 5,915 7,694 8,489 10,522 11,697 12,810 13,798 14,661
Goodwill & intangibles 1,158 1,292 1,516 8,356 8,508 9,708 9,708 9,708
Other non-current assets 568 829 1,225 5,140 6,542 6,684 6,911 7,276
Total assets 17,306 20,202 20,991 40,339 47,081 46,989 48,615 50,406
Short-term debt 691 657 599 8,554 4,479 3,000 3,000 3,000
Accounts payable 3,548 3,685 3,679 4,761 4,992 5,043 5,305 5,418
Other current liabilities 1,999 2,885 2,703 4,748 4,880 4,880 4,880 4,880
Total current liabilities 6,238 7,226 6,981 18,063 14,351 12,923 13,185 13,298
Long-term debt 150 0 0 3,236 5,464 4,957 4,460 3,972
Other non-current liabilities 700 927 938 1,029 2,773 2,773 2,773 2,773
Total liabilities 7,088 8,153 7,919 22,328 22,588 20,653 20,418 20,043
Share capital 357 362 362 724 392 392 392 392
Reserves/R.E./others 9,401 11,109 12,081 14,637 21,097 23,031 24,888 27,044
Shareholders' equity 9,758 11,471 12,443 15,361 21,489 23,424 25,280 27,436
Minority interests 459 578 629 2,650 3,003 2,912 2,918 2,926
Total equity & liabilities 17,306 20,202 20,991 40,339 47,081 46,989 48,615 50,406
EV 30,735 30,629 31,269 40,283 40,553 41,483 40,840 39,581
Net debt/(cash) (5,959) (6,145) (5,631) 4,126 5,041 6,204 5,783 4,880
BVPS (CNY) 2.809 3.245 3.520 4.219 5.534 6.032 6.510 7.065
Year to 31 Dec 2010 2011 2012 2013 2014 2015E 2016E 2017E
Sales (YoY) 17.7 23.5 (3.5) 20.2 15.4 (1.9) 3.7 2.5
EBITDA (YoY) 9.6 27.3 (1.1) 12.5 28.9 15.1 (2.0) 7.2
Operating profit (YoY) 131.8 30.3 (11.0) 9.8 37.5 22.6 (6.9) 6.8
Net profit (YoY) 180.9 28.4 (13.0) 16.3 39.0 15.4 (4.1) 11.1
Core EPS (fully-diluted) (YoY) 164.7 27.5 (13.0) 13.9 32.3 11.6 (4.1) 11.1
Gross-profit margin 25.7 25.7 25.0 27.0 30.8 32.2 31.2 31.5
EBITDA margin 7.2 7.4 7.6 7.1 7.9 9.3 8.8 9.2
Operating-profit margin 4.8 5.1 4.7 4.3 5.1 6.4 5.7 5.9
Net profit margin 4.1 4.3 3.8 3.7 4.5 5.2 4.9 5.3
ROAE 13.5 15.0 11.6 11.6 12.1 11.5 10.1 10.4
ROAA 7.9 8.5 6.7 5.2 5.1 5.5 5.2 5.5
ROCE 14.0 16.0 12.8 8.5 7.9 9.1 8.3 8.5
ROIC 33.9 32.3 21.9 10.4 8.8 8.2 7.2 7.4
Net debt to equity n.a. n.a. n.a. 26.9 23.5 26.5 22.9 17.8
Effective tax rate 11.8 13.4 13.5 16.6 15.1 18.0 18.0 18.0
Accounts receivable (days) 7.0 6.9 8.3 6.5 6.9 11.4 14.7 15.5
Current ratio (x) 1.5 1.4 1.4 0.9 1.4 1.4 1.4 1.4
Net interest cover (x) n.a. n.a. n.a. n.a. n.a. n.a. n.a. n.a.
Net dividend payout 22.5 21.8 20.3 22.4 23.8 19.3 19.0 19.1
Free cash flow yield 2.4 0.4 0.1 n.a. n.a. 2.5 3.2 4.4
Company profile
Established in Inner Mongolia in 1999, China Mengniu Dairy (Mengniu) is controlled by COFCO
group, a state-owned food conglomerate. Mengniu focuses on the production of UHT milk, milk
beverages and ice cream. It is China’s largest maker of liquid milk products by revenue, with about
a 28% market share in 2013, according to AC Nielsen.

See important disclosures, including any required research certifications, beginning on page 81
Hong Kong Materials
What's new: On the back of the decline in input costs in 2H15, the price of
Fufeng’s MSG fell by 8% HoH for 2H15 and we expect a further fall of 10%
for 2016E. Weak oil prices are also likely to weigh on Fufeng’s ASPs.
What's the impact: Pricing pressure intensifying: 1) for September-
October 2015, Fufeng’s MSG price fell by c.10%. We believe the big
players like Fufeng have cut their ASPs due to the lower corn cost, with the
aim of pushing competitors out of the market. We are cutting cut our MSG
ASP assumptions by 2% for 2015E and 8% for 2016-17E. We now forecast
the unit gross profit of its MSG to stay at c.CNY800/tonne (last trough was
in 2013), as we think Fufeng has a scale advantage (previous forecast: a
rise of c.CNY 220/tonne for 2016E). We expect the MSG price to fall in line
with corn costs in 2016E, driven by policy changes (see the sector portion
of this report), 2) the price of the company’s xanthan gum (XG) fell by 30%
YoY for 2H15, on weakening demand from oil drilling (XG is used as a mud
additive). Accordingly, we estimate Fufeng’s XG price would be
CNY13,000/tonne for 2016E, down 14% YoY. But potential XG price
downside looks limited as: 1) demand from the food-processing segment
(accounting for c.40 -45% of total revenue) is steady, and 2) we believe the
current price is close to the cash cost level of its domestic peers.
Earnings CAGR of 8% for 2015-17E (previously: 22%): We cut our
2015-17E core EPS for Fufeng by 5-25%, due to the falling prices for XG
and MSG. But we raise our MSG sales volume forecasts by an average of
13% for 2016-17E, as Fufeng plans to enhance its production lines in Inner
Mongolia and northeast China, with new technology improving the yield
and leading to cost reductions. We also expect financial cost savings of
CNY118m for 2016E on lower debt and because it replaced some bank
loans with domestic bonds issued in November 2015.
What we recommend: Given our revised EPS forecasts, we are cutting
our 12-month TP to HKD2.55 (from HKD5.0). We also cut our target PER to
9x, from 12x, on the falling ASP trend, and believe the shares should trade
at their past-5-year average PER of 9x (vs. high end of the range when we
thought the product price upcycle was ongoing). However, we still forecast
Fufeng’s recurring EPS to grow by 8% YoY for each of 2016-17E, on sales
volume growth and lower financial costs, and the shares are trading at 0.7x
2016E PBR, which we see as attractive. We downgrade our rating to Hold
(3), from Buy (1). The main upside/downside risks: rising/falling ASPs for its
key products, in particular MSG.
How we differ: Our 2015-17E EPS are 22-39% below the Bloomberg
consensus on our lower ASP assumptions.
26 January 2016
Fufeng Group
Price headwinds strengthening
Weak oil and commodity prices putting pressure on ASP
Hence, we cut our 2015-17E EPS; but limited share price downside
Downgrading to Hold (3); cutting EPS by 5-25%, TP to HKD2.55
Source: Daiwa forecasts
Source: FactSet, Daiwa forecasts
Fufeng Group (546 HK)
Target price: HKD2.55 (from HKD5.00)
Share price (25 Jan): HKD2.61 | Up/downside: -2.2%
Anson Chan, CFA(852) 2532 4350
Forecast revisions (%)
Year to 31 Dec 15E 16E 17E
Revenue change (1.5) (5.4) (5.4)
Net profit change (12.7) (32.0) (31.5)
Core EPS (FD) change (5.0) (25.1) (24.3)
80
99
118
136
155
2.5
3.6
4.8
5.9
7.0
Jan-15 Apr-15 Jul-15 Oct-15
Share price performance
Fufeng Gp (LHS) Relative to HSI (RHS)
(HKD) (%)
12-month range 2.53-6.71
Market cap (USDbn) 0.70
3m avg daily turnover (USDm) 1.57
Shares outstanding (m) 2,113
Major shareholder Li Xue Chun (46.2%)
Financial summary (CNY)
Year to 31 Dec 15E 16E 17E
Revenue (m) 11,761 12,869 12,992
Operating profit (m) 892 818 889
Net profit (m) 510 550 596
Core EPS (fully-diluted) 0.241 0.260 0.282
EPS change (%) (19.5) 7.9 8.4
Daiwa vs Cons. EPS (%) (22.2) (36.5) (38.7)
PER (x) 9.1 8.5 7.8
Dividend yield (%) 3.8 3.3 3.5
DPS 0.084 0.072 0.078
PBR (x) 0.8 0.7 0.7
EV/EBITDA (x) 4.7 4.4 3.7
ROE (%) 9.0 9.0 9.2

67
Fufeng Group (546 HK): 26 January 2016
How do we justify our view?
Growth outlook Valuation Earnings revisions
Growth outlook Fufeng: net profit and recurring profit (CNYm) and YoY %
We forecast a core EPS CAGR of 8% over 2015-17E on
the back of lower financial costs as well as growth in MSG
sales. In our model, we have factored in a 10% decline in
the price of MSG and a 13% decline in the price of its XG
in 2016E. MSG and its by-products should together
account for more than 80% of Fufeng’s operating profit in
2016-17E, and our sensitivity analysis shows that a
CNY100 increase in the price of the company’s MSG
would lead to a 14% increase in its net profit.
Source: Company, Daiwa forecasts
Valuation Fufeng: 12-month forward PER bands
In 2015, the stock was derated from a 12x 12-month
forward PER to 9x amid falling product ASPs. It is
currently trading at 9x 2016E PER, on our estimates,
which is close to the middle of its past-5-year 12-month
forward PER range of 6-12x. We believe this reflects the
product pricing pressure that we anticipate for 2016E, as
well as the more favourable corn cost outlook. Hence, we
recommend waiting for product ASPs to recover (ie, after
2017E) before revisiting the stock.
Source: Bloomberg
Earnings revisions Fufeng: Bloomberg consensus EPS (HKD)
The 2015-16 Bloomberg consensus EPS forecasts for
Fufeng have trended down since the company missed the
consensus expectations for 1H15. We see further
downside to the 2016-17E consensus EPS forecasts, as
we are cautious on the company’s MSG and XG prices.
Source: Bloomberg
(50%)
(40%)
(30%)
(20%)
(10%)
0%
10%
20%
30%
0
100
200
300
400
500
600
700
2011 2012 2013 2014 2015E 2016E 2017E
Reported net profit (CNY m) Recurring profit (CNY m)
Recurring profit YoY%
0
2
4
6
8
10
Nov
-07
Apr
-08
Sep
-08
Feb
-09
Jul-0
9
Dec
-09
May
-10
Oct
-10
Mar
-11
Aug
-11
Jan-
12
Jun-
12
Nov
-12
Apr
-13
Sep
-13
Feb
-14
Jul-1
4
Dec
-14
May
-15
Oct
-15
564.HK 6x 7.5x
9x 10.5x 12x
(HKD)
0.30
0.35
0.40
0.45
0.50
0.55
0.60
0.65
0.70
0.75
Jan-
15
Jan-
15
Feb
-15
Mar
-15
Mar
-15
Apr
-15
May
-15
May
-15
Jun-
15
Jul-1
5
Jul-1
5
Aug
-15
Sep
-15
Oct
-15
Oct
-15
Nov
-15
Dec
-15
Dec
-15
2015E 2016E
(HKD)

68
Fufeng Group (546 HK): 26 January 2016
Financial summary
Key assumptions
Profit and loss (CNYm)
Cash flow (CNYm)
Source: FactSet, Daiwa forecasts
Year to 31 Dec 2010 2011 2012 2013 2014 2015E 2016E 2017E
MSG price (CNY/tonne) 7,903 7,984 7,134 6,307 6,495 6,650 6,000 6,000
Xanthan gum price (CNY/tonne) 19,579 18,222 20,392 25,254 20,607 15,000 13,000 13,000
Corn price (CNY/tonne) 1,741 1,978 2,015 1,798 1,875 1,819 1,637 1,605
Sales volume - MSG (000 tonnes) 493 616 945 1,003 926 927 1,077 1,077
Sales volume - Xanthan gum (000
tonnes)35 46 52 58 65 58 55 55
GPM - MSG segment (%) 22.7 16.1 11.4 12.6 14.6 14.6 13.8 14.6
GPM - Xanthan gum (%) 38.8 36.2 46.0 58.3 52.7 36.1 30.8 31.6
Year to 31 Dec 2010 2011 2012 2013 2014 2015E 2016E 2017E
MSG segment 5,350 7,024 9,539 9,114 8,605 9,481 10,376 10,499
Xanthan gum segment 682 836 1,066 1,454 1,348 870 715 715
Other Revenue 385 539 507 798 1,344 1,410 1,778 1,778
Total Revenue 6,416 8,399 11,112 11,367 11,298 11,761 12,869 12,992
Other income 111 118 145 153 193 215 223 228
COGS (4,851) (6,880) (9,474) (9,267) (9,131) (9,853) (10,975) (10,979)
SG&A (550) (795) (1,011) (1,252) (1,165) (1,157) (1,217) (1,261)
Other op.expenses (22) (64) (37) (76) (75) (75) (82) (90)
Operating profit 1,104 778 735 925 1,120 892 818 889
Net-interest inc./(exp.) (32) (62) (245) (290) (346) (265) (147) (167)
Assoc/forex/extraord./others 0 0 0 0 0 162 0 0
Pre-tax profit 1,071 716 490 635 774 789 671 722
Tax (105) (112) (64) (129) (148) (142) (121) (126)
Min. int./pref. div./others 0 0 0 0 0 0 0 0
Net profit (reported) 966 604 427 506 626 647 550 596
Net profit (adjusted) 966 604 427 506 626 510 550 596
EPS (reported)(CNY) 0.582 0.352 0.248 0.259 0.300 0.308 0.262 0.284
EPS (adjusted)(CNY) 0.582 0.352 0.248 0.259 0.300 0.243 0.262 0.284
EPS (adjusted fully-diluted)(CNY) 0.582 0.352 0.248 0.259 0.300 0.241 0.260 0.282
DPS (CNY) 0.227 0.106 0.000 0.047 0.059 0.084 0.072 0.078
EBIT 1,104 778 735 925 1,120 892 818 889
EBITDA 1,358 1,146 1,268 1,623 1,840 1,693 1,664 1,770
Year to 31 Dec 2010 2011 2012 2013 2014 2015E 2016E 2017E
Profit before tax 1,071 716 490 635 774 789 671 722
Depreciation and amortisation 254 368 533 698 719 801 846 881
Tax paid (125) (96) (71) (129) (148) (142) (121) (126)
Change in working capital 427 (576) (170) (240) 500 (565) 383 (39)
Other operational CF items 32 62 245 290 346 265 147 167
Cash flow from operations 1,659 474 1,028 1,255 2,192 1,148 1,926 1,605
Capex (1,912) (2,419) (1,800) (1,180) (2,363) (900) (900) (500)
Net (acquisitions)/disposals 0 0 0 0 613 299 0 0
Other investing CF items 0 0 0 0 0 0 0 0
Cash flow from investing (1,912) (2,419) (1,800) (1,180) (1,749) (601) (900) (500)
Change in debt 938 2,012 904 24 39 (300) (724) (913)
Net share issues/(repurchases) 0 0 0 493 0 77 0 0
Dividends paid (379) (358) (42) (33) (116) (137) (220) (152)
Other financing CF items (32) (62) (245) (290) (346) (265) (147) (167)
Cash flow from financing 527 1,592 618 194 (423) (625) (1,091) (1,232)
Forex effect/others 0 0 0 0 0 0 0 0
Change in cash 274 (353) (154) 269 19 (79) (65) (127)
Free cash flow (253) (1,945) (772) 75 (171) 248 1,026 1,105

69
Fufeng Group (546 HK): 26 January 2016
Financial summary continued …
Balance sheet (CNYm)
Key ratios (%)
Source: FactSet, Daiwa forecasts
As at 31 Dec 2010 2011 2012 2013 2014 2015E 2016E 2017E
Cash & short-term investment 915 614 550 862 962 883 818 691
Inventory 711 1,180 1,415 1,517 1,946 2,705 2,574 2,598
Accounts receivable 817 1,739 2,340 2,069 1,452 1,511 1,654 1,669
Other current assets 0 0 0 0 0 0 0 0
Total current assets 2,443 3,533 4,305 4,449 4,359 5,100 5,046 4,959
Fixed assets 4,088 6,032 7,259 7,576 7,470 7,283 7,349 6,980
Goodwill & intangibles 0 0 0 0 0 0 0 0
Other non-current assets 190 294 407 595 1,865 1,853 1,840 1,828
Total assets 6,720 9,859 11,971 12,619 13,694 14,235 14,235 13,767
Short-term debt 555 704 2,408 1,168 813 813 813 500
Accounts payable 1,839 2,631 3,304 2,891 3,203 3,457 3,850 3,852
Other current liabilities 31 54 47 52 51 51 51 51
Total current liabilities 2,425 3,388 5,759 4,111 4,067 4,320 4,714 4,403
Long-term debt 981 2,844 2,045 3,309 3,702 3,402 2,679 2,079
Other non-current liabilities 169 220 372 380 556 556 556 556
Total liabilities 3,575 6,453 8,176 7,800 8,325 8,279 7,948 7,037
Share capital 174 174 176 204 205 205 205 205
Reserves/R.E./others 2,971 3,233 3,619 4,615 5,164 5,751 6,081 6,525
Shareholders' equity 3,145 3,407 3,795 4,819 5,369 5,956 6,286 6,730
Minority interests 0 0 0 0 0 0 0 0
Total equity & liabilities 6,720 9,859 11,971 12,619 13,694 14,235 14,235 13,767
EV 5,280 7,593 8,561 8,274 8,213 7,991 7,332 6,546
Net debt/(cash) 621 2,934 3,902 3,615 3,554 3,333 2,674 1,887
BVPS (CNY) 1.895 1.982 2.180 2.306 2.570 2.819 2.976 3.186
Year to 31 Dec 2010 2011 2012 2013 2014 2015E 2016E 2017E
Sales (YoY) 38.5 30.9 32.3 2.3 (0.6) 4.1 9.4 1.0
EBITDA (YoY) 9.3 (15.6) 10.6 28.0 13.3 (8.0) (1.7) 6.4
Operating profit (YoY) 5.2 (29.5) (5.5) 25.8 21.1 (20.4) (8.4) 8.7
Net profit (YoY) 4.1 (37.5) (29.4) 18.7 23.8 (18.6) 7.9 8.4
Core EPS (fully-diluted) (YoY) 4.1 (39.6) (29.4) 4.5 15.6 (19.5) 7.9 8.4
Gross-profit margin 24.4 18.1 14.7 18.5 19.2 16.2 14.7 15.5
EBITDA margin 21.2 13.6 11.4 14.3 16.3 14.4 12.9 13.6
Operating-profit margin 17.2 9.3 6.6 8.1 9.9 7.6 6.4 6.8
Net profit margin 15.1 7.2 3.8 4.5 5.5 4.3 4.3 4.6
ROAE 34.9 18.4 11.8 11.8 12.3 9.0 9.0 9.2
ROAA 17.6 7.3 3.9 4.1 4.8 3.7 3.9 4.3
ROCE 28.8 13.4 9.7 10.5 11.7 8.9 8.2 9.3
ROIC 31.2 13.0 9.1 9.1 10.4 8.0 7.3 8.3
Net debt to equity 19.8 86.1 102.8 75.0 66.2 56.0 42.5 28.0
Effective tax rate 9.8 15.7 13.0 20.3 19.1 18.0 18.0 17.5
Accounts receivable (days) 42.8 55.5 67.0 70.8 56.9 46.0 44.9 46.7
Current ratio (x) 1.0 1.0 0.7 1.1 1.1 1.2 1.1 1.1
Net interest cover (x) 34.1 12.6 3.0 3.2 3.2 3.4 5.6 5.3
Net dividend payout 39.0 30.3 0.0 18.3 19.7 27.3 27.5 27.4
Free cash flow yield n.a. n.a. n.a. 1.6 n.a. 5.3 22.0 23.7
Company profile
Fufeng is the largest producer of MSG and xanthan gum in China, with an approx. 45% share of
the former market and over 50% of the latter for 2014. Corn is the company’s major raw material,
accounting for about 60% of its COGS for 2014. Its production plants are located in Inner Mongolia,
Xinjiang and Shaanxi.

See important disclosures, including any required research certifications, beginning on page 81
China Consumer Staples
What's new: We believe Tsingtao will remain a victim of market-share
losses to international brands in the premium beer segment in China in
2016E. Similar to other Goliaths, Tsingtao is finding it hard to grow its
revenue from a high per capita base of beer consumption in China. Hence,
we reiterate our Underperform (4) rating.
What's the impact: Risks losing further market share amid weak
industry outlook. We see rising competition for Tsingtao beer from other
alcoholic drinks, such as wine (imported volume +42% YoY in China in
2015E) and Chinese liquor (+7% YoY in sales volume for 9M15). Beer
industry sales in China also face pressure given a high base, with per
capita consumption in China currently at c. 37 litres a year, in line with the
global average and accounting for c. 80% of alcohol consumption in China.
In 2016E, we expect continued weak demand for beer (for 11M15, industry
output volume declined by 5.7% YoY). We are concerned that Tsingtao’s
market share stopped growing for 9M15 (flat YoY at 19.6%, still the second-
largest player in China), while the other top-3 players gained market share.
Tsingtao lost ground in the high-end segment in 2015E to its main
competitor, AB-InBev, and we think this loss could widen in 2016E as we
see a lack of product differentiation and marketing strategy.
Sitting on its cash. We estimate Tsingtao was sitting on net cash of
CNY6.2bn as at end-December 2015 (vs. CNY6bn as at end-December
2014), and we forecast its ROE to slide from 13.6% in 2014 to 10.3%/9.4%
for 2015/16E, respectively. We believe Tsingtao is finding it hard to identify
meaningful acquisition targets at a reasonable price or those that could
boost EPS, as the other A-share and H-share-listed beer companies are
trading at PERs of 25-29x for 2016E, based on the Bloomberg consensus,
vs Tsingtao’s 20x.
What we recommend: We reiterate our Underperform (4) rating, and cut
our 2015-17E revenue by 1-9% as we expect its sales volume to decline.
And to reflect its higher selling expenses needed to keep up with its
competitors, we are also cutting our 2015-17E EPS by 5-10%. Accordingly,
we cut our 12-month TP to HKD26.80 from HKD32, based on a 2016E
PER of 19x (formerly 20x). Our target PER is still at a 10% discount to the
stock’s past-3-year average 12-month forward PER, as Tsingtao’s EPS
CAGR has declined from 8% for 2010-14 to 2% over 2015-17E. The main
risks to our rating: price hikes and EPS-accretive M&A.
How we differ: Our revised 2016-17 revenue forecasts are 4 -7% below
the Bloomberg consensus as we assume lower ASPs than other analysts.
Hence our 2016-17E EPS estimates are 6-7% below the consensus.
26 January 2016
Tsingtao Brewer y
Still a market-share loser
Revenue to continue to contract in 2016E on industry decline
ROE continuing to decline on inefficient use of net cash
Reiterate Underperform (4); cutting TP on lower EPS forecasts
Source: Daiwa forecasts
Source: FactSet, Daiwa forecasts
Tsingtao Brewery (168 HK)
Target price: HKD26.80 (from HKD32.00)
Share price (25 Jan): HKD28.80 | Up/downside: -6.9%
Anson Chan, CFA(852) 2532 4350
Forecast revisions (%)
Year to 31 Dec 15E 16E 17E
Revenue change (1.4) (7.6) (8.6)
Net profit change (7.2) (10.4) (4.8)
Core EPS (FD) change (7.2) (10.4) (4.8)
65
74
83
91
100
25
34
43
51
60
Jan-15 Apr-15 Jul-15 Oct-15
Share price performance
Tsingtao B (LHS) Relative to HSI (RHS)
(HKD) (%)
12-month range 28.80-56.75
Market cap (USDbn) 4.99
3m avg daily turnover (USDm) 7.90
Shares outstanding (m) 1,351
Major shareholder Tsingtao Brewery Grp (30.5%)
Financial summary (CNY)
Year to 31 Dec 15E 16E 17E
Revenue (m) 28,092 26,912 27,286
Operating profit (m) 1,758 1,628 1,761
Net profit (m) 1,636 1,610 1,714
Core EPS (fully-diluted) 1.211 1.191 1.269
EPS change (%) (17.9) (1.6) 6.5
Daiwa vs Cons. EPS (%) (1.3) (7.2) (6.4)
PER (x) 20.1 20.4 19.2
Dividend yield (%) 1.6 1.5 1.6
DPS 0.386 0.357 0.381
PBR (x) 2.0 1.9 1.7
EV/EBITDA (x) 8.9 9.0 8.1
ROE (%) 10.3 9.4 9.4

71
Tsingtao Brewery (168 HK): 26 January 2016
How do we justify our view?
Growth outlook Valuation Earnings revisions
Growth outlook Tsingtao: reported net profit and change YoY (%)
We forecast Tsingtao’s recurring net profit to decline by
18% and 2% YoY for 2015-16E, respectively, on a decline
in sales volume, at a CAGR of 6%, and less non-operating
financing income over the same period. We expect a slight
rebound in 2017E net profit (+6% YoY) on a higher ASP
due to product mix upgrades and flat sales volume.
Source: Company, Daiwa forecasts
Valuation Tsingtao: 12-month forward PER bands
We believe Tsingtao’s previously strong valuation was
supported by its frequent M&A activity and continuous ASP
hikes, both of which have ground to a halt. Our target price
is based on a 2016E PER of 19x, a 10% discount to
Tsingtao’s past-5-year average. This discount is the same
as the discount seen in 2012, when its operating-profit
margin also came under pressure due to competition.
Source: Bloomberg
Earnings revisions Tsingtao: Bloomberg-consensus EPS-forecast revisions
The Bloomberg-consensus EPS forecasts for 2015-16
have trended down since the beginning of 2015 as industry
sales volume growth has been slowing QoQ. Our EPS
forecasts are marginally lower than the consensus for
2015E, 7% lower for 2016E, and 6% lower for 2017E, as
we are less optimistic on Tsingtao’s sales-volume growth
outlook due to it still losing market share in the premium
segment.
Source: Bloomberg
2%0%
13%
-18%
-2%
6%
(20%)
(15%)
(10%)
(5%)
0%
5%
10%
15%
0
500
1,000
1,500
2,000
2,500
2012 2013 2014 2015E 2016E 2017E
Recurring net profit one-off gain YoY
CNY m
20
30
40
50
60
70
80
Jan-
11
Apr
-11
Jul-1
1
Oct
-11
Jan-
12
Apr
-12
Jul-1
2
Oct
-12
Jan-
13
Apr
-13
Jul-1
3
Oct
-13
Jan-
14
Apr
-14
Jul-1
4
Oct
-14
Jan-
15
Apr
-15
Jul-1
5
Oct
-15
Jan-
16
168 HK 18 21
24 27 30
HKD
1.0
1.2
1.4
1.6
1.8
2.0
2.2
2.4
2.6
2.8
3.0
Jan-15 Mar-15 May-15 Jul-15 Sep-15 Nov-15
2015E 2016E
HKD

72
Tsingtao Brewery (168 HK): 26 January 2016
Financial summary
Key assumptions
Profit and loss (CNYm)
Cash flow (CNYm)
Source: FactSet, Daiwa forecasts
Year to 31 Dec 2010 2011 2012 2013 2014 2015E 2016E 2017E
Sales volume growth YoY - Principal
brand 22.9 18.0 14.7 7.5 4.9 0.0 (4.0) (5.0)
Sales volume growth YoY - Other
brands (1.8) 0.0 (1.2) 15.8 14.0 15.0 6.0 4.0
Average selling price (CNY / tonne) 3,005.2 3,088.8 3,187.5 3,204.8 3,191.6 3,164.4 3,212.4 3,271.6
Gross margin % 35.2 33.3 31.6 32.0 30.9 31.4 32.0 32.7
Sellling and distribution expense ratio
(%)19.7 19.1 19.1 19.8 19.6 19.7 20.5 20.8
Year to 31 Dec 2010 2011 2012 2013 2014 2015E 2016E 2017E
Beer 19,614 22,790 25,318 27,767 28,599 27,642 26,462 26,836
others 284 368 463 524 450 450 450 450
Other Revenue 0 0 0 0 0 0 0 0
Total Revenue 19,898 23,158 25,782 28,291 29,049 28,092 26,912 27,286
Other income 0 0 0 0 0 0 0 0
COGS (12,898) (15,441) (17,635) (19,236) (20,082) (19,283) (18,294) (18,373)
SG&A (4,997) (5,599) (6,200) (7,183) (7,045) (6,951) (6,991) (7,152)
Other op.expenses (72) (17) (1) (2) 4 (100) 0 0
Operating profit 1,931 2,101 1,945 1,870 1,926 1,758 1,628 1,761
Net-interest inc./(exp.) (5) 36 178 251 335 176 171 180
Assoc/forex/extraord./others 125 301 360 543 426 323 419 419
Pre-tax profit 2,051 2,438 2,483 2,665 2,687 2,257 2,217 2,359
Tax (539) (657) (639) (692) (663) (601) (588) (625)
Min. int./pref. div./others (64) (60) (86) (2) (29) (20) (20) (20)
Net profit (reported) 1,448 1,721 1,758 1,971 1,994 1,636 1,610 1,714
Net profit (adjusted) 1,448 1,721 1,758 1,761 1,994 1,636 1,610 1,714
EPS (reported)(CNY) 1.072 1.274 1.301 1.459 1.476 1.211 1.191 1.269
EPS (adjusted)(CNY) 1.072 1.274 1.301 1.304 1.476 1.211 1.191 1.269
EPS (adjusted fully-diluted)(CNY) 1.072 1.274 1.301 1.304 1.476 1.211 1.191 1.269
DPS (CNY) 0.180 0.260 0.400 0.450 0.442 0.386 0.357 0.381
EBIT 1,931 2,101 1,945 2,080 1,926 1,758 1,628 1,761
EBITDA 2,612 2,816 2,790 2,757 2,859 2,799 2,768 3,001
Year to 31 Dec 2010 2011 2012 2013 2014 2015E 2016E 2017E
Profit before tax 2,051 2,438 2,483 2,665 2,687 2,257 2,217 2,359
Depreciation and amortisation 681 715 845 887 933 1,040 1,140 1,240
Tax paid (586) (485) (981) (930) (780) (601) (588) (625)
Change in working capital 1,098 (5) 643 1,311 (641) 75 14 (6)
Other operational CF items (5) (41) (193) (261) (359) (191) (186) (195)
Cash flow from operations 3,239 2,622 2,797 3,672 1,839 2,580 2,598 2,773
Capex (1,103) (2,442) (2,382) (2,036) (1,943) (2,000) (2,000) (2,000)
Net (acquisitions)/disposals (340) (1,769) 0 0 (350) 0 0 0
Other investing CF items 0 0 0 0 0 0 0 0
Cash flow from investing (1,444) (4,210) (2,382) (2,036) (2,293) (2,000) (2,000) (2,000)
Change in debt 91 480 61 (109) (1,466) (3) 0 0
Net share issues/(repurchases) 0 0 0 0 0 0 0 0
Dividends paid (216) (244) (351) (540) (608) (597) (521) (483)
Other financing CF items 687 (6) 930 604 384 275 421 371
Cash flow from financing 562 230 639 (45) (1,690) (325) (100) (112)
Forex effect/others 0 0 0 0 0 0 0 0
Change in cash 2,357 (1,358) 1,054 1,590 (2,143) 255 498 661
Free cash flow 2,135 180 415 1,635 (103) 580 598 773
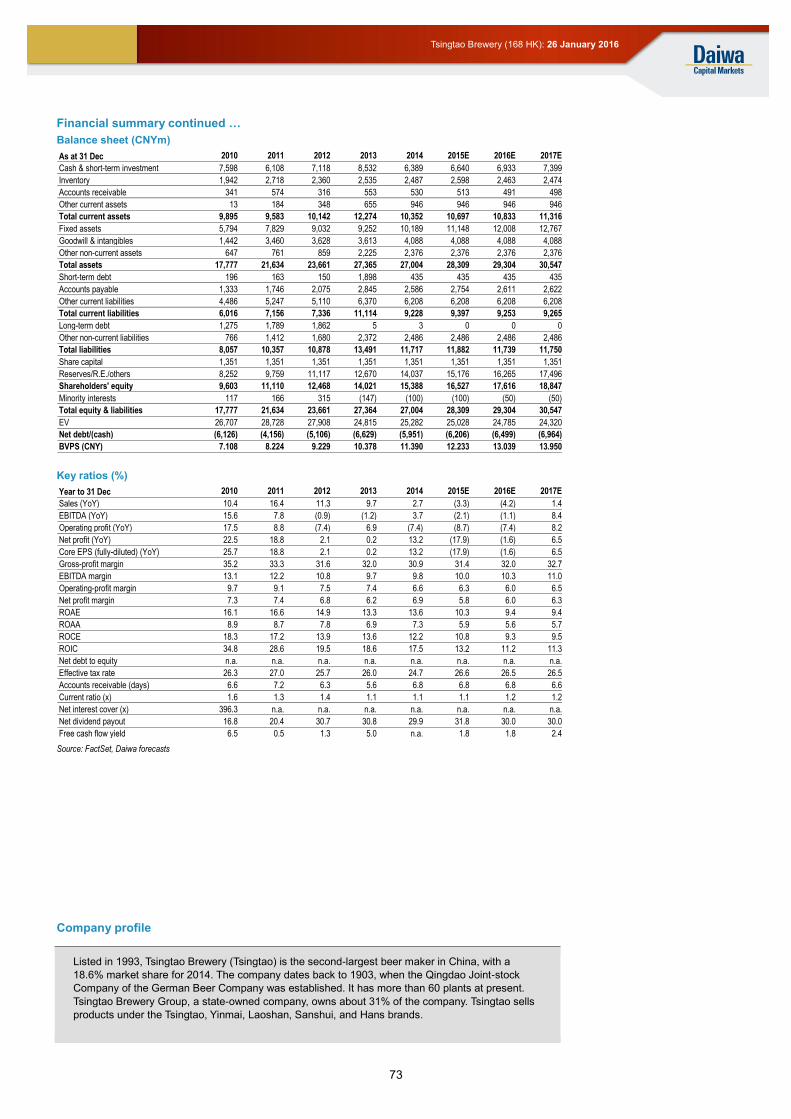
73
Tsingtao Brewery (168 HK): 26 January 2016
Financial summary continued …
Balance sheet (CNYm)
Key ratios (%)
Source: FactSet, Daiwa forecasts
As at 31 Dec 2010 2011 2012 2013 2014 2015E 2016E 2017E
Cash & short-term investment 7,598 6,108 7,118 8,532 6,389 6,640 6,933 7,399
Inventory 1,942 2,718 2,360 2,535 2,487 2,598 2,463 2,474
Accounts receivable 341 574 316 553 530 513 491 498
Other current assets 13 184 348 655 946 946 946 946
Total current assets 9,895 9,583 10,142 12,274 10,352 10,697 10,833 11,316
Fixed assets 5,794 7,829 9,032 9,252 10,189 11,148 12,008 12,767
Goodwill & intangibles 1,442 3,460 3,628 3,613 4,088 4,088 4,088 4,088
Other non-current assets 647 761 859 2,225 2,376 2,376 2,376 2,376
Total assets 17,777 21,634 23,661 27,365 27,004 28,309 29,304 30,547
Short-term debt 196 163 150 1,898 435 435 435 435
Accounts payable 1,333 1,746 2,075 2,845 2,586 2,754 2,611 2,622
Other current liabilities 4,486 5,247 5,110 6,370 6,208 6,208 6,208 6,208
Total current liabilities 6,016 7,156 7,336 11,114 9,228 9,397 9,253 9,265
Long-term debt 1,275 1,789 1,862 5 3 0 0 0
Other non-current liabilities 766 1,412 1,680 2,372 2,486 2,486 2,486 2,486
Total liabilities 8,057 10,357 10,878 13,491 11,717 11,882 11,739 11,750
Share capital 1,351 1,351 1,351 1,351 1,351 1,351 1,351 1,351
Reserves/R.E./others 8,252 9,759 11,117 12,670 14,037 15,176 16,265 17,496
Shareholders' equity 9,603 11,110 12,468 14,021 15,388 16,527 17,616 18,847
Minority interests 117 166 315 (147) (100) (100) (50) (50)
Total equity & liabilities 17,777 21,634 23,661 27,364 27,004 28,309 29,304 30,547
EV 26,707 28,728 27,908 24,815 25,282 25,028 24,785 24,320
Net debt/(cash) (6,126) (4,156) (5,106) (6,629) (5,951) (6,206) (6,499) (6,964)
BVPS (CNY) 7.108 8.224 9.229 10.378 11.390 12.233 13.039 13.950
Year to 31 Dec 2010 2011 2012 2013 2014 2015E 2016E 2017E
Sales (YoY) 10.4 16.4 11.3 9.7 2.7 (3.3) (4.2) 1.4
EBITDA (YoY) 15.6 7.8 (0.9) (1.2) 3.7 (2.1) (1.1) 8.4
Operating profit (YoY) 17.5 8.8 (7.4) 6.9 (7.4) (8.7) (7.4) 8.2
Net profit (YoY) 22.5 18.8 2.1 0.2 13.2 (17.9) (1.6) 6.5
Core EPS (fully-diluted) (YoY) 25.7 18.8 2.1 0.2 13.2 (17.9) (1.6) 6.5
Gross-profit margin 35.2 33.3 31.6 32.0 30.9 31.4 32.0 32.7
EBITDA margin 13.1 12.2 10.8 9.7 9.8 10.0 10.3 11.0
Operating-profit margin 9.7 9.1 7.5 7.4 6.6 6.3 6.0 6.5
Net profit margin 7.3 7.4 6.8 6.2 6.9 5.8 6.0 6.3
ROAE 16.1 16.6 14.9 13.3 13.6 10.3 9.4 9.4
ROAA 8.9 8.7 7.8 6.9 7.3 5.9 5.6 5.7
ROCE 18.3 17.2 13.9 13.6 12.2 10.8 9.3 9.5
ROIC 34.8 28.6 19.5 18.6 17.5 13.2 11.2 11.3
Net debt to equity n.a. n.a. n.a. n.a. n.a. n.a. n.a. n.a.
Effective tax rate 26.3 27.0 25.7 26.0 24.7 26.6 26.5 26.5
Accounts receivable (days) 6.6 7.2 6.3 5.6 6.8 6.8 6.8 6.6
Current ratio (x) 1.6 1.3 1.4 1.1 1.1 1.1 1.2 1.2
Net interest cover (x) 396.3 n.a. n.a. n.a. n.a. n.a. n.a. n.a.
Net dividend payout 16.8 20.4 30.7 30.8 29.9 31.8 30.0 30.0
Free cash flow yield 6.5 0.5 1.3 5.0 n.a. 1.8 1.8 2.4
Company profile
Listed in 1993, Tsingtao Brewery (Tsingtao) is the second-largest beer maker in China, with a
18.6% market share for 2014. The company dates back to 1903, when the Qingdao Joint-stock
Company of the German Beer Company was established. It has more than 60 plants at present.
Tsingtao Brewery Group, a state-owned company, owns about 31% of the company. Tsingtao sells
products under the Tsingtao, Yinmai, Laoshan, Sanshui, and Hans brands.

See important disclosures, including any required research certifications, beginning on page 81
China Consumer Staples
What's new: As Huishan is still a small player in the liquid milk market of
China (~2% in 1H15, on our estimates), we expect increasing marketing
expenses and discounts in 2016E as it attempts to gain market share. We
are also bearish on Huishan’s ambitions in the infant formula business
through a JV with FrieslandCampania, which targets to launch new infant
formula products in 2H16E. As discussed in our sector note, we foresee
increasing competition from foreign competitors that are much stronger
than Huishan in e-commerce channels and the mass-market segment. On
stretched valuation, we reiterate Sell [5].
What's the impact: Due to more promotional discounts among peers in
the UHT milk industry at retail channels, we cut our FY16-18E revenue
estimates by 1-3%. We also expect Huishan’s cost advantage over other
major dairy farms due to in-house feed production to diminish due to: 1) a
falling corn price in China (the feed costs of peers should fall), and 2)
Huishan’s move to expand in Eastern China in 2H16E, where land costs
are higher than in its home turf of Liaoning province. We expect Huishan’s
free cashflow to remain negative over FY16-17E and net gearing to go up
to 61-67% (also includes the impact of the aggressive share buybacks in
2015). Factoring in the cuts to our revenue forecasts, increasing financial
costs, and valuation losses from biological assets (crops and cows), we
revise down our FY16-18E EPS by 2-18%.
What we recommend: We raise our valuation for the upstream business
to HKD1.77 from HKD1.50 (DCF-based) by using new WACC assumptions
based on the latest data. We value the downstream business at HKD0.1
per share (unchanged), based on 12x FY16E PER. We also raise our
SOTP-based 12-month TP from HKD1.60 to HKD1.87, due to the reduced
number of shares outstanding after share buyback in 2H15. The stock is
now trading far above its peers’ PER range of 3-7x (upstream) and 14-27x
(downstream), and we don’t think the company’s currently weak
fundamentals justify the prevailing valuation (45x FY16E and 34x FY17E
PER on 1%/31% YoY EPS growth). Hence, we reiterate our Sell (5) rating
on Huishan. The key risk to our call: a strong rebound in raw milk prices.
How we differ: Our FY16-18E EPS forecasts are 6-17% below the
Bloomberg consensus due to Huishan’s increasing marketing expenses
and higher feed costs as it expands into Eastern China.
26 January 2016
China H uishan D airy Hol dings
More competition for downstream
Cost advantage diminishing on expansion outside home turf
Pricing pressure leading to our FY16-18E EPS cuts of 2-18%
Reiterating Sell (5) on high net gearing, stretched valuation
Source: Daiwa forecasts
Source: FactSet, Daiwa forecasts
China Huishan Dairy Holdings (6863 HK)
Target price: HKD1.87 (from HKD1.60)
Share price (25 Jan): HKD2.95 | Up/downside: -36.6%
Anson Chan, CFA(852) 2532 4350
Forecast revisions (%)
Year to 31 Mar 16E 17E 18E
Revenue change (1.0) (1.6) (2.8)
Net profit change (1.9) (17.9) (18.1)
Core EPS (FD) change (1.9) (17.9) (18.1)
50
113
175
238
300
1.2
1.7
2.1
2.6
3.1
Jan-15 Apr-15 Jul-15 Oct-15
Share price performance
CHDH (LHS) Relative to HSI (RHS)
(HKD) (%)
12-month range 1.23-3.01
Market cap (USDbn) 5.10
3m avg daily turnover (USDm) 7.04
Shares outstanding (m) 13,473
Major shareholder Yang Kai (70.7%)
Financial summary (CNY)
Year to 31 Mar 16E 17E 18E
Revenue (m) 4,470 5,558 6,327
Operating profit (m) 1,314 1,508 1,807
Net profit (m) 768 977 1,133
Core EPS (fully-diluted) 0.055 0.073 0.084
EPS change (%) 0.8 31.2 15.9
Daiwa vs Cons. EPS (%) (12.3) (16.6) (5.5)
PER (x) 45.1 34.4 29.6
Dividend yield (%) 0.5 0.6 0.7
DPS 0.013 0.015 0.017
PBR (x) 2.7 2.5 2.3
EV/EBITDA (x) 28.8 24.3 20.7
ROE (%) 5.8 7.5 8.1

75
China Huishan Dairy Holdings (6863 HK): 26 January 2016
How do we justify our view?
Growth outlook Valuation Earnings revisions
Growth outlook Huishan: Net profit and YoY growth
We forecast EPS growth for Huishan of 1% YoY for FY16E,
31% YoY for FY17E and 16% YoY for FY18E. Although we
expect sales volume to see a 21% CAGR over FY15-18E,
on an increasing number of milkable cows, we believe
sales volume growth will be offset by a decline in the raw
milk price (-10% YoY in FY16E, flat over FY17-18E) and
increased marketing and feed costs as Huishan expands in
Eastern China.
Source: Company, Daiwa forecast
Valuation Huishan: 12M forward PER band since listing
Huishan is trading currently at a PER of 34x for FY17E
based on our EPS forecasts), which we believe has only
been boosted by the share repurchase undertaken in
2H15. The stock is trading at a significant premium to its
downstream peers, such as China Mengniu Dairy. We see
long-term derating potential for Huishan due to an increase
in marketing expenses to drive market-share gains, and a
diminishing cost advantage when the company expands
outside its home turf (Northeastern China) in 2H16.
Source: Bloomberg
Earnings revisions Huishan: Bloomberg consensus FY16-17E EPS forecast
We believe the recent slight upward revisions to the
consensus FY17E EPS estimate, which is likely due to
anticipation of an increasing downstream revenue
contribution through expansion, is not justified.
Our FY16-18E EPS is 6-17% below the consensus due to
our concerns over Huishan’s increasing marketing
expenses.
Source: Bloomberg
111%
32%
-37%
-3%
27%16%
(60%)
(40%)
(20%)
0%
20%
40%
60%
80%
100%
120%
0
200
400
600
800
1,000
1,200
1,400
FY13 FY14 FY15 FY16E FY17E FY18E
Net profit (LHS) Net profit YoY (RHS)
(CNYm)
0
1
2
3
4
5
6
Sep
13
Nov
13
Jan
14
Mar
14
May
14
Jul 1
4
Sep
14
Nov
14
Jan
15
Mar
15
May
15
Jul 1
5
Sep
15
Nov
15
6863 HK 12x 16x
20x 24x 28x
(HKD)
0.00
0.05
0.10
0.15
0.20
0.25
0.30
Jul 14 Sep 14 Nov 14 Jan 15 Mar 15 May 15 Jul 15 Sep 15 Nov 15
FY16 FY17
(HKD)

76
China Huishan Dairy Holdings (6863 HK): 26 January 2016
Financial summary
Key assumptions
Profit and loss (CNYm)
Cash flow (CNYm)
Source: FactSet, Daiwa forecasts
Year to 31 Mar 2011 2012 2013 2014 2015 2016E 2017E 2018E
Milk Yield (tonne/cow/year) 8.70 8.60 9.10 9.00 9.10 8.52 8.72 8.74
Sales volume of Milk (tonnes) 57,381 213,920 352,411 482,428 577,071 742,574 947,801 1,071,201
ASP of raw milk (CNY/kg) 4.30 4.45 4.51 5.04 4.87 4.40 4.40 4.40
Number of cows (heads) 55,570 90,254 112,778 144,191 180,331 194,920 219,447 242,825
Upstream gross margin (%) 42.7 48.5 58.7 62.0 56.1 51.7 53.5 55.1
Year to 31 Mar 2011 2012 2013 2014 2015 2016E 2017E 2018E
Raw Milk 244 672 681 989 1,028 1,006 1,057 1,109
Processed milk 15 564 1,707 2,288 2,422 2,847 3,269 3,986
Other Revenue 115 97 165 254 473 617 1,233 1,231
Total Revenue 374 1,333 2,552 3,530 3,923 4,470 5,558 6,327
Other income 0 0 0 0 0 0 0 0
COGS (231) (732) (1,105) (1,162) (1,440) (1,898) (2,452) (2,752)
SG&A (33) (54) (197) (562) (935) (1,078) (1,358) (1,488)
Other op.expenses (24) (52) (69) (315) (293) (180) (240) (280)
Operating profit 87 495 1,181 1,491 1,255 1,314 1,508 1,807
Net-interest inc./(exp.) (57) (103) (142) (206) (323) (623) (565) (621)
Assoc/forex/extraord./others 297 67 (28) 9 (83) 123 103 90
Pre-tax profit 327 459 1,012 1,294 850 814 1,046 1,276
Tax 0 (11) (67) (45) (60) (46) (69) (113)
Min. int./pref. div./others 0 0 0 0 0 0 0 (30)
Net profit (reported) 327 448 945 1,249 790 768 977 1,133
Net profit (adjusted) 327 448 945 1,249 790 768 977 1,133
EPS (reported)(CNY) 0.028 0.039 0.082 0.096 0.055 0.055 0.073 0.084
EPS (adjusted)(CNY) 0.028 0.039 0.082 0.096 0.055 0.055 0.073 0.084
EPS (adjusted fully-diluted)(CNY) 0.028 0.039 0.082 0.096 0.055 0.055 0.073 0.084
DPS (CNY) 0.000 0.000 0.000 0.022 0.015 0.013 0.015 0.017
EBIT 87 495 1,181 1,491 1,255 1,314 1,508 1,807
EBITDA 406 611 1,181 1,654 1,361 1,435 1,748 2,086
Year to 31 Mar 2011 2012 2013 2014 2015 2016E 2017E 2018E
Profit before tax 327 459 1,012 1,294 850 814 1,046 1,276
Depreciation and amortisation 24 37 69 163 222 180 240 280
Tax paid 0 (9) (96) (45) (60) (46) (69) (113)
Change in working capital (64) (128) 191 (710) (237) 27 (139) 421
Other operational CF items 52 101 139 204 322 643 575 631
Cash flow from operations 340 460 1,315 906 1,097 1,618 1,653 2,494
Capex (1,921) (1,744) (1,541) (5,503) (5,491) (3,304) (2,170) (2,350)
Net (acquisitions)/disposals 26 8 57 23 2 713 23 38
Other investing CF items 0 0 0 0 0 0 0 0
Cash flow from investing (1,895) (1,737) (1,485) (5,480) (5,489) (2,591) (2,147) (2,312)
Change in debt 0 137 732 3,309 1,687 2,000 600 600
Net share issues/(repurchases) 243 0 907 5,816 (141) (1,673) 0 0
Dividends paid 0 0 0 0 (311) (219) (169) (197)
Other financing CF items (122) 1,801 (1,383) (85) 481 (60) (565) (621)
Cash flow from financing 121 1,938 257 9,040 1,716 48 (135) (218)
Forex effect/others 0 0 0 0 0 0 0 0
Change in cash (1,435) 661 87 4,466 (2,676) (925) (629) (36)
Free cash flow (1,581) (1,284) (227) (4,597) (4,394) (1,686) (517) 144

77
China Huishan Dairy Holdings (6863 HK): 26 January 2016
Financial summary continued …
Balance sheet (CNYm)
Key ratios (%)
Source: FactSet, Daiwa forecasts
As at 31 Mar 2011 2012 2013 2014 2015 2016E 2017E 2018E
Cash & short-term investment 48 513 826 5,363 3,138 2,272 1,643 1,607
Inventory 203 413 447 915 1,582 1,776 2,002 1,955
Accounts receivable 138 148 173 220 271 325 390 468
Other current assets 1,585 582 696 784 2,817 1,012 1,012 1,012
Total current assets 1,974 1,655 2,141 7,283 7,807 5,385 5,046 5,041
Fixed assets 1,844 2,840 3,637 5,337 7,322 8,730 9,278 9,786
Goodwill & intangibles 384 418 1,453 3,975 3,824 3,836 3,848 3,860
Other non-current assets 1,305 2,278 3,280 4,425 5,382 7,066 8,413 9,925
Total assets 5,507 7,190 10,511 21,020 24,334 25,016 26,585 28,612
Short-term debt 182 362 909 1,641 2,867 3,367 3,967 4,567
Accounts payable 470 524 910 738 1,401 1,682 1,838 2,290
Other current liabilities 2,313 3,280 473 540 986 579 574 574
Total current liabilities 2,965 4,166 2,292 2,919 5,254 5,628 6,379 7,431
Long-term debt 1,961 1,917 2,103 4,679 5,140 6,640 6,640 6,640
Other non-current liabilities 193 224 233 227 255 107 107 107
Total liabilities 5,119 6,307 4,628 7,825 10,649 12,376 13,127 14,178
Share capital 0 0 0 1,143 1,143 1,143 1,143 1,143
Reserves/R.E./others 388 882 5,883 12,053 12,544 11,499 12,317 13,262
Shareholders' equity 388 882 5,883 13,195 13,686 12,642 13,459 14,405
Minority interests 0 0 0 0 (1) (1) (1) 29
Total equity & liabilities 5,507 7,190 10,511 21,020 24,334 25,016 26,585 28,612
EV 35,671 35,342 35,762 34,534 38,444 41,310 42,539 43,205
Net debt/(cash) 2,095 1,766 2,186 958 4,869 7,735 8,964 9,600
BVPS (CNY) 0.034 0.077 0.512 0.916 0.956 0.938 0.999 1.069
Year to 31 Mar 2011 2012 2013 2014 2015 2016E 2017E 2018E
Sales (YoY) n.a. 256.3 91.5 38.3 11.1 13.9 24.3 13.8
EBITDA (YoY) n.a. 50.5 93.5 40.0 (17.7) 5.5 21.8 19.4
Operating profit (YoY) n.a. 470.3 138.5 26.2 (15.8) 4.7 14.8 19.8
Net profit (YoY) n.a. 36.9 110.8 32.2 (36.8) (2.7) 27.2 15.9
Core EPS (fully-diluted) (YoY) n.a. 36.9 110.8 17.1 (43.1) 0.8 31.2 15.9
Gross-profit margin 38.4 45.1 56.7 67.1 63.3 57.5 55.9 56.5
EBITDA margin 108.5 45.8 46.3 46.8 34.7 32.1 31.4 33.0
Operating-profit margin 23.2 37.2 46.3 42.2 32.0 29.4 27.1 28.6
Net profit margin 87.5 33.6 37.0 35.4 20.1 17.2 17.6 17.9
ROAE 168.7 70.6 27.9 13.1 5.9 5.8 7.5 8.1
ROAA 11.9 7.1 10.7 7.9 3.5 3.1 3.8 4.1
ROCE 6.9 17.4 19.6 10.5 6.1 5.9 6.5 7.3
ROIC 3.5 18.8 20.6 13.0 7.1 6.4 6.6 7.1
Net debt to equity 539.8 200.2 37.2 7.3 35.6 61.2 66.6 66.6
Effective tax rate 0.0 2.3 6.6 3.5 7.1 5.6 6.6 8.9
Accounts receivable (days) 67.5 39.2 22.9 20.3 22.9 24.3 23.5 24.8
Current ratio (x) 0.7 0.4 0.9 2.5 1.5 1.0 0.8 0.7
Net interest cover (x) 1.5 4.8 8.3 7.2 3.9 2.1 2.7 2.9
Net dividend payout 0.0 0.0 0.0 22.4 27.9 22.8 20.2 20.2
Free cash flow yield n.a. n.a. n.a. n.a. n.a. n.a. n.a. 0.4
Company profile
China Huishan Dairy (Huishan) is the second-largest dairy-farm operator in China and is based in
Liaoning Province, northeastern China. The company supplies raw milk to third-party dairy
processors, as well as produces fresh milk and UHT dairy products under its own brand, Huishan.

78
China Huishan Dairy Holdings (6863 HK): 26 January 2016
Valuation
Huishan: valuation sensitivity to discount rate Huishan: key DCF assumptions
Equity Value
Discount NPV of Enterprise Equity Per Share
Rate FCF (CNY m) Value (CNY m) Value (CNY m) (HKD)
4.0% 55,132 56,384 51,515 4.59
5.0% 42,948 44,200 39,330 3.50
6.0% 34,856 36,108 31,239 2.78
7.0% 29,099 30,351 25,481 2.27
8.0% 24,797 26,049 21,180 1.89
9.0% 21,465 22,717 17,848 1.59
10.0% 18,811 20,063 15,193 1.35
11.0% 16,648 17,900 13,031 1.16
12.0% 14,855 16,107 11,237 1.00
Beta (X) 0.522 Terminal growth rate 0
Equity risk premium 12.96 Cost of debt 6
Risk free rate 2.94 Debt-weighting 44.9
Cost of equity 9.7 WACC* 8.0
Source: Daiwa estimates
Source: Daiwa estimates
Huishan: DCF valuation of upstream business
FY16F FY17F FY18F FY19F FY20F FY21F FY22F FY23F FY24F FY25F
EBIT (CNY m) 471 797 2,511 3,030 3,182 3,211 3,177 3,152 3,152 3,170
Depreciation(CNY m) 150 210 250 270 290 303 315 328 341 354
EBITDA (CNY m) 621 1,007 2,761 3,300 3,472 3,514 3,492 3,480 3,493 3,523
Capex (CNY m) -1,266 -800 -800 -808 -500 -505 -510 -515 -520 -526
Cashflow (CNY m) -1,040 -222 1,507 2,129 2,609 2,646 2,619 2,601 2,609 2,635
Discount factor 1.080 1.166 1.260 1.360 1.469 1.587 1.714 1.851 1.999 2.159
Discounted FCF -962.5 -190.0 1196.6 1564.8 1775.5 1667.3 1528.2 1405.4 1305.3 1220.4
FY26F FY27F FY28F FY29F FY30F FY31F FY32F FY33F FY34F >FY35E
EBIT (CNY m) 3,192 3,209 3,222 3,231 3,238 3,243 3,245 3,245 3,243
Depreciation(CNY m) 367 380 394 407 421 435 157 160 163 Terminal
EBITDA (CNY m) 3,559 3,589 3,616 3,639 3,659 3,677 3,402 3,405 3,406 Value
Capex (CNY m) -531 -536 -541 -547 -552 -558 -563 -569 -575
Cashflow (CNY m) 2,665 2,690 2,711 2,729 2,743 2,756 2,476 2,473 2,468 30,855
Discount factor 2.332 2.518 2.720 2.937 3.172 3.426 3.700 3.996 4.316 4.661
Discounted FCF 1142.8 1068.3 996.9 929.0 864.9 804.6 669.1 618.9 572.0 6619.9
Total discounted FCF (from FY16E onward) 24,797 NAV/share (CNY) 1.48
Net cash as of FY15 -4,869 Total value 19,9289
NAV/share (HK$) 1.77
Source: Daiwa estimates

79
China Huishan Dairy Holdings (6863 HK): 26 January 2016
Daiwa’s Asia Pacific Research Directory
HONG KONG
Takashi FUJIKURA (852) 2848 4051 [email protected]
Regional Research Head
Kosuke MIZUNO (852) 2848 4949 / (852) 2773 8273
Regional Research Co-head
John HETHERINGTON (852) 2773 8787 [email protected]
Regional Deputy Head of Asia Pacific Research
Rohan DALZIELL (852) 2848 4938 [email protected]
Regional Head of Product Management
Kevin LAI (852) 2848 4926 [email protected]
Chief Economist for Asia ex-Japan; Macro Economics (Regional)
Junjie TANG (852) 2773 8736 [email protected]
Macro Economics (China)
Jonas KAN (852) 2848 4439 [email protected]
Head of Hong Kong and China Property
Cynthia CHAN (852) 2773 8243 [email protected]
Property (China)
Leon QI (852) 2532 4381 [email protected]
Banking (Hong Kong/China); Broker (China); Insurance (China)
Anson CHAN (852) 2532 4350 [email protected]
Consumer (Hong Kong/China)
Jamie SOO (852) 2773 8529 [email protected]
Gaming and Leisure (Hong Kong/China)
Dennis IP (852) 2848 4068 [email protected]
Power; Utilities; Renewables and Environment (Hong Kong/China)
John CHOI (852) 2773 8730 [email protected]
Head of Hong Kong and China Internet; Regional Head of Small/Mid Cap
Kelvin LAU (852) 2848 4467 [email protected]
Head of Automobiles; Transportation and Industrial (Hong Kong/China)
Brian LAM (852) 2532 4341 [email protected]
Transportation – Railway; Construction and Engineering (China)
Jibo MA (852) 2848 4489 [email protected]
Head of Custom Products Group
Thomas HO (852) 2773 8716 [email protected]
Custom Products Group
PHILIPPINES
Bianca SOLEMA (63) 2 737 3023 [email protected]
Utilities and Energy
SOUTH KOREA
Sung Yop CHUNG (82) 2 787 9157 [email protected]
Pan-Asia Co-head/Regional Head of Automobiles and Components; Automobiles; Shipbuilding; Steel
Mike OH (82) 2 787 9179 [email protected]
Banking; Capital Goods (Construction and Machinery)
Iris PARK (82) 2 787 9165 [email protected]
Consumer/Retail
SK KIM (82) 2 787 9173 [email protected]
IT/Electronics – Semiconductor/Display and Tech Hardware
Thomas Y KWON (82) 2 787 9181 [email protected]
Pan-Asia Head of Internet & Telecommunications; Software – Internet/On-line Game
Kevin JIN (82) 2 787 9168 [email protected]
Small/Mid Cap
TAIWAN
Rick HSU (886) 2 8758 6261 [email protected]
Head of Regional Technology; Head of Taiwan Research; Semiconductor/IC Design (Regional)
Christie CHIEN (886) 2 8758 6257 [email protected]
Banking; Insurance (Taiwan); Macro Economics (Regional)
Steven TSENG (886) 2 8758 6252 [email protected]
IT/Technology Hardware (PC Hardware)
Christine WANG (886) 2 8758 6249 [email protected]
IT/Technology Hardware (Automation); Pharmaceuticals and Healthcare; Consumer
Kylie HUANG (886) 2 8758 6248 [email protected]
IT/Technology Hardware (Handsets and Components)
Helen CHIEN (886) 2 8758 6254 [email protected]
Small/Mid Cap
INDIA
Punit SRIVASTAVA (91) 22 6622 1013 [email protected]
Head of India Research; Strategy; Banking/Finance
Saurabh MEHTA (91) 22 6622 1009 [email protected]
Capital Goods; Utilities
SINGAPORE
Ramakrishna MARUVADA (65) 6499 6543 [email protected]
Head of Singapore Research; Telecommunications (China/ASEAN/India)
Royston TAN (65) 6321 3086 [email protected]
Oil and Gas; Capital Goods
David LUM (65) 6329 2102 [email protected]
Banking; Property and REITs
Shane GOH (65) 64996546 [email protected]
Small/Mid Cap (Singapore)
Jame OSMAN (65) 6321 3092 [email protected]
Telecommunications (ASEAN/India); Pharmaceuticals and Healthcare; Consumer (Singapore)

80
China Huishan Dairy Holdings (6863 HK): 26 January 2016
Daiwa’s Offices
Office / Branch / Affiliate Address Tel Fax
DAIWA SECURITIES GROUP INC
HEAD OFFICE Gran Tokyo North Tower, 1-9-1, Marunouchi, Chiyoda-ku, Tokyo, 100-6753 (81) 3 5555 3111 (81) 3 5555 0661
Daiwa Securities Trust Company One Evertrust Plaza, Jersey City, NJ 07302, U.S.A. (1) 201 333 7300 (1) 201 333 7726
Daiwa Securities Trust and Banking (Europe) PLC (Head Office) 5 King William Street, London EC4N 7JB, United Kingdom (44) 207 320 8000 (44) 207 410 0129
Daiwa Europe Trustees (Ireland) Ltd Level 3, Block 5, Harcourt Centre, Harcourt Road, Dublin 2, Ireland (353) 1 603 9900 (353) 1 478 3469
Daiwa Capital Markets America Inc. New York Head Office Financial Square, 32 Old Slip, New York, NY10005, U.S.A. (1) 212 612 7000 (1) 212 612 7100
Daiwa Capital Markets America Inc. San Francisco Branch 555 California Street, Suite 3360, San Francisco, CA 94104, U.S.A. (1) 415 955 8100 (1) 415 956 1935
Daiwa Capital Markets Europe Limited, London Head Office 5 King William Street, London EC4N 7AX, United Kingdom (44) 20 7597 8000 (44) 20 7597 8600
Daiwa Capital Markets Europe Limited, Frankfurt Branch Neue Mainzer Str. 1, 60311 Frankfurt/Main, Germany (49) 69 717 080 (49) 69 723 340
Daiwa Capital Markets Europe Limited, Paris Representative Office 17, rue de Surène 75008 Paris, France (33) 1 56 262 200 (33) 1 47 550 808
Daiwa Capital Markets Europe Limited, Geneva Branch 50 rue du Rhône, P.O.Box 3198, 1211 Geneva 3, Switzerland (41) 22 818 7400 (41) 22 818 7441
Daiwa Capital Markets Europe Limited, Moscow Representative Office
Midland Plaza 7th Floor, 10 Arbat Street, Moscow 119002, Russian Federation
(7) 495 641 3416 (7) 495 775 6238
Daiwa Capital Markets Europe Limited, Bahrain Branch 7th Floor, The Tower, Bahrain Commercial Complex, P.O. Box 30069, Manama, Bahrain
(973) 17 534 452 (973) 17 535 113
Daiwa Capital Markets Hong Kong Limited Level 28, One Pacific Place, 88 Queensway, Hong Kong (852) 2525 0121 (852) 2845 1621
Daiwa Capital Markets Singapore Limited 6 Shenton Way #26-08, OUE Downtown 2, Singapore 068809, Republic of Singapore
(65) 6220 3666 (65) 6223 6198
Daiwa Capital Markets Australia Limited Level 34, Rialto North Tower, 525 Collins Street, Melbourne, Victoria 3000, Australia
(61) 3 9916 1300 (61) 3 9916 1330
DBP-Daiwa Capital Markets Philippines, Inc 18th Floor, Citibank Tower, 8741 Paseo de Roxas, Salcedo Village, Makati City, Republic of the Philippines
(632) 813 7344 (632) 848 0105
Daiwa-Cathay Capital Markets Co Ltd 14/F, 200, Keelung Road, Sec 1, Taipei, Taiwan, R.O.C. (886) 2 2723 9698 (886) 2 2345 3638
Daiwa Securities Capital Markets Korea Co., Ltd. 20 Fl.& 21Fl. One IFC, 10 Gukjegeumyung-Ro, Yeongdeungpo-gu, Seoul, Korea
(82) 2 787 9100 (82) 2 787 9191
Daiwa Securities Co. Ltd., Beijing Representative Office Room 301/302,Kerry Center,1 Guanghua Road,Chaoyang District,
Beijing 100020, People’s Republic of China
(86) 10 6500 6688 (86) 10 6500 3594
Daiwa (Shanghai) Corporate Strategic Advisory Co. Ltd. 44/F, Hang Seng Bank Tower, 1000 Lujiazui Ring Road, Pudong, Shanghai China 200120 , People’s Republic of China
(86) 21 3858 2000 (86) 21 3858 2111
Daiwa Securities Co. Ltd., Bangkok Representative Office 18th Floor, M Thai Tower, All Seasons Place, 87 Wireless Road,
Lumpini, Pathumwan, Bangkok 10330, Thailand (66) 2 252 5650 (66) 2 252 5665
Daiwa Capital Markets India Private Ltd 10th Floor, 3 North Avenue, Maker Maxity, Bandra Kurla Complex, Bandra East, Mumbai – 400051, India
(91) 22 6622 1000 (91) 22 6622 1019
Daiwa Securities Co. Ltd., Hanoi Representative Office Suite 405, Pacific Palace Building, 83B, Ly Thuong Kiet Street, Hoan Kiem Dist. Hanoi, Vietnam
(84) 4 3946 0460 (84) 4 3946 0461
DAIWA INSTITUTE OF RESEARCH LTD
HEAD OFFICE 15-6, Fuyuki, Koto-ku, Tokyo, 135-8460, Japan (81) 3 5620 5100 (81) 3 5620 5603
MARUNOUCHI OFFICE Gran Tokyo North Tower, 1-9-1, Marunouchi, Chiyoda-ku, Tokyo, 100-6756 (81) 3 5555 7011 (81) 3 5202 2021
New York Research Center 11th Floor, Financial Square, 32 Old Slip, NY, NY 10005-3504, U.S.A. (1) 212 612 6100 (1) 212 612 8417
London Research Centre 3/F, 5 King William Street, London, EC4N 7AX, United Kingdom (44) 207 597 8000 (44) 207 597 8550

81
China Huishan Dairy Holdings (6863 HK): 26 January 2016
Important Disclosures and Disclaimer
This publication is produced by Daiwa Securities Group Inc. and/or its non-U.S. affiliates, and distributed by Daiwa Securities Group Inc. and/or its non-U.S. affiliates, except to the extent expressly provided herein. This publication and the contents hereof are intended for information purposes only, and may be subject to change without further notice. Any use, disclosure, distribution, dissemination, copying, printing or reliance on this publication for any other purpose without our prior consent or approval is strictly prohibited. Neither Daiwa Securities Group Inc. nor any of its respective parent, holding, subsidiaries or affiliates, nor any of its respective directors, officers, servants and employees, represent nor warrant the accuracy or completeness of the information contained herein or as to the existence of other facts which might be significant, and will not accept any responsibility or liability whatsoever for any use of or reliance upon this publication or any of the contents hereof. Neither this publication, nor any content hereof, constitute, or are to be construed as, an offer or solicitation of an offer to buy or sell any of the securities or investments mentioned herein in any country or jurisdiction nor, unless expressly provided, any recommendation or investment opinion or advice. Any view, recommendation, opinion or advice expressed in this publication may not necessarily reflect those of Daiwa Securities Group Inc., and/or its affiliates nor any of its respective directors, officers, servants and employees except where the publication states otherwise. This research report is not to be relied upon by any person in making any investment decision or otherwise advising with respect to, or dealing in, the securities mentioned, as it does not take into account the specific investment objectives, financial situation and particular needs of any person. Daiwa Securities Group Inc., its subsidiaries or affiliates, or its or their respective directors, officers and employees from time to time have trades as principals, or have positions in, or have other interests in the securities of the company under research including market making activities, derivatives in respect of such securities or may have also performed investment banking and other services for the issuer of such securities. The following are additional disclosures.
Ownership of Securities
For “Ownership of Securities” information, please visit BlueMatrix disclosure link at https://daiwa3.bluematrix.com/sellside/Disclosures.action.
Investment Banking Relationship
For “Investment Banking Relationship”, please visit BlueMatrix disclosure link at https://daiwa3.bluematrix.com/sellside/Disclosures.action.
Japan
Daiwa Securities Co. Ltd. and Daiwa Securities Group Inc.
Daiwa Securities Co. Ltd. is a subsidiary of Daiwa Securities Group Inc.
Investment Banking Relationship
Within the preceding 12 months, the subsidiaries and/or affiliates of Daiwa Securities Group Inc. * has lead-managed public offerings and/or secondary offerings (excluding straight bonds) of the securities of the following companies: Modern Land (China) Co. Ltd (1107 HK); econtext Asia Ltd (1390 HK); Accordia Golf Trust (AGT SP); GF Securities Co Ltd (1776 HK); Mirae Asset Life Insurance Co Ltd (085620 KS); China Reinsurance Group Corporation (1508 HK).
*Subsidiaries of Daiwa Securities Group Inc. for the purposes of this section shall mean any one or more of: Daiwa Capital Markets Hong Kong Limited (大和資本市場香港有限公司), Daiwa
Capital Markets Singapore Limited, Daiwa Capital Markets Australia Limited, Daiwa Capital Markets India Private Limited, Daiwa-Cathay Capital Markets Co., Ltd., Daiwa Securities Capital Markets Korea Co., Ltd.
Hong Kong
This research is distributed in Hong Kong by Daiwa Capital Markets Hong Kong Limited (大和資本市場香港有限公司) (“DHK”) which is regulated by the Hong Kong Securities and Futures
Commission. Recipients of this research in Hong Kong may contact DHK in respect of any matter arising from or in connection with this research. Relevant Relationship (DHK)
DHK may from time to time have an individual employed by or associated with it serves as an officer of any of the companies under its research coverage.
Singapore
This research is distributed in Singapore by Daiwa Capital Markets Singapore Limited and it may only be distributed in Singapore to accredited investors, expert investors and institutional investors as defined in the Financial Advisers Regulations and the Securities and Futures Act (Chapter 289), as amended from time to time. By virtue of distribution to these category of investors, Daiwa Capital Markets Singapore Limited and its representatives are not required to comply with Section 36 of the Financial Advisers Act (Chapter 110) (Section 36 relates to disclosure of Daiwa Capital Markets Singapore Limited’s interest and/or its representative’s interest in securities). Recipients of this research in Singapore may contact Daiwa Capital Markets Singapore Limited in respect of any matter arising from or in connection with the research.
Australia
This research is distributed in Australia by Daiwa Capital Markets Australia Limited and it may only be distributed in Australia to wholesale investors within the meaning of the Corporations Act. Recipients of this research in Australia may contact Daiwa Capital Markets Stockbroking Limited in respect of any matter arising from or in connection with the research.
India
This research is distributed in India to Institutional Clients only by Daiwa Capital Markets India Private Limited (Daiwa India) which is an intermediary registered with Securities & Exchange Board of India as a Stock Broker, Merchant Bank and Research Analyst. Daiwa India, its Research Analyst and their family members and its associates do not have any financial interest save as disclosed or other undisclosed material conflict of interest in the securities or derivatives of any companies under coverage. Daiwa India and its associates may have received compensation for any products other than Investment Banking (as disclosed) or brokerage services from the subject company in this report during the past 12 months. Unless otherwise stated in BlueMatrix disclosure link at https://daiwa3.bluematrix.com/sellside/Disclosures.action, Daiwa India and its associates do not hold more than 1% of any companies covered in this research report. There is no material disciplinary action against Daiwa India by any regulatory authority impacting equity research analysis activities as of the date of this report.
Taiwan
This research is distributed in Taiwan by Daiwa-Cathay Capital Markets Co., Ltd and it may only be distributed in Taiwan to institutional investors or specific investors who have signed recommendation contracts with Daiwa-Cathay Capital Markets Co., Ltd in accordance with the Operational Regulations Governing Securities Firms Recommending Trades in Securities to Customers. Recipients of this research in Taiwan may contact Daiwa-Cathay Capital Markets Co., Ltd in respect of any matter arising from or in connection with the research.
Philippines This research is distributed in the Philippines by DBP-Daiwa Capital Markets Philippines, Inc. which is regulated by the Philippines Securities and Exchange Commission and the Philippines Stock Exchange, Inc. Recipients of this research in the Philippines may contact DBP-Daiwa Capital Markets Philippines, Inc. in respect of any matter arising from or in connection with the research. DBP-Daiwa Capital Markets Philippines, Inc. recommends that investors independently assess, with a professional advisor, the specific financial risks as well as the legal, regulatory, tax, accounting, and other consequences of a proposed transaction. DBP-Daiwa Capital Markets Philippines, Inc. may have positions or may be materially interested in the securities in any of the markets mentioned in the publication or may have performed other services for the issuers of such securities.
For relevant securities and trading rules please visit SEC and PSE links at http://www.sec.gov.ph/irr/AmendedIRRfinalversion.pdf and http://www.pse.com.ph/ respectively.
Thailand
This research is distributed to only institutional investors in Thailand primarily by Thanachart Securities Public Company Limited (“TNS”).
This report is prepared by analysts who are employed by Daiwa Securities Group Inc. and/or its non-U.S. affiliates. This report is provided to you for informational purposes only and it is not, and is not to be construed as, an offer or an invitation to make an offer to sell or buy any securities. Neither Thanachart Securities Public Company Limited, Daiwa Securities Group Inc. nor any of their respective parent, holding, subsidiaries or affiliates, nor any of their respective directors, officers, servants and employees accept any liability whatsoever for any direct or consequential loss arising from any use of this research or its contents.
The information and opinions contained herein have been compiled or arrived at from sources believed to be reliable. However, Thanachart Securities Public Company Limited, Daiwa Securities Group Inc. nor any of their respective parent, holding, subsidiaries or affiliates, nor any of their respective directors, officers, servants and employees make no representation or warranty, express or implied, as to their accuracy or completeness. Expressions of opinion herein are subject to change without notice. The use of any information, forecasts and opinions contained in this report shall be at the sole discretion and risk of the user.
Daiwa Securities Group Inc. and/or its non-U.S. affiliates perform and seek to perform business with companies covered in this research. Thanachart Securities Public Company Limited, Daiwa Securities Group Inc., their respective parent, holding, subsidiaries or affiliates, their respective directors, officers, servants and employees may have positions and financial interest in securities mentioned in this research. Thanachart Securities Public Company Limited, Daiwa Securities Group Inc., their respective parent, holding, subsidiaries or affiliates may from time to time perform investment banking or other services for, or solicit investment banking or other business from, any entity mentioned in this research. Therefore, investors should be aware of conflict of interest that may affect the objectivity of this research.
United Kingdom
This research report is produced by Daiwa Securities Co. Ltd. and/or its affiliates and is distributed in the European Union, Iceland, Liechtenstein, Norway and Switzerland. Daiwa Capital Markets Europe Limited is authorised and regulated by The Financial Conduct Authority (“FCA”) and is a member of the London Stock Exchange and Eurex. This publication is intended for investors who are not Retail Clients in the United Kingdom within the meaning of the Rules of the FCA and should not therefore be distributed to such Retail Clients in the United Kingdom. Should you enter into investment business with Daiwa Capital Markets Europe’s affiliates outside the United Kingdom, we are obliged to advise that the protection afforded by the United Kingdom regulatory system may not apply; in particular, the benefits of the Financial Services Compensation Scheme may not be available.

82
China Huishan Dairy Holdings (6863 HK): 26 January 2016
Daiwa Capital Markets Europe Limited has in place organisational arrangements for the prevention and avoidance of conflicts of interest. Our conflict management policy is available at http://www.uk.daiwacm.com/about-us/corporate-governance-regulatory.
Germany
This document is distributed in Germany by Daiwa Capital Markets Europe Limited, Niederlassung Frankfurt which is regulated by BaFin (Bundesanstalt fuer Finanzdienstleistungsaufsicht) for the conduct of business in Germany.
Bahrain
This research material is distributed in Bahrain by Daiwa Capital Markets Europe Limited, Bahrain Branch, regulated by The Central Bank of Bahrain and holds Investment Business Firm – Category 2 license and having its official place of business at the Bahrain World Trade Centre, South Tower, 7th floor, P.O. Box 30069, Manama, Kingdom of Bahrain. Tel No. +973 17534452 Fax No. +973 535113
United States
This report is distributed in the U.S. by Daiwa Capital Markets America Inc. (DCMA). It may not be accurate or complete and should not be relied upon as such. It reflects the preparer’s views at the time of its preparation, but may not reflect events occurring after its preparation; nor does it reflect DCMA’s views at any time. Neither DCMA nor the preparer has any obligation to update this report or to continue to prepare research on this subject. This report is not an offer to sell or the solicitation of any offer to buy securities. Unless this report says otherwise, any recommendation it makes is risky and appropriate only for sophisticated speculative investors able to incur significant losses. Readers should consult their financial advisors to determine whether any such recommendation is consistent with their own investment objectives, financial situation and needs. This report does not recommend to U.S. recipients the use of any of DCMA’s non-U.S. affiliates to effect trades in any security and is not supplied with any understanding that U.S. recipients of this report will direct commission business to such non-U.S. entities. Unless applicable law permits otherwise, non-U.S. customers wishing to effect a transaction in any securities referenced in this material should contact a Daiwa entity in their local jurisdiction. Most countries throughout the world have their own laws regulating the types of securities and other investment products which may be offered to their residents, as well as a process for doing so. As a result, the securities discussed in this report may not be eligible for sales in some jurisdictions. Customers wishing to obtain further information about this report should contact DCMA: Daiwa Capital Markets America Inc., Financial Square, 32 Old Slip, New York, New York 10005 (Tel no. 212-612-7000).
Ownership of Securities
For “Ownership of Securities” information please visit BlueMatrix disclosure link at https://daiwa3.bluematrix.com/sellside/Disclosures.action.
Investment Banking Relationships
For “Investment Banking Relationships” please visit BlueMatrix disclosure link at https://daiwa3.bluematrix.com/sellside/Disclosures.action. DCMA Market Making
For “DCMA Market Making” please visit BlueMatrix disclosure link at https://daiwa3.bluematrix.com/sellside/Disclosures.action.
Research Analyst Conflicts
For updates on “Research Analyst Conflicts” please visit BlueMatrix disclosure link at https://daiwa3.bluematrix.com/sellside/Disclosures.action. The principal research analysts who prepared this report have no financial interest in securities of the issuers covered in the report, are not (nor are any members of their household) an officer, director or advisory board member of the issuer(s) covered in the report, and are not aware of any material relevant conflict of interest involving the analyst or DCMA, and did not receive any compensation from the issuer during the past 12 months except as noted: no exceptions.
Research Analyst Certification
For updates on “Research Analyst Certification” and “Rating System” please visit BlueMatrix disclosure link at https://daiwa3.bluematrix.com/sellside/Disclosures.action. The views about any and all of the subject securities and issuers expressed in this Research Report accurately reflect the personal views of the research analyst(s) primarily responsible for this report (or the views of the firm producing the report if no individual analysts[s] is named on the report); and no part of the compensation of such analyst(s) (or no part of the compensation of the firm if no individual analyst[s)] is named on the report) was, is, or will be directly or indirectly related to the specific recommendations or views contained in this Research Report.
The following explains the rating system in the report as compared to relevant local indices, unless otherwise stated, based on the beliefs of the author of the report.
"1": the security could outperform the local index by more than 15% over the next 12 months. "2": the security is expected to outperform the local index by 5-15% over the next 12 months. "3": the security is expected to perform within 5% of the local index (better or worse) over the next 12 months. "4": the security is expected to underperform the local index by 5-15% over the next 12 months. "5": the security could underperform the local index by more than 15% over the next 12 months. Disclosure of investment ratings
Rating Percentage of total
Buy* 63.9%
Hold** 21.3%
Sell*** 14.8%
Source: Daiwa
Notes: data is for single-branded Daiwa research in Asia (ex Japan) and correct as of 31 December 2015. * comprised of Daiwa’s Buy and Outperform ratings. ** comprised of Daiwa’s Hold ratings. *** comprised of Daiwa’s Underperform and Sell ratings. Additional information may be available upon request.
Japan - additional notification items pursuant to Article 37 of the Financial Instruments and Exchange Law (This Notification is only applicable where report is distributed by Daiwa Securities Co. Ltd.)
If you decide to enter into a business arrangement with us based on the information described in materials presented along with this document, we ask you to pay close attention to the following items.
In addition to the purchase price of a financial instrument, we will collect a trading commission* for each transaction as agreed beforehand with you. Since commissions may be included in the purchase price or may not be charged for certain transactions, we recommend that you confirm the commission for each transaction.
In some cases, we may also charge a maximum of ¥ 2 million (including tax) per year as a standing proxy fee for our deposit of your securities, if you are a non-resident of Japan.
For derivative and margin transactions etc., we may require collateral or margin requirements in accordance with an agreement made beforehand with you. Ordinarily in such cases, the amount of the transaction will be in excess of the required collateral or margin requirements.
There is a risk that you will incur losses on your transactions due to changes in the market price of financial instruments based on fluctuations in interest rates, exchange rates, stock prices, real estate prices, commodity prices, and others. In addition, depending on the content of the transaction, the loss could exceed the amount of the collateral or margin requirements.
There may be a difference between bid price etc. and ask price etc. of OTC derivatives handled by us.
Before engaging in any trading, please thoroughly confirm accounting and tax treatments regarding your trading in financial instruments with such experts as certified public accountants. *The amount of the trading commission cannot be stated here in advance because it will be determined between our company and you based on current market conditions and the content of each transaction etc.
When making an actual transaction, please be sure to carefully read the materials presented to you prior to the execution of agreement, and to take responsibility for your own decisions regarding the signing of the agreement with us.
Corporate Name: Daiwa Securities Co. Ltd. Financial instruments firm: chief of Kanto Local Finance Bureau (Kin-sho) No.108 Memberships: Japan Securities Dealers Association, The Financial Futures Association of Japan Japan Securities Investment Advisers Association Type II Financial Instruments Firms Association