Embed Size (px)
Citation preview

i
T.R.N.C.
NEAR EAST UNIVERSITY
INSTITUTE OF HEALTH SCIENCES
SWITCHABLE-POLARITY SOLVENT-LIQUID-LIQUID
MICROEXTRACTION OF PIPERINE FROM BLACK AND WHITE
PEPPER PRIOR TO ITS DETERMINATION BY HPLC
MAIS AL-NIDAWI
ANALYTICAL CHEMISTRY
MASTER OF SCIENCE THESIS
NICOSIA
2018
ii
T.R.N.C.
NEAR EAST UNIVERSITY
INSTITUTE OF HEALTH SCIENCES
SWITCHABLE-POLARITY SOLVENT-LIQUID-LIQUID
MICROEXTRACTION OF PIPERINE FROM BLACK AND WHITE
PEPPER PRIOR TO ITS DETERMINATION BY HPLC
MAIS AL-NIDAWI
ANALYTICAL CHEMISTRY
MASTER OF SCIENCE THESIS
SUPERVISOR
ASSIST. PROF. DR. USAMA ALSHANA
CO-SUPERVISOR
PROF. DR. İHSAN ÇALIŞ
NICOSIA
2018

iii
APPROVAL
Insert Approval Page here

iv
DECLARATION
I hereby declare that all information in this document has been obtained and presented in
accordance with academic rules and ethical conduct. I also declare that, as required by
these rules and conduct, I have fully cited and referenced all material and results that are
not original to this work.
Name, Last Name : MAIS AL-NIDAWI
Signature :
Date : 29 May 2018

v
ACKNOWLEDGEMENTS
I would like to express my biggest appreciation and thanks to my supervisor Assist.
Prof. Dr. Usama Alshana who has guided me tirelessly to the right path in each step
throughout this research, for being patient with me, and for giving me a positive energy
to complete this thesis without whom it would not have been possible to complete. You
were our father, elder brother and friend and not only a supervisor. I appreciate your
efforts and everything you did. I am very grateful to you more than words can say.
I also would like to thank my co-supervisor Prof. Dr. İhsan Çalış for being helpful
whenever I needed his advice despite his busy schedule and heavy responsibilities.
I want to thank Assoc. Prof. Dr. Hayati Çelik and Assist. Prof. Dr. Banu Keşanlı for
giving their time, teaching and motivating me about life beyond MSc.; I appreciate your
efforts.
I would like also to thank Duygu Yiğit Hanoğlu and Azmi Hanoğlu for giving me their
time during my experiments at the Laboratory of Pharmacognosy; I am grateful for your
help.
I would also like to thank Prof. Dr. Hasan Abou Gazar (Yusufoğlu) from the Department
of Pharmacognosy, Faculty of Pharmacy, Prince Sattam bin Abdulaziz University, for
analyzing the isolated piperine standard by FT-NMR.
My precious father who supported me morally and financially, I am grateful to you for
the rest of my life for giving me the opportunity to chase my dream. I am proud to have
you and will make you proud of me.
My mother, my soulmate, I do not know how to thank you; I am so lucky to have you in
my life; without you I am nothing. You supported me whenever I needed, you motivated

vi
me whenever I was mentally weak, you endured with me whenever I was in a bad mood,
you did not and would not stop helping and supporting me and praying for me, you are
always proud of me. I am truly thankful for having you.
My brothers; Mohammed and Ibrahim, my dear sister, my whole family and friends
back in Iraq, I am grateful for your support. Thank you from the bottom of my heart for
being a part of my life, I am lucky to have you.
Last but not the least, my friends and colleagues at Near East University, it was pleasure
to know you and spend time with you, I am proud to have you and feel grateful to you
all, specially Malik Hassan, my right hand in the laboratory; I appreciate your efforts
and everything you did for me and Jude Caleb, you were always helping and supporting
me mentally and giving me positive energy whenever I was mentally tired; thank you, I
appreciate your help. Also I want to thank Semra Altunterim and Dr. Selin Işık for
supporting and helping me in the writing of Turkish abstract. Thank you all again.

vii
To my late grandfather Masoud Mustafa Al-Bayaty, who passed away few days before
my graduation and left fingerprints of forgiveness, love, grace, generosity and kindness
in our hearts and lives. Who did not stop encouraging me to get higher education and to
open my own laboratory that carries my name. You will not be forgotten.

viii
ABSTRACT
Al-Nidawi, Mais. Switchable-polarity solvent liquid-liquid microextraction of piperine
from black and white pepper prior to its determination by HPLC.
Near East University, Institute of Health Science, Analytical Chemistry Program, Master
of Science Thesis, Nicosia, 2018.
Piperine is an important alkaloid that has many medical and pharmaceutical benefits, it was
extracted from Piper nigrum L. by switchable-polarity solvent which was synthesized from
triethylamine (TEA)/water/CO2 (1:1, excess, v/v) via proton transfer reaction and was used for
the extraction of piperine from black and white pepper prior to its determination by high-
performance liquid chromatography (HPLC). The proposed method was termed as switchable-
polarity solvent-liquid-liquid microextraction (SPS-LLME). Optimum extraction conditions
were found as follows: Extraction solvent, TEA; volume of TEA in the extraction solvent, 750
µL; and extraction time, 10s. Addition/ volume of organic modifier, centrifugation time, and
ionic strength had no significant effect on the extraction efficiency. The final extract was
suitable for direct injection into HPLC without any further pretreatment. Optimum HPLC
conditions were found as follows: Column, Agilent Eclipse XDB C18 (4.6 mm ID × 15 cm, 5
μm); separation temperature, 20 °C; mobile phase, ACN:H2O, 45:55 (%, v/v); flow rate, 1.1 mL
min-1, and injection volume, 5 μL. Piperine was monitored using a diode-array detector (DAD)
at 346 nm. Limits of detection (LOD) and quantitation (LOQ), calculated based on 3Sb/m and
10Sb/m, were found as 0.4-1.2 and 1.3-3.9 mg g-1, respectively. Calibration graphs showed good
linearity with coefficients of determination (R2) higher than 0.9950. Piperine standard was
isolated and characterized by 1D- (1H- and 13C-NMR) and 2D-NMR (COSY, HSQC and
HMBC). SPS-LLME-HPLC was applied for the extraction and determination of piperine from
seven black and one white pepper samples from different origins and percentage relative
recoveries (%RR) were obtained within the range of 95.6% and 104.7%. The results proved that
SPS-LLME can represent a simple, rapid and green alternative method for the extraction of
piperine from black and white pepper prior to HPLC analysis in routine work.
Keywords: Black Pepper, Determination, HPLC, Piperine, Switchable-Polarity Solvent-Liquid-
Liquid Microextraction, White Pepper

ix
ÖZET
Al-Nidawi, Mais. Siyah ve Beyaz Biberden Piperinin Değiştirilebilir Polarite Çözücülü -
Sıvı-Sıvı Mikroekstraksiyonu ve HPLC ile Tayini.
Yakın Doğu Üniversitesi, Sağlık Bilimleri Enstitüsü, Analitik Kimya Programı, Yüksek
Lisans Tezi, Lefkoşa, 2018.
Birçok tıbbi ve farmasötik faydaya sahip önemli bir alkaloid olan piperin, bu tez çalışmasında,
trietilamin (TEA)/su/CO2 (1:1, fazla, h/h) ile sentezlenen değiştirilebilir polariteli çözücü
kullanılarak Piper nigrum L.'den (kara ve beyaz biber) ekstrakte edilmiş ve proton transfer
reaksiyonu ile yüksek performanslı sıvı kromatografi (HPLC) kullanılarak tayin edilmiştir.
Önerilen yöntem; değiştirilebilir polarite çözücülü-sıvı-sıvı mikroekstraksiyonu (SPS-LLME)
olarak adlandırılmıştır. Optimum ekstraksiyon koşulları aşağıdaki gibi bulunmuştur:
Ekstraksiyon çözücü, TEA; ekstraksiyon çözücüsündeki TEA hacmi, 750 µL; ve ekstraksiyon
süresi, 10 s. Organik modifiye edicinin varlığı ve hacmi, santrifüjleme süresi ve iyonik şiddeti
ekstraksiyon verimi üzerinde önemli bir etkiye sahip olmadığı tespit edilmiştir. Son ekstrakt,
başka bir ön işlem yapılmadan HPLC'ye doğrudan enjeksiyon için uygun olarak
değerlendirilmiştir. Optimum HPLC koşulları aşağıdaki gibi bulunmuştur: kolon, Agilent
Eclipse XDB C18 (4.6 mm ID × 15 cm, 5 µm); ayırma sıcaklığı, 20 °C; mobil faz, ACN:H20,
45:55 (%, v/v); akış hızı, 1.1 mL min-1 ve enjeksiyon hacmi, 5 μL. Piperin, 346 nm'de bir diyod
dizisi detektörü (DAD) kullanılarak izlenmiştir. 3Sb/m ve 10Sb/m'ye göre hesaplanan teşhis
(LOD) ve tayin (LOQ) sınırları sırasıyla 0.4-1.2 ve 1.3-3.9 mg g-1 olarak bulunmuştur.
Kalibrasyon grafikleri, 0.9950'den yüksek olan tamamlayıcılık katsayısı (R2) ile iyi bir
doğrusallık göstermiştir. Piperin standardı izole edilerek 1D- (1H- ve 13C-NMR) ve 2D-NMR
(COSY, HSQC ve HMBC) ile karakterize edilmiştir. Farklı orijinlerden yedi adet siyah ve bir
adet beyaz biber örneklerinden elde edilen piperinin ekstraksiyonu ve tayini için SPS-LLME-
HPLC uygulanmış ve % 95,6 ile % 104,7 aralığında nispi geri kazanımlar (%RR) elde edilmiştir.
Sonuçlar, SPS-LLME'nin, rutin çalışmada HPLC analizinden önce siyah ve beyaz biberden
piperin ekstraksiyonu için basit, hızlı ve çevreci alternatif bir yöntemi temsil edebileceği
kanıtlanmıştır.
Anahtar kelimeler: Beyaz biber, Değiştirilebilir Polarite Çözücülü-Sıvı-Sıvı
Mikroekstraksiyonu, HPLC, Karabiber, Piperin

x
TABLE OF CONTENTS
APPROVAL ................................................................................................................................. iii
DECLARATION .......................................................................................................................... iv
ACKNOWLEDGEMENTS ........................................................................................................... v
ABSTRACT ............................................................................................................................... viii
ÖZET ............................................................................................................................................ ix
TABLE OF CONTENTS ............................................................................................................... x
LIST OF FIGURES ..................................................................................................................... xii
LIST OF TABLES ....................................................................................................................... xv
LIST OF ABBREVIATIONS ..................................................................................................... xvi
1 CHAPTER 1: INTRODUCTION ......................................................................................... 1
1.1 Piperine .......................................................................................................................... 1
1.2 Liquid-Phase Exraction .................................................................................................. 6
1.3 Liquid-Phase Microextraction ....................................................................................... 7
1.4 Switchable-Polarity Solvents (SPS) ............................................................................. 11
1.5 High-Performance Liquid Chromatography (HPLC) .................................................. 17
1.5.1 Retention factor (𝑘′) ............................................................................................. 23
1.5.2 Selectivity (∝) ...................................................................................................... 24
1.5.3 Efficiency (𝑁) ...................................................................................................... 24
1.5.4 Resolution (𝑅𝑠) .................................................................................................... 25
1.5.5 Mode of elution in HPLC .................................................................................... 28
1.6 Nuclear Magnetic Resonance Spectroscopy (NMR) ................................................... 30
1.7 Column Chromatography ............................................................................................ 31
1.8 Literature Review ........................................................................................................ 31
2 CHAPTER 2: EXPERIMENTAL ....................................................................................... 33
2.1 Instrumentation ............................................................................................................ 33
2.2 Reagents and Solutions ................................................................................................ 33
2.3 Apparatus ..................................................................................................................... 34
2.4 Sampling and Sample Pre-treatment ............................................................................ 34
2.4.1 Sampling Blending............................................................................................... 34
2.4.2 Solid-Liquid Extraction ....................................................................................... 34
2.4.3 Salting-out extraction (SOE) ................................................................................ 35
2.4.4 SPS-LLME ........................................................................................................... 35
2.5 Extraction and Isolation of Piperine from Black Pepper ............................................. 36

xi
2.5.1 Salting-out extraction (SOE) ................................................................................ 36
2.5.2 Scaled-up DLLME ............................................................................................... 37
2.5.3 Preparation of piperine for isolation by column chromatography ....................... 37
2.5.4 Column chromatography ..................................................................................... 40
3 CHAPTER 3: RESULTS AND DISCUSSION .................................................................. 41
3.1 Selection of Maximum Absorption Wavelength (λmax) ............................................... 41
3.2 Optimization of Extraction Methods ........................................................................... 42
3.2.1 Optimization of extraction parameters ................................................................. 42
3.2.2 Switchable-polarity-solvent liquid-liquid microextraction (SPS-LLME) ........... 43
3.3 Optimization of HPLC Conditions .............................................................................. 44
3.3.1 Type of the mobile phase ..................................................................................... 45
3.3.2 Optimization of the mobile phase composition ................................................... 47
3.3.3 Effect of adding acetic acid as a modifier in the mobile phase ............................ 47
3.3.4 Optimization of the flow rate ............................................................................... 48
3.4 Optimum HPLC Conditions ........................................................................................ 49
3.5 Switchable-Polarity Solvent Liquid-Liquid Microextraction (SPS-LLME) ................ 50
3.5.1 Optimization of the type of extraction solvent for SPS-LLME ........................... 50
3.5.2 Optimization of the volume of TEA .................................................................... 51
3.5.3 Optimization of the volume of the deionized water ............................................. 52
3.5.4 Optimization the volume of the organic modifier ................................................ 53
3.5.5 Optimization of the ionic strength ....................................................................... 54
3.5.6 Optimization of extraction time ........................................................................... 55
3.5.7 Optimization of centrifugation time ..................................................................... 56
3.5.8 Optimization of sample introduction of the final extract into HPLC ................... 57
3.6 Optimum SPS-LLME Conditions ................................................................................ 60
3.7 Calibration, Quantitation and Figures of Merit ............................................................ 60
3.8 Isolation of Piperine ..................................................................................................... 64
3.8.1 Scaled-up DLLME ............................................................................................... 64
3.8.2 Column chromatography ..................................................................................... 64
3.9 Structural Elucidation Using NMR .............................................................................. 67
3.10 Comparison of SPS-LLME With Other Methods For The Extraction of Piperine
from Black and White Pepper ................................................................................................. 75
4 CHAPTER 4: CONCLUSION AND RECOMMENDATION ........................................... 78
REFERENCES ............................................................................................................................ 80

xii
LIST OF FIGURES
Figure 1.1: Different types of berries pepper. .................................................................... 1
Figure 1.2: Isomeric structures of piperine ........................................................................ 3
Figure 1.3: Different isomers of piperine........................................................................... 4
Figure 1.4: Piper nigrum Linn., known as black pepper. ................................................... 5
Figure 1.5: Piper longum Linn., known as long pepper. .................................................... 5
Figure 1.6: Direct-immersion SDME. ............................................................................... 9
Figure 1.7: HF-LPME. ..................................................................................................... 10
Figure 1.8: DLLME. ........................................................................................................ 11
Figure 1.9: Reversible reaction of amines with CO2. ...................................................... 12
Figure 1.10: Process for formation of SPS. ..................................................................... 13
Figure 1.11: Chemical and physical methods for phase separation. ................................ 16
Figure 1.12: HPLC instrument. ........................................................................................ 18
Figure 1.13: Schematic diagram of liquid chromatography modes. ................................ 20
Figure 1.14: Different particles size and inner diameter of the column chromatography
prepared (a) 250 µm; (b) 100 µm; (c) 75 µm; and 50 µm fused silica. ........................... 20
Figure 1.15: Effect of efficiency, retention factor and selectivity on resolution. ............ 26
Figure 1.16: Systematic approach to HPLC separations. ................................................ 27
Figure 1.17: Isocratic and gradient elution. ..................................................................... 29
Figure 2.1: SPS-LLME procedure. .................................................................................. 35
Figure 2.2: Salting-out extraction .................................................................................... 36
Figure 2.3: Collected CF from scaled-up DLLME. ......................................................... 37
Figure 2.4: Evaporation of CF by rotary evaporator. ....................................................... 38
Figure 2.5: The collected crude solid residue. ................................................................. 38
Figure 2.6: TLC with toluene: ethyl acetate 70/30 (%v/v). ............................................. 39
Figure 2.7: Extraction and Isolation of Piperine from Black Pepper. .............................. 39
Figure 2.8: Crystallization of piperine. ............................................................................ 40
Figure 3.1: Absorption profile of piperine. ...................................................................... 41
Figure 3.2: 3D Plot of piperine standard. ......................................................................... 42

xiii
Figure 3.3: log𝑃 of piperine. ............................................................................................ 43
Figure 3.4: log𝑃 of triethylamine. .................................................................................... 43
Figure 3.5: Microspecies distribution of piperine. ........................................................... 44
Figure 3.6: Snyder solvent polarity index. ....................................................................... 45
Figure 3.7: Relationship between organic solvent mixture ratio and back pressure of the
column. ............................................................................................................................. 46
Figure 3.8: UV absorption spectrum of: (a) acetonitrile and (b) methanol reagents. ...... 46
Figure 3.9: Optimization of the mobile phase composition. ............................................ 47
Figure 3.10: Effect of adding acetic acid as a mobile phase modifier. ............................ 48
Figure 3.11: Optimization of the flow rate. ..................................................................... 49
Figure 3.12: Comparison between DMCHA and TEA. ................................................... 50
Figure 3.13: Selection of extraction solvent. ................................................................... 51
Figure 3.14: Optimization of the volume of the SPS. ...................................................... 52
Figure 3.15: Optimization the volume of DI water. ......................................................... 53
Figure 3.16: Optimization the volume of the organic modifier. ...................................... 54
Figure 3.17: Optimization of the ionic strength. .............................................................. 55
Figure 3.18: Optimization of the extraction time. ............................................................ 56
Figure 3.19: Optimization of centrifugation time. ........................................................... 57
Figure 3.20: Microspecies distribution form of piperine in the acidic medium. ............. 58
Figure 3.21: Representative chromatograms obtained with of the three sample
introduction methods. ...................................................................................................... 59
Figure 3.22: Mode of sample introduction. ..................................................................... 59
Figure 3.23: External aqueous calibration graph for piperine ......................................... 61
Figure 3.24: Chromatogram of the extract obtained after the scaled-up DLLME
procedure. ......................................................................................................................... 64
Figure 3.25: Isolation of piperine by column chromatography. ...................................... 65
Figure 3.26: TLC plates the under UV light at (a) 254 nm and (b) 366 nm. ................... 66
Figure 3.27: TLC plates after being sprayed with 1% vanillin and 5% H2SO4. ............. 66
Figure 3.28: A chromatogram obtained with the 46-51 fractions. ................................... 67
Figure 3.29: A chromatogram obtained with 52-63 fractions. ......................................... 67

xiv
Figure 3.30: Yellow crystals of piperine. ......................................................................... 68
Figure 3.31: Numbered structural formula of piperine. ................................................... 68
Figure 3.32: 1H-NMR Spectrum of piperine (500 MHz, CDCl3). .................................. 70
Figure 3.33: 13C-NMR and DEPT Spectra of piperine (125 MHz, CDCl3)................... 71
Figure 3.34: Spectrum (a), 1H,1H-Homonuclear Correlated Spectrum (COSY) of
piperine, and spectrum (b), 1H,1H-Homonuclear Correlated Spectrum (COSY) of
piperine. ........................................................................................................................... 72
Figure 3.35: 1H,13C-Heteronuclear Correlated Spectrum (HSQC) of piperine; [(HSQC:
Heteronuclear Single-Quantum Correlation) experiment]. .............................................. 73
Figure 3.36: Spectrum (a), 1H,13C-Heteronuclear Multiple Bond Correlated Spectrum
(HMBC) of piperine, and spectrum (b),1H,13C-Heteronuclear Multiple Bond Correlated
Spectrum (HMBC) of piperine. ....................................................................................... 74
Figure 3.37: 1H,13C-Heteronuclear Long Range Correlations ....................................... 75

xv
LIST OF TABLES
Table 1.1: Design and evaluation of switchable-polarity solvents. ................................. 14
Table 3.1: Optimum HPLC conditions. ........................................................................... 49
Table 3.2: Optimum SPS-LLME conditions. .................................................................. 60
Table 3.3: Analytical performance of SPS-LLME-HPLC. .............................................. 62
Table 3.4: Relative recoveries of piperine from black and white pepper samples. ......... 63
Table 3.5: 1H and 13C-NMR data of piperine [(E-E)-5-(3,4-methylenedioxyphenyl)-2,4-
pentadienoyl-2-piperidine)] (CDCl3: 1H: 500 MHz, 13C: 125 MHz). ........................... 69
Table 3.6: Comparison of SPS-LLME with other methods for the extraction of piperine
from black and white pepper. ........................................................................................... 77

xvi
LIST OF ABBREVIATIONS
Abbreviation Definition
ACN Acetonitrile
AP Acceptor phase
BES Back-extraction solvent
CF Chloroform
DI Direct injection
DLLME Dispersive liquid-liquid microextraction
DMCHA Dimethylcyclohexylamine
DP Donor phase
EF Enrichment factor
EVAP Evaporation-to-dryness
FT-NMR Furrier transform-nuclear magnetic resonance
GC Gas chromatography
HF-LPME Hollow fiber liquid-liquid microextraction
HLLE Homogeneous liquid-liquid extraction
HPLC High-performance liquid chromatography
IE Ion-exchange
ILUAE Ionic liquid-based ultrasonic-assisted extraction
LC/MS Liquid chromatography/mass spectrometry
LDR Linear dynamic range
LLE Liquid-liquid extraction
LLME Liquid-liquid microextraction
LOD Limit of detection
LOQ Limit of quantitation
LPME Liquid-phase microextraction
LP-SOX Low pressure-based Soxhlet extraction
LP-UAE Low pressure-based ultrasound-assisted extraction
NMR Nuclear magnetic resonance spectroscopy
NP Normal phase

xvii
Abbreviation Definition
ODS Octadecyl silica gel
PLE Pressurized liquid extraction
RP Reversed phase
RR Relative recovery
SD-LPME Single-drop liquid phase microextraction
SE Size exclusion
SFE Supercritical fluid extraction
SOE Salting-out extraction
SPE Solid-phase extraction
SPME Solid-phase microextraction
SPS Switchable-polarity solvent
SPS-LLME Switchable-polarity solvent liquid-liquid microextraction
SS Switchable solvent
TEA Triethylamine
TLC Thin-layer chromatography
TMS Tetramethylsilane
TRNC Turkish Republic of Northern Cyprus
UV Ultra-violet

1
1 CHAPTER 1: INTRODUCTION
CHAPTER 1
INTRODUCTION
1.1 Piperine
Herbs and spices have an old history in food processing and medicinal preparation
because of their health benefits and charming flavor which make them necessary and
essential in our daily food. In addition, they are used in the preparation of many
medications due to their pharmacological characteristics. Black peppers are formed from
green immature berries of pepper plant. After picking these berries, they are left under
heat treatment for drying and for browning enzymes to be secreted out of the cell walls,
while white peppers are formed when the berries are mature and dried with the removal
of the outer shell. Green peppers are collected immature and left to dry either by air or
freeze-drying. Red pepper is collected when matured 1. Different types of berries pepper
are shown in Figure 1.1.
Figure 1.1: Different types of berries pepper.

2
Black pepper is largely used as spice worldwide. It has been called the “king of Spices”,
and was used in the past in many fields, extended to the present time and its use is
predicted to continue in the future. The pungency and flavor of the pepper is associated
with the presence of the naturally existing alkaloid, known as piperine in addition to
some volatile oils. Generally, the amount of piperine in black and white pepper ranges
between 2 and 7.4% in Piper nigrum L., about 4% of long pepper (Piper longum L.), and
4.5% of Balinese long pepper fruits (Piper retrofractum Vahl). Whereas, the volatile
oils, which are responsible for the odor of the pepper, form about 0.4 to 7%. Other
compounds such as oleoresin, fats and starch form about 4.4-12%, 1.9-9%, and 28-49%
of the black body, respectively 2.
The amount of piperine changes in the plants according to the piperaceae family, and it
is also affected by various environmental determinants like, weather, growing
circumstances and place of origin 3. Christian Ørsted was the first chemist who isolated
piperine from black pepper in 1819. The extracted piperine was a yellow crystalline
compound, having a melting point of 128 to 130 ºC. The chemical structure is
recognized as piperoylpiperidine, with a molecular formula of C17H19NO3, and its
IUPAC name is 1-(5-[1,3-benzodioxol5-yl]-1-oxo-2,4-pentadienyl) piperidine. Because
piperine tends to be a weak base, it decomposes through acid or alkali hydrolysis to a
volatile basic compounds, piperidine (C5H11N) and piperic acid (C12H10O4). There are
four isomeric structures for piperine: piperine (trans-trans isomer), isopiperine (cis-trans
isomer), chavicine (cis-cis isomer), and isochavicine (trans-cis isomer) 4, the structures
of which are shown in Figure 1.2.

3
Figure 1.2: Isomeric structures of piperine
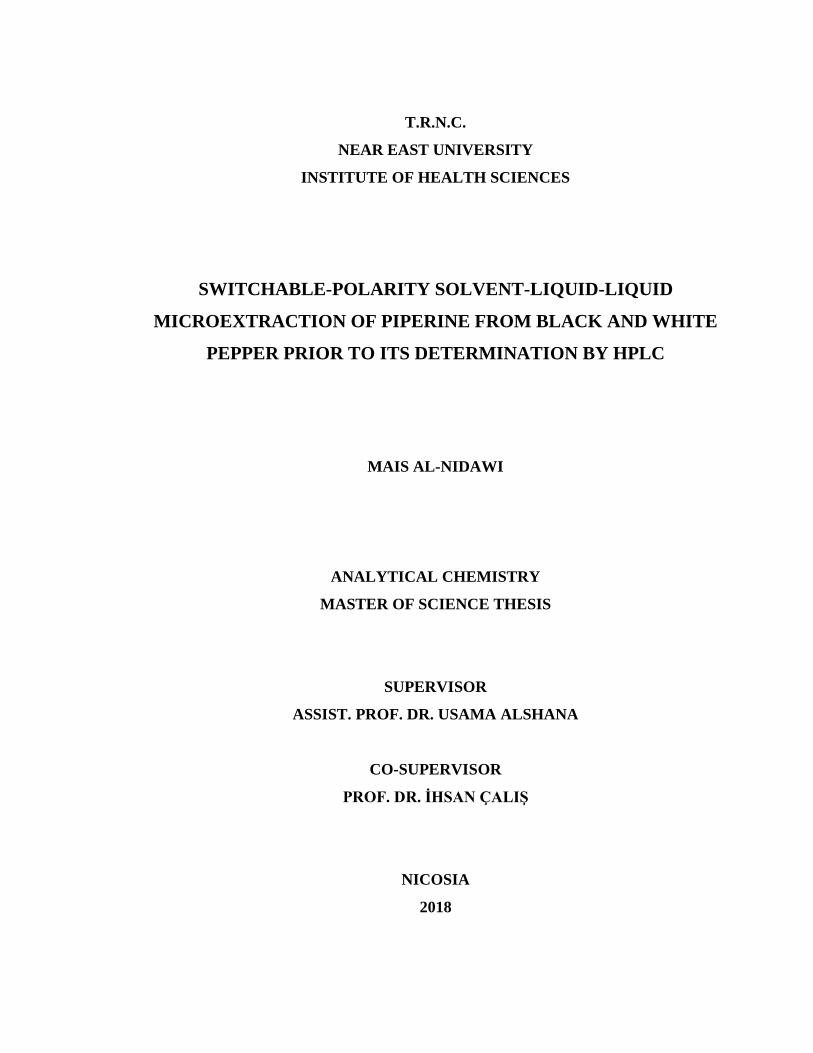
Nevertheless, the three other geometric isomers of piperine do not exhibit pungency.
Other alkaloids have been found in black pepper like, piperanine, piperettine, piperylin
A, piperolein B and pipericine (Figure 1.3). All of these alkaloids have some degree of
pungency in the pepper, but the overall contribution of these alkaloids is small. Piperine
is the main compound which is responsible for the pungency of pepper; it is about 98%
of the total alkaloids in pepper. Piperine and its similar compounds are used to measure
the total pungency of pepper 4.
4
Figure 1.3: Different isomers of piperine.
Black pepper has been used in ancient Chinese and Indian medicine for treatment and
relief of cold, influenza, rheumatism, fever, chills, and muscular pain as a natural
medicinal product. Nevertheless, black pepper is also believed to have been used as tea
for serious headache, sore throat, bad digestion and even coma. It has also been used to
increase the flow of saliva, enhance the circulation of blood, and activate appetite 4.
Black pepper is also used in many fields like food processing due to its specific bitter
quality which is related to piperine 5, as food preservatives, in cosmetic products and
pharmaceutical 6. In addition to the previously mentioned points, it has been reported
lately that piperine and its essential oils have physiological effects such as antioxidant
activities, chemoprevention, immunomodulatory, anti-carcinogenic, hepatoprotective,
anti-inflammatory, stimulatory 7, antiulcer activities 8,9. Black pepper has shown positive
effects on swallowing reflexes in elderly dysphagia people 10, protection against
oxidative damage and reduced lipid peroxidation 11.

5
Piper nigrum Linn. and Piper longum Linn, which are known as Black pepper and Long
pepper, are shown in Figure 1.4 and Figure 1.5 respectively. They are the oldest and
most important spices in the world, which are cultivated and native to the hot and moist
part of India.
Figure 1.4: Piper nigrum Linn., known as black pepper.
Figure 1.5: Piper longum Linn., known as long pepper.

6
In addition to the fact that piperine is highly photosensitive in solution, it may be
decomposed under light, heat, oxygen and other environmental conditions and affect the
long term storage stability 12.
1.2 Liquid-Phase Extraction
Generally, the analysis of any compound in complex sample need two steps of sample
processing. The first step includes extraction, separation, purification and pre-
concentration. The second step consists of identification, qualitative and quantitative
analysis. With the development in analytical methods and techniques due to the
evolution in computer, information and instrument technologies, sample pre-treatment is
lagging behind. Nevertheless, it was only until recently that sample pre-treatment has
received attention in an effort to reduce procedure steps, and reduce or eliminate using
solvents for extraction or alternative solvents that are environmentally friendly.
Flexibility of sampling and automation is also a huge area of interest 13. Such a
development helps especially with neutral product analysis which have a high
complexity, low levels of active ingredients and multiple components. Therefore, sample
pre-treatment is necessary to separate and remove any ineffective ingredient and
impurities because figures of merit such as precision, accuracy and limit of detection
(LODs) can be affected by any part of the extraction procedure. Thus, it is very
important, and fundamental for any successful analytical method, which includes mainly
three parts: (1) sample matrix simplification and replacement, (2) Analyte enhancement
and preconcentration, and (3) sample clean-up 13.
The ideal goal of extraction techniques is to minimize the use of toxic solvents and
combine sampling, extraction, preconcentration and even conversion of the analytes into
another suitable form by derivatization in a single step 14,15.
Sample preparation is always considered as the bottleneck of any analytical protocols
before determination of any substance in complicated matrices 16. The major classical

7
extraction methods that have been used in many fields are liquid-liquid extraction (LLE)
and solid-phase extraction (SPE) 17,18. But they are still not satisfying due to the use of
large volumes of organic solvents, boring, time consuming and complex mass transfer in
two phase systems. Shortcomings associated with LLE such as emulsion formation, use
of large sample volumes and toxic organic solvents make it labor-intensive, expensive,
time-consuming, and environmentally-unfriendly. Although SPE uses much less solvent
than LLE, it can still be considered significant, and normally an extra step is needed to
preconcentrate the analytes further into smaller volumes. SPE is also time-consuming
and relatively expensive 19. Recently, much research has been directed toward efficient,
economic and ‘‘green’’ miniaturized extraction techniques. Liquid–liquid
microextraction (LLME) with its different operating modes, such as single-drop
microextraction (SDME) 20, hollow fiber-based liquid-phase microextraction (HF-
LPME) 21, solvent-bar microextraction (SBME) 22, and dispersive liquid–liquid
microextraction (DLLME) 23, among others, has attracted increasing attention as novel
sample preparation techniques.
1.3 Liquid-Phase Microextraction
Liquid-phase microextraction (LPME) is a miniaturized form of LLE, which has been
used in separation and extraction procedure to overcome the obvious disadvantages of
LLE time consuming and solvent toxicity in addition to laborious application 24. In
LPME, a few microliters are used as the extraction solvent which is a water-immiscible
solvent, also called acceptor phase (AP), in contact with the aqueous phase, also called
the donor phase (DP), which contains the analyte.
SPME is a miniaturized form of SPE that has also been developed to offer advantages
such as simplicity, ease of application, requirement of short time for the extraction,
relatively low analysis cost, high enrichment factor, minimum volumes of the extractant
and agreement with the green analytical chemistry approach 25. The main disadvantage
of LLME is using toxic and many cases volatile solvents which are denser than water,

8
like halogenated solvents that cause danger to the analyst and the environment. The
requirement for an extraction solvent in ordinary LLME procedure matches the
improvement of “green extraction agents” which are require the reduction of toxicity
and volatility of extraction solvents and the hazard to the analysts, hence, the increased
attention toward this method in recent years 26.
In order to enhance the selectivity, sensitivity, to protect analytical columns, and to
reduce matrix effect, the pretreatment of the sample is very important, specifically in the
pharmaceutical and biomedical analysis 27. Simple procedures are needed to prepare the
sample for the analysis in pharmaceutical analysis such as dissolution, filtration and
dilution used for dosage form assays 28. But, in biological samples, the matrix is much
more complicated and the analyte is present at a much lower concentration, making it
necessary to develop more specific and sensitive methods 29,30, in conjunction with
common methods such protein precipitation 31,32.
SDME was first introduced in 1996 by Jeannot and Cantwell 20 followed by
chromatographic analysis. This technique relies on the suspension of a few microliters of
the extraction solvent at the tip of a microsyringe needle above (head-space) or
immersed directly (direct-immersion) into the sample solution that contains the analyte.
After the extraction has taken place, the microdrop is withdrawn into the syringe as
shown in Figure 1.6, and injected directly to electrophoretic or chromatographic system
33. Despite the various advantages of this method, which include low consumption of
organic solvents, high enrichment factors, it suffers from several limitations such as
imbalance and dislodge of the drop during extraction step, the need for filtration after the
extraction due to adsorption of other components of the complex matrix, low precision
due to low surface area of contact between the drop and sample solution, and
unsuitability for routine analysis.

9
Figure 1.6: Direct-immersion SDME.
HF-LPME 21was performed first introduced 1999 by Pedersen-Bjergaard and co-workers
and has been, since then, applied for various analytes and samples 34. In its simplest
mode, two-phase-HF-LPME, it is performed by placing the sample solution containing
the analyte into a small vial and a hollow fiber, made of porous polypropylene, is soaked
in an organic solvent, is placed inside the sample solution. Hollow fiber is covered with
a layer of 200 µm immiscible organic solvent to ensure the solvent does not leak to the
sample solution during extraction (Figure 1.7).
pH of the sample solution is adjusted so that the analyte is present in its neutral form.
The analyte then diffuses from the sample solution through the pores containing an
organic solvent inside its lumens, into the acceptor solution, which is withdrawn and
analyzed. There are several limitations of HF-LPME, the most important being the long
extraction time ranging between 30 to 60 minutes and the high probability for the hollow
fiber pores to be blocked during extraction 35.

10
Figure 1.7: HF-LPME.
DLLME was invented by Assadi and his co-workers in 2006 23. The main principle of
this method is the use of a tertiary solvent system that consists of an aqueous sample
solution, an extraction solvent and a disperser solvent. Upon the addition of a mixture of
the extraction and disperser solvents to the aqueous sample solution, an emulsion forms
(Figure 1.8); the extraction solvent, which is abundant with the analyte(s), is
precipitated at the bottom or floated at the surface of the solution upon centrifugation,
depending on the density of the organic extraction solvent used. This solvent is collected
and injected into the instrument for analysis, or is further pretreated before injection
depending on its compatibility with the instrument used. DLLME has found wide
acceptance as an outstanding technique for its simplicity, cost effectiveness and ability
to provide high extraction efficiencies within a very short time due to the extensive
surface contact between the droplets of the extraction solvent and the sample solution.
However, it has some limitations which still need to be overcome: (1) three solvents are
needed; (2) relatively long steps; (3) centrifugation is necessary; (4) limited
compatibility with complex matrix composition 35,36.

11
Figure 1.8: DLLME.
1.4 Switchable-Polarity Solvents (SPS)
Despite their low volumes, the most commonly used extraction phases in almost all of
the above mentioned techniques, are volatile organic solvents that may cause health
problems to the analyst and environment, such as toxicity, smog formation, inhalation
difficulties and flammability. Greener solvents include ionic liquids, CO2, water and bio-
derived organic solvents have been focused on as alternatives to achieve “environmental
damage reduction”.
Since their initial discovery in 1914, ionic liquids (ILs) have been widely studied in
multiple chemistry disciplines. They possess melting points at or below 100 °C. In most
cases, ILs are composed of an organic cation and an organic or inorganic anion. It has
been estimated there can be up to 1018 possible combinations of ILs 37. A number of ILs
exhibit beneficial characteristics, such as high thermal stability, negligible vapor
pressure, and non-flammability, in addition to varying viscosities, conductivity, and
miscibility in different solvents. These characteristics can also be finely tuned to meet

12
specific requirements by imparting different functional groups and/or varying the
combinations of cations and anions in the ILs.
Switchable-polarity solvents (SPS) “also called smart solvents” were first invented in
2005 by Philip G. Jessop 38. The author reported that certain environmentally-friendly
organic solvents such as tertiary amines show complete solubility in water in the
presence of carbon dioxide. An acid-base reaction occurs between tertiary amines and
hydrated CO2 in water to produce protonated SPS and the bicarbonate salt which are
completely soluble in water. Upon removal of CO2, the polarity of the SPS can be
switched off toward the non-polar form of the tertiary amine by converting it into its
original water-immiscible non-polar form. Thus, this property makes it possible to
extract relatively hydrophobic compounds from aqueous media. The analyte-rich tertiary
amine phase, can be easily collected, from the surface of the sample solution, and
analyzed by the instrument for the presence and/or concentration of the analyte.
Based on this reversible reaction shown in Figure 1.9 39, it is possible to produce a new
generation of ionic liquids that can have switchable polarity behavior in the presence and
absence of CO2.
Figure 1.9: Reversible reaction of amines with CO2.
Because not all solvents have the ability to change or switch their polarities in the
solution, this is a special and new class of solvents for analytical applications. Such
organic solvents should be able to form two layers “biphasic” with water (immiscible)
before the reaction and should for a “monophasic” mixture (immiscible) upon the
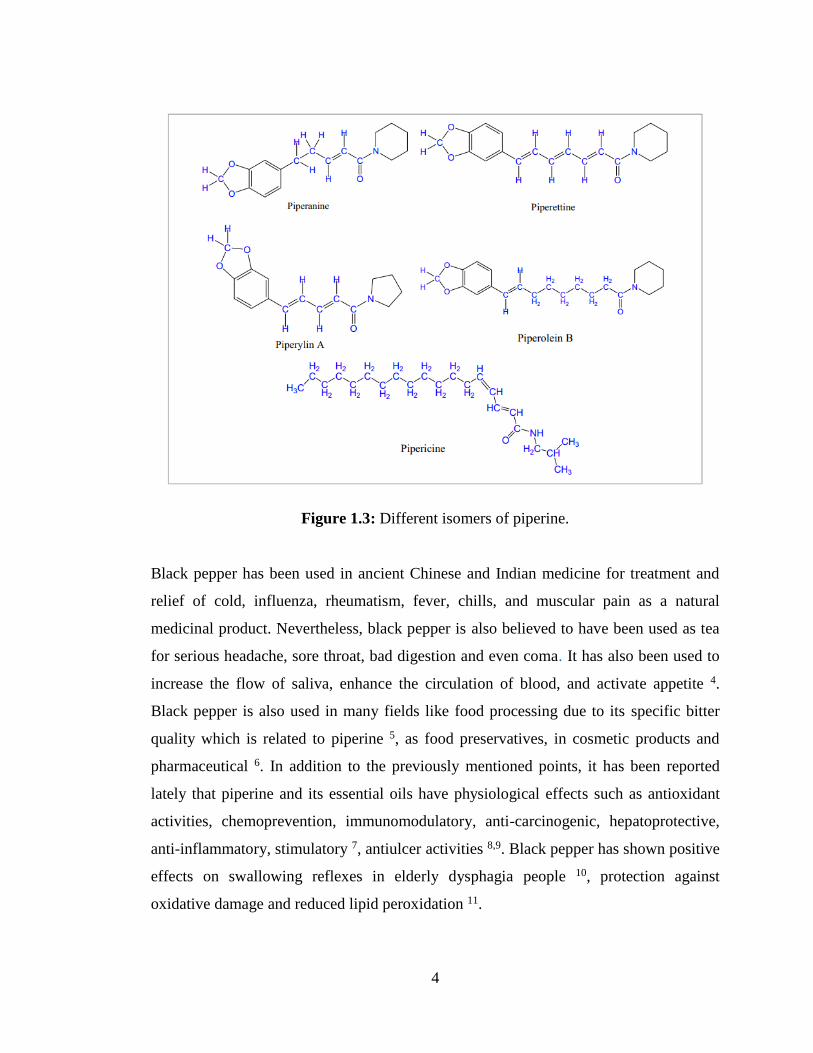
addition of CO2. The process for forming SPS is shown in Figure 1.10.
13
Figure 1.10: Process for formation of SPS.
The most common solvents tested for SPS behavior are amines, amidines and
guanidines. However, it should be noted that not all classes of these solvents have this
property. In addition, amidines are expensive, not easily found in nature and are difficult
to synthesize 40,41. A list of amines, amidine and guanidines tested for their SPS behavior
is shown in Table 1.1.

14
Table 1.1: Design and evaluation of switchable-polarity solvents.
Behavior Compound
Ratio of
compound to
water (v:v)
LogKow pKa
Monophasic Triethanolamine 1:1 -1.51 7.85
Monophasic N,N,N′,N′-Tetramethylethylenediamine 1:1 0.21 9.2
Monophasic N,N,N′,N′-Tetramethylguanidine 2:1 0.30 13.6
Monophasic N-Ethylmorpholine 1:1 0.30 7.70
Monophasic 1,8-Diazabicycloundec-7-ene 2:1 1.73 12
Monophasic N-Hexyl-N′,N′-dimethylacetamidine 2:1 2.94 12
Irreversible N″-Hexyl-N,N,N′,N′-tetramethylguanidine 2:1 2.82 13.6
Irreversible N″-Butyl-N,N,N′,N′-tetraethylguanidine 2:1 3.52 13.6
Irreversible N″-Hexyl-N,N,N′,N′-tetraethylguanidine 2:1 4.43 13.6
Switchable Triethylamine 1:1 1.47 10.7
Switchable N,N-Dimethylbutylamine 1:1 1.60 10.0
Switchable N-Ethylpiperidine 1:1 1.75 10.5
Switchable N-Methyldipropylamine 1:1 1.96 10.4
Switchable N,N-Dimethylcyclohexylamine 1:1 2.04 10.5
Switchable N-Butylpyrrolidine 1:1 2.15 10.4
Switchable N,N-Diethylbutylamine 1:1 2.37 10.5
Switchable N,N-Dimethylhexylamine 1:1 2.51 10.2
Switchable N,N,N′-Tripropylbutanamidine 2:1 4.20 12.0
Switchable N,N,N′-Tributylpentanamidine 2:1 5.99 12.0
Biphasic N,N-Dimethylaniline 1:1 2.11 5.1
Biphasic N,N-Diisopropylethylamine 1:1 2.28 11.0
Biphasic Tripropylamine 1:1 2.83 10.7
Biphasic N″-Hexyl-N,N,N′,N′-tetrabutylguanidine 2:1 7.91 13.6
Biphasic Trioctylamine 1:1 9.45 10.9
It can be seen in Table 1.1 that some of guanidines form monophasic systems with
water (e.g., N,N,N′ ,N′ -Tetramethylguanidine), while others irreversibly form
monophasic systems with water after adding CO2 and cannot return back to biphasic
under every known condition because they are highly basic (e.g., N″-hexyl-N,N,N′,N

15
′-tetramethylguanidine). Other solvents such as tripropylamine remain as biphasic with
water. It can be concluded From Table 1.1 that some solvents such as triethylamine and
N,N-dimethylcyclohexylamine can form switchable systems with water at 1:1 (v:v) ratio.
It was reported that secondary amines are faster than tertiary amines in terms of the
formation of monophasic but they require higher energy and temperature to remove CO2
to switch to biphasic which was thought to be due to the formation of ammonium
carbamate in the solution 42. On the other hand, tertiary amines require much less energy
to remove CO2 from ammonium bicarbonate solution. Hence, using secondary amine as
SPS is more energy exhaustive than tertiary amines making them less favorable for this
purpose.
By determining the log of octanol/water (𝑙𝑜𝑔𝑃𝑜/𝑤) partition coefficient and their log of
ionization constant (𝑝𝐾𝑎), the choice of the solvent will be easier. Amines should have
(𝑙𝑜𝑔𝑃𝑜/𝑤) between 1.5-2.5 because with the lower their (𝑙𝑜𝑔𝑃𝑜/𝑤), the most polar they
are and the easier they would form monophasic with water. On the contrary, the higher
(𝑙𝑜𝑔𝑃𝑜/𝑤), the lower the polarity of the solvent and the more difficult, it would form
biphasic with water even with the addition of CO2 to the mixture. In addition, amines
should have (𝑝𝐾𝑎) higher than 9.5 because below this value, the basicity is not enough to
react with carbonated water in order to switch its form.
The separation of the SPS from a homogenous mixture does not need any special
equipment. However, there are many physical and chemical methods that have been also
tried for phase separation as shown in Figure 1.11. Most of these methods are not
favorable due to low recovery and possible loss of the analyte(s) 42. The addition of
sodium hydroxide has been reported to provide good and rapid phase separation and
high recovery of the SPS 43.

16
Figure 1.11: Chemical and physical methods for phase separation.
The ability of using CO2 to switch the properties of a medium provides an extra
important advantage of the method, the design of eco-efficient approach. The low cost
and non-toxic nature of CO2 make it a perfect transition phase in extraction techniques.
Another fascinating advantage of using SPS is their ability to provide infinite contact
between the extraction phase and the analyte due to its complete homogeneity with the
sample solution. Hence, there is no need for disperser solvents which are one of the
drawback of DLLME. Moreover, since switching the SPS is instantaneous upon the
addition of a strong base, phase separation can be obtained without the need for
centrifugation. Such solvents used for SPS are themselves green solvents 44,45. Based on
such superior advantages, it is so obvious that the application of SPS in microextraction
context has a high potential and would gain high interest among analytical chemists and
in other fields as well.

17
In large-scale applications, SPS have been used to extract bitumen from oil sands 46, soy
oil from crushed soybeans 47, phenols as a mixture from the lignin microwave-pyrolysis
oil 39, polycyclic aromatic structures-enriched portion from direct coal liquefaction
residue 48, and Lipids from algal biomass 49,50.
Few publications have suggested the used of SPS for microextraction. Some applications
include the extraction of aluminum from biological sample and its determination by
flame atomic absorption spectrometry (FAAS) 51, cadmium ions in baby food by FAAS
52, uranium in water, sediment, soil and rock samples by UV-vis spectrophotometry 53,
lead in fresh and waste water samples by FAAS 54, cadmium in water, vegetable, fruit
and cigarette samples by FAAS 43, mercury in water and hair samples by UV-vis
spectrophotometry 55, and copper in water, food and hair samples by FAAS 56.
To the best of our knowledge, this is the first report on the applications of SPS-LPME
prior to HPLC for the determination of molecular analysis.
1.5 High-Performance Liquid Chromatography (HPLC)
High-performance liquid chromatography started in the early 20th century. The basic
study started in the early 1940s by Martin and Synge. But, progress in this field did not
take place until the 1960s after scientists found out that better separation could be
obtained by reducing the inner diameter, decreasing the size of the packing materials,
afterward increasing the flow rate of the mobile phase which led up to increase in the
pressure. Then, the separation time decreased at the same time with corresponding
increase in resolution, leading to the necessity to use high-performance (pressure) liquid
chromatography. HPLC instrument is shown in Figure 1.12.

18
Figure 1.12: HPLC instrument.
HPLC is a separation technique using a liquid phase that pass through a porous
stationary phase. The liquid and the stationary phases should be compatible with the
sample components so that the sample can equilibrate between them and spend a
considerable residence time in both. Distribution of the analyte between these two
phases can be considered as distribution coefficient (K) as shown in Equation 1.1:
Equation
1.1
HPLC is an active analytical method, an important preparative separation technique with
high recognition due to high reproducibility, high accuracy, applicability to a wide range
of substances, appropriateness with many detectors like UV-VIS, fluorescence,
electrochemical, mass spectrometry, and others. HPLC has rapidly developed into an
innovative, fast and highly selective analytical tool with widely distributed application in

19
biology, chemical engineering, food, pharmaceuticals, petrochemical industries and
environment protection.
The porous stationary phase is the heart of HPLC because the mobile phase passing
through the stationary phase is a fundamental merit of the chromatographic process.
Mass transfer of the solute molecules should swap between the mobile phase and the
stationary phase fast and frequently, to obtain equilibrium of solutes in the
chromatographic system and to gain a high column efficiency. Also, there are many
properties that should be considered in the stationary phase to provide fast mass transfer
kinetics. First, the diffusion distances in the stationary phase must be small. Secondly,
the surface area between the stationary phase and the mobile phase must be large.
HPLC requires continuous evolution of its part including injectors, pumps, detection
units, processors, data recorders, mobile phases and stationary phases. In addition, the
development of HPLC separation modes which include normal-phase (NP), reversed-
phase (RP), ion-exchange (IE) and size-exclusion (SE).
The choice of the mode of liquid chromatography depends on the molecular weight of
the analyte and its polarity according to the schematic diagram shown in Figure 1.13.

20
Figure 1.13: Schematic diagram of liquid chromatography modes.
There are three packing materials in HPLC, inorganic, organic and inorganic-organic
hybrid with different particles size and inner diameter, as shown in Figure 1.14.
Figure 1.14: Different particles size and inner diameter of the column chromatography
prepared (a) 250 µm; (b) 100 µm; (c) 75 µm; and 50 µm fused silica.

21
The most widely used modes of HPLC are NP and RP. In NP, the stationary phase is
polar such as silica gel, or silica cores bonded to functional groups like cyano, amino
and diol. Mobile phases used in NP are non-polar solvents such as hexane, cyclohexane,
heptane etc. In RP, the stationary phase is non-polar like alkyl group chains bonded to
silica cores called octadecyl silica gel (ODS) with different length C8 or C18 and mobile
phases are polar like water, methanol, ethanol, acetonitrile, acetone, tetrahydrofuran, etc.
Choosing the mode depends on the polarity of the analyte. By knowing
partition coefficient (𝑙𝑜𝑔𝑃) of the analyte, a chromatographer can decide on the correct
choice of the mode.
𝑙𝑜𝑔𝑃 is the ratio of the concentration of the analyte between two immiscible liquids,
generally octanol and water, between which an equilibrium for the analyte takes place,
The logarithm of this ratio is referred to as 𝑙𝑜𝑔𝑃 or 𝑙𝑜𝑔𝑃𝑜/𝑤 (Equation 1.2).
𝑙𝑜𝑔𝑃𝑜/𝑤 = 𝑙𝑜𝑔[𝑎𝑛𝑎𝑙𝑦𝑡𝑒]𝑂𝑐𝑡𝑎𝑛𝑜𝑙
[𝑎𝑛𝑎𝑙𝑦𝑡𝑒]𝑊𝑎𝑡𝑒𝑟 Equation 1.2
Silica is the most widely used inorganic packing material for stationary phase in HPLC.
Due to its monodispersing property, which means that it contains a uniform particles
size, modifiable surface, surface area and pore diameter, controllable porosity, high
mechanical strength and good chromatographic efficiency. Limitations of using silica,
nevertheless, exist like instability at low pH below 2 where silica starts to dissolve and at
higher pH than 8, where it starts to crack and lose its bonded phase 57.
By using organic packing materials, which can resist severe pH, but suffer from extreme
swelling, mechanical stability can be low and disappointing chromatographic
performance might be observed. Inorganic-organic hybrid materials have both inorganic
and organic composition characteristics. They possess improved thermal and chemical
stability but they are vulnerable to hydrolysis and dissolution of the silyl-ether bond in
an alkaline mobile phase 58.

22
RP is the most commonly used stationary phases because of their stability and high
chromatographic efficiency that can be obtained due to their fast mass transfer effects 59.
In addition to their applicability to a wide range of analytes and samples, less or non-
toxicity of the mobile phases are applied in this mode as compared to mobile phases are
used in NP.
Moreover, the hydraulic resistance of the stationary phase to the flow of mobile phase
should be average, because the length of the column will be limited that can be used
with a given pumping system due to high hydraulic resistance.
Mikhail Tswett used a column packed with fine particles. He understood the idea of
using fine particles to obtain better separation. But in return, decreasing the particle size
resulted in slower mobile phase velocity, which was a serious disadvantage, especially,
due to the absence of a pump in that era; the flow of the mobile phase was forced by
gravity 60.
For about a century after this invention, all the chromatographic packing materials used
were fine particles. Until the late 1960s, column chromatography was carried out by
passing the mobile phase through the stationary phase under gravitational force. But, this
progress prevented the accomplishment of neither fast separations nor high efficiency
because the particles size of the stationary phase could not get smaller and the length of
the column was limited. The characteristics that have been successfully developed in the
late 1950s were gas chromatography, control of flow rate, on-line detection, pressurized
mobile phase and expanded to column chromatography and HPLC. This is due to the
availability of the dependable pumps that could deliver any solvent used as the mobile
phase at a constant flow rate, under pressures up to 400-500 bar. This type of pumps did
not cause any problems, their mechanism was straightforward and their maintenance
was easy and not costly. Difficulties started with high-pressure pumps (above 500 bar)
which were complicated and more expensive.

23
When fast analysis is required, there are some other possible choices, one of which is the
column temperature. Temperature is an essential factor that clearly affects the viscosity
of the mobile phase. By increasing the temperature, the viscosity of the mobile phase
decreases, which increase the velocity. Column efficiency is hardly affected, so the same
resolution will be obtained with faster separation 61.
The most important basic concepts in HPLC used to characterize and determine the
chromatographic behavior include these four main terms: retention (or capacity factor),
selectivity, efficiency and resolution. The capacity and selectivity can be controlled by
the column manufacturer. However, efficiency and resolution can be controlled by the
chromatographer. To minimize band broadening, the chromatographic system should be
optimized.
1.5.1 Retention factor (𝒌′)
To obtain an efficient separation, the column should be able to retain the analyte and
separate the other components of the sample. The capacity factor (𝑘′) can be defined as
in Equation 1.3:
𝑘′ =𝑡𝑅 − 𝑡𝑀
𝑡𝑀 Equation 1.3
where,
𝑡𝑅 is the retention time of the analyte (i.e., the time consumed by the sample to reach the
detector) and 𝑡𝑀 is the retention time of an unretained species.
The larger the retention factor, the higher the ability of the column to retain analytes
which will improve the resolution of the separation because it is given longer analysis
time that should be optimized with the resolution. An ideal value for 𝑘′ would fall
between 5 and 7, illustrating a good balance between analysis time and resolution.

24
However, a value for 𝑘′ would falling between 3 and 10 is, for many separations,
acceptable. 𝑘′ can be controlled by changing the mobile phase composition, pH, buffer
concentration or column temperature.
1.5.2 Selectivity (∝)
The selectivity factor (∝) of a column is defined as the degree of separation between
successive peaks (generally called as critical pair). For the two species A and B, α can be
defined as in Equation 1.4:
∝=𝑘𝐵
′
𝑘𝐴′ =
(𝑡𝑅)𝐵 − 𝑡𝑀
(𝑡𝑅)𝐴 − 𝑡𝑀 Equation 1.4
where,
𝑘𝐴′ and 𝑘𝐵
′ are the retention factors of A and B, respectively.
When 𝛼 = 1, the first peak appeared in the dead volume, or the retention time of the
two compounds, A and B, are equal [i.e., (𝑡𝑅)𝐴 = (𝑡𝑅)𝐵 ], resulting in a complete
overlap of the critical pair. Selectivity can be controlled by changing the mobile phase
identity or changing the column.
1.5.3 Efficiency (𝑵)
Theoretical plate number (𝑁) is an index that indicates column efficiency. It describes
the number of plates as defined according to plate theory, and can be used to determine
column efficiency based on calculation in which the larger the theoretical plate number,
the sharper the peaks. The theoretical plate number (𝑁) is included as a numerical value

25
in column instruction manuals and inspection reports. The theoretical plate number is
represented by Equation 1.5.
𝑁 =𝐿
𝐻 Equation 1.5
where,
𝐿 is the column length (usually in centimeters) and 𝐻 is the plate height.
Efficiency can be practically calculated from a chromatogram using Equation 1.6:
𝑁 = 16 (𝑡𝑅
𝑊)
2
Equation 1.6
𝑁 can be controlled by optimizing the flow rate.
1.5.4 Resolution (𝑹𝒔)
Resolution (𝑅𝑠) is used to express the degree of separation between two critical peaks. It
is affected by the retention factor (𝑘′), selectivity (𝛼) and efficiency (𝑁) of the column
as shown in Figure 1.15.

26
Figure 1.15: Effect of efficiency, retention factor and selectivity on resolution.
The relationship between the resolution and these separation factors can be described by
Equation 1.7:
Equation 1.7
(i) (ii) (iii)
The value of 𝑅𝑠 should be larger than 1.5 (baseline resolution) to obtain a precise and
accurate quantification of two peaks with minimum peak overlapping. Increasing the
selectivity has the highest effect on resolution. On the other hand, increasing the
retention factor up to 10 has a significant effect on resolution, beyond which less effect
is observed. Increasing efficiency would always improve resolution (Figure 1.15).
Optimum resolution can be obtained within the shortest time using a systematic
approach such as the one summarized in Figure 1.16.

27
Figure 1.16: Systematic approach to HPLC separations.
A strategy or an approach to the design of this HPLC assay can be broken down into the
following six steps:
1. Selecting an HPLC methodology,
2. Selecting an HPLC column,
3. Selecting initial experimental conditions,
4. Carrying out an initial separation,
5. Evaluating the initial chromatogram and determining what change in resolution
is required,
6. Establishing conditions required for the necessary final resolution.
Equation 1.7 is a fundamental relationship in HPLC, which allows a chromatographer
to control resolution (𝑅𝑠) by varying 𝑘𝑎𝑣′ , 𝑁 and ∝, where 𝑘𝑎𝑣
′ is the average of retention
factors of a critical pair, 𝑁 is the number of theoretical plates (efficiency) and ∝ is the

28
selectivity factor. The three terms (i), (ii) and (iii) of the equation are essentially
independent, so that one term can be optimized first then another.
1.5.5 Mode of elution in HPLC
After separation of the sample components due to different adsorption to the stationary
phase and different solubilities in the mobile phase, elution of separate bands of the
analytes is the next step. There are two modes of elution in chromatography depending
on the composition of the mobile phase. Isocratic elution is used when the sample is
injected and eluted from the column without changing the mobile phase composition
during the chromatographic run. It is mostly used when the sample components are
relatively similar to the stationary phase and can be eluted one by one quickly. The other
mode, called gradient elution, involves a gradual change of the mobile phase
composition during the run until the separation of sample components is accomplished.
It is mostly used in RP chromatography and also used with compounds which are
different from stationary phase. The gradient elution can be binary gradient which is
made of two different solvents or ternary that is made of three different solvents and
quaternary which contain four different solvents. The effect of gradient elution in
solving the “general elution problem” namely, long analysis time and poor resolution, is
shown in Figure 1.17.

29
Figure 1.17: Isocratic and gradient elution.
The main instrumental components of HPLC are:
1. Solvent reservoirs that contain the mobile phase which is also connected to the
degassing system. The gradient system has a minimum of two solvent reservoirs,
while isocratic has just one solvent reservoir.
2. A pump to deliver the mobile phase and the sample through the instrument.
3. Injector which is used to introduce the sample to the instrument. An auto-sampler
with variable volumes (0.1-100) µL can operate unattended, or manual injector
with fixed volume with different loop volumes can be used. It means that when
the volume needs to be changed the loop should be changed also with the desired
volume.
4. A column that is used to separate the analyte. There are two types of columns:
guard and analytical columns.

30
5. Another HPLC accessory is column oven which is used to adjust the temperature
(generally between 4 and 80 °C).
6. A detector to visualize the separated sample components. Some common
detectors include diode array detectors (DAD), refractive index, fluorescence
detectors and mass spectrometers, etc.
7. A waste bottle is needed which contains the mobile phase and the eluted
analytes.
8. Data processors are used to store and analyze the results 62.
1.6 Nuclear Magnetic Resonance Spectroscopy (NMR)
Nuclear magnetic resonance (NMR) is used for determining the structure of organic
compounds. It depends on the interaction between the magnetic moments of the nuclei
of different atoms and the magnetic fields. The magnetic moment of a nuclear related to
the nuclear spin relies on the nucleus spin number and its properties. The nuclei with an
even number of protons and neutrons will have zero nuclear spin and magnetic moment.
While the nuclei with an odd number of protons and neutrons will have non-zero spin
and magnetic moment. Some of the nuclei that have odd number of protons and neutrons
are 1H, 13C, 15N and 31P having the spin number of 1/2, which is used in many
applications of magnetic resonance 61,63.
Electronegativity of the surrounding atoms affects the shielding of the magnetic field
which in turn affects the absorption. The signal of NMR is also affected by many factors
as follows: the number of signals that presents how many different kinds of protons are
there, the location illustrates the shielded and de-shielded protons, the intensity shows
the number of protons of the same type, and splitting which shows the number of
protons on adjacent atoms.

31
1.7 Column Chromatography
There are two types of columns in chromatography: ready-to-use-pre-packed columns
which are filled with the bulk from the manufacturer and columns that are packed by the
user. Pre-packed columns can be of disposable and non-disposable designs; disposable
columns should be simple, easy-to-manufacturer and should be made of economical
materials like polypropylene. This type cannot be re-packed again when column period
is over, it should be discarded. Non-disposable columns are made of glass walls and
high-grade materials can be re-packed with different stationary phase by the user 64.
1.8 Literature Review
In the literature there are many extraction and analytical methods that have been used to
extract and analyze piperine from different pepper berries, which include; UV
spectroscopy 65, capillary electrochromatography 66, NMR 9,67, microliquid
chromatography 68, liquid chromatography/mass spectrometry (LC/MS) 69, among other
techniques.
Friedman et al. used 2 mL of 80% ethanol as the extraction solvent for piperine and the
extraction time was 60 min using sonication and 10 min for centrifugation at 12000 rpm
at 5ºC. Then, 20 µL from the supernatant was injected into HPLC. For the separation,
the authors used a gradient system with a mobile phase of ACN/H2O acidified with 0.5%
formic acid. The gradient started from 31% to 55% ACN for 70 min at a flow rate of 1
mL min-1 70.
Kozukue et al. used isocratic elution for the separation of piperine by HPLC with
(30/70%) ACN/H2O acidified with 0.5% formic acid at a flow rate of 0.8 mL min-1 71.
Piperine has also been extracted with Soxhlet extractor using diethyl ether for 20 h.
HPLC was used for the separation; the piperine extract was dissolved in 20 mL

32
methanol and filtered before being injected into HPLC with different mobile phase
compositions starting with doubly-distilled water, (50/50) methanol-water, (80/20)
methanol-water, and (50/50) methanol-water 72.
1.9 Aim of This Study
The aim of this study is to develop an extraction method which is simple, fast, efficient
and green to be combined with HPLC for the determination of piperine in black and
white pepper in addition to other important requirements: preconcentration, minimizing
the use of toxic solvent, sample clean-up and an efficient separation of the piperine
without and interference from the other matrix components.
To the best of our knowledge, this is the first report on development of SPS-LLME prior
to HPLC for the determination of piperine in black and white pepper and the first use of
scaled-up DLLME for the isolation of piperine standard.
1.10 Future Work
In the near future, the developed SPS-LLME will be applied to other types of analytes of
analytical, pharmaceutical, environmental and industrial interest in related matrices.
Experimental parameters affecting the extraction method which are thought to enhance
the preconcentration and extraction efficiency will be further studied and understood.

33
2 CHAPTER 2: EXPERIMENTAL
CHAPTER 2
EXPERIMENTAL
2.1 Instrumentation
Chromatographic separations were carried out by an Agilent 1200 series HPLC system
(USA) equipped with quaternary pump, vacuum degasser, autosampler, column oven,
DAD detector and Agilent ChemStation for LC 3D Systems (Rev. B.03.01) software.
The column used in the separation was a reversed-phase (Agilent Eclipse XDB-C18. 4.6
mm ID x 150 mm, 5 µm). An electronic balance (Mettler Toledo) was used for accurate
weighing of solid samples and piperine standard.
Isolation of piperine was carried out by using column chromatography packed with (100
g) silica gel. TLC Silica gel 60 F254 (20 × 20 𝑐𝑚) from Merck. TLC chamber from
CAMAG was used for monitoring the spots on the plate.
Structural determination of piperine was done with FT-NMR (1H 400 MHz, 13C 100
MHz) from Varian Mercury Agilent (USA) at Prince Sattam bin Abdulaziz University
by Prof. Dr. Hasan Abou Gazar (Yusufoğlu), who is acknowledged for this support.
Tetramethylsilane (TMS) was used as the internal standard. CDCl3 was used as the
solvent for dissolving the crystals of piperine.
2.2 Reagents and Solutions
HPLC-grade acetonitrile, sodium chloride, trimethylamine, dimethylcyclohaxylamine,
sodium hydroxide and vanillin were acquired from Sigma-Aldrich (Germany). Toluene,
ethyl acetate and acetic acid were acquired from Riedel- de haën (Germany). Sulfuric
acid was acquired from Fluka (USA).

34
2.3 Apparatus
Heater and UV lamp from CAMAG, and a rotary evaporator from BÜCHI (rotavapor R-
210) was used for evaporating the fractions to dryness. Hettich Eba 20 centrifuge
(Germany), Binder oven (USA), Eppendorf micropipette of different volumes from
Sigma-Aldrich (USA) and tips from ISOLAB laborgeräte GmbH were used. A solvent
filtration system (BORU CAM 1000 mL) and Whatman filters (0.45 µm and 0.2 µm),
were used for filtering deionized water (DI). A coffee grinder from Sinbo (model SCM
2927, P.R.C) was used for blending black and white pepper samples. Ultrasound and
water bath were from ISOLAB laborgeräte GmbH (Germany). Vortex machine was
from Heidolph Reax. A refrigerator from Blomberg was used for preserving samples and
standards until analysis.
2.4 Sampling and Sample Pre-treatment
Seven samples of black pepper from different origins (i.e., Brazil, India, Pakistan, Sri
Lanka, UK and Vietnam) and one sample of white pepper (Jamaica) were purchased
from local markets in Cyprus, Kuwait, Saudi Arabia and Pakistan.
2.4.1 Sampling Blending
Using the grinder, each sample was blended and homogenized into fine powder and
stored in a well-sealed glass bottles till analysis.
2.4.2 Solid-Liquid Extraction
A portion of the fine powder (0.1 ± 0.01 g) was transferred into a 15-mL falcon tube
and 5.0 mL of 50/50 (%v/v) ACN/H2O were added. This mixture was vortexed for 1
min, centrifuged for 2 min and filtered through a cotton wool.

35
2.4.3 Salting-out extraction (SOE)
The filtered solution was transferred into another falcon tube and 3.0 mL of saturated
NaCl were added. The mixture was vortexed for 1 min and centrifuged for 2 min at 6000
rpm. Approximately, 500 µL of ACN salted out, 50.0 µL of which were used for SPS-
LLME.
2.4.4 SPS-LLME
50 µL of the extract were transferred into a falcon tube and made up to 4.0 mL with DI
water, 1.5 mL of the SPS were added to the solution and the mixture was vortexed for 10
s. Then, 1.0 mL of 20 M NaOH was added and vortexed for 10 s. Approximately, 600
µL of SPS floated at the surface, all of which were transferred into a microvial and
completed to 1.0 mL with the mobile phase. The mixture was vortexed for 10 s before
being injected into HPLC. A schematic diagram of the extraction procedure is shown in
Figure 2.1.
Figure 2.1: SPS-LLME procedure.

36
2.5 Extraction and Isolation of Piperine from Black Pepper
Black pepper (70 g) were blended into fine powder using the coffee blender. The powder
was transferred into a 1000 mL volumetric flask and 700 mL of 50:50 ACN/H2O were
added. The mixture was placed in the ultrasound bath for 10 min, then it was filtered and
centrifuged for 2 min. The supernatant was used for SOE.
2.5.1 Salting-out extraction (SOE)
The solution was transferred into a separatory funnel as shown in Figure 2.2. Saturated
NaCl (420 mL) was added and the mixture was shaken for few seconds. A small amount
of NaCl (approx. 5 g) was added to the mixture and it was shaken again until it became
saturated with NaCl. Then, 3 mL of 20 M NaOH were added and allowed to stand on a
retort stand until phase separation between aqueous and ACN layers occur. The ACN
layer was transferred into a beaker and was ready to be used as the disperser solvent in
the scaled-up DLLME.
Figure 2.2: Salting-out extraction

37
2.5.2 Scaled-up DLLME
ACN (140 mL) was transferred into a 1000 mL measuring cylinder and 23 mL of
chloroform (CF) were added; 583 mL with DI water and 59 mL of 1.0 M NaOH were
added to the solution. The mixture was transferred into a beaker, placed in the
ultrasound bath for 10 min and centrifuged in portions for 2 min at 6000 rpm. CF which
sedimented at the bottom was collected (approx. 15 mL) (Figure 2.3), and was analyzed
using HPLC before continuing with the isolation procedure.
Figure 2.3: Collected CF from scaled-up DLLME.
2.5.3 Preparation of piperine for isolation by column chromatography
The final CF extract from DLLME was evaporated by rotary evaporator at 43 ºC,
starting with 443 mbar and reducing the pressure until all the CF evaporated after about
an hour as shown in Figure 2.4. The collected solid residue was 2.76 𝑔 (Figure 2.5),
some of it was re-dissolved in a small volume of 7:3 (%v/v) toluene:EtOAC which was
checked with TLC (Figure 2.6) and used as a reference sample as all the procedure is
shown in Figure 2.7.

38
Figure 2.4: Evaporation of CF by rotary evaporator.
Figure 2.5: The collected crude solid residue.

39
Figure 2.6: TLC with toluene: ethyl acetate 70/30 (%v/v).
Figure 2.7: Extraction and Isolation of Piperine from Black Pepper.

40
2.5.4 Column chromatography
The column had been prepared by dissolving 100 g of silica gel in 100 mL toluene:ethyl
acetate (90:10), packed into the column and covered up with cotton wool to obtain fixed
sample zone. After making sure that there were no air bubbles trapped inside the column
during the packing step, the solid residue, that had been dissolved in an appropriate
amount of the mobile phase toluene:ethyl acetate (90:10), was loaded into the column.
Gradient elution started from 90:10 until 60:40 toluene:ethyl acetate was performed and
130 fractions were collected.
TLC and HPLC were used to analyze the fractions. The fractions which were similar
(46-51) and (52-63) that were thought to contain piperine were collected separately, each
in a pre-weighed round bottom flask and the solvent was evaporated (toluene:ethyl
acetate) by rotary evaporator. The weight of the final extract was 800 mg for the 46-51
fractions and 999.6 mg for 52-63 fractions. After a while, this extract started to
crystalize by itself probably because of high concentration of piperine as shown in
Figure 2.8. An appropriate amount of these crystals was sent for structural
characterization by NMR.
Figure 2.8: Crystallization of piperine.

41
3 CHAPTER 3: RESULTS AND DISCUSSION
CHAPTER 3
RESULTS AND DISCUSSION
3.1 Selection of Maximum Absorption Wavelength (λmax)
Choosing λmax is an essential and an important step which helps to eliminate the errors
and to improve the selectivity and sensitivity of the determination. The first choice of
λmax can be based on literature, where it was mentioned that maximum absorption of
piperine is 343 nm 4. However, from the absorption profile of piperine obtained in our
experiment (Figure 3.1), and with the help of 3D plot (Figure 3.2), 346 nm was chosen
as optimum.
Figure 3.1: Absorption profile of piperine.

42
Figure 3.2: 3D Plot of piperine standard.
3.2 Optimization of Extraction Methods
3.2.1 Optimization of extraction parameters
In the solid-liquid extraction of piperine from black pepper, ACN was used as the
extraction solvent due to its intermediate polarity. This choice was applied after
checking the polarity of piperine and it turned out that piperine had an intermediate
polarity, as also indicated by its log 𝑃 (Figure 3.3).

43
Figure 3.3: 𝐥𝐨𝐠 𝑷 of piperine.
Accordingly, ACN/H2O (50/50%) was used for extracting piperine from the solid
sample with the help of vortex mixing. Upon centrifugation, phase separation was made
possible through SOE.
3.2.2 Switchable-polarity-solvent liquid-liquid microextraction (SPS-LLME)
SPS based on TEA have an intermediate polarity (Figure 3.4). Hence, they are suitable
for extraction of intermediate-polarity analytes.
Figure 3.4: 𝐥𝐨𝐠 𝑷 of triethylamine.
Apart from the polarity of piperine, it is important to examine the different forms it has
at different pH ranges. Piperine is present in its neutral (non-ionized) form within a wide
range of pH (i.e., from 4.8 and above). It can be ionized in very acidic media at pH
values below 4.8 (Figure 3.5). Therefore, since the apparent pH of the sample solution

44
obtained after SOE is about 7, piperine is present in its neutral form, changing the pH of
the solution was not necessary.
Figure 3.5: Microspecies distribution of piperine.
Phase separation was achieved by adding 20 M NaOH to the solution. By doing so, the
SPS was made immiscible with the aqueous sample solution and it floated on the
surface.
3.3 Optimization of HPLC Conditions
Chromatographic system was optimized in order to obtain high selectivity, sensitivity,
efficiency and resolution in addition to minimizing broad broadening and/or overlap
with other sample components.

45
3.3.1 Type of the mobile phase
The mobile phase composition is a very important parameter in HPLC. There were three
possible options for organic solvents in the mobile phase, MeOH, ACN and THF. From
the Snyder Polarity Index of the three solvent as shown in Figure 3.6. ACN has a
polarity of 6.2, which is intermediate compared to the two other polarities of MeOH
( 𝑃 = 6.6 ) and THF ( 𝑃 = 4.2 ). Hence, ACN/H2O was chosen as a starting point,
considering that the analyte has intermediate polarity too. Moreover, ACN has low back
pressure as shown in Figure 3.7 due to its low viscosity and UV cut off as compared to
MeOH and THF, which would result into lower noise in the UV region as shown in
Figure 3.8. Hence, ACN was the solvent of choice for the mobile phase.
Figure 3.6: Snyder solvent polarity index.

46
Figure 3.7: Relationship between organic solvent mixture ratio and back pressure of the
column.
Figure 3.8: UV absorption spectrum of: (a) acetonitrile and (b) methanol reagents.

47
3.3.2 Optimization of the mobile phase composition
Mobile phase compositions that were considered for examining the effect of mobile
phase composition included; 40, 42.5, 45, 47.5 and 50% ACN in water (%, 𝑣/𝑣). By
increasing the volume of ACN in the mobile phase, the retention time of piperine
decreased, which was due to decrease in the polarity of the mobile phase. However, 45%
ACN was chosen for this work (Figure 3.9) because 𝑘𝑎𝑣′ for the three peaks, including
piperine, was within the ideal range of 5 to 7, and the retention time was also acceptable
(within 10 min).
Figure 3.9: Optimization of the mobile phase composition.
Conditions: Extraction solvent: TEA; Volume of extraction solvent: 1500 µL; Volume of DI water: 4.0 mL; Volume
of NaOH: 1.0 mL; Extraction time: 10 s.
3.3.3 Effect of adding acetic acid as a modifier in the mobile phase
Effect of adding different concentrations of acetic acid to the mobile phase starting from
0 to 1.0%, was examined through concentration intervals of 0.25%, going no further
than 1% because high concentration of the acid in the mobile phase was thought to
damage the column by dissolving the silica core. As shown in Figure 3.10, the addition
of the acid to the mobile phase did not have any significant improvement. Hence, 0%

48
was chosen; piperine was separated without any overlap with the other compounds that
were present in the sample.
Figure 3.10: Effect of adding acetic acid as a mobile phase modifier.
Conditions: Extraction solvent: TEA; Volume of extraction solvent: 1500 µL; Volume of DI water: 4.0 mL; Volume
of NaOH: 1.0 mL; Extraction time: 10 s.
3.3.4 Optimization of the flow rate
The aim of optimizing the flow rate was to obtain a good separation efficiency that
would ultimately result into good resolution and to reduce the retention time without
overlapping of the analyte peak with those of other components. Optimization started
from 0.8 to 1.4 mL min-1 through 0.1 mL min-1 intervals. It is well known that increasing
the flow rate decreases the retention time and peak areas. Therefore, using corrected
peak area, which is obtained by dividing the peak area over the retention time and
plotting the ratio against the flow rate, was though to better account for the effect of flow
rate. As shown in Figure 3.11, the flow rate had little effect of the corrected peak area.
However, considering the retention time and the column back-pressure, a flow rate of
1.1 mL min-1 was selected as optimum.

49
Figure 3.11: Optimization of the flow rate.
Conditions: Extraction solvent: TEA; Volume of extraction solvent: 1500 µL; Volume of DI water: 4.0 mL; Volume
of NaOH: 1.0 mL; Extraction time: 10 s.
3.4 Optimum HPLC Conditions
Optimum conditions of HPLC are summarized in Table 3.1.
Table 3.1: Optimum HPLC conditions.
Physical
parameters Column
Agilent Eclipse XDB-C18. 4.6 mm ID x 150 mm (5
µm)
Flow Rate 1.1 mL min-1
Temperature Ambient (20 °C)
Detector/wavelength DAD 346 nm (BW 16). Reference: none
Injection volume 5.0 µL
Chemical
parameters Mobile phase ACN:H2O 45:55 (%𝑣/𝑣)

50
3.5 Switchable-Polarity Solvent Liquid-Liquid Microextraction (SPS-LLME)
Optimizing extraction conditions can improve many aspects of the extraction method
such as robustness, extraction efficiency, sensitivity and selectivity. Influential
parameters on SPS-LLME were studied in details and optimized.
3.5.1 Optimization of the type of extraction solvent for SPS-LLME
As discussed earlier (Section 1.4), tertiary amines are preferred as SPS-based
extractions. Dimethylcyclohexylamine (DMCHA) and triethylamine (TEA) were
considered for this purpose. Solvent recovery in both cases was similar. However, when
DMCHA was used splitting or shouldering of the analyte peak occurred, the reason of
which was not well understood. However, using TEA was more adequate and provided
better peak shape and symmetry as well as a higher efficiency as shown in Figure 3.12.
In addition, it gave a higher extraction efficiency (Figure 3.13) and was eventually
chosen as the optimum extraction solvent.
Figure 3.12: Comparison between DMCHA and TEA.

51
Figure 3.13: Selection of extraction solvent.
Conditions: Volume of extraction solvent: 1.0 mL; Volume of DI water: 5.0 mL; Volume of NaOH: 1.0 mL;
Extraction time: 1 min; Centrifugation time: 3 min; Sample introduction: Direct injection. HPLC conditions: as
mentioned in Table 3.1.
3.5.2 Optimization of the volume of TEA
Starting from 500 µL to 2000 µL and increasing the volume by 250 µL, the effect of
volume of the extraction solvent on the extraction efficiency and the enrichment factor
(EF) was examined. Using large volumes of the extraction solvent provided high
recovery of piperine up to some point (i.e., 1500 µL). However, increasing the volume
further started to decrease the EF which was thought to be due to dilution of the analyte
in the solvent.
100 µL as the volume of the extraction solvent was also checked, but the recovery of the
extraction solvent was very low and it was difficult to collect the floated TEA layer.
1500 µL was chosen as the optimum volume of the extraction solvent (Figure 3.14). It
is noteworthy to mention here that this volume of the SPS contained 750 µL of TEA.

52
Figure 3.14: Optimization of the volume of the SPS.
Conditions: Extraction solvent: TEA; Volume of DI water: 5.0 mL; Volume of NaOH: 1.0 mL; Extraction time: 1
min; Centrifugation time: 3 min; Sample introduction: Direct injection. HPLC conditions: as mentioned in Table 3.1.
3.5.3 Optimization of the volume of the deionized water
In LLE or LPME techniques using immiscible liquids, increasing the volume of DI
water (aqueous phase) provides higher surface area between the extraction solvent and
the aqueous layer. However, in SPS-LLME, the surface area between the sample
solution and the extraction solvent is infinite due to the complete miscibility of the
solvent with the aqueous solution. Therefore, increasing the volume of the DI water did
not have effect on the recovery of the piperine (Figure 3.15). In addition, the collected
volume of the extraction solvent after phase separation was constant (i.e., 300 µL).
The volume of DI water was increased starting from 1.0 to 6.0 mL within 1.0 mL
intervals. Hence, 4.0 mL was chosen as an intermediate reasonable volume for the DI
water (Figure 3.15).

53
Figure 3.15: Optimization the volume of DI water.
Conditions: Extraction solvent: TEA; Volume of extraction solvent: 1500 µL; Volume of NaOH: 1.0 mL; Extraction
time: 1 min; Centrifugation time: 3 min; Sample introduction: Direct injection. HPLC conditions: as mentioned in
Table 3.1.
3.5.4 Optimization the volume of the organic modifier
The effect of adding ACN as a modifier in the sample solution was also studied. ACN is
the most commonly used disperser solvent in DLLME. It increases extraction efficiency
by dispersing the organic immiscible solvent into the sample solution, increasing the
surface area of contact and thereby extraction efficiency. Although it had been expected
that the addition of ACN as an organic modifier in SPS-LLME would not have any
effect or might even have a negative effect on extraction efficiency, its effect was
studied by adding 0, 500, 1000, 1500, and 2000 µL of ACN to the sample solution
within 500 µL intervals. Expectedly, peak area decreased by increasing the volume of
ACN. The addition of ACN resulted into decreasing the polarity of the donor solution.
Therefore, the partition equilibrium of the analyte between TEA and the aqueous
solution favored the latter. The optimum recovery for piperine was obtained with no
addition of ACN (Figure 3.16).

54
Figure 3.16: Optimization the volume of the organic modifier.
Conditions: Extraction solvent: TEA; Volume of extraction solvent: 1500 µL; Volume of DI water: 4.0 mL; Volume
of NaOH: 1.0 mL; Extraction time: 1 min; Centrifugation time: 3 min; Sample introduction: Direct injection. HPLC
conditions: as mentioned in Table 3.1.
3.5.5 Optimization of the ionic strength
Generally, increasing the ionic strength the donor aqueous solution via addition of a salt
increases the polarity of the solution and results in higher recovery of nonpolar analytes
throughout salting-out. In other words, the solubility of hydrophobic analytes would be
reduced in the aqueous solution. In some cases, however, no effect or even converse
effect has been observed do to other physicochemical properties such as surface tension.
The concentration of NaCl in the donor solution was increased from 0 to 5 (% w/v)
within 1% intervals through the addition of increasing volumes of a stock NaCl solution.
No effect was observed, probably because addition of small concentrations of the salt
compared to the high concentration of 20 M NaOH added for phase separation had
negligible effect on the ionic strength of the sample solution. Hence, no NaCl was added
in subsequent experiments (Figure 3.17).

55
Figure 3.17: Optimization of the ionic strength.
Conditions: Extraction solvent: TEA; Volume of extraction solvent: 1500 µL; Volume of DI water: 4.0 mL; Volume
of NaOH: 1.0 mL; Extraction time: 1 min; Centrifugation time: 3 min; Sample introduction: Direct injection. HPLC
conditions: as mentioned in Table 3.1.
3.5.6 Optimization of extraction time
Extraction time in SPS-LLME may be defined as the time interval between the addition
of the SPS to the donor solution and the addition of NaOH to cause phase separation.
Extraction time was studied starting from 0 s to 150 s and there was no effect, which
was thought of as being the result of complete miscibility of the extraction solvent was
with the sample solution (Figure 3.18). However, 10 s of extraction time through vortex
mixing was used as an optimum extraction time to ensure better robustness and higher
reproducibility of the method.

56
Figure 3.18: Optimization of the extraction time.
Conditions: Extraction solvent: TEA; Volume of extraction solvent: 1500 µL; Volume of DI water: 4.0 mL; Volume
of NaOH: 1.0 mL; Centrifugation time: 3 min; Sample introduction: Direct injection. HPLC conditions: as mentioned
in Table 3.1.
3.5.7 Optimization of centrifugation time
Centrifugation time used for separating the organic extraction solvent that contain the
analyte from the aqueous solution was increased from 0 min to 4 min and no effect was
observed because adding 20 M of NaOH cause instantaneous phase separation with
constant volume of the SPS via switching off the polarity of the SPS; CO2 was freed
from the structure of the ionic liquid and TEA became completely immiscible again with
the aqueous phase and immediately floated on the surface of the sample solution. No
centrifugation was necessary in further experiments (Figure 3.19).

57
Figure 3.19: Optimization of centrifugation time.
Conditions: Extraction solvent: TEA; Volume of extraction solvent: 1500 µL; Volume of DI water: 4.0 mL; Volume
of NaOH: 1.0 mL; Extraction time: 10 s; Sample introduction: Direct injection. HPLC conditions: as mentioned in
Table 3.1.
3.5.8 Optimization of sample introduction of the final extract into HPLC
Sample introduction to the HPLC is an important step to maintain the life time of the
column, because the solvent in the final extract should be compatible with both the
column and the mobile phase. RP column was used with polar mobile phase, so the final
extract should be miscible with the aqueous mobile phase. Three sample introduction
methods of the final extract into the instrument were considered, namely; back-
extraction, evaporation-to-dryness and direct injection.
In the back-extraction method, 50 mM of acetic acid (HAc) was used as the acceptor
phase. According to the microspecies distribution of piperine, 𝑝𝐾𝑎 is equal to 2.4,
implying that it can be ionized in an acidic medium (Figure 3.20).

58
Figure 3.20: Microspecies distribution form of piperine in the acidic medium.
However, the recovery was very poor, with small peak obtained for piperine. This was
thought to be due to inability of 50 mM HAc to neutralize TEA, a basic solvent itself.
Using high concentration of the acid was considered but was avoided because higher
concentrations would damage the column by dissolving silica gel, so back-extraction
was not suitable.
In the evaporation-to-dryness method, after evaporating the solvent and reconstituting
the analyte in the mobile phase ACN:H2O 45:55 (%𝑣/𝑣), good recovery with “clean”
baseline was obtained. But, the main disadvantages of this method were time
consumption, loss of the analyte during the evaporation and relatively high cost due to
high consumption of nitrogen gas.

59
The third method was to introduce the final extract into HPLC with direct injection of
the final extract, because TEA was miscible with the mobile phase ACN:H2O [45:55
(%𝑣/𝑣]. It is easy, fast and high extraction efficiency of piperine was obtained.
Representative chromatograms obtained with of the three sample introduction methods
are given in Figure 3.21. Direct injection was chosen for the rest of the experiments
(Figure 3.22).
Figure 3.21: Representative chromatograms obtained with of the three sample
introduction methods.
Figure 3.22: Mode of sample introduction.
Conditions: Extraction solvent: TEA; Volume of extraction solvent: 1500 µL; Volume of DI water: 5.0 mL; Volume
of NaOH: 1.0 mL; Extraction time: 10 s. HPLC conditions: as mentioned in Table 3.1.

60
3.6 Optimum SPS-LLME Conditions
The optimum conditions of the SPS-LLME method are summarized in Table 3.2.
Table 3.2: Optimum SPS-LLME conditions.
Extraction solvent Triethylamine (TEA)
Volume of the sample solution 4 mL
Volume of the extraction solvent 1500 µL
Volume of the NaOH 1 mL
Extraction time 10 s
Sample introduction Direct injection
3.7 Calibration, Quantitation and Figures of Merit
The piperine standard isolated at our laboratory was used under optimum RP-HPLC
conditions to plot an aqueous calibration curve. Standards were prepared in the mobile
phase ACN:H2O 45:55 (%𝑣/𝑣), at the concentrations of 100, 250, 375, 400, 500, and
625 mg L-1. As shown in Figure 3.23, coefficient of determination (R2) was 0.9999
within a linear dynamic range between 100 and 625 mg L-1, indicating a good linearity.

61
Figure 3.23: External aqueous calibration graph for piperine
To check for any matrix effect, calculate the concentration and recovery, the developed
method was applied for the extraction of piperine from eight unspiked samples of black
pepper and one white pepper. The samples were also spiked at five levels, 100, 250, 375,
500 and 675 mg L-1 of piperine and standard addition calibration graphs were plotted for
each sample. The slope was different for each sample indicating the presence of matrix
effect. Limits of detection (LOD), based on 3𝑆𝑏/𝑚, where 𝑆𝑏 is the standard deviation
of the blank signal and 𝑚 is the slope of the calibration graph, ranged from 0.4 to 1.2 mg
g-1 and limits of quantitation (LOQ), based on 10𝑆𝑏/𝑚, ranged from 1.3 to 3.9 mg g-1 of
Reproducibility of the method, expressed as percentage relative standard deviation
(%RSD), ranged from 1.2 to 4.7% for intraday and 2.1 to 10.0% for interday precision.
R2 ranged between 0.9950 and 0.9990, whereas, linear dynamic range (LDR) was
obtained between LOQ and 35.0 mg g-1. Figures of merit are summarized in Table 3.3.
y = 27.514x - 34.711R² = 0.9999
0
2000
4000
6000
8000
10000
12000
14000
16000
18000
20000
0 100 200 300 400 500 600 700
Pe
ak
Are
a
Concentration mg L-1

62
Table 3.3: Analytical performance of SPS-LLME-HPLC.
Sample/ origin Regression equation(b) R2
LOD(c)
(mg g-1)
LOQ(d)
(mg g-1)
LDR(e)
(mg g-1)
%RSD(f)
Intraday Interday
Bla
ck
Pooled(a) 𝑦 = 5.0(±0.05)𝑥 − 7356.4(±19.8) 0.9990 0.6 1.9 1.9-35.0 3.1 4.9
Brazil 𝑦 = 0.45(±0.003)𝑥 − 481.1(±1.2) 0.9990 0.4 1.3 1.3-35.0 1.5 2.6
India 𝑦 = 0.69(±0.01)𝑥 − 738.7(±5.3) 0.9960 1.1 3.7 3.7-35.0 2.6 4.0
India 2 𝑦 = 0.62(±0.008)𝑥 − 460.4(±3.16) 0.9980 0.7 2.5 2.5-35.0 4.0 8.1
Pakistan 𝑦 = 0.77(±0.01)𝑥 − 358.9(±4.3) 0.9970 0.8 2.7 2.7-35.0 2.1 3.6
Sri Lanka 𝑦 = 0.8(±0.01)𝑥 − 792.9(±4.9) 0.9975 0.9 3.0 3.0-35.0 4.7 10.0
UK 𝑦 = 1.68(±0.02)𝑥 − 1953.2(±10.9) 0.997 0.9 3.1 3.1-35.0 2.7 4.0
Vietnam 𝑦 = 10.1(±0.14)𝑥 − 5152.8(±56.3) 0.9979 0.8 2.7 2.7-35.0 4.5 9.1
White Jamaica 𝑦 = 0.74(±0.01)𝑥 − 444.3(±5.9) 0.9950 1.2 3.9 3.9-35.0 1.2 2.1
aA pooled sample prepared by mixing equal masses of the seven black pepper samples.
b𝑃𝑒𝑎𝑘 𝑎𝑟𝑒𝑎 = 𝑠𝑙𝑜𝑝𝑒(±𝑆𝐷) × 𝑐𝑜𝑛𝑐𝑒𝑛𝑡𝑟𝑎𝑡𝑖𝑜𝑛(𝑚𝑔 𝑔−1) + 𝑖𝑛𝑡𝑒𝑟𝑐𝑒𝑝𝑡(±𝑆𝐷)
cLimit of detection
dLimit of quantitation
eLinear dynamic range
fPercentage relative standard deviation (𝑛 = 3)
63

63
Regression equations shown in Table 3.3 were used to calculate the original
concentration (in mg g-1 and as %, g g-1) in the unspiked samples. Percentage relative
recoveries (%RR) were calculated by spiking the samples at two levels, 250 mg L-1
(12.5 mg g-1) and 500 mg L-1 (25.0 mg g-1) and were found to range between 95.6 and
104.7%. These recovery values assisted us to correct for the actual concentration of
piperine in the original sample. The concentrations of piperine originally present in
black pepper samples ranged from 23.3 mg g-1 (2.3%, g g-1, Pakistan) to 58.1 mg g-1
(5.8%, g g-1, UK) and that found in the white pepper sample was 30.2 mg g-1 (3.0%,
g g-1, Jamaica) (Table 3.4).
Table 3.4: Relative recoveries of piperine from black and white pepper samples.
Sample Added
(mg g-1)
Found %RR
mg g-1 %, g g-1
Pooled
- 74.2 7.4 -
12.5 12.2 1.2 97.5
25.0 24.5 2.4 97.9
Brazil
- 53.5 5.3 -
12.5 12.3 1.2 98.8
25.0 25.4 2.5 101.6
India
- 53.5 5.4 -
12.5 12.4 1.2 99.3
25.0 24.2 2.4 96.6
India 2
- 37.4 3.7 -
12.5 12.8 1.3 102.7
25.0 25.6 2.6 102.3
Pakistan
- 23.3 2.3 -
12.5 13.1 1.3 104.7
25.0 25.6 2.6 102.4
Siri Lanka
- 50.1 5.0 -
12.5 13.0 1.3 104.1
25.0 25.0 2.5 100.0
UK
- 58.1 5.8 -
12.5 12.0 1.2 95.8
25.0 24.0 2.4 96.0
Vietnam
- 25.6 2.6 -
12.5 12.0 1.2 95.6
25.0 25.8 2.6 103.3
White/
Jamaica
- 30.2 3.0 -
12.5 12.5 1.2 99.8
25.0 25.6 2.6 102.6

64
3.8 Isolation of Piperine
3.8.1 Scaled-up DLLME
The chromatogram for the extract obtained after the scaled-up DLLME procedure
(Section 2.5.2) is shown in Figure 3.24. It can be observed from the chromatogram that
the extract contained three major compounds that absorbed at 346 nm.
Figure 3.24: Chromatogram of the extract obtained after the scaled-up DLLME
procedure.
3.8.2 Column chromatography
After packing silica gel to the column, choosing the right mobile phase composition was
an important step. Gradient elution was chosen and the fractions were tested with TLC
to check whether they contained the analyte or not. HPLC was also used to check the
identity of the analyte through its UV spectra. Eluents in column chromatography were
in the order of: 300 mL, 90:10 (%, v/v) toluene:EtOAC, 200 mL, 85:15 toluene:EtOAC,
200 mL, 80:20 toluene:EtOAC, 100 mL, 75:25 toluene:EtOAC, 200 mL, 70:30
toluene:EtOAC and 600 mL, 60:40 toluene:EtOAC until all the compounds in the
extract were eluted from the column.

65
A yellow zone was obtained after loading the sample into the column as shown Figure
3.25, which is a characteristic color of piperine. Piperine was not eluted at the beginning.
It was not before forty fractions when it was observed. Black pepper is rich with polar
and non-polar compounds that interfered with piperine.
Figure 3.25: Isolation of piperine by column chromatography.
TLC was performed by applying replicate spots (10 fractions on a TLC plate) in addition
to the reference sample from the crude extract to compare the retardation factor (𝑅𝑓) of
piperine using a mobile phase of 7:3 (%v/v) toluene:EtOAC.
After the plate was dried, a UV lamp was used to check the spots at 254 and 366 nm as
shown in Figure 3.26. The plate was also sprayed with 1% vanillin and 5% H2SO4 to

66
visualize the separated compounds as shown in Figure 3.27. Piperine started appearing
from fraction 46 to 63. These fractions were thus collected and evaporated to dryness
using a rotary evaporation after checking the purity of these fractions by HPLC. A
sample of the final solid extract was sent for NMR analysis for characterization and
structural elucidation of the isolated compound.
Figure 3.26: TLC plates the under UV light at (a) 254 nm and (b) 366 nm.
Figure 3.27: TLC plates after being sprayed with 1% vanillin and 5% H2SO4.

67
Chromatograms obtained with the 46-51 fractions (Figure 3.28) and 52-63 fractions
(Figure 3.29) showed high concentration of piperine in those fractions.
Figure 3.28: A chromatogram obtained with the 46-51 fractions.
Figure 3.29: A chromatogram obtained with 52-63 fractions.
3.9 Structural Elucidation Using NMR
NMR results obtained for piperine which was isolated from the chloroform extract of
Piper nigri fructus using scaled-up DLLME and purified using silica gel column
chromatography are discussed below. Piperine was obtained as yellow colored crystals
as shown in Figure 3.30, the purity of which was also checked by HPLC under
optimized chromatographic conditions.

68
Figure 3.30: Yellow crystals of piperine.
Figure 3.31: Numbered structural formula of piperine.

69
Table 3.5: 1H and 13C-NMR data of piperine [(E-E)-5-(3,4-methylenedioxyphenyl)-2,4-
pentadienoyl-2-piperidine)] (CDCl3: 1H: 500 MHz, 13C: 125 MHz).
C/H
Atom
Multiplicit
y
(DEPT-
135)
13C-NMR
(ppm)
1H-NMR
(ppm), J (Hz)
HMBC
From C to H
2,4-Pentadienoyl
1 C 165.40 - H-2, H-3
2 CH 120.07 6.42 d (14.6) H-3, H-4
3 CH 142.46 7.39 ddd (14.6, 14,6, 2.3) H-2, H-4, H-5
4 CH 125.35 7.42† H-2, H-3, H-5
5 CH 138.19 7.42† H-2, H-3, H-4, H-2', H-6'
3,4-Methylenedioxyphenyl
1' C 130.98 - H-5', H-4, H-5
2' CH 105.64 6.96 d (1.6) H-3, H-5', H-6'
3' C 148.18 - CH2-O-CH2, H-5'
4' C 148.11 - CH2-O-CH2, H-6'
5' CH 108.46 6.75 d (8.2) -
6' CH 122.50 6.87 dd (8.2, 1.6) H-2', H-5
CH2-O-CH2 CH2 101.28 5.95 s -
Piperidine
2'' CH2 43.22 3.62 br s H-3'', H-4'', H-5''
3'' CH2 26.74 1.57 m -
4'' CH2 24.65 1.64 m H-3''
5'' CH2 25.63 1.57 m -
6'' CH2 46.89 3.51 br s H-3'', H-4'', H-5''
All assignments are based on 2D-NMR experiments (COSY, HSQC and HMBC)
†Signal pattern is unclear due to overlapping.

70
Figure 3.32: 1H-NMR Spectrum of piperine (500 MHz, CDCl3).
The structure of the isolated compound (Figure 3.31) has been confirmed by NMR
spectroscopical studies. The 1H-NMR spectrum of piperine (Figure 3.32) exhibited four
spin systems which were established using COSY experiment (Figure 3.34). The COSY
experiment revealed that the first spin system signals arose from the methylene protons
of piperidine moiety at high field of the spectrum. The signals appearing at 3.62 (2H),
3.51 (2H), 1.64 (2H) and 1.57 (4H) were assigned to H2-2ʹʹ, H2-6ʹʹ, H2-4ʹʹ and H2-3ʹʹ and
H2-5ʹʹ, respectively. The assignments were based on a COSY experiment (Figure 3.34).
The other three spin systems were observed between 7.5 and 5.50 ppm. The singlet
signal at 5.95 with two proton intensities was assigned to a methylene-dioxy signal of
3,4-methylenedioxyphenyl moiety. The signals observed as an ABX system at 6.96 d
(𝐽 = 1.6 Hz), 6.75 d (𝐽 = 8.2 Hz) and 6.87 dd (𝐽 = 8.2, 1.6 Hz) were attributed to the
aromatic protons of the 3,4-disubstituted-phenyl unit. The rest of the signals observed in
the same spin system were clearly assigned to the 2,4-pentadienoyl part of the molecule.
The H-2 close to the carbonyl was observed as a well separated doublet at 6.42 (𝐽 =

71
14.6 Hz). The coupling constant of 14.6 Hz was consistent a trans configuration of the
following proton, H-3, which was observed as ddd at 7.39 (𝐽3,2 = 14.6; J3,4= 14,6 and
𝐽3,2= 2,3 Hz). The H-4 and H-5 protons were observed at 7.42 ppm as overlapped
signals.
Figure 3.33: 13C-NMR and DEPT Spectra of piperine (125 MHz, CDCl3).
The 13C-NMR spectrum of piperine (Figure 3.33 and Table 3.5) exhibited 17 carbon
resonances including 6 methylenes five of which were due to the piperidine unit at
43.22, 26.74, 24.65, 25.63 and 46.89 assigned C-2'', C-3'', C-4'', C-5'' and C-6'',
respectively. An additional methylene resonance in DEPT experiment (Figure 3.33) was
consistent for the presence of a methylenedioxy functionality at 101.28 ppm. The
downfield signal at 165.40 observed as a quarternary carbon was attributed to the
carbonyl carbon of 2,4-pentadienoyl moiety together with the olefinic carbons at
120.07, 142.46, 125.35 and 138.19 assigned to H-2, H-3, H-4 and H-5, respectively.

72
The remaining carbon atoms were assigned to the 3,4-methylenedioxyphenyl moiety
(Table 3.5). All assignments were based on a HSQC experiment (Figure 3.35).
Figure 3.34: Spectrum (a), 1H,1H-Homonuclear Correlated Spectrum (COSY) of
piperine, and spectrum (b), 1H,1H-Homonuclear Correlated Spectrum (COSY) of
piperine.

73
Figure 3.35: 1H,13C-Heteronuclear Correlated Spectrum (HSQC) of piperine; [(HSQC:
Heteronuclear Single-Quantum Correlation) experiment].
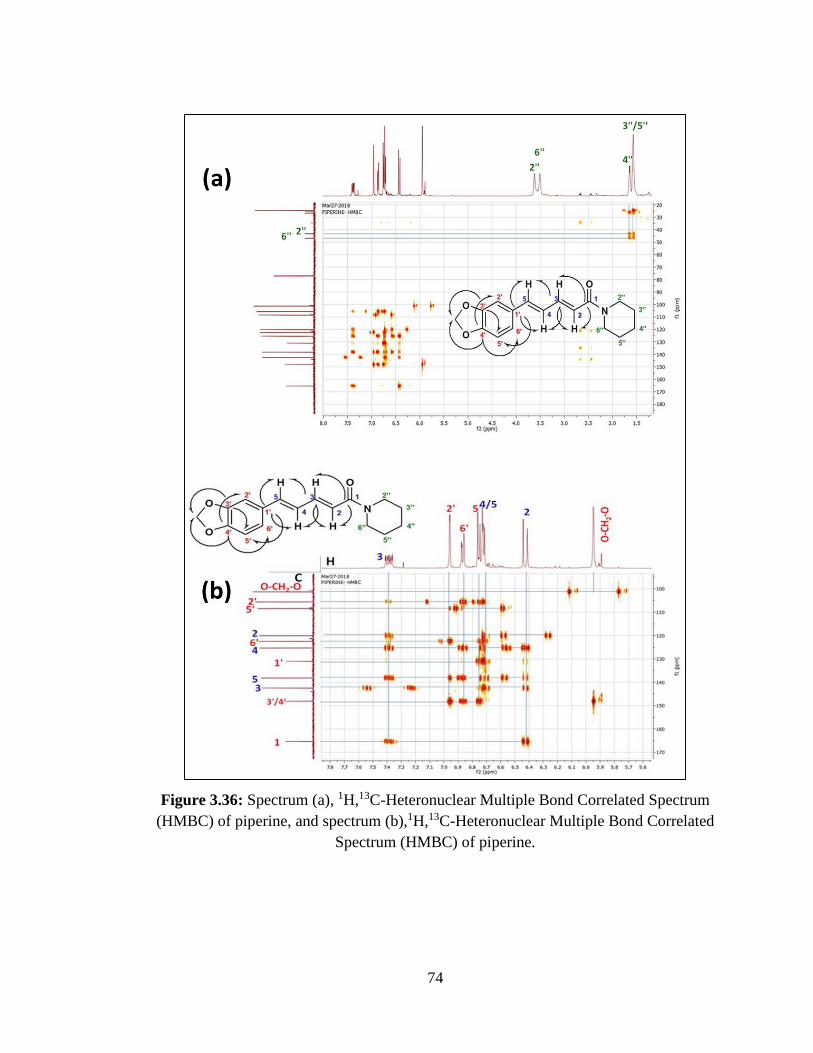
74
Figure 3.36: Spectrum (a), 1H,13C-Heteronuclear Multiple Bond Correlated Spectrum
(HMBC) of piperine, and spectrum (b),1H,13C-Heteronuclear Multiple Bond Correlated
Spectrum (HMBC) of piperine.

75
Intermolecular connectivities were established using HMBC (1H,13C-Heteronuclear
Multiple Bond Correlated Spectroscopy) experiment [Figure 3.36 (a and b)].
H H
N
H H O
O
O
2''
3''
4''
5''
6''
2'
3'
4'
5'
6'
1'
5
4
3
2
1
Figure 3.37: 1H,13C-Heteronuclear Long Range Correlations
Figure 3.37 and Figure 3.36 (a and b) show long-range correlations from C atoms to H.
The location of methylenedioxy functionality and the connectivity between 1,3,4-
trisubstituted-phenyl moiety with the 2,4-pentadienoyl unit were confirmed by the long-
range correlations from C-3ʹ and C-4ʹ to methylenedioxy protons and from C-1ʹ to H-5
and H-4. The further significant long-range correlations were observed from carbonyl
carbon (C-1) to H-2 and H-3, confirming the structure. Thus, the assignments of proton
and carbon resonances were in good aggreement with those in published data 73,74.
3.10 Comparison of SPS-LLME With Other Methods For The Extraction of
Piperine from Black and White Pepper
A comparison between our study and other different extraction methods used in the
literature for the extraction of piperine from black and white pepper is presented in this
section. Pressurized-liquid soxhlet extraction (LP-SOX) was used by Katia S. A. et al.75.
5 g of dried sample were weighed and 150 mL of three different solvents: ethyl acetate;
ethanol; and hexane were applied for 6 h at the solvent boiling point to extract piperine
from the samples.
76
The same authors75 also used supercritical fluid extraction (SFE) by placing 20 g of
grinded black pepper inside the extractor cell for 4 h under the optimum extraction
conditions (i.e., pressure 200 bar and temperture 50 ºC).
The same authors75 used pressurized liquid extraction (PLE) through using ethanol as an
extraction solvent for piperine in about 20 g of blended black pepper after being
transferred into the extraction vessel. Extraction time was 60 min at 40 ºC.
Conventional extraction method used for the extraction of piperine started with 1.0 g of
sample and mixed with 10 mL of 75% methanol as an extraction solvent boiled for 2 h
under the water bath reflux 76.
Friedman et al.70 used solid-liquid extraction (SLE) to extract piperine from 0.1–0.15 g
of black pepper powder. 2 mL of 80% ethanol were used as the extraction solvent using
sonication for 60 min and centrifugation at 12000 rpm for 10 min at 5 ºC.
Ultrasound-asisted extraction method (LP-UAE) was used at room temperture with 210
mL of extraction solvent that was added to 7 g of grinded pepper. Extraction was done
within 45 min75.
Ionic liquid based ultrasounic-assisted extraction (IL-UAE) was applied for the
extraction of piperine using 1.0 g of dried grinded sample mixed with 10 mL of different
ionic liquid solutions. This method consumed 30 min as an extraction time 76.
In our proposed method, switchable polarity solvent liquid-liquid microextraction was
performed by weighing 0.1 g of black pepper powder using 750 µL extraction solvent
within 10 s as an extraction time without the need for centrifuge or any other equipment
for the extraction of piperine as sammurized in Table 3.6.

77
Table 3.6: Comparison of SPS-LLME with other methods for the extraction of piperine
from black and white pepper.
Extraction method Extraction time
(h)
Sample size
(g)
Vorg.
(mL) Reference
LP-SOXa 6 5 150 75
SFEb 4 20 - 75
SLEc 2 1 10 76
SLEc 1.17 0.1–0.15 2 70
PLEd 1 20 - 75
LP-UAEe 0.7 7 210 75
IL-UAEf 0.5 1 10 76
SPS-LLME 0.2 0.1 0.75 This study
a Low pressure-based soxhlet extraction. b Supercritical fluid extraction. c Solid-liquid extraction d Pressurized liquid extraction. e Low pressure-based ultrasound-assisted extraction. f Ionic liquid-based ultrasonic-assisted extraction.
4

78
5 CHAPTER 4: CONCLUSION AND RECOMMENDATION
CHAPTER 4
CONCLUSION AND RECOMMENDATION
The main purpose of this study was to find a simple, easy, fast, efficient and green
extraction method that is compatible with HPLC and can be applied to black and white
pepper samples of different origins.
The desired property of the extraction method was efficient separation and sample clean-
up of the matrix that interfere with the analyte of interest. At the same time pre-
concentration was required especially for the analytes that might be present in small
amounts in the sample. In addition, minimizing the amount of toxic organic solvent was
desired.
A novel liquid-liquid microextraction method based on the use of switchable-polarity
solvents was developed and was termed as SPS-LLME. This method was demonstrated
to provide such requirements of green analytical sample preparation. SPS-LLME
provided several advantages such as powerful sample clean-up, short extraction time,
due to complete miscibility of the switchable solvent with the sample solution, and ease
of application without the need for organic modifiers, centrifugation or other special
equipment.
For the identification, qualitative and quantitative analysis, RP-HPLC was fast, simple,
robust, sensitive with only 5 µL injection volume, high peak areas were obtained.
Analysis time was fast making it good for routine analysis and efficient.
Dispersive liquid-liquid microextraction was scaled up for the first time for preparative
extraction of piperine. This novel approach, when combined with column
chromatography, provided high-purity standard of piperine (more than 97%) as proved
by NMR analysis using much smaller volume of organic solvents than conventional
79
liquid-liquid extraction techniques used for its isolation. The collaboration between the
Department of Analytical Chemistry and the Department of Pharmacognosy was fruitful
and each department complemented one another.

80
REFERENCES
1. Szallasi A. Piperine: researchers discover new flavor in an ancient spice. Trends
in Pharmacological Sciences. 2005;26(9):437-439.
2. Gorgani L, Mohammadi M, Najafpour GD, Nikzad M. Sequential Microwave-
Ultrasound-Assisted Extraction for Isolation of Piperine from Black Pepper
(Piper nigrum L.). Food and Bioprocess Technology. 2017;10(12):2199-2207.
3. Knill CJ, Kennedy JF. Handbook of Herbs and Spices. International Journal of
Biological Macromolecules. 2007;41(4):488-489.
4. Gorgani L, Mohammadi M, Najafpour GD, Nikzad M. Piperine-The Bioactive
Compound of Black Pepper: From Isolation to Medicinal Formulations.
Comprehensive Reviews in Food Science and Food Safety. 2017;16(1):124-140.
5. Zhang J, Wang Y, Pan DD, et al. Effect of black pepper essential oil on the
quality of fresh pork during storage. Meat Science. 2016;117:130-136.
6. Ferreira SRS, Meireles MAA. Modeling the supercritical fluid extraction of
black pepper (Piper nigrum L.) essential oil. Journal of Food Engineering.
2002;54(4):263-269.
7. Darshan S, Doreswamy R. Patented antiinflammatory plant drug development
from traditional medicine. Phytotherapy Research. 2004;18(5):343-357.
8. Bai YF, Xu H. Protective action of piperine against experimental gastric ulcer.
Acta Pharmacologica Sinica. 2000;21(4):357-359.
9. Yang YC, Lee SG, Lee HK, Kim MK, Lee SH, Lee HS. A piperidine amide
extracted from Piper longum L. fruit shows activity against Aedes aegypti
mosquito larvae. Journal of Agricultural and Food Chemistry.
2002;50(13):3765-3767.
10. Ebihara S, Kohzuki M, Sumi Y, Ebihara T. Sensory Stimulation to Improve
Swallowing Reflex and Prevent Aspiration Pneumonia in Elderly Dysphagic
People. Journal of Pharmacological Sciences. 2011;115(2):99-104.

81
11. Srinivasan K. Black pepper and its pungent principle-piperine: A review of
diverse physiological effects. Critical Reviews in Food Science and Nutrition.
2007;47(8):735-748.
12. Dutta S, Bhattacharjee P. Nanoliposomal encapsulates of piperine-rich black
pepper extract obtained by enzyme-assisted supercritical carbon dioxide
extraction. Journal of Food Engineering. 2017;201:49-56.
13. Ma MH, Cantwell FF. Solvent microextraction with simultaneous back-
extraction for sample cleanup and preconcentration: Preconcentration into a
single microdrop. Analytical Chemistry. 1999;71(2):388-393.
14. Cabaleiro N, de la Calle I, Bendicho C, Lavilla I. Current trends in liquid-liquid
and solid-liquid extraction for cosmetic analysis: a review. Analytical Methods.
2013;5(2):323-340.
15. Pena-Pereira F, Lavilla I, Bendicho C. Liquid-phase microextraction techniques
within the framework of green chemistry. Trac-Trends in Analytical Chemistry.
2010;29(7):617-628.
16. Smith RM. Before the injection - modern methods of sample preparation for
separation techniques. Journal of Chromatography A. 2003;1000(1-2):3-27.
17. Beck IC, Bruhn R, Gandrass J, Ruck W. Liquid chromatography-tandem mass
spectrometry analysis of estrogenic compounds in coastal surface water of the
Baltic Sea. Journal of Chromatography A. 2005;1090(1-2):98-106.
18. Matejicek D, Kuban V. High performance liquid chromatography/ion-trap mass
spectrometry for separation and simultaneous determination of ethynylestradiol,
gestodene, levonorgestrel, cyproterone acetate and desogestrel. Analytica
Chimica Acta. 2007;588(2):304-315.
19. Rezaee M, Yamini Y, Faraji M. Evolution of dispersive liquid-liquid
microextraction method. Journal of Chromatography A. 2010;1217(16):2342-
2357.
20. Jeannot MA, Cantwell FF. Solvent microextraction into a single drop. Anal
Chem. 1996;68(13):2236-2240.

82
21. Pedersen-Bjergaard S, Rasmussen KE. Liquid-liquid-liquid microextraction for
sample preparation of biological fluids prior to capillary electrophoresis. Anal
Chem. 1999;71(14):2650-2656.
22. Xu L, Basheer C, Lee HK. Solvent-bar microextraction of herbicides combined
with non-aqueous field-amplified sample injection capillary electrophoresis. J
Chromatogr A. 2010;1217(39):6036-6043.
23. Rezaee M, Assadi Y, Hosseinia MRM, Aghaee E, Ahmadi F, Berijani S.
Determination of organic compounds in water using dispersive liquid-liquid
microextraction. Journal of Chromatography A. 2006;1116(1-2):1-9.
24. Asensio-Ramos M, Ravelo-Perez LM, Gonzalez-Curbelo MA, Hernandez-
Borges J. Liquid phase microextraction applications in food analysis. J
Chromatogr A. 2011;1218(42):7415-7437.
25. Galuszka A, Migaszewski Z, Namiesnik J. The 12 principles of green analytical
chemistry and the SIGNIFICANCE mnemonic of green analytical practices.
Trac-Trends in Analytical Chemistry. 2013;50:78-84.
26. Zhu SQ, Zhou J, Jia HF, Zhang HX. Liquid-liquid microextraction of synthetic
pigments in beverages using a hydrophobic deep eutectic solvent. Food
Chemistry. 2018;243:351-356.
27. Mansour FR, Danielson ND. Separation methods for captopril in
pharmaceuticals and biological fluids. Journal of Separation Science.
2012;35(10-11):1213-1226.
28. Khairy MA, Mansour FR. Simultaneous Determination of Ursodeoxycholic Acid
and Chenodeoxycholic Acid in Pharmaceutical Dosage Form by HPLC-UV
Detection. Journal of Aoac International. 2017;100(1):59-64.
29. Bylda C, Thiele R, Kobold U, Volmer DA. Recent advances in sample
preparation techniques to overcome difficulties encountered during quantitative
analysis of small molecules from biofluids using LC-MS/MS. Analyst.
2014;139(10):2265-2276.
30. Soltani S, Jouyban A. Biological sample preparation: attempts on productivity
increasing in bioanalysis. Bioanalysis. 2014;6(12):1691-1710.

83
31. Alshana U, Ertas N, Goger NG. Determination of parabens in human milk and
other food samples by capillary electrophoresis after dispersive liquid-liquid
microextraction with back-extraction. Food Chemistry. 2015;181:1-8.
32. Us MF, Alshana U, Lubbad I, Goger NG, Ertas N. Dispersive liquid-liquid
microextraction based on solidification of floating organic drop combined with
field-amplified sample injection in capillary electrophoresis for the determination
of beta(2)-agonists in bovine urine. Electrophoresis. 2013;34(6):854-861.
33. Zhao EC, Shan WL, Jiang SR, Liu Y, Zhou ZQ. Determination of the
chloroacetanilide herbicides in waters using single-drop microextraction and gas
chromatography. Microchemical Journal. 2006;83(2):105-110.
34. Rasmussen KE, Pedersen-Biergaard S. Developments in hollow fibre-based,
liquid-phase microextraction. Trac-Trends in Analytical Chemistry.
2004;23(1):1-10.
35. Dadfarnia S, Shabani AMH. Recent development in liquid phase microextraction
for determination of trace level concentration of metals-A review. Analytica
Chimica Acta. 2010;658(2):107-119.
36. Sarafraz-Yazdi A, Amiri A. Liquid-phase microextraction. Trac-Trends in
Analytical Chemistry. 2010;29(1):1-14.
37. Ho TD, Zhang C, Hantao LW, Anderson JL. Ionic Liquids in Analytical
Chemistry: Fundamentals, Advances, and Perspectives. Analytical Chemistry.
2014;86(1):262-285.
38. Jessop PG, Heldebrant DJ, Li XW, Eckert CA, Liotta CL. Green chemistry -
Reversible nonpolar-to-polar solvent. Nature. 2005;436(7054):1102-1102.
39. Fu DB, Farag S, Chaouki J, Jessop PG. Extraction of phenols from lignin
microwave-pyrolysis oil using a switchable hydrophilicity solvent. Bioresource
Technology. 2014;154:101-108.
40. Jessop PG, Phan L, Carrier A, Robinson S, Durr CJ, Harjani JR. A solvent
having switchable hydrophilicity. Green Chemistry. 2010;12(5):809-814.
41. Jessop PG, Kozycz L, Rahami ZG, et al. Tertiary amine solvents having
switchable hydrophilicity. Green Chemistry. 2011;13(3):619-623.

84
42. Zhang JF, Misch R, Tan YD, Agar DW. Novel Thermomorphic Biphasic Amine
Solvents for CO2 Absorption and Low-Temperature Extractive Regeneration.
Chemical Engineering & Technology. 2011;34(9):1481-1489.
43. Yilmaz E, Soylak M. Switchable polarity solvent for liquid phase
microextraction of Cd(II) as pyrrolidinedithiocarbamate chelates from
environmental samples. Analytica Chimica Acta. 2015;886:75-82.
44. Jessop PG, Mercer SM, Heldebrant DJ. CO2-triggered switchable solvents,
surfactants, and other materials. Energy & Environmental Science.
2012;5(6):7240-7253.
45. Vanderveen JR, Durelle J, Jessop PG. Design and evaluation of switchable-
hydrophilicity solvents. Green Chemistry. 2014;16(3):1187-1197.
46. Holland A, Wechsler D, Patel A, Molloy BM, Boyd AR, Jessop PG. Separation
of bitumen from oil sands using a switchable hydrophilicity solvent. Canadian
Journal of Chemistry-Revue Canadienne De Chimie. 2012;90(10):805-810.
47. Phan L, Brown H, White J, Hodgson A, Jessop PG. Soybean oil extraction and
separation using switchable or expanded solvents. Green Chemistry.
2009;11(1):53-59.
48. Wang YG, Niu ZS, Shen J, et al. Extraction of direct coal liquefaction residue
using dipropylamine as a CO2-triggered switchable solvent. Fuel Processing
Technology. 2017;159:27-30.
49. Du Y, Schuur B, Samori C, Tagliavini E, Brilman DWF. Secondary amines as
switchable solvents for lipid extraction from non-broken microalgae.
Bioresource Technology. 2013;149:253-260.
50. Samori C, Torri C, Samori G, et al. Extraction of hydrocarbons from microalga
Botryococcus braunii with switchable solvents. Bioresource Technology.
2010;101(9):3274-3279.
51. Arain MS, Kazi TG, Afridi HI, Khan N, Ali J. A innovative switchable polarity
solvent, based on 1,8-diazabicyclo- 5.4.0 - undec-7-ene and decanol was
prepared for enrichment of aluminum in biological sample prior to analysis by
85
flame atomic absorption spectrometry. Applied Organometallic Chemistry.
2018;32(3).
52. Vessally E, Ghorbani-Kalhor E, Hosseinzadeh-Khanmiri R, et al. Application of
switchable solvent-based liquid phase microextraction for preconcentration and
trace detection of cadmium ions in baby food samples. Journal of the Iranian
Chemical Society. 2018;15(2):491-498.
53. Soylak M, Khan M, Yilmaz E. Switchable solvent based liquid phase
microextraction of uranium in environmental samples: a green approach.
Analytical Methods. 2016;8(5):979-986.
54. Naeemullah, Shah F, Kazi TG, et al. Switchable dispersive liquid-liquid
microextraction for lead enrichment: a green alternative to classical extraction
techniques. Analytical Methods. 2016;8(4):904-911.
55. Khan M, Soylak M. Switchable solvent based liquid phase microextraction of
mercury from environmental samples: a green aspect. Rsc Advances.
2016;6(30):24968-24975.
56. Yilmaz E, Soylak M. Switchable solvent-based liquid phase microextraction of
copper(II): optimization and application to environmental samples. Journal of
Analytical Atomic Spectrometry. 2015;30(7):1629-1635.
57. Zhang ML, Qiu HD. Progress in stationary phases modified with carbonaceous
nanomaterials for high-performance liquid chromatography. Trac-Trends in
Analytical Chemistry. 2015;65:107-121.
58. Davies NH, Euerby MR, McCalley DV. Analysis of basic compounds by
reversed-phase high-performance liquid chromatography using hybrid
inorganic/organic phases at high pH. Journal of Chromatography A.
2008;1178(1-2):71-78.
59. Sander LC, Wise SA. Recent advances in bonded phases for liquid-
chromatography. Crc Critical Reviews in Analytical Chemistry. 1987;18(4):299-
415.
60. Guiochon G. Monolithic columns in high-performance liquid chromatography.
Journal of Chromatography A. 2007;1168(1-2):101-168.

86
61. Skoog DA, Holler FJ, Crouch SR. Principles of Instrumental Analysis. 6th
Edition ed: Brooks/Cole Publishing Co.; 2007.
62. Weston A, Brown PR. HPLC and CE Principles and Practice. CA, USA:
Academic Press; 1997.
63. Mlynarik V. Introduction to nuclear magnetic resonance. Analytical
Biochemistry. 2017;529:4-9.
64. Schweiger S, Hinterberger S, Jungbauer A. Column-to-column packing variation
of disposable pre-packed columns for protein chromatography. Journal of
Chromatography A. 2017;1527:70-79.
65. Lupina T, Cripps H. UV Spectrophotometric determination of piperine in pepper
preparations - collaborative study. Journal of the Association of Official
Analytical Chemists. 1987;70(1):112-113.
66. Musenga A, Mandrioli R, Ferranti A, D'Orazio G, Fanali S, Raggi MA. Analysis
of aromatic and terpenic constituents of pepper extracts by capillary
electrochromatography. Journal of Separation Science. 2007;30(4):612-619.
67. Catchpole OJ, Grey JB, Perry NB, Burgess EJ, Redmond WA, Porter NG.
Extraction of chill, black pepper, and ginger with near-critical CO2, propane, and
dimethyl ether: Analysis of the extracts by quantitative nuclear magnetic
resonance. Journal of Agricultural and Food Chemistry. 2003;51(17):4853-4860.
68. Verzele M, Vandamme F, Schuddinck G, Vyncke P. Quantitative microscale
liquid-chromatography of piperine in pepper and pepper extracts. Journal of
Chromatography. 1989;471:335-346.
69. Scott IM, Puniani E, Jensen H, et al. Analysis of Piperaceae germplasm by
HPLC and LCMS: A method for isolating and identifying unsaturated amides
from Piper spp extracts. Journal of Agricultural and Food Chemistry.
2005;53(6):1907-1913.
70. Friedman M, Levin CE, Lee SU, Lee JS, Ohnisi-Kameyama M, Kozukue N.
Analysis by HPLC and LC/MS of pungent piperamides in commercial black,
white, green, and red whole and ground peppercorns. Journal of Agricultural and
Food Chemistry. 2008;56(9):3028-3036.

87
71. Kozukue N, Park MS, Choi SH, et al. Kinetics of light-induced cis-trans
isomerization of four piperines and their levels in ground black peppers as
determined by HPLC and LC/MS. Journal of Agricultural and Food Chemistry.
2007;55(17):7131-7139.
72. Rathnawathie M, Buckle KA. Determination of piperine in pepper (piper-
nigrum) using high-performance liquid-chromatography. Journal of
Chromatography. 1983;264(2):316-320.
73. Islam MS, Roy AC, Haque MM, Hossain MS, Abu Sayeed M. Phytochemical
studies on piper chaba hunter. International Journal of Pharmaceutical Sciences
and Research. 2015;6(6):2525-2531.
74. Ternes W, Krause EL. Characterization and determination of piperine and
piperine isomers in eggs. Analytical and Bioanalytical Chemistry.
2002;374(1):155-160.
75. Andrade KS, Trivellin G, Ferreira SRS. Piperine-rich extracts obtained by high
pressure methods. Journal of Supercritical Fluids. 2017;128:370-377.
76. Cao XJ, Ye XM, Lu YB, Yu Y, Mo WM. Ionic liquid-based ultrasonic-assisted
extraction of piperine from white pepper. Analytica Chimica Acta. 2009;640(1-
2):47-51.