Embed Size (px)
Citation preview

Switching from Cash to Mobile Payment: What’s the Hold-Up?
Xiu-Ming Loha, Voon-Hsien Leeb, Garry Wei-Han Tanc, Keng-Boon Ooid,e, Yogesh K. Dwivedif,*
aFaculty of Business and Finance,
Universiti Tunku Abdul Rahman,
Jalan Universiti, Bandar Barat, 31900 Kampar, Perak, Malaysia
Email: [email protected]
bFaculty of Business and Finance,
Universiti Tunku Abdul Rahman,
Jalan Universiti, Bandar Barat, 31900 Kampar, Perak, Malaysia
Email: [email protected]
cFaculty of Business and Information Science,
UCSI University, No. 1 Jalan Menara Gading,
UCSI Heights, 56000 Cheras, Wilayah Persekutuan Kuala Lumpur
Email: [email protected]
dFaculty of Business and Information Science,
UCSI University, No. 1 Jalan Menara Gading,
UCSI Heights, 56000 Cheras, Wilayah Persekutuan Kuala Lumpur
Email: [email protected]
eCollege of Management,
Chang Jung Christian University
711, Taiwan, Tainan City, Guiren District
Email: [email protected]
f,*School of Management,
Swansea University Bay Campus,
Fabian Way, Swansea SA1 8EN, UK
Corresponding author
Email: [email protected]
Abstract
Purpose – This paper explores the reasons behind the slow uptake of mobile payment (m-
payment) from a switching intention (SI) perspective. The antecedents of SI from cash to m-
payment were explored using an integrated conceptual model of the Push-Pull-Mooring (PPM)
framework and the Status Quo Bias (SQB) perspective.
Design/methodology/approach – A self-administered survey was used to collect data, which
is empirically tested using SmartPLS 3.0.
Findings – The push factor was found to have an insignificant effect on SI to m-payment
whereas the pull factor was significant. Furthermore, the results revealed that the two mooring
variables have contrasting results as trust is not a significant determinant of SI to m-payment
while perceived security and privacy is. Additionally, all SQB-related relationships were found
to be statistically significant.
Originality/value – This study determined the factors that play vital roles in the consumers’
decision making to transition from cash to m-payment. This was done via a uniquely developed
conceptual model that incorporated the PPM framework with the SQB perspective.
Keywords – mobile payment, switching intention, push-pull-mooring, status quo bias, mobile
commerce.
Paper type – Research paper

1. Introduction
The exponential development of smartphones has revolutionized today’s world. Smartphones
can now carry out a broad range of activities such as mobile payment (m-payment) which is
the purchase of goods and services through the use of proximity payments at the point of sale
(Barbero et al., 2016). Well-known examples of m-payments include Android Pay, Samsung
Pay, and Apple Pay.
In Malaysia, the country has a solid foundation for m-payment to thrive as the number
of mobile connections in terms of the total population is at 125% (We Are Social, 2019).
Furthermore, the Central Bank of Malaysia has been putting in efforts to accelerate the
promotion of m-payment adoption as it recognizes the numerous benefits of m-payment (Bank
Negara Malaysia, 2018). These advantages include enhancing the performance of customers’
checkout experience as the cashier can focus more on customer service instead of handling
cash (Busu et al., 2018).
The initiatives by the Malaysian government to encourage m-payment usage include
providing RM30 and RM50 incentives in the first and second half of 2020 (Ong, 2020). For
the first stint, this was carried out through the top three m-payment platforms in Malaysia (Gazi,
2020a; Wong, 2019). As these m-payment platforms primarily use QR code for their payment
function (Gazi, 2020b), this study focuses on proximity m-payment.
However, m-payment is surprisingly infrequently used in Malaysia as consumers still
feel more comfortable using cash to make payments for goods and services. M-payment was
found to only make up around 10% of total payments in Malaysia (Yuen, 2019). Accordingly,
cash is still king among the payment methods available despite the efforts to shift Malaysia
into a cashless society (Nielsen, 2019). All these points to the fact that there is a need to better
understand the drivers of users’ switching intention (SI) from cash to m-payment as the country
looks to shift to a cashless society.
Hence, this study looks into the factors that influence SI to m-payment. Many past
studies have looked into users’ m-payment adoption (Gao and Waechter, 2017; Ooi and Tan,
2016). However, this study argues that there are significant deficiencies in such studies. This
is because such studies assume that users will only need to consider m-payment without
impediments coming from cash. Therefore, past studies fail to account for the influences of
cash in the m-payment context.
As the goal of m-payment is to replace cash, m-payment serves as a substitute for cash
(Bank Negara Malaysia, 2017). In other words, using m-payment takes away the opportunity
for consumers to use cash for a particular transaction. As Trütsch (2016) stated that m-payment
complements credit/debit cards, this implies a shift rather than a switch. Additionally, it was
found that those who use cards as one of their payment methods were less likely to adopt m-
payment when compared to others who only use cash. This situation is pertinent in Malaysia
as BigPay (2019) found that the majority of all consumer transactions in the country still
involve cash despite the relatively high number of banked adults (91%) when compared to the
global average (60%).
Moreover, the examination of factors influencing SI to m-payment has been largely
neglected. Therefore, the push-pull mooring (PPM) framework is utilized to overcome the
deficiencies mentioned above. Accordingly, PPM is an integrated framework that investigates
SI from the incumbent to an alternative from the perspectives of push, pull, and mooring factors
(Bansal et al., 2005). In this study, cash is the incumbent payment method because of its
prevalence (Nielsen, 2019) whereas the alternative is m-payment.
2. Research Framework and Conceptual Model
2.1. Push-Pull Mooring (PPM)

Originating from the migration theory which suggests that the motivation for migration is to
enhance one’s life (Ravenstein, 1885), the PPM framework is an integrated framework that
investigates SI from multiple perspectives. This includes push factors that propel consumers
away from the incumbent, pull factors that entice consumers to an alternative, and mooring
factors that either impede or promote switching behavior (Bansal et al., 2005). Many studies
have found the PPM framework useful to investigate switching behavior in mobile-related
fields. For example, PPM was applied to investigate users’ switching behavior of mobile
personal cloud storage services (Cheng et al., 2019), social networking sites (Chang et al.,
2014), mobile stores (Zhou, 2016), mobile communication service (Zhang et al., 2014), and
mobile instant messaging (Sun et al., 2017).
In this study, the PPM framework consists of monetary value (MV) as the push factor,
alternative attractiveness (AA) as the pull factor, whereas trust (TR), as well as perceived
security and privacy (PSP), are the mooring factors. MV in the form of price has been reported
as one of the important push factors in the switching literature (Bansal et al., 2005; Wieringa
and Verhoef, 2007). Hence, there is a tendency for one to switch to an alternative if the price
appears to be too high or unfair (Keaveney, 1995). Besides, m-payment service providers are
promoting the vast features and benefits of making payment using mobile devices as an
alternative (Birruntha, 2019). Therefore, the attractiveness of m-payment is posited to be a vital
element of the pull effect (Chang et al., 2017). Also, TR has been confirmed as a critical factor
(Wang et al., 2019) whereas privacy and security are among the utmost concerns for users in
predicting switching behavior (Cheng et al., 2019).
2.2. Status Quo Bias (SQB)
The SQB perspective developed by Samuelson and Zeckhauser (1988) seeks to understand the
role of biases that contribute to one’s tendency to resist change. Through several experiments,
it was verified that individuals are likely to disproportionally stick with the status quo. Hence,
the SQB perspective postulates that individuals are skewed towards keeping the status quo
which is “doing nothing or maintaining one’s current or previous decision” (Samuelson and
Zeckhauser, 1988, p.7). The SQB perspective has been applied in numerous fields to
understand users’ resistance towards a new technology (Kim and Kankanhalli, 2009),
customers’ continuance intention with mobile service providers (Lee and Joshi, 2017),
consumers’ loyalty toward smartphone brands (Shi et al., 2018) and one’s intention to use m-
payment service (Gong et al., 2020).
Inertia (IN), which is the externalization of SQB, refers to one’s attachment to and
persistence in using the current system even if there are new and better alternatives. There are
two categories of IN, namely conscious and subconscious (Polites and Karahanna, 2012). In
this study, switching costs (SC) and traditional payment habit (TPH) represent the conscious
and subconscious aspects of IN respectively. SC was chosen as the conscious bias toward the
status quo as it includes transition costs (Ng and Kwahk, 2010). As for SC of the alternative
increase in terms of time, effort, and money, one is likely to remain in their current status
(Vatanasombut et al., 2008). Additionally, one’s IN can also result from a subconscious bias
toward the status quo, such as habit (Polites and Karahanna, 2012). When individuals have
acquired a set of habits through routine use over time, they develop automatic responses to
specific cues that often serve to maintain the status quo (Ng and Kwahk, 2010).
3. Hypotheses Development
3.1. Monetary Value (MV)
In the business sector, many companies are fiercely competing to position themselves against
their competitors by boosting their perceived value to customers. This situation comes in both

tangible and intangible forms related to price (Heda et al., 2017). Particularly in the academic
sphere, MV has been widely recognized as a significant factor that influences consumers’
behavior and decision-making (Chang, 2009). In the general mobile marketing context, MV is
vital to the consumers’ perceived value preferences (Huang et al., 2019). This situation is also
true in several contexts such as online group buying (Lee et al., 2016), online hotel booking
(Lien et al., 2015), mobile commerce (Shaw and Sergueeva, 2019) and mobile shopping (Gupta
and Arora, 2017). In this study, MV has been adapted to refer to the users’ perception of the
advantages they will obtain in financial terms when switching to m-payment (Liu et al., 2014;
Zhang et al., 2015). MV is posited to be a significant determinant in affecting SI to m-payment
as it involves monetary transactions in the process of purchasing a product or service (Grant,
2019). Additionally, there are financial benefits that can be obtained from the use of m-payment
such as lower rates in the form of price, promotions, rebates, cashback, and so on (Gazi, 2020b).
Therefore, the following hypothesis is derived:
H1: MV has a significantly positive relationship with SI to m-payment.
3.2. Alternative Attractiveness (AA)
AA is defined as the extent to which consumers perceive that viable competing alternatives are
available in the marketplace (Jones et al., 2000). In this study, AA refers to the attractiveness
of m-payment as an alternative to cash. When consumers perceive that m-payment is better
than cash, there is a higher tendency of switching to m-payment. The attractiveness of m-
payment over cash can be in the form of ubiquity, convenience, and speed (Porath, 2017).
These mobile-based characteristics exemplify AA, which in turn generates pull forces on
consumers that encourage consumers to switch to m-payment. Several prior studies have found
AA to influence SI significantly. Particularly in mobile-related settings, these studies include
mobile data service providers (Chuah et al., 2018), mobile stores (Zhou, 2016), and mobile
shopping (Lai et al., 2012). Thus, it is proposed that a consumer who is attracted by the
advantages of m-payment will develop a higher level of SI to m-payment. Hence, the following
hypothesis is derived:
H2: AA has a significantly positive relationship with SI to m-payment.
3.3. Trust (TR)
In this study, TR refers to the confidence users have in the trustworthiness of m-payment (Zhou,
2014). Given the increasingly competitive financial services industry, there is an emphasis on
TR (Sekhon et al., 2014). TR has been identified as the most significant long-term facilitator
for the success of mobile-related services and systems in several geographical locations. These
include the contexts of mobile shopping in Taiwan (Lai et al., 2012) as well as mobile
commerce in both China and Malaysia (Chong et al., 2012). According to the study of Marriott
and Williams (2018), the results revealed that TR was the most significant predictor in the m-
payment context. This is in line with the results of Gao and Waechter (2017) which reasons
that TR acts as a perceived guarantee by users that m-payment is reliable and able to provide
the services as promised. When it comes to switching to m-payment, it is inherent that users
will need to trust m-payment to a certain degree in attempting to use it. This is because the
usage of m-payment involves transactions between unknown entities and involve multifarious
uncertainties and risks (Chandra et al., 2010). Thus, the following hypothesis is derived:
H3: TR has a significantly positive relationship with SI to m-payment.

3.4. Perceived Security and Privacy (PSP)
PSP reflects the level of concern an individual has on the features of m-payment related to
personal information and payment transaction (Gao et al., 2015; Kim, et al., 2011). The fears
include improper access and transaction errors while the features are to protect the individual’s
privacy and transaction security. Past studies have suggested that privacy and security concerns
are inextricably linked (Balapour et al., 2020; Johnson et al., 2018). Additionally, information
privacy and transaction security are closely related to hidden information and underlying
behavior (Yeh et al., 2012). Several studies have included PSP to examine SI in mobile-related
services. One of which is by Lai et al. (2012) in the context of mobile shopping whereas another
study by Lai and Wang (2015) is in the mobile cloud healthcare setting. Both studies found
that PSP is among the most influential factors of SI in their respective mobile services. PSP is
proposed in this study as m-payment involves the transfer of data in a wireless environment
whereby security and privacy risks are present. Thus, privacy and security concerns may
dampen SI to m-payment as doubt on the ability, integrity, and benevolence of m-payment to
protect their personal information and transaction security may arise in consumers’ minds (Gao
et al., 2015). Therefore, the following hypothesis is derived:
H4: PSP has a significantly positive relationship with SI to m-payment.
3.5. Switching Costs (SC)
In this study, SC have been adapted to refer to the costs incurred by a user to switch from using
cash to m-payment (Polites and Karahanna, 2012). In marketing literature, several studies have
established the prevalence of SC in a wide variety of contexts and geographical locations (Blut
et al., 2015). They are salient and evident by making the switch away from the status quo to
the alternative seem unattractive when users come across a reason to consider switching
(Samuelson and Zeckhauser, 1988). When it comes to switching, customers may be open to
doing so, but SC can deter them, especially when they find that the costs outweigh the benefits
of switching (Lee and Neale, 2012). In such a situation, regardless of consumers’ dispositions,
they will be unwilling to expend the effort required to switch which can be translated to IN on
the current system (Dagger and David, 2012). As such, high SC were found to affect consumers
in terms of retaining them to physical stores instead of mobile ones (Chang et al., 2017). In this
study, it is proposed to be the same when it comes to physical cash and m-payment. As such,
SC are proposed to be relevant in the context of SI to m-payment through the promotion of IN
on an incumbent system. Hence, the following hypothesis is derived:
H5: SC has a significantly positive relationship with IN.
3.6. Traditional Payment Habit (TPH)
In general, habit is defined as the situation-behavior sequences that are or have become
automatic responses to specific cues whereby the individual is usually not conscious of
obtaining certain goals or end states (Polites and Karahanna, 2012). In this study, habit has
been adapted into the construct of TPH to reflect the subject matter of this research. In view of
this, the traditional payment aspect of this construct refers to cash. Several past studies have
examined the role of habit in the context of an incumbent system in technology acceptance.
The study by Polites and Karahanna (2012) determined that there are subconscious origins that
affect IN which is in the form of incumbent system habit. In this study, it is posited that users
are less likely to consider switching to m-payment when they have been habituated to the use
of cash. Instead, they would tend to keep the habitual response and commit to their existing
behavioral patterns to minimize the costs in the thought process of one’s decision making (Sun
et al., 2017). Additionally, consumers looking to avoid the stress from change will discover
that it is easy to engage in habitual behavior and maintain the status quo (Gan, 2016). Thus, the
following hypothesis is derived:
H6: TPH has a significantly negative relationship with IN.
3.7. Inertia (IN)
IN is defined as the “attachment to and persistence of existing behavioral patterns (i.e., the
status quo), even if there are better alternatives or incentives to change” (Polites and
Karahanna, 2012, p.24). In short, it reflects a consumer’s unwillingness to leave the status quo
regardless of the presence of any current or future alternatives. In this study, it refers to the
consumer’s attachment to and persistence in using cash, even with the availability of m-
payment. IN is posited to enhance one’s resistance to change regardless of their views on the
alternatives (Barnes and Stack, 2016). This is also said to be true in the context of service in
general (Gray et al., 2017). Past studies that have established IN as a significant determinant
of SI in mobile-related services. This includes settings in m-payment (Gong et al., 2020; Wang
et al., 2019), mobile application (Li, 2018), and mobile instant messaging (Sun et al., 2017).
Therefore, it is proposed that consumers with high IN are likely to continue using cash and be
reluctant to use m-payment. Therefore, the following hypothesis is derived:
H7: IN has a significantly negative relationship with SI to m-payment.
From all the hypotheses developed, the conceptual framework of this study is shown in
Figure 1.
<Figure 1 about here>
4. Research Methodology
4.1. Data Collection and Sampling Method
Data was collected in several shopping malls around the Klang Valley region given the high
population density in Klang Valley whereby 25.5% of the population is clustered in this area
(Department of Statistics Malaysia, 2018a). Furthermore, highly popular shopping centers
were selected because of the high traffic of Malaysian consumers with different demographics
(Wong et al., 2015). Additionally, Kuala Lumpur has the highest mobile-broadband
penetration rate per 100 inhabitants whereas Selangor is the fifth-highest state concerning this
among all the states in Malaysia (MCMC, 2018). From the payment perspective, a large
number of payment transactions happen in Klang Valley. This is based on the fact that this
region contributed nearly 40% to the country’s gross domestic product and is among the top
four states in terms of economic growth (Department of Statistics Malaysia, 2018b).
Malaysian mobile device users were targeted as it was found that this group has a
greater propensity for using mobile devices for commerce-related activities than non-mobile
users (Sim et al., 2014). Only respondents who concurred to have used mobile devices to make
payment before when queried were sought to participate in this study. Therefore, purposive
sampling was used in this study. A short briefing on the definitions and terminologies was
subsequently given to the respondents. Additionally, the researchers were around to answer
any questions that the respondents had regarding the questionnaire to eliminate the possibility

that the respondents answer it without totally comprehending the content. The questionnaires
were collected back as soon as the participants completed every section.
The minimum sample was estimated using G*Power software to be 103 given the
presence of 7 exogenous constructs and a significance level of 0.05 to achieve a statistical
power of 80%. Thus, the sample size of 343 gained from the distribution of 400 questionnaires
which translates to an 85.75% response rate is sufficient for this study.
4.2. Measurement of instrument
There are three sections in the survey. Section A enquires on the demographic profile whereas
Section B and Section C look into the exogenous and endogenous constructs respectively. A
total of 32 measurement items adapted from the existing literature were used in this survey.
The respondents’ level of agreement or disagreement towards the measurement items was
gauged using a seven-point Likert scale ranging from (1) strongly disagree to (7) strongly
agree. The items and their particular sources are listed in Table 1.
<Table 1 about here>
5. Analysis of Data
5.1 Descriptive Statistics
The demographic profiles of respondents are summarized in Table 2 with 42.27% of the
respondents being male while 57.73% were female. The majority are between the age of 20
and 24 whereas more than half of the respondents possess a bachelor's degree/professional
qualification.
<Table 2 about here>
5.2. Statistical Analysis
The multivariate normality of this study was examined using the Web Power online tool to
determine the Mardia's multivariate skewness and kurtosis. Since both Mardia’s multivariate
skewness (β = 6.21) and kurtosis (β = 94.00) were less than 0.001, this confirmed the issue of
non-normality present in the data. Henceforth, SmartPLS 3 (a variance-based SEM software)
is ideal for this study since it has less restrictive assumptions on normality. Additionally,
SmartPLS 3 maximizes the explained variance of all exogenous constructs and supports
prediction-oriented goals (Leong et al., 2019).
5.3 Common Method Bias
Common method bias (CMB) is problematic when the survey data are collected from a single
informant. Therefore, to check on the magnitude of such bias, the study deployed a combination
of two approaches namely procedural and statistical approach. In the procedural approach, the
study ensured clarity of questioning and adopted a standard survey procedure (Stocchi et al.,
2019). The assessment of the statistical approach follows the latent method factor approach by
Liang et al. (2007). The "method model included factor loadings linking the method effect
latent variable to the substantive indicators" (Chou et al., 2015, p. 370). Table 3 shows the
average substantive factor loading explained variance of the construct's indicators is 0.769.
However, the average method factor loading is -0.001. Given that method factor loading shows
insignificant and small values, CMB was unlikely to pose a serious threat in this study.
<Table 3 about here>

5.4 Assessing the Outer Measurement Model
The study tested the adequacy of the measurement model by evaluating internal reliability,
convergent validity, and discriminant validity. In Table 4, every construct has composite
reliability (CR) and Dijkstra-Henseler's rho (rho_A) values that are above 0.7 which indicates
that the reflective items were considered satisfactory (Talukder et al., 2019). Factor loadings
and average variance extracted (AVE) were examined for convergent validity (CV). All factor
loadings in Table 4 are above 0.7 except MV4 at 0.567. Tan and Ooi (2018, p. 1627) stressed
that "outer loading between 0.4 and 0.7 can be accepted if other indicators with high loading
can explain 50 percent of the AVE". Thus, MV4 has been retained since AVE exceeded the
minimum threshold. The AVE for each construct exceeded 0.50 which denotes that the
acceptable level of CV has been achieved (Buyucek et al., 2019). Additionally, the study
examined discriminant validity (DV) by using the Hetero-Trait-Mono-Trait (HTMT) ratio of
correlations (Henseler et al., 2015). As shown in Table 5, all values are within the threshold
criterion of HTMT scores (HTMT < 0.85). DV was further assessed using the HTMT inference
ratio method through a non-parametric bootstrap approach. All values in the brackets for Table
5 show the lower and upper bounds of the 95% confidence interval and as the values were
lower than one for each relationship, DV has been established.
<Table 4 about here>
<Table 5 about here>
5.5 Inspecting the Inner Structural Model
Standardized root means square residual (SRMR) was also applied to check the model fit. The
overall model is deemed fit as both the saturated and estimated values are 0.056 and 0.073
respectively, which is below 0.08 (Gao et al., 2018). All variance inflation factor ranged from
1.063 to 2.037 and is below the threshold value of 3.3 (Aw et al., 2019). Therefore,
multicollinearity is not an issue in this study. Furthermore, the hypothesized relationships were
assessed based on the level of significance of the path coefficient using a 5000 bootstrapping
subsample method. The results in Table 6 and Figure 2 revealed that AA (β = 0.164, p < 0.05),
IN (β = -0.231, p < 0.001) and PSP (β = 0.179, p < 0.05) have significant relationships with SI
to m-payment. However, the relationships between MV (β = 0.035, p > 0.05) and TR (β =
0.118, p > 0.05) with SI to m-payment were not supported. Additionally, SC (β = 0.324, p <
0.001) and TPH (β = 0.39, p < 0.001) have significant relationships with IN. Therefore, all the
proposed hypotheses are supported except H1 and H3. The non-significant relationships have
been further confirmed as the values of the bias-corrected confidence intervals are between -1
to 1 (Aw et al., 2019).
Moreover, Table 7 reveals that the research model can explain 31.9% and 24.9% of the
variance in IN and SI to m-payment respectively which indicates a high level of in-sample
prediction (Tan and Ooi, 2018). R2, however, only captured on the model’s in-sample
explanatory power and did not capture the out-of-sample predictive performance. Hence, the
study adopts the PLSpredict approach from Shmueli et al. (2016) by focusing on the key target
construct (SI to m-payment). All the Q2 values obtained for SI to m-payment in Table 8 indicate
positive values and are all greater than 0 which suggests sufficient predictive power of the
model to predict (Ahmad et al., 2019). As none of the indicators for root mean squared error
(RMSE) and the mean absolute error (MAE) in the PLS-SEM model have a higher value than
those of the naïve linear model, the model has high predictive power (Shmueli et al., 2019).
<Table 6 about here>
<Table 7 about here>
<Table 8 about here>

<Figure 2 about here>
5.6 The Predictive Relevance and Effect Size
The model's predictive quality was assessed using a blindfolding procedure with an omission
distance of nine to obtain Stone-Geisser's Q2 value. Q2 values as shown in Table 7 for IN and
SI to m-payment are 0.253 and 0.192 respectively. Since both values are above zero, the model
exhibits predictive relevance (Ooi and Tan, 2018). The study further assessed the f2 effect size
using the following guideline by Cohen (2013) whereby 0.02, 0.15, and 0.35 indicate small,
medium, and large effects. If the value of f2 is less than 0.02, it shows that there is no effect
(Ooi and Tan, 2018). The results in Table 9 show that AA, IN, and PSP have small effects on
SI to m-payment whereas MV and TR do not affect SI to m-payment. Additionally, SC and
TPH have small and medium effects on IN respectively.
<Table 9 about here>
5.7 Importance Performance Map Analysis
The study further extends the PLS-SEM results by performing the Importance-Performance
Map Analysis (IMPA). IMPA helps to identify key target constructs that have a strong total
effect but low performance so that strategic decisions can be implemented (Souiden et al.,
2019). Concerning the predecessors of SI to m-payment as shown in Table 10, AA shows the
highest importance (0.17), followed by PSP (0.16), TR (0.11), MV (0.04), SC (-0.06), TPH (-
0.09) and IN (-0.21). On the performance level to predict SI to m-payment, AA (64.52) is the
most influential followed by MV (64.11), TPH (59.21), TR (58.07), IN (53.43), PSP (53.17)
and SC (44.29). Emphasis should be concentrated on PSP as the construct shows high
importance (0.16) but low performance (53.17).
<Table 10 about here>
6. Discussion
Despite the seemingly skewed proportion of younger respondents, the sample is deemed to be
representative of the population. This is because a high percentage of smartphone users in the
country are between the ages of 20 to 34 years old while the percentage of smartphone users
decreases for the age groups thereafter (MCMC, 2018). With reference to the same source, it
was reported that most of these smartphone users have an income of RM3000 and below. This
is in addition to several sources (Nielsen, 2019; PwC, 2018) which have indicated that the
younger, tech-savvy population is a strong catalyst for m-payment adoption. As this study only
solicited responses from those who have experience with using mobile devices to make
payment, the above-mentioned scenario is reinforced. Therefore, the representativeness of the
sample is affirmed.
According to the results, all but two of the hypotheses developed were statistically
supported. Surprisingly, H1 which represents the push factor is not supported. This could be
attributed to the fact that most of the respondents do not use m-payment daily. Furthermore,
Malaysians use m-payment to pay for small transactions (Pikri, 2019). Thus, the cumulative
financial savings would be difficult to be noticed by m-payment users in such a situation. In
contrast, H2 which represents the pull factor is supported. There are features such as the ease
of use and speed of completing transactions that make m-payment more attractive than cash.
Furthermore, there are several m-payment platforms available in Malaysia; with each platform
having its unique user interface, features, functionality, and so on. Hence, consumers can either
choose one or several m-payment platforms that are compatible with their lifestyles.

Moreover, the two mooring variables had contrasting results. H3 which relates to TR is
not supported. This could be because the majority of the respondents use m-payment at least
once a month. Hence, this situation implies that there is a certain level of trust users have with
m-payment. However, the result whereby PSP is a significant determinant of SI to m-payment
supports H4. Additionally, the IMPA suggests that emphasis should be given to PSP as it is of
high importance. This is aligned with a study by Nielsen (2019) whereby they found that
security and privacy concerns are the main reasons Malaysians do not use m-payment. These
are valid concerns as m-payment platforms store users’ personal information such as identity
card numbers, bank account details, and other personal information. Therefore, the worry is
that these private information of theirs might end up in the wrong hands.
Furthermore, all hypotheses on the SQB variables (H4, H5, and H6) are statistically
supported. Firstly, SC and TPH have significantly positive effects on IN. As the dynamics of
using cash and m-payment are different, there would be costs involved when transitioning from
cash to m-payment. These costs can be intangible which include the effort and time to learn
and use m-payment (Cheng et al., 2019). Moreover, switching to m-payment involves changing
consumers' existing payment habits due to the inherent differences of both payment methods.
As consumers have been using cash much earlier on, they may not be familiar with or
accustomed to m-payment which is a relatively recent innovation and hold some concerns
towards it. Besides that, as IN reflects the resistance to change, it is a significant deterrent of
SI to m-payment given people’s dispositional tendency is to resist or avoid change (Gan, 2016).
Overall, IN is an important mechanism to which TPH and SC negatively impact SI to m-
payment.
7. Implications
Theoretically, this study advances our understanding of the formation of SI within the emerging
context of m-payment. Although SI has been previously investigated in various situations, it
has rarely been utilized in the m-payment setting. Additionally, this study considered the effect
of cash on consumers in the m-payment context which has been largely overlooked by past
studies. The factors affecting consumers’ SI from cash to m-payment were studied with an
integrated model consisting of the PPM framework and SQB perspective. As both theories
have received relatively less attention, this study extends the literature in migration behavior
and innovation resistance in the context of m-payment. This research also establishes that the
uniquely integrated model is effective in studying the subject matter. This study enriches the
PPM framework by providing empirical justifications for the inclusion of specific contextual
variables and confirms the applicability of the SQB perspective in the SI to m-payment context.
In particular, the presence and significance of SQB reflected in the construct of IN along with
its antecedents have been validated. Moreover, the importance of IN is reflected by its high
negative influence on SI to m-payment in the context of a developing country. Also, the
integration of other constructs that are not technological-based is established to be valid. Practically, m-payment service providers should highlight the benefits of their services
to make it seem more attractive which will strengthen the reasons for consumers to switch.
Providers should demonstrate the superiority of m-payment over cash in a contemporary
setting. This is in view that consumers may be pulled towards m-payment even in the absence
of being pushed away from cash. Moreover, providers should focus on the security and privacy
aspects by integrating encryption into their service while performing regular security and
privacy updates. Additionally, interesting and easy-to-understand approaches to explain such
measures and updates should also be done so that users are made aware of such things.
Furthermore, a notification system should be implemented whereby users are notified of any

unauthorized access happening in real-time. Besides, the government should help to provide
assurances in the technological and legal structures to help m-payment users feel more secure.
This can be done by updating the relevant laws to cover current issues of data privacy and
providing funds to improve the security infrastructure of m-payment services.
Furthermore, providers should pay attention to IN by recognizing the different IN
components and execute appropriate strategic actions. The bias effect suggests that providers
should focus on information dissemination in changing the biased perceptions of users with
high IN . With regards to SC, providers should make their m-payment service easy to learn and
use which will minimize the time and effort to be skillful at using it. This can be in terms of
online personal assistance and step-by-step tutorials. Moreover, regarding TPH, providers
should form strategic alliances with the government, telecommunications companies, and
retailers to implement habit alteration strategies. For instance, retailers provide cashback while
telecommunication companies provide free data for consumers to use m-payment which is
subsidized by the government. Thus, the overall suggestion is to foster a more conducive
environment to develop the habit of using m-payment which also helps to alleviate the concerns
of SC.
With the increase of m-payment adoption and decrease in cash usage, the costs of cash
can be decreased. These costs include the printing, storing, and distribution of cash incurred by
the banks and government. Overall, the annual cost of cash incurred by Malaysian citizens
totals up to RM9 billion (BigPay, 2019). These savings can provide the government with excess
funds which can be reallocated to develop other sectors of the country’s economy.
8. Limitations and future research
Firstly, this research only looked at the subject matter from the Malaysian perspective with a
limited profile of respondents. Thus, the insights may not accurately reflect the variations of
perceptions towards SI to m-payment in other countries as well as among the different age
groups. Therefore, future research should look into conducting cross-country research and/or
comparative study between the various age groups to widen the scope of the study. Secondly,
future studies can expound on the antecedents of exogenous variables such as value (Zhang et
al., 2019), privacy (Gong et al., 2019), and TR (Cao et al., 2018). Also, there are other factors
not included in this study that could have significant impacts on the SI to m-payment. As the
PPM and SQB do not mandate fixed factors for the push, pull, or mooring and antecedents of
IN respectively, future studies can adapt the model to include more unique push (e.g.
convenience) and pull (e.g. referent network size) factors that have been previously discovered
to be significant in the mobile setting (Cheng et al., 2019). Furthermore, future research can
also consider studying the moderating effects of age (Loh et al., Forthcoming) and SQB
variables (e.g. IN and SC) on the relationships among PPM variables with SI (Wang et al.,
2019; Wirth and Maier, 2017) to obtain more comprehensive findings. Finally, this research
looks into the SI to m-payment with a cross-sectional approach. However, the longitudinal
approach should be considered by future researchers as the m-payment landscape is constantly
changing. This will allow researchers to gauge the changes in factors and observe the
differences over time which would provide for a more comprehensive evaluation.
References
Ahmad, N. H., Ramayah, T., Mahmud, I., Musa, M., and Anika, J. J. (2019), “Entrepreneurship
as a preferred career option”, Education+ Training, Vol. 61 No.9, pp.1151-1169.

Aw, E. C. X., Basha, N. K., Ng, S. I., and Sambasivan, M. (2019), “To grab or not to grab?
The role of trust and perceived value in on-demand ridesharing services”, Asia Pacific
Journal of Marketing and Logistics, Vol. 31 No. 5, pp.1442-1465.
Balapour, A., Nikkhah, H. R., and Sabherwal, R. (2020), “Mobile application security: role of
perceived privacy as the predictor of security perceptions”, International Journal of
Information Management, Vol. 52, pp.1-13.
Bansal, H. S., Taylor, S. F., and St. James, Y. (2005), ““Migrating” to new service providers:
toward a unifying framework of consumers’ switching behaviors”, Journal of the
Academy of Marketing Science, Vol. 33 No. 1, pp.96-115.
Bank Negara Malaysia. (2017), “Financial stability and payment systems report 2017”,
available at: https://www.bnm.gov.my/files/publication/fsps/en/2017/fs2017_book.pdf
(accessed 12 November 2019)
Bank Negara Malaysia. (2018), “Financial stability and payment systems report 2018”,
available at: http://www.bnm.gov.my/files/publication/fsps/en/2018/fs2018_book.pdf
(accessed 12 November 2019)
Barbero, L., Caprara, P., Infantino, M., and Mancini, S. (2016), “Mobile proximity payment: 5
things retailers should know”, PwC, available at:
https://www.pwc.com/it/it/publications/assets/docs/mobile-proximity.pdf (accessed 12
November 2019)
Barnes, W. and Stack, M. (2016), “Old habits die hard: path dependency and behavioural lock-
in”, Journal of Economic Issues, Vol. 38 No. 2, pp.371-377.
BigPay. (2019), “What's the cost of cash to Malaysians?”, available at:
https://www.bigpayme.com/post/what-is-the-cost-of-cash (accessed 1 July 2020)
Birruntha, S. (2019), “The best e-wallets in Malaysia, as ranked by users”, The Malaysian
Reserve, 29 October, available at: https://themalaysianreserve.com/2019/10/29/the-best-
e-wallets-in-malaysia-as-ranked-by-users/ (accessed 12 November 2019)
Blut, M., Frennea, C. M., Mittal, V., and Mothersbaugh, D. L. (2015), “How procedural,
financial and relational switching costs affect customer satisfaction, repurchase
intentions, and repurchase behavior: a meta-analysis”, International Journal of Research
in Marketing, Vol. 32 No. 2, pp.226-229.
Busu, S., Karim, N.A. and Haron, H. (2018), “Factors of adoption intention for near field
communication mobile payment”, Indonesian Journal of Electrical Engineering and
Computer Science, Vol. 11 No. 1, pp.98-104.
Buyucek, N., Knox, K., and Rundle-Thiele, S. (2019), “A positive behavioral approach:
identifying theoretical factors influencing moderate drinking practices”, Social
Marketing Quarterly, Vol. 25 No. 2, pp.107-122.
Cao, X., Yu, L., Liu, Z., Gong, M., and Adeel, L. (2018), “Understanding mobile payment
users’ continuance intention: a trust transfer perspective”, Internet Research, Vol. 28 No.
2, pp.456-476.
Chandra, S., Srivastava, S. C., and Theng, Y. L. (2010), “Evaluating the role of trust in
consumer adoption of mobile payment systems: an empirical analysis”, Communications
of the Association for Information Systems, Vol. 27 No. 1, pp.561-588.
Chang, C. Y. C. (2009), “Does price matter? How price influences online consumer decision-
making”, Japanese Journal of Administrative Science, Vol. 22 No. 3, pp.245-254.
Chang, H. H., Wong, K. H., and Li, S. Y. (2017), “Applying push-pull-mooring to investigate
channel switching behaviors: m-shopping self-efficacy and switching costs as
moderators”, Electronic Commerce Research and Applications, Vol. 24, pp.50–67.
Chang, I. C., Liu, C. C., and Chen, K. (2014), “The push, pull and mooring effects in virtual
migration for social networking sites”, Information Systems Journal, Vol. 24 No. 4,
pp.323–346.

Cheng, S., Lee, S. J., and Choi, B. (2019), “An empirical investigation of users’ voluntary
switching intention for mobile personal cloud storage services based on the push-pull-
mooring framework”, Computers in Human Behavior, Vol. 92, pp.198–215.
Chong, A. Y. L., Chan, F. T., and Ooi, K. B. (2012), “Predicting consumer decisions to adopt
mobile commerce: cross country empirical examination between China and Malaysia”,
Decision Support Systems, Vol. 53 No. 1, pp.34-43.
Chou, C. H., Wang, Y. S., and Tang, T. I. (2015), “Exploring the determinants of knowledge
adoption in virtual communities: a social influence perspective”, International Journal
of Information Management, Vol. 35 No. 3, pp.364-376.
Chuah, S. H. W., Rauschnabel, P. A., Tseng, M. L., and Ramayah, T. (2018), “Reducing
temptation to switch mobile data service providers over time”, Industrial Management
& Data Systems, Vol. 118 No. 8, pp.1597-1628.
Cohen, J. (2013), Statistical power analysis for the behavioral sciences, Routledge, New York,
NY.
Dagger, T. S. and David, M. E. (2012), “Uncovering the real effect of switching costs on the
satisfaction-loyalty association: the critical role of involvement and relationship
benefits”, European Journal of Marketing, Vol. 46 No. 3/4, pp.447-468.
Department of Statistics Malaysia. (2018a), “Demographic statistics third quarter (Q3) 2018,
Malaysia”, available at:
https://www.dosm.gov.my/v1/index.php?r=column/cthemeByCat&cat=430&bul_id=b
Gs2eUViWlNoTDQybFJwanlEQW9YZz09&menu_id=L0pheU43NWJwRWVSZklW
dzQ4TlhUUT09 (accessed 10 December 2019)
Department of Statistics Malaysia. (2018b), “The performance of state's economy, 2017”,
available at:
https://www.dosm.gov.my/v1/index.php?r=column/cthemeByCat&cat=449&bul_id=L2
5EUXQxbWdBaEVoWXU5aTFQWUpNdz09&menu_id=TE5CRUZCblh4ZTZMODZ
Ibmk2aWRRQT09 (accessed 10 December 2019)
Gan, C. (2016), “An empirical analysis of factors influencing continuance intention of mobile
instant messaging in China”, Information Development, Vol. 32 No. 4, pp.1109-1119.
Gao, L. and Waechter, K. A. (2017), “Examining the role of initial trust in user adoption of
mobile payment services: an empirical investigation”, Information Systems Frontiers,
Vol. 19 No. 3, pp.525-548.
Gao, L., Waechter, K. A., and Bai, X. (2015), “Understanding consumers’ continuance
intention towards mobile purchase: a theoretical framework and empirical study – a case
of China”, Computers in Human Behavior, Vol. 53, pp.249-262.
Gao, W., Liu, Z., Guo, Q., and Li, X. (2018), “The dark side of ubiquitous connectivity in
smartphone-based SNS: an integrated model from information perspective”, Computers
in Human Behavior, Vol. 84, pp.185-193.
Gazi, F. (2020a), “Here’s how to claim your free RM30 from Boost, Grab, and TNG eWallet”,
available at: https://www.imoney.my/articles/rm30-e-tunai-rakyat-ewallet-credit
(accessed 12 November 2019)
Gazi, F. (2020b), “What is an e-wallet and how is it different from a credit card?”, available at:
https://www.imoney.my/articles/choosing-e-wallet (accessed 12 November 2019)
Gong, X., Zhang, K. Z. K., Chen, C., Cheung, C. M. K., and Lee, M. K. O. (2020), “Transition
from web to mobile payment services: the triple effects of status quo inertia”,
International Journal of Information Management, Vol. 50, pp.310–324.
Gong, X., Zhang, K. Z., Chen, C., Cheung, C. M., and Lee, M. K. (2019), “What drives self-
disclosure in mobile payment applications? The effect of privacy assurance approaches,
network externality, and technology complementarity”, Information Technology &
People, Vol. 33 No. 4, pp. 1174-1213.
Grant, M. (2019), “Mobile payment”, available at:
https://www.investopedia.com/terms/m/mobile-payment.asp (accessed 28 November
2019)
Gray, D. M., D’Alessandro, S., Johnson, L. W., and Carter, L. (2017), “Inertia in services:
Causes and consequences for switching”, Journal of Services Marketing, Vol. 31 No. 6,
pp.485-498.
Gupta, A. and Arora, N. (2017), “Understanding determinants and barriers of mobile shopping
adoption using behavioral reasoning theory”, Journal of Retailing and Consumer
Services, Vol. 36, pp.1-7.
Hair, J. F., Hult, G. T. M., Ringle, C., and Sarstedt, M. (2017), A primer on partial least squares
structural equation modeling (PLS-SEM) (2nd ed.), Sage Publications, London, UK.
Heda, S., Mewborn, S., and Caine, S. (2017), “How customers perceive a price is as important
as the price itself”, Harvard Business Review, 3 January, available at:
https://hbr.org/2017/01/how-customers-perceive-a-price-is-as-important-as-the-price-
itself (accessed 10 December 2019)
Henseler, J., Ringle, C. M., and Sarstedt, M. (2015), “A new criterion for assessing
discriminant validity in variance-based structural equation modelling”, Journal of the
Academy of Marketing Science, Vol. 43 No. 1, pp.115-135.
Huang, L., Mou, J., See-To, E. W., and Kim, J. (2019), “Consumer perceived value preferences
for mobile marketing in China: a mixed method approach”, Journal of Retailing and
Consumer Services, Vol. 48, pp.70-86.
Johnson, V. L., Kiser, A., Washington, R., and Torres, R. (2018), “Limitations to the rapid
adoption of m-payment services: understanding the impact of privacy risk on m-payment
services”, Computers in Human Behavior, Vol. 79, pp.111-122.
Jones, M. A., Mothersbaugh, D. L., and Beatty, S. E. (2000), “Switching barriers and
repurchase intentions in services”, Journal of Retailing, Vol. 76 No. 2, pp.259-274.
Keaveney, S. M. (1995), “Customer switching behavior in service industries: an exploratory
study”, Journal of Marketing, Vol. 59 No. 2, pp.71–82.
Kim, H. W. and Kankanhalli, A. (2009), “Investigating user resistance to information systems
implementation: a status quo bias perspective”, MIS Quarterly, Vol. 33 No. 3, pp.567–
582.
Kim, M. J., Chung, N., and Lee, C. K. (2011), “The effect of perceived trust on electronic
commerce: shopping online for tourism products and services in South Korea”, Tourism
Management, Vol. 32 No. 2, pp.256–265.
Köster, A., Matt, C., and Hess, T. (2016), “Carefully choose your (payment) partner: how
payment provider reputation influences m-commerce transactions”, Electronic
Commerce Research and Applications, Vol. 15, pp.26-37.
Lai, J. Y., Debbarma, S., and Ulhas, K. R. (2012), “An empirical study of consumer switching
behaviour towards mobile shopping: a push-pull-mooring model”, International Journal
of Mobile Communications, Vol. 10 No. 4, pp.386-404.
Lai, J. Y. and Wang, J. (2015), “Switching attitudes of Taiwanese middle-aged and elderly
patients toward cloud healthcare services: an exploratory study”, Technological
Forecasting and Social Change, Vol. 92, pp.155-167.
Lee, K. and Joshi, K. (2017), “Examining the use of status quo bias perspective in IS research:
need for re-conceptualizing and incorporating biases”, Information Systems Journal, Vol.
27 No. 6, pp.733–752.
Lee, R. and Neale, L. (2012), “Interactions and consequences of inertia and switching costs”,
Journal of Services Marketing, Vol. 26 No. 5, pp.365-374.

Lee, Y. K., Kim, S. Y., Chung, N., Ahn, K., and Lee, J. W. (2016), “When social media met
commerce: a model of perceived customer value in group-buying”, Journal of Services
Marketing, Vol. 30 No. 4, pp.398-410.
Leong, L. Y., Hew, T. S., Ooi, K. B., Lee, V. H., and Hew, J. J. (2019), “A hybrid SEM-neural
network analysis of social media addiction”, Expert Systems with Applications, Vol. 133,
pp.296-316.
Li, C. Y. (2018), “Consumer behavior in switching between membership cards and mobile
applications: the case of Starbucks”, Computers in Human Behavior, Vol. 84, pp.171-
184.
Liang, H., Saraf, N., Hu, Q., and Xue, Y. (2007), “Assimilation of enterprise systems: the effect
of institutional pressures and the mediating role of top management”, MIS Quarterly,
Vol. 31 No. 1, pp.59-87.
Lien, C. H., Wen, M. J., Huang, L. C., and Wu, K. L. (2015), “Online hotel booking: the effects
of brand image, price, trust and value on purchase intentions”, Asia Pacific Management
Review, Vol. 20 No. 4, pp.210-218.
Liu, F., Zhao, X., Chau, P. Y., and Tang, Q. (2015), “Roles of perceived value and individual
differences in the acceptance of mobile coupon applications”, Internet Research, Vol. 25
No. 3, pp.471-495.
Loh, X. M., Lee, V. H., Tan, G. W. H., Hew, J. J., and Ooi, K. B. (Forthcoming), “Towards a
cashless society: the imminent role of wearable technology”, Journal of Computer
Information Systems. doi: 10.1080/08874417.2019.1688733
Marriott, H. R. and Williams, M. D. (2018), “Exploring consumers perceived risk and trust for
mobile shopping: a theoretical framework and empirical study”, Journal of Retailing and
Consumer Services, Vol. 42, pp.133-146.
MCMC. (2018), “Communications & multimedia: Facts and figures (3Q 2018)”, available at:
https://www.mcmc.gov.my/skmmgovmy/media/General/pdf/CM-Facts-and-Figures-3Q
18.pdf (accessed 21 December 2019)
Ng, E. H. and Kwahk, K. Y. (2010), “Examining the determinants of mobile internet service
continuance: a customer relationship development perspective”, International Journal of
Mobile Communications, Vol. 8 No. 2, pp.210–229.
Nielsen. (2019), “Cash or cashless? Malaysia’s shifting payment landscape”, available at:
https://www.nielsen.com/my/en/insights/article/2019/cash-or-cashless-malaysias-
shifting-payment-landscape/ (accessed 12 November 2019)
Ong, J. (2020), “15 million Malaysians getting RM50 each in e-wallet funds to boost
contactless payments”, Malay Mail, 5 June, available at:
https://www.malaymail.com/news/malaysia/2020/06/05/15-million-malaysians-getting-
rm50-each-in-e-wallet-funds-to-boost-contactl/1872794 (accessed 12 November 2019)
Ooi, K. B. and Tan, G. W. H. (2016), “Mobile technology acceptance model: an investigation
using mobile users to explore smartphone credit card”, Expert Systems with Applications,
Vol. 59, pp.33-46.
Park, M., Jun, J., and Park, H. (2017), “Understanding mobile payment service continuous use
intention: an expectation-confirmation model and inertia”, Quality Innovation
Prosperity, Vol. 21 No. 3, pp.78-94.
Pikri, E. (2019), “How cashless is Malaysia right now?” available at:
https://fintechnews.my/19964/payments-remittance-malaysia/cashless-malaysia-credit-
debit-card-e-wallet-money/ (accessed 25 February 2020)
Polites, G. L. and Karahanna, E. (2012), “Shackled to the status quo: the inhibiting effects of
incumbent system habit, switching costs, and inertia on new system acceptance”, MIS
Quarterly, Vol. 36 No. 1, pp.21-42.

Porath, M. (2017), “Immediate payments: beyond ubiquity, convenience speed and security
paving the road to a cashless society”, Journal of Digital Banking, Vol. 1 No. 4, pp.349-
357.
PwC. (2018), “Banking on the e-wallet in Malaysia”, available at:
https://www.pwc.com/my/en/assets/blog/pwc-my-deals-strategy-banking-on-the-
ewallet-in-malaysia.pdf (accessed 3 August 2020)
Ravenstein, E. G. (1885), “The laws of migration”, Journal of the Statistical Society of London,
Vol. 48 No. 2, pp.167–235.
Samuelson, W. and Zeckhauser, R. (1988), “Status quo bias in decision making”, Journal of
Risk and Uncertainty, Vol. 1 No. 1, pp.7-59.
Sekhon, H., Ennew, C., Kharouf, H. and Devlin, J. (2014), “Trustworthiness and trust:
influences and implications”, Journal of Marketing Management, Vol. 30 No. 3-4,
pp.409-430.
Shaw, N. and Sergueeva, K. (2019), “The non-monetary benefits of mobile commerce:
extending UTAUT2 with perceived value”, International Journal of Information
Management, Vol. 45, pp.44-55.
Shi, X., Lin, Z., Liu, J., and Hui, Y. K. (2018), “Consumer loyalty toward smartphone brands:
the determining roles of deliberate inertia and cognitive lock-in”, Information and
Management, Vol. 55 No. 7, pp.866–876.
Shmueli, G., Sarstedt, M., Hair, J. F., Cheah, J. H., Ting, H., Vaithilingam, S., and Ringle, C.
M. (2019), “Predictive model assessment in PLS-SEM: guidelines for using PLSpredict”,
European Journal of Marketing, Vol. 53 No. 11, pp.2322-2347.
Shmueli, G., Ray, S., Estrada, J. M. V., and Chatla, S. B. (2016), “The elephant in the room:
predictive performance of PLS models”, Journal of Business Research, Vol. 69 No. 10,
pp.4552-4564.
Sim, J. J., Tan, G. W. H., Wong, J. C., Ooi, K. B., and Hew, T. S. (2014), “Understanding and
predicting the motivators of mobile music acceptance–a multi-stage MRA-artificial
neural network approach”, Telematics and Informatics, Vol. 31 No. 4, pp.569-584.
Souiden, N., Chaouali, W., and Baccouche, M. (2019), “Consumers’ attitude and adoption of
location-based coupons: the case of the retail fast food sector”, Journal of Retailing and
Consumer Services, Vol. 47, pp.116-132.
Stocchi, L., Michaelidou, N., and Micevski, M. (2019), “Drivers and outcomes of branded
mobile app usage intention”, Journal of Product & Brand Management, Vol. 28 No. 1,
pp.28-49.
Sun, Y., Liu, D., Chen, S., Wu, X., Shen, X. L., and Zhang, X. (2017), “Understanding users’
switching behavior of mobile instant messaging applications: an empirical study from the
perspective of push-pull-mooring framework”, Computers in Human Behavior, Vol. 75,
pp.727–738.
Talukder, S., Chiong, R., Dhakal, S., Sorwar, G., and Bao, Y. (2019), “A two-stage structural
equation modeling-neural network approach for understanding and predicting the
determinants of m-government service adoption”, Journal of Systems and Information
Technology, Vol. 21 No. 4, pp.419-438.
Tan, G. W. H. and Ooi, K. B. (2018), “Gender and age: do they really moderate mobile tourism
shopping behavior”, Telematics and Informatics, Vol. 35, pp.1617-1642.
Thakur, R. (2016), “Understanding customer engagement and loyalty: a case of mobile devices
for shopping”, Journal of Retailing and Consumer Services, Vol. 32, pp.151-163.
Trütsch, T. (2016), “The impact of mobile payment on payment choice”, Financial Markets
and Portfolio Management, Vol. 30 No. 3, pp.299-336.

Vatanasombut, B., Igbaria, M., Stylianou, A. C., and Rodgers, W. (2008), “Information
systems continuance intention of web-based applications customers: the case of online
banking”, Information and Management, Vol. 45 No. 7, pp.419–428.
Wang, L., Luo, X. R., Yang, X., and Qiao, Z. (2019), “Easy come or easy go? Empirical
evidence on switching behaviors in mobile payment applications”, Information &
Management, Vol. 56 No. 7, pp.1-13.
We Are Social. (2019), “Digital in 2019”, available at: https://wearesocial.com/global-digital-
report-2019 (accessed 12 November 2019)
Wieringa, J. E. and Verhoef, P. C. (2007), “Understanding customer switching behavior in a
liberalizing service market: an exploratory study”, Journal of Service Research, Vol. 10
No. 2, pp.174–186.
Wirth, J. and Maier, C. (2017), “Why individuals switch to using mobile payment: a migration-
theoretic, empirical study”, Twenty-third Americas Conference on Information Systems,
Boston, pp.1-10.
Wong, C. H., Tan, G. W. H., Loke, S. P., and Ooi, K. B. (2015), “Adoption of mobile social
networking sites for learning?”, Online Information Review, Vol. 39 No. 6, pp.762-778.
Wong, K. (2019), “Who snatch the throne to become the top e-wallet king/queen in Malaysia?”,
Medium, 8 November, available at: https://medium.com/@kenjiwong2772/who-snatch-
the-throne-to-become-the-top-e-wallet-king-queen-in-malaysia-32d8f8bde89f (accessed
12 November 2019)
Yeh, J. C., Hsiao, K. L., and Yang, W. N. (2012), “A study of purchasing behavior in Taiwan’s
online auction websites: effects of uncertainty and gender differences”, Internet
Research, Vol. 22 No. 1, pp.98–115.
Yuen, M. K. (2019), “Cashing in on e-wallets”, The Star, 3 February, available at:
https://www.thestar.com.my/news/nation/2019/02/03/cashing-in-on-ewallets-its-a-
growing-trend-more-people-are-using-ewallets-in-their-phones-these-days (accessed 12
November 2019)
Zhang, K. Z., Gong, X., Chen, C., Zhao, S. J., and Lee, M. K. (2019), “Spillover effects from
web to mobile payment services”, Internet Research, Vol. 29 No. 6, pp.1213-1232.
Zhang, H., Lu, Y., Gupta, S., and Gao, P. (2015), “Understanding group-buying websites
continuance: an extension of expectation confirmation model”, Internet Research, Vol.
25 No. 5, pp.767-793.
Zhou, T. (2016), “Understanding users’ switching from online stores to mobile stores”,
Information Development, Vol. 32 No. 1, pp.60-69.
Zhou, T. (2014), “An empirical examination of initial trust in mobile payment”, Wireless
Personal Communications, Vol. 77 No. 2, pp.1519-1531.

Figures and Tables
Figure 1: Conceptual Model
Figure 2: Structural Model Testing
Note: *p <0.05; ***p <0.001; NS Not supported.

Table 1: Constructs and Adapted Sources of Survey Items
Constructs Measurement Items Sources
Switching
Intention
SI1: I am considering switching from cash to mobile payment. Cheng et al.
(2019); Zhou
(2016) SI2: I intend to switch from cash to mobile payment in the future.
SI3: The chance of me to switch from cash to mobile payment is high.
SI4: I am determined to switch from cash to mobile payment.
Monetary
Value
MV1: By paying with cash, it would not help me save more money
than compared to mobile payment.
Thakur (2016)
MV2: By paying with cash, it would not give me better deals than
compared to mobile payment.
MV3: By paying with cash, it would not give me more exclusive time-
bound offers than compared to mobile payment.
MV4: Overall, by paying with cash, I would not spend less than
compared to mobile payment.
Alternative
Attractiveness
AA1: If I need to switch to mobile payment, there are good mobile
payment services to choose from.
Chuah et al.
(2018); Sun et al.
(2017) AA2: Mobile payment would benefit me more than cash.
AA3: I would probably be happy with the features and services of
mobile payment.
AA4: Compared to cash, I would probably be more satisfied with
mobile payment.
Trust TR1: I believe mobile payment is trustworthy. Köster et al.
(2016) TR2: I believe mobile payment keeps customers’ best interests in mind.
TR3: I believe mobile payment keeps its promises and commitments.
TR4: I believe mobile payment is reliable.
Perceived
Security and
Privacy
PSP1: I think using mobile payment is financially secure. Lai et al. (2012)
PSP2: I am not worried about the transaction security of mobile
payment.
PSP3: I think mobile payment has the ability to protect my privacy.
PSP4: I think using mobile payment does not put my privacy at risk.
Switching
Costs
SC1: Switching from cash to mobile payment will cost me much effort. Zhou (2016);
Jones et al.
(2000) SC2: Switching from cash to mobile payment will cost me much time.
SC3: Becoming skillful at using mobile payment would not be easy for
me.
SC4: In general, it would be troublesome to switch to mobile payment.
Traditional
Payment
Habit
TPH1: Whenever I need to pay, I unconsciously use cash. Park et al. (2017)
TPH2: Whenever I need to pay, I choose to use cash even without
being aware of the choices.
TPH3: It would be difficult to control my tendency to use cash when I
pay.
TPH4: I do not need to devote a lot of mental effort in deciding that I
will use cash to pay.
Inertia IN1: I will continue using cash to pay because it would be stressful to
change to mobile payment.
Polites and
Karahanna
(2012) IN2: I will continue using cash to pay because I am comfortable doing
so.
IN3: I will continue using cash to pay because it is what I have always
done.
IN4: I will continue using cash to pay because I’ve done it so regularly
in the past.

Table 2: Descriptive Characteristics of the Participants
Demographic Characteristics Count Percentage (%)
Gender Female 198 57.73
Male 145 42.27
Age 15 to 19 years 57 16.62
20 to 24 years 177 51.60
25 to 29 years 47 13.70
30 to 34 years 29 8.45
35 to 39 years 10 2.92
40 to 44 years 6 1.75
45 to 49 years 8 2.33
50 years and above 9 2.62
Personal income / allowance (per month) Less than RM2,000 221 64.43
RM2,001 to RM4,000 81 23.62
RM4,001 to RM6,000 20 5.83
RM6,001 to RM8,000 14 4.08
RM8,001 to RM10,000 6 1.75
RM10,001 and above 1 0.29
Highest level of education Primary or secondary education 37 10.79
Diploma / advance diploma 78 22.74
Bachelor’s degree / professional
qualification 201 58.6
Postgraduate 27 7.87
Number of smart mobile devices
currently in possession Less than 3 devices 235 68.51
3 to 5 devices 68 19.83
More than 5 devices 40 11.66
Experience of using smart mobile
devices in general Less than 3 years 100 29.15
3 to 5 years 57 16.62
More than 5 years 186 54.23
Experience of using smart mobile
devices specifically to make payment Less than 3 years 214 62.39
3 to 5 years 98 28.57
More than 5 years 31 9.04
Frequency of using smart mobile devices
to make payment Every day 51 14.87
Every week 85 24.78
Every month 105 30.61
Every 3 months 27 7.87
Every 6 months 43 12.54
Every year 32 9.33

Table 3: Common Method Factor Analysis
Latent Constructs Indicators
Substantive
factor
loadings (Ra)
Ra2 Method factor
loadings (Rb) Rb2
Switching Intention SI1 0.843*** 0.711 0.017 NS 0.000
SI2 0.873*** 0.762 0.024 NS 0.001
SI3 0.902*** 0.814 0.022 NS 0.000
SI4 0.943*** 0.889 -0.062* 0.004
Monetary Value MV1 0.856*** 0.733 -0.080 NS 0.006
MV2 0.803*** 0.645 0.094* 0.009
MV3 0.722*** 0.521 0.157 ** 0.025
MV4 0.832*** 0.692 -0.189*** 0.036
Alternative Attractiveness AA1 0.858*** 0.736 -0.056NS 0.003
AA2 0.869*** 0.755 0.014 NS 0.000
AA3 0.917*** 0.841 -0.028 NS 0.001
AA4 0.827*** 0.684 0.067 NS 0.004
Trust TR1 0.834*** 0.696 0.073 NS 0.005
TR2 0.914*** 0.835 -0.001 NS 0.000
TR3 0.958*** 0.918 -0.052 NS 0.003
TR4 0.935*** 0.874 -0.018 NS 0.000
Perceived Security and Privacy PSP1 0.797*** 0.635 0.129*** 0.017
PSP2 0.896*** 0.803 -0.012 NS 0.000
PSP3 0.943*** 0.889 -0.058* 0.003
PSP4 0.959*** 0.920 -0.056* 0.003
Switching Costs SC1 0.901*** 0.812 -0.010 NS 0.000
SC2 0.899*** 0.808 -0.012 NS 0.000
SC3 0.918*** 0.843 0.033 NS 0.001
SC4 0.897*** 0.805 -0.011 NS 0.000
Traditional Payment Habit TPH1 0.870*** 0.757 0.048 NS 0.002
TPH2 0.820*** 0.672 -0.049 NS 0.002
TPH3 0.804*** 0.646 -0.023 NS 0.001
TPH4 0.803*** 0.645 0.025 NS 0.001
Inertia IN1 0.739*** 0.546 -0.138** 0.019
IN2 0.958*** 0.918 0.046 NS 0.002
IN3 0.969*** 0.939 0.055 NS 0.003
IN4 0.929*** 0.863 0.024 NS 0.001
Average 0.875*** 0.769 -0.001 0.005
Note: ***p<0.001; **p<0.01; *p< 0.05, NSnot significant.

Table 4: Loading, Composite Reliability, Dijkstra Henseler and Average Variance
Extracted Latent
Constructs Items Loadings
Composite
Reliability (CR)
Dijkstra Henseler’s
(rho_A)
Average Variance
Extracted (AVE)
Switching
Intention SI1 0.855 0.939 0.915 0.793
SI2 0.892
SI3 0.918
SI4 0.897
Monetary
Value MV1 0.746 0.861 0.856 0.614
MV2 0.896
MV3 0.880
MV4 0.567
Alternative
Attractiveness AA1 0.811 0.924 0.901 0.752
AA2 0.881
AA3 0.893
AA4 0.881
Trust TR1 0.894 0.951 0.934 0.829
TR2 0.912
TR3 0.919
TR4 0.918
Perceived
Security and
Privacy
PSP1 0.897 0.944 0.936 0.807
PSP2 0.890
PSP3 0.889
PSP4 0.917
Switching
Costs SC1 0.898 0.947 0.931 0.816
SC2 0.902
SC3 0.903
SC4 0.911
Traditional
Payment Habit TPH1 0.849 0.894 0.852 0.679
TPH2 0.855
TPH3 0.808
TPH4 0.782
Inertia IN1 0.842 0.945 0.922 0.812
IN2 0.924
IN3 0.928
IN4 0.909

Table 5: Hetero-Trait-Mono-Trait Assessment
Latent Construct SI MV AA TR PSP SC TPH IN
Switching Intention
Monetary Value
0.226
[0.136,
0.36]
Alternative Attractiveness
0.359
[0.228,
0.479]
0.581
[0.464,
0.677]
Trust
0.387
[0.256,
0.504]
0.311
[0.167,
0.443]
0.336
[0.198,
0.460]
Perceived Security and Privacy
0.372
[0.246,
0.485]
0.220
[0.102,
0.363]
0.204
[0.090,
0.338]
0.735
[0.638,
0.815]
Switching Costs
0.312
[0.182,
0.432]
0.176
[0.125,
0.270]
0.307
[0.170,
0.435]
0.169
[0.061,
0.299]
0.154
[0.051,
0.284]
Traditional Payment Habit
0.133
[0.069,
0.275]
0.096
[0.081,
0.210]
0.110
[0.055,
0.261]
0.065
[0.043,
0.204]
0.080
[0.050,
0.212]
0.277
[0.154,
0.399]
Inertia
0.389
[0.276,
0.494]
0.207
[0.131,
0.329]
0.344
[0.218,
0.455]
0.265
[0.138,
0.388]
0.234
[0.105,
0.355]
0.448
[0.336,
0.548]
0.528
[0.407,
0.636] Note: The values in the brackets represent the lower and the upper bounds of the 95% confidence interval.

Table 6: Outcome of the Structural Model Examination
Hypotheses PLS Paths Original Mean (O) Sample Mean (M) Standard Deviation
(STDEV)
T Statistics
(|O/STDEV|) P-values
Bias corrected
confidence intervals Supported?
H1 MV -> SI 0.035NS 0.046 0.059 0.597 0.551 [-0.097, 0.140] No
H2 AA -> SI 0.164* 0.160 0.068 2.402 0.016 [0.036, 0.299] Yes
H3 TR -> SI 0.118NS 0.117 0.086 1.374 0.170 [-0.046, 0.294] No
H4 PSP -> SI 0.179* 0.180 0.077 2.335 0.020 [0.024, 0.320] Yes
H5 SC -> IN 0.324*** 0.325 0.047 6.894 0.000 [0.232, 0.417] Yes
H6 TPH -> IN 0.390*** 0.392 0.054 7.189 0.000 [0.274, 0.486] Yes
H7 IN -> SI -0.231*** -0.230 0.053 4.377 0.000 [-0.337, -0.126] Yes
Notes:
a. SI = Switching Intention; MV = Monetary Value; AA = Alternative Attractiveness; TR = Trust; PSP = Perceived Security and Privacy; SC = Switching Costs; TPH = Traditional Payment Habit; IN = Inertia.
b. *p <0.05; ***p <0.001; NS not significant.
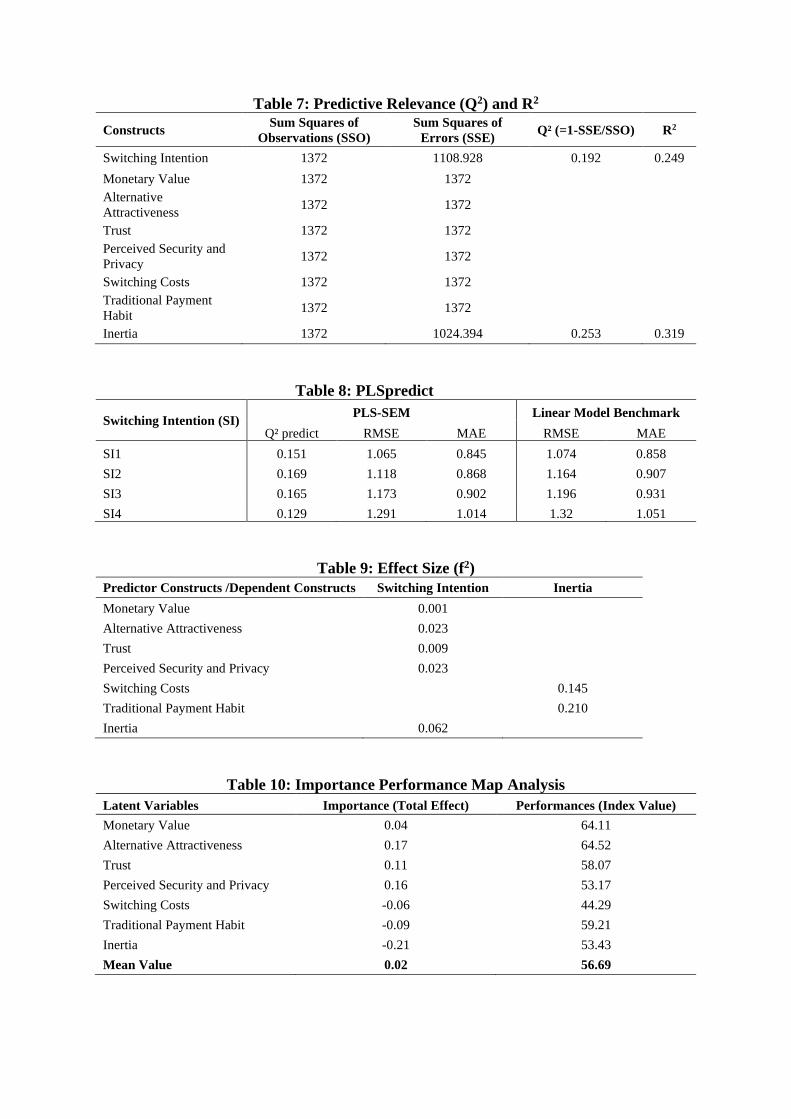
Table 7: Predictive Relevance (Q2) and R2
Constructs Sum Squares of
Observations (SSO)
Sum Squares of
Errors (SSE) Q² (=1-SSE/SSO) R2
Switching Intention 1372 1108.928 0.192 0.249
Monetary Value 1372 1372
Alternative
Attractiveness 1372 1372
Trust 1372 1372
Perceived Security and
Privacy 1372 1372
Switching Costs 1372 1372
Traditional Payment
Habit 1372 1372
Inertia 1372 1024.394 0.253 0.319
Table 8: PLSpredict
Switching Intention (SI) PLS-SEM Linear Model Benchmark
Q² predict RMSE MAE RMSE MAE
SI1 0.151 1.065 0.845 1.074 0.858
SI2 0.169 1.118 0.868 1.164 0.907
SI3 0.165 1.173 0.902 1.196 0.931
SI4 0.129 1.291 1.014 1.32 1.051
Table 9: Effect Size (f2)
Predictor Constructs /Dependent Constructs Switching Intention Inertia
Monetary Value 0.001
Alternative Attractiveness 0.023
Trust 0.009
Perceived Security and Privacy 0.023
Switching Costs 0.145
Traditional Payment Habit 0.210
Inertia 0.062
Table 10: Importance Performance Map Analysis Latent Variables Importance (Total Effect) Performances (Index Value)
Monetary Value 0.04 64.11
Alternative Attractiveness 0.17 64.52
Trust 0.11 58.07
Perceived Security and Privacy 0.16 53.17
Switching Costs -0.06 44.29
Traditional Payment Habit -0.09 59.21
Inertia -0.21 53.43
Mean Value 0.02 56.69