Embed Size (px)
Citation preview
i
Sydney Airport Operational Statistics April 2015
1
PREVIEW Sydney Airport Operational Statistics Report Preview April 2015 Total Runway Movements (excluding helicopter operations) (refer pages 6-11) There were a total of 26,320 aircraft movements this month (daily average 877.33). Last month there were a total of 27,371 movements (daily average 882.94) and for the same month last year there were a total of 26,488 movements (daily average 882.93). Mode Utilisation (refer pages 12 & 14) Individual mode use in excess of 9 hours occurred on 28 days this month, Mode 9 on 9 days and Mode 10 on 19 days. Crossing runway modes (including Sodprops) were used for 13.38% of non Curfew hours. Mode 15 was introduced during RESA works (commenced October 2008) and ceased being used at the completion of RESA (April 2010). Runway End Impact Long Term Operating Plan (LTOP) Targets (refer page 13) LTOP targets - North 17% - South 55% - East 13% - West 15% The two fundamental factors which influence the selection of a runway and therefore the LTOP targets are forecast or prevailing weather and traffic levels. This month’s results are as follows: North 37.29% - This result is above the LTOP target and above the previous month (34.76%) South 51.48% - This result is below the LTOP target and below the previous month (51.85%) East 9.98% - This result is below the LTOP target and above the previous month (9.65%) West 1.25% - This result is below the LTOP target and below the previous month (3.74%) 16 Precision Runway Monitor (PRM) Operations (refer page 15) This procedure was used on 10, 13, 17, 20, 29, and 30 of April for a total of 13 hours and 36 minutes (ATIS time). Noise Complaints & Information Service Environmental Services Airservices Australia telephone 1-800-802-584 facsimile (02) 9556-6641 e-mail [email protected] internet www.airservicesaustralia.com
2
Table of Contents Preview .................................................................................................................................. 1 Table of Contents ................................................................................................................... 2 Sydney Airport Runways ........................................................................................................ 3 Runway Modes of Operation .................................................................................................. 4 Preferred Runway Selection ................................................................................................... 5 Runway Movement Summary – All Aircraft ............................................................................ 6 Runway Movement Summary – Jet Aircraft only .................................................................... 7 Runway Movement Summary – Non Jet Aircraft only ............................................................. 8 Hourly Runway Movement Summary– All Movements ........................................................... 9 Hourly Runway Movement Summary – Arrivals ................................................................... 10 Hourly Runway Movement Summary – Departures .............................................................. 11 Mode Utilisation Summary / Cumulative Mode Utilisation from 1 January 2015 ................... 12 Runway End Impact ............................................................................................................. 13 Daily Mode Usage ................................................................................................................ 14 PRM Statistics ...................................................................................................................... 15 Noise Enquiry Service .......................................................................................................... 16 Jet Flight Path Movements * (1 - 30 April 2015) ................................................................... 17 Jet Flight Path Movements * (1 May 2014 - 30 April 2015) ................................................... 18 Jet Aircraft Respite (R60) * (1 - 30 April 2015) ..................................................................... 19 Jet Aircraft Respite (R60) * (1 May 2014 - 30 April 2015) ..................................................... 20 Jet Flight Path Movements (Explanation) ............................................................................. 21 Jet Aircraft Respite (R60) (Explanation) ............................................................................... 22 Measured Daily N70 Values ................................................................................................. 23
This report is available on the Internet at Airservices Australia website at
www.airservicesaustralia.com
click on “Publications”.
* This information is produced using Airservices Australia’s Noise and Flight Path Monitoring System and the TNIP software
package developed by the Department of Infrastructure and Transport.
3
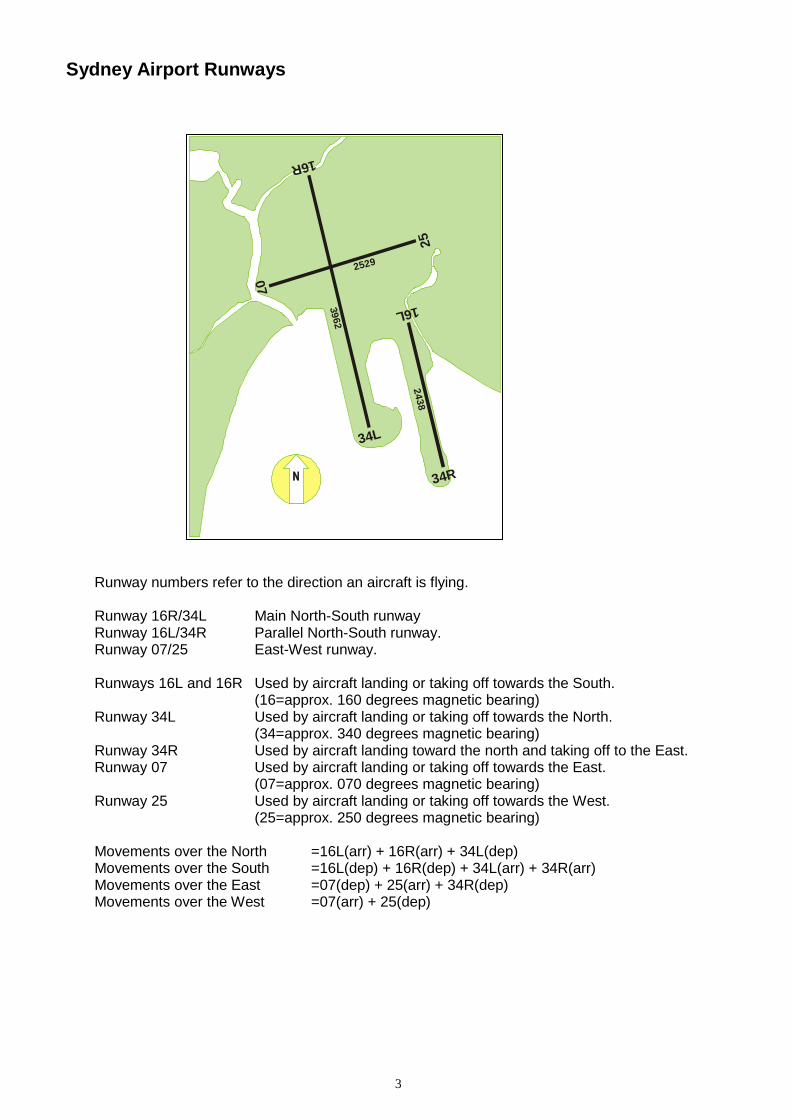
Sydney Airport Runways
Runway numbers refer to the direction an aircraft is flying. Runway 16R/34L Main North-South runway Runway 16L/34R Parallel North-South runway. Runway 07/25 East-West runway. Runways 16L and 16R Used by aircraft landing or taking off towards the South. (16=approx. 160 degrees magnetic bearing) Runway 34L Used by aircraft landing or taking off towards the North.
(34=approx. 340 degrees magnetic bearing) Runway 34R Used by aircraft landing toward the north and taking off to the East. Runway 07 Used by aircraft landing or taking off towards the East. (07=approx. 070 degrees magnetic bearing) Runway 25 Used by aircraft landing or taking off towards the West. (25=approx. 250 degrees magnetic bearing) Movements over the North =16L(arr) + 16R(arr) + 34L(dep) Movements over the South =16L(dep) + 16R(dep) + 34L(arr) + 34R(arr) Movements over the East =07(dep) + 25(arr) + 34R(dep) Movements over the West =07(arr) + 25(dep)
34L
34R
16R
25
07
16L
2529
3962
2438
4
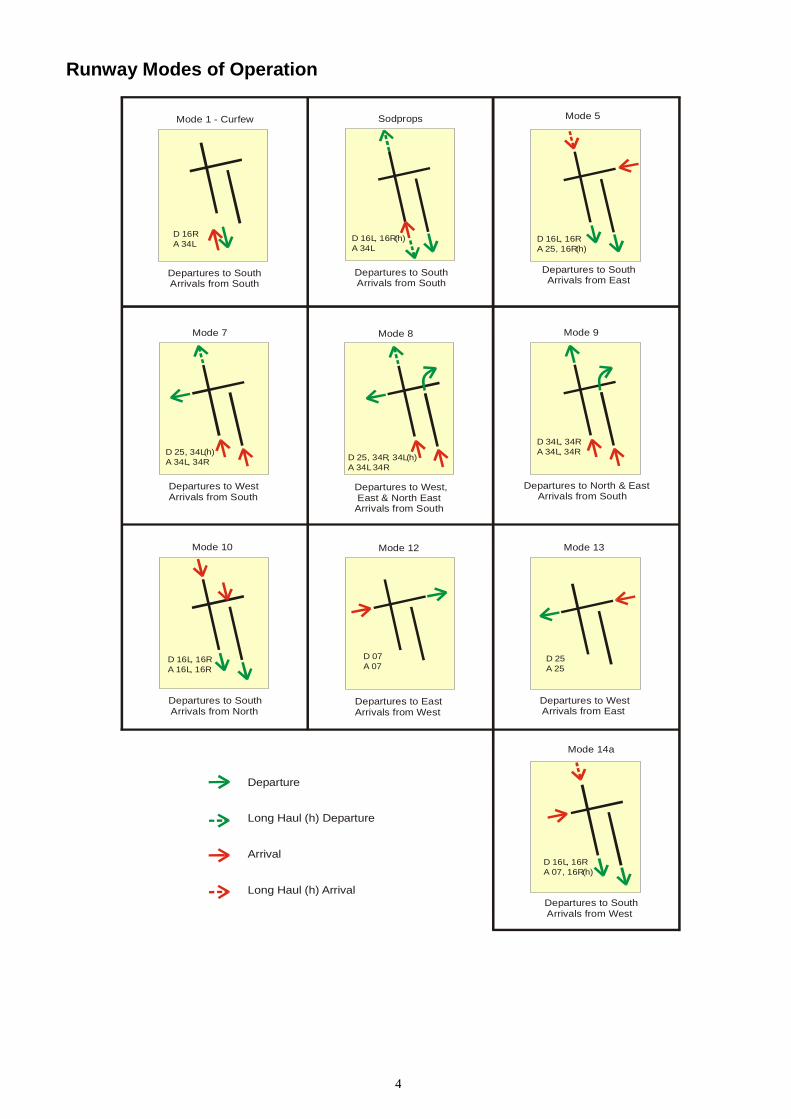
Runway Modes of Operation
D 16RA 34L
Mode 1 - Curfew
Departures to South Arrivals from South
Sodprops
Departures to South Arrivals from South
D 16L, 16R(h)A 34L
Mode 5
Departures to South Arrivals from East
D 16L, 16RA 25, 16R(h)
Mode 7
Departures to WestArrivals from South
D 25, 34L(h)A 34L, 34R
Mode 8
Departures to West, East & North EastArrivals from South
D 25, 34R, 34L(h)A 34L 34R
Mode 9
Departures to North & East Arrivals from South
D 34L, 34RA 34L, 34R
Mode 10
Departures to South Arrivals from North
D 16L, 16RA 16L, 16R
Mode 12
Departures to EastArrivals from West
D 07A 07
Mode 13
Departures to West Arrivals from East
D 25A 25
Mode 14a
Departures to South Arrivals from West
D 16L, 16RA 07, 16R(h)
Departure
Long Haul (h) Departure
Arrival
Long Haul (h) Arrival
5
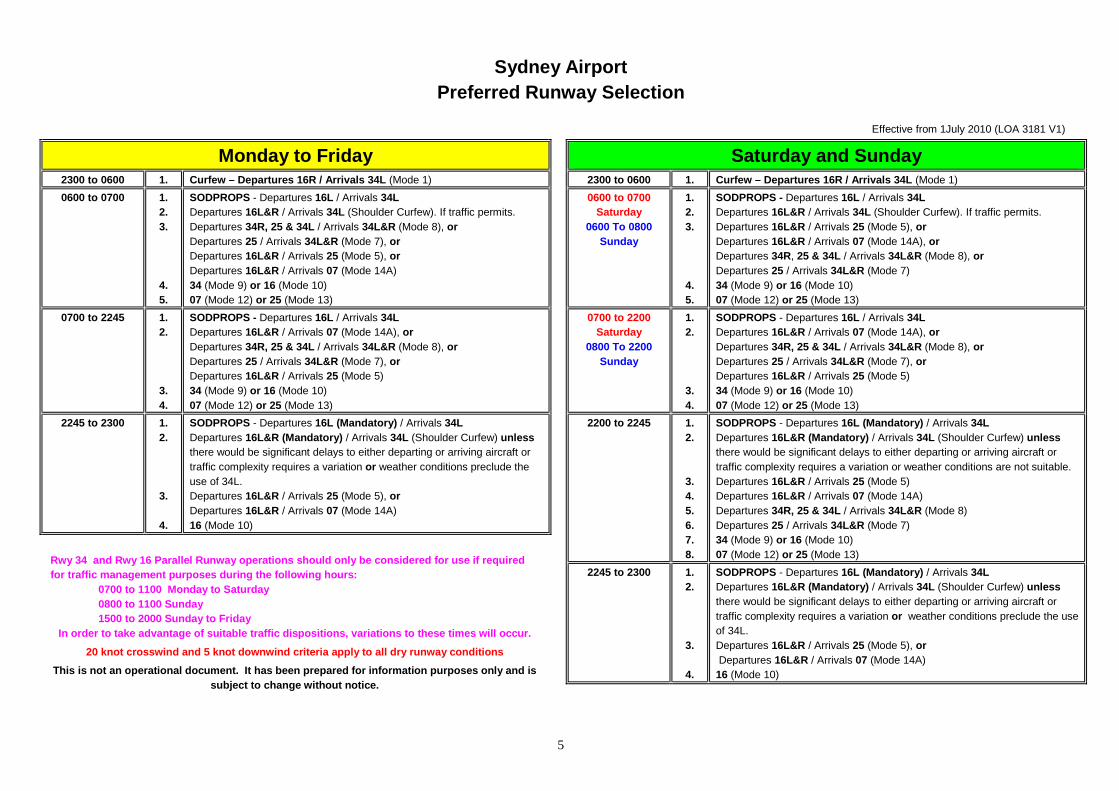
Sydney Airport Preferred Runway Selection
Effective from 1July 2010 (LOA 3181 V1)
Monday to Friday 2300 to 0600 1. Curfew – Departures 16R / Arrivals 34L (Mode 1) 0600 to 0700 1.
2. 3.
4. 5.
SODPROPS - Departures 16L / Arrivals 34L Departures 16L&R / Arrivals 34L (Shoulder Curfew). If traffic permits. Departures 34R, 25 & 34L / Arrivals 34L&R (Mode 8), or Departures 25 / Arrivals 34L&R (Mode 7), or Departures 16L&R / Arrivals 25 (Mode 5), or Departures 16L&R / Arrivals 07 (Mode 14A) 34 (Mode 9) or 16 (Mode 10) 07 (Mode 12) or 25 (Mode 13)
0700 to 2245 1. 2.
3. 4.
SODPROPS - Departures 16L / Arrivals 34L Departures 16L&R / Arrivals 07 (Mode 14A), or Departures 34R, 25 & 34L / Arrivals 34L&R (Mode 8), or Departures 25 / Arrivals 34L&R (Mode 7), or Departures 16L&R / Arrivals 25 (Mode 5) 34 (Mode 9) or 16 (Mode 10) 07 (Mode 12) or 25 (Mode 13)
2245 to 2300 1. 2.
3.
4.
SODPROPS - Departures 16L (Mandatory) / Arrivals 34L Departures 16L&R (Mandatory) / Arrivals 34L (Shoulder Curfew) unless there would be significant delays to either departing or arriving aircraft or traffic complexity requires a variation or weather conditions preclude the use of 34L. Departures 16L&R / Arrivals 25 (Mode 5), or Departures 16L&R / Arrivals 07 (Mode 14A) 16 (Mode 10)
Rwy 34 and Rwy 16 Parallel Runway operations should only be considered for use if required for traffic management purposes during the following hours:
0700 to 1100 Monday to Saturday 0800 to 1100 Sunday 1500 to 2000 Sunday to Friday
In order to take advantage of suitable traffic dispositions, variations to these times will occur.
20 knot crosswind and 5 knot downwind criteria apply to all dry runway conditions This is not an operational document. It has been prepared for information purposes only and is
subject to change without notice.
Saturday and Sunday 2300 to 0600 1. Curfew – Departures 16R / Arrivals 34L (Mode 1) 0600 to 0700
Saturday 0600 To 0800
Sunday
1. 2. 3.
4. 5.
SODPROPS - Departures 16L / Arrivals 34L Departures 16L&R / Arrivals 34L (Shoulder Curfew). If traffic permits. Departures 16L&R / Arrivals 25 (Mode 5), or Departures 16L&R / Arrivals 07 (Mode 14A), or Departures 34R, 25 & 34L / Arrivals 34L&R (Mode 8), or Departures 25 / Arrivals 34L&R (Mode 7) 34 (Mode 9) or 16 (Mode 10) 07 (Mode 12) or 25 (Mode 13)
0700 to 2200 Saturday
0800 To 2200 Sunday
1. 2.
3. 4.
SODPROPS - Departures 16L / Arrivals 34L Departures 16L&R / Arrivals 07 (Mode 14A), or Departures 34R, 25 & 34L / Arrivals 34L&R (Mode 8), or Departures 25 / Arrivals 34L&R (Mode 7), or Departures 16L&R / Arrivals 25 (Mode 5) 34 (Mode 9) or 16 (Mode 10) 07 (Mode 12) or 25 (Mode 13)
2200 to 2245 1. 2.
3. 4. 5. 6. 7. 8.
SODPROPS - Departures 16L (Mandatory) / Arrivals 34L Departures 16L&R (Mandatory) / Arrivals 34L (Shoulder Curfew) unless there would be significant delays to either departing or arriving aircraft or traffic complexity requires a variation or weather conditions are not suitable. Departures 16L&R / Arrivals 25 (Mode 5) Departures 16L&R / Arrivals 07 (Mode 14A) Departures 34R, 25 & 34L / Arrivals 34L&R (Mode 8) Departures 25 / Arrivals 34L&R (Mode 7) 34 (Mode 9) or 16 (Mode 10) 07 (Mode 12) or 25 (Mode 13)
2245 to 2300 1. 2.
3.
4.
SODPROPS - Departures 16L (Mandatory) / Arrivals 34L Departures 16L&R (Mandatory) / Arrivals 34L (Shoulder Curfew) unless there would be significant delays to either departing or arriving aircraft or traffic complexity requires a variation or weather conditions preclude the use of 34L. Departures 16L&R / Arrivals 25 (Mode 5), or Departures 16L&R / Arrivals 07 (Mode 14A) 16 (Mode 10)
6
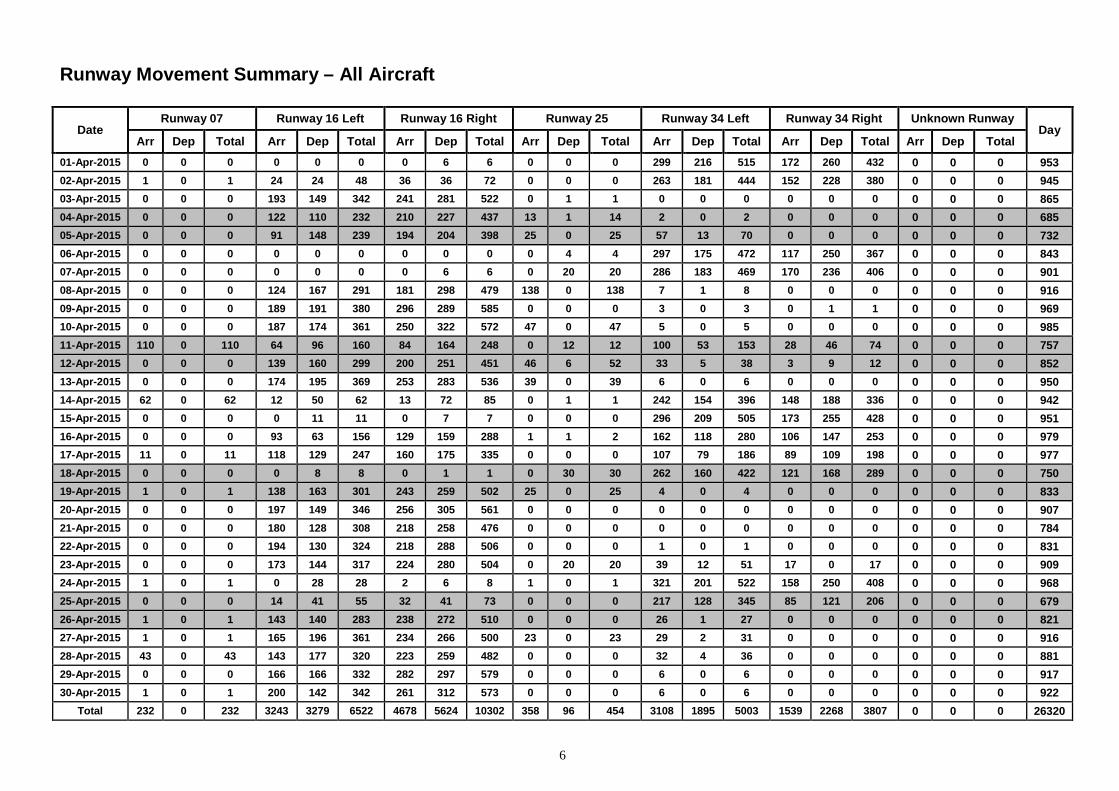
Runway Movement Summary – All Aircraft
Date Runway 07 Runway 16 Left Runway 16 Right Runway 25 Runway 34 Left Runway 34 Right Unknown Runway
Day Arr Dep Total Arr Dep Total Arr Dep Total Arr Dep Total Arr Dep Total Arr Dep Total Arr Dep Total
01-Apr-2015 0 0 0 0 0 0 0 6 6 0 0 0 299 216 515 172 260 432 0 0 0 953 02-Apr-2015 1 0 1 24 24 48 36 36 72 0 0 0 263 181 444 152 228 380 0 0 0 945 03-Apr-2015 0 0 0 193 149 342 241 281 522 0 1 1 0 0 0 0 0 0 0 0 0 865 04-Apr-2015 0 0 0 122 110 232 210 227 437 13 1 14 2 0 2 0 0 0 0 0 0 685 05-Apr-2015 0 0 0 91 148 239 194 204 398 25 0 25 57 13 70 0 0 0 0 0 0 732 06-Apr-2015 0 0 0 0 0 0 0 0 0 0 4 4 297 175 472 117 250 367 0 0 0 843 07-Apr-2015 0 0 0 0 0 0 0 6 6 0 20 20 286 183 469 170 236 406 0 0 0 901 08-Apr-2015 0 0 0 124 167 291 181 298 479 138 0 138 7 1 8 0 0 0 0 0 0 916 09-Apr-2015 0 0 0 189 191 380 296 289 585 0 0 0 3 0 3 0 1 1 0 0 0 969 10-Apr-2015 0 0 0 187 174 361 250 322 572 47 0 47 5 0 5 0 0 0 0 0 0 985 11-Apr-2015 110 0 110 64 96 160 84 164 248 0 12 12 100 53 153 28 46 74 0 0 0 757 12-Apr-2015 0 0 0 139 160 299 200 251 451 46 6 52 33 5 38 3 9 12 0 0 0 852 13-Apr-2015 0 0 0 174 195 369 253 283 536 39 0 39 6 0 6 0 0 0 0 0 0 950 14-Apr-2015 62 0 62 12 50 62 13 72 85 0 1 1 242 154 396 148 188 336 0 0 0 942 15-Apr-2015 0 0 0 0 11 11 0 7 7 0 0 0 296 209 505 173 255 428 0 0 0 951 16-Apr-2015 0 0 0 93 63 156 129 159 288 1 1 2 162 118 280 106 147 253 0 0 0 979 17-Apr-2015 11 0 11 118 129 247 160 175 335 0 0 0 107 79 186 89 109 198 0 0 0 977 18-Apr-2015 0 0 0 0 8 8 0 1 1 0 30 30 262 160 422 121 168 289 0 0 0 750 19-Apr-2015 1 0 1 138 163 301 243 259 502 25 0 25 4 0 4 0 0 0 0 0 0 833 20-Apr-2015 0 0 0 197 149 346 256 305 561 0 0 0 0 0 0 0 0 0 0 0 0 907 21-Apr-2015 0 0 0 180 128 308 218 258 476 0 0 0 0 0 0 0 0 0 0 0 0 784 22-Apr-2015 0 0 0 194 130 324 218 288 506 0 0 0 1 0 1 0 0 0 0 0 0 831 23-Apr-2015 0 0 0 173 144 317 224 280 504 0 20 20 39 12 51 17 0 17 0 0 0 909 24-Apr-2015 1 0 1 0 28 28 2 6 8 1 0 1 321 201 522 158 250 408 0 0 0 968 25-Apr-2015 0 0 0 14 41 55 32 41 73 0 0 0 217 128 345 85 121 206 0 0 0 679 26-Apr-2015 1 0 1 143 140 283 238 272 510 0 0 0 26 1 27 0 0 0 0 0 0 821 27-Apr-2015 1 0 1 165 196 361 234 266 500 23 0 23 29 2 31 0 0 0 0 0 0 916 28-Apr-2015 43 0 43 143 177 320 223 259 482 0 0 0 32 4 36 0 0 0 0 0 0 881 29-Apr-2015 0 0 0 166 166 332 282 297 579 0 0 0 6 0 6 0 0 0 0 0 0 917 30-Apr-2015 1 0 1 200 142 342 261 312 573 0 0 0 6 0 6 0 0 0 0 0 0 922
Total 232 0 232 3243 3279 6522 4678 5624 10302 358 96 454 3108 1895 5003 1539 2268 3807 0 0 0 26320
7
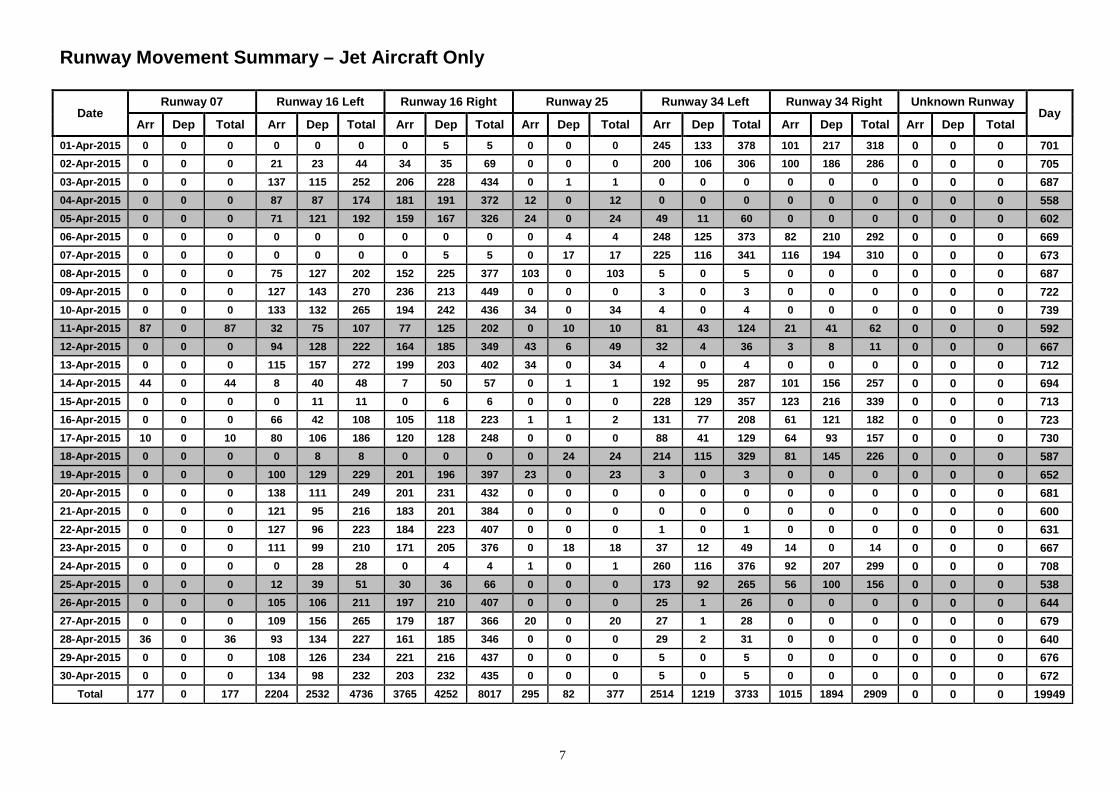
Runway Movement Summary – Jet Aircraft Only
Date Runway 07 Runway 16 Left Runway 16 Right Runway 25 Runway 34 Left Runway 34 Right Unknown Runway
Day Arr Dep Total Arr Dep Total Arr Dep Total Arr Dep Total Arr Dep Total Arr Dep Total Arr Dep Total
01-Apr-2015 0 0 0 0 0 0 0 5 5 0 0 0 245 133 378 101 217 318 0 0 0 701 02-Apr-2015 0 0 0 21 23 44 34 35 69 0 0 0 200 106 306 100 186 286 0 0 0 705 03-Apr-2015 0 0 0 137 115 252 206 228 434 0 1 1 0 0 0 0 0 0 0 0 0 687 04-Apr-2015 0 0 0 87 87 174 181 191 372 12 0 12 0 0 0 0 0 0 0 0 0 558 05-Apr-2015 0 0 0 71 121 192 159 167 326 24 0 24 49 11 60 0 0 0 0 0 0 602 06-Apr-2015 0 0 0 0 0 0 0 0 0 0 4 4 248 125 373 82 210 292 0 0 0 669 07-Apr-2015 0 0 0 0 0 0 0 5 5 0 17 17 225 116 341 116 194 310 0 0 0 673 08-Apr-2015 0 0 0 75 127 202 152 225 377 103 0 103 5 0 5 0 0 0 0 0 0 687 09-Apr-2015 0 0 0 127 143 270 236 213 449 0 0 0 3 0 3 0 0 0 0 0 0 722 10-Apr-2015 0 0 0 133 132 265 194 242 436 34 0 34 4 0 4 0 0 0 0 0 0 739 11-Apr-2015 87 0 87 32 75 107 77 125 202 0 10 10 81 43 124 21 41 62 0 0 0 592 12-Apr-2015 0 0 0 94 128 222 164 185 349 43 6 49 32 4 36 3 8 11 0 0 0 667 13-Apr-2015 0 0 0 115 157 272 199 203 402 34 0 34 4 0 4 0 0 0 0 0 0 712 14-Apr-2015 44 0 44 8 40 48 7 50 57 0 1 1 192 95 287 101 156 257 0 0 0 694 15-Apr-2015 0 0 0 0 11 11 0 6 6 0 0 0 228 129 357 123 216 339 0 0 0 713 16-Apr-2015 0 0 0 66 42 108 105 118 223 1 1 2 131 77 208 61 121 182 0 0 0 723 17-Apr-2015 10 0 10 80 106 186 120 128 248 0 0 0 88 41 129 64 93 157 0 0 0 730 18-Apr-2015 0 0 0 0 8 8 0 0 0 0 24 24 214 115 329 81 145 226 0 0 0 587 19-Apr-2015 0 0 0 100 129 229 201 196 397 23 0 23 3 0 3 0 0 0 0 0 0 652 20-Apr-2015 0 0 0 138 111 249 201 231 432 0 0 0 0 0 0 0 0 0 0 0 0 681 21-Apr-2015 0 0 0 121 95 216 183 201 384 0 0 0 0 0 0 0 0 0 0 0 0 600 22-Apr-2015 0 0 0 127 96 223 184 223 407 0 0 0 1 0 1 0 0 0 0 0 0 631 23-Apr-2015 0 0 0 111 99 210 171 205 376 0 18 18 37 12 49 14 0 14 0 0 0 667 24-Apr-2015 0 0 0 0 28 28 0 4 4 1 0 1 260 116 376 92 207 299 0 0 0 708 25-Apr-2015 0 0 0 12 39 51 30 36 66 0 0 0 173 92 265 56 100 156 0 0 0 538 26-Apr-2015 0 0 0 105 106 211 197 210 407 0 0 0 25 1 26 0 0 0 0 0 0 644 27-Apr-2015 0 0 0 109 156 265 179 187 366 20 0 20 27 1 28 0 0 0 0 0 0 679 28-Apr-2015 36 0 36 93 134 227 161 185 346 0 0 0 29 2 31 0 0 0 0 0 0 640 29-Apr-2015 0 0 0 108 126 234 221 216 437 0 0 0 5 0 5 0 0 0 0 0 0 676 30-Apr-2015 0 0 0 134 98 232 203 232 435 0 0 0 5 0 5 0 0 0 0 0 0 672
Total 177 0 177 2204 2532 4736 3765 4252 8017 295 82 377 2514 1219 3733 1015 1894 2909 0 0 0 19949
8
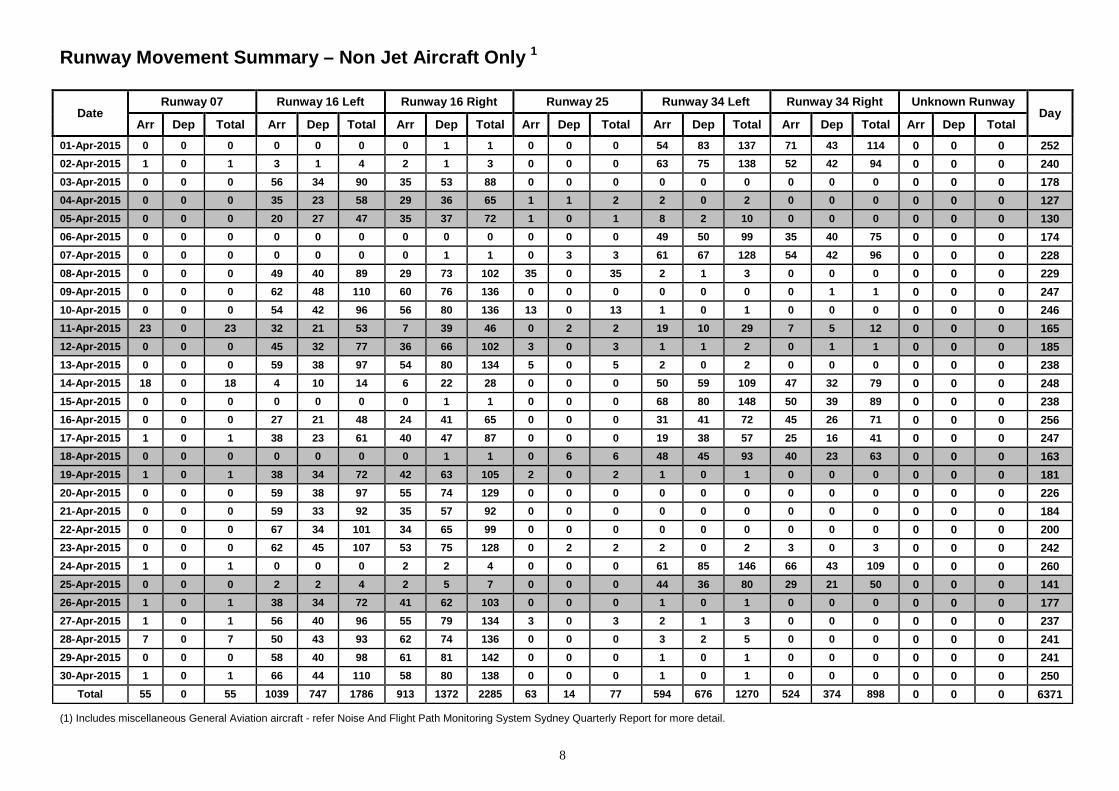
Runway Movement Summary – Non Jet Aircraft Only 1
Date Runway 07 Runway 16 Left Runway 16 Right Runway 25 Runway 34 Left Runway 34 Right Unknown Runway
Day Arr Dep Total Arr Dep Total Arr Dep Total Arr Dep Total Arr Dep Total Arr Dep Total Arr Dep Total
01-Apr-2015 0 0 0 0 0 0 0 1 1 0 0 0 54 83 137 71 43 114 0 0 0 252 02-Apr-2015 1 0 1 3 1 4 2 1 3 0 0 0 63 75 138 52 42 94 0 0 0 240 03-Apr-2015 0 0 0 56 34 90 35 53 88 0 0 0 0 0 0 0 0 0 0 0 0 178 04-Apr-2015 0 0 0 35 23 58 29 36 65 1 1 2 2 0 2 0 0 0 0 0 0 127 05-Apr-2015 0 0 0 20 27 47 35 37 72 1 0 1 8 2 10 0 0 0 0 0 0 130 06-Apr-2015 0 0 0 0 0 0 0 0 0 0 0 0 49 50 99 35 40 75 0 0 0 174 07-Apr-2015 0 0 0 0 0 0 0 1 1 0 3 3 61 67 128 54 42 96 0 0 0 228 08-Apr-2015 0 0 0 49 40 89 29 73 102 35 0 35 2 1 3 0 0 0 0 0 0 229 09-Apr-2015 0 0 0 62 48 110 60 76 136 0 0 0 0 0 0 0 1 1 0 0 0 247 10-Apr-2015 0 0 0 54 42 96 56 80 136 13 0 13 1 0 1 0 0 0 0 0 0 246 11-Apr-2015 23 0 23 32 21 53 7 39 46 0 2 2 19 10 29 7 5 12 0 0 0 165 12-Apr-2015 0 0 0 45 32 77 36 66 102 3 0 3 1 1 2 0 1 1 0 0 0 185 13-Apr-2015 0 0 0 59 38 97 54 80 134 5 0 5 2 0 2 0 0 0 0 0 0 238 14-Apr-2015 18 0 18 4 10 14 6 22 28 0 0 0 50 59 109 47 32 79 0 0 0 248 15-Apr-2015 0 0 0 0 0 0 0 1 1 0 0 0 68 80 148 50 39 89 0 0 0 238 16-Apr-2015 0 0 0 27 21 48 24 41 65 0 0 0 31 41 72 45 26 71 0 0 0 256 17-Apr-2015 1 0 1 38 23 61 40 47 87 0 0 0 19 38 57 25 16 41 0 0 0 247 18-Apr-2015 0 0 0 0 0 0 0 1 1 0 6 6 48 45 93 40 23 63 0 0 0 163 19-Apr-2015 1 0 1 38 34 72 42 63 105 2 0 2 1 0 1 0 0 0 0 0 0 181 20-Apr-2015 0 0 0 59 38 97 55 74 129 0 0 0 0 0 0 0 0 0 0 0 0 226 21-Apr-2015 0 0 0 59 33 92 35 57 92 0 0 0 0 0 0 0 0 0 0 0 0 184 22-Apr-2015 0 0 0 67 34 101 34 65 99 0 0 0 0 0 0 0 0 0 0 0 0 200 23-Apr-2015 0 0 0 62 45 107 53 75 128 0 2 2 2 0 2 3 0 3 0 0 0 242 24-Apr-2015 1 0 1 0 0 0 2 2 4 0 0 0 61 85 146 66 43 109 0 0 0 260 25-Apr-2015 0 0 0 2 2 4 2 5 7 0 0 0 44 36 80 29 21 50 0 0 0 141 26-Apr-2015 1 0 1 38 34 72 41 62 103 0 0 0 1 0 1 0 0 0 0 0 0 177 27-Apr-2015 1 0 1 56 40 96 55 79 134 3 0 3 2 1 3 0 0 0 0 0 0 237 28-Apr-2015 7 0 7 50 43 93 62 74 136 0 0 0 3 2 5 0 0 0 0 0 0 241 29-Apr-2015 0 0 0 58 40 98 61 81 142 0 0 0 1 0 1 0 0 0 0 0 0 241 30-Apr-2015 1 0 1 66 44 110 58 80 138 0 0 0 1 0 1 0 0 0 0 0 0 250
Total 55 0 55 1039 747 1786 913 1372 2285 63 14 77 594 676 1270 524 374 898 0 0 0 6371
(1) Includes miscellaneous General Aviation aircraft - refer Noise And Flight Path Monitoring System Sydney Quarterly Report for more detail.
9
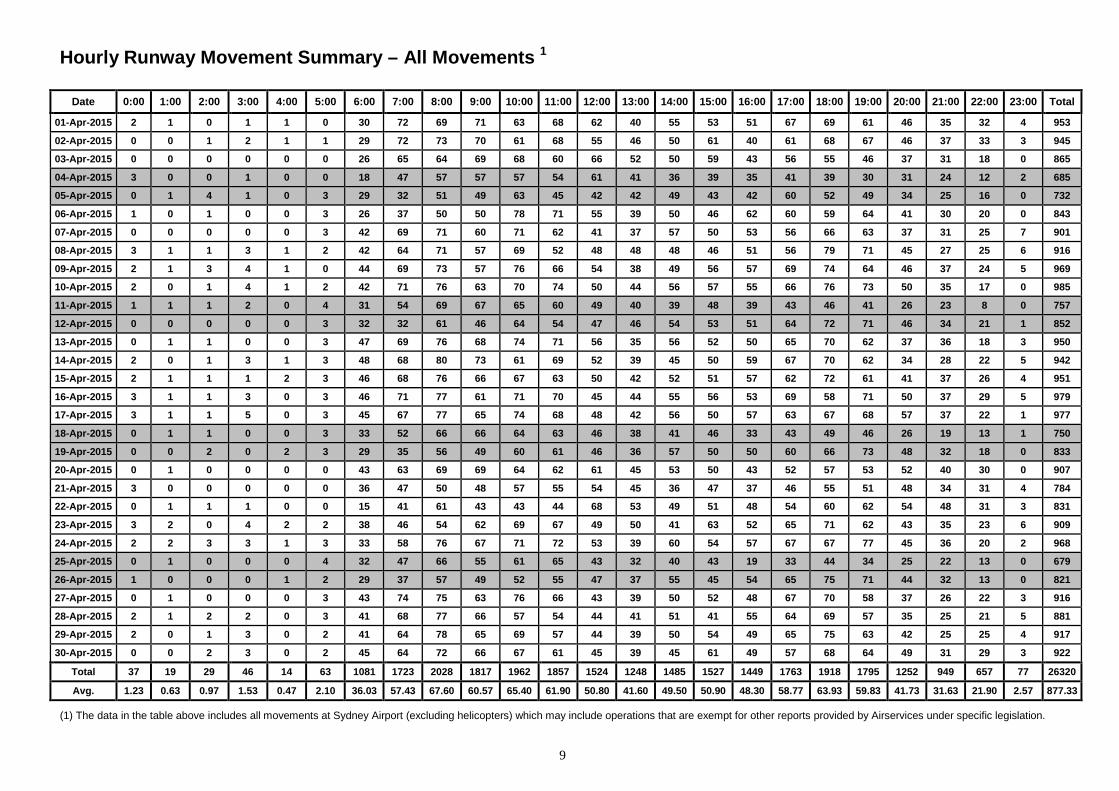
Hourly Runway Movement Summary – All Movements 1
Date 0:00 1:00 2:00 3:00 4:00 5:00 6:00 7:00 8:00 9:00 10:00 11:00 12:00 13:00 14:00 15:00 16:00 17:00 18:00 19:00 20:00 21:00 22:00 23:00 Total
01-Apr-2015 2 1 0 1 1 0 30 72 69 71 63 68 62 40 55 53 51 67 69 61 46 35 32 4 953
02-Apr-2015 0 0 1 2 1 1 29 72 73 70 61 68 55 46 50 61 40 61 68 67 46 37 33 3 945
03-Apr-2015 0 0 0 0 0 0 26 65 64 69 68 60 66 52 50 59 43 56 55 46 37 31 18 0 865
04-Apr-2015 3 0 0 1 0 0 18 47 57 57 57 54 61 41 36 39 35 41 39 30 31 24 12 2 685
05-Apr-2015 0 1 4 1 0 3 29 32 51 49 63 45 42 42 49 43 42 60 52 49 34 25 16 0 732
06-Apr-2015 1 0 1 0 0 3 26 37 50 50 78 71 55 39 50 46 62 60 59 64 41 30 20 0 843
07-Apr-2015 0 0 0 0 0 3 42 69 71 60 71 62 41 37 57 50 53 56 66 63 37 31 25 7 901
08-Apr-2015 3 1 1 3 1 2 42 64 71 57 69 52 48 48 48 46 51 56 79 71 45 27 25 6 916
09-Apr-2015 2 1 3 4 1 0 44 69 73 57 76 66 54 38 49 56 57 69 74 64 46 37 24 5 969
10-Apr-2015 2 0 1 4 1 2 42 71 76 63 70 74 50 44 56 57 55 66 76 73 50 35 17 0 985
11-Apr-2015 1 1 1 2 0 4 31 54 69 67 65 60 49 40 39 48 39 43 46 41 26 23 8 0 757
12-Apr-2015 0 0 0 0 0 3 32 32 61 46 64 54 47 46 54 53 51 64 72 71 46 34 21 1 852
13-Apr-2015 0 1 1 0 0 3 47 69 76 68 74 71 56 35 56 52 50 65 70 62 37 36 18 3 950
14-Apr-2015 2 0 1 3 1 3 48 68 80 73 61 69 52 39 45 50 59 67 70 62 34 28 22 5 942
15-Apr-2015 2 1 1 1 2 3 46 68 76 66 67 63 50 42 52 51 57 62 72 61 41 37 26 4 951
16-Apr-2015 3 1 1 3 0 3 46 71 77 61 71 70 45 44 55 56 53 69 58 71 50 37 29 5 979
17-Apr-2015 3 1 1 5 0 3 45 67 77 65 74 68 48 42 56 50 57 63 67 68 57 37 22 1 977
18-Apr-2015 0 1 1 0 0 3 33 52 66 66 64 63 46 38 41 46 33 43 49 46 26 19 13 1 750
19-Apr-2015 0 0 2 0 2 3 29 35 56 49 60 61 46 36 57 50 50 60 66 73 48 32 18 0 833
20-Apr-2015 0 1 0 0 0 0 43 63 69 69 64 62 61 45 53 50 43 52 57 53 52 40 30 0 907
21-Apr-2015 3 0 0 0 0 0 36 47 50 48 57 55 54 45 36 47 37 46 55 51 48 34 31 4 784
22-Apr-2015 0 1 1 1 0 0 15 41 61 43 43 44 68 53 49 51 48 54 60 62 54 48 31 3 831
23-Apr-2015 3 2 0 4 2 2 38 46 54 62 69 67 49 50 41 63 52 65 71 62 43 35 23 6 909
24-Apr-2015 2 2 3 3 1 3 33 58 76 67 71 72 53 39 60 54 57 67 67 77 45 36 20 2 968
25-Apr-2015 0 1 0 0 0 4 32 47 66 55 61 65 43 32 40 43 19 33 44 34 25 22 13 0 679
26-Apr-2015 1 0 0 0 1 2 29 37 57 49 52 55 47 37 55 45 54 65 75 71 44 32 13 0 821
27-Apr-2015 0 1 0 0 0 3 43 74 75 63 76 66 43 39 50 52 48 67 70 58 37 26 22 3 916
28-Apr-2015 2 1 2 2 0 3 41 68 77 66 57 54 44 41 51 41 55 64 69 57 35 25 21 5 881
29-Apr-2015 2 0 1 3 0 2 41 64 78 65 69 57 44 39 50 54 49 65 75 63 42 25 25 4 917
30-Apr-2015 0 0 2 3 0 2 45 64 72 66 67 61 45 39 45 61 49 57 68 64 49 31 29 3 922
Total 37 19 29 46 14 63 1081 1723 2028 1817 1962 1857 1524 1248 1485 1527 1449 1763 1918 1795 1252 949 657 77 26320
Avg. 1.23 0.63 0.97 1.53 0.47 2.10 36.03 57.43 67.60 60.57 65.40 61.90 50.80 41.60 49.50 50.90 48.30 58.77 63.93 59.83 41.73 31.63 21.90 2.57 877.33
(1) The data in the table above includes all movements at Sydney Airport (excluding helicopters) which may include operations that are exempt for other reports provided by Airservices under specific legislation.
10
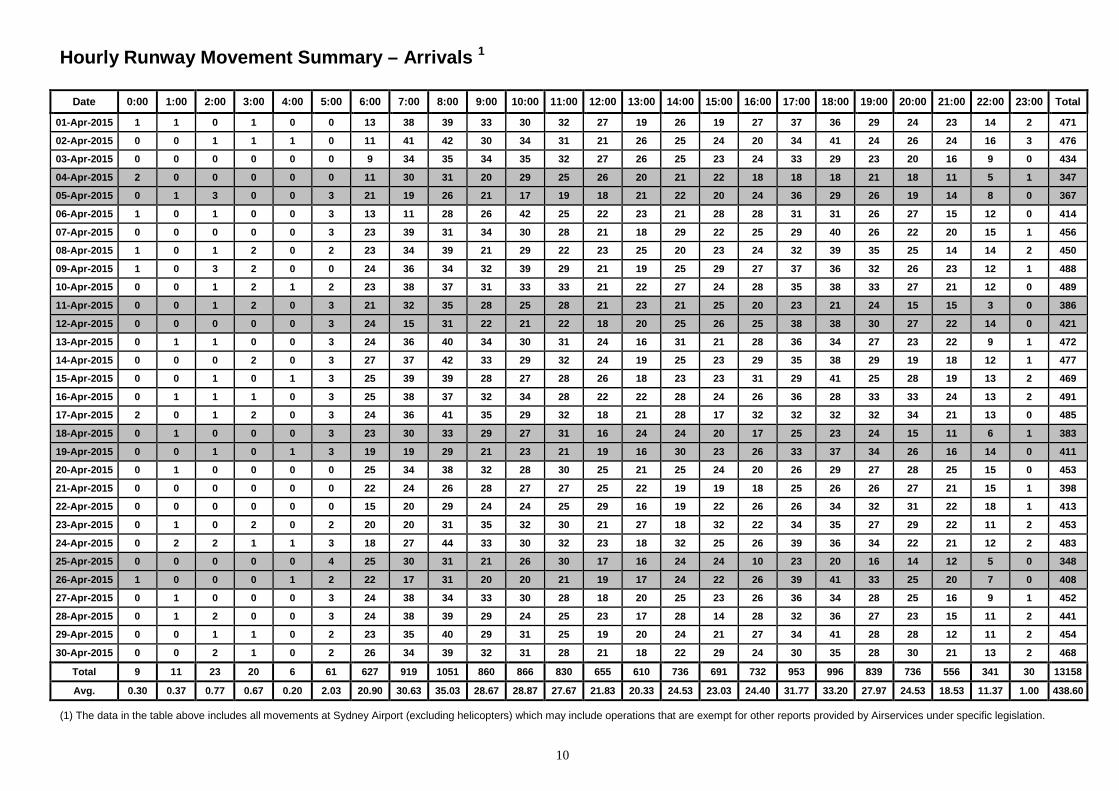
Hourly Runway Movement Summary – Arrivals 1
Date 0:00 1:00 2:00 3:00 4:00 5:00 6:00 7:00 8:00 9:00 10:00 11:00 12:00 13:00 14:00 15:00 16:00 17:00 18:00 19:00 20:00 21:00 22:00 23:00 Total
01-Apr-2015 1 1 0 1 0 0 13 38 39 33 30 32 27 19 26 19 27 37 36 29 24 23 14 2 471
02-Apr-2015 0 0 1 1 1 0 11 41 42 30 34 31 21 26 25 24 20 34 41 24 26 24 16 3 476
03-Apr-2015 0 0 0 0 0 0 9 34 35 34 35 32 27 26 25 23 24 33 29 23 20 16 9 0 434
04-Apr-2015 2 0 0 0 0 0 11 30 31 20 29 25 26 20 21 22 18 18 18 21 18 11 5 1 347
05-Apr-2015 0 1 3 0 0 3 21 19 26 21 17 19 18 21 22 20 24 36 29 26 19 14 8 0 367
06-Apr-2015 1 0 1 0 0 3 13 11 28 26 42 25 22 23 21 28 28 31 31 26 27 15 12 0 414
07-Apr-2015 0 0 0 0 0 3 23 39 31 34 30 28 21 18 29 22 25 29 40 26 22 20 15 1 456
08-Apr-2015 1 0 1 2 0 2 23 34 39 21 29 22 23 25 20 23 24 32 39 35 25 14 14 2 450
09-Apr-2015 1 0 3 2 0 0 24 36 34 32 39 29 21 19 25 29 27 37 36 32 26 23 12 1 488
10-Apr-2015 0 0 1 2 1 2 23 38 37 31 33 33 21 22 27 24 28 35 38 33 27 21 12 0 489
11-Apr-2015 0 0 1 2 0 3 21 32 35 28 25 28 21 23 21 25 20 23 21 24 15 15 3 0 386
12-Apr-2015 0 0 0 0 0 3 24 15 31 22 21 22 18 20 25 26 25 38 38 30 27 22 14 0 421
13-Apr-2015 0 1 1 0 0 3 24 36 40 34 30 31 24 16 31 21 28 36 34 27 23 22 9 1 472
14-Apr-2015 0 0 0 2 0 3 27 37 42 33 29 32 24 19 25 23 29 35 38 29 19 18 12 1 477
15-Apr-2015 0 0 1 0 1 3 25 39 39 28 27 28 26 18 23 23 31 29 41 25 28 19 13 2 469
16-Apr-2015 0 1 1 1 0 3 25 38 37 32 34 28 22 22 28 24 26 36 28 33 33 24 13 2 491
17-Apr-2015 2 0 1 2 0 3 24 36 41 35 29 32 18 21 28 17 32 32 32 32 34 21 13 0 485
18-Apr-2015 0 1 0 0 0 3 23 30 33 29 27 31 16 24 24 20 17 25 23 24 15 11 6 1 383
19-Apr-2015 0 0 1 0 1 3 19 19 29 21 23 21 19 16 30 23 26 33 37 34 26 16 14 0 411
20-Apr-2015 0 1 0 0 0 0 25 34 38 32 28 30 25 21 25 24 20 26 29 27 28 25 15 0 453
21-Apr-2015 0 0 0 0 0 0 22 24 26 28 27 27 25 22 19 19 18 25 26 26 27 21 15 1 398
22-Apr-2015 0 0 0 0 0 0 15 20 29 24 24 25 29 16 19 22 26 26 34 32 31 22 18 1 413
23-Apr-2015 0 1 0 2 0 2 20 20 31 35 32 30 21 27 18 32 22 34 35 27 29 22 11 2 453
24-Apr-2015 0 2 2 1 1 3 18 27 44 33 30 32 23 18 32 25 26 39 36 34 22 21 12 2 483
25-Apr-2015 0 0 0 0 0 4 25 30 31 21 26 30 17 16 24 24 10 23 20 16 14 12 5 0 348
26-Apr-2015 1 0 0 0 1 2 22 17 31 20 20 21 19 17 24 22 26 39 41 33 25 20 7 0 408
27-Apr-2015 0 1 0 0 0 3 24 38 34 33 30 28 18 20 25 23 26 36 34 28 25 16 9 1 452
28-Apr-2015 0 1 2 0 0 3 24 38 39 29 24 25 23 17 28 14 28 32 36 27 23 15 11 2 441
29-Apr-2015 0 0 1 1 0 2 23 35 40 29 31 25 19 20 24 21 27 34 41 28 28 12 11 2 454
30-Apr-2015 0 0 2 1 0 2 26 34 39 32 31 28 21 18 22 29 24 30 35 28 30 21 13 2 468
Total 9 11 23 20 6 61 627 919 1051 860 866 830 655 610 736 691 732 953 996 839 736 556 341 30 13158
Avg. 0.30 0.37 0.77 0.67 0.20 2.03 20.90 30.63 35.03 28.67 28.87 27.67 21.83 20.33 24.53 23.03 24.40 31.77 33.20 27.97 24.53 18.53 11.37 1.00 438.60
(1) The data in the table above includes all movements at Sydney Airport (excluding helicopters) which may include operations that are exempt for other reports provided by Airservices under specific legislation.
11
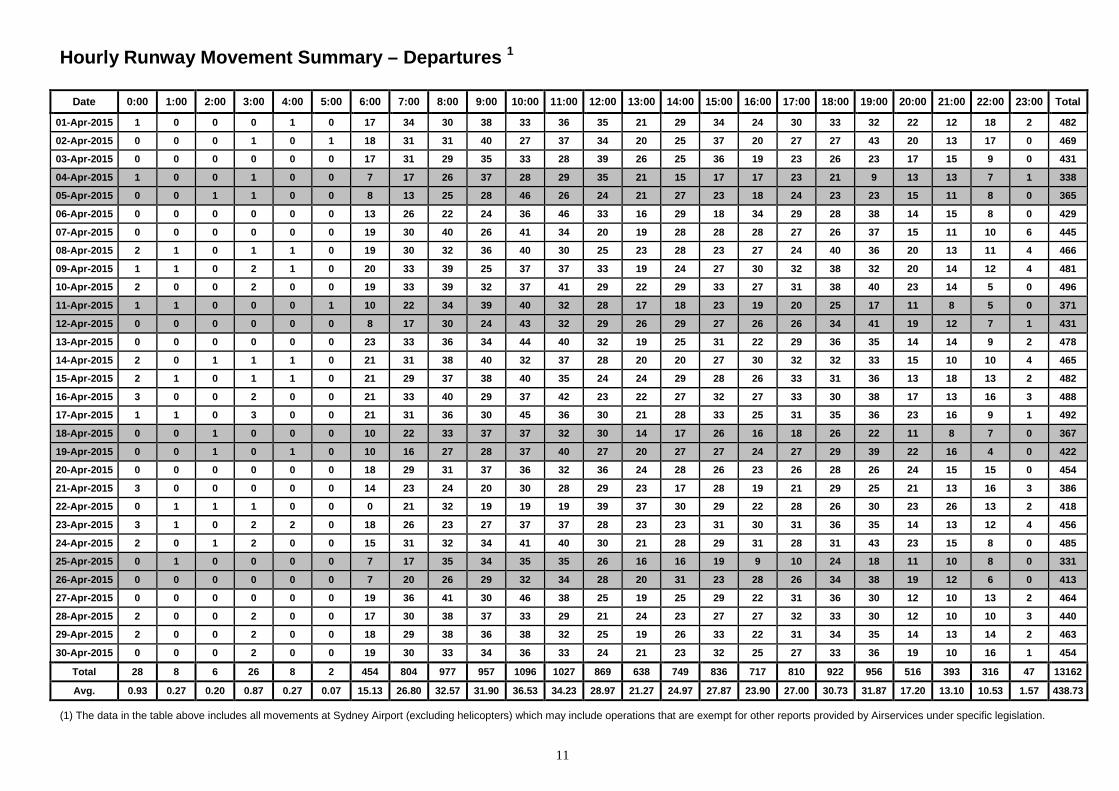
Hourly Runway Movement Summary – Departures 1
Date 0:00 1:00 2:00 3:00 4:00 5:00 6:00 7:00 8:00 9:00 10:00 11:00 12:00 13:00 14:00 15:00 16:00 17:00 18:00 19:00 20:00 21:00 22:00 23:00 Total
01-Apr-2015 1 0 0 0 1 0 17 34 30 38 33 36 35 21 29 34 24 30 33 32 22 12 18 2 482
02-Apr-2015 0 0 0 1 0 1 18 31 31 40 27 37 34 20 25 37 20 27 27 43 20 13 17 0 469
03-Apr-2015 0 0 0 0 0 0 17 31 29 35 33 28 39 26 25 36 19 23 26 23 17 15 9 0 431
04-Apr-2015 1 0 0 1 0 0 7 17 26 37 28 29 35 21 15 17 17 23 21 9 13 13 7 1 338
05-Apr-2015 0 0 1 1 0 0 8 13 25 28 46 26 24 21 27 23 18 24 23 23 15 11 8 0 365
06-Apr-2015 0 0 0 0 0 0 13 26 22 24 36 46 33 16 29 18 34 29 28 38 14 15 8 0 429
07-Apr-2015 0 0 0 0 0 0 19 30 40 26 41 34 20 19 28 28 28 27 26 37 15 11 10 6 445
08-Apr-2015 2 1 0 1 1 0 19 30 32 36 40 30 25 23 28 23 27 24 40 36 20 13 11 4 466
09-Apr-2015 1 1 0 2 1 0 20 33 39 25 37 37 33 19 24 27 30 32 38 32 20 14 12 4 481
10-Apr-2015 2 0 0 2 0 0 19 33 39 32 37 41 29 22 29 33 27 31 38 40 23 14 5 0 496
11-Apr-2015 1 1 0 0 0 1 10 22 34 39 40 32 28 17 18 23 19 20 25 17 11 8 5 0 371
12-Apr-2015 0 0 0 0 0 0 8 17 30 24 43 32 29 26 29 27 26 26 34 41 19 12 7 1 431
13-Apr-2015 0 0 0 0 0 0 23 33 36 34 44 40 32 19 25 31 22 29 36 35 14 14 9 2 478
14-Apr-2015 2 0 1 1 1 0 21 31 38 40 32 37 28 20 20 27 30 32 32 33 15 10 10 4 465
15-Apr-2015 2 1 0 1 1 0 21 29 37 38 40 35 24 24 29 28 26 33 31 36 13 18 13 2 482
16-Apr-2015 3 0 0 2 0 0 21 33 40 29 37 42 23 22 27 32 27 33 30 38 17 13 16 3 488
17-Apr-2015 1 1 0 3 0 0 21 31 36 30 45 36 30 21 28 33 25 31 35 36 23 16 9 1 492
18-Apr-2015 0 0 1 0 0 0 10 22 33 37 37 32 30 14 17 26 16 18 26 22 11 8 7 0 367
19-Apr-2015 0 0 1 0 1 0 10 16 27 28 37 40 27 20 27 27 24 27 29 39 22 16 4 0 422
20-Apr-2015 0 0 0 0 0 0 18 29 31 37 36 32 36 24 28 26 23 26 28 26 24 15 15 0 454
21-Apr-2015 3 0 0 0 0 0 14 23 24 20 30 28 29 23 17 28 19 21 29 25 21 13 16 3 386
22-Apr-2015 0 1 1 1 0 0 0 21 32 19 19 19 39 37 30 29 22 28 26 30 23 26 13 2 418
23-Apr-2015 3 1 0 2 2 0 18 26 23 27 37 37 28 23 23 31 30 31 36 35 14 13 12 4 456
24-Apr-2015 2 0 1 2 0 0 15 31 32 34 41 40 30 21 28 29 31 28 31 43 23 15 8 0 485
25-Apr-2015 0 1 0 0 0 0 7 17 35 34 35 35 26 16 16 19 9 10 24 18 11 10 8 0 331
26-Apr-2015 0 0 0 0 0 0 7 20 26 29 32 34 28 20 31 23 28 26 34 38 19 12 6 0 413
27-Apr-2015 0 0 0 0 0 0 19 36 41 30 46 38 25 19 25 29 22 31 36 30 12 10 13 2 464
28-Apr-2015 2 0 0 2 0 0 17 30 38 37 33 29 21 24 23 27 27 32 33 30 12 10 10 3 440
29-Apr-2015 2 0 0 2 0 0 18 29 38 36 38 32 25 19 26 33 22 31 34 35 14 13 14 2 463
30-Apr-2015 0 0 0 2 0 0 19 30 33 34 36 33 24 21 23 32 25 27 33 36 19 10 16 1 454
Total 28 8 6 26 8 2 454 804 977 957 1096 1027 869 638 749 836 717 810 922 956 516 393 316 47 13162
Avg. 0.93 0.27 0.20 0.87 0.27 0.07 15.13 26.80 32.57 31.90 36.53 34.23 28.97 21.27 24.97 27.87 23.90 27.00 30.73 31.87 17.20 13.10 10.53 1.57 438.73
(1) The data in the table above includes all movements at Sydney Airport (excluding helicopters) which may include operations that are exempt for other reports provided by Airservices under specific legislation.
12
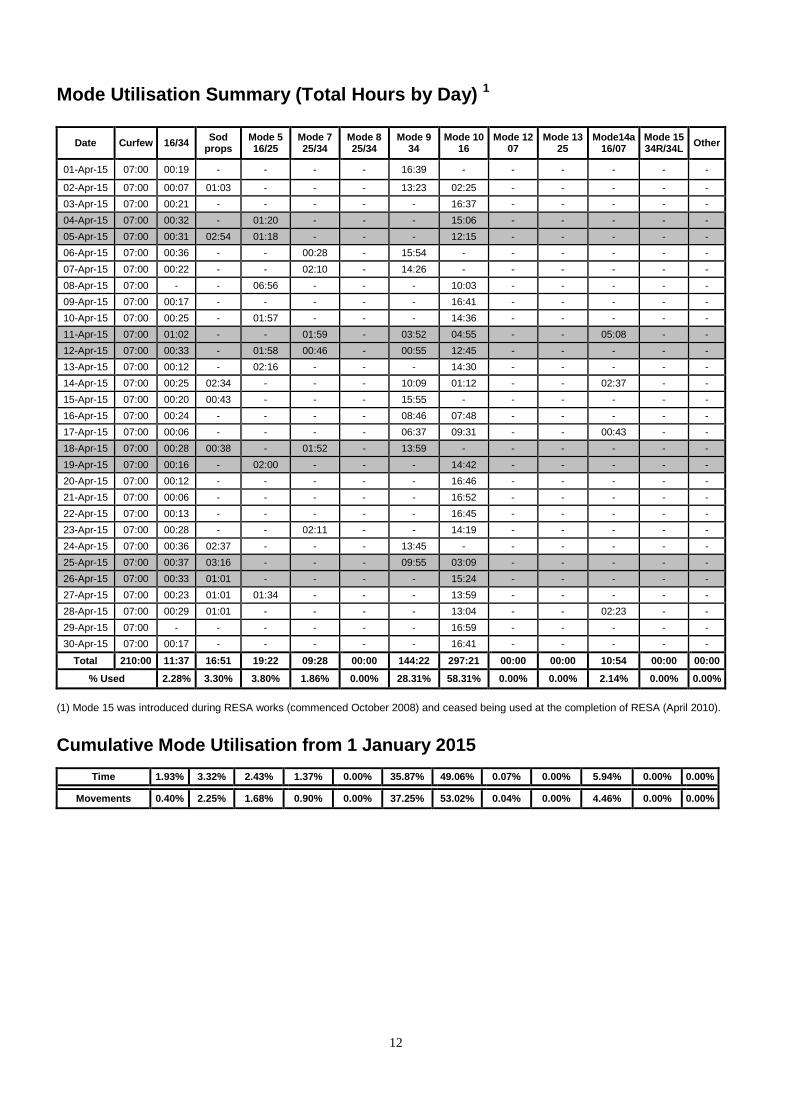
Mode Utilisation Summary (Total Hours by Day) 1
Date Curfew 16/34 Sod props
Mode 5 16/25
Mode 7 25/34
Mode 8 25/34
Mode 9 34
Mode 10 16
Mode 12 07
Mode 13 25
Mode14a 16/07
Mode 15 34R/34L Other
01-Apr-15 07:00 00:19 - - - - 16:39 - - - - - -
02-Apr-15 07:00 00:07 01:03 - - - 13:23 02:25 - - - - - 03-Apr-15 07:00 00:21 - - - - - 16:37 - - - - - 04-Apr-15 07:00 00:32 - 01:20 - - - 15:06 - - - - - 05-Apr-15 07:00 00:31 02:54 01:18 - - - 12:15 - - - - - 06-Apr-15 07:00 00:36 - - 00:28 - 15:54 - - - - - - 07-Apr-15 07:00 00:22 - - 02:10 - 14:26 - - - - - - 08-Apr-15 07:00 - - 06:56 - - - 10:03 - - - - - 09-Apr-15 07:00 00:17 - - - - - 16:41 - - - - - 10-Apr-15 07:00 00:25 - 01:57 - - - 14:36 - - - - - 11-Apr-15 07:00 01:02 - - 01:59 - 03:52 04:55 - - 05:08 - - 12-Apr-15 07:00 00:33 - 01:58 00:46 - 00:55 12:45 - - - - - 13-Apr-15 07:00 00:12 - 02:16 - - - 14:30 - - - - - 14-Apr-15 07:00 00:25 02:34 - - - 10:09 01:12 - - 02:37 - - 15-Apr-15 07:00 00:20 00:43 - - - 15:55 - - - - - - 16-Apr-15 07:00 00:24 - - - - 08:46 07:48 - - - - - 17-Apr-15 07:00 00:06 - - - - 06:37 09:31 - - 00:43 - - 18-Apr-15 07:00 00:28 00:38 - 01:52 - 13:59 - - - - - - 19-Apr-15 07:00 00:16 - 02:00 - - - 14:42 - - - - - 20-Apr-15 07:00 00:12 - - - - - 16:46 - - - - - 21-Apr-15 07:00 00:06 - - - - - 16:52 - - - - - 22-Apr-15 07:00 00:13 - - - - - 16:45 - - - - - 23-Apr-15 07:00 00:28 - - 02:11 - - 14:19 - - - - - 24-Apr-15 07:00 00:36 02:37 - - - 13:45 - - - - - - 25-Apr-15 07:00 00:37 03:16 - - - 09:55 03:09 - - - - - 26-Apr-15 07:00 00:33 01:01 - - - - 15:24 - - - - - 27-Apr-15 07:00 00:23 01:01 01:34 - - - 13:59 - - - - - 28-Apr-15 07:00 00:29 01:01 - - - - 13:04 - - 02:23 - - 29-Apr-15 07:00 - - - - - - 16:59 - - - - - 30-Apr-15 07:00 00:17 - - - - - 16:41 - - - - -
Total 210:00 11:37 16:51 19:22 09:28 00:00 144:22 297:21 00:00 00:00 10:54 00:00 00:00
% Used 2.28% 3.30% 3.80% 1.86% 0.00% 28.31% 58.31% 0.00% 0.00% 2.14% 0.00% 0.00% (1) Mode 15 was introduced during RESA works (commenced October 2008) and ceased being used at the completion of RESA (April 2010).
Cumulative Mode Utilisation from 1 January 2015
Time 1.93% 3.32% 2.43% 1.37% 0.00% 35.87% 49.06% 0.07% 0.00% 5.94% 0.00% 0.00%
Movements 0.40% 2.25% 1.68% 0.90% 0.00% 37.25% 53.02% 0.04% 0.00% 4.46% 0.00% 0.00%
13
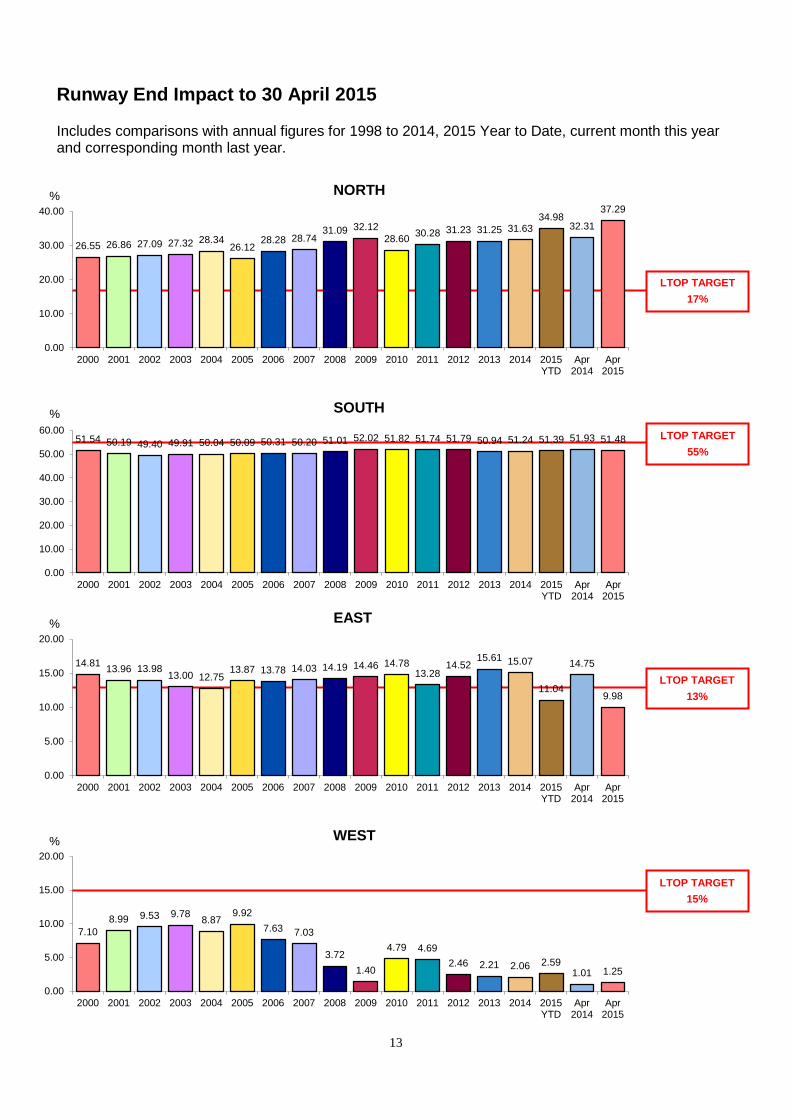
Runway End Impact to 30 April 2015 Includes comparisons with annual figures for 1998 to 2014, 2015 Year to Date, current month this year and corresponding month last year.
LTOP TARGET 55%
LTOP TARGET 13%
LTOP TARGET 15%
LTOP TARGET 17%
7.10 8.99 9.53 9.78 8.87
9.92 7.63 7.03
3.72 1.40
4.79 4.69 2.46 2.21 2.06 2.59
1.01 1.25
0.00
5.00
10.00
15.00
20.00
2000 2001 2002 2003 2004 2005 2006 2007 2008 2009 2010 2011 2012 2013 2014 2015YTD
Apr2014
Apr2015
% WEST
14.81 13.96 13.98 13.00 12.75 13.87 13.78 14.03 14.19 14.46 14.78
13.28 14.52
15.61 15.07
11.04
14.75
9.98
0.00
5.00
10.00
15.00
20.00
2000 2001 2002 2003 2004 2005 2006 2007 2008 2009 2010 2011 2012 2013 2014 2015YTD
Apr2014
Apr2015
% EAST
51.54 50.19 49.40 49.91 50.04 50.09 50.31 50.20 51.01 52.02 51.82 51.74 51.79 50.94 51.24 51.39 51.93 51.48
0.00
10.00
20.00
30.00
40.00
50.00
60.00
2000 2001 2002 2003 2004 2005 2006 2007 2008 2009 2010 2011 2012 2013 2014 2015YTD
Apr2014
Apr2015
% SOUTH
26.55 26.86 27.09 27.32 28.34 26.12
28.28 28.74 31.09 32.12
28.60 30.28 31.23 31.25 31.63 34.98
32.31
37.29
0.00
10.00
20.00
30.00
40.00
2000 2001 2002 2003 2004 2005 2006 2007 2008 2009 2010 2011 2012 2013 2014 2015YTD
Apr2014
Apr2015
% NORTH
14
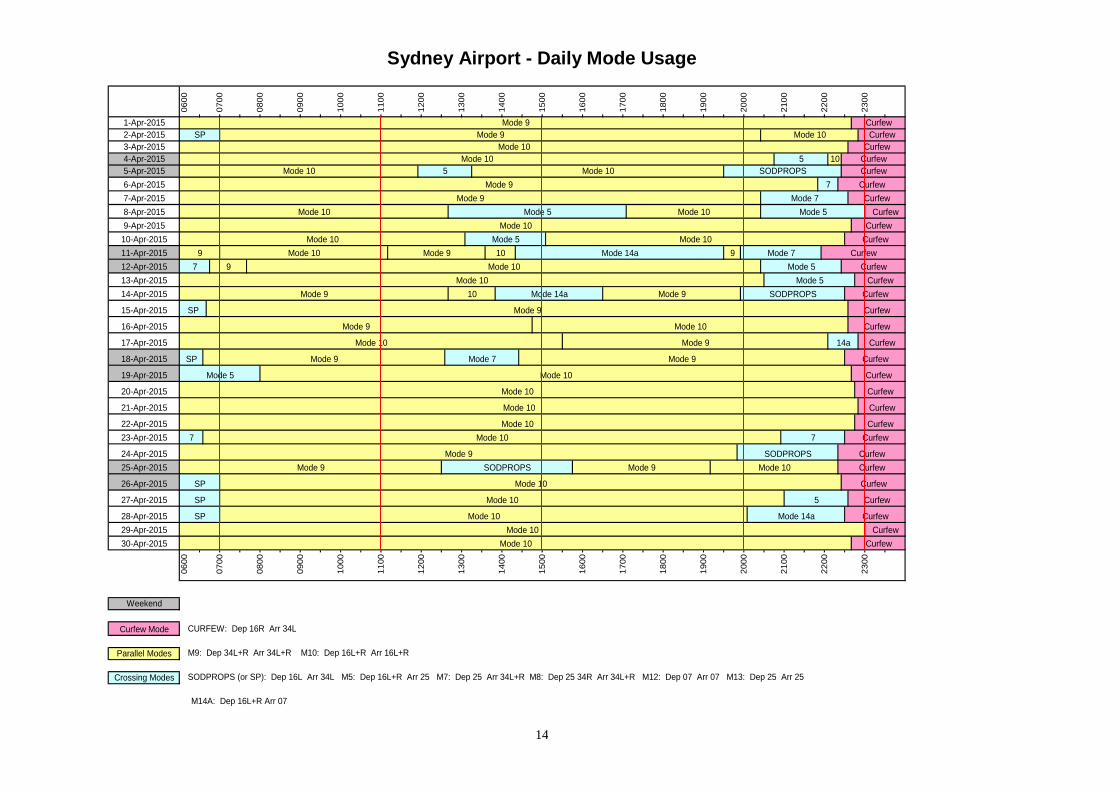
Sydney Airport - Daily Mode Usage
1-Apr-20152-Apr-20153-Apr-20154-Apr-20155-Apr-20156-Apr-20157-Apr-20158-Apr-20159-Apr-2015
10-Apr-201511-Apr-201512-Apr-201513-Apr-201514-Apr-2015
15-Apr-2015
16-Apr-2015
17-Apr-2015
18-Apr-2015
19-Apr-2015
20-Apr-2015
21-Apr-2015
22-Apr-201523-Apr-2015
24-Apr-201525-Apr-2015
26-Apr-2015
27-Apr-2015
28-Apr-201529-Apr-201530-Apr-2015
Weekend
Curfew Mode CURFEW: Dep 16R Arr 34L
Parallel Modes M9: Dep 34L+R Arr 34L+R M10: Dep 16L+R Arr 16L+R
Crossing Modes SODPROPS (or SP): Dep 16L Arr 34L M5: Dep 16L+R Arr 25 M7: Dep 25 Arr 34L+R M8: Dep 25 34R Arr 34L+R M12: Dep 07 Arr 07 M13: Dep 25 Arr 25
M14A: Dep 16L+R Arr 07
2000
2100
2200
2300
1400
1500
1600
1700
1800
1900
Mode 10 Curfew
0600
0700
0800
0900
1000
1100
1200
1300
SP Mode 10 Curfew
SP Mode 10 5 Curfew
SP Mode 10 Mode 14a CurfewMode 10 Curfew
Mode 10 Curfew7 Mode 10 7 Curfew
Mode 9 SODPROPS CurfewMode 9 SODPROPS Mode 9 Mode 10 Curfew
Mode 10 Mode 9 14a Curfew
SP Mode 9 Mode 7 Mode 9 Curfew
Mode 5 Mode 10 Curfew
Mode 10 Curfew
Mode 10 Curfew
Mode 9 Mode 10 Curfew
Mode 10 Mode 5 CurfewMode 9 10 Mode 14a Mode 9
10 Mode 14a 9
SP Mode 9 Curfew
SODPROPS Curfew
Mode 7 Curfew7 9 Mode 10 Mode 5 Curfew
9 Mode 10 Mode 9
Mode 9 Mode 7 CurfewMode 10 Mode 5 Mode 10 Mode 5 Curfew
Mode 10 CurfewMode 10 Mode 5 Mode 10 Curfew
Mode 10 CurfewMode 10 5 10 Curfew
Mode 10 5 Mode 10 SODPROPS CurfewMode 9 7 Curfew
0600
0700
0800
0900
1000
1100
1200
1300
1400
1500
1600
1700
1800
1900
2000
2100
2200
2300
Mode 9 CurfewSP Mode 9 Mode 10 Curfew
15
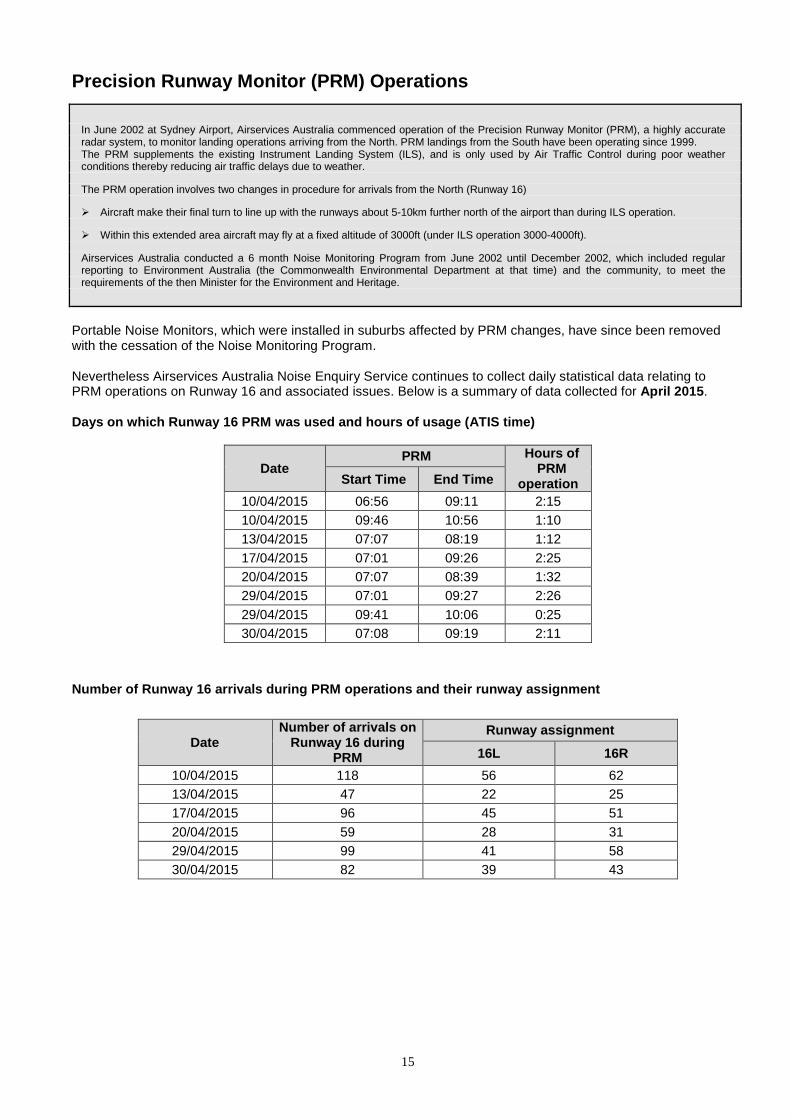
Precision Runway Monitor (PRM) Operations
In June 2002 at Sydney Airport, Airservices Australia commenced operation of the Precision Runway Monitor (PRM), a highly accurate radar system, to monitor landing operations arriving from the North. PRM landings from the South have been operating since 1999. The PRM supplements the existing Instrument Landing System (ILS), and is only used by Air Traffic Control during poor weather conditions thereby reducing air traffic delays due to weather. The PRM operation involves two changes in procedure for arrivals from the North (Runway 16) Aircraft make their final turn to line up with the runways about 5-10km further north of the airport than during ILS operation. Within this extended area aircraft may fly at a fixed altitude of 3000ft (under ILS operation 3000-4000ft). Airservices Australia conducted a 6 month Noise Monitoring Program from June 2002 until December 2002, which included regular reporting to Environment Australia (the Commonwealth Environmental Department at that time) and the community, to meet the requirements of the then Minister for the Environment and Heritage.
Portable Noise Monitors, which were installed in suburbs affected by PRM changes, have since been removed with the cessation of the Noise Monitoring Program. Nevertheless Airservices Australia Noise Enquiry Service continues to collect daily statistical data relating to PRM operations on Runway 16 and associated issues. Below is a summary of data collected for April 2015. Days on which Runway 16 PRM was used and hours of usage (ATIS time)
Date PRM Hours of
PRM operation Start Time End Time
10/04/2015 06:56 09:11 2:15 10/04/2015 09:46 10:56 1:10 13/04/2015 07:07 08:19 1:12 17/04/2015 07:01 09:26 2:25 20/04/2015 07:07 08:39 1:32 29/04/2015 07:01 09:27 2:26 29/04/2015 09:41 10:06 0:25 30/04/2015 07:08 09:19 2:11
Number of Runway 16 arrivals during PRM operations and their runway assignment
Date Number of arrivals on
Runway 16 during PRM
Runway assignment
16L 16R 10/04/2015 118 56 62 13/04/2015 47 22 25 17/04/2015 96 45 51 20/04/2015 59 28 31 29/04/2015 99 41 58 30/04/2015 82 39 43
16
Noise Complaints & Information Service The Noise Complaints & Information Service is a function of Airservices Australia located at Sydney Airport. Information on noise complaints will be published as a separate report on Airservices Australia website.
17

18

19
20
21
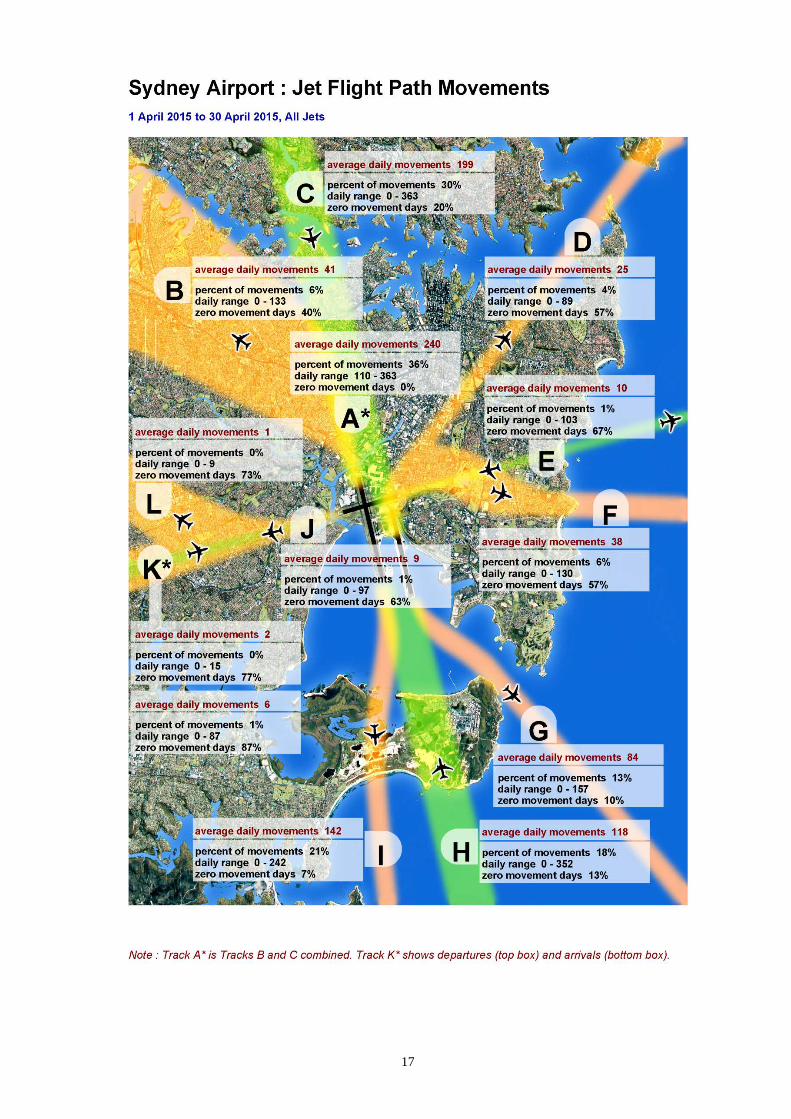
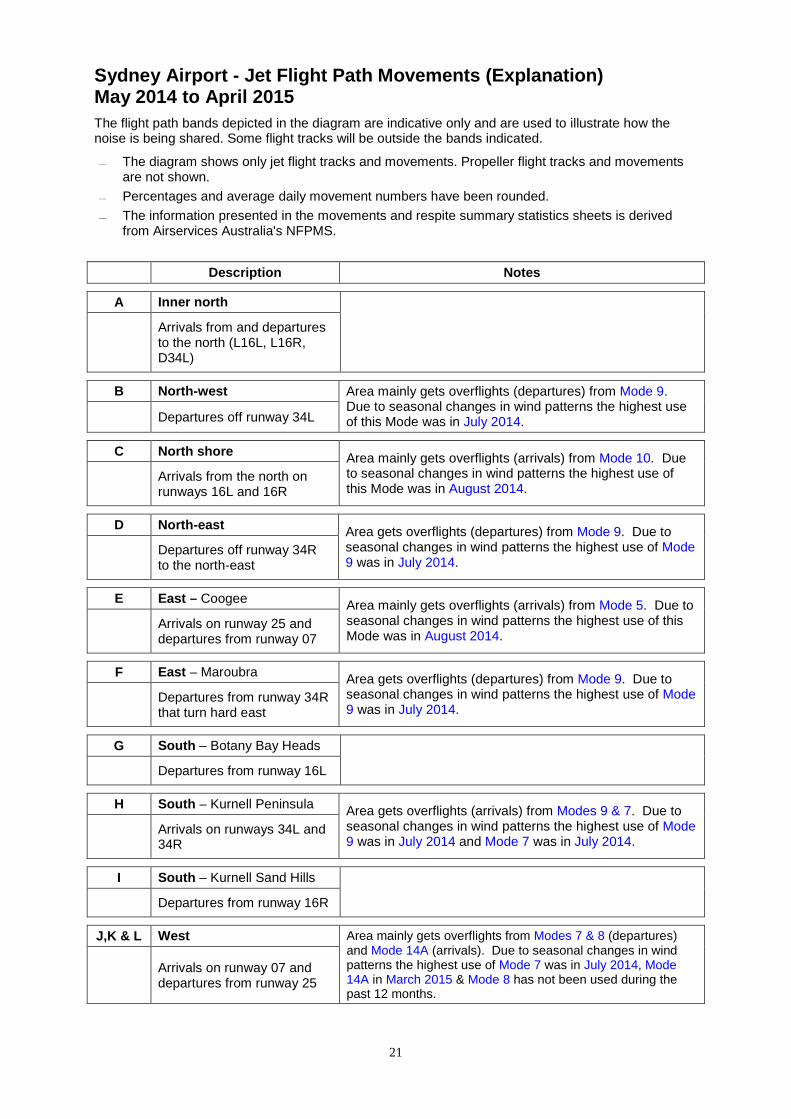
Sydney Airport - Jet Flight Path Movements (Explanation) May 2014 to April 2015 The flight path bands depicted in the diagram are indicative only and are used to illustrate how the noise is being shared. Some flight tracks will be outside the bands indicated.
The diagram shows only jet flight tracks and movements. Propeller flight tracks and movements are not shown.
Percentages and average daily movement numbers have been rounded.
The information presented in the movements and respite summary statistics sheets is derived from Airservices Australia's NFPMS.
Description Notes
A Inner north
Arrivals from and departures to the north (L16L, L16R, D34L)
B North-west Area mainly gets overflights (departures) from Mode 9. Due to seasonal changes in wind patterns the highest use of this Mode was in July 2014. Departures off runway 34L
C North shore Area mainly gets overflights (arrivals) from Mode 10. Due to seasonal changes in wind patterns the highest use of this Mode was in August 2014. Arrivals from the north on
runways 16L and 16R
D North-east Area gets overflights (departures) from Mode 9. Due to seasonal changes in wind patterns the highest use of Mode 9 was in July 2014. Departures off runway 34R
to the north-east
E East – Coogee Area mainly gets overflights (arrivals) from Mode 5. Due to seasonal changes in wind patterns the highest use of this Mode was in August 2014. Arrivals on runway 25 and
departures from runway 07
F East – Maroubra Area gets overflights (departures) from Mode 9. Due to seasonal changes in wind patterns the highest use of Mode 9 was in July 2014. Departures from runway 34R
that turn hard east
G South – Botany Bay Heads
Departures from runway 16L
H South – Kurnell Peninsula Area gets overflights (arrivals) from Modes 9 & 7. Due to seasonal changes in wind patterns the highest use of Mode 9 was in July 2014 and Mode 7 was in July 2014. Arrivals on runways 34L and
34R
I South – Kurnell Sand Hills
Departures from runway 16R
J,K & L West Area mainly gets overflights from Modes 7 & 8 (departures) and Mode 14A (arrivals). Due to seasonal changes in wind patterns the highest use of Mode 7 was in July 2014, Mode 14A in March 2015 & Mode 8 has not been used during the past 12 months.
Arrivals on runway 07 and departures from runway 25
22
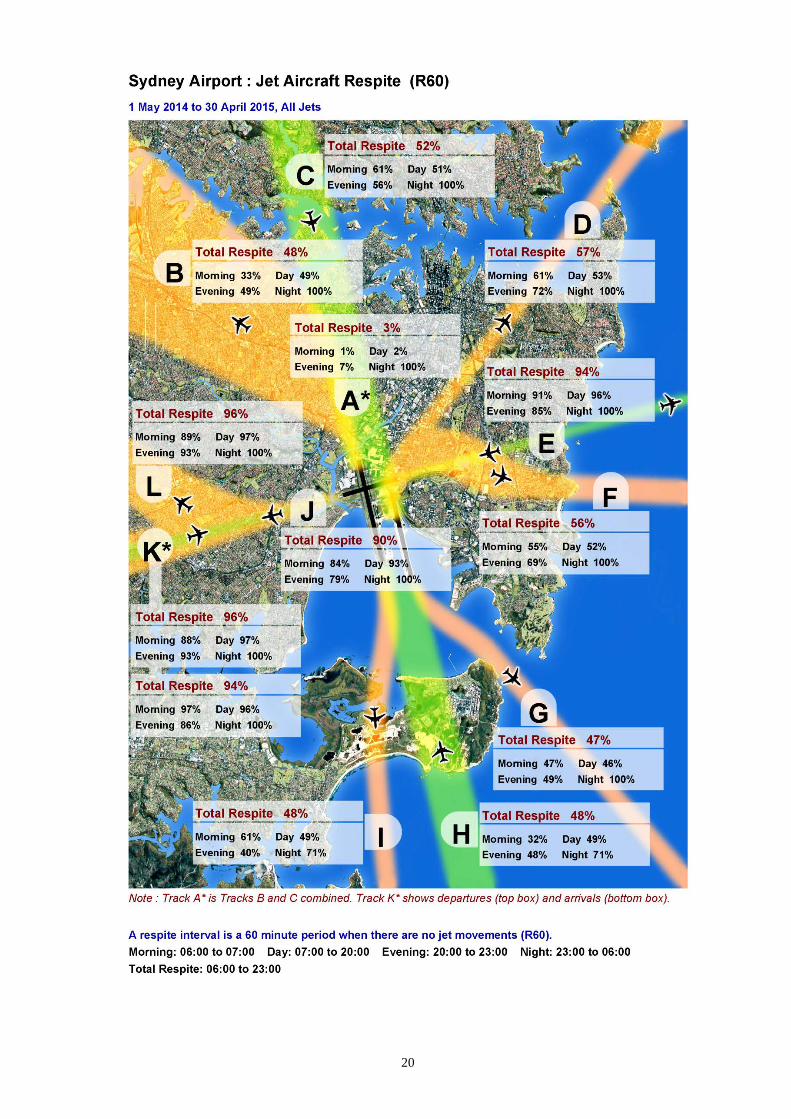
Sydney Airport - Jet Aircraft Respite (R60) (Explanation) Respite The respite figures in the map are based on the concept of a respite hour being a whole clock hour where there are no aircraft movements. Total Respite takes into account all 7 days of the week and is based on the total number
of clock hours during the period 6am to 11pm, for the period May 2014 to April 2015, during which there were no movements.
Morning Respite is based on the above criteria for the period 6am to 7am for all 7 days of the week. Day Respite is based on the above criteria for the period 7am to 8pm for all 7 days of the week. Evening Respite is based on the above criteria for the period 8pm to 11pm for all 7 days of
the week. Curfew (Night) is based on the above criteria for the period 11pm to 6am for all 7 days of
the week. The percentage figure for a category of respite refers to the proportion of the total possible number of respite hours for that category for the date period. For example, the Jet Aircraft Respite Hours map (for the last rolling year) shows that flight path D has Total Respite hours of 57%. This means that over the period May 2014 to April 2015 for 57% of the total clock hours between 6am and 11pm there were no movements on that flight path. Notes - Propeller movements have not been taken into account.
- The information presented in the map is derived from the Airport Noise and Operations
Management System (ANOMS) data and is subject to change.
- The flight path bands depicted in the map are indicative only and are used to illustrate the extent of respite in different areas. Some jet movements will be outside the bands indicated.
23
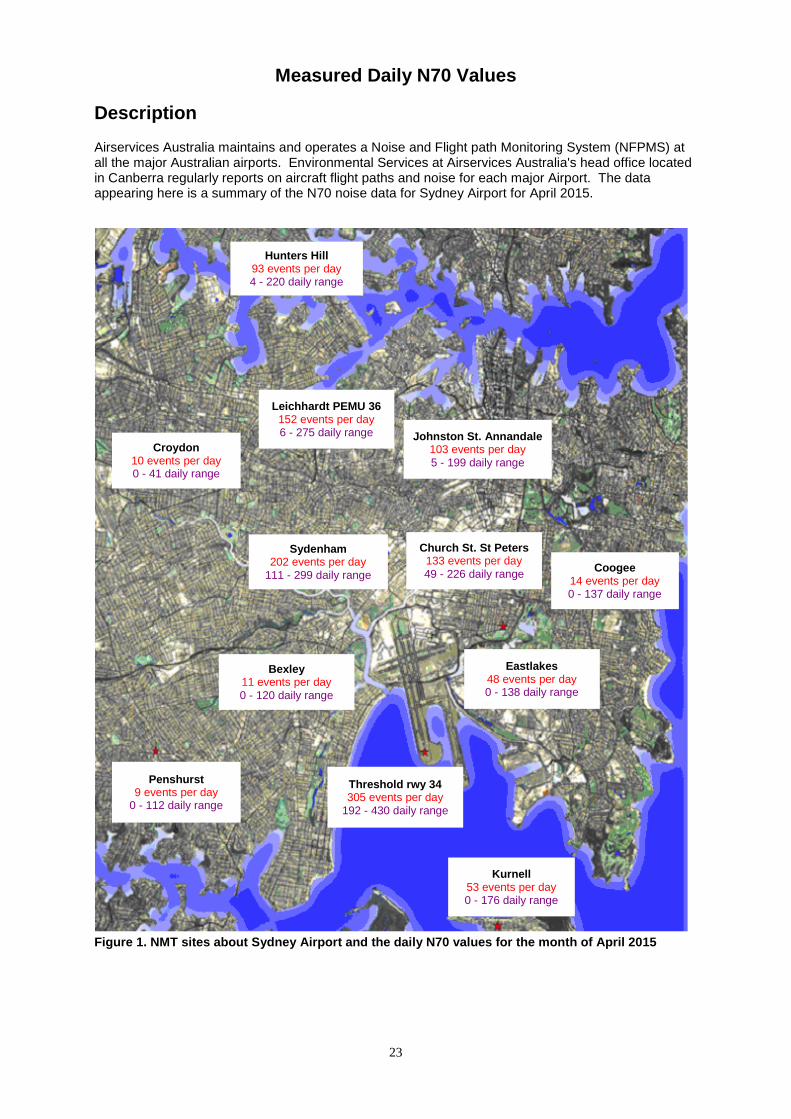
Figure 1. NMT sites about Sydney Airport and the daily N70 values for the month of April 2015
Hunters Hill 93 events per day 4 - 220 daily range
Leichhardt PEMU 36 152 events per day 6 - 275 daily range Johnston St. Annandale
103 events per day 5 - 199 daily range
Croydon 10 events per day 0 - 41 daily range
Sydenham 202 events per day
111 - 299 daily range
Church St. St Peters 133 events per day 49 - 226 daily range Coogee
14 events per day 0 - 137 daily range
Bexley 11 events per day 0 - 120 daily range
Eastlakes 48 events per day 0 - 138 daily range
Penshurst 9 events per day
0 - 112 daily range Threshold rwy 34 305 events per day
192 - 430 daily range
Kurnell 53 events per day 0 - 176 daily range
Measured Daily N70 Values Description Airservices Australia maintains and operates a Noise and Flight path Monitoring System (NFPMS) at all the major Australian airports. Environmental Services at Airservices Australia's head office located in Canberra regularly reports on aircraft flight paths and noise for each major Airport. The data appearing here is a summary of the N70 noise data for Sydney Airport for April 2015.
24
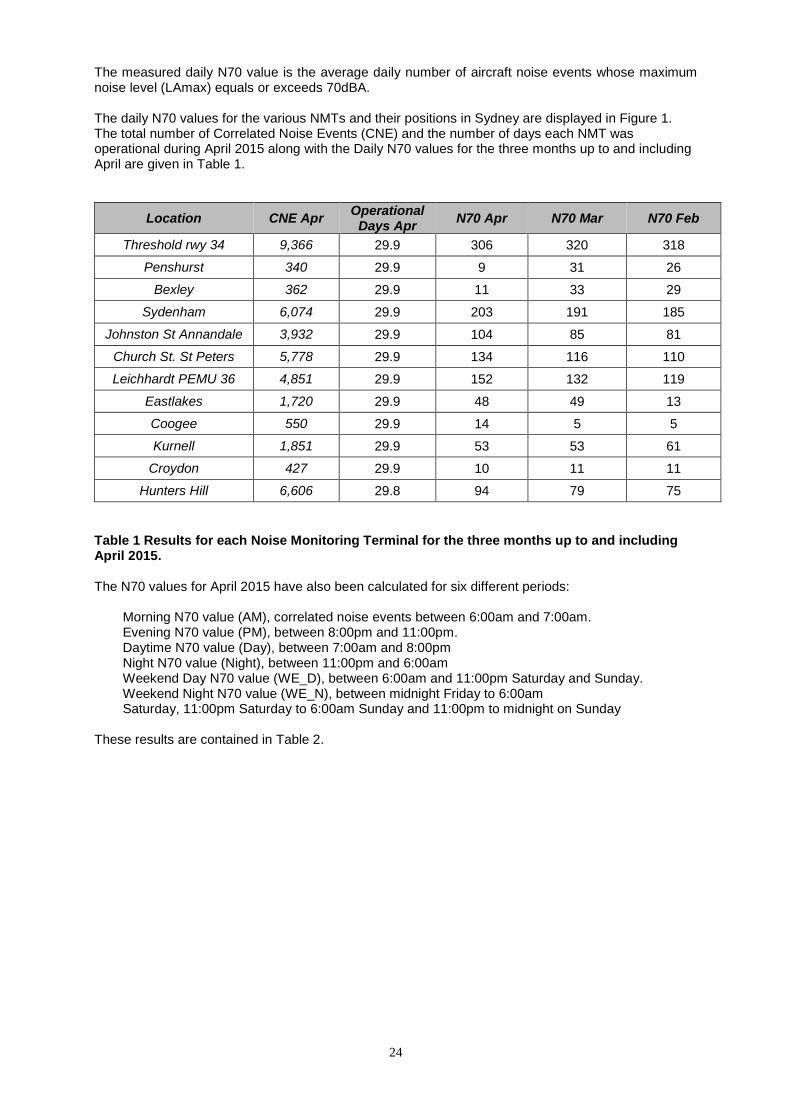
The measured daily N70 value is the average daily number of aircraft noise events whose maximum noise level (LAmax) equals or exceeds 70dBA. The daily N70 values for the various NMTs and their positions in Sydney are displayed in Figure 1. The total number of Correlated Noise Events (CNE) and the number of days each NMT was operational during April 2015 along with the Daily N70 values for the three months up to and including April are given in Table 1.
Location CNE Apr Operational Days Apr N70 Apr N70 Mar N70 Feb
Threshold rwy 34 9,366 29.9 306 320 318
Penshurst 340 29.9 9 31 26
Bexley 362 29.9 11 33 29
Sydenham 6,074 29.9 203 191 185
Johnston St Annandale 3,932 29.9 104 85 81
Church St. St Peters 5,778 29.9 134 116 110
Leichhardt PEMU 36 4,851 29.9 152 132 119
Eastlakes 1,720 29.9 48 49 13
Coogee 550 29.9 14 5 5
Kurnell 1,851 29.9 53 53 61
Croydon 427 29.9 10 11 11
Hunters Hill 6,606 29.8 94 79 75 Table 1 Results for each Noise Monitoring Terminal for the three months up to and including April 2015. The N70 values for April 2015 have also been calculated for six different periods:
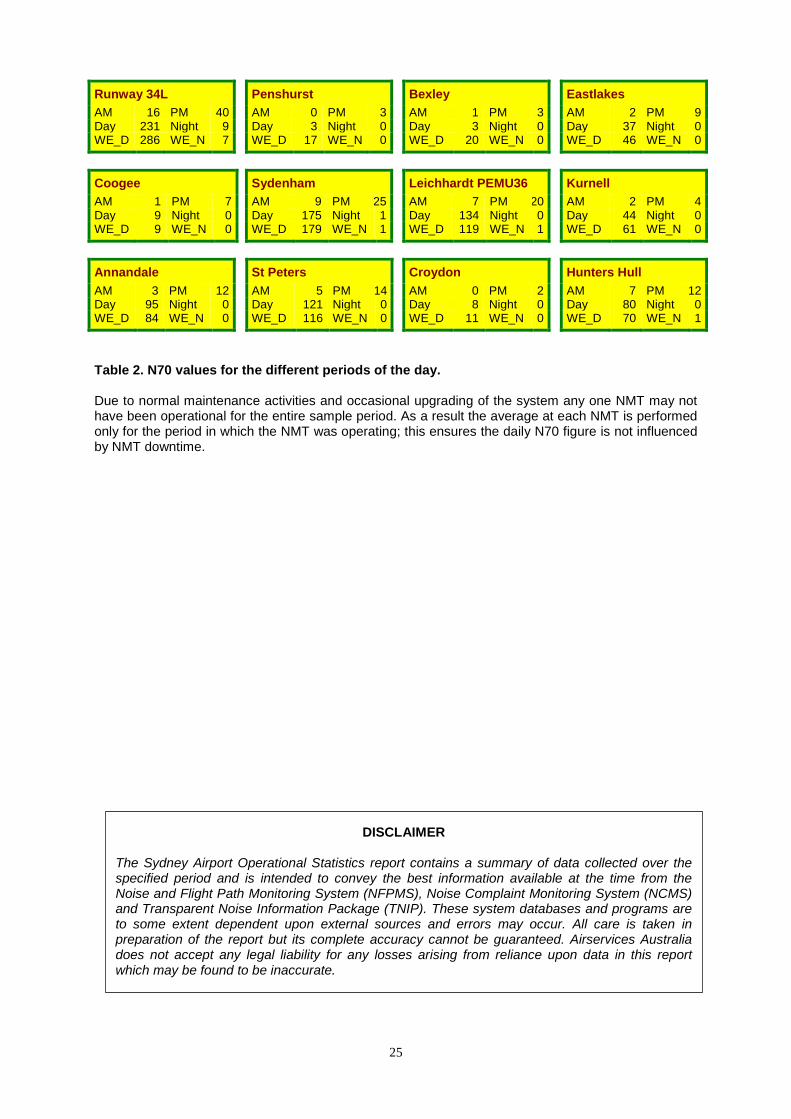
Morning N70 value (AM), correlated noise events between 6:00am and 7:00am. Evening N70 value (PM), between 8:00pm and 11:00pm. Daytime N70 value (Day), between 7:00am and 8:00pm Night N70 value (Night), between 11:00pm and 6:00am Weekend Day N70 value (WE_D), between 6:00am and 11:00pm Saturday and Sunday. Weekend Night N70 value (WE_N), between midnight Friday to 6:00am Saturday, 11:00pm Saturday to 6:00am Sunday and 11:00pm to midnight on Sunday
These results are contained in Table 2.
25
Runway 34L AM 16 PM 40 Day 231 Night 9 WE_D 286 WE_N 7
Coogee AM 1 PM 7 Day 9 Night 0 WE_D 9 WE_N 0
Annandale AM 3 PM 12 Day 95 Night 0 WE_D 84 WE_N 0
Penshurst AM 0 PM 3 Day 3 Night 0 WE_D 17 WE_N 0
Sydenham AM 9 PM 25 Day 175 Night 1 WE_D 179 WE_N 1
St Peters AM 5 PM 14 Day 121 Night 0 WE_D 116 WE_N 0
Bexley AM 1 PM 3 Day 3 Night 0 WE_D 20 WE_N 0
Leichhardt PEMU36 AM 7 PM 20 Day 134 Night 0 WE_D 119 WE_N 1
Croydon AM 0 PM 2 Day 8 Night 0 WE_D 11 WE_N 0
Eastlakes AM 2 PM 9 Day 37 Night 0 WE_D 46 WE_N 0
Kurnell AM 2 PM 4 Day 44 Night 0 WE_D 61 WE_N 0
Hunters Hull AM 7 PM 12 Day 80 Night 0 WE_D 70 WE_N 1
Table 2. N70 values for the different periods of the day. Due to normal maintenance activities and occasional upgrading of the system any one NMT may not have been operational for the entire sample period. As a result the average at each NMT is performed only for the period in which the NMT was operating; this ensures the daily N70 figure is not influenced by NMT downtime.
DISCLAIMER
The Sydney Airport Operational Statistics report contains a summary of data collected over the specified period and is intended to convey the best information available at the time from the Noise and Flight Path Monitoring System (NFPMS), Noise Complaint Monitoring System (NCMS) and Transparent Noise Information Package (TNIP). These system databases and programs are to some extent dependent upon external sources and errors may occur. All care is taken in preparation of the report but its complete accuracy cannot be guaranteed. Airservices Australia does not accept any legal liability for any losses arising from reliance upon data in this report which may be found to be inaccurate.