Embed Size (px)
Citation preview

Australia New Zealand Testing Board www.anztb.org
Guest PresentationTest Environment Management
“The Balance of Control & Agility”“The Balance of Control & Agility”
By: Steven Iannuzzelli
Copyright © ANZTB1
Australia New Zealand Testing Board www.anztb.org
Agenda
� Our Services and Scope
� Why Test Environment Management
� CBA Context
� Environment Management Challenges
� Environment Management Frameworks
� Reporting & Insights to Drive Continuous Improvement
� The Results
Australia New Zealand Testing Board www.anztb.org
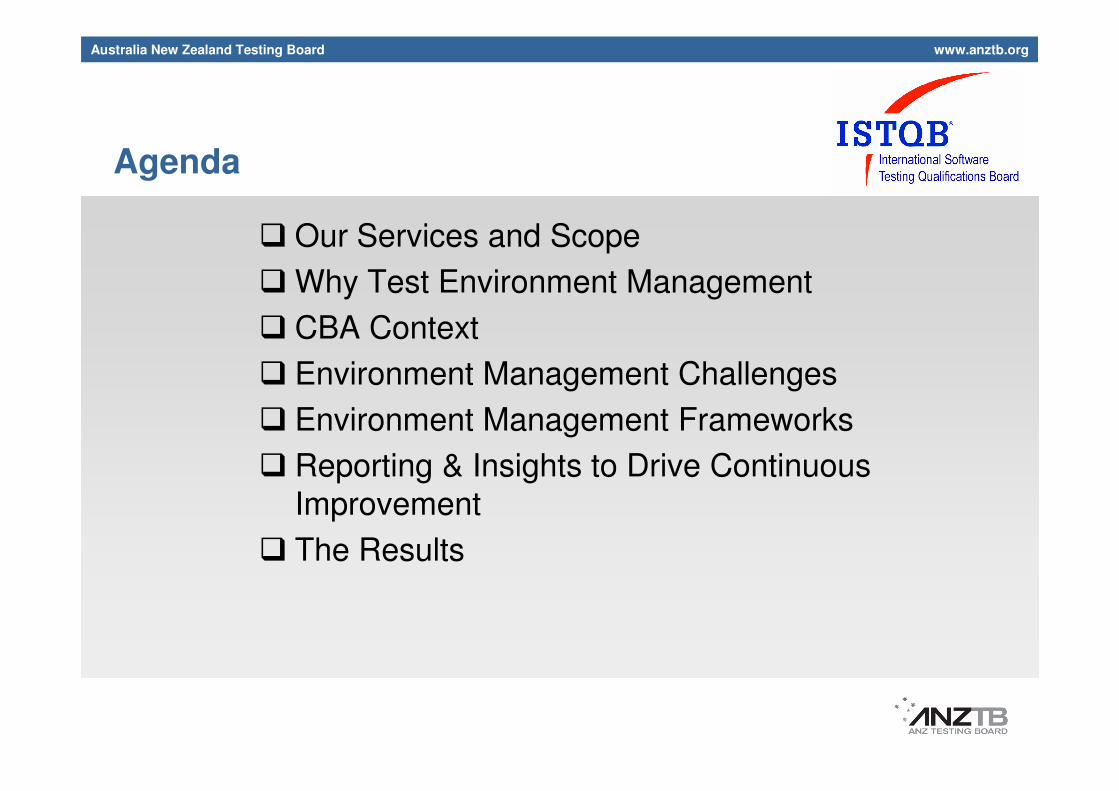
Enterprise Testing and Assurance ….our customers and services
EML / CommSec
EML / CommSec
Retail Banking
Retail Banking
Institutional and Global
Markets
Institutional and Global
Markets
Finance, HR, Risk,
Marketing,
Finance, HR, Risk,
Marketing,
Business and
Corporate Banking
Business and
Corporate Banking
Funds Mgt and
Insurance
Funds Mgt and
Insurance
Enterprise Services (IT,
BackOffice)
Enterprise Services (IT,
BackOffice)
Test Management ServicesTest Management Services
Project Engagements200-300 active testing projects
Project Engagements200-300 active testing projects
Test Management Services+750 Test Professionals
Test Management Services+750 Test Professionals
Demand and Resource ManagementDemand and Resource Management
Performance Testing / Test Automation / Tools SupportPerformance Testing / Test Automation / Tools Support
Enterprise Testing
and Assurance
Process Mgt, Measurement & Continuous Improvement
Environment & Release Management Services
Australia New Zealand Testing Board www.anztb.org
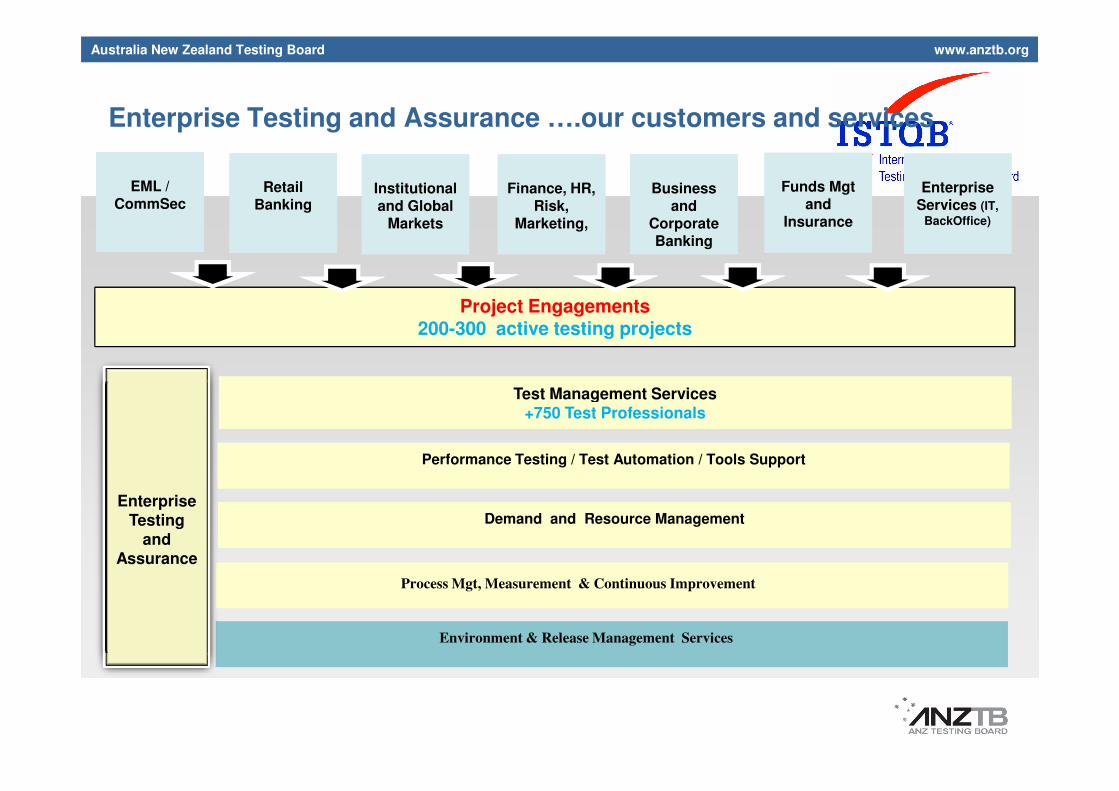
Why Test Environment Management ?
� Significant enterprise demand and reliance on integrated test environments
� Up to 30-40 % of testing time is often lost in environment related issues
� Significant improvements can be achieved by implementing basic ‘ITIL” practices to
improve availability as test environment processes are often informal compared to
productionproduction
� A dedicated Test Environment Management capability should be considered as a
means for implementing process improvements and taking accountability to
increase availability and maintain “production-likeness” of your test environments.
� The effective management and accountability for process improvement benefits
realisation can result in large savings for the project portfolio
Australia New Zealand Testing Board www.anztb.org
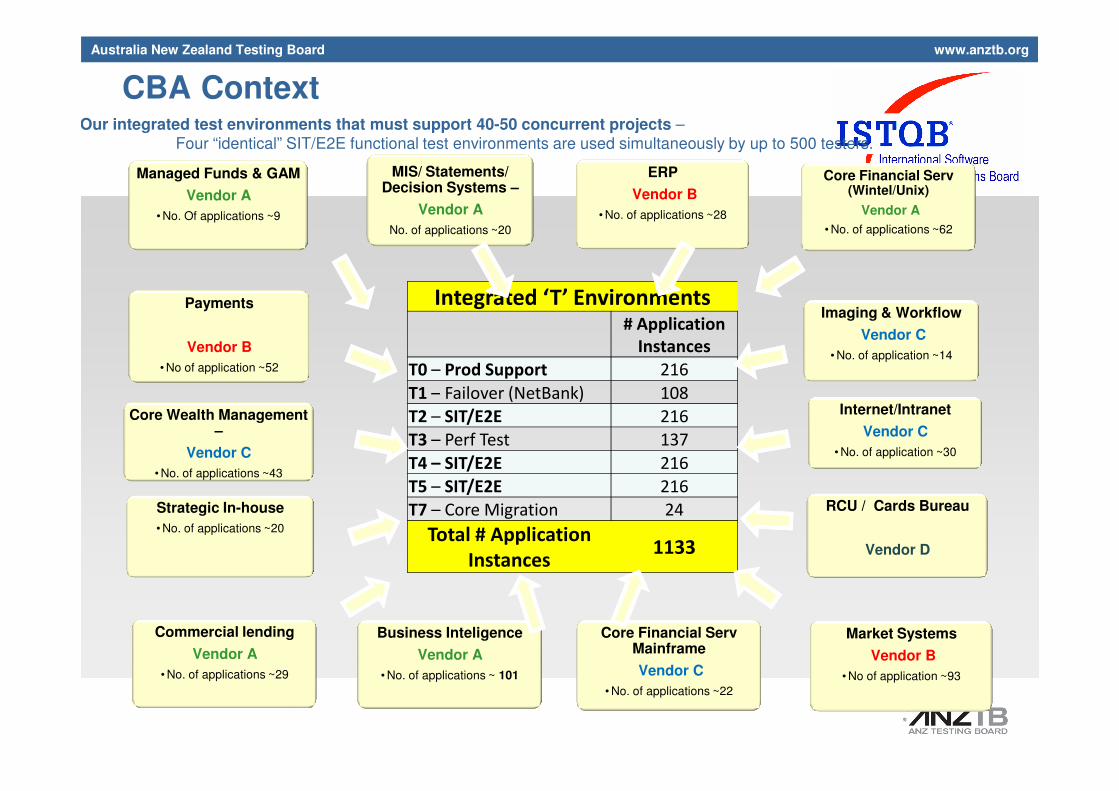
Integrated ‘T’ Environments# Application
Instances
T0 – Prod Support 216
T1 – Failover (NetBank) 108
Our integrated test environments that must support 40-50 concurrent projects –Four “identical” SIT/E2E functional test environments are used simultaneously by up to 500 testers.
Core Financial Serv(Wintel/Unix)
Vendor A
• No. of applications ~62
ERP
Vendor B
• No. of applications ~28
Managed Funds & GAM
Vendor A
• No. Of applications ~9
MIS/ Statements/ Decision Systems –
Vendor A
No. of applications ~20
Imaging & Workflow
Vendor C
• No. of application ~14
Payments
Vendor B
• No of application ~52
CBA Context
T1 – Failover (NetBank) 108
T2 – SIT/E2E 216
T3 – Perf Test 137
T4 – SIT/E2E 216
T5 – SIT/E2E 216
T7 – Core Migration 24
Total # Application
Instances1133
Core Financial ServMainframe
Vendor C
• No. of applications ~22
Internet/Intranet
Vendor C
• No. of application ~30
Market Systems
Vendor B
• No of application ~93
Strategic In-house
• No. of applications ~20
Core Wealth Management –
Vendor C
• No. of applications ~43
Commercial lending
Vendor A
• No. of applications ~29
RCU / Cards Bureau
Vendor D
Business Inteligence
Vendor A
• No. of applications ~ 101
Australia New Zealand Testing Board www.anztb.org
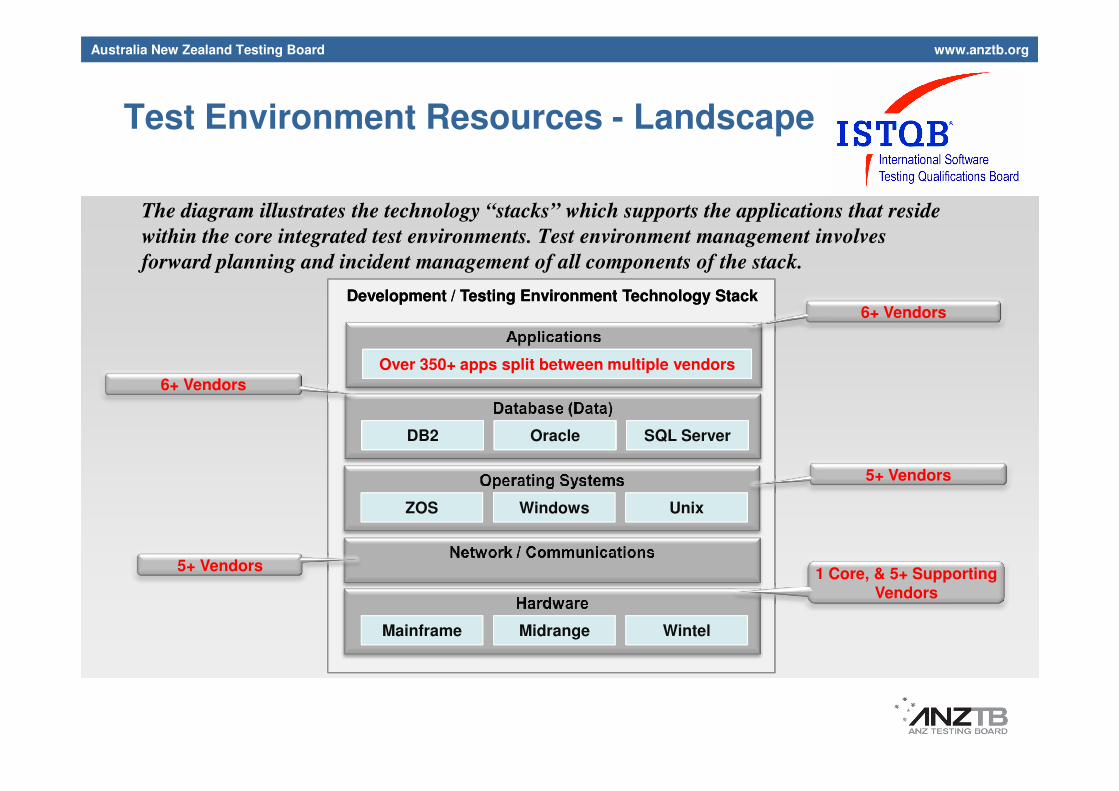
Test Environment Resources - Landscape
Development / Testing Environment Technology StackDevelopment / Testing Environment Technology Stack
Over 350+ apps split between multiple vendorsOver 350+ apps split between multiple vendors
6+ Vendors
6+ Vendors
Over 350+ apps split between multiple vendors
The diagram illustrates the technology “stacks” which supports the applications that reside
within the core integrated test environments. Test environment management involves
forward planning and incident management of all components of the stack.
Mainframe Midrange Wintel
ZOS Windows Unix
DB2DB2 OracleOracle SQL ServerSQL Server
1 Core, & 5+ Supporting Vendors
5+ Vendors
5+ Vendors
DB2 Oracle SQL Server

Australia New Zealand Testing Board www.anztb.org
Test Environment Management Challenges
Change controls need to balance speedy delivery, with environment
stability.
Planning and stakeholder expectations need to reflect realistic
availability levels…
We can’t expect same performance as production.
• Sufficient Environments
• Increasing project demand
Key challenges
Test Environment Availability is impacted by a number of factors, namely code deployment issues,
configuration errors, server and network downtime.
Enterprise Services – Service Development – ET&A - Test Environment Services
• Increasing project demand
• Engagement and expectation management
• Environment Provisioning & Evolution• Introduction of new applications across
multiple integrated test environments
• Maintenance and upgrades of existing applications
• Cost of provisioning and environment management
• Environment Stability
• Agility and speed Vs. Control and stability
• Complexity of applying code to multiple environments

Australia New Zealand Testing Board www.anztb.org
Enterprise Testing and Assurance – Strategic Framework
Create the Finest customer experience delivered by the best people and services underpinned by superior processes and agile
technology.
Giving our customers what they want, when they need it.
� Ensuring a consistent
experience (common
process, templates,
estimates)
� Integrated Process
(SDLC/CMDB)
� Consistent metrics and
reporting
� Applying PE Principles
(Living Zero, getting it
right first time)
Providing services which are flexible and responsive to our
customers’ needs.
� Tailored processes to
meet customer needs
� Risk based decision
making
� On demand services
� Knowledge reuse
Transforming our organisation with an engaged, diverse team
focussed on customers and continual development.
� Diverse teams
� Build a “Quality Culture”
� Embrace organisational
change management
� Customer centricity
� Leadership development
� Develop trusting
relationships
Achieving better outcomes for customers through increased
standardisation, reuse and cost optimisation.
� Continued process
improvement
� Engagement efficiency
� Building process
excellence capability
� Maximise reuse
� Optimized resource
utilisation

Australia New Zealand Testing Board www.anztb.org
Use standard ITIL practices to define your environmentmanagement framework….
9
Team Structure
(Roles and
Responsibilities)
Governance
Forums and
Committees
Application Development Team(Code, Application Environment Configuration, Test Data)
Input
Process
Request for support for
Environment –
Test data, Configuration
parameters
Demand Management
Change Management
Release Management
Request for
Enhancement or
IT fix change – Risk and
Impact Assessment
Request for deployment
of changes – Fixes,
Enhancements and
Maintenance
Build - System Administration (Upgrade/Maintenance) and Server Backup
Status Reporting
Knowledge Management
Metrics
Environment Setup
Tools ManagementData Management
Process
Output
Data synchronization with production environment
Consistent and Accurate Test Environment
Early defect detection - Production failure scenarios detected at Testing
External failure cost reduction – Lesser post-production defects
Automation of Test Environment Management – Tool Management
Reduction in test environment downtime – reduction in release cycle time
Build - System Administration (Upgrade/Maintenance) and Server Backup
Australia New Zealand Testing Board www.anztb.org
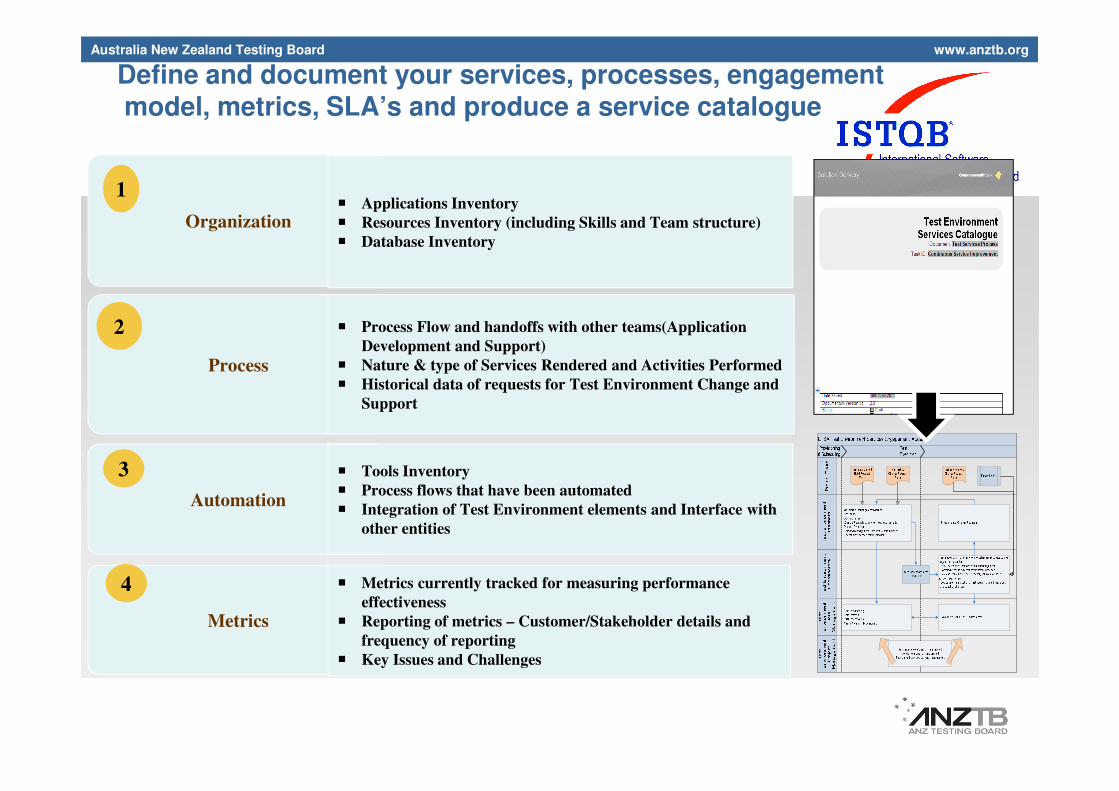
Define and document your services, processes, engagementmodel, metrics, SLA’s and produce a service catalogue
Organization� Applications Inventory
� Resources Inventory (including Skills and Team structure)
� Database Inventory
Process
� Process Flow and handoffs with other teams(Application
Development and Support)
� Nature & type of Services Rendered and Activities Performed
� Historical data of requests for Test Environment Change and
Support
1
2
Support
Automation
� Tools Inventory
� Process flows that have been automated
� Integration of Test Environment elements and Interface with
other entities
Metrics
� Metrics currently tracked for measuring performance
effectiveness
� Reporting of metrics – Customer/Stakeholder details and
frequency of reporting
� Key Issues and Challenges
3
4

Australia New Zealand Testing Board www.anztb.org
Australia New Zealand Testing Board www.anztb.org
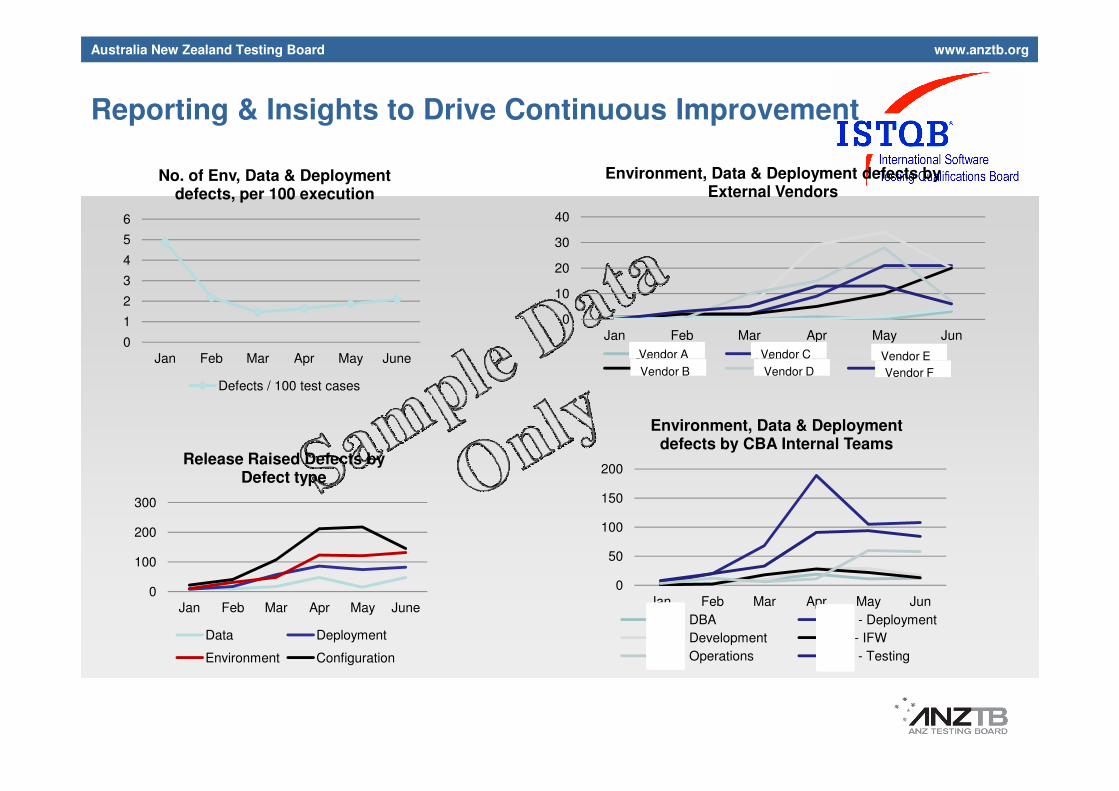
0
1
2
3
4
5
6
Jan Feb Mar Apr May June
No. of Env, Data & Deployment defects, per 100 execution
Defects / 100 test cases
Reporting & Insights to Drive Continuous Improvement
0
10
20
30
40
Jan Feb Mar Apr May Jun
Environment, Data & Deployment defects by External Vendors
Gen-i HCL HPIBM SAP TCSVendor A
Vendor D
Vendor C
Vendor B Vendor F
Vendor E
0
100
200
300
Jan Feb Mar Apr May June
Release Raised Defects by Defect type
Data Deployment
Environment Configuration
0
50
100
150
200
Jan Feb Mar Apr May Jun
Environment, Data & Deployment defects by CBA Internal Teams
CBA - DBA CBA - Deployment
CBA - Development CBA- IFW
CBA - Operations CBA - Testing

Australia New Zealand Testing Board www.anztb.org
Detailed metrics on productivity impacts, used to drivecontinuous improvements…
Lost Testing Hours by Root-Cause / by service provider)
Detailed metrics by severity and repeat failed changes

Australia New Zealand Testing Board www.anztb.org
Track and report process improvement initiatives to CIO and steering groups
Jan 2010 – Jun 2010
Jun 2010 – Dec 2010
Jan 2011 – Oct 2011
Non 2011 – Jun 2012
�Standardised change management process & increase applications in Test environments CAB.
�Standardised change management process & increase applications in Test environments CAB.
�Increase reporting coverage by environment to further
�Increase reporting coverage by environment to further
�Improved process in capturing project environment requirements.
�Improved process in capturing project environment requirements.
�Increase use of automated tools and services to facilitate
�Increase use of automated tools and services to facilitate
� Review estimation process gaps and cost recovery processes
� Review estimation process gaps and cost recovery processes
� Review and formaliseacceptable SLA’s and SLO’s for internal and
� Review and formaliseacceptable SLA’s and SLO’s for internal and
� Investigate build downtime reduction -dynamic environment switching
� Investigate build downtime reduction -dynamic environment switching
� Support services and scope review with cost rationalisation
� Support services and scope review with cost rationalisation
Completed Work in progress
environment to further drive process improvements
environment to further drive process improvements
�Enable continuous improvement by increasing detail in reporting.
�Enable continuous improvement by increasing detail in reporting.
�Virtualization of application & infrastructure activities.
�Virtualization of application & infrastructure activities.
services to facilitate testing requirements.services to facilitate testing requirements.
�Increase scope in automated shakedown tests.
�Increase scope in automated shakedown tests.
�Review resources across test environments to identify sharing opportunities
�Review resources across test environments to identify sharing opportunities
SLO’s for internal and vendor managed applications.
SLO’s for internal and vendor managed applications.
� Start of day and end of day test automation analysis
� Start of day and end of day test automation analysis
�Increase documentation detail of core systems
�Increase documentation detail of core systems
rationalisationrationalisation
� Live monitoring of services and accounts to proactively maintain environments.
� Live monitoring of services and accounts to proactively maintain environments.
�Change management tool Automation�Change management tool Automation

Australia New Zealand Testing Board www.anztb.org
Realisation of Virtualisation & Cloud Benefits
Investment Split & Benefit Analysis
Mths
Physical
Servers
Virtual
Servers
Total Op Ex
36 300 0 300 100%
24 240 60 300 ↓↓↓↓ 18%
18 170 130 300 ↓↓↓↓ 26%
12 80 300 380 ↓↓↓↓ 55%
6 80 390 410 ↑↑↑↑ 3%
Months
now 80 500 580 ↑↑↑↑ 5%
Investment Benefits
� Increased capacity for reduced cost
� Procurement & provisioning 27 days reduced to 1hr
� Real Estate (data centres, racks) Overhead cost reduction
Investment Enablers
�Elastic resource utilisation CPU follows demand
� Snapshot builds 20mins
� Availability increases Speed of recovery
� Duplicate stacks Reduce change
impacts
� Demand driven environment integration
� Automation tools & services ITKO LISA / ACDC

Australia New Zealand Testing Board www.anztb.org
Self Service Information

Australia New Zealand Testing Board www.anztb.org
Test Environment Services Tool

Australia New Zealand Testing Board www.anztb.org
Booking Analysis & Summary

Australia New Zealand Testing Board www.anztb.org
Asset Management & Asset Detail