Embed Size (px)
Citation preview
ONGC
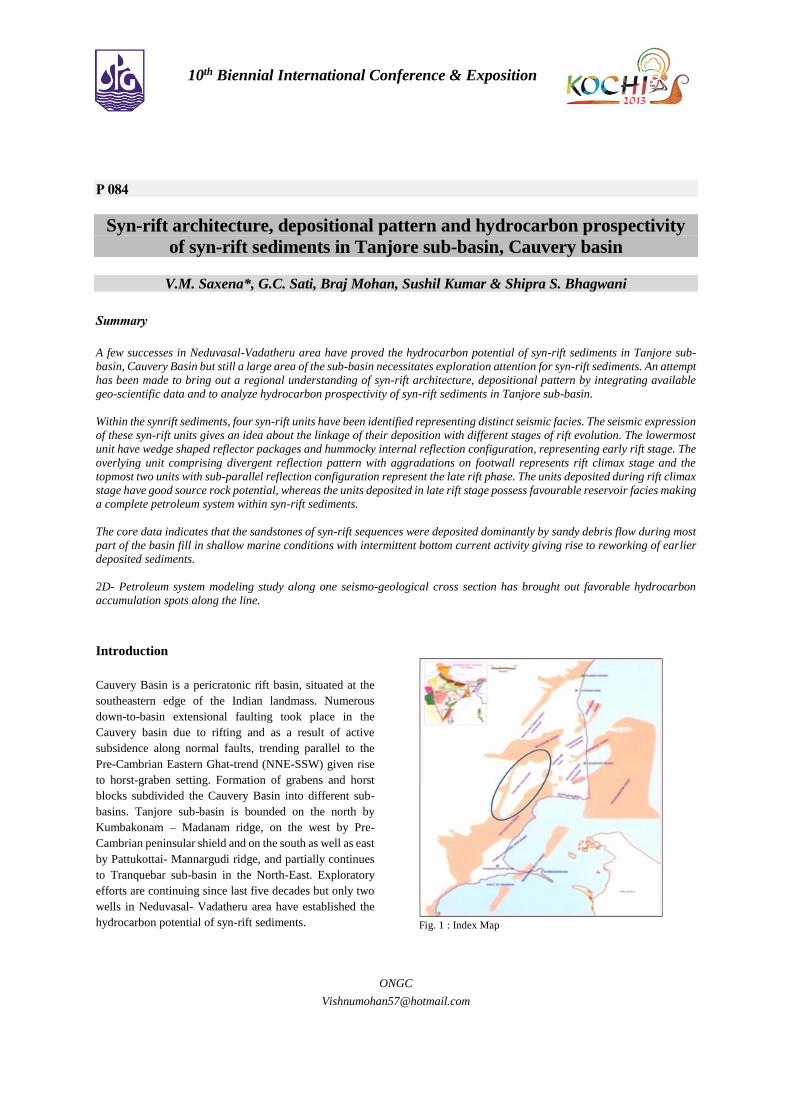
10th Biennial International Conference & Exposition
P 084
Syn-rift architecture, depositional pattern and hydrocarbon prospectivity
of syn-rift sediments in Tanjore sub-basin, Cauvery basin
V.M. Saxena*, G.C. Sati, Braj Mohan, Sushil Kumar & Shipra S. Bhagwani
Summary
A few successes in Neduvasal-Vadatheru area have proved the hydrocarbon potential of syn-rift sediments in Tanjore sub-
basin, Cauvery Basin but still a large area of the sub-basin necessitates exploration attention for syn-rift sediments. An attempt
has been made to bring out a regional understanding of syn-rift architecture, depositional pattern by integrating available
geo-scientific data and to analyze hydrocarbon prospectivity of syn-rift sediments in Tanjore sub-basin.
Within the synrift sediments, four syn-rift units have been identified representing distinct seismic facies. The seismic expression
of these syn-rift units gives an idea about the linkage of their deposition with different stages of rift evolution. The lowermost
unit have wedge shaped reflector packages and hummocky internal reflection configuration, representing early rift stage. The
overlying unit comprising divergent reflection pattern with aggradations on footwall represents rift climax stage and the
topmost two units with sub-parallel reflection configuration represent the late rift phase. The units deposited during rift climax
stage have good source rock potential, whereas the units deposited in late rift stage possess favourable reservoir facies making
a complete petroleum system within syn-rift sediments.
The core data indicates that the sandstones of syn-rift sequences were deposited dominantly by sandy debris flow during most
part of the basin fill in shallow marine conditions with intermittent bottom current activity giving rise to reworking of earlier
deposited sediments.
2D- Petroleum system modeling study along one seismo-geological cross section has brought out favorable hydrocarbon
accumulation spots along the line.
Introduction
Cauvery Basin is a pericratonic rift basin, situated at the
southeastern edge of the Indian landmass. Numerous
down-to-basin extensional faulting took place in the
Cauvery basin due to rifting and as a result of active
subsidence along normal faults, trending parallel to the
Pre-Cambrian Eastern Ghat-trend (NNE-SSW) given rise
to horst-graben setting. Formation of grabens and horst
blocks subdivided the Cauvery Basin into different sub-
basins. Tanjore sub-basin is bounded on the north by
Kumbakonam – Madanam ridge, on the west by Pre-
Cambrian peninsular shield and on the south as well as east
by Pattukottai- Mannargudi ridge, and partially continues
to Tranquebar sub-basin in the North-East. Exploratory
efforts are continuing since last five decades but only two
wells in Neduvasal- Vadatheru area have established the
hydrocarbon potential of syn-rift sediments.
Fig. 1 : Index Map
2
Four log markers have been identified in the syn-rift
section on the basis of log characters and bio-stratigrapic
control. Equivalent seismic markers could be traced and
were mapped regionally along with Basement top. The
four Cauvery Tanjore Syn-rift units bounded by these
seismic markers were named as unit 1, unit 2, unit 3 & unit
4, from older to younger. These unit tops were dated with
the available paleontological/ palynological informations.
The top of unit 1, unit 2 & unit 4 have been assigned as
Barremian (?), Aptian and Albian tops respectively,
whereas unit 3 lie within Albian.
These identified units have distinct seismic facies. The
seismic facies within the units indicate their depositional
environment associated with the stage of rifting. Lower
part of bottom most unit1 was deposited during early rift
stage. Rift climax stage prevailed during deposition of unit
2 and upper part of unit 1, whereas, unit 3 & 4 were
deposited during late rift stage. It is observed that the
potential and effective source are present in the unit 2,
followed by unit 3 and better reservoir facies are
developed in unit 3 & 4. The favorable reservoir facies are
also expected in unit 1 in fans and channels deposited in
early stage of rifting. Hence, the favorable Petroleum
system exists within the synrift sediments.
The time structure map at Basement level indicates four
isolated lows which merged to form two major lows at the
end of rift, one extending from North-East to North-
Central part and other in south. The Northern low is more
prominent and wide spread. Southern low, which was
earlier connected to western deepest low at basement level,
got well differentiated as the rift progressed and becomes
shallower and localized towards south-western margin.
Moreover, Krishnapuram-Vadatheru-Orthanandu spur in
the central part gradually becomes more prominent and
widespread towards NW, bifurcating the two lows. The
available core data indicates that the sediments were
originally transported by fluvial drainage with
considerable length of transportation and deposited in the
shallow marine setup. The sedimentation was later
dominated by sandy debris flow along with intermittent
bottom current activity in shallow marine condition.
2D- Petroleum system modeling study along one seismo-
geological cross section has brought out favorable
hydrocarbon accumulation spots along the line.
Discussion
Log Analysis
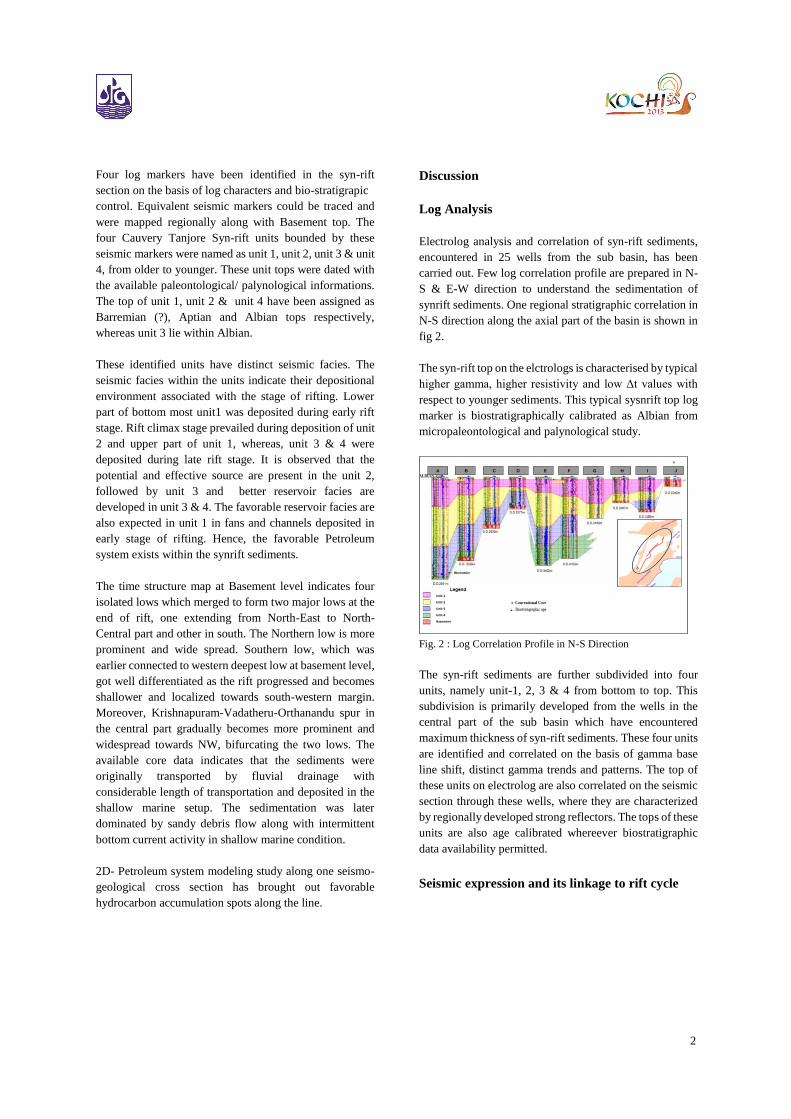
Electrolog analysis and correlation of syn-rift sediments,
encountered in 25 wells from the sub basin, has been
carried out. Few log correlation profile are prepared in N-
S & E-W direction to understand the sedimentation of
synrift sediments. One regional stratigraphic correlation in
N-S direction along the axial part of the basin is shown in
fig 2.
The syn-rift top on the elctrologs is characterised by typical
higher gamma, higher resistivity and low Δt values with
respect to younger sediments. This typical sysnrift top log
marker is biostratigraphically calibrated as Albian from
micropaleontological and palynological study.
Fig. 2 : Log Correlation Profile in N-S Direction
The syn-rift sediments are further subdivided into four
units, namely unit-1, 2, 3 & 4 from bottom to top. This
subdivision is primarily developed from the wells in the
central part of the sub basin which have encountered
maximum thickness of syn-rift sediments. These four units
are identified and correlated on the basis of gamma base
line shift, distinct gamma trends and patterns. The top of
these units on electrolog are also correlated on the seismic
section through these wells, where they are characterized
by regionally developed strong reflectors. The tops of these
units are also age calibrated whereever biostratigraphic
data availability permitted.
Seismic expression and its linkage to rift cycle
B C D E F G H I JA
Unit-1
Unit-2
Unit-3
Unit-4
Basement
N
A
J
B C D E F G H I JA
Unit-1
Unit-2
Unit-3
Unit-4
Basement
N
A
J
A
J
3
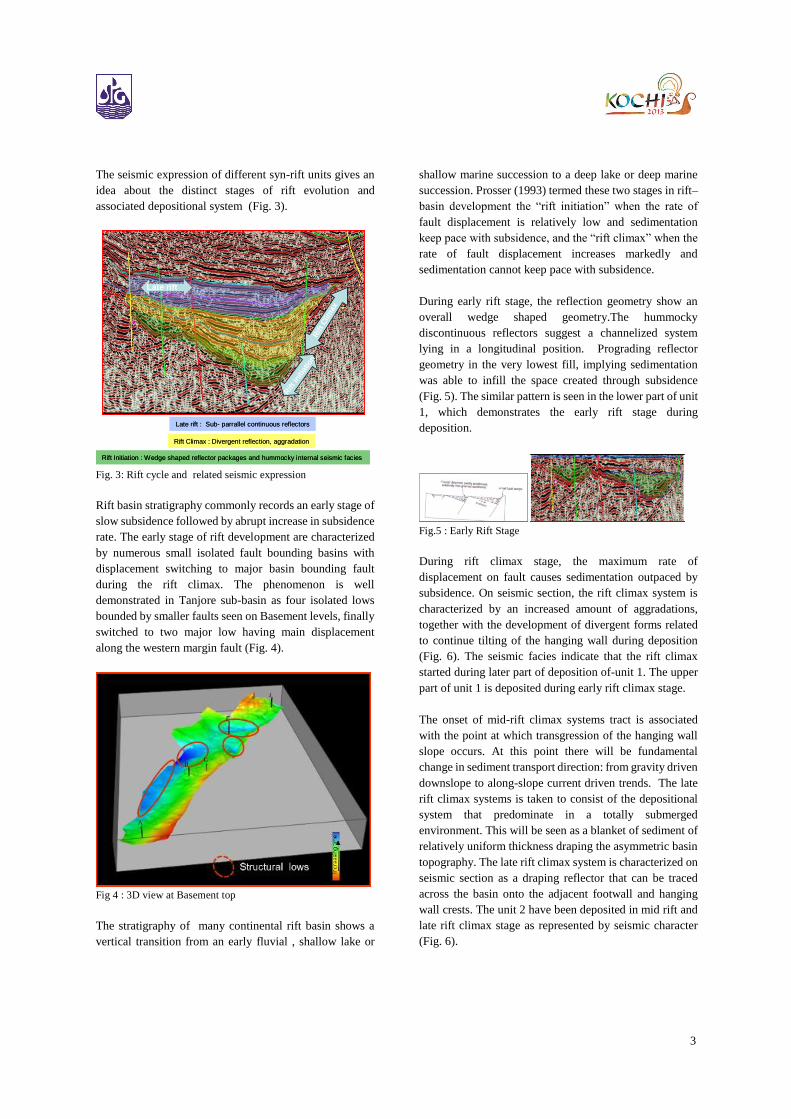
The seismic expression of different syn-rift units gives an
idea about the distinct stages of rift evolution and
associated depositional system (Fig. 3).
Fig. 3: Rift cycle and related seismic expression
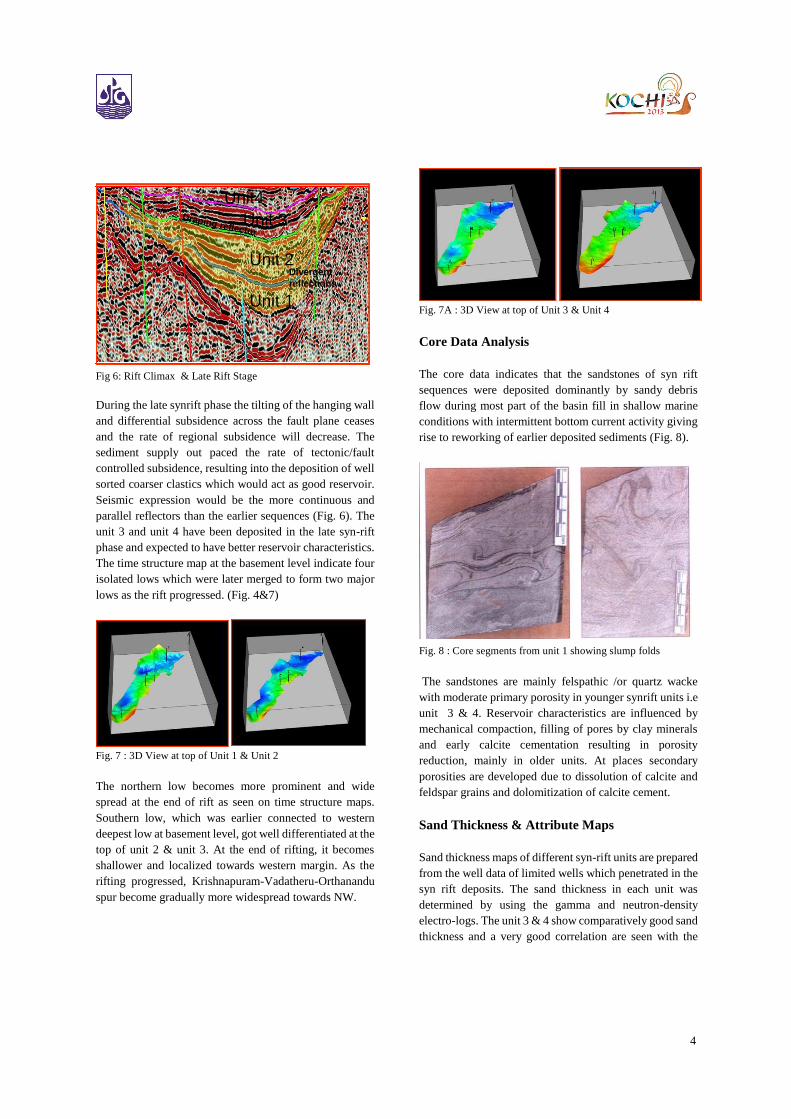
Rift basin stratigraphy commonly records an early stage of
slow subsidence followed by abrupt increase in subsidence
rate. The early stage of rift development are characterized
by numerous small isolated fault bounding basins with
displacement switching to major basin bounding fault
during the rift climax. The phenomenon is well
demonstrated in Tanjore sub-basin as four isolated lows
bounded by smaller faults seen on Basement levels, finally
switched to two major low having main displacement
along the western margin fault (Fig. 4).
Fig 4 : 3D view at Basement top
The stratigraphy of many continental rift basin shows a
vertical transition from an early fluvial , shallow lake or
shallow marine succession to a deep lake or deep marine
succession. Prosser (1993) termed these two stages in rift–
basin development the “rift initiation” when the rate of
fault displacement is relatively low and sedimentation
keep pace with subsidence, and the “rift climax” when the
rate of fault displacement increases markedly and
sedimentation cannot keep pace with subsidence.
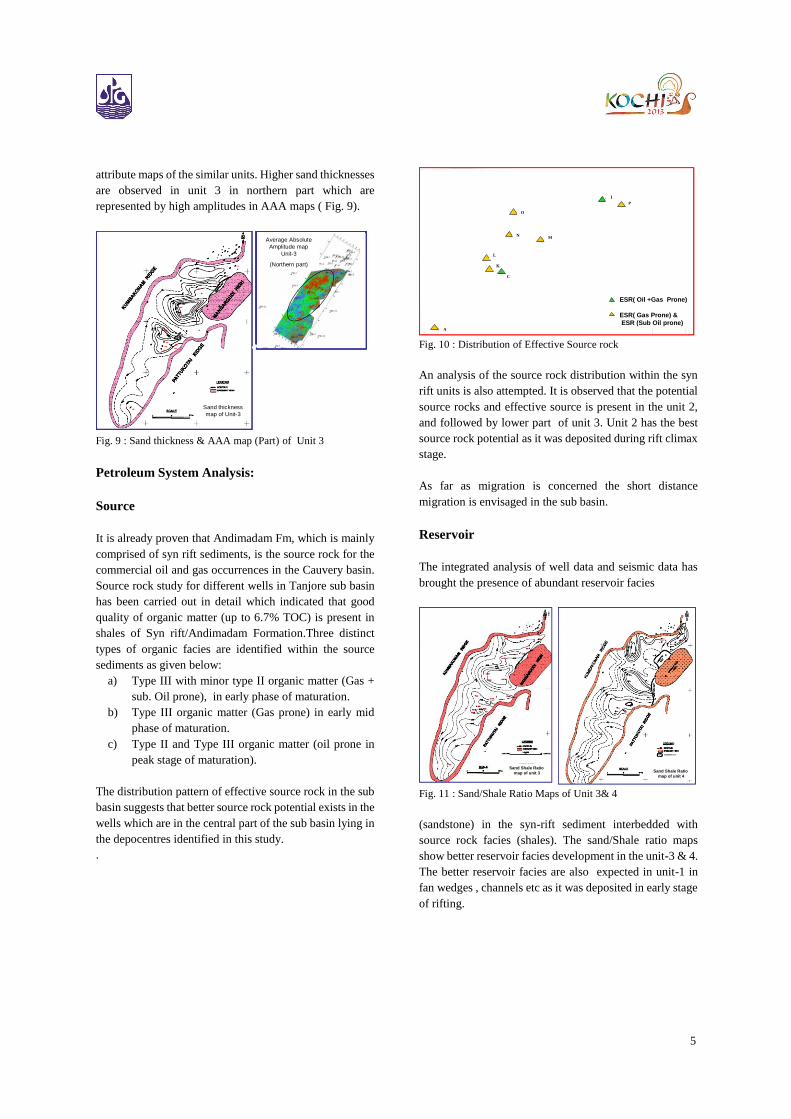
During early rift stage, the reflection geometry show an
overall wedge shaped geometry.The hummocky
discontinuous reflectors suggest a channelized system
lying in a longitudinal position. Prograding reflector
geometry in the very lowest fill, implying sedimentation
was able to infill the space created through subsidence
(Fig. 5). The similar pattern is seen in the lower part of unit
1, which demonstrates the early rift stage during
deposition.
Fig.5 : Early Rift Stage
During rift climax stage, the maximum rate of
displacement on fault causes sedimentation outpaced by
subsidence. On seismic section, the rift climax system is
characterized by an increased amount of aggradations,
together with the development of divergent forms related
to continue tilting of the hanging wall during deposition
(Fig. 6). The seismic facies indicate that the rift climax
started during later part of deposition of-unit 1. The upper
part of unit 1 is deposited during early rift climax stage.
The onset of mid-rift climax systems tract is associated
with the point at which transgression of the hanging wall
slope occurs. At this point there will be fundamental
change in sediment transport direction: from gravity driven
downslope to along-slope current driven trends. The late
rift climax systems is taken to consist of the depositional
system that predominate in a totally submerged
environment. This will be seen as a blanket of sediment of
relatively uniform thickness draping the asymmetric basin
topography. The late rift climax system is characterized on
seismic section as a draping reflector that can be traced
across the basin onto the adjacent footwall and hanging
wall crests. The unit 2 have been deposited in mid rift and
late rift climax stage as represented by seismic character
(Fig. 6).
Rift Initiation : Wedge shaped reflector packages and hummocky internal seismic facies
Rift Climax : Divergent reflection, aggradation
Late rift : Sub- parrallel continuous reflectors
Rift i
nitia
tion
Rift C
limax
Late rift
Rift Initiation : Wedge shaped reflector packages and hummocky internal seismic facies
Rift Climax : Divergent reflection, aggradation
Late rift : Sub- parrallel continuous reflectors
Rift i
nitia
tion
Rift C
limax
Late rift R
ift i
nitia
tion
Rift C
limax
Late rift
4
Fig 6: Rift Climax & Late Rift Stage
During the late synrift phase the tilting of the hanging wall
and differential subsidence across the fault plane ceases
and the rate of regional subsidence will decrease. The
sediment supply out paced the rate of tectonic/fault
controlled subsidence, resulting into the deposition of well
sorted coarser clastics which would act as good reservoir.
Seismic expression would be the more continuous and
parallel reflectors than the earlier sequences (Fig. 6). The
unit 3 and unit 4 have been deposited in the late syn-rift
phase and expected to have better reservoir characteristics.
The time structure map at the basement level indicate four
isolated lows which were later merged to form two major
lows as the rift progressed. (Fig. 4&7)
Fig. 7 : 3D View at top of Unit 1 & Unit 2
The northern low becomes more prominent and wide
spread at the end of rift as seen on time structure maps.
Southern low, which was earlier connected to western
deepest low at basement level, got well differentiated at the
top of unit 2 & unit 3. At the end of rifting, it becomes
shallower and localized towards western margin. As the
rifting progressed, Krishnapuram-Vadatheru-Orthanandu
spur become gradually more widespread towards NW.
Fig. 7A : 3D View at top of Unit 3 & Unit 4
Core Data Analysis
The core data indicates that the sandstones of syn rift
sequences were deposited dominantly by sandy debris
flow during most part of the basin fill in shallow marine
conditions with intermittent bottom current activity giving
rise to reworking of earlier deposited sediments (Fig. 8).
Fig. 8 : Core segments from unit 1 showing slump folds
The sandstones are mainly felspathic /or quartz wacke
with moderate primary porosity in younger synrift units i.e
unit 3 & 4. Reservoir characteristics are influenced by
mechanical compaction, filling of pores by clay minerals
and early calcite cementation resulting in porosity
reduction, mainly in older units. At places secondary
porosities are developed due to dissolution of calcite and
feldspar grains and dolomitization of calcite cement.
Sand Thickness & Attribute Maps
Sand thickness maps of different syn-rift units are prepared
from the well data of limited wells which penetrated in the
syn rift deposits. The sand thickness in each unit was
determined by using the gamma and neutron-density
electro-logs. The unit 3 & 4 show comparatively good sand
thickness and a very good correlation are seen with the
Unit 2
Unit 1
Divergent
reflections
Draping reflector
Unit 2
Unit 1
Divergent
reflections
Draping reflectorUnit 3
Unit4
Unit 2
Unit 1
Divergent
reflections
Draping reflector
Unit 2
Unit 1
Divergent
reflections
Draping reflectorUnit 3
Unit4
5
attribute maps of the similar units. Higher sand thicknesses
are observed in unit 3 in northern part which are
represented by high amplitudes in AAA maps ( Fig. 9).
Fig. 9 : Sand thickness & AAA map (Part) of Unit 3
Petroleum System Analysis:
Source
It is already proven that Andimadam Fm, which is mainly
comprised of syn rift sediments, is the source rock for the
commercial oil and gas occurrences in the Cauvery basin.
Source rock study for different wells in Tanjore sub basin
has been carried out in detail which indicated that good
quality of organic matter (up to 6.7% TOC) is present in
shales of Syn rift/Andimadam Formation.Three distinct
types of organic facies are identified within the source
sediments as given below:
a) Type III with minor type II organic matter (Gas +
sub. Oil prone), in early phase of maturation.
b) Type III organic matter (Gas prone) in early mid
phase of maturation.
c) Type II and Type III organic matter (oil prone in
peak stage of maturation).
The distribution pattern of effective source rock in the sub
basin suggests that better source rock potential exists in the
wells which are in the central part of the sub basin lying in
the depocentres identified in this study.
.
Fig. 10 : Distribution of Effective Source rock
An analysis of the source rock distribution within the syn
rift units is also attempted. It is observed that the potential
source rocks and effective source is present in the unit 2,
and followed by lower part of unit 3. Unit 2 has the best
source rock potential as it was deposited during rift climax
stage.
As far as migration is concerned the short distance
migration is envisaged in the sub basin.
Reservoir
The integrated analysis of well data and seismic data has
brought the presence of abundant reservoir facies
Fig. 11 : Sand/Shale Ratio Maps of Unit 3& 4
(sandstone) in the syn-rift sediment interbedded with
source rock facies (shales). The sand/Shale ratio maps
show better reservoir facies development in the unit-3 & 4.
The better reservoir facies are also expected in unit-1 in
fan wedges , channels etc as it was deposited in early stage
of rifting.
Sand thickness
map of Unit-3
Average Absolute
Amplitude map
Unit-3
(Northern part)
Sand thickness
map of Unit-3
Average Absolute
Amplitude map
Unit-3
(Northern part)
O
N
L
K
A
M
P
I
ESR( Oil +Gas Prone)
ESR( Gas Prone) &
ESR (Sub Oil prone)
C
O
N
L
K
A
M
P
I
ESR( Oil +Gas Prone)
ESR( Gas Prone) &
ESR (Sub Oil prone)
C
Sand Shale Ratio
map of unit 3 Sand Shale Ratio
map of unit 4
Sand Shale Ratio
map of unit 3 Sand Shale Ratio
map of unit 4
6
Entrapment
Structural culmination and fault closure in the syn rift
sequences are prospective entrapments. Still more
important entrapment can be provided by stratigraphic
traps formed by the wedge outs and pinch out of the syn-
rift reservoir strata. The wedge out phenomenon is
observed at the basin margins and more characteristically
at the intrabasinal paleohighs at the accommodation zones.
Few such paleo highs and accommodation zones are
identified in the northern part of the sub basin.
2D- Petroleum system modeling
2D- Petroleum system modeling study along one seismo-
geological cross section has been carried out to model
paleo-history reconstruction and to assess hydrocarbon
generation and migration to evaluate the possible
hydrocarbon prospectivity in Tanjore sub-basin of
Cauvery Basin.
The modeled section (Fig.12 ) covers the entire geological
domain and passes through three drilled wells The lateral
extent of the line is approx. 68.5 Km .
Fig 12 : 2D Modeled Section
The synrift units were further divided into different layers
on the basis of source/reservoir facies. (Fig.12A).
Fig. 12A : Facies Distribution along modeled section
The details of the modeled layers and their petroleum
system element has been shown in Table 1.
Table 1
2D modeling along above seismo-geological section in the
study area indicates the possibility of following two
accumulations (Fig. 12 C).
Fig. 12B : Modeled Hydrocarbon Accumulations
On the top of unit 3 layer near well C (oil and
gas)
In unit-1 layer at the deeper basinal part of the
section (mainly gas)
unit 2
C
G
Q
QGC
unit1
unit 3
unit 4
Albian Top
NE
unit 2
C
G
Q
QGC
unit1
unit 3
unit 4
Albian Top
NE
7
The results from source rock tracking indicate that the
hydrocarbon accumulation on the top of unit 3 layer near
well C is mainly contributed from unit 3- SR2 (type II)
source rock with very minor contribution from unit3 – SR-
1(type III) source rock. In the other hydrocarbon
accumulation in unit1 layer at the deeper basinal part of the
section, the accumulated gases are mainly contributed by
deepest unit1-SR source rock with a minor contribution
from unit2-SR and unit3SR-1 source rocks.
The hydrocarbon generation has taken place in basinal part
where unit3-SR-2 (type II), unit3-SR-1 (type III), unit2-SR
and unit1–SR (type III) source facies are mature and
attained critical moment at 83.5 Ma, 69.2 Ma, 80 Ma and
89 Ma respectively(Table 2). The expelled hydrocarbons
have migrated up-dip and reservoired in structures.
Table 2
The modeling results are only indicative and suggest that
source rocks are mature and generated and expelled
hydrocarbons. However, any hydrocarbon accumulation
requires the availability of suitable traps for entrapment at
the time of hydrocarbon expulsion and migration.
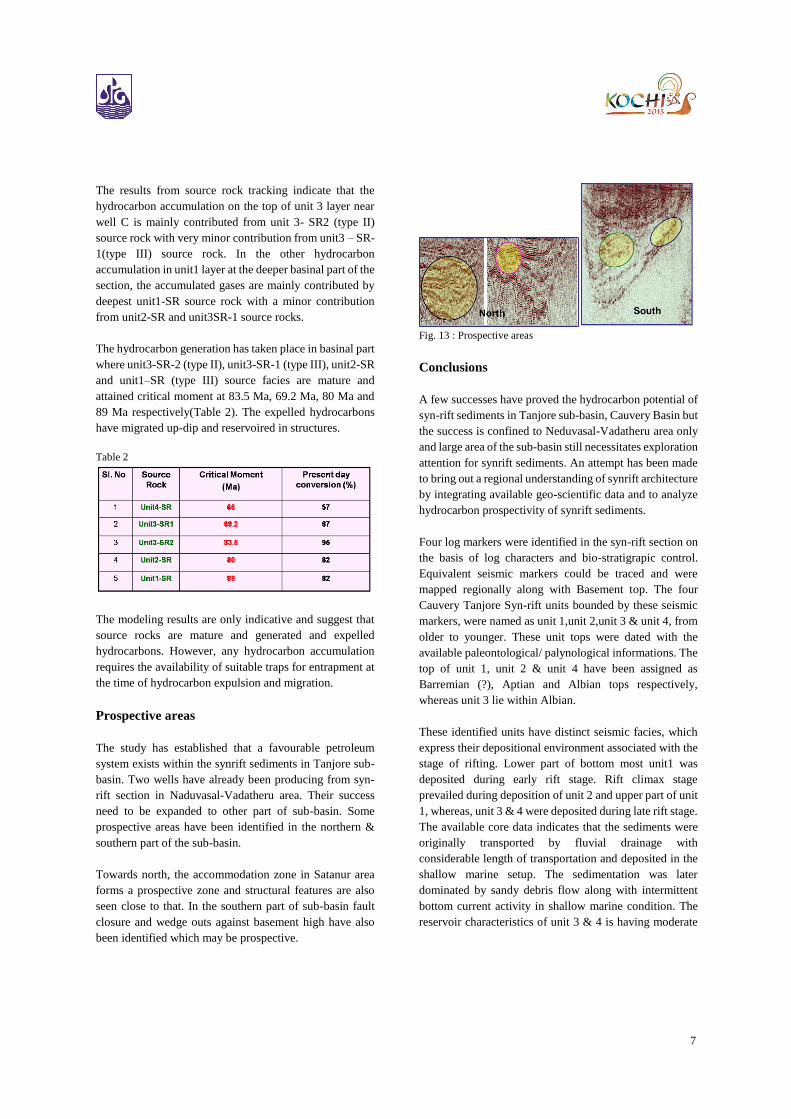
Prospective areas
The study has established that a favourable petroleum
system exists within the synrift sediments in Tanjore sub-
basin. Two wells have already been producing from syn-
rift section in Naduvasal-Vadatheru area. Their success
need to be expanded to other part of sub-basin. Some
prospective areas have been identified in the northern &
southern part of the sub-basin.
Towards north, the accommodation zone in Satanur area
forms a prospective zone and structural features are also
seen close to that. In the southern part of sub-basin fault
closure and wedge outs against basement high have also
been identified which may be prospective.
Fig. 13 : Prospective areas
Conclusions
A few successes have proved the hydrocarbon potential of
syn-rift sediments in Tanjore sub-basin, Cauvery Basin but
the success is confined to Neduvasal-Vadatheru area only
and large area of the sub-basin still necessitates exploration
attention for synrift sediments. An attempt has been made
to bring out a regional understanding of synrift architecture
by integrating available geo-scientific data and to analyze
hydrocarbon prospectivity of synrift sediments.
Four log markers were identified in the syn-rift section on
the basis of log characters and bio-stratigrapic control.
Equivalent seismic markers could be traced and were
mapped regionally along with Basement top. The four
Cauvery Tanjore Syn-rift units bounded by these seismic
markers, were named as unit 1,unit 2,unit 3 & unit 4, from
older to younger. These unit tops were dated with the
available paleontological/ palynological informations. The
top of unit 1, unit 2 & unit 4 have been assigned as
Barremian (?), Aptian and Albian tops respectively,
whereas unit 3 lie within Albian.
These identified units have distinct seismic facies, which
express their depositional environment associated with the
stage of rifting. Lower part of bottom most unit1 was
deposited during early rift stage. Rift climax stage
prevailed during deposition of unit 2 and upper part of unit
1, whereas, unit 3 & 4 were deposited during late rift stage.
The available core data indicates that the sediments were
originally transported by fluvial drainage with
considerable length of transportation and deposited in the
shallow marine setup. The sedimentation was later
dominated by sandy debris flow along with intermittent
bottom current activity in shallow marine condition. The
reservoir characteristics of unit 3 & 4 is having moderate
8
to good primary porosity and is mainly composed of
arenite to feldspathic/ quartz wacke.
It is observed that the potential and effective source are
present mainly in the unit 2 and better reservoir facies are
developed in unit 3 & 4. The favorable reservoir facies are
also expected in unit 1 in fans and channels deposited in
early stage of rifting. 2D- Petroleum system modeling
study along one seismo-geological cross section has
brought out favorable hydrocarbon accumulation spots
along the line.
The study indicates that a complete petroleum system exist
within syn-rift sediments which have been established by
few success. The success need to be expanded to other
parts of sub-basin, which are lesser explored. The
identified prospective areas may be targeted.
Acknowledgements
The authors express their gratitude to Shri N.K.Verma,
Director (Expl.), ONGC, for according permission to
present this paper. The authors are grateful to Dr.
D.K.Dasgupta, GGM-HOI, KDMIPE, ONGC, for
providing an opportunity to work on this project and
providing guidance and encouragement during the course
of study.
"Views expressed in the paper are solely of the authors and
does not necessarily reflects the views of ONGC"
References
Bharkatya, Dilip.,Nagraj,M. and Goswami,P (2011).
Review of sub-surface Lithostratigraphy of Cauvery
Basin (Andimadam and Bhuvanagiri formations)
(Unpublished ONGC reports)
Goswami, P., Bharktya, D. K., Nagraj, M. and Bhaskaran,
B., (2006). Reservoir characterisatioin through diagenetic
modeling in sands of Andimadam Formation of Tanjore
sub basin, Cauvery basin (Unpublished ONGC reports)
Lambiase,J.J and Bosworth,W. (1995). Structural control
in sedimentation in continental rifts. Geological society
special publication , No. 80, 117-144.
Mohan,S.G.K., Roy Moulik, S.K. and Rana, M.S., (2000).
Sequence stratigraphic analysis and Hydrocarbon
prospectivity of Tanjore sub basin. (Unpublished ONGC
reports)
Prosser, S., (1993) Rift related linked depositional systems
and their seismic expression, In: Williams, G.D. and Dobb,
A., (Tectonics and seismic sequence stratigraphy.
Geological society special publication , No. 71, 35-66).