Embed Size (px)
DESCRIPTION
Overview: Embedded systems increasingly employ a combination of low speed serial, analog voltages and RF communications which are tightly synchronized in time. This session will discuss the background of performing time and frequency domain analysis on these systems with example measurements on a digitally controlled RF transmitter. What will you learn? The challenges of debugging embedded systems Frequency domain analysis and FFT basics Time gating, Dynamic range and Triggering considerations PLL locking measurement example
Citation preview
Synchronous Time and Frequency Domain Analysis of Embedded Systems
2
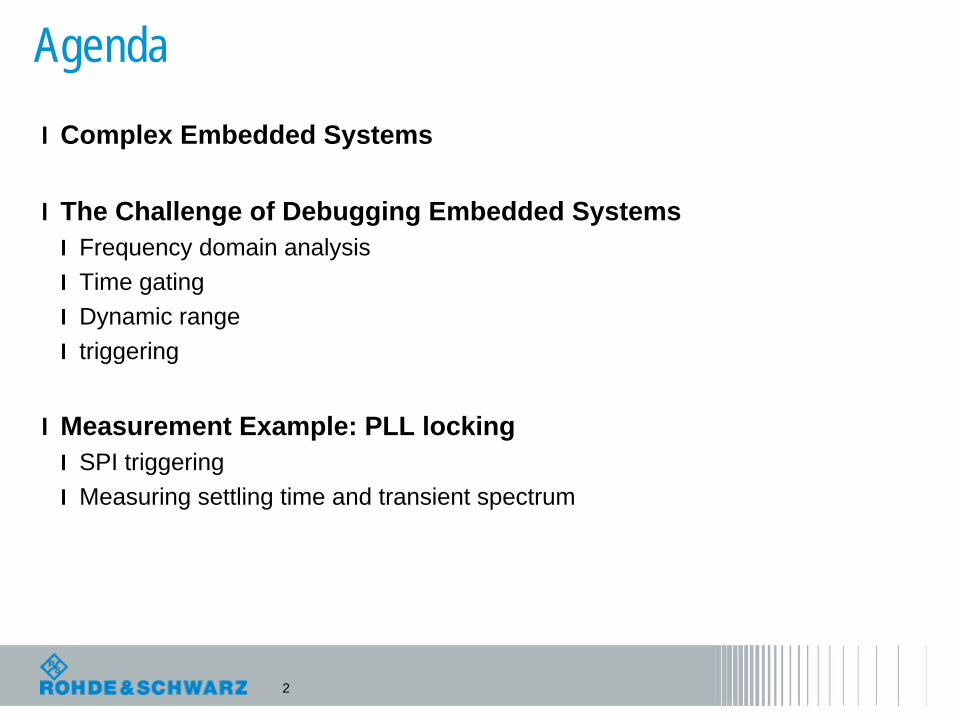
Agendal Complex Embedded Systems
l The Challenge of Debugging Embedded Systemsl Frequency domain analysisl Time gating l Dynamic rangel triggering
l Measurement Example: PLL lockingl SPI triggering l Measuring settling time and transient spectrum
3
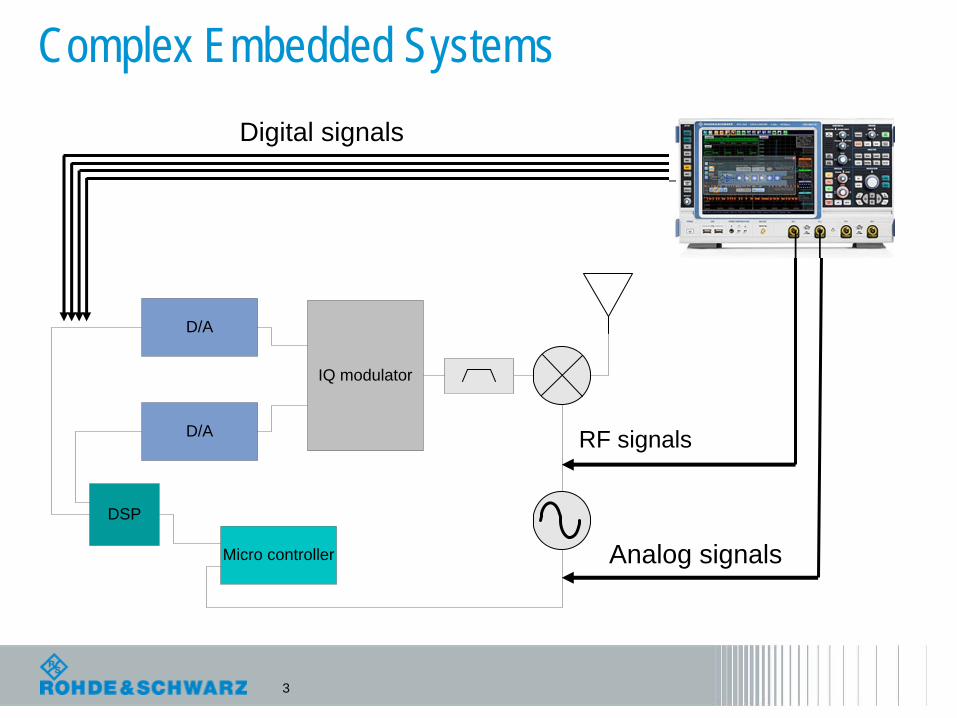
Complex Embedded Systems
D/A
D/A
DSP
Micro controller
IQ modulator
Digital signals
Analog signals
RF signals
4
The Challenge of Debugging Embedded Systems
l Baseband digital, RF and analog signals are interdependentl Feedback control of RF by microcontrollerl Low speed serial busses l Critical timing relationshipsl Interference between RF and digital signals
l Analyzing and debugging in the frequency domainl Frequency domain analysis synchronized with time and digital domainsl Frequency analysis speedl Sufficient sensitivity in both time and frequency domainsl Triggering ( time, digital and frequency)
5
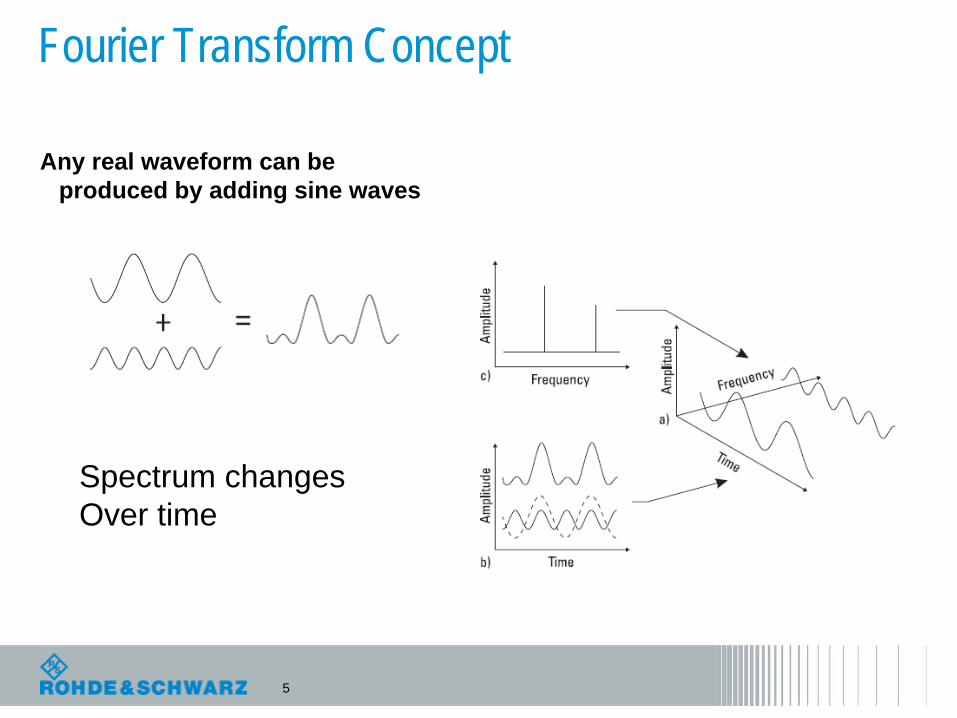
Fourier Transform Concept
Any real waveform can be produced by adding sine waves
Spectrum changesOver time
6
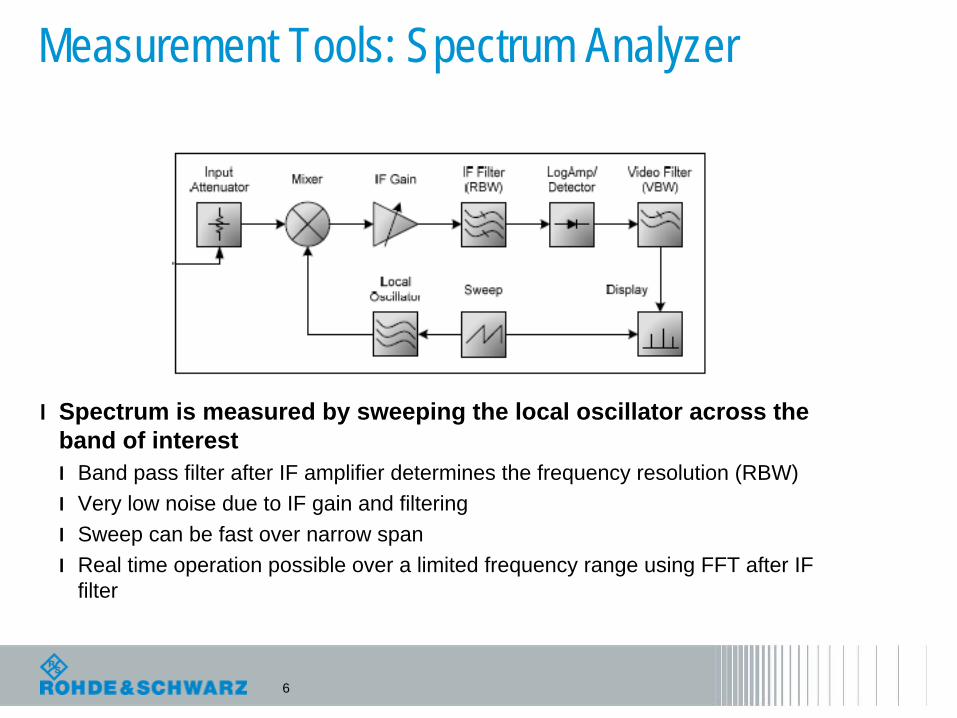
Measurement Tools: Spectrum Analyzer
l Spectrum is measured by sweeping the local oscillator across the band of interestl Band pass filter after IF amplifier determines the frequency resolution (RBW)l Very low noise due to IF gain and filteringl Sweep can be fast over narrow spanl Real time operation possible over a limited frequency range using FFT after IF
filter
7
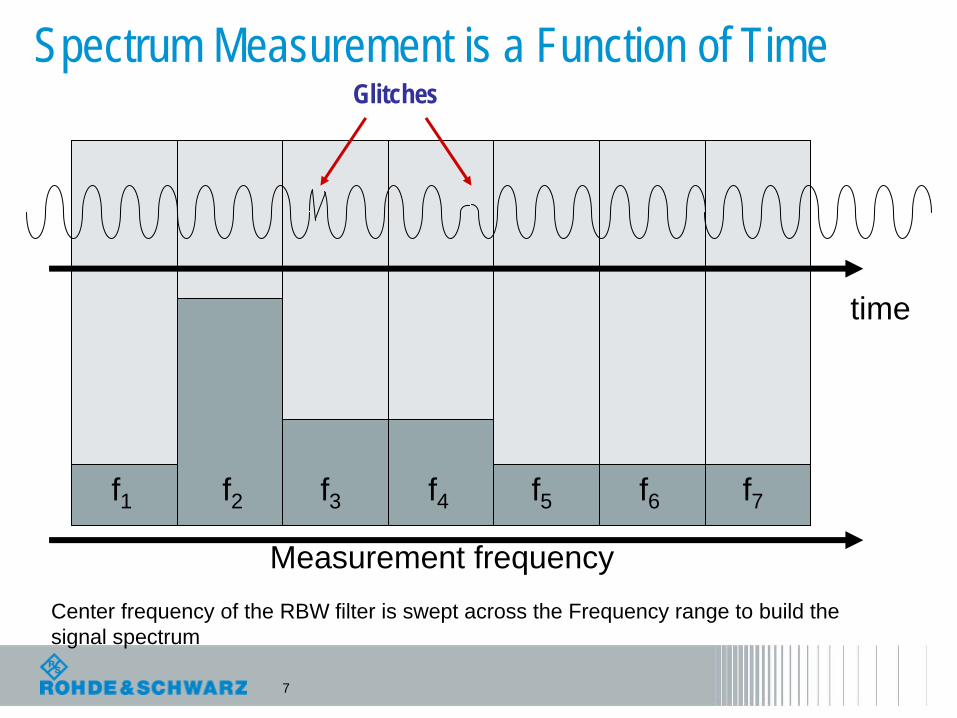
Spectrum Measurement is a Function of TimeGlitches
time
f1 f2 f3 f4 f5 f6 f7
Measurement frequencyCenter frequency of the RBW filter is swept across the Frequency range to build the signal spectrum
8
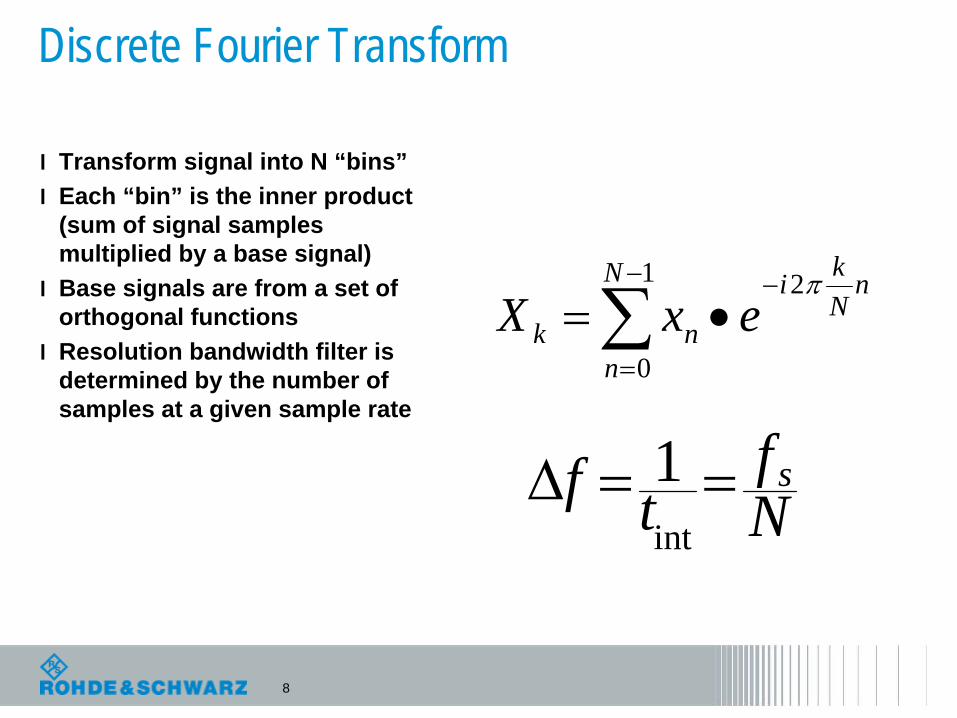
Discrete Fourier Transform
l Transform signal into N “bins”l Each “bin” is the inner product
(sum of signal samples multiplied by a base signal)
l Base signals are from a set of orthogonal functions
l Resolution bandwidth filter is determined by the number of samples at a given sample rate
nNkiN
nnk exX
21
0
Nf
tf sint
1
9
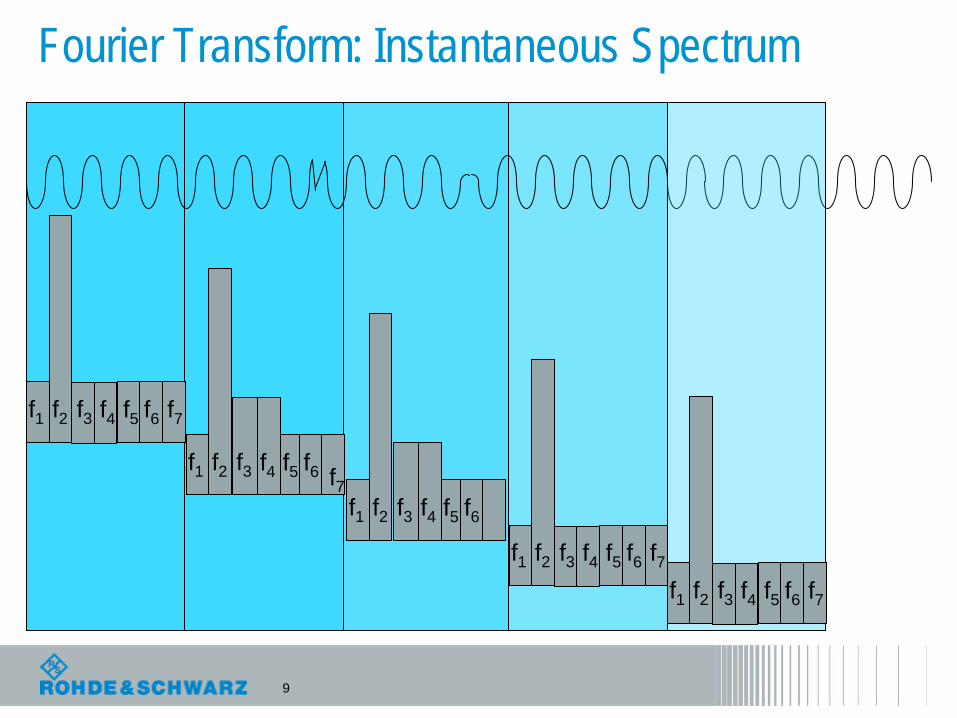
Fourier Transform: Instantaneous Spectrum
f1 f2 f3 f4 f5 f6 f7
f1 f2 f3 f4 f5 f6 f7
f1 f2 f3 f4 f5 f6 f7
f1 f2 f3 f4 f5 f6
f1 f2 f3 f4 f5 f6 f7
10
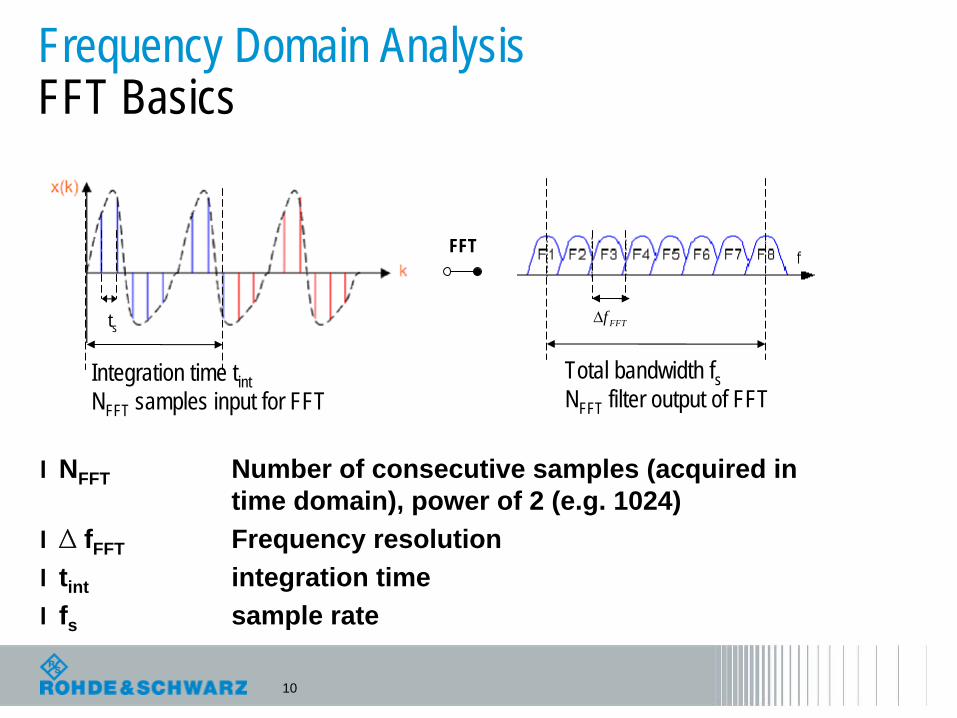
Frequency Domain Analysis FFT Basics
l NFFT Number of consecutive samples (acquired in time domain), power of 2 (e.g. 1024)
l ∆
fFFT Frequency resolutionl tint integration timel fs sample rate
Integration time tintNFFT samples input for FFT
FFT
Total bandwidth fsNFFT filter output of FFT
FFTfts
11
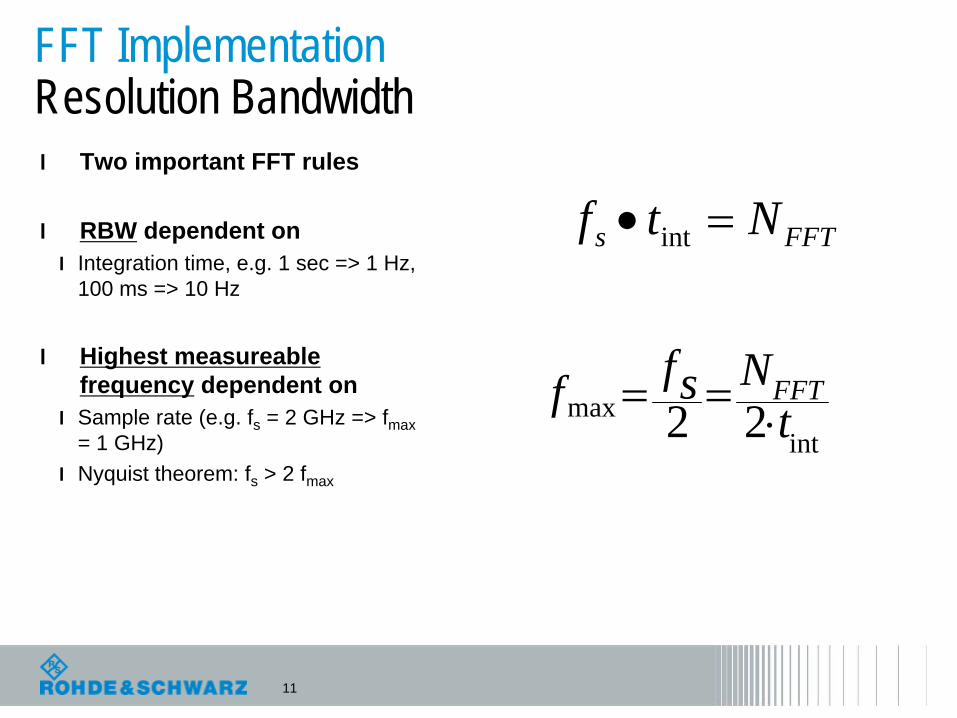
FFT Implementation Resolution Bandwidthl Two important FFT rules
l RBW dependent on l Integration time, e.g. 1 sec => 1 Hz,
100 ms => 10 Hz
l Highest measureable frequency dependent on
l Sample rate (e.g. fs = 2 GHz => fmax = 1 GHz)
l Nyquist theorem: fs > 2 fmax
intmax 22 t
Nsff FFT
FFTs Ntf int
12
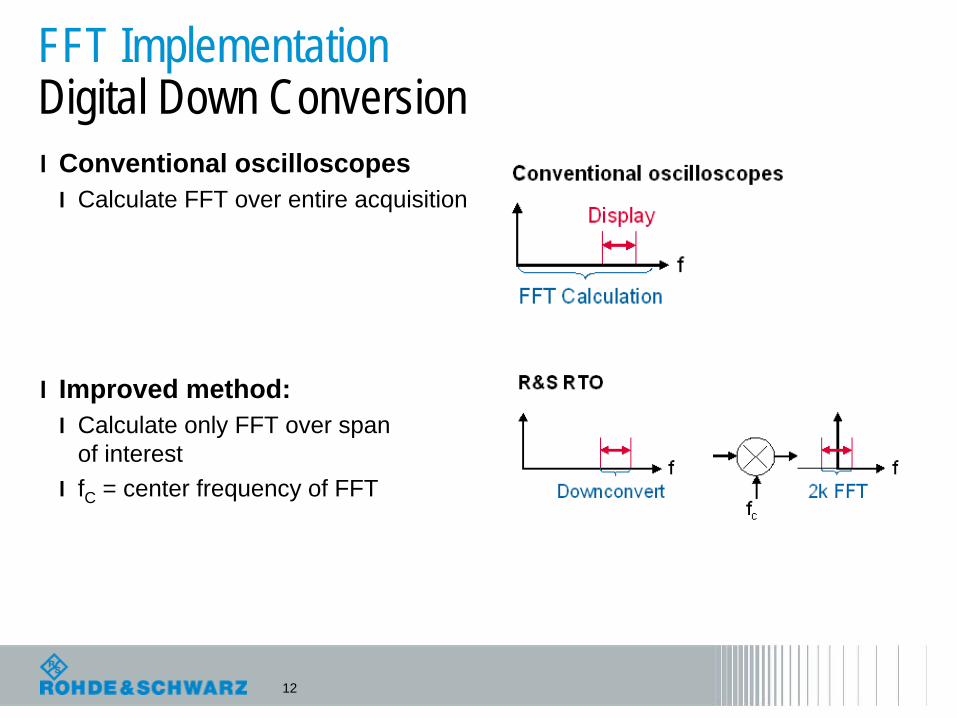
FFT Implementation Digital Down Conversionl Conventional oscilloscopes
l Calculate FFT over entire acquisition
l Improved method:l Calculate only FFT over span
of interestl fC = center frequency of FFT
13
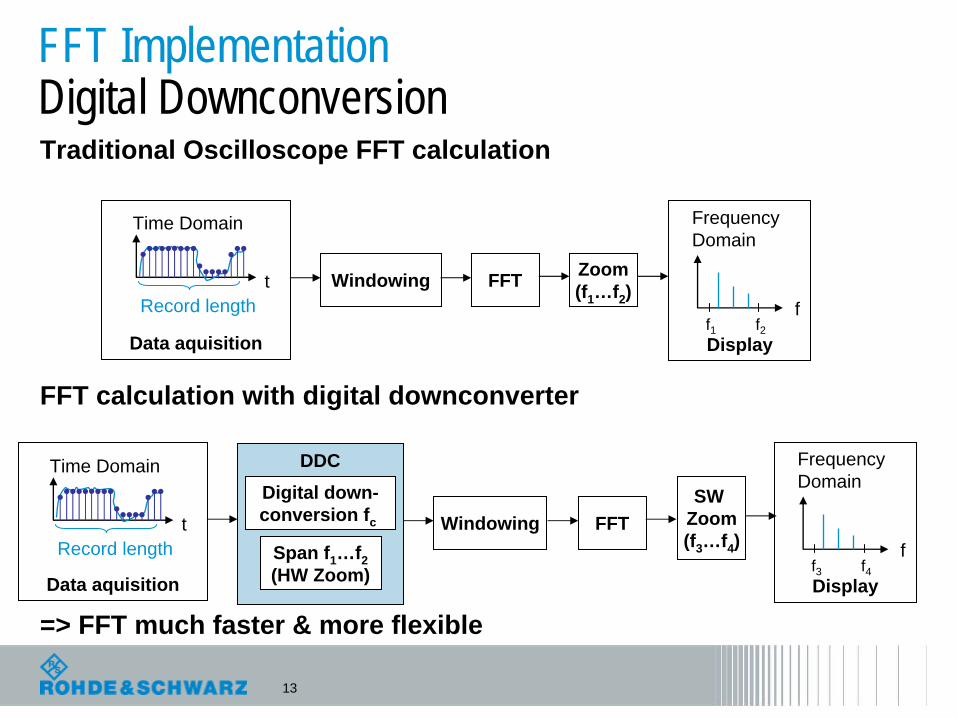
Traditional Oscilloscope FFT calculation
FFT calculation with digital downconverter
=> FFT much faster & more flexible
FFT Implementation Digital Downconversion
t
Time Domain
Record lengthWindowing FFT
Data aquisition
Zoom(f1 …f2 ) f
Frequency Domain
Displayf2f1
f
Frequency Domain
t
Time Domain
Record lengthWindowing FFT
DisplayData aquisition
DDC
f4f3Span f1 …f2(HW Zoom)
Digital down-conversion fc
SW Zoom(f3 …f4 )
14
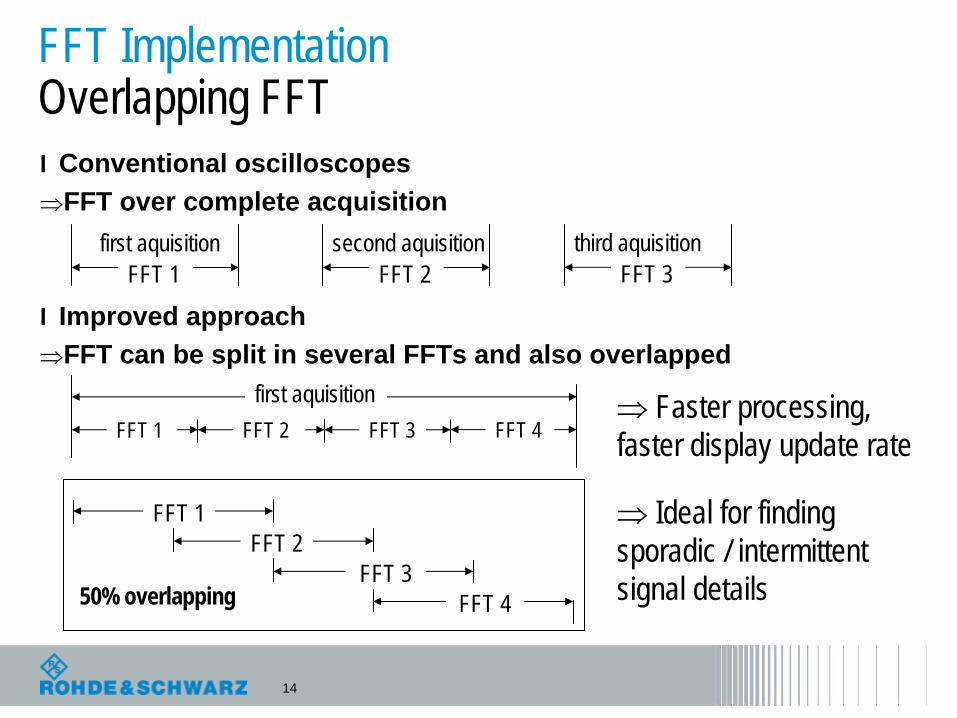
FFT Implementation Overlapping FFTl Conventional oscilloscopesFFT over complete acquisition
l Improved approachFFT can be split in several FFTs and also overlapped
FFT 2second aquisition
FFT 1first aquisition
FFT 3third aquisition
FFT 1 FFT 2 FFT 3 FFT 4first aquisition
FFT 1FFT 2
FFT 3FFT 450% overlapping
Faster processing, faster display update rate
Ideal for findingsporadic / intermittentsignal details
15
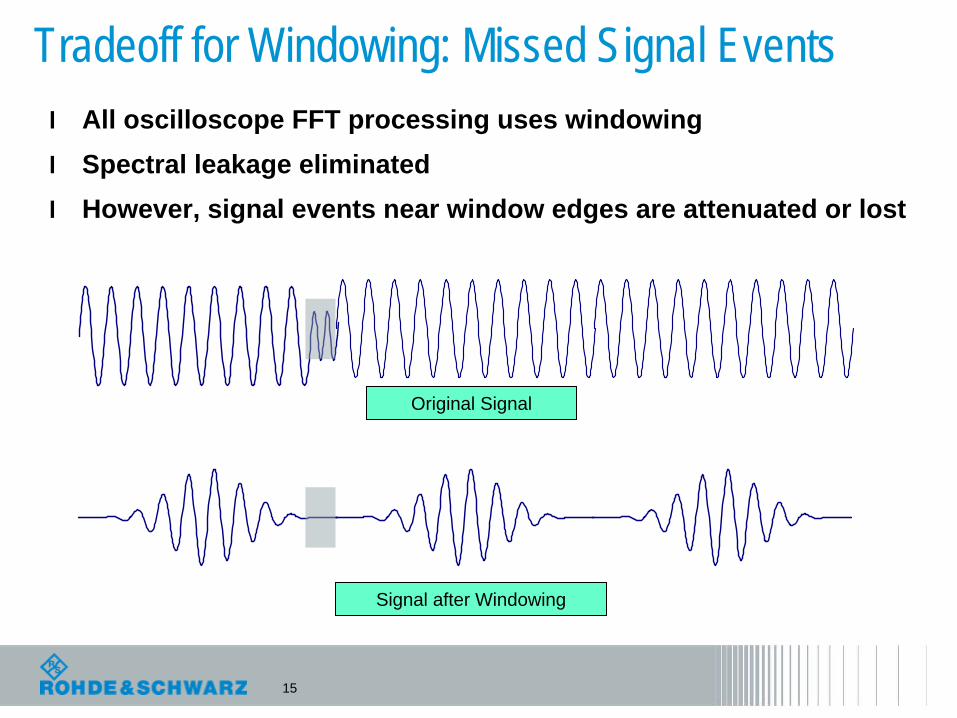
Tradeoff for Windowing: Missed Signal Events
Original Signal
Signal after Windowing
l All oscilloscope FFT processing uses windowingl Spectral leakage eliminatedl However, signal events near window edges are attenuated or lost
16
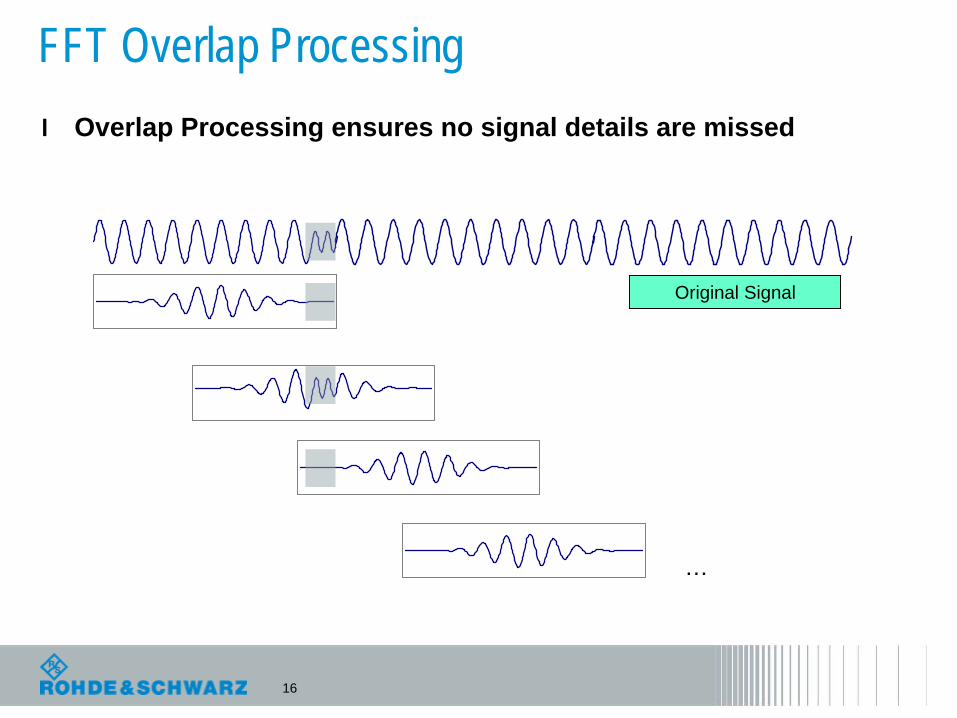
FFT Overlap Processingl Overlap Processing ensures no signal details are missed
Original Signal
…
17
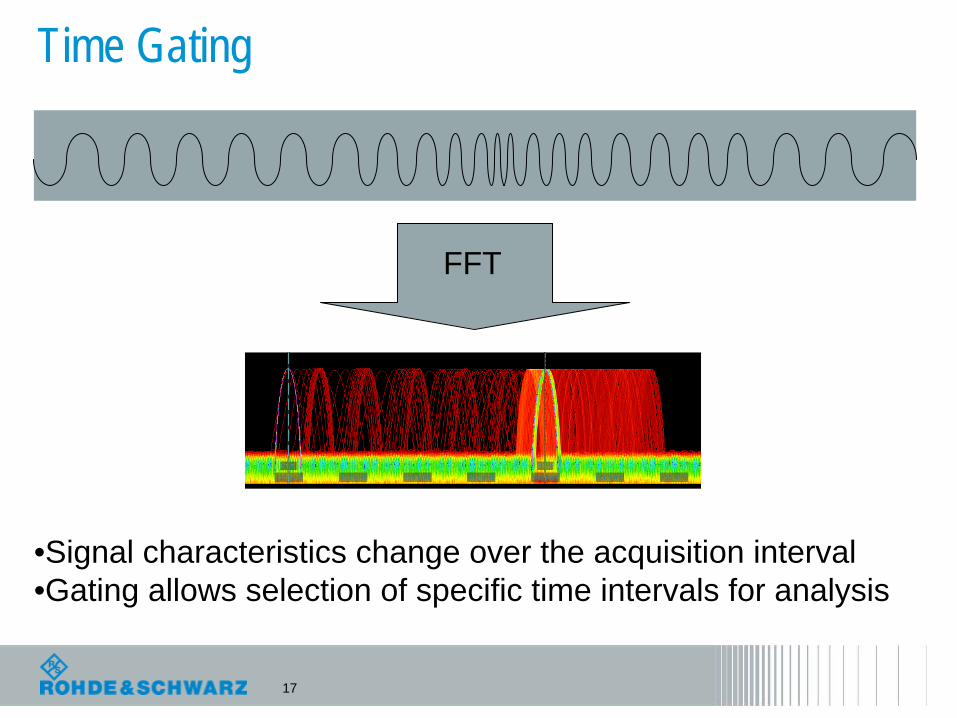
Time Gating
•Signal characteristics change over the acquisition interval•Gating allows selection of specific time intervals for analysis
FFT
18
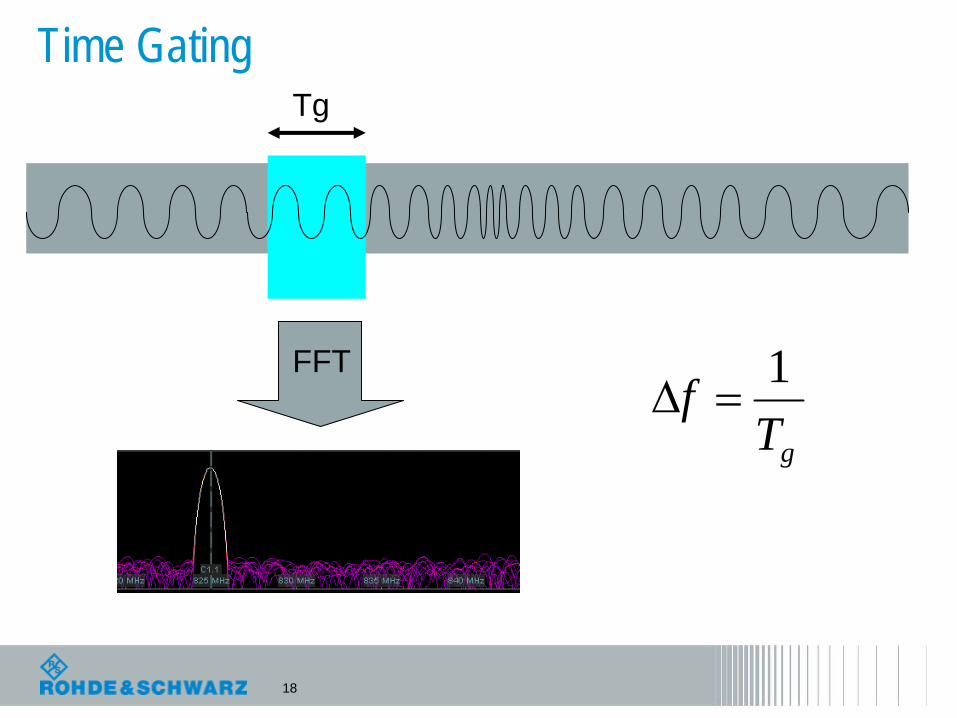
Time GatingTg
gTf 1
FFT
19
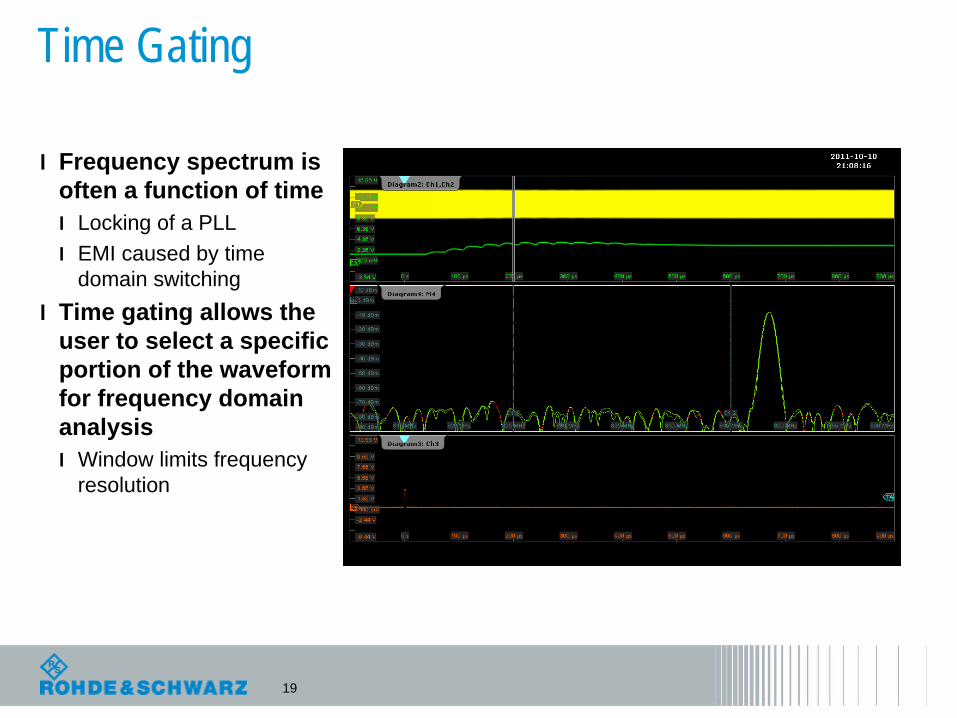
Time Gating
l Frequency spectrum is often a function of timel Locking of a PLLl EMI caused by time
domain switchingl Time gating allows the
user to select a specific portion of the waveform for frequency domain analysisl Window limits frequency
resolution
20
Frequency domain measurement dynamic rangel Analog to digital conversion (ADC) performance sets the
dynamic rangel Signal to noise ratio (ENOB)l Frequency domain spurious
l Front-end amplifier gainl Noise figure and sensitivity
21
Ideal ADC
Ideal ADC
s(t) s (t )q i
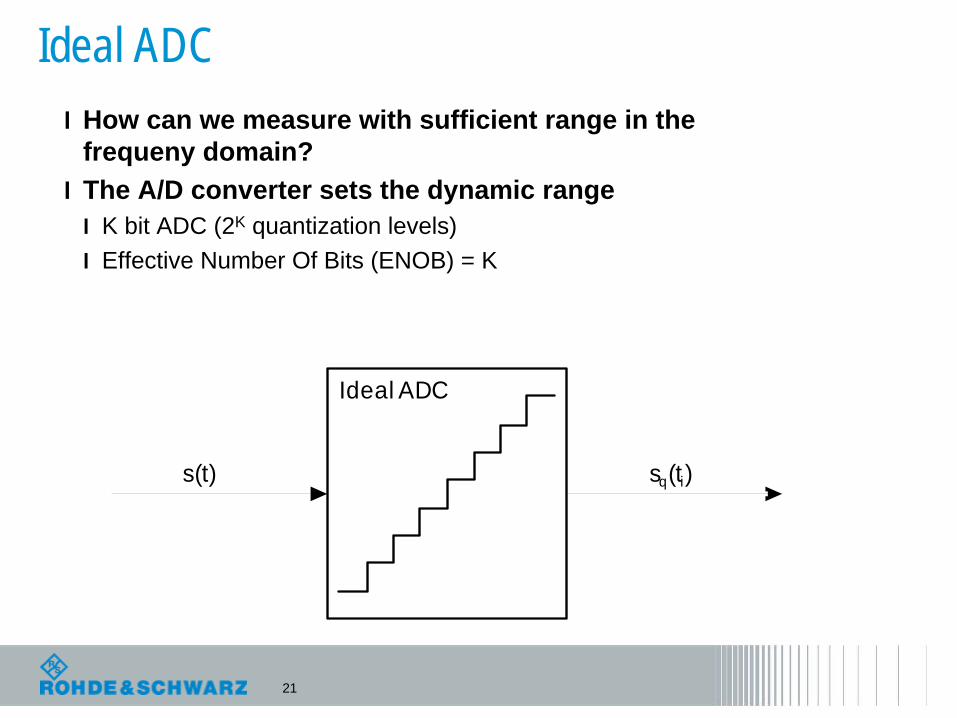
l How can we measure with sufficient range in the frequeny domain?
l The A/D converter sets the dynamic rangel K bit ADC (2K quantization levels)l Effective Number Of Bits (ENOB) = K
22
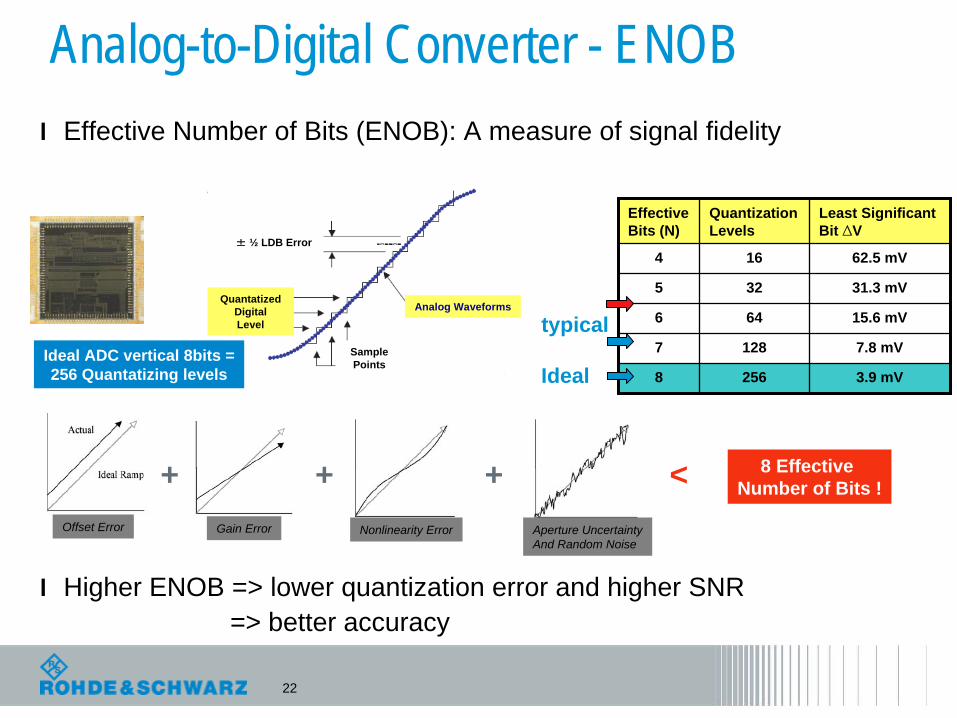
Analog-to-Digital Converter - ENOBl Effective Number of Bits (ENOB): A measure of signal fidelity
l Higher ENOB => lower quantization error and higher SNR => better accuracy
Effective Bits (N)
Quantization Levels
Least Significant Bit ∆V
4 16 62.5 mV
5 32 31.3 mV
6 64 15.6 mV
7 128 7.8 mV
8 256 3.9 mV
Offset Error Gain Error Nonlinearity Error Aperture UncertaintyAnd Random Noise
+ + +
± ½ LDB Error
Quantatized Digital Level
Sample Points
Analog Waveforms
<
Ideal ADC vertical 8bits =256 Quantatizing levels
8 Effective Number of Bits !
Ideal
typical
23
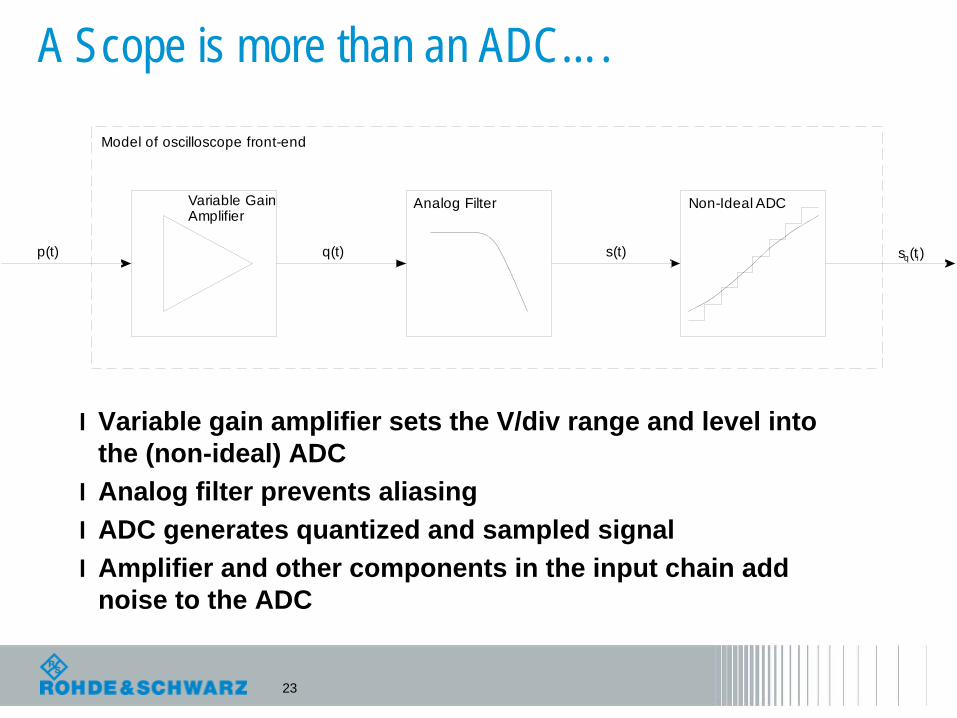
A Scope is more than an ADC….
Non-Ideal ADCAnalog FilterVariable GainAmplifier
Model of oscilloscope front-end
p(t) s(t)q(t) s (t )q i
l Variable gain amplifier sets the V/div range and level into the (non-ideal) ADC
l Analog filter prevents aliasingl ADC generates quantized and sampled signall Amplifier and other components in the input chain add
noise to the ADC
24
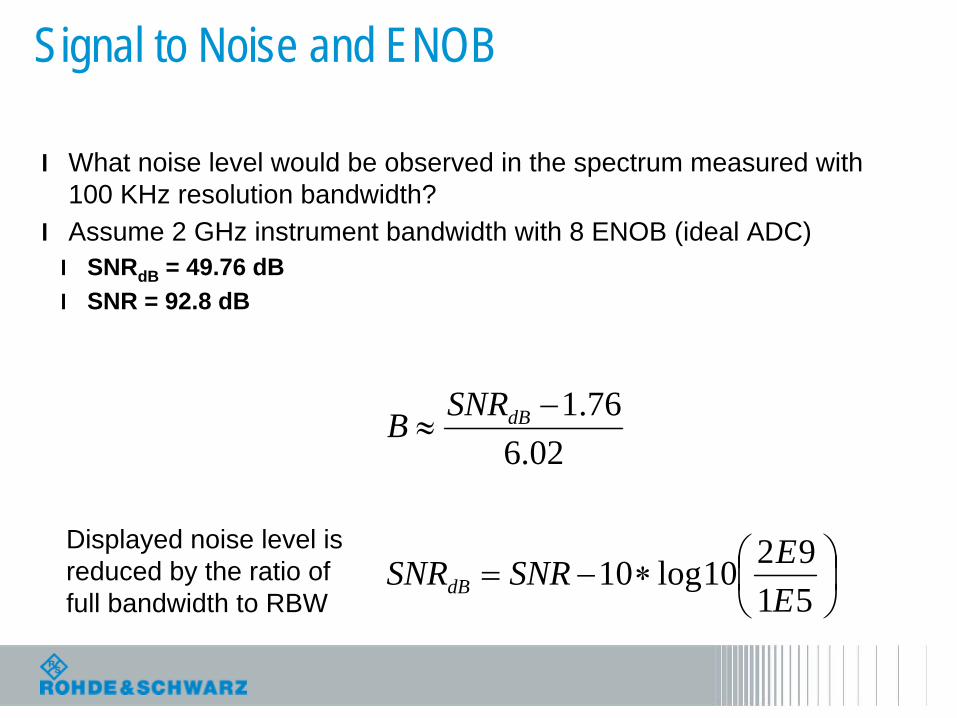
Signal to Noise and ENOB
l What noise level would be observed in the spectrum measured with 100 KHz resolution bandwidth?
l Assume 2 GHz instrument bandwidth with 8 ENOB (ideal ADC)l SNRdB = 49.76 dBl SNR = 92.8 dB
519210log10
02.676.1
EESNRSNR
SNRB
dB
dB
Displayed noise level is reduced by the ratio of full bandwidth to RBW
25
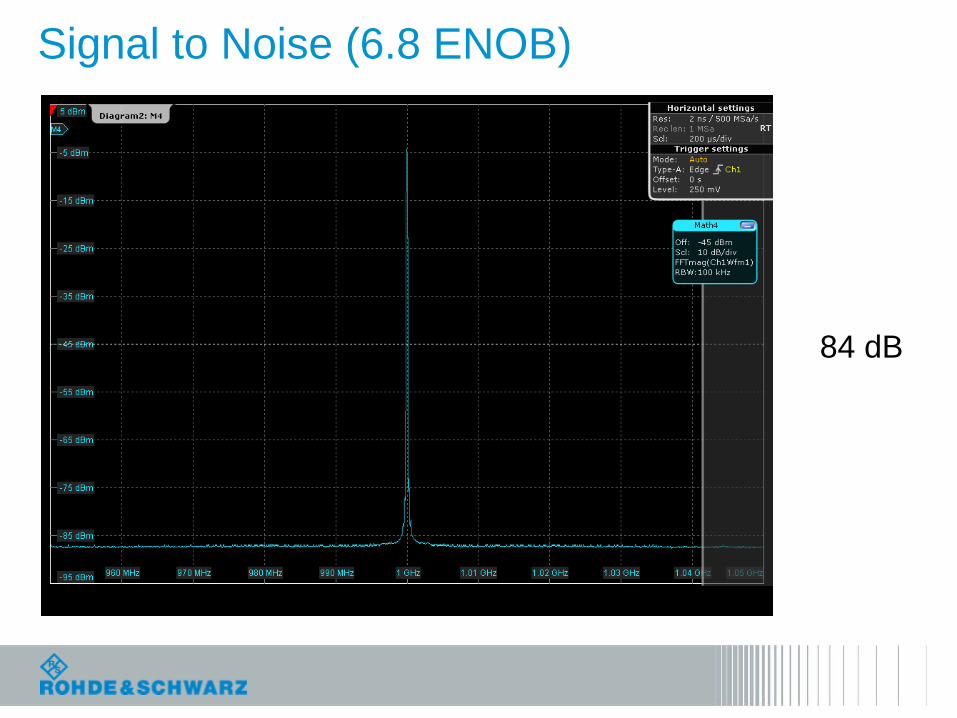
Signal to Noise (6.8 ENOB)
84 dB
26
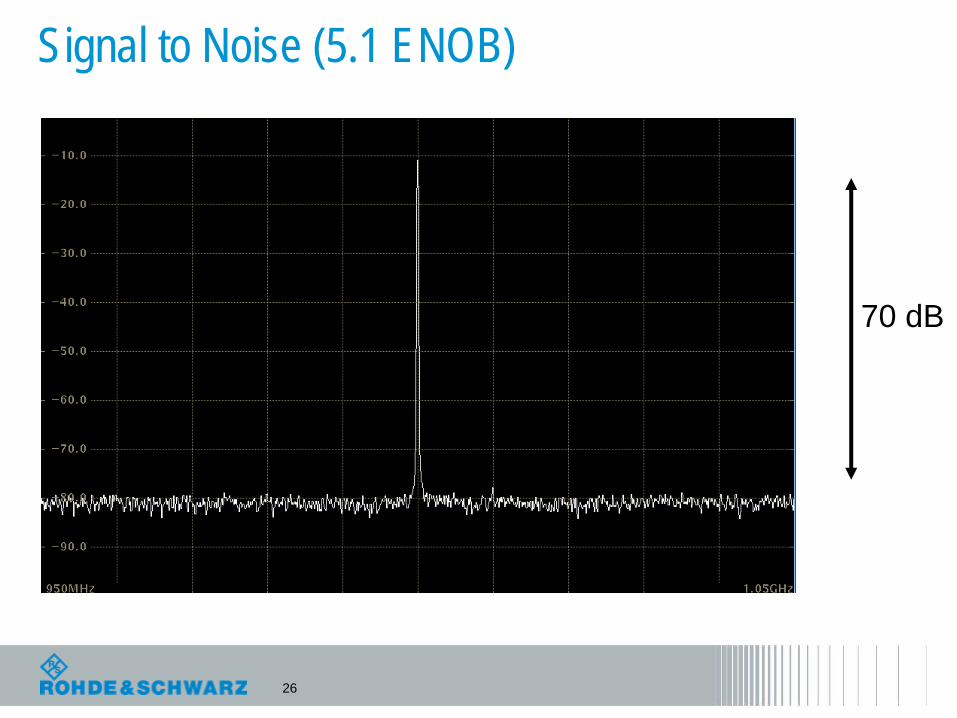
Signal to Noise (5.1 ENOB)
70 dB
27
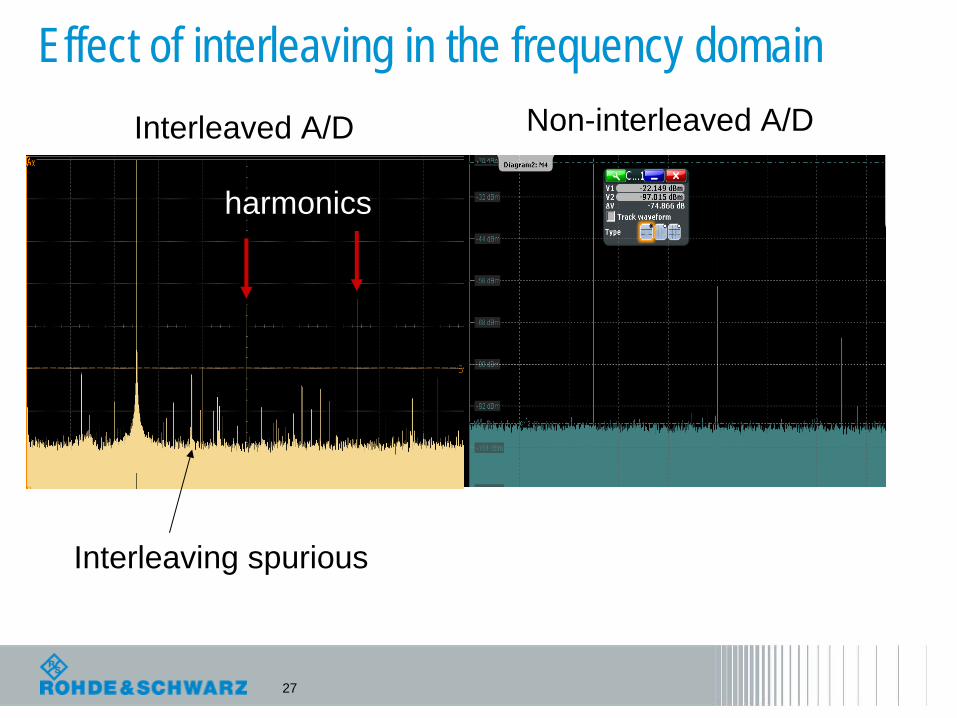
Effect of interleaving in the frequency domain
harmonics
Interleaving spurious
Interleaved A/D Non-interleaved A/D
28
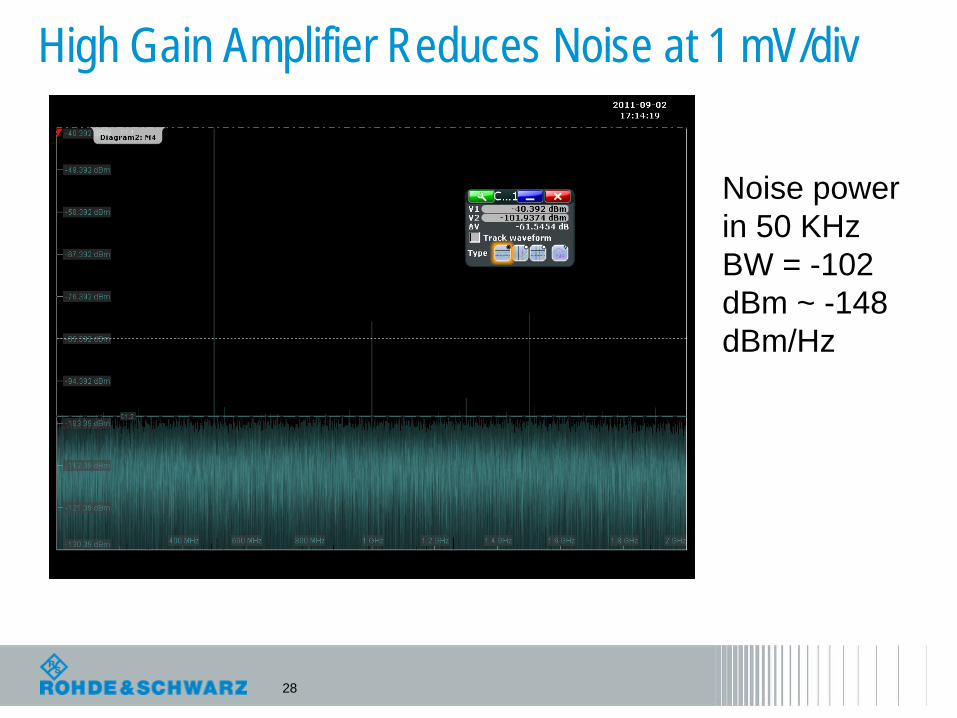
High Gain Amplifier Reduces Noise at 1 mV/div
Noise power in 50 KHz BW = -102 dBm ~ -148 dBm/Hz
29
Triggering
l Triggers can be required different “domains”l Time domain (edge, runt, width, etc.)l Digital domain (pattern, serial bus)l Frequency domain (amplitude/frequency mask)
l Sensitivity of time domain triggersl Matching bandwidth with acquisition for all trigger typesl Noise reduction (filtering, hysteresis)
l Frequency domain triggersl Processing speed of FFT
30
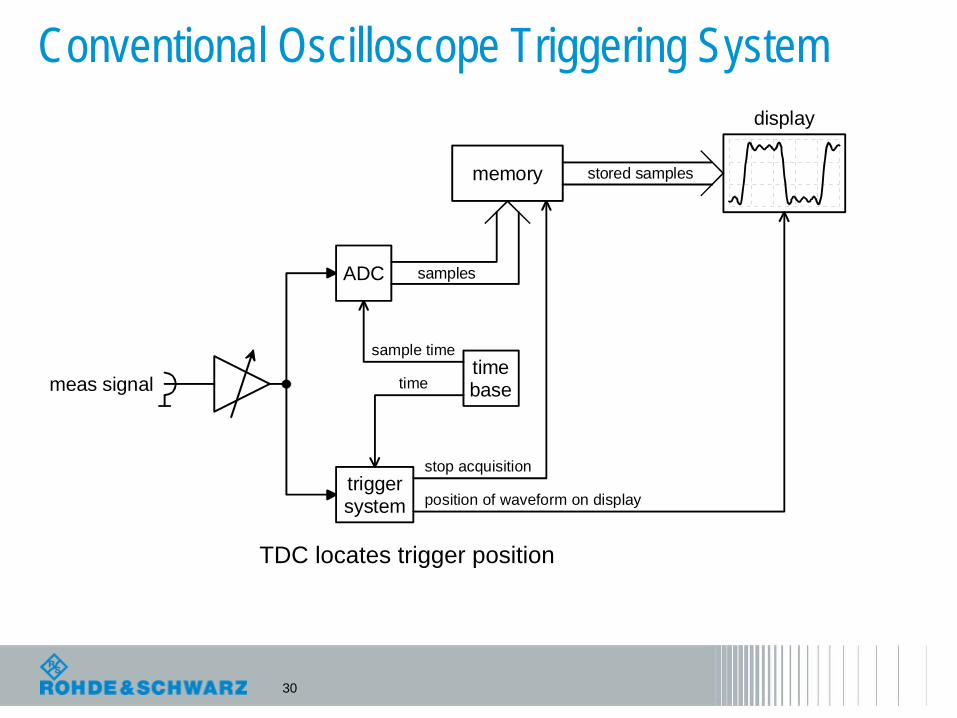
Conventional Oscilloscope Triggering System
meas signal
ADC
triggersystem
samples
memory stored samples
display
timebase
sample time
time
stop acquisition
position of waveform on display
TDC locates trigger position
31
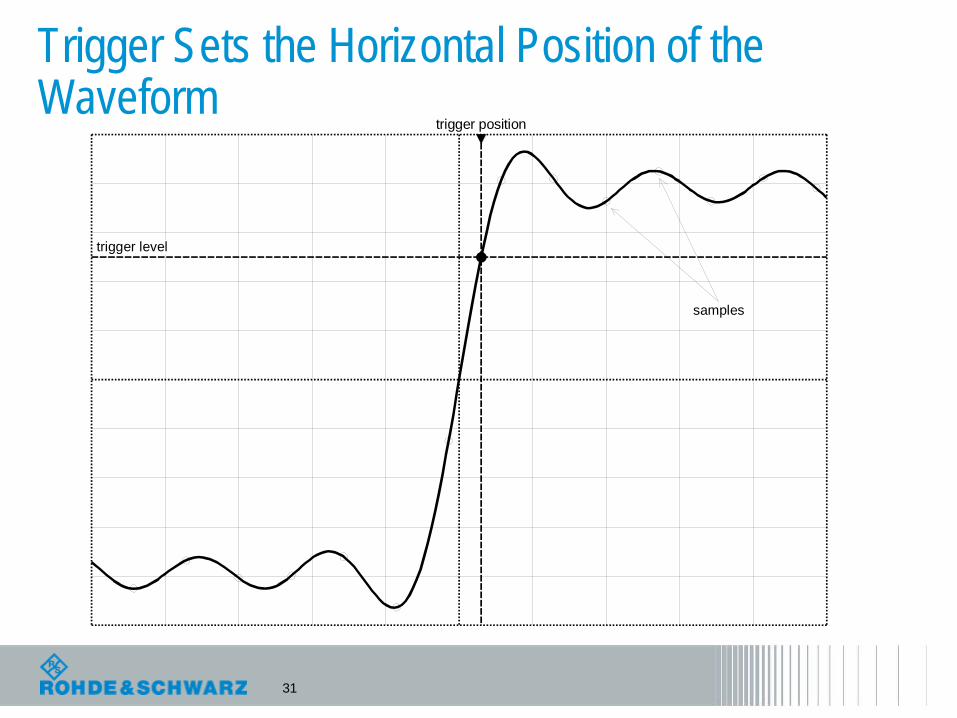
Trigger Sets the Horizontal Position of the Waveform
trigger level
trigger position
samples
32
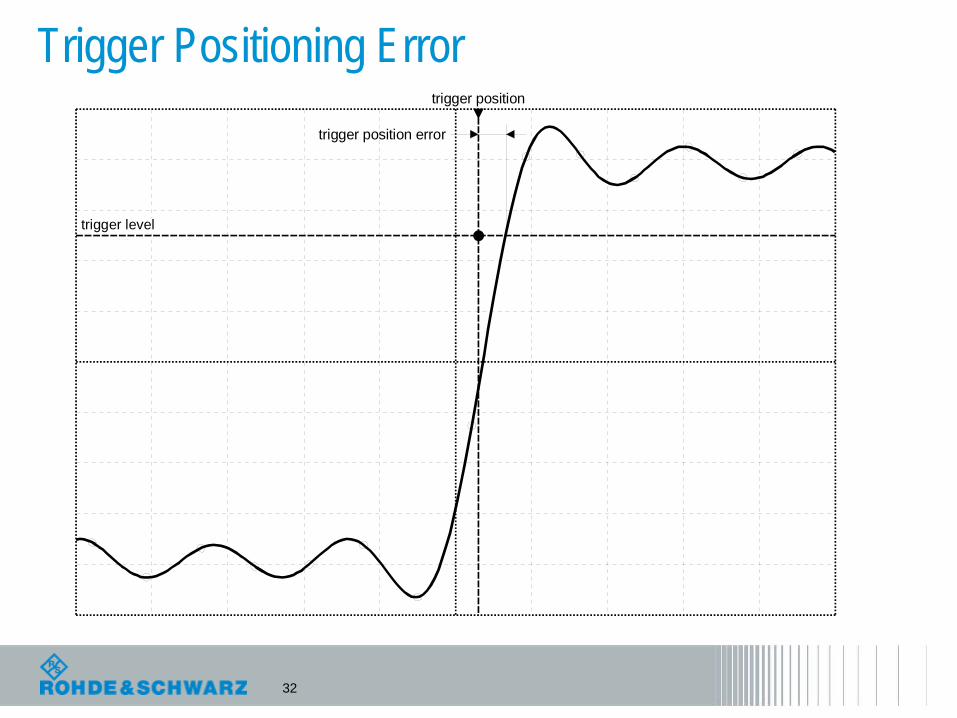
Trigger Positioning Error
trigger level
trigger position
trigger position error
33
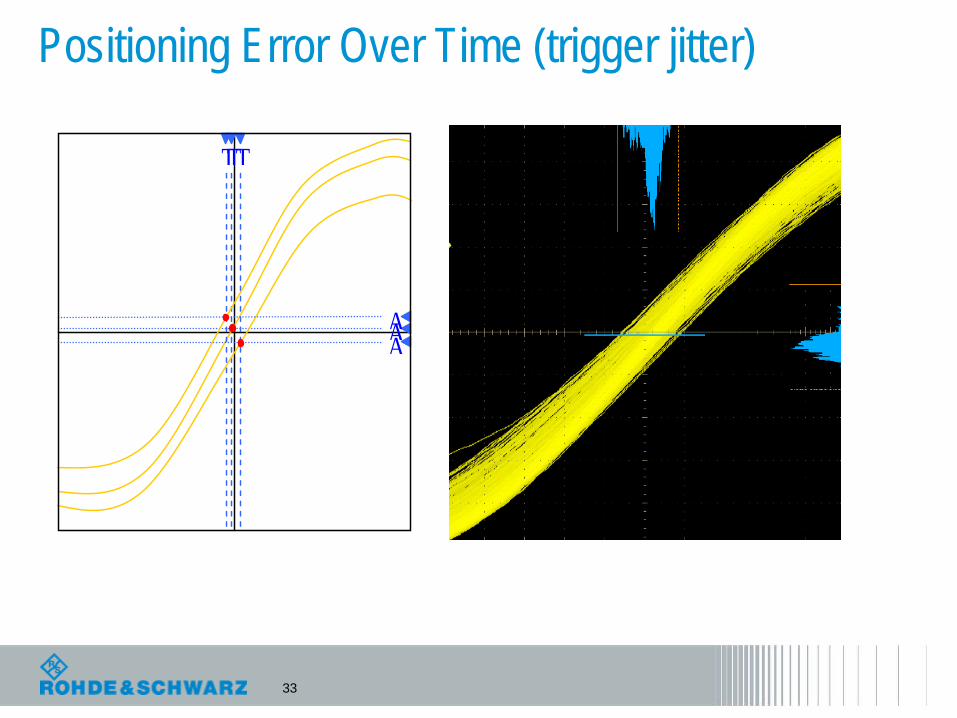
Positioning Error Over Time (trigger jitter)
T
A
T
A
T
A
34
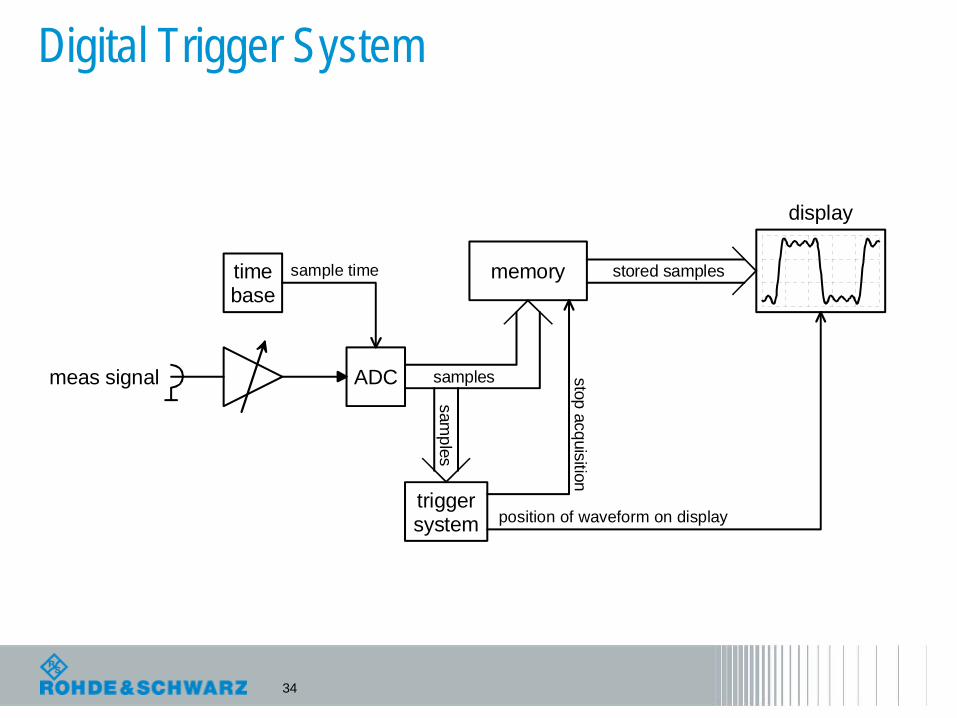
Digital Trigger System
meas signal ADC
triggersystem
samples
memory stored samples
display
timebase
sample time
stop acquisition
position of waveform on displaysam
ples
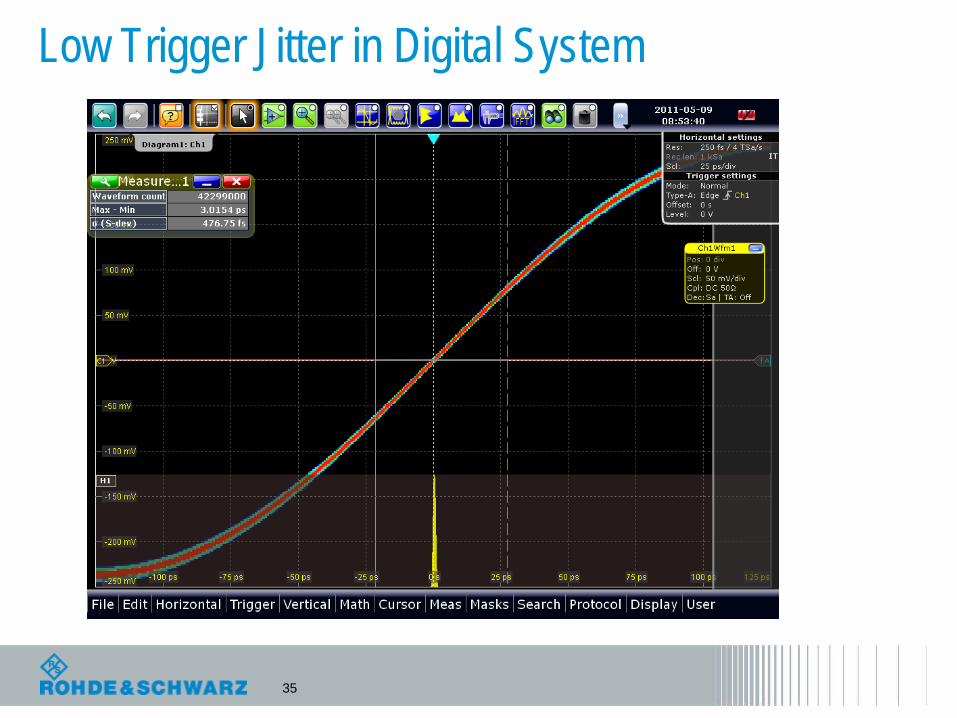
35
Low Trigger Jitter in Digital System
36
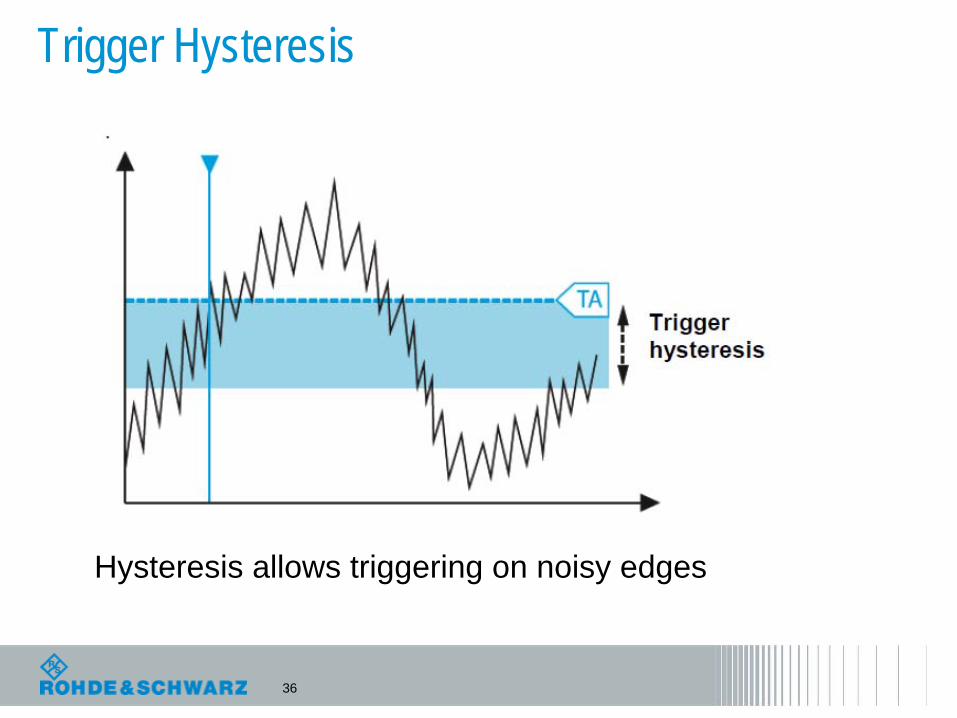
Trigger Hysteresis
Hysteresis allows triggering on noisy edges
37
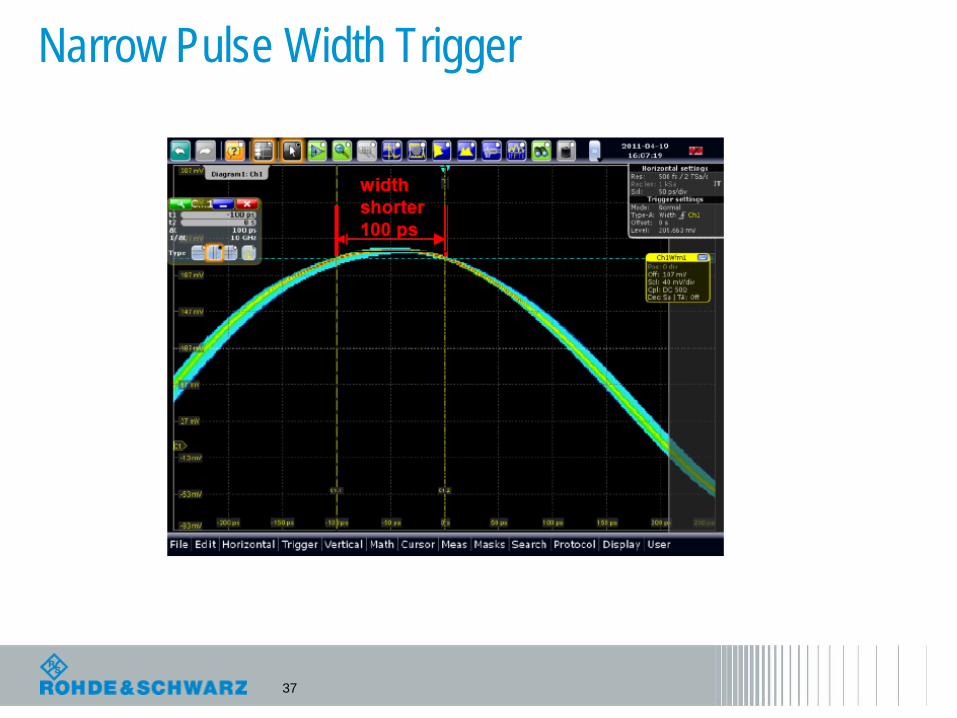
Narrow Pulse Width Trigger
38
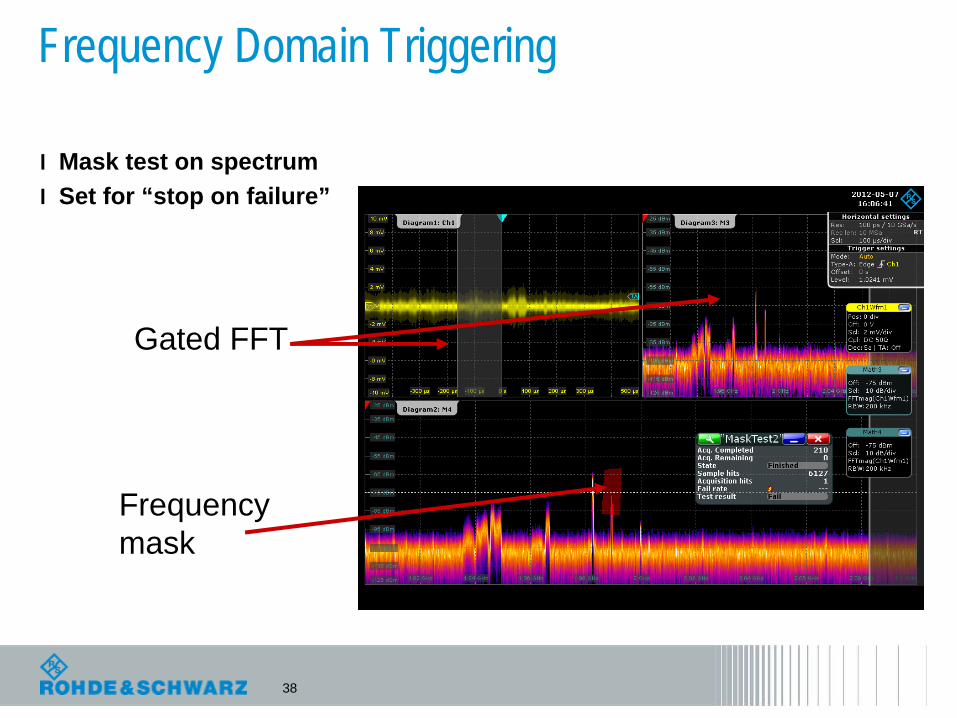
Frequency Domain Triggering
l Mask test on spectruml Set for “stop on failure”
Frequency mask
Gated FFT
39
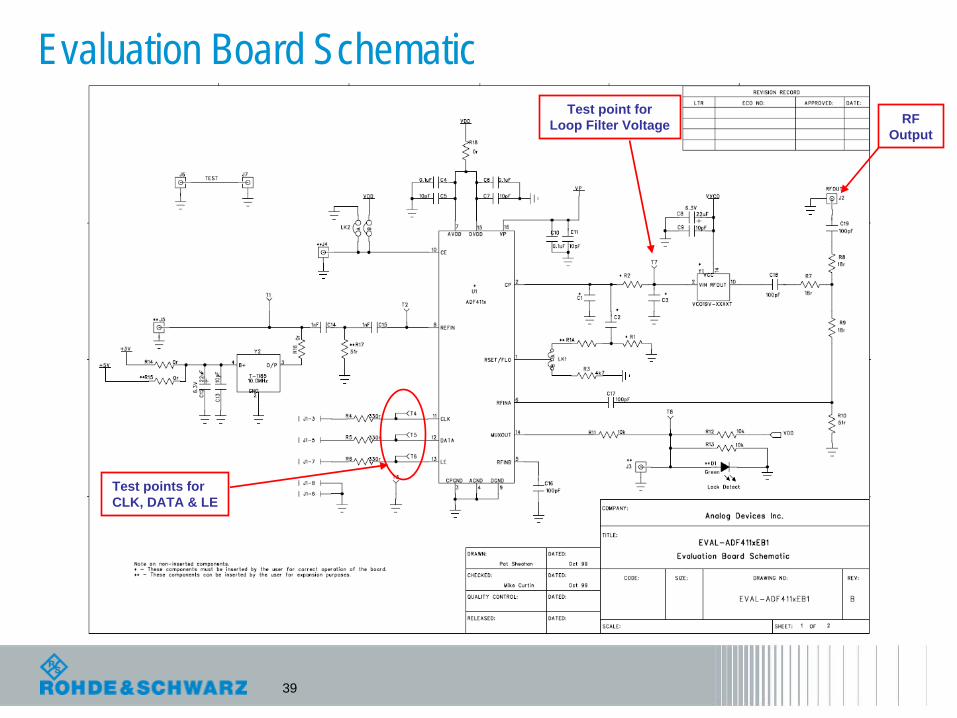
Evaluation Board Schematic
Test points forCLK, DATA & LE
Test point forLoop Filter Voltage RF
Output
40
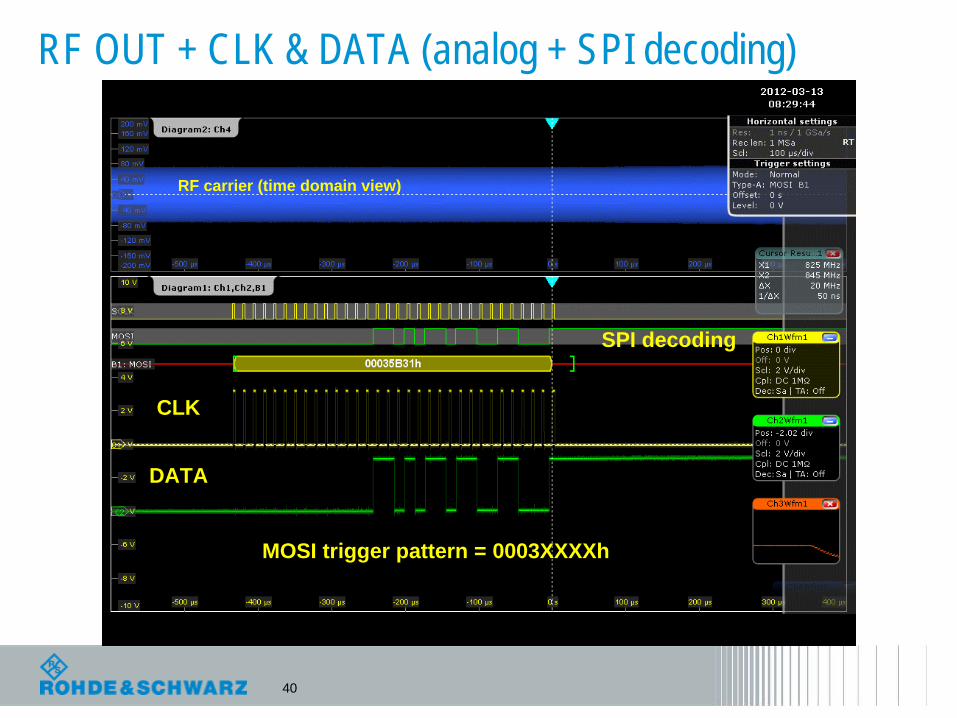
RF OUT + CLK & DATA (analog + SPI decoding)
CLK
DATA
SPI decoding
RF carrier (time domain view)
MOSI trigger pattern = 0003XXXXh
41
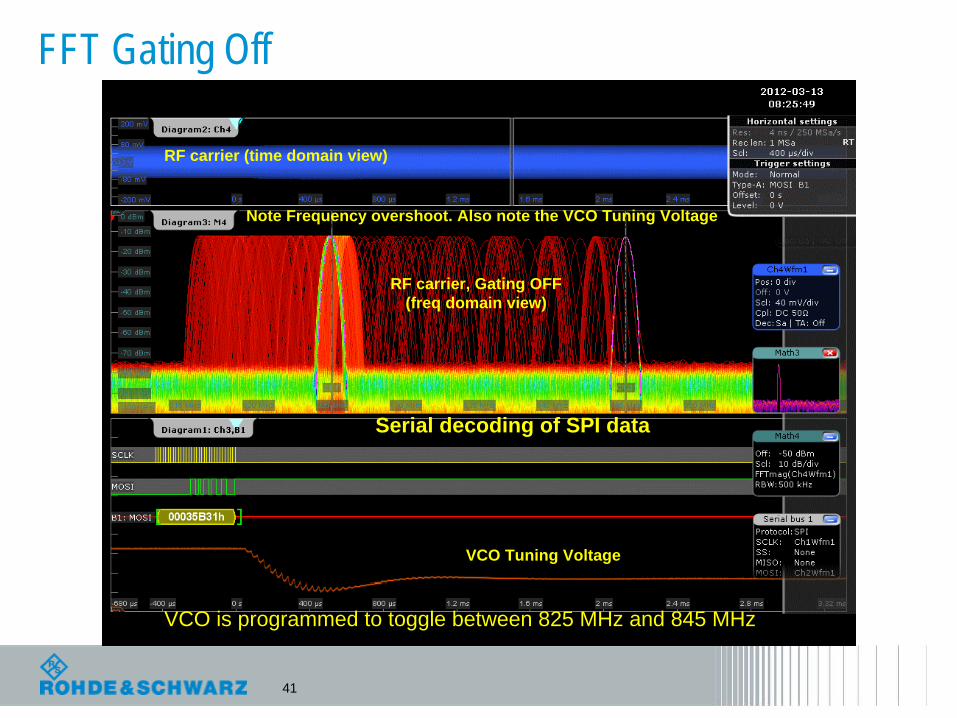
FFT Gating Off
Serial decoding of SPI data
VCO Tuning Voltage
RF carrier (time domain view)
RF carrier, Gating OFF(freq domain view)
Note Frequency overshoot. Also note the VCO Tuning Voltage
VCO is programmed to toggle between 825 MHz and 845 MHz
42
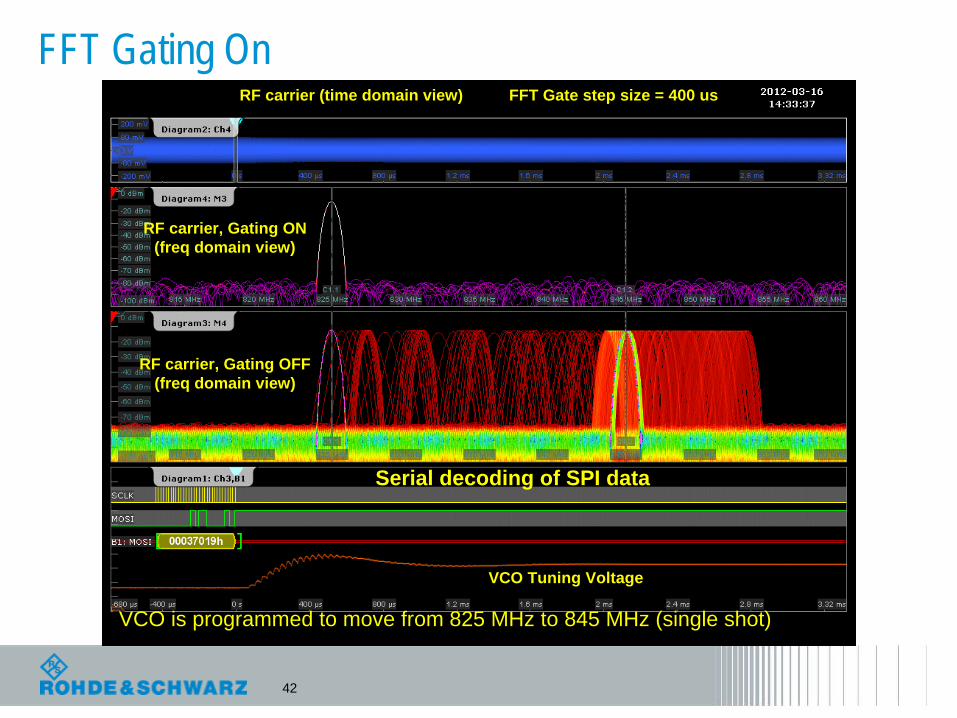
FFT Gating On
VCO Tuning Voltage
RF carrier (time domain view)
RF carrier, Gating ON(freq domain view)
FFT Gate step size = 400 us
Serial decoding of SPI data
RF carrier, Gating OFF(freq domain view)
VCO is programmed to move from 825 MHz to 845 MHz (single shot)
43
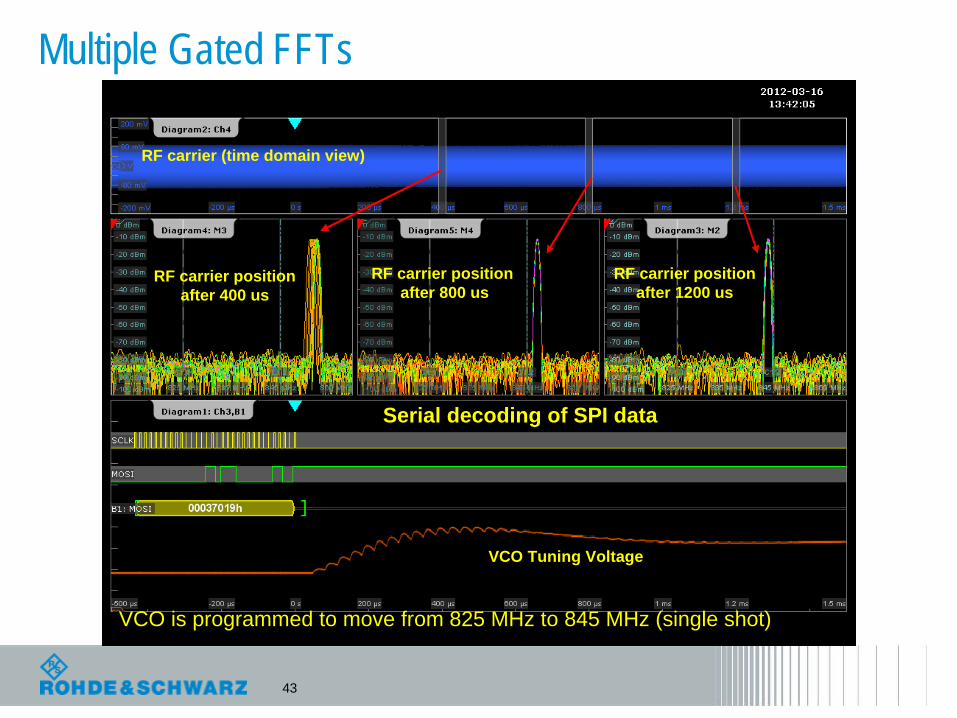
Multiple Gated FFTs
RF carrier (time domain view)
RF carrier positionafter 400 us
RF carrier positionafter 1200 us
RF carrier position after 800 us
VCO Tuning Voltage
Serial decoding of SPI data
VCO is programmed to move from 825 MHz to 845 MHz (single shot)
44
Summary
l FFT based spectrum analysis can be enhanced to enable time-correlated spectrum analysisl Improved throughput using digital down conversionl High dynamic range A/D conversionl High gain amplifier for small signal measurement
l Real time oscilloscope platform is ideal for digital, time and frequency analysisl Synchronized time and frequency domain analysisl Serial protocol trigger and decodel Parallel data channels
45
Summary
l Watch the recorded webinar on this presentation here!l http://bit.ly/SYqjzCl Or scan the QR code on your mobile device: