Embed Size (px)
Citation preview
GLOBAL SYNDICATED LOANS REVIEWMANAGING UNDERWRITERS
First Half 2012
Asia Loans - Asian Currency (S3i) 9
Table of ContentsGlobal Syndicated Loans
Global Loans - Mandated Arrangers (R3)
Global Deals Intelligence
Top 10 Global Syndicated Loans
1
1
Global Loans - Bookrunners (R1) 1
2
2
Leading Underwriters for 2012
Global Scorecard 2
Global Loans Rankings - Last Ten Years 39
EMEA Mandated Lead Arrangers (R19) 7
Asia Loans - Bookrunners (S5c)
EMEA Sponsored Loans (P13) 8
Asia Pacific (Excl. Japan) Syndicated Loans
Asia & Australia Deals Intelligence
Global Debt & Syndicated Loans (DL1) 2
European Leveraged Loans (P10) 8
9
Top Asia Syndicated Loans 9
First Half 2012
MANAGING UNDERWRITERS
SYNDICATED LOANS REVIEW
10
11
11
Japan Loans - Mandated Arrangers (S12a)
Thomson Reuters Solutions for the Deal Making Community
10
Syndicated Loans Criteria Summary 13
Regional Contacts
10
14
12
Americas Syndicated Loans
EMEA Syndicated Loans
Japan Syndicated Loans
EMEA Deals Intelligence 7
Americas Deals Intelligence 4
US Leveraged Loans - Bookrunners (R11a) 5
6
Australia Loans - Bookrunners (S7)
Australia Loans - Mandated Arrangers (S6a)
Japan Deals Intelligence
Top Japan Syndicated Loans
Japan Loans - Bookrunners (S12b)
Americas Loans - Bookrunners (R7) 4
Asia Loans - Mandated Arrangers (S5b) 9
Top Australia Syndicated LoansTop Americas Syndicated Loans 4
Latin America Loans - Mandated Lead Arrangers (R16)
Top EMEA Syndicated Loans 7
US Investment Grade Loans - Bookrunners (R11b)
North America Loans - Bookrunners (R9) 5
5
EMEA Bookrunners (R17) 7
6
Americas Loans - Mandated Arrangers (R8c)
US Loans - Bookrunners (R11) 5
13
Ranking Criteria Summary
11
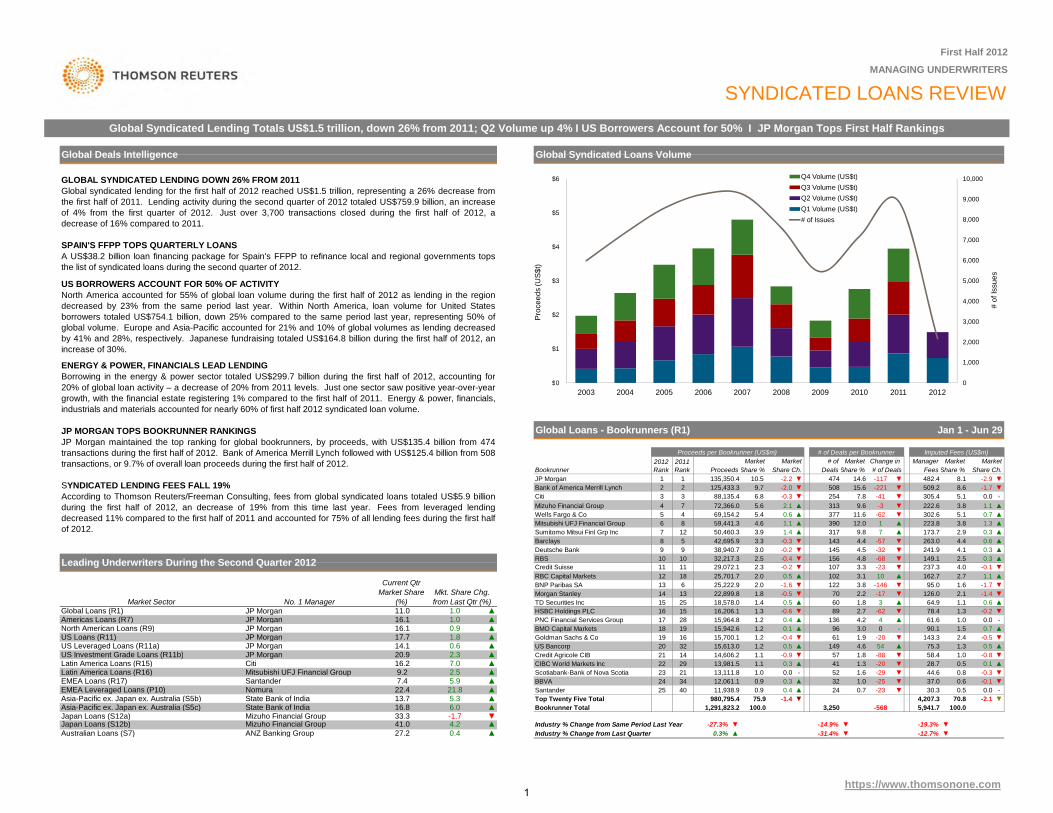
ENERGY & POWER, FINANCIALS LEAD LENDING Borrowing in the energy & power sector totaled US$299.7 billion during the first half of 2012, accounting for
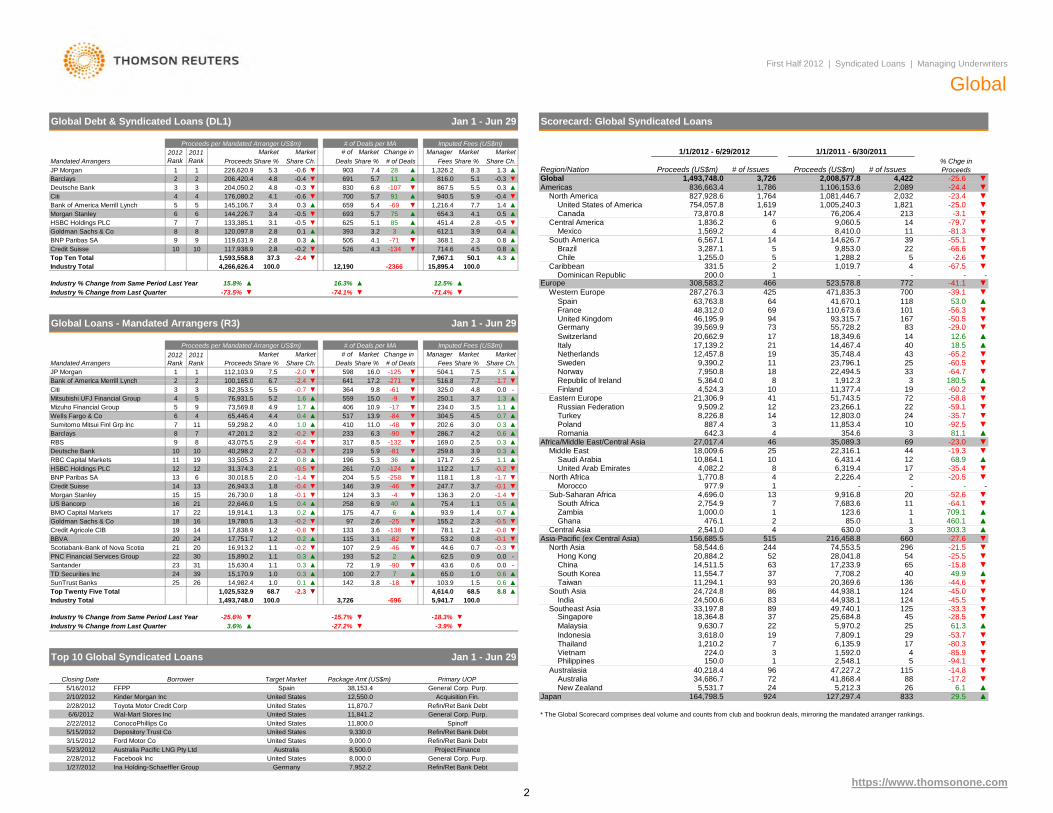
US BORROWERS ACCOUNT FOR 50% OF ACTIVITYNorth America accounted for 55% of global loan volume during the first half of 2012 as lending in the regiondecreased by 23% from the same period last year. Within North America, loan volume for United Statesborrowers totaled US$754.1 billion, down 25% compared to the same period last year, representing 50% ofglobal volume. Europe and Asia-Pacific accounted for 21% and 10% of global volumes as lending decreasedby 41% and 28%, respectively. Japanese fundraising totaled US$164.8 billion during the first half of 2012, anincrease of 30%.
First Half 2012
MANAGING UNDERWRITERS
SYNDICATED LOANS REVIEWGlobal Syndicated Lending Totals US$1.5 trillion, down 26% from 2011; Q2 Volume up 4% I US Borrowers Account for 50% I JP Morgan Tops First Half Rankings
Global Syndicated Loans VolumeGlobal Deals Intelligence
GLOBAL SYNDICATED LENDING DOWN 26% FROM 2011Global syndicated lending for the first half of 2012 reached US$1.5 trillion, representing a 26% decrease fromthe first half of 2011. Lending activity during the second quarter of 2012 totaled US$759.9 billion, an increaseof 4% from the first quarter of 2012. Just over 3,700 transactions closed during the first half of 2012, adecrease of 16% compared to 2011.
SPAIN'S FFPP TOPS QUARTERLY LOANSA US$38.2 billion loan financing package for Spain's FFPP to refinance local and regional governments topsthe list of syndicated loans during the second quarter of 2012.
0
1,000
2,000
3,000
4,000
5,000
6,000
7,000
8,000
9,000
10,000
$0
$1
$2
$3
$4
$5
$6
# of
Issu
es
Pro
ceed
s (U
S$t
)
Q4 Volume (US$t)Q3 Volume (US$t)Q2 Volume (US$t)Q1 Volume (US$t)# of Issues
g gy p $ g , g20% of global loan activity – a decrease of 20% from 2011 levels. Just one sector saw positive year-over-yeargrowth, with the financial estate registering 1% compared to the first half of 2011. Energy & power, financials,industrials and materials accounted for nearly 60% of first half 2012 syndicated loan volume. JP MORGAN TOPS BOOKRUNNER RANKINGSJP Morgan maintained the top ranking for global bookrunners, by proceeds, with US$135.4 billion from 474transactions during the first half of 2012. Bank of America Merrill Lynch followed with US$125.4 billion from 508transactions, or 9.7% of overall loan proceeds during the first half of 2012.
SYNDICATED LENDING FEES FALL 19%According to Thomson Reuters/Freeman Consulting, fees from global syndicated loans totaled US$5.9 billionduring the first half of 2012, an decrease of 19% from this time last year. Fees from leveraged lendingdecreased 11% compared to the first half of 2011 and accounted for 75% of all lending fees during the first halfof 2012.
4.2
1.01.00.91.8
▲
▲
▲
0.4
0.62.37.02.55.921.8
6.0-1.7
5.3
▲
-12.7% ▼Industry % Change from Last Quarter 0.3% ▲ -31.4%
11.0
32
▼
Top Twenty Five Total
0.6
-19.3%
37.01.00.7
-25
980,795.4 ▼75.9 -1.4
▼
9.216.2
▼
▼-27.3% -14.9%
▼
3,250
-23
24
Bookrunner Total▲
▲
16.1▲
▲
16.1
22.47.4
20.9
▲
▲
14.117.7
▲16.813.7
▼41.0 ▲
Credit Agricole CIB
0.00.3
1,291,823.2
Industry % Change from Same Period Last Year
1.121
Scotiabank-Bank of Nova ScotiaCIBC World Markets Inc
0.912,061.1 0.9
▲
BBVA 24Santander
▲
21 13,111.8 1.0
25
-8854149
0.3 4157-0.9
0.844.6
30.3
▼
-0.00.5
100.0
▼0.4
100.05,941.74,207.3
-0.1
-2.1
0.1-0.3
28.7
-568
-23▲
-201.31.6
1.8▲
40 11,938.9
1429
▲52
4
-0.4
▼
▲ 136▲
-20-▼▼
89
4.6
0.4
1.90.1 96
4.23.0
610.5 ▲
-29
1.3 -0.6 ▼
0
2.7
▼
58.475.3 ▲
▼
78.4
1.51.0
90.161.6
1.3
3
0.0
-0.81.0
▼
1.1
▼
▼▼
▲1.3▼
▲
2.4
-1.4
-0.5
▼▼
-
▲-0.2
0.7 ▲▼
▼
0.5
0.5
70.8
1.1
143.3
126.0 2.1-1.7
0.6
104.02.7162.7
237.3-23 ▼▲
▼▼
▼▲
-▲
▲▲
-0.1
Share Ch.Fees# of Deals
Global Loans - Bookrunners (R1)
MarketImputed Fees (US$m)Proceeds per Bookrunner (US$m)
Jan 1 - Jun 29
# of Deals per Bookrunner2012 Rank Share Ch.Bookrunner Proceeds
MarketMarket Manager# of MarketMarket Change in 2011 Rank Share %
Bank of America Merrill Lynch
Wells Fargo & CoMitsubishi UFJ Financial Group
RBS
PNC Financial Services Group
Sumitomo Mitsui Finl Grp IncBarclays
Credit Suisse
2 2 125,433.3
Share %Deals
508 ▼-221
Share %474JP Morgan 1 1 135,350.4 -117 ▼10.5 -2.2 ▼ 14.6 8.1 -2.9482.4
0.07.8509.2 -1.7
1.19.6 -3 ▼ 3.8222.66.8 -0.3 ▼
8.6254 -41 ▼
15.6305.4 5.1
▲
▼Citi 3 3 88,135.4
5.6 2.1
9.7 -2.0
5 4 69,154.259,441.3
Mizuho Financial Group 4 7 72,366.0377 ▼ 302.611.65.4 0.6 ▲ -62313
▲2.9 0.3
0.7 ▲▲
5.11.312.04.6 1.16 8 1 3.8390 ▲ 223.8▲
8 5 42,695.97 12 50,460.3
0.3▼ 241.93.33.9 ▲ 317 ▲1.4
-0.37
▲143 4.4 -57 ▼ 263.0 4.4 0.6
25,222.9
Deutsche Bank 9 9 38,940.7
173.7
4.5 -32▼
9.8
4.810 10 32,217.3 2.529,072.1 ▼2.311 11
3.13.3
▲
2.2▼ 95.03.8
1.8 ▲
▼ 145
102107156
70▲ 60
25,701.7
▼1.6▼
-62
-146-17
64.9▼
12213
19
US Bancorp 20
2515
Goldman Sachs & Co 19BMO Capital Markets
32
12BNP Paribas SA 6RBC Capital Markets
HSBC Holdings PLC
Morgan Stanley13
1514
TD Securities Inc16
22
1815,700.1
1716,206.1
13,981.5
15,613.0
18,578.0
1.2
1.114,606.2
34
18
1.2
1.8
28 15,964.8
22,899.82.0
1615,942.6 1.2
1.4
-0.2
-0.20.52.0
0.5
-1.6-0.5
1.2
0.3149.14.13.0
-0.4 ▼ 2.5-68 ▼
▲
33.3
27.2
Current Qtr Market Share
(%)Mkt. Share Chg. from Last Qtr (%)
Leading Underwriters During the Second Quarter 2012
US Investment Grade Loans (R11b)Latin America Loans (R15)
Asia-Pacific ex. Japan ex. Australia (S5c)Japan Loans (S12a)Japan Loans (S12b)Australian Loans (S7)
Latin America Loans (R16)EMEA Loans (R17)EMEA Leveraged Loans (P10)Asia-Pacific ex. Japan ex. Australia (S5b)
State Bank of IndiaMizuho Financial GroupMizuho Financial GroupANZ Banking Group
Market SectorGlobal Loans (R1)Americas Loans (R7)North American Loans (R9)US Loans (R11)US Leveraged Loans (R11a)
JP MorganCitiMitsubishi UFJ Financial GroupSantanderNomuraState Bank of India
No. 1 ManagerJP MorganJP MorganJP MorganJP MorganJP Morgan
0$0 2003 2004 2005 2006 2007 2008 2009 2010 2011 2012
https://www.thomsonone.com1
9,390.2
-73.5% ▼
20,662.9Italy
MarketShare %
▲Industry % Change from Last Quarter
Deals
Global Loans - Mandated Arrangers (R3)
# of Deals per MA Imputed Fees (US$m)MarketMarket
Mandated ArrangersNetherlands
73
8
Sweden
Republic of Ireland 5 364 0
Share Ch.ProceedsMarket2012
Rank2011 Rank
Industry % Change from Same Period Last Year 15.8%
France 48,312.046,195.9
Western Europe
1,836.2
827,928.6
73,870.8
308,583.2
63,763.8
15,895.4
-71.4%
2,008,577.8
425
1,764
2
14
Canada
466
United Kingdom
▲
-2366
Share Ch.
Europe
United States of America
12,457.8
287,276.3
Caribbean
Brazil
Dominican Republic
6,567.1
7,950.8
Switzerland
12,190
16.3% ▲
2
Industry Total 4,266,626.4
1JP Morgan 112,103.9 7.5100 165 0Bank of America Merrill Lynch 2
331.5
▼6 7
First Half 2012 | Syndicated Loans | Managing Underwriters
Top Ten Total 1,593,558.8 37.3
Share % Share %1 16.0
▼-74.1%
-2.4
Proceeds per Mandated Arranger US$m)
▼Fees
271 ▼
4.3 ▲
598
▲
Jan 1 - Jun 29
▼ 50.1
641
100.0
▼
7,967.1
# of Deals504.1
12.5%
516 8
5
Mexico
-12517 2
4
3,287.1
1,569.2
# of
7.57 7
-2.02 4 ▼
714.6
7.5
4.5
18
Manager
1 7
▼
200.0
64
754,057.8
Chile
147
▲
Central America
South America
Region/Nation
▼▲ 0.4
69
Americas
1,255.0
1/1/2012 - 6/29/2012
▼
# of Issues3,726
5
1,619
4.3 0.8
North America836,663.4
Germany
Proceeds (US$m)Global
94
21
39,569.9
11
17
19
Spain
17,139.2
Norway
6
1,7862,032
1/1/2011 - 6/30/2011
Scorecard: Global Syndicated Loans
▼1,493,748.0
31 912 3
4335,748.414,467.4
23,796.122,494.5
2533
1440
-65.2
▼
-66.6
▼▼
180 5
18.5
-29.0
-60.5
▲
-64.7
-55.114,626.7
1,821
1,019.7
Global
# of Issues
213
8,410.0 11
41,670.1 118
-
149,060.576,206.4
1,081,446.7
-523,578.8
9,853.0
471,835.3
18,349.6
4,4222,089
1,005,240.3
1,106,153.6
14
1,288.2 5
Proceeds (US$m)
▲53.0-39.1-41.1
▼
▼
700
▼
▲
▲
-
-50.5
12.6
-
▼
▼▼
22
772
▼▼
-79.7
-2.6-67.5
▼▼
▼-81.3
55,728.2
110,673.693,315.7
101
83▼▼
167-56.3
39
-3.1
% Chge in Proceeds
▼
-25.6
-23.4-24.4
-25.0▼
Change in
-1340.8 ▲
2.8 -0.2 ▼Credit Suisse 10 10 117,938.9505 4.1526
0.3 ▲BNP Paribas SA
100.0
Market
368.1 2.3-71612.1 3.9 ▲
9 9 119,631.9 2.83.2 3Goldman Sachs & Co 8 8 120,097.8 2.8
85▼0.1 ▲ 393
-0.5451.4 2.84.1 0.5 ▲
▼625 5.175 ▲ 654.3
▲5.7
HSBC Holdings PLC 7 7 133,385.1 3.1 -0.5Morgan Stanley 6 6 144,226.7 3.4 -0.5 ▼ 693
▲ 659 5.4 1,216.4 7.7 1.4Bank of America Merrill Lynch 5 5 145,106.7 3.4 0.3700 5.7
5.5 0.3940.5 5.9 -0.4▲ ▼
-69 ▼ ▲91
▲Citi 4 4 176,080.2 4.1 -0.6 ▼
▼ 830 6.8 -107 ▼ 867.5Deutsche Bank 3 3 204,050.2 4.8 -0.311 ▲ 816.0 5.1 -0.3 ▼
▲Barclays 2 2 206,420.4 4.8 -0.4 ▼ 691 5.7
7.4 28 ▲ 1,326.2 8.3 1.3Share % Share Ch.
JP Morgan 1 1 226,620.9 5.3 -0.6 ▼ 903Share % Share Ch. Deals Share % # of Deals Fees
Market Market # of Market Change in Manager Market Market2012 Rank
2011 RankMandated Arrangers Proceeds
Global Debt & Syndicated Loans (DL1) Jan 1 - Jun 29
Proceeds per Mandated Arranger US$m) # of Deals per MA Imputed Fees (US$m)
* The Global Scorecard comprises deal volume and counts from club and bookrun deals, mirroring the mandated arranger rankings.
150.0
11,294.1
156,685.5
11,554.7
Singapore
112.2
-18.3% ▼
8389
199,630.7
24,500.633,197.8
3,618.0
924 127,297.4
5,970.2
73
7,809.1
41,868.447,227.2
2,548.11,592.0
37
5214,511.5 63
12
123.6
51542
6,319.42,226.4 2
17
7
▼
4625
35,089.3
6,431.4
354.6
12,803.0
13148
1241
1022,316.1
72
1175
▼
Ghana
4,524.3
887.44
1.8
9,509.2
4,082.2
1001.9
2 62.5 0.9▼-90 0.6
193
1.0
▼▼
Eastern EuropeFinland
▲
68.5▲-18
-25
8Republic of Ireland 5,364.0
3
21,306.9
7
19,780.5
15 26,730.0 1.8 ▼6.92581.5 ▲
4,696.0
Saudi Arabia
124 3.3
▼
0.5
247.72.0
-0.530,018.5
43,075.5
115-0.8 133
▼ 97
▲
3.9 -46
-124
▼
7.0
3.13.6
4.7
-4
-138
▼
HSBC Holdings PLC
-0.4
▼▼
26120414614 -0.4
BNP Paribas SA ▼5.5
365.30.8
-1.4
▲2.12.2
5591.6
0.44.44.9
517
▲1.7
▼-27.2%Industry % Change from Last Quarter
▼1,025,532.9 8.868.7 -2.33,726 -696
▲ 65.0 0.6
-1.3
4.8
▲
14
10
▼
0.6
44.6
1.5
0.0
75.41.4
-0.5
▲
Industry Total
▲0.1 3.8SunTrust Banks
Industry % Change from Same Period Last Year
Santander
1,493,748.0
-25.6%
31 15,630.4
26Top Twenty Five Total
25
▲
14,982.4
3.6%
76,931.54
12 12 31,374.3
22
-82 0.8▼ 53.2
▼
Scotiabank-Bank of Nova Scotia
-1.4
-1.7
19
4.0
-0.8
0.7
1,000.0
▲-46
▼ Morocco1,770.8
-15.7%▼
▲142
0.3
100.0
▼1.1
2.9
-0.7
▼
1.1
1.0
▲1.1 0.3
-0.1
▲15,170.9 1.02324 39
▼0.2
211.2
PNC Financial Services Group0.3
3020
47,201.2
14
-0.220
16,913.217,751.7
1526,943.3
-0.2
59,298.2
2
1.0
17,838.9 1.2
3
9 73,569.8
82,353.5
0.2
1940,298.2
18
15,890.2
24
22,646.0
33,505.3
Sumitomo Mitsui Finl Grp Inc
Mizuho Financial Group
Barclays 8
1010
5
Morgan Stanley
8
Wells Fargo & Co
BBVA
13 6
BMO Capital Markets 17
3
7 116 4
Australia Pacific LNG Pty LtdFacebook Inc
Deutsche Bank 3.9
Australia
▲
5.9
-84
Credit Agricole CIB
65,446.4
5
100,165.05.5
Bank of America Merrill Lynch 2
Mitsubishi UFJ Financial Group 5.2
Closing Date Borrower Target Market
2/22/2012
3/15/2012
FFPP
Credit Suisse
6.7
5/23/20122/28/2012
United States
United States
Spain
Ford Motor Co5/15/2012
United StatesRefin/Ret Bank DebtRefin/Ret Bank Debt
RBC Capital Markets
6 ▲
Spinoff
▼
▼
-0.0 -
43.6
0.7
2.7
▲0.4
2.6
TD Securities Inc
22US Bancorp 16 21
107 2.9
13
Goldman Sachs & Co 16
Citi
11
169.0
-9
▼
15.09.8
286.7410
-271 ▼
196
364
-132
▼
641
-81
-17
▼▼
▲
-90
India
0.72.3
3.7
3.71.8
-0.2
South Africa
1.1
▼
18,364.8
406 10.9
0.0
24,724.8
5.2
1.1
-61
40
2.7 259.8
516.8
▼
▼317233
13.9
▲
7 ▼3.211.0
17.2
4.2
0.38.5
▲
0.60.3▲
-0.2
▼ 219-0.3
7.7-2.4
▼
4,614.05,941.7
3.0
2.5
93.9
103.9
1.2
-3.9%
202.6
20,884.2
100.0
▲
▼
▲▼
▲ 2.5
78.1
South Asia
IndonesiaThailand
Malaysia
South KoreaChina
-48
1.7
304.5
118.1
▼
171.7
▼▼
-258▼
North Asia
▼
3.5
-0.3
Zambia
▲
Asia-Pacific (ex Central Asia)
-0.1
-0.1
▲
2.0
155.2
1.1 2,754.9
476.1
136.3
▲
0.3
4.5
-1.7
▲250.1234.0
▲
▼ 325.0
6/6/2012 United States
▼
642.3
8,226.8
Romania
Middle East
Poland
18,009.6
TurkeyRussian Federation
27,017.4
58,544.6Hong Kong
Sub-Saharan Africa977.9
Central Asia
United Arab Emirates
Africa/Middle East/Central Asia
10,864.1
2,541.0
244
North Africa
72
37
Japan 164,798.524
Taiwan
Australasia
1,210.2
34,686.7
ConocoPhillips CoDepository Trust Co
General Corp. Purp.Acquisition Fin.
9386
5,531.7
Southeast Asia
Australia
224.0Vietnam
44,938.120,369.6
49,740.125,684.8
44,938.1
96
22
140,218.4
New Zealand
Philippines
-
1117,683.6
9,916.8
216,458.8
7,708.2
20
630.0
28,041.817,233.9
660
54
85.0
115▼▼
124
45
-45.0
-14.8
3
3
3
1,912.3
▲
6,135.9 17
5,212.3 ▲
74,553.5
19
69
10
23,266.17222
51,743.5
296
44
24
-94.1
49.9-44.6
-45.5
4
-17.2
-21.5
▼-80.3
▼
61.3
-33.3
-25.5
29.56.1
-53.7
-85.9
833
-
1
8826
125
5
2925
124136
6540
-58.8-60.2
--20.5
-23.0
-59.1
-92.5-35.7
▼
68.9-19.3
▼
▼
▲
-64.1 ▼
460.1709.1
▼
▼▼
▼
▼
▲
▲▲
▼
▼
▼
▼
▼
▼
▲
▼
▼▼
-28.5▲
▼180.5
-15.8
▼
-52.6
81.1
-35.4
▲
-27.6
▼
-
303.3
1.3
11,377.4
11,853.4
▲
United States
Kinder Morgan Inc United StatesToyota Motor Credit Corp United States
11,800.0
11,870.7Wal-Mart Stores Inc
5/16/2012
▲
RBS 9
19,914.11.3
▼
6.3
9,330.09,000.08,500.0
Jan 1 - Jun 29
Primary UOP
General Corp. Purp.Refin/Ret Bank Debt
Top 10 Global Syndicated Loans
2/10/20122/28/2012
8,000.0 General Corp. Purp.
11,841.2
Project Finance
Package Amt (US$m)38,153.412,550.0
https://www.thomsonone.com
aceboo c/ 8/ 01/27/2012
U ted StatesIna Holding-Schaeffler Group Germany
8,000 07,952.2
Ge e a Co p u pRefin/Ret Bank Debt
2
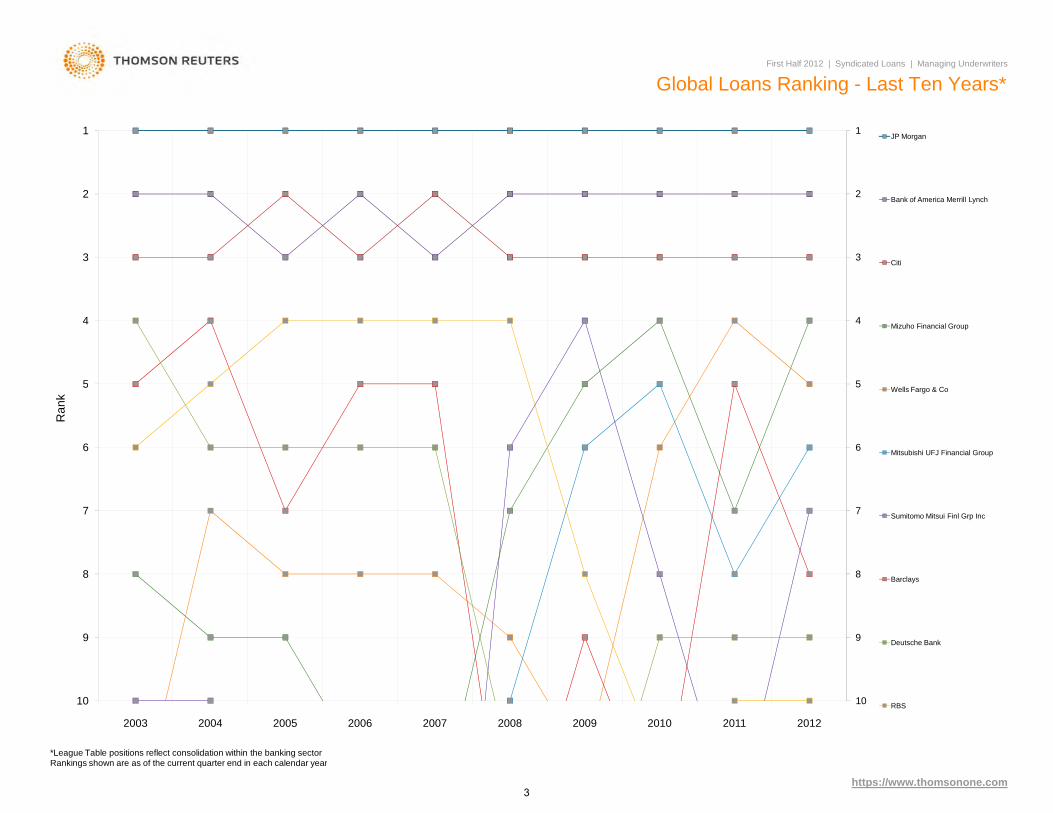
Global Loans Ranking - Last Ten Years*First Half 2012 | Syndicated Loans | Managing Underwriters
1
2
3
4
5
1
2
3
4
5
JP Morgan
Bank of America Merrill Lynch
Citi
Mizuho Financial Group
5
6
7
8
9
10
5
6
7
8
9
10
2003 2004 2005 2006 2007 2008 2009 2010 2011 2012
Ran
k
Wells Fargo & Co
Mitsubishi UFJ Financial Group
Sumitomo Mitsui Finl Grp Inc
Barclays
Deutsche Bank
RBS
*League Table positions reflect consolidation within the banking sectorR ki h f th t t d i h l d
https://www.thomsonone.com
Rankings shown are as of the current quarter end in each calendar year
3
Jan 1 - Jun 29 2012
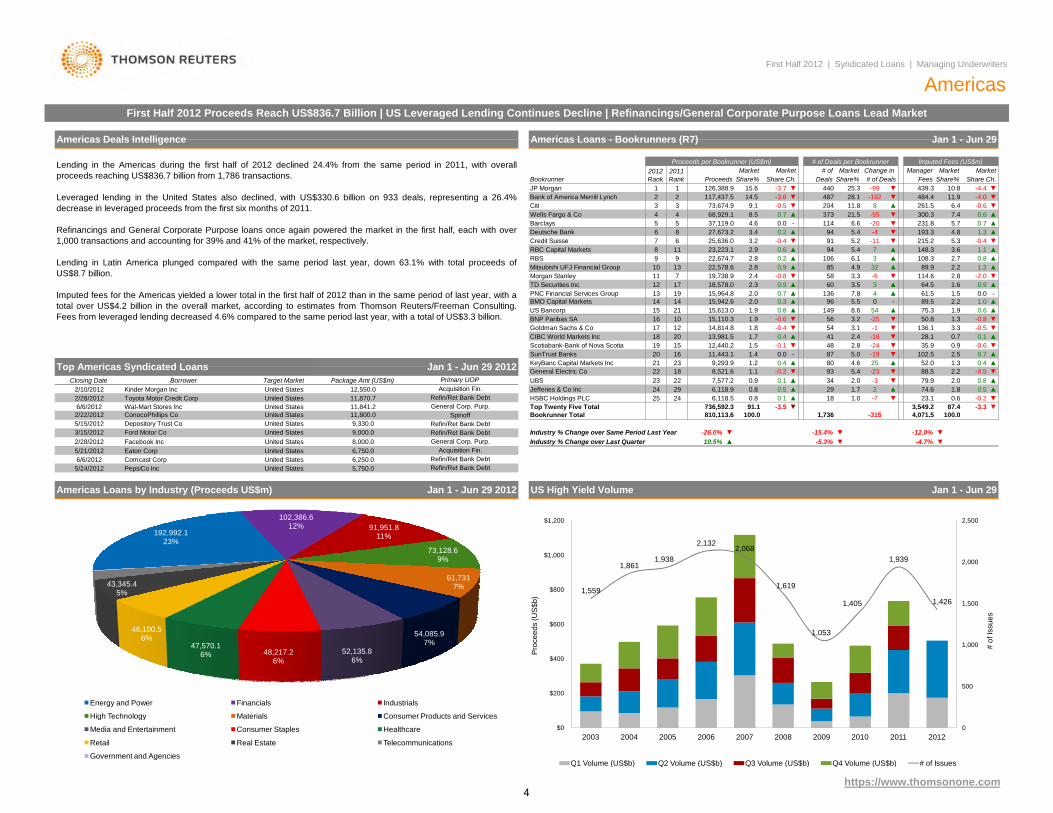
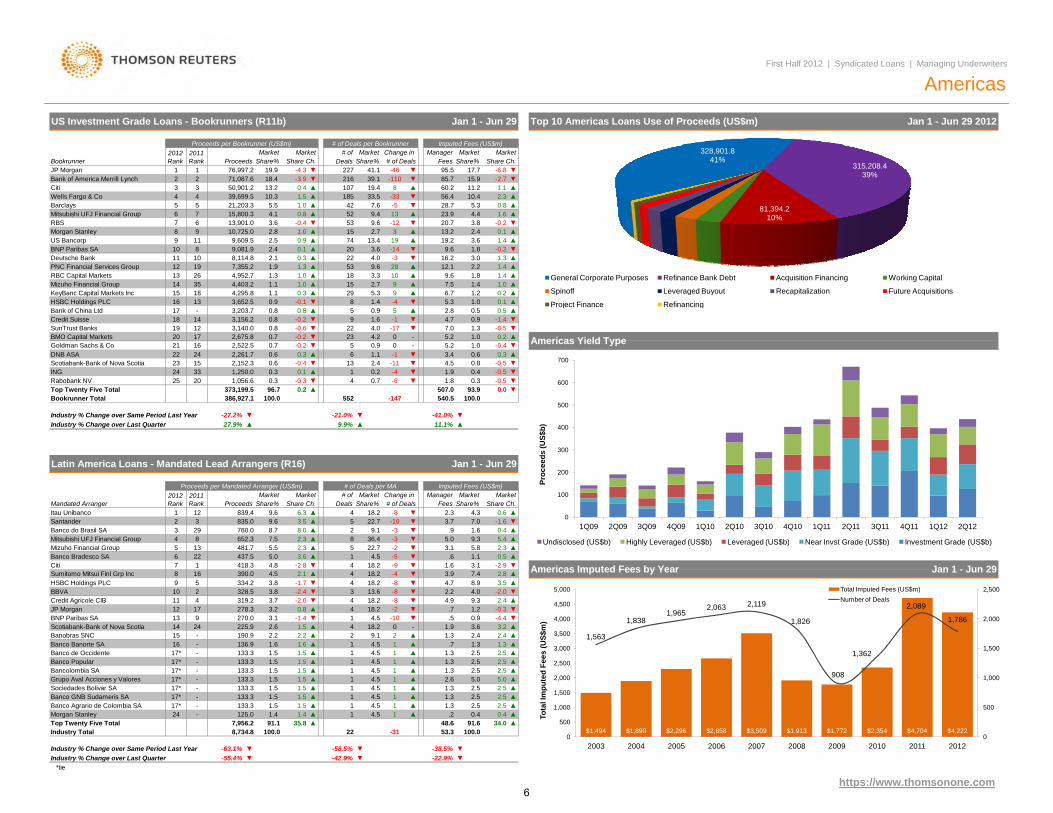
Lending in the Americas during the first half of 2012 declined 24.4% from the same period in 2011, with overallproceeds reaching US$836.7 billion from 1,786 transactions.
Leveraged lending in the United States also declined, with US$330.6 billion on 933 deals, representing a 26.4%decrease in leveraged proceeds from the first six months of 2011.
Refinancings and General Corporate Purpose loans once again powered the market in the first half, each with over1,000 transactions and accounting for 39% and 41% of the market, respectively.
Lending in Latin America plunged compared with the same period last year, down 63.1% with total proceeds ofUS$8.7 billion.
Imputed fees for the Americas yielded a lower total in the first half of 2012 than in the same period of last year, with atotal over US$4.2 billion in the overall market, according to estimates from Thomson Reuters/Freeman Consulting.Fees from leveraged lending decreased 4.6% compared to the same period last year, with a total of US$3.3 billion.
Borrower Primary UOPGeneral Electric Co 22 18
▼ 79 9 2 0▼
UBS 23 22 7 577 2 0 9 0 1 ▲ 0 8 ▲
4.6 25 ▲ 1.35.4 -23 ▼ 88.58,521.6
0.41.1 -0.2 ▼ 93 2.2 -0.51.2 80
▲2.50.4 ▲ 52.0KeyBanc Capital Markets Inc 21 23 9,293.9 ▲
5.0 -19- 87 0.7▼ 102.5SunTrust Banks 20 16 11,443.1 1.4 0.0▼48 2.8 -24 ▼ 35.9 0.9
0.1 ▲Scotiabank-Bank of Nova Scotia 19 15 12,440.2 1.5 -0.1 ▼ -0.6
136.1 3.32.4 -18 ▼ 28.1 0.7
-1 ▼54 3.11.7 0.4 ▲ 41
-0.4 ▼CIBC World Markets Inc 18 20 13,981.5Goldman Sachs & Co 17 12 14,814.8 -0.5 ▼
1.9 -0.6 3.2 -25▼ 56 ▼1.8
149 8.6 54BNP Paribas SA 16 10 15,110.3
1.9 0.815,613.00.3 ▲ 96
▲75.3 1.92.2 1.0 ▲
▲
4 ▲ 61.5 1.5
1.3 -0.80.6▲
▼ 50.8
0 - 89.52.0
▲PNC Financial Services Group 13 19 15,964.8 2.0 0.0 -136 7.8
0.9
BMO Capital Markets 14 14 15,942.6 5.5
114.6 2.83.5 3 ▲ 64.5
-6 ▼1.6
0.7 ▲2.3 0.9 ▲ 60TD Securities Inc 12 17 18,578.0
58 3.3▲
Morgan Stanley 11 7 19,738.9 2.4 -0.8 ▼ -2.0 ▼4.9 32▲ 85 2.2 1.2▲ 89.9Mitsubishi UFJ Financial Group 10 13 22,578.6 2.8 0.9
0.2 ▲ 0.8 ▲106 6.1 3 ▲ 108.3 2.7▲ 94 3.6 1.1 ▲
RBS 9 9 22,674.7 2.8
215.2 5.35.4 7 ▲ 148.3
91 5.2 -11 ▼RBC Capital Markets 8 11 23,223.1 2.9 0.6
▲Credit Suisse 7 6 25,636.0 3.2 -0.4 ▼ -0.4 ▼
5.4 -4▲ 94 4.8 1.3▼ 193.3Deutsche Bank 6 8 27,673.2 3.4 0.20.7 ▲114 6.6 -20 ▼ 231.8 5.7
7.4 0.6 ▲Barclays 5 5 37,119.0 4.6 0.0 -
21.5 -55 ▼ 300.3▲ 373Wells Fargo & Co 4 4 68,929.1 8.5 0.7204 11.8 8 ▲ 261.5 6.4
▼Citi 3 3 73,674.9 9.1 -0.5 ▼ -0.6 ▼
11.915.6 -3.7
-4.0▼ 484.414.5 -3.6 28.1 -192▼ 487▼ -4.4 ▼440 25.3 -99 ▼ 439.3 10.8
Change in
Bank of America Merrill Lynch 2 2 117,437.5
DealsJP Morgan 1 1
Share% Share Ch.Market
First Half 2012 | Syndicated Loans | Managing Underwriters
AmericasFirst Half 2012 Proceeds Reach US$836.7 Billion | US Leveraged Lending Continues Decline | Refinancings/General Corporate Purpose Loans Lead Market
Americas Loans - Bookrunners (R7) Jan 1 - Jun 29
Share% # of Deals# of
US Bancorp 15 21
MarketBookrunner
126,388.9Proceeds
Imputed Fees (US$m)Proceeds per Bookrunner (US$m) # of Deals per BookrunnerManagerMarket2012
Rank2011 Rank
MarketFees Share% Share Ch.
Market
34 2 0 3Package Amt (US$m)
Top Americas Syndicated LoansClosing Date Target Market
Americas Deals Intelligence
Kinder Morgan Inc
Facebook Inc
Borrower
Comcast Corp
100.0
6/6/2012
810,113.6
Americas Loans by Industry (Proceeds US$m)
PepsiCo Inc
Depository Trust Co
-5.3% ▼Industry % Change over Last QuarterEaton Corp
Jan 1 - Jun 29US High Yield Volume
5/21/2012 Acquisition Fin.United States
-12.0%▼10.5% ▲
▼-15.4% ▼-4.7%
▼-26.0%
▼0.8 1811,841.2
United States736,592.3
6,118.5
-315
United States
Top Twenty Five Total
United States
24
United States General Corp. Purp.United States
25
Primary UOPAcquisition Fin.
6,750.0
Bookrunner Total
Jefferies & Co Inc
Industry % Change over Same Period Last Year
3,549.2-3.5 ▼
24
4,071.587.4 -3.3 ▼
100.0
-0.20.8 0.5 ▲ 29 1.8 0.5
0.6▲0.1 ▼23.11.0
▼ 79.9 2.0▲ 74.61.7 2
UBS 23 22 7,577.2 0.9 0.1 ▲ 0.8 ▲34 2.0 -329 6,118.9
HSBC Holdings PLC
8,000.0
Refin/Ret Bank DebtGeneral Corp. Purp.
-7
Package Amt (US$m)12,550.0
1,736
▲
91.1
9,330.0
5/24/2012 United States6,250.0
Refin/Ret Bank Debt
United States
5,750.0
SpinoffRefin/Ret Bank Debt
2/10/2012Closing Date Target Market
Wal-Mart Stores IncToyota Motor Credit Corp 11,870.7
6/6/20122/28/2012
9,000.0
ConocoPhillips Co
Ford Motor Co
United States
2/28/2012
11,800.0United States
2/22/20125/15/20123/15/2012
Refin/Ret Bank DebtRefin/Ret Bank Debt
Jan 1 - Jun 29 2012
192,992.123%
102,386.612% 91,951.8
11%
73,128.69%
61,7317%
54,085.97%
52,135.86%
48,217.26%
47,570.16%
46,100.56%
43,345.45%
18307.12%
20060%
Energy and Power Financials Industrials
High Technology Materials Consumer Products and Services
Media and Entertainment Consumer Staples Healthcare
Retail Real Estate Telecommunications
Government and Agencies
1,559
1,8611,938
2,1322,068
1,619
1,053
1,405
1,939
1,426
0
500
1,000
1,500
2,000
2,500
$0
$200
$400
$600
$800
$1,000
$1,200
2003 2004 2005 2006 2007 2008 2009 2010 2011 2012
# of
Issu
es
Pro
ceed
s (U
S$b
)
Q1 V l (US$b) Q2 V l (US$b) Q3 V l (US$b) Q4 V l (US$b) # f I
https://www.thomsonone.com
Q1 Volume (US$b) Q2 Volume (US$b) Q3 Volume (US$b) Q4 Volume (US$b) # of Issues
4
19 2 0 515 0 9 4 ▼▲
HSBC Holdings PLC 25 24 5 241 2 0 7 0 1 ▲ 0 2 ▼1.7 2▲ 29 1.9 0.6▲ 74.6Jefferies & Co Inc 24 28 6,118.9 0.8 0.4
0.1 ▲ 0.8 ▲34 2.0 -3 ▼ 79.9 2.0▼ 92 2.2 -0.5 ▼
UBS 23 22 7,577.2 0.9
52.0 1.35.4 -24 ▼ 88.0
80 4.7 25 ▲General Electric Co 22 18 8,477.8 1.1 -0.3
▲KeyBanc Capital Markets Inc 21 23 9,293.9 1.2 0.4 ▲ 0.4 ▲
5.0 -20▼ 86 2.5 0.7▼ 102.0SunTrust Banks 20 16 11,399.3 1.4 -0.1-0.1 ▼ -0.6 ▼47 2.7 -25 ▼ 35.4 0.9
▲ 41 0.7 0.1 ▲Scotiabank-Bank of Nova Scotia 19 15 12,396.4 1.5
136.0 3.42.4 -18 ▼ 28.1
53 3.1 -2 ▼CIBC World Markets Inc 18 20 13,981.5 1.7 0.4
▼Goldman Sachs & Co 17 12 14,766.4 1.8 -0.4 ▼ -0.4 ▼
-24▼ 55 1.2 -0.9▼ 50.316 10 14,840.3 1.8 -0.7 3.2149 8.7 54 ▲ 75.3 1.9
0.9 ▲15 21 15,613.0 1.9 0.8 ▲ 0.6 ▲
5.6 0 - 89.5 2.27.9 4 ▲
14 14 15,942.6 2.0 0.2 ▲ 96
▲13 19 15,964.8 2.0 0.6 ▲ 0.0 -136
3▲ 60 1.6 0.9▲ 64.561.5 1.5
12 17 18,578.0 2.3 0.8 3.5-2.1 ▼58 3.4 -6 ▼ 114.6 2.8
81 2.1 1.1 ▲11 7 19,738.9 2.5 -0.8 ▼
108.3 2.74.7 32 ▲ 85.7
106 6.2 4 ▲10 13 22,158.6 2.8 1.0 ▲
▲3.79 9 22,674.7 2.8 0.2 ▲ 0.8 ▲
7▲ 94 1.2▲ 148.38 11 23,223.1 2.9 0.5 5.5▼90 5.2 -10 ▼ 215.1 5.33.2 -0.4 ▼ -0.47 6 25,561.0
4.86.6
1.3 ▲5.5 -2 ▼ 193.30.6 ▲
944.6 -0.1 ▼3.4 0.2
▲1145 5 37,119.0 231.8 5.7
8.6 0.7 7.4 0.5300.3-20 ▼
21.7 -54 ▼-0.5 ▼200 11.6 14 ▲ 259.8 6.4
12.0 -4.0 ▼484.4-190 ▼126,247.2 15.7 -3.8 ▼-4.4438 438.8 10.9280.3 -97▼
Change in Manager# of Deals
MarketShare Ch.
▼
9.1 -0.4▼
6 8 27,673.2
▼
▲
-3.7
68,929.1
▼-0.6
▲
▲ 373
2 23 3 73,198.3
Proceeds2012 Rank
1.2
▲
1.2-2.0
4
▼
1.2▲
4 8 45 1 1 1
4
▲24
14.6
-▲ 22.50 8 0 3 ▲ 85Fifth Third Bancorp 25 34 6 744 4 0 6
▲
▲
1.30.00.4
0.5160.3
2.5 90.4 ▲ 456.2▲
19 10,946.2 1.3 ▼▲
0.6 -0.21.1 111 53.40.9
-0.1 ▼ 13KeyBanc Capital Markets Inc 23 25 8,753.4Mizuho Financial Group 24
3.5 25.7▲72 4.0 10 ▲ 89.3 0.9UBS 21 23 11,372.3
▲
0.72.1
1HSBC Holdings PLC 22
▼ 28.51.4 0.4 ▲1.4 0.2 ▲ 62CIBC World Markets Inc 20 20 11,408.41.8 8.0 103.9 2.5SunTrust Banks 19 17 14,982.4 142 -160.2
TD Securities Inc 18 21 14,988.8 1.8 0.6
88 4.9 -46
▲-1.050.9 1.24.6 -63
64.7-0.9 ▼ 82
▲ 98 5.5
Market# ofFeesDeals Share Ch.
MarketShare% Share%
MarketMarketManager
▼
0.4 ▲ 193
Fees# of
Share%
-1.0
Deals
PNC Financial Services Group 15 15,890.2
2012 Rank
2011 Rank
Bank of America Merrill Lynch 2 2
Proceeds per Mandated Arranger (US$m)
First Half 2012 | Syndicated Loans | Managing Underwriters
▼-4.3
Share% Share Ch.
▼11.5485.8
Jan 1 - Jun 29
Market# of Deals per MA Imputed Fees (US$m)
Americas
Americas Loans - Mandated Arrangers (R8c)
Market Market
▼
▼
Imputed Fees (US$m)2011 Rank
Proceeds per Bookrunner (US$m) # of Deals per Bookrunner
487117,437.5 28.3
Mandated Arranger Proceeds▼JP Morgan 1
93,970.0
Share%
BNP Paribas SA 17
10.7
2.3
0.5-0.5-4.2
▲
6.47.25.8
▲28.3
▼
▲▲
5▼
-24
93.15.2
▲
▲▲
▲
▼ 220.7
1 99,913.6 527 29.5
▼
Share Ch.Market Change in
11.9 -3.6 -94
36,775.3
33 7,604.3
3.8
3.3▼
10 15,015.1 1.81.8
33.3-4.0
7.764,711.7
23,690.6
11.2 ▼ 594
▲3.5
111.1
1.8
▼
1.5
0.70.0 -
9.7
7.3
0.9
198.9RBS
54
Barclays
RBC Capital Markets 76
812
4Citi 3 3 67,572.7 8.1
27,564.4
Wells Fargo & Co
2.8117.7
0.9
0.72.6
3.4
1.5
▲
3.6 ▲
-0.4
144.7
41
381.4
131
3.7
14.4
178▲1
173▲
19010.0
46
▲30,800.3
115
Mitsubishi UFJ Financial Group
-771520.0 -
31,781.24.4
▼▲0.5▼-12
268.2301.5
8.5
▲506
0.8 ▲243.0
▼
95.8
75.4
153.4
4.7 ▲
0.5
26,803.7 -142.8 -
Deutsche Bank 9 7
84
10.63.2 -0.1
15-200
5.5 16
0.1
99▲
0.0
266 14.9
8
Morgan Stanley 10US Bancorp 11 15
9
13
▼
▲0.8
9.62.3 2.2
37.5
6.4
Scotiabank-Bank of Nova Scotia -0.4
Credit Suisse 12 6 22,377.3BMO Capital Markets
16 13 15,257.9
Goldman Sachs & Co 1418
-0.7258
1710.4 ▲
2.7 0.7-12
14 18,037.1 2.2 0.1
▼ 114416
2.7
--0.3
62.5 1.5 0.0▲
22,646.0
19,516.7
10.8▼
▼
BMO Capital MarketsUS Bancorp2
▲1.9
4.7 ▲10
450.7▼
North America Loans - Bookrunners (R9)
Share% 1 1
# of DealsMarket
Jan 1 - Jun 29
PNC Financial Services Group
RBC Capital MarketsRBS
BookrunnerJP Morgan
BNP Paribas SA
Bank of America Merrill LynchCitiWells Fargo & CoBarclaysDeutsche BankCredit Suisse
Mitsubishi UFJ Financial GroupMorgan StanleyTD Securities Inc
-26.4%Industry % Change over Same Period Last Year ▼ -5.8% ▼ -4.6% ▼
Bookrunner Total2,899.5 88.1
-57 3,289.9 100.0330,637.0 933100.0
▼Top Twenty Five Total 297,875.5 90.0 -6.5 ▼ -4.3 ▼
0.5 -1▲ 5 0.4 -0.3▼ 13.0HSBC Holdings PLC 25 27 1,433.2 0.4 0.10.0 - 0.2 ▲14 1.5 1 ▲ 17.2 0.5
▼ 8 0.5 -0.5 ▼TD Securities Inc 24 24 1,454.9 0.4
42.4 1.30.9 -3 ▼ 15.6
20 2.1 2 ▲Scotiabank-Bank of Nova Scotia 23 21 1,714.3 0.5 -0.2
▲Fifth Third Bancorp 22 23 2,376.6 0.7 0.3 ▲ 0.7 ▲
5.8 23▲ 54 1.6 0.5▲ 52.7US Bancorp 21 22 3,897.3 1.2 0.7-0.2 ▼ -0.3 ▼47 5.0 7 ▲ 43.4 1.3
▲ 43 1.7 0.7 ▲PNC Financial Services Group 20 14 4,453.5 1.4
45.1 1.44.6 2 ▲ 57.0
48 5.1 14 ▲BMO Capital Markets 19 17 4,548.0 1.4 0.3
▼KeyBanc Capital Markets Inc 18 18 4,894.2 1.5 0.6 ▲ 0.5 ▲
3.4 -9▼ 32 1.1 -1.1▼ 37.2BNP Paribas SA 17 11 5,035.0 1.5 -1.41.3 ▲ 1.2 ▲22 2.4 13 ▲ 58.4 1.8
▲ 28 2.3 0.6 ▲Mitsubishi UFJ Financial Group 16 28 5,430.3 1.6
76.2 2.33.0 2 ▲ 74.2
31 3.3 3 ▲Jefferies & Co Inc 15 19 5,918.9 1.8 1.0
▼UBS 14 15 6,630.0 2.0 0.6 ▲ 0.8 ▲
9.2 -23▼ 86 2.6 -1.0▼ 86.2General Electric Co 13 10 7,573.7 2.3 -0.80.5 ▲ 1.0 ▲63 6.8 -2 ▼ 94.3 2.9
▲ 51 2.6 1.1 ▲SunTrust Banks 12 13 7,716.7 2.3
99.5 3.05.5 21 ▲ 86.9
43 4.6 -6 ▼RBS 11 16 8,239.3 2.5 1.2
▲Morgan Stanley 10 8 8,963.9 2.7 -2.4 ▼ -2.6 ▼
5.5 10▲ 51 3.5 1.2▲ 114.9RBC Capital Markets 9 12 10,218.9 3.1 0.9-0.6 ▼ -0.7 ▼48 5.1 -2 ▼ 130.8 4.0
▼ 74 6.1 0.6 ▲Goldman Sachs & Co 8 9 12,243.9 3.7
175.5 5.37.9 -14 ▼ 201.9
70 7.5 1 ▲Barclays 7 6 15,878.2 4.8 -1.0
▼Deutsche Bank 6 7 17,995.9 5.4 0.3 ▲ 1.1 ▲
9.4 6▼ 88 5.9 -0.5▲ 193.9Citi 5 5 19,345.9 5.9 -1.4▼ ▼81 8.7 -7 ▼ 207.0 6.3 -0.5Credit Suisse 4 4 21,817.3 6.6 -0.7
▲Wells Fargo & Co 3 3 28,539.9 ▼ 7.4 0.5▲ 191 242.2-168.6 0.7336.7JP Morgan 2 2 45,572.5 21.4
▼13.8 -2.913.9 -3.4
20.5▼ 200
▼-39
12.1 -4.2-3.3 ▼10.2▼
▼ 397.3
# of Market Change in
Bank of America Merrill Lynch 1 1 45,983.2Deals Share%Bookrunner
Manager Market# of Deals
Imputed Fees (US$m)Market
Fees Share% Share Ch.ProceedsMarket Market
Share% Share Ch.
US Leveraged Loans - Bookrunners (R11a)
Proceeds per Bookrunner (US$m) # of Deals per Bookrunner
276 29.6 -73
2012 Rank
2011 Rank
-0.5
Industry % Change over Same Period Last Year -26.8% ▼ -12.8% ▼ -12.4% ▼
1,577 -232 100.03,418.5 88.73,859.4Bookrunner Total 733,986.6 100.0
677,242.131
-3.7 ▼0.5 0.3
▼1.2 0.6 ▲
-3.69
0.52.0▲
92.3Fifth Third Bancorp 25 31 3,281.1Top Twenty Five Total
-0.4 ▼▲ 45.0
▼21 1.3 -15 ▼ 20.1▲ 18 0.5 0.0 -
Scotiabank-Bank of Nova Scotia 24 20 3,866.6 0.5
18.3 0.51.1 12 ▲ 18.4
13 0.8 -5 ▼Mizuho Financial Group 23 43 4,701.8 0.6 0.5
▲HSBC Holdings PLC 22 22 5,085.7 0.7 0.0 - -0.2 ▼
1.8 2▲ 29 1.9 0.5▲ 74.6Jefferies & Co Inc 21 25 6,118.9 0.8 0.40.0 - 0.7 ▲66 4.2 0 - 62.3 1.6
▲ 34 2.0 0.7 ▲BMO Capital Markets 20 18 7,270.8 1.0
87.2 2.32.2 -3 ▼ 78.4
91 5.8 -23 ▼UBS 19 19 7,577.2 1.0 0.1
▲General Electric Co 18 15 8,385.2 1.1 -0.3 ▼ -0.5 ▼
5.1 25▲ 80 1.4 0.5▲ 52.0KeyBanc Capital Markets Inc 17 21 9,293.9 1.3 0.50.0 - 0.7 ▲86 5.5 -20 ▼ 102.0 2.6
▼ 53 3.5 -0.5 ▼SunTrust Banks 16 13 11,399.3 1.6
47.5 1.23.4 -2 ▼ 136.0
55 3.5 -22 ▼Goldman Sachs & Co 15 11 14,766.4 2.0 -0.4
▲BNP Paribas SA 14 10 14,840.3 2.0 -0.6 ▼ -0.9 ▼
4.4 19▲ 69 3.2 1.3▲ 124.7RBC Capital Markets 13 17 15,221.7 2.1 0.90.9 ▲ 0.6 ▲149 9.4 54 ▲ 75.3 2.0
▲ 136 1.6 0.0 -US Bancorp 12 16 15,613.0 2.1
112.9 2.98.6 4 ▲ 61.5
58 3.7 -5 ▼PNC Financial Services Group 11 14 15,964.8 2.2 0.7
▲Morgan Stanley 10 8 19,738.9 2.7 -0.6 ▼ -1.9 ▼
5.1 31▲ 80 2.2 1.1▲ 84.0Mitsubishi UFJ Financial Group 9 12 21,708.6 3.0 1.10.3 ▲ 0.8 ▲104 6.6 4 ▲ 107.8 2.8
▼ 89 5.5 -0.3 ▼RBS 8 9 22,252.8 3.0
193.3 5.05.6 -9 ▼ 211.9
94 6.0 -2 ▼Credit Suisse 7 6 25,061.0 3.4 -0.4
▲Deutsche Bank 6 7 27,673.2 3.8 0.3 ▲ 1.3 ▲
7.2 -20▲ 114 6.0 0.8▼ 230.7Barclays 5 5 37,119.0 5.1 0.10.6 ▲372 23.6 -54 ▼ 299.4 7.8
6.7 -0.4 ▼Wells Fargo & Co 4 4 68,779.1 9.4 1.0 ▲
12.4 12 ▲ 257.2▼ 196Citi 3 3 70,508.8 9.6 -0.6▼ -4.1 ▼487 30.9 -188 ▼ 483.8 12.5Bank of America Merrill Lynch 2 2 117,437.5 16.0 -3.6
-3.9 27.5 -94▼ 433 ▼FeesShare% Share Ch. Deals Share%
JP Morgan 1 1 123,576.5 16.8
Market Change in Manager
11.3 -4.5▼ 434.2Share% Share Ch.# of Deals
Market2012 Rank
2011 RankBookrunner Proceeds
Market Market # of
▼ -0.7% ▼
US Loans - Bookrunners (R11) Jan 1 - Jun 29
▲ -3.8%Industry % Change over Last Quarter 10.9% ▼
Jan 1 - Jun 29
▼▼
Proceeds per Bookrunner (US$m) # of Deals per Bookrunner Imputed Fees (US$m)
Industry % Change over Last Quarter ▲ -4.5% ▼ -3.8%Industry % Change over Same Period Last Year ▼ -14.6% -11.9%
11.5%-25.3%
1,719 -295 4,041.4 100.0▼ 87.6 -3.5 ▼
Bookrunner Total 805,413.7 100.0
19.2 0.53,536.7
15 0.9 -4 ▼Top Twenty Five Total 734,151.9 91.3 -4.4HSBC Holdings PLC 25 24 5,241.2 0.7 0.1 ▲ -0.2 ▼
1,786
4.8 45.1 1.1 ▲84.1
24
▼
▼-3.1-303 4,212.9 100.0
▼ -10.3%Industry % Change over Same Period Last Year -24.4%
100.0
▼
Industry Total 836,663.486.0 -3.3 ▼0.8 0.3 ▲ 85Fifth Third Bancorp 25 34 6,744.4
Top Twenty Five Total 719,124.00.6▲
3,544.0
Market
-14.5%
-9.4% ▼ -5.4% ▼Industry % Change over Last Quarter ▼ -10.2%▼ -3.1% ▼
https://www.thomsonone.com
y gy gIndustry % Change over Last Quarter 9.3% ▲ -3.2%
5
Jan 1 - Jun 29 2012Top 10 Americas Loans Use of Proceeds (US$m)
0 3 0 5 ▼1 820 1 056 6Rabobank NV
23 15 2,152.3
250.40 30 7
▼ 131.9
0 3
-1
1,250.0 0.3 0.1 ▲
-0.5 ▼1.3
▼
0.2 ▲
0.9
3.44.5
Goldman Sachs & Co 21 16 2,522.5 0.7 -0.2
24
Market Market# of Deals Fees
1.0
0.6
First Half 2012 | Syndicated Loans | Managing Underwriters
Americas
14
# of2011 Rank
Credit Suisse 18SunTrust Banks
RBSMorgan Stanley 8
3Wells Fargo & Co
Mizuho Financial Group
5.2
4.0
▲
6.7
3
-3
13.2
▲
▲
▲
1.1
3.6
▲
-0.4▲
1.1
50,901.2
10
3,156.2 0.8 -0.2
3 ▲
5.356.4
Citi 0.4
▼216
14
13.2
1.9
10.34
19.9
Manager
-4641.1-4.3Deals
Market
227
Change in
5.2 Americas Yield Type
12.1
1.2
3.610
2,261.7
18.4 ▼
0.8
4 39,699.5107
0.7 ▼
0.8
0.3
4.1
0.9
922
5.3
-3.9
1851.5
22▲
▲
1
▼1.1
3.3
4.0
0
1.0
1.4
0.60.6
-▼
-4
2,675.8
24
23
▼
-110
Share%▼
Share Ch.
▲
6
▼
74 13.4 19 ▲
9.452
▲
Mitsubishi UFJ Financial Group 6 7 15,800.3
▼
▼
-0.5 ▼▼
▲
▲
1.0
0.8
0.1
-1.4
▼0.3
-0.4
▼
Bank of America Merrill Lynch
Bookrunner Proceeds1 1 76,997.2JP Morgan
2012 Rank
2 71,087.6
9.63.6 1.4 ▲
▼
15
13
28
2.79.6▼
Barclays
11
7
Scotiabank-Bank of Nova Scotia
9,081.98,114.8
1.0
▼2.40.2
-
▲
US Bancorp
33
Deutsche Bank
13
20 17
DNB ASA 22
ING
BNP Paribas SA
12 19
HSBC Holdings PLC 16KeyBanc Capital Markets Inc
-12
Market
10.4
▲
Imputed Fees (US$m)
4.2
28.7
▼
60.2
# of Deals per Bookrunner
33.58
▼
Proceeds per Bookrunner (US$m)
10,725.0
2
US Investment Grade Loans - Bookrunners (R11b)
0.8
11.285.795.5
Share%
0.2
2.4
1.3
-0.5
-0.2
-2.7
1.8
17.715.9
-6.8
1.6
▲
▲
1.8
7.0
53 9.6
▲
1.6
9.6
4.75 ▲-1
15
-14
18▲
▼
1.3
-0.6
102.7
▲
-0.1
7,355.2PNC Financial Services GroupRBC Capital Markets
3,140.0
15 18 4,295.8
-11
9
19 12
6
-0.4
▼ -17 ▼
17 - 3,203.7 0.8
0.3▼
50.8▼
▼
0
Bank of China Ltd▼
BMO Capital Markets
▲
-0.2
4
5
1.02.8
2.52.8
3513 26 4,952.7 1.3
9
4,403.2 9
20
▲1.0
5 21,203.3
1.0
5.5
9 11 9,609.5
6 13,901.0
8
5
2.4
Share Ch.
19.4-33
7.5
0.10.9
1.41.4
4.4
2.2
19.2
23.920.7
16.2
2.3
3.0
▲
1.4
0.1
1.1
▼
▲
▲
▼
▲
1.0
▲-0.2
0.53,652.5 0.9
0.95.38 ▲
0.5
-4
▼
Jan 1 - Jun 29
▼
▲
Market
39.1
▲
-5
3.8
Share%
▲ 29
53
2.1 0.3
▲▲
▲ 42 7.6
328,901.841%
315,208.439%
81,394.210%
17577.82%
162502%13928.1
2%
12920.21%
10407.91%7355.9
1%
5121.91%
General Corporate Purposes Refinance Bank Debt Acquisition Financing Working Capital
Spinoff Leveraged Buyout Recapitalization Future Acquisitions
Project Finance Refinancing
600
700
-38.5% ▼
34.0 ▲8,734.8 53.3
48.6
Industry % Change over Same Period Last Year -63.1% ▼ -58.5% ▼
100.091.6Top Twenty Five Total 7,956.2 91.1 35.8
Banco Agrario de Colombia SA
Industry % Change over Last Quarter
▲
100.0
-27.2% ▼ -21.0%
-55.4%
0.4
Industry % Change over Same Period Last Year
▲
▲▲
▼ -42.9%
▲
▲
▲0.42.5
.24.5 1
-31
2.51.5 1
▲
▲
1
▼
1.3
▲▲
▼ -22.9%
22
Morgan Stanley 24 - 125.0 4.5 11.4 ▲1.4
Banco GNB Sudameris SA 17* - 133.317* - 133.3
2.5▲11.5 1.51.5
▲1.3▲
14.5 1 ▲ 1.3 2.51.5 2.5▲ 11.54.5
▲4.5 1 ▲ 2.6 5.0 5.01.5Sociedades Bolivar SA 17* - 133.3Grupo Aval Acciones y Valores 17* - 133.3 1.5
▲ 1▲
1.5 1.51.3 2.51.5 1.5 2.5
12.54.5 1 ▲Bancolombia SA 17* - 133.3
Banco Popular 17* - 133.3▲ 1▲
1.51 ▲
▲1.51 ▲
.7 1.3 1.3
12.5
4.54.5 1 1.3 2.5Banco de Occidente 17* - 133.3
Banco Banorte SA 16 - 136.9▲9.1 2 ▲ 1.3 2.42.2
12.4
1.6 1.6▲ 2▲
2.24.5
▲18.2 0 - 1.9 3.6 3.2Banobras SNC 15 - 190.9Scotiabank-Bank of Nova Scotia 14 24 225.9
▼4.5 -10 ▼ .5 -4.4-1.44
0.92.6 1.5
▼ 1▲
3.1▼18.2 -2 ▼ .7 1.2 -0.3
BNP Paribas SA 13 9 270.0JP Morgan 12 17 278.3
▲18.2 -8 ▼ 4.9 2.4-2.04
9.33.2 0.8
▼ 4▲
3.7▼13.6 -8 ▼ 2.2 4.0 -2.0
Credit Agricole CIB 11 4 319.2BBVA 10 2 328.5
▲18.2 -8 ▼ 4.7 3.5-1.73
8.93.8 -2.4
▼ 4▼
3.8▲18.2 -4 ▼ 3.9 7.4 2.8
HSBC Holdings PLC 9 5 334.2Sumitomo Mitsui Finl Grp Inc 8 16 390.0
▼18.2 -9 ▼ 1.6 -2.9-2.84
3.14.5 2.1
▼ 4▲
4.8▲4.5 -5 ▼ .6 1.1 0.5
Citi 7 1 418.3Banco Bradesco SA 6 22 437.5
22.7 -2 ▼ 3.1 2.35.85.0 3.6
▲ 5▲
5.5-3 ▼ 5.0 9.3 5.48
1.622.7 -10
Mizuho Financial Group 5 13 481.7Mitsubishi UFJ Financial Group 4
2.3
Manager
▼▼
Banco do Brasil SA 3 29 760.0Santander
9.1 -3
2012 Rank
Market
▲9.6 6.3 4▲ 2.3 4.3
MarketMandated Arranger Proceeds Share% Share Ch. Deals
2011 Rank
3.5.9▼▲ 2
▲
Share%
9.618.2
36.4
Top Twenty Five TotalBookrunner Total 386,927.1 540.5 100.0100.0
▼
8.0
27.9% ▲ 9.9% ▲
0.3 -0.5 ▼▲ 507.0
1.820 1,056.6Rabobank NV 25
2.3
552
0.393.9
0.7
# ofFees# of Deals
0.0
▼
373,199.5-0.3
Market Market
1
5
96.7 0.2▼
7.0
1.3
-41.0%
-147
-8
Change in
839.4▲
8.77.5
13.7
8 652.3
▼
▼
2.5
0.6
▲0.4▲▲
11.1% ▲
Imputed Fees (US$m)
12
Industry % Change over Last Quarter
2 3 835.0
Share%
2.5
-1.6
Share Ch.Market
Industry Total
Proceeds per Mandated Arranger (US$m)
Itau Unibanco
# of Deals per MA
-6
Latin America Loans - Mandated Lead Arrangers (R16)
▼
Americas Imputed Fees by Year
4
Jan 1 - Jun 29
Jan 1 - Jun 29
0
100
200
300
400
500
600
1Q09 2Q09 3Q09 4Q09 1Q10 2Q10 3Q10 4Q10 1Q11 2Q11 3Q11 4Q11 1Q12 2Q12
Proc
eeds
(US$
b)Undisclosed (US$b) Highly Leveraged (US$b) Leveraged (US$b) Near Invst Grade (US$b) Investment Grade (US$b)
$1,494 $1,890 $2,296 $2,658 $3,509 $1,913 $1,772 $2,354 $4,704 $4,222
1,563
1,8381,965
2,063 2,119
1,826
908
1,362
2,089
1,786
0
500
1,000
1,500
2,000
2,500
0
500
1,000
1,500
2,000
2,500
3,000
3,500
4,000
4,500
5,000
2003 2004 2005 2006 2007 2008 2009 2010 2011 2012
Tota
l Im
pute
d Fe
es (U
S$m
)
Total Imputed Fees (US$m)Number of Deals
*tiey g Q
https://www.thomsonone.com6
`
First Half 2012 | Syndicated Loans | Managing Underwriters
Europe, Middle East & AfricaLowest First Half Volume Since 2002 | Investment Banking Fees Down 47% | US$38 Billion FFPP Transaction is Top Loan
EMEA Use of Proceeds (US$bn)
Top EMEA Syndicated Loans (US$m) Jan 1 - Jun 29 2012
EMEA Deals Intelligence
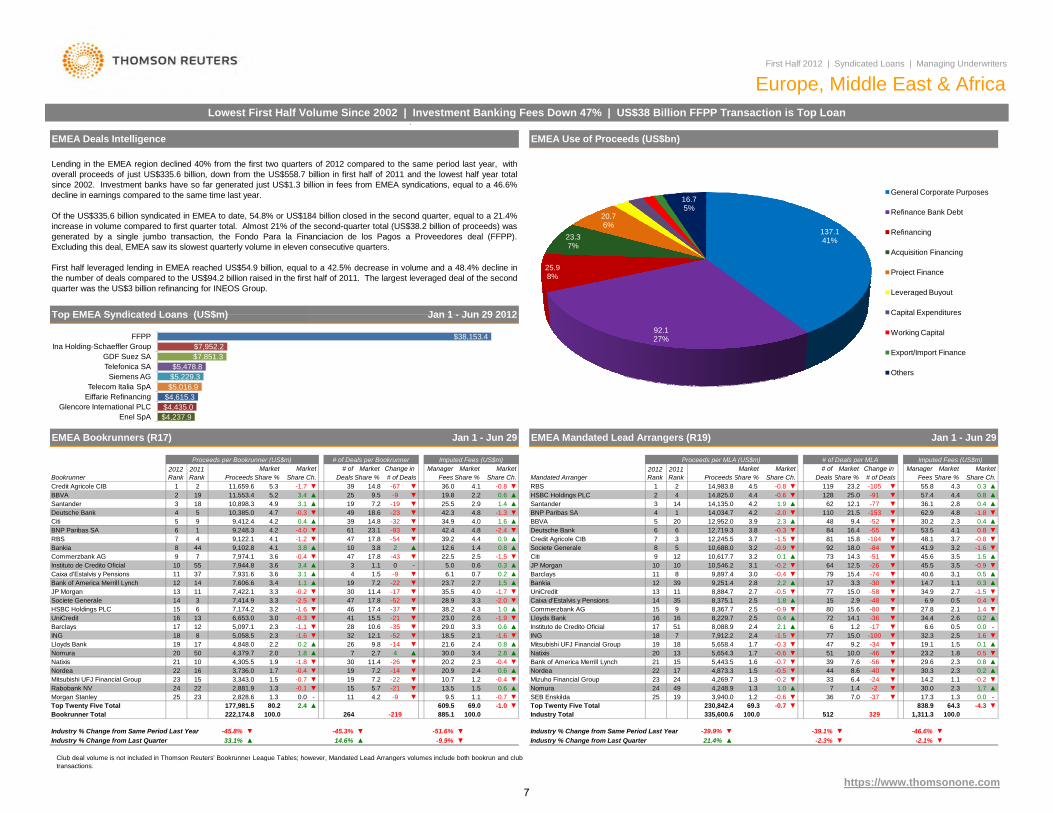
Lending in the EMEA region declined 40% from the first two quarters of 2012 compared to the same period last year, withoverall proceeds of just US$335.6 billion, down from the US$558.7 billion in first half of 2011 and the lowest half year totalsince 2002. Investment banks have so far generated just US$1.3 billion in fees from EMEA syndications, equal to a 46.6%decline in earnings compared to the same time last year.
Of the US$335.6 billion syndicated in EMEA to date, 54.8% or US$184 billion closed in the second quarter, equal to a 21.4%increase in volume compared to first quarter total. Almost 21% of the second-quarter total (US$38.2 billion of proceeds) wasgenerated by a single jumbo transaction, the Fondo Para la Financiacion de los Pagos a Proveedores deal (FFPP).Excluding this deal, EMEA saw its slowest quarterly volume in eleven consecutive quarters.
First half leveraged lending in EMEA reached US$54.9 billion, equal to a 42.5% decrease in volume and a 48.4% decline inthe number of deals compared to the US$94.2 billion raised in the first half of 2011. The largest leveraged deal of the secondquarter was the US$3 billion refinancing for INEOS Group.
$38,153.4$7,952.2$7,851.3
$5,478.8$5,229.3
FFPPIna Holding-Schaeffler Group
GDF Suez SATelefonica SA
Siemens AG
137.141%
92.127%
25.98%
23.37%
20.76%
6.12%
5.82%
4.41%
3.41%
16.75%
General Corporate Purposes
Refinance Bank Debt
Refinancing
Acquisition Financing
Project Finance
Leveraged Buyout
Capital Expenditures
Working Capital
Export/Import Finance
Others
100.0
1.2 -0.6 ▼3,940.0Top Twenty Five Total
▼-39.1% ▼ -46.6%
512 329
Industry % Change from Same Period Last Year
-0.5-17▼ 1.6
72 14.1 -36 ▼
-39.9%
Nomura 24 49
230,842.4SEB Enskilda 25
4,269.7 ▼1.3 1.0
-244,248.9 -2 ▼7
▼33 6.41.3
▼
▼
23.2-56 0.8 ▲-0.7 ▼-46 ▼
39
▲-0.2 ▼
▼ 19.1 1.5 ▲0.1
▼
100.0
▼ -2.1%
1,311.3▼
7.0 0.0 -838.9
1.317.33664.3
2.38.6
30.0
-4.3
-40 ▼ 30.3 ▲14.2
1.4 2.3 1.7 ▲1.1 -0.2
Nordea 22 17 4,873.37.6
1.7 -0.6 ▼ 51 ▼Bank of America Merrill Lynch 21 15 5,443.5 1.6
9.2 -34Natixis 20 13 5,654.3 10.0
471.7 -0.3Mitsubishi UFJ Financial Group 19 18 5,658.4
1.5 -0.5 44
ING 18 7 7,912.2Instituto de Credito Oficial 17 51 8,088.9
15.0 -100 ▼ 32.32.42.1 ▲ ▼ 6.66 1.2
-1.5 77
▲2.4
0.4 ▲
▼
3.3 -30 ▼▲
0.52.92.1 1.42.6 0.2
80 15.6 -80 ▼ ▼▼
-1.5 ▼2.7▲
2.7 -0.5 34.90.4
17
2.50.0
Lloyds Bank 16 16 8,229.7 2.52.5 -0.9 ▼ 27.8
34.4
▼ 40.614.72.2
-74 ▼
-48▼
Commerzbank AG 15 9 8,367.7Caixa d'Estalvis y Pensions 14 35 8,375.1
15.0 -58UniCredit 13 11 8,884.7Bankia 12
3.112.5 -26 ▼
▲
14.3 1.5 ▲3.5▼ 45.5
▼ 6.915
39 9,251.4 2.8
▲▼ 77
2.5 1.8
Barclays 11 8 9,897.4 791.1 0.3
▼
-0.9 ▼73
3.1
▼Citi 9 12 10,617.7 3.2 -510.1 ▲
-84
64-0.2JP Morgan 10
Societe Generale 8 5 10,688.0 92 18.0
0.8-0.3 ▼ 84
▼-153 ▼
25.0 -91 ▼12.162
7 3 12,245.5 3.7▼ 53.5
48.116.4 -55
-0.8
14 14,135.04 1 14,034.7 4.2 -2.0 ▼ 110 21.5 -1.8 ▼
0.4▲
4.836.1 2.8
▼23.2
HSBC Holdings PLC 2 4 14,825.0 4.4▲▲
57.4 4.4 0.8-0.655.8 4.3 0.3▼ ▲
BNP Paribas SA 62.9
69.3 -0.7
-77
Deutsche Bank 6
4.2 1.9
3.8BBVA 5 20 12,952.0
12,719.3
Santander 3
-52
▼-1.5
483.9 2.3 ▲6
81 15.8Credit Agricole CIB
15.43.0 -0.410 10,546.2
335,600.6
0.2
▲
-37 ▼
0.5
2.3▼▼
-1.6
4.13.7
2.31.8
▼ 29.6
45.641.9
▼
▼ 3.5-0.9
0.4▼ 30.2
-104 ▼3.2▼
0.5
Market
-105
-2.3%
2
9.4
11,659.6 5.3 39 -67 ▼0.6
▼128
-2.447 ▼ 39.2
-9 ▼25 9.5▲
▼4.0 1.6
▲
3.2
Manager Market MarketMandated Arranger
Market # of Market# of Deals Fees Share % Share Ch.
MarketProceeds per MLA (US$m)
Change in
Jan 1 - Jun 29
2.219.8▼
MarketImputed Fees (US$m)
2012 Rank
▲4.9 3.15.2 3.4 ▲
# of Deals per Bookrunner
2.9-19
Jan 1 - Jun 29
Share Ch.
EMEA Mandated Lead Arrangers (R19)
# of Deals per MLA
119
EMEA Bookrunners (R17)
MarketShare %Bookrunner Proceeds Proceeds Share % Share Ch. Deals Share %
2011 RankFees
2 14,983.8 4.5 -0.8RBS 1
# ofShare Ch.
-1.7 ▼
ManagerImputed Fees (US$m)
MarketDeals
Change in Proceeds per Bookrunner (US$m)
# of Deals14.8
2012 Rank
2011 Rank
MarketShare % Share %
36.0 4.1
42.4-32
Credit Agricole CIB 1
Deutsche Bank 4 5 10,385.0 4.7Santander 3 19
-23 ▼ 42.3▼1.47.2
4.8Citi 5
BBVA 2 19 11,553.4-0.8
-0.339
4.818.618 10,898.3
9,412.4 ▼BNP Paribas SA 6 1 9,248.3 4.2
▲4.4 0.917.8 -544.1
▲
▼ 25.5▲
23.114.84.2
-1.3 ▼49
-4.0 ▼0.4 ▲9
6134.9
-93 ▼
1.44.1 3.8Bankia 8 44 9,102.83.6 -0.4 ▼
RBS0.8 ▲10 3.8 2 ▲▲
-1.212.6
▼ 22.5-43
▼7 4 9,122.1
0.3 ▲2.5 -1.50.6
▼Commerzbank AG 91.13.4 ▲Instituto de Credito Oficial
7 47 17.87,974.15.010 55 7,944.8 33.6 0 -
▲Bank of America Merrill Lynch 12 14 7,606.6 3.4
3.6 3.1 ▲ 4Caixa d'Estalvis y Pensions 11 37 7,931.6 0.7 0.21.5 -9 ▼ 6.1
11 ▼1.5 ▲19 7.2 -22
35.5▼ 23.7
-0.2 ▼17.8-2.5 -2.0
4.0 -1.73.3
-1.6
2.730 11.4
1.1 ▲
28.9-17
7,414.9 ▼7,422.1 ▼
47▼3.33.3 -52 ▼
JP Morgan
46 ▼HSBC Holdings PLC 15 6Societe Generale 14 3
38.26,653.0
3.2 ▲4.3 1.017.4 -373.0
7,174.2▼ 41 15.5 23.0UniCredit 16 13 -0.3 2.6-21 ▼
13
▼
-1.6
-1.9
-52 ▼ 18.5
▼▼10.6 29.0-35
▼3.3 0.62.1
▲12.1
12 5,097.1ING 18 8 5,058.5Barclays 17 2.3 -1.1 ▼
322.3 -1.6 ▼28
17 4,848.0 ▲ 262.2 0.2 ▲Nomura 20 50 4,379.7 2.0Lloyds Bank 19 -149.8
1.8 30.0▲-0.42.320.2▼30▼ 11.42.80.82.4▼ 21.6
0.67.2 20.9-14Natixis 21 10 4,305.5
▲7 2.7 4 ▲ 3.41.9
▲-26
3,736.0 -0.416 2.4▼▼ 19▼
22 2,881.9 -211.5 ▼1.3
-1.8
7.2 -22 ▼5.7▼ 15
193,343.0-0.1Rabobank NV 24-0.7Mitsubishi UFJ Financial Group 23 15
Nordea 22 1.7-0.4
▲0.61.51.2 ▼
▼10.7
Industry % Change from Last Quarter
▼1.1 -0.7▼69.0
Industry Total
13.5Mizuho Financial Group 23 24
19609.5 -1.0
100.0
▼21.4%
9.5
-9.9%
▼
▲
- 110.0 4.22.4 ▲
-51.6%
-219264
▼
23
100.0
Morgan Stanley
Bookrunner Total
2,828.625
▼Industry % Change from Last Quarter 33.1%
1.3
885.180.2
-9
222,174.8177,981.5Top Twenty Five Total
Industry % Change from Same Period Last Year -45.8% ▼ ▼-45.3%
Club deal volume is not included in Thomson Reuters' Bookrunner League Tables; however, Mandated Lead Arrangers volumes include both bookrun and club
▲ 14.6%
,$5,016.9
$4,615.3$4,435.0$4,237.9
Telecom Italia SpAEiffarie Refinancing
Glencore International PLCEnel SpA
https://www.thomsonone.com
g ; , gtransactions.
7
EMEA Syndicated Loans by Industry (US$m)
0 75 0
Jan 1 - Jun 29 2012
▼
▲▼
▲▲
▲
-0.57.7
0.5
▲▲
▼1.15.2
1.7
1.2
10.1
▲▲
2
▲
10.5
7.7 ▲4
▼▼
▲
▲31 3 5 10 20 5 ▲
-21 1▲
▼ 2.3Bankia 25 29 503 5
568.7
596.6 8.21.5
0.1 6.1▲1.4
1.5 1.2 3▲ 5 10.2
DNB ASA 22 40
23Lloyds BankSEB Enskilda 23 48* 1.4
24
▲ 4578.9
▲263 6.1
0.81.2
2.412.2 -6-2.11.7 ▲
1.61.7
▼
1.7
Natixis 21 10 640.5Caixa Geral de Depositos 20 56 661.1
1.81.24.1
▼4.11
2.31.6
-21.8
1.7▲ 2 ▲ 7.3
▲ 6.348*
BBVA 19 24Bayerische Landesbank Giro 17*
6693.9 0.81.40.4 ▲ 12.2 1
20.63 2.433 844.0 2.1 3.0▲ 6Santander
22 748.216
Landesbank Baden-Wurttemberg 17* 1.9 10.3
2.2 1.5 2 ▼▲13.61.5
▲1.9
12.2 ▲
748.2
0.84.1 -2 2.19.3-1.4-2.7 -2.3
9.9-7 ▼
-2.32.211.6 2.6
Bank of Ireland 15 32 883.97 1,026.6 5
2.6 5 10.210.22.6
▼▼
UniCredit 13 4 1,029.7Commerzbank AG 14
Societe Generale 12 2.8 96 1,105.0 -1.9
▼-7
▲
11 1,622.512.48.2
▲
1,142.6 ▼
4.7
▼▲Barclays 10
Credit Suisse 114.1
-6▼14.30.4
-0.2 ▼
1.6▲
14
13 1,774.8
2.9 4
▲ 2.8
1.4
-1.7-0.6
4.4
3.02.8
3.817.221.0
3RBS
-65.14.4 1.2
28.69 18.4 18
13.4
19.4
▲15.8
Nordea 9 15 1,762.6 ▲-3
6 ▲7
12.24.4 1.3
18.4▼ ▼-8
▲-2.10.23.5
JP Morgan▲4.5 3.2▲ 32,208.618 5.5 3.4
16.3
▼ 4.3-5 ▼
18.45.5
-4.15.8 -2.3 ▼9Citi
22.9
▼ 14-2.1 ▼
5 ▲Credit Agricole CIB 6 9 2,203.4
7 3 2,053.2BNP Paribas SA
4 2 2,324.3
19.3
20.21.6 ▲ 10 20.4
▲5.7 -3.4▼ 25.3
▲
▼
2.2-11Deutsche Bank
10.9Nomura
20.410-4.7 ▼3.6
6.08
▼5.10
▲
-
22.3 5.014 28.6 617 2,425.49.9 14.3 ▲5.557 ▲ 6.730.0
ManagerShare % # of Deals
HSBC Holdings PLC 21 26 4,379.7 ▲
Share Ch.
Europe, Middle East & Africa
# of Deals per BookrunnerMarket
Fees Share %Market# of Market Change in
Imputed Fees (US$m)
Jan 1 - Jun 29
First Half 2012 | Syndicated Loans | Managing Underwriters
EMEA Quarterly Syndicated Loan Volume
MarketBookrunner
European Leveraged Loans (P10)
Proceeds per Bookrunner (US$m)
Proceeds Share Ch.
6.12,409.53 1
Share %Market2011
Rank2012 Rank Deals
9.65.52 1 Financials
251,
162
209,
437
119,
349
158,
323
155,
205
224,
347
241,
862
295,
770
243,
808
314,
861
257,
650
282,
772
151,
558
184,
043
223
276249
264 264
339315
361
264
339315
361 374
442
0
100
200
300
400
500
$0
$50,000
$100,000
$150,000
$200,000
$250,000
$300,000
1 2 3 4 1 2 3 4 1 2 3 4 1 2
2009 2010 2011 2012
EMEA Proceeds (US$m)Number of deals
Pro
ceed
s (U
S$m
)
165.1 85.0 12.8 ▲Bookrunner Total -44 194.2
EMEA Imputed Fees Jan 1 - Jun 29▼ 7.3
353.7 79.1 11.2
▲
▲
0.75.0
ManagerShare %
▲
▲
-17.1%
▲
▲4.4 -6.04.3
▼
3.8 1.1
▲
-4.62.6
▼
▼
2.0
2.75.0
0.8
Jan 1 - Jun 29
▼
▲
▲2▲
Market
▼
Imputed Fees (US$m)
34,935.4 ▲100.040,015.6
14.71.3 5 10.287.5
0.5 ▲ 1.1▲
-48.4%▲
49
▼
-46 446.6 100.0
-50.3%▼
FeesMarket
▲10.3
Industry % Change from Same Period Last Year -42.4% ▼
Bookrunner Total
-5 ▼ 1.95.332.310.7
2011 Rank Share Ch.
▲Deals
30.6 ▲
Bankia 25 29 503.5Top Twenty Five Total
EMEA Sponsored Loans (P13)
Industry % Change from Last Quarter 13.0%-10.1%
# of Deals per Bookrunner
Share %Proceeds
▼
Change in Market MarketProceeds per Bookrunner (US$m)
MarketShare %
# of2012 Rank
19Bookrunner
4,281.5Nomura 1 13.4
-6.55
Share Ch.29.0▲6 26.1 4
# of Deals14.9
Credit Agricole CIB 2 9 1,419.6 21.7▼ 4
6.3 ▲17.4
5.1JP Morgan 3 2 744.9Nordea 4 7 675.9
5.6 -2 ▼ 10.12.18.8 4.5
-5.65.20.4 ▲ 3 13.0 1 ▲
4 17.4 ▼
Credit Suisse 9
8.6-3 ▼ 8.4
-11
2.8
2.0Deutsche Bank 5
8.71.0 ▲1 542.4 4.1 -11.4 ▼
Barclays 6 13 467.9 23.5
36 372.8 -2.0
3.5 1.718 459.4
38 298.30.1
13.0
1
▲ 3Lloyds Bank 8 17 412.4HSBC Holdings PLC 7
0.9 ▲ 23.1
10 362.0Natixis 11 15 315.3 2.4 ▲ 2DNB ASA 2.7
▼
▲5.4 2.8-
8.7
2.7
6.0▼-58.7
2 ▲
▼ 4.07.84.3 0
5.6-5 ▼
1.42.7-
BNP Paribas SA 14
Citi 16 24 184.1
3 277.1RBS 13 282.4
8.28.7 4.2-3 ▼2.93.1
2.3 2.2 ▲RBC Capital Markets 12
SEB Enskilda 17*4
Danske Markets 17* - 169.6 1.3 1.3
32* 169.61.3UniCredit 17* 169.6
1.1
▼▼
Rabobank NV 15 23 252.4 1.9 1.2
16
5 98.0 0.7 ▼101.3
-2.8%▲ ▲62.9%Industry % Change from Last Quarter
100.0
30.0%
7.20.8
▲ -34.31
22 114.1
Industry % Change from Same Period Last Year -67.2% ▼ -65.7% ▼ -73.1% ▼
Top Twenty Five Total
21* 114.1Goldman Sachs & Co 17* 8Mizuho Financial Group 27
169.6
0.8Bank of Ireland 21*
▲
1
1▼
▼
▲ 1Kohlberg Kravis Roberts & Co 23
13,271.2
4.3Societe Generale 24
12,454.3 93.8-2.2
7.1-10
▲
4.3 -1
4.3
1
23
-9 ▼
100.0
▲
-4.21.4
▼ -31.6
1.6
-3.4 1.7 -1.8 ▼
7.9
3.0
4.1
1.30.9 0.5
-8 ▼04.3
4.31
2.71.4
2.1 -0.1 4.342.1
0.5
▼1
▼
-94.3-5.2 ▼ 1
0.8
2.4
▲
1▲-3.4
1.33.0
2.4
-
13.0 -2
3.7
1.61.4
▼
▲
1.2▼ 0.0
2.0
▲1 ▲3 13.0
1
1.4
2.6
▲
▼
1 -3
▲ 2 2.6 ▲-1.0
0.8
17.4-5.4
▼3.7
▼
17.44-5.4
-0.2-
1.2▲▼4.30.9
3.9
-0.4
$1,2
67.9
$1,6
31.5
$2,6
62.0
$3,4
06.2
$4,6
51.6
$2,3
98.6
$1,6
43.1
$1,4
65.1
$2,5
82.6
$1,4
03.7
534
681
787
958
1,131
763
499
603
841
512
0
200
400
600
800
1000
1200
$0
$500
$1,000
$1,500
$2,000
$2,500
$3,000
$3,500
$4,000
$4,500
$5,000
2003 2004 2005 2006 2007 2008 2009 2010 2011 2012
Tota
l Im
pute
d Fe
es (U
S$m
)
Total Imputed Fees (US$m)Number of Deals
78.923%
60.318%
53.716%
40.012%
29.29%
15.14%
14.54%
10.73%
9.63%9.3
3%6.62%
2%2.11%
Financials
Energy and Power
Industrials
Materials
Telecommunications
Consumer Staples
Retail
Media and Entertainment
Consumer Products and Services
Real Estate
High Technology
Healthcare
Government and Agencies
https://www.thomsonone.com8
Asia & Australia Deals Intelligence
Jan 1 - Jun 29 2012
Proceeds per Bookrunner (US$m) # of Deals per Bookrunner Imputed Fees (US$m)
Share Ch. FeesMarket Market
First Half 2012 | Syndicated Loans | Managing Underwriters
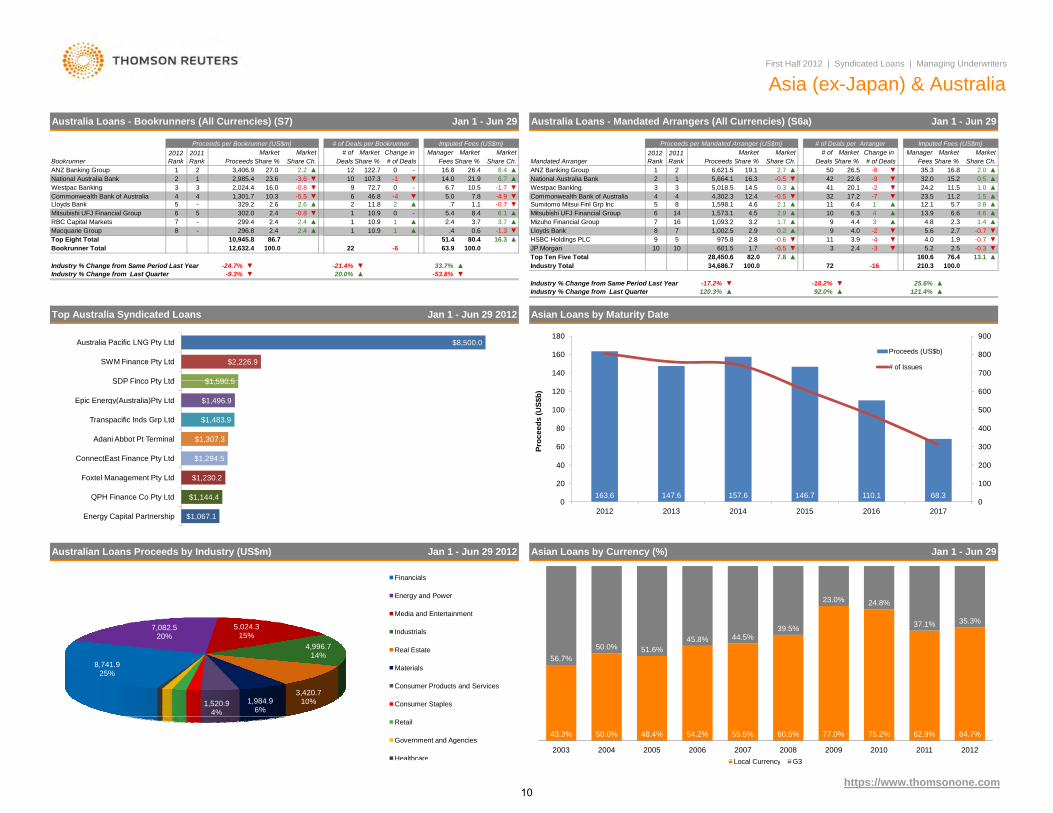
Asia (ex-Japan)Asian Syndicated Loans Down 31.2% l Growth in South Korea & Malaysia l Australian Project Finance Up 222.3%
Asia Loans - Bookrunners (All Currencies) (S5c) Jan 1 - Jun 29
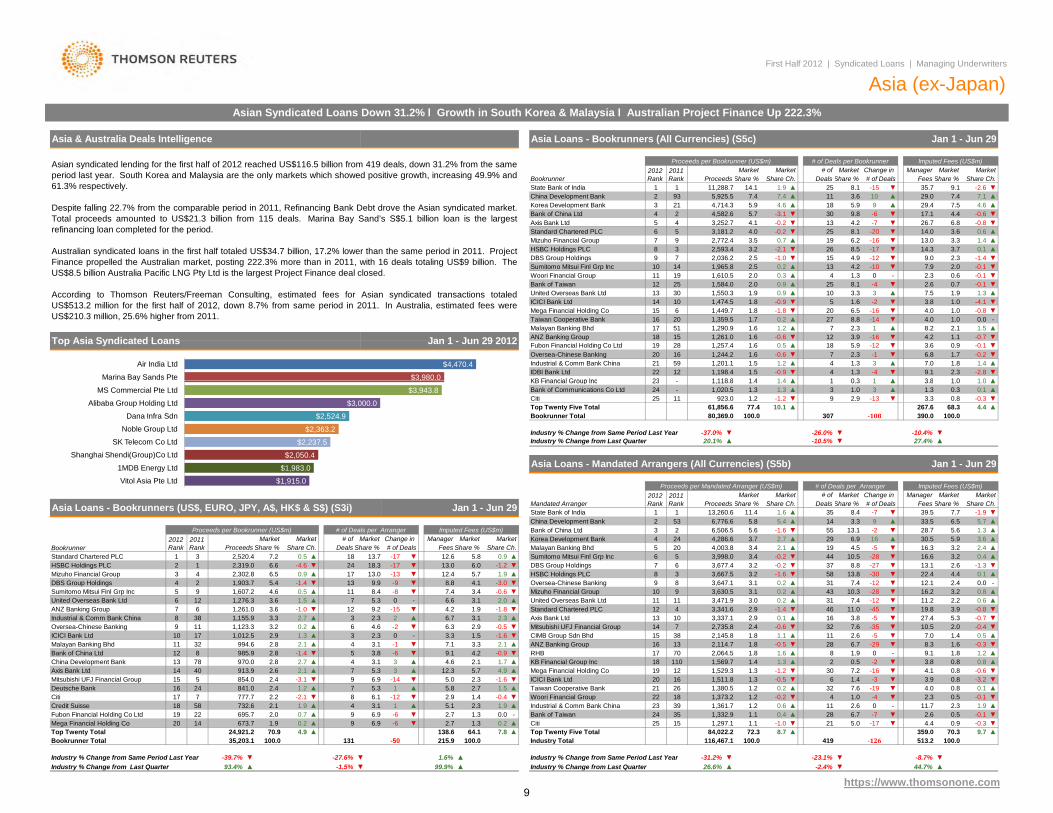
Asian syndicated lending for the first half of 2012 reached US$116.5 billion from 419 deals, down 31.2% from the sameperiod last year. South Korea and Malaysia are the only markets which showed positive growth, increasing 49.9% and61.3% respectively.
Despite falling 22.7% from the comparable period in 2011, Refinancing Bank Debt drove the Asian syndicated market.Total proceeds amounted to US$21.3 billion from 115 deals. Marina Bay Sand’s S$5.1 billion loan is the largestrefinancing loan completed for the period.
Australian syndicated loans in the first half totaled US$34.7 billion, 17.2% lower than the same period in 2011. ProjectFinance propelled the Australian market, posting 222.3% more than in 2011, with 16 deals totaling US$9 billion. TheUS$8.5 billion Australia Pacific LNG Pty Ltd is the largest Project Finance deal closed.
According to Thomson Reuters/Freeman Consulting, estimated fees for Asian syndicated transactions totaledUS$513.2 million for the first half of 2012, down 8.7% from same period in 2011. In Australia, estimated fees wereUS$210.3 million, 25.6% higher from 2011.
2012 Rank
2011 Rank
MarketChange in ManagerDeals
# of MarketShare %
29.010 ▲25
3.6
Share Ch.
7.4 7.1
-0.8-0.6
9
▼ 26.7 6.8-74.4▼-6
▼17.1
▲ 29.4 ▲7.5 4.6▼
5,925.511,288.7 14.1 ▲1.9 ▼9.1 -2.6
▲▼State Bank of India
MarketShare %
35.78.1 -15# of Deals Share %Bookrunner Proceeds
7.4 7.418
▲▲
114.6
1 1China Development Bank 2 93
5.75.9
2Korea Development Bank 3 21 4,714.3
-0.2-3.1 9.8
5.9▼ 30
13 4.2Axis Bank Ltd 5 4 3,252.74,582.6
4.1Bank of China Ltd 4
6 5▼
3,181.2 4.0 -0.21.4
14.0▼ 13.0▼ 0.6 ▲▼
▲8.1 -20
▲2519 6.2
3.6Mizuho Financial Group 7 9 2,772.4
3.7-163.5 0.7 3.3
Standard Chartered PLC
▼3.2 -2.1 ▼ 26HSBC Holdings PLC 8 3 2,593.4
Sumitomo Mitsui Finl Grp Inc 10 1415-1.02.5 ▼DBS Group Holdings 9 7
▲
13-1.4
8.5 0.114.3-12 ▼
▼
-172,036.2
▲1,965.8 2.5 0.2 ▲
0.32.011 19 1,610.5 ▼4.2 -10 7.9 ▼1.3 0 - 2.3
▼2.39.0
4-0.12.0
4.9
25 1,584.0 -4 ▼2.0Bank of Taiwan 120.91.9
0.7▲
0.9 ▲7.5
Woori Financial Group 0.6 -0.1
United Overseas Bank Ltd 13 30 1,550.38.1 -0.12.6
14 10▲ 10
3.81,474.53
▼ 1.63.3
▼1.0 -0.8-4.1ICICI Bank Ltd
6.56 1,449.71.8 -0.9
▲▼
5 ▼
251.3
▼ 1.01.9
-16 ▼ 4.0-2
▼ 201.81.7 0.2
-1.8Mega Financial Holding Co 15Taiwan Cooperative Bank 16 20 1,359.5 0.04.0 1.0-14 ▼
2.3 2.1 ▲-
▲ 8.27▲ 27
1 1.58.8
▼Malayan Banking Bhd 17 51 1.6
18 15▲
ANZ Banking Group 1.6 ▼ 4.23.9 -16 -0.70.9
1.2
1.6 0.5
1,290.9-0.6
1,257.41,261.0
▼12
▼ -0.220 16 1,244.2-0.1
1.118
1 118 8 1 4
1.6
12
7
▼5.9 -12 ▼ 3.6
▼
1,198.4
1.71,201.1
1.31.5 1.2
2.31.3
421
IDBI Bank Ltd 22
▲-1▼
28
59
Fubon Financial Holding Co Ltd 19
1.8-4
-0.6
3 81
▲46.8
▼ 2.3▲
1.5 -0.9 ▼ ▼▲ 3 1.47.0
-2.89.11 ▲ ▲0 31 4 1 0▲ 1 0KB Financial Group Inc 23
Top Asia Syndicated Loans
Industrial & Comm Bank ChinaOversea-Chinese Banking
$4,470.4
$3,980.0
Air India Ltd
Marina Bay Sands Pte
Bookrunner
▲ 9 ▲6.9 -6 ▼ 2.7 1.3 0.2Mega Financial Holding Co 20 14 673.7 1.9 0.2
▲Fubon Financial Holding Co Ltd 19 22 695.7 2.0 -6.9 -6 ▼
1▲2.7 1.3 0.0
1.95.1 2.31.4 -0.4 ▼
0.7 ▲ 94 3.1
-12 ▼ 2.9Credit Suisse 18 58 732.6 2.1 1.9 ▲
▲Citi 17 7 777.7 2.2 -2.1 ▼ 8 6.1
5.3 1 ▲ 5.8 2.7 1.5-1.6 ▼
Deutsche Bank 16 24 841.0 2.4 1.2 ▲ 79 6.9 -14 ▼ 5.0 2.3
5.7 4.9 ▲Mitsubishi UFJ Financial Group 15 5 854.0 2.4 -3.1 ▼
▲ 7 5.3 3 ▲ 12.3Axis Bank Ltd 14 40 913.9 2.6 2.13 ▲ 4.6 2.1 1.7 ▲
▼China Development Bank 13 78 970.0 2.8 2.7 ▲ 4 3.1
3.8 -6 ▼ 9.1 4.2 -0.92.1 ▲
Bank of China Ltd 12 8 985.9 2.8 -1.4 ▼ 54 3.1 -1 ▼ 7.1 3.3
1.5 -1.6 ▼Malayan Banking Bhd 11 32 994.6 2.8 2.1 ▲
▲ 3 2.3 0 - 3.3ICICI Bank Ltd 10 17 1,012.5 2.9 1.3-2 ▼ 6.3 2.9 -0.5 ▼
▲Oversea-Chinese Banking 9 11 1,123.3 3.2 0.2 ▲ 6 4.6
2.3 2 ▲ 6.7 3.1 2.3-1.8 ▼
Industrial & Comm Bank China 8 38 1,155.9 3.3 2.7 ▲ 312 9.2 -15 ▼ 4.2 1.9
3.1 2.0 ▲ANZ Banking Group 7 6 1,261.0 3.6 -1.0 ▼
▲ 7 5.3 0 - 6.6United Overseas Bank Ltd 6 12 1,276.3 3.6 1.5-8 ▼ 7.4 3.4 -0.6 ▼
▼Sumitomo Mitsui Finl Grp Inc 5 9 1,607.2 4.6 0.5 ▲ 11 8.4
9.9 -9 ▼ 8.8 4.1 -3.01.9 ▲
DBS Group Holdings 4 2 1,903.7 5.4 -1.4 ▼ 1317 13.0 -13 ▼ 12.4 5.7
6.0 -1.2 ▼Mizuho Financial Group 3 4 2,302.8 6.5 0.9 ▲
▼ 24 18.3 -17 ▼ 13.012.6 5.8 0.9 ▲
HSBC Holdings PLC 2 1 2,319.0 6.6 -4.60.5 ▲ 18 13.7 -17 ▼
2012 Rank
2011 Rank
MarketShare %# of Deals Fees
MarketProceeds Share % Share Ch. Share %
Standard Chartered PLC 1 3 2,520.4 7.2
Market # ofDeals
Jan 1 - Jun 29
Market Change in Share Ch.
Asia Loans - Bookrunners (US$, EURO, JPY, A$, HK$ & S$) (S3i)
Manager MarketProceeds per Bookrunner (US$m) # of Deals per Arranger Imputed Fees (US$m) ▼ ▲28.7
3.31.3
5.8▼ 55 13.1 -25.6
8.4 39.5 7.733.514 ▲
5.6
▼9
-1.95.76.5
-7▲China Development Bank 2 53 6,776.6
4,286.6 3.7
3.2
43
Share Ch.
6,506.5
1 1.61 13,260.6
24
▲
Share % # of Deals
5.4▼
2
Share %Market Market Manager
11.4 35▲
Change in # ofMarket MarketShare Ch.Fees Share %
Market
-26.0%
Deals
▲Industry % Change from Same Period Last Year -37.0% ▼
United Overseas Bank Ltd
2012 Rank
-1.6Bank of China LtdKorea Development BankMalayan Banking Bhd
HSBC Holdings PLC
5 20
9 8
11
6
Axis Bank LtdStandard Chartered PLC
Imputed Fees (US$m)
Jan 1 - Jun 29
1,118.8 1.4 3.811.3
1 ▲ ▲1.3 ▲ 0.3
0.31.4 1.0▲1.3
1.0
-0.3267.6
-132.9 0.84.4
▼77.4 10.1
90.1 ▲3 1.0 3 ▲
▼▲
923.0
▼▼
-10.4%27.4%
3.3
▲▼
68.3 ▲100.0108100.0 307 390.0
KB Financial Group Inc
25
-
11
23
2011 Rank
Top Twenty Five Total
Mandated Arranger ProceedsState Bank of India
Industry % Change from Last Quarter 20.1%
Asia Loans - Mandated Arrangers (All Currencies) (S5b)
24
Bookrunner Total
Citi61,856.6
- 1,020.5
80,369.0
Bank of Communications Co Ltd
-10.5%
Proceeds per Mandated Arranger (US$m) # of Deals per Arranger
1.2 -1.2 ▼
3.6
16.63.4 -0.2 ▼▼ 44
16 ▲2.4
5.92.7 ▲ 29 6.919
-0.2 ▼ 37 8.8
▲4.5 -5 ▼ 16.3
30.5
3,677.4Sumitomo Mitsui Finl Grp Inc 6 5DBS Group Holdings
3,998.07
4,003.8▲-28
▲3.4 2.110.5
▲3.2
▼ 58▼
3.2▼ 13.1 -1.3
0.42.6-27
-▲
12.18 3 3,667.5 3.2 -30 ▼-1.6
0.013.8 0.122.4 4.4
16.2 3.27.4 2.4-123,647.1
Mizuho Financial Group0.23.1
3,630.510 9Oversea-Chinese Banking
▲ 2.2 0.63.0433.1 0.8
▼0.2 ▲
▲▼
31
3,471.9▲
7.4 -12 ▼ 11.2 ▲10.3 -28
0.211 31
-0.711.0 -0.819.8 3.9-45 ▼462.9 ▼
32▼ 27.4
▼5.3 ▼-53.810 3,337.1
7
-1.4 ▼2.92.4 -0.6 ▼
▲
-5 ▼▲ 11
12 4 3,341.6160.113
7.0Mitsubishi UFJ Financial Group 14 2,735.8CIMB Group Sdn Bhd 15 38 2,145.8 1.8 1.1 ▲
7.6 -35 ▼ -0.40.5
10.5 2.01.42.6
ANZ Banking Group 16 13 2,114.7 1.8 -0.5
KB Financial Group Inc 18 110 1,569.7RHB 17 70 2,064.5 ▲
▼1.6-29 ▼1.9 1.89.1 1.26.7 -0.38.3
0.81.8 0
▼ 28-
1.48
0.51.3 ▲▲1.6
2 ▲3.8-2 ▼7.2 -16 ▼ 4.1 0.8
0.8▼
ICICI Bank Ltd 20 16 1,511.81.3 -0.630-1.2 ▼
-0.5 ▼ 1.46 ▼3.9 0.8▼ -3.2▲32 0.17.6
Mega Financial Holding Co-3
19 12 1,529.31.3
4.022 18 1,373.2
1.2-4
▲0.2-0.12.3
Taiwan Cooperative Bank 21 26 1,380.5Woori Financial Group
0.8-19 ▼
▲ 11▼1.2 -0.2 ▼ 4 1.0 ▼ 0.5
39 1,361.7
-1.00.4
5.0
1.2 0.6▲ 28 6.7
11.72.6-70
Bank of Taiwan 24 35 1,332.9Industrial & Comm Bank China 23
1.1▲
-0.1▼ 2.6 ▼0.52.3 1.9-
359.021Citi 25 15
Top Twenty Five Total 84,022.21,297.1 ▼
▲1.1 ▼ -17 -0.3 ▼4.4
▲0.9
4199.770.3
513.2 100.0Industry Total72.3 8.7
116,467.1
Industry % Change from Same Period Last Year -31.2% ▼ -23.1% ▼
126100.0
▼ -8.7%
4.9 7.8 ▲138.6-50Bookrunner Total 35,203.1 100.0 215.9
Top Twenty Total 64.124,921.2 70.9 ▲
Industry % Change from Same Period Last Year -39.7% ▼ -27.6% ▼ 1.6% ▲
131 100.0
$ ,
$3,943.8
$3,000.0
$2,524.9
$2,363.2
$2,237.5
$2,050.4
$1,983.0
$1,915.0
y
MS Commercial Pte Ltd
Alibaba Group Holding Ltd
Dana Infra Sdn
Noble Group Ltd
SK Telecom Co Ltd
Shanghai Shendi(Group)Co Ltd
1MDB Energy Ltd
Vitol Asia Pte Ltd
y gIndustry % Change from Last Quarter 26.6% ▲ -2.4% ▼ ▲44.7%
https://www.thomsonone.com
y g▲Industry % Change from Last Quarter 93.4% ▲ -1.5% ▼ 99.9%
9
------
100.02216.3
# of Deals# of Market
Deals
Proceeds per Bookrunner (US$m)
1,301.7 10.33 3 2,024.4
Jan 1 - Jun 29
Market ManagerMarket Market
54-
302.0 2.4
# of Deals per Bookrunner2012 Rank
2011 Rank Share %
23.6
222.6 ▲-0.8
4
6329.2 2.6
5
46.8
010.9
-4 ▼
10.9 1 ▲-▲
17 299.46.13.72.4
5.4-
10,945.810.9 -1.31 ▲ .4 0.6
86.7
▼
Bookrunner Total -6
20.0%
63.9100.012,632.4Top Eight Total
▼
8
-21.4%
Share Ch.1
10
12.4 2.4
2
Lloyds Bank
▼
▲
16.0 -0.8
2.4
Westpac Banking
▼▲
▼
RBC Capital MarketsMacquarie Group
▼
296.8
-4.9
33.7%
-0.7Mitsubishi UFJ Financial Group
-24.7%Industry % Change from Same Period Last Year▼▲Industry % Change from Last Quarter -9.3%
-
1.1
3.78.4
.7
▲
9
Mizuho Financial Group 7▼2.4
80.4
Top Ten Five Total▲
1.7
▲
5.2
-16
▼
3
2.11,598.1
816
210.3
1,002.5
5
HSBC Holdings PLC
1
Jan 1 - Jun 29
▲
Proceeds per Mandated Arranger (US$m)
4
27.0
4,302.3
975.8
4.6
3
51.4
-53.8%
7.8
Commonwealth Bank of AustraliaSumitomo Mitsui Finl Grp Inc
2
72
Westpac Banking
Lloyds Bank
Industry Total
JP Morgan
Commonwealth Bank of Australia
ANZ Banking Group
75
10
Asian Loans by Maturity Date
2.2
10 -0.5601.5▼ -0.7 ▼
82.0 ▲
# of Deals per Arranger
-0.3
92.0% 121.4% ▲▲25.6%
100.0100.0
2.9-0.6
▲▼ ▼
1.9
13.1
0.2
-18.2%
▲ 92.8 11▼
120.3% ▲Industry % Change from Last Quarter
▼▲ 2.3
▼4.09
▲ ▲2.91.4
5.6 2.7 -0.74.8
-2
▲
13.96.34.4
▲Mitsubishi UFJ Financial Group 6 14 1,573.1 4.5 6.6
3.823.5 1.512.1
11.25.7
4.6
▼ 24.220.141 11.5
Australia Loans - Mandated Arrangers (All Currencies) (S6a)Australia Loans - Bookrunners (All Currencies) (S7)
Share Ch.
107.3 14.0116.82.7 ▼▲ -8ANZ Banking Group
Share Ch.
First Half 2012 | Syndicated Loans | Managing Underwriters
Asia (ex-Japan) & Australia
Bookrunner Share %26.4
▲
Imputed Fees (US$m)
▲122.7-0.5
Share %
12.4
8.4-
-0.5 32
ProceedsMarket 2012
Rank
6.410
3.2 1.7 ▲
▲
160.6
National Australia Bank03,406.92
2,985.4
7.8
1,093.2
Market
-3.616.8▲ 12
-5.5 5.0
▲
-1 ▼
▼6
Change in FeesShare %
6.7-072.7▲
2 6,621.5
1
10.5 ▼▼
6.7 32.0
Imputed Fees (US$m)
▲
MarketShare %
42 15.222.616.3 -9 ▼
ProceedsMarket
118
Deals2011 Rank
14.5 0.3▼
▼ -1.7
11.8
19.1
94
3 5,018.521.9 National Australia Bank
Change in Manager# ofShare % # of Deals
50 26.5
▼4.0
Fees
2.4
35.3
▼
-4
3
-3
-2
3.9
▲
Market Market
0.52.0
Share Ch.
76.42.5
1.0 ▲
▲
1 5,664.1
17.2▲ 1
-7
4
▼▲
▼
Top Australia Syndicated Loans Jan 1 - Jun 29 2012
28,450.6
Industry % Change from Same Period Last Year -17.2%
34,686.7
Mandated Arranger
700
800
900
140
160
180
Proceeds (US$b)
# of Issues
$8,500.0
$2,226.9
$1 590 5
Australia Pacific LNG Pty Ltd
SWM Finance Pty Ltd
SDP Finco Pty Ltd
Jan 1 - Jun 29Jan 1 - Jun 29 2012 Asian Loans by Currency (%)Australian Loans Proceeds by Industry (US$m)
8,741.925%
7,082.520%
5,024.315%
4,996.714%
3,420.710%1,984.9
6%1,520.9
4%
572.92%
563.72%
393.51%206.81%
Financials
Energy and Power
Media and Entertainment
Industrials
Real Estate
Materials
Consumer Products and Services
Consumer Staples
Retail
Government and Agencies
Healthcare
43.3% 50.0% 48.4% 54.2% 55.5% 60.5% 77.0% 75.2% 62.9% 64.7%
56.7%50.0% 51.6%
45.8% 44.5%39.5%
23.0% 24.8%
37.1% 35.3%
2003 2004 2005 2006 2007 2008 2009 2010 2011 2012Local Currency G3
163.6 147.6 157.6 146.7 110.1 68.30
100
200
300
400
500
600
0
20
40
60
80
100
120
2012 2013 2014 2015 2016 2017
Proc
eeds
(US$
b)
$1,590.5
$1,496.9
$1,483.9
$1,307.3
$1,294.5
$1,230.2
$1,144.4
$1,067.1
SDP Finco Pty Ltd
Epic Energy(Australia)Pty Ltd
Transpacific Inds Grp Ltd
Adani Abbot Pt Terminal
ConnectEast Finance Pty Ltd
Foxtel Management Pty Ltd
QPH Finance Co Pty Ltd
Energy Capital Partnership
https://www.thomsonone.com
Local Currency G3
10
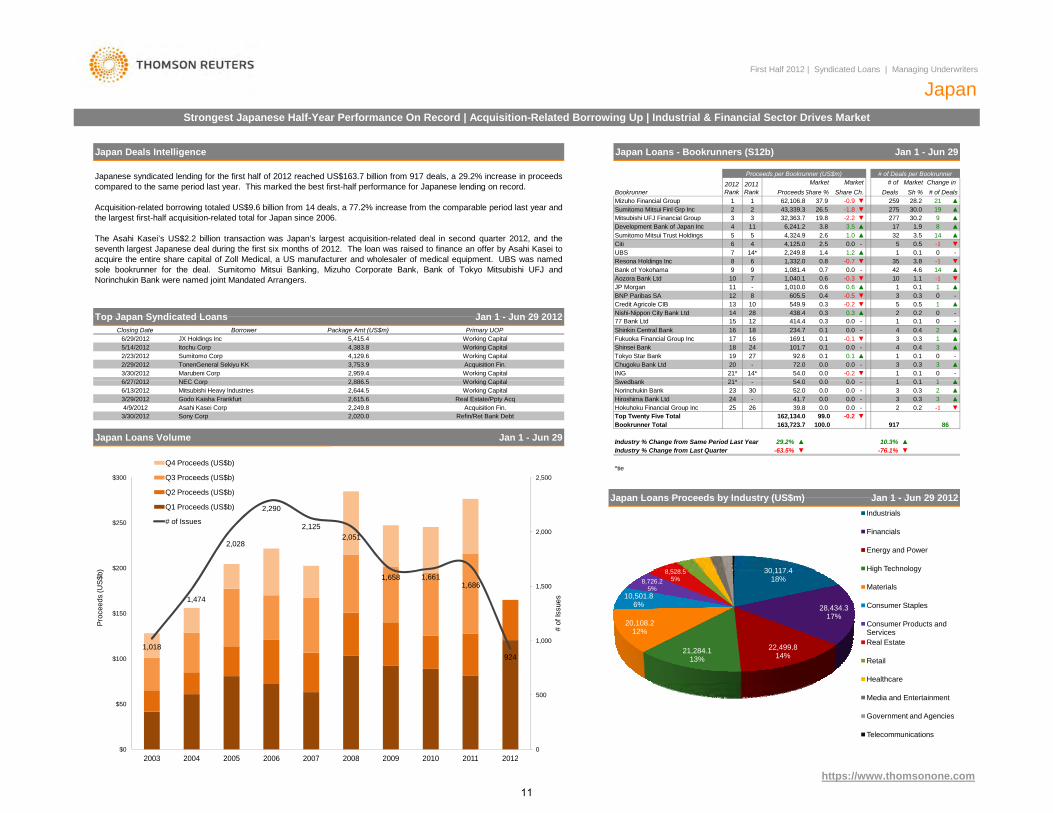
NEC C
Primary UOP
Working Capital3/30/2012
5/14/20122/23/20122/29/2012
Working CapitalAcquisition Fin.
Borrower
TonenGeneral Sekiyu KK
JX Holdings IncItochu CorpSumitomo Corp
Marubeni Corp
Jan 1 - Jun 29 2012Top Japan Syndicated LoansClosing Date
6/29/2012Working CapitalWorking Capital
Japanese syndicated lending for the first half of 2012 reached US$163.7 billion from 917 deals, a 29.2% increase in proceedscompared to the same period last year. This marked the best first-half performance for Japanese lending on record.
Acquisition-related borrowing totaled US$9.6 billion from 14 deals, a 77.2% increase from the comparable period last year andthe largest first-half acquisition-related total for Japan since 2006.
The Asahi Kasei’s US$2.2 billion transaction was Japan’s largest acquisition-related deal in second quarter 2012, and theseventh largest Japanese deal during the first six months of 2012. The loan was raised to finance an offer by Asahi Kasei toacquire the entire share capital of Zoll Medical, a US manufacturer and wholesaler of medical equipment. UBS was namedsole bookrunner for the deal. Sumitomo Mitsui Banking, Mizuho Corporate Bank, Bank of Tokyo Mitsubishi UFJ andNorinchukin Bank were named joint Mandated Arrangers.
4,383.8
2,959.42 886 5 W ki C it l6/27/2012
2772.0
0.1101.7
4,129.63,753.9
-
Package Amt (US$m)5,415.4
1.9
BNP Paribas SA
8 0.8
-
1,081.49 0.7
First Half 2012 | Syndicated Loans | Managing Underwriters
JapanStrongest Japanese Half-Year Performance On Record | Acquisition-Related Borrowing Up | Industrial & Financial Sector Drives Market
Japan Deals Intelligence
7 1.4Citi
Nishi-Nippon City Bank Ltd
Bank of Yokohama 90.6
-
0.3
7
8 605.511
-0.3
Chugoku Bank Ltd
12
-2.2
JP Morgan
Credit Agricole CIB 13
4
10
UBS
19.8
6
115
Mizuho Financial Group
Sumitomo Mitsui Trust Holdings
37.943,339.3
3
0.0
54.0
6
1,040.1
169.1
0 054 00.0
92.624
12
4
1,332.0
26.5
2,249.8
Change in
Jan 1 - Jun 29
21
Market Market
Japan Loans - Bookrunners (S12b)
Deals62,106.81
Share %▼
Proceeds per Bookrunner (US$m)
Bookrunner Share Ch.Proceeds2011 Rank
2012 Rank
-0.9
# of
Sumitomo Mitsui Finl Grp Inc 2
56,241.2
32,363.7Development Bank of Japan IncMitsubishi UFJ Financial Group 3
27528.2
# of Deals per BookrunnerMarket
3.8 3.5 ▲8
# of Deals
-1.8
Resona Holdings Inc
Sh %
9
▲
▼ 277▲▲
30.030.2
17
259
4,125.0
19▼
14
Aozora Bank Ltd 10
-0.7
▲
1.22.5
14*
3.52.65- 0.5
549.9438.4 0.3
0.6 0.6
0.0
▲‐1 ▼
1.04,324.9
-0.0
▲ 32
▲▼
‐1
‐11
14▼
0.1▲ 0
▲-
▼3542 4.6
▼
3.8
110
0.1
1.1
0▲
-
▼1
0.30.50.2
15 414.414
▲
0.1
12▲
1,010.03
28
40.3
-
-0.5
0.3-0.2
0.45▼2 -
-▲0.4 2▲0.3 1
001
0.1
0 1 1
3
1
4
▼ 00.3
▲-0.0
11
0.113
0.13
0▲0.4
▲-
▲
3-0.20.00.0
Shinkin Central Bank
-19
Shinsei Bank 18
234.7 0.1
Tokyo Star Bank20
77 Bank Ltd16
16Fukuoka Financial Group Inc ▼-0.1
0.0
0.118
170.1
14*21*S db kING
-
21* 0 0
*tie
NEC Corp
Refin/Ret Bank DebtAsahi Kasei CorpSony Corp 2,020.0
Hokuhoku Financial Group IncAcquisition Fin.
Mitsubishi Heavy IndustriesGodo Kaisha Frankfurt Real Estate/Ppty Acq
Working CapitalHiroshima Bank Ltd
2,644.52,886.5 Working Capital
4/9/2012 2,249.8
6/27/20126/13/20123/29/2012
3/30/2012
2,615.6 24Norinchukin Bank
162,134.0
-
▲
86
Japan Loans Proceeds by Industry (US$m)
Japan Loans Volume
0.054.0
Top Twenty Five Total
0.1 1
2-
-
0.0
1
0.03-230.0
▲▲0.323
Swedbank -30
0.20.0
21*0.0
25 26
52.0-
0.0
10.3%
▲0.341.7▼
3‐10.0
100.0163,723.7 91799.0 ▼
-63.5% ▼29.2%Industry % Change from Same Period Last Year ▲
-0.239.8
Jan 1 - Jun 29▼
Bookrunner Total
-76.1%
Jan 1 - Jun 29 2012
Industry % Change from Last Quarter
1,018
1,474
2,028
2,290
2,1252,051
1,658 1,6611,686
924
0
500
1,000
1,500
2,000
2,500
$0
$50
$100
$150
$200
$250
$300
2003 2004 2005 2006 2007 2008 2009 2010 2011 2012
# of
Issu
es
Proc
eeds
(US$
b)
Q4 Proceeds (US$b)
Q3 Proceeds (US$b)
Q2 Proceeds (US$b)
Q1 Proceeds (US$b)
# of Issues
30,117.418%
28,434.317%
22,499.814%21,284.1
13%
20,108.212%
10,501.86%
8,726.25%
8,528.55%
4394.43%
4106.43%2904.4
2%2758.8
2%434.20%
Industrials
Financials
Energy and Power
High Technology
Materials
Consumer Staples
Consumer Products and ServicesReal Estate
Retail
Healthcare
Media and Entertainment
Government and Agencies
Telecommunications
https://www.thomsonone.com2003 2004 2005 2006 2007 2008 2009 2010 2011 2012
11
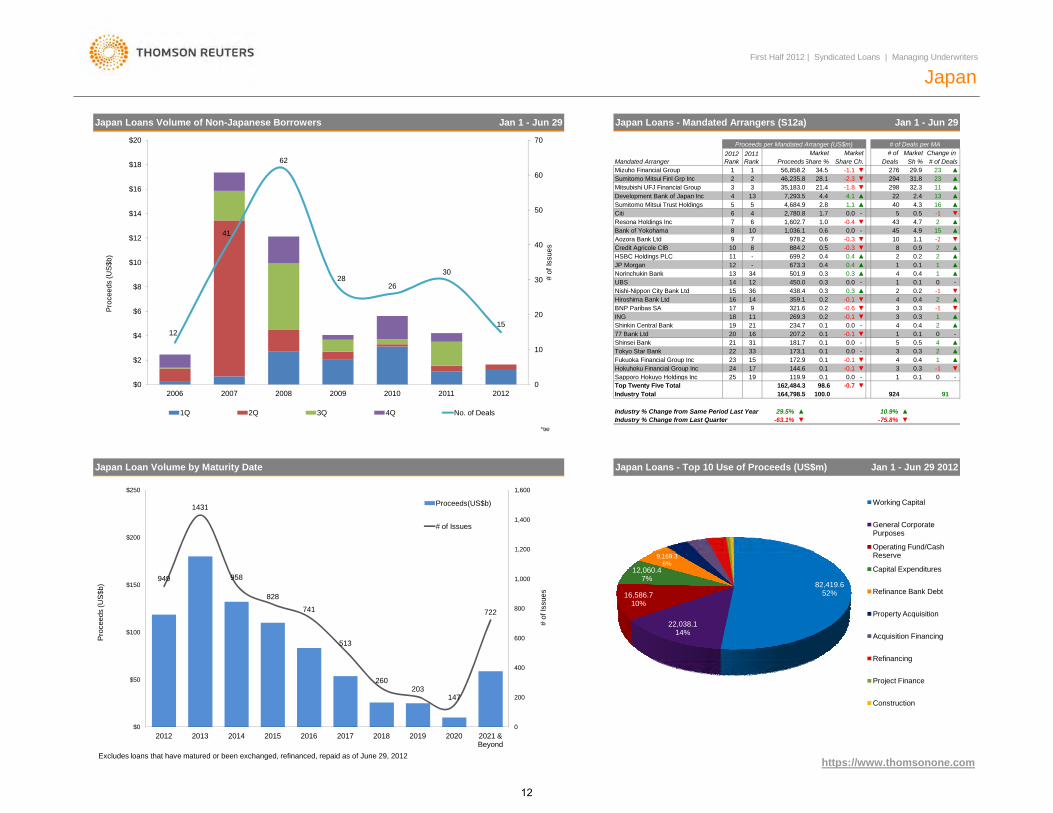
Japan
Japan Loans Volume of Non-Japanese Borrowers
-
4
Jan 1 - Jun 29
▼
15
18
450.0
Shinsei Bank
0.3
Bank of Yokohama
JP Morgan
-0.3
12
77 Bank Ltd
172.9
HSBC Holdings PLC
Aozora Bank Ltd10
13
181.7
21
10
673.3
17359.1
34
9 0.2
12
ING
207.2
UBS
0.1
11
▲▲8
9Credit Agricole CIB
▼
4
▲-
438.4
Norinchukin Bank
11
14
173.1
Hokuhoku Financial Group Inc
20
321.6
2333
16
-17 -0.1144.6 315
1
4-0.1
0.10.0‐1
0.1
0.1
0.0
- 024
19 119.9
Nishi-Nippon City Bank Ltd0.2
Sapporo Hokuyo Holdings Inc 25
234.7
16Hiroshima Bank LtdBNP Paribas SA
Shinkin Central Bank
0.4
0.1
▲2-1
0.3▲
3▼
0.4-
4
0.0
0.50.1-0.1
0.0
▼
▲0.4
▲2
-0
▲-
▼
5
-0.6-0.1269.3
0.3
▼1‐1
▲
‐12
1
▼
‐24.9
2
20.1 0
0.3
1
0.2
3
▲2.4
2
1
0.2
4.7
1
▲▼
▲
2
0.40.4 ▲
▲0.1
0.3▲
2699.2 0.4
1.110▼-0.30.5
0.60.9
45-0.61,036.1
8884.2978.2
4-0.4
7
-8
-
6 1,602.70.0
0.4
▼1.0
▼
▲
134,684.92,780.8
2.855
40‐1
▲1.10.5-0.0
164.313227,293.5
1.7
23
Market
▲32.3
Market
23
4 4.4 4.121.4 -1.8
235,183.0
# of Deals per MA
Proceeds
3 346,235.8 28.1 -2.3 ▼
▼
# of Deals
▲
298
▼43
Japan Loans - Mandated Arrangers (S12a) Jan 1 - Jun 29
29.9Mandated Arranger
▲
Change in
1436
Deals-1.1
15
▲294 ▲
1131.8
0.10.2
34
▲
0.3▼
0.30.0 1
Proceeds per Mandated Arranger (US$m)2011 Rank Share Ch.
▼
2012 Rank
Mizuho Financial Group 1
▼
Sumitomo Mitsui Finl Grp Inc
Fukuoka Financial Group Inc
0.3
31 0.1
0.1Tokyo Star Bank
-0.1
First Half 2012 | Syndicated Loans | Managing Underwriters
2
Sh %Market
34.5
Resona Holdings Inc6
Mitsubishi UFJ Financial Group
Sumitomo Mitsui Trust Holdings
56,858.2
Citi
1
5Development Bank of Japan Inc
7
2122
19
# of
501.9
Share %
0.4
0.3
276
12
41
62
2826
30
15
10
20
30
40
50
60
70
$2
$4
$6
$8
$10
$12
$14
$16
$18
$20
# of
Issu
es
Proc
eeds
(US$
b)
*tie
Japan Loan Volume by Maturity Date
91
Japan Loans - Top 10 Use of Proceeds (US$m)
pp y g
-63.1%
100.0162,484.3 ▼
Industry % Change from Last Quarter
Top Twenty Five Total
Industry % Change from Same Period Last Year
Industry Total
▲29.5%
164,798.5
▼ -75.8% ▼
98.6
10.9%
-0.7
▲
924
https://www thomsonone com
Jan 1 - Jun 29 2012
0$02006 2007 2008 2009 2010 2011 2012
1Q 2Q 3Q 4Q No. of Deals
949
1431
958
828
741
513
260203
147
722
0
200
400
600
800
1,000
1,200
1,400
1,600
$0
$50
$100
$150
$200
$250
2012 2013 2014 2015 2016 2017 2018 2019 2020 2021 & Beyond
# of
Issu
es
Proc
eeds
(US$
b)
Proceeds(US$b)
# of Issues
Excludes loans that have matured or been exchanged, refinanced, repaid as of June 29, 2012
82,419.652%
22,038.114%
16,586.710%
12,060.47%
9,169.36%
5,660.83%
5079.63%
4871.63%
936.81%
915.91% Working Capital
General Corporate Purposes
Operating Fund/Cash Reserve
Capital Expenditures
Refinance Bank Debt
Property Acquisition
Acquisition Financing
Refinancing
Project Finance
Construction
.
https://www.thomsonone.com
12
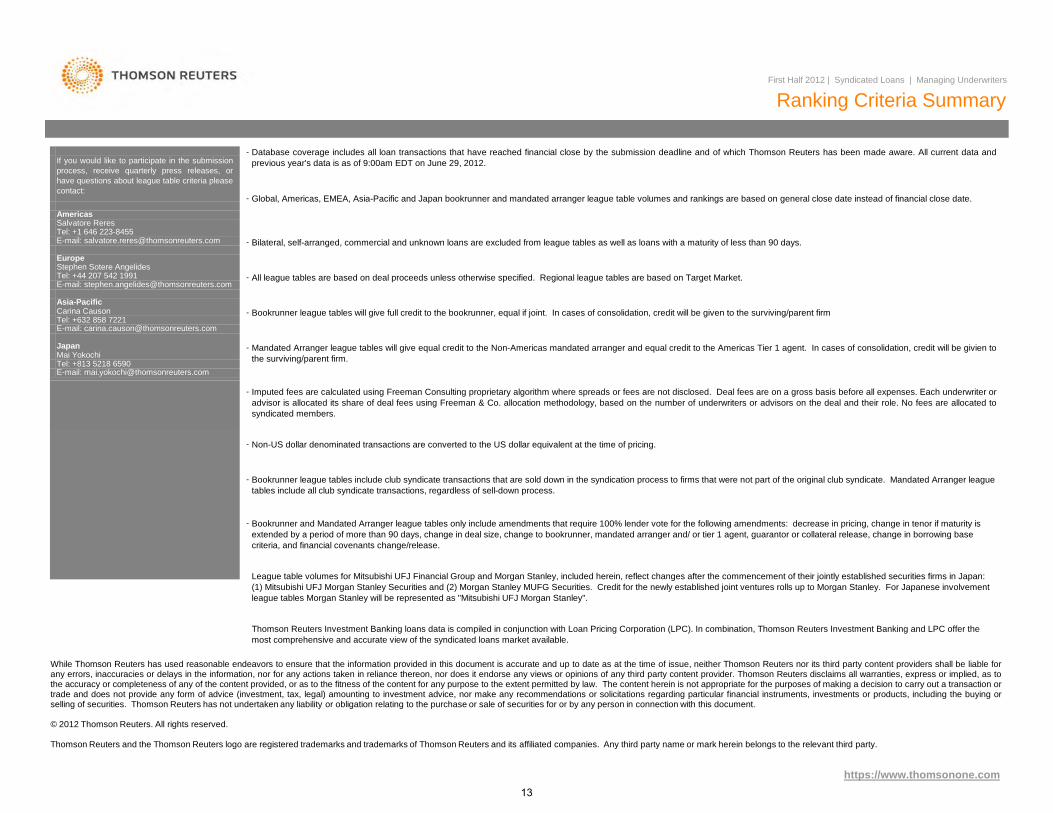
-
-
-
-
-
-
Stephen Sotere AngelidesTel: +44 207 542 1991E-mail: [email protected]
Asia-PacificCarina CausonTel: +632 858 7221E-mail: [email protected]
Europe
If you would like to participate in the submissionprocess, receive quarterly press releases, orhave questions about league table criteria pleasecontact:
AmericasSalvatore ReresTel: +1 646 223-8455
First Half 2012 | Syndicated Loans | Managing Underwriters
Ranking Criteria Summary
E-mail: [email protected]
JapanMai YokochiTel: +813 5218 6590
E-mail: [email protected]
Global, Americas, EMEA, Asia-Pacific and Japan bookrunner and mandated arranger league table volumes and rankings are based on general close date instead of financial close date.
Database coverage includes all loan transactions that have reached financial close by the submission deadline and of which Thomson Reuters has been made aware. All current data andprevious year's data is as of 9:00am EDT on June 29, 2012.
Mandated Arranger league tables will give equal credit to the Non-Americas mandated arranger and equal credit to the Americas Tier 1 agent. In cases of consolidation, credit will be givien tothe surviving/parent firm.
Bookrunner league tables will give full credit to the bookrunner, equal if joint. In cases of consolidation, credit will be given to the surviving/parent firm
All league tables are based on deal proceeds unless otherwise specified. Regional league tables are based on Target Market.
Bilateral, self-arranged, commercial and unknown loans are excluded from league tables as well as loans with a maturity of less than 90 days.
-
-
-
- Bookrunner and Mandated Arranger league tables only include amendments that require 100% lender vote for the following amendments: decrease in pricing, change in tenor if maturity is extended by a period of more than 90 days, change in deal size, change to bookrunner, mandated arranger and/ or tier 1 agent, guarantor or collateral release, change in borrowing base criteria, and financial covenants change/release.
Imputed fees are calculated using Freeman Consulting proprietary algorithm where spreads or fees are not disclosed. Deal fees are on a gross basis before all expenses. Each underwriter oradvisor is allocated its share of deal fees using Freeman & Co. allocation methodology, based on the number of underwriters or advisors on the deal and their role. No fees are allocated tosyndicated members.
Thomson Reuters Investment Banking loans data is compiled in conjunction with Loan Pricing Corporation (LPC). In combination, Thomson Reuters Investment Banking and LPC offer the most comprehensive and accurate view of the syndicated loans market available.
League table volumes for Mitsubishi UFJ Financial Group and Morgan Stanley, included herein, reflect changes after the commencement of their jointly established securities firms in Japan: (1) Mitsubishi UFJ Morgan Stanley Securities and (2) Morgan Stanley MUFG Securities. Credit for the newly established joint ventures rolls up to Morgan Stanley. For Japanese involvement league tables Morgan Stanley will be represented as "Mitsubishi UFJ Morgan Stanley".
Bookrunner league tables include club syndicate transactions that are sold down in the syndication process to firms that were not part of the original club syndicate. Mandated Arranger league tables include all club syndicate transactions, regardless of sell-down process.
Non-US dollar denominated transactions are converted to the US dollar equivalent at the time of pricing.
While Thomson Reuters has used reasonable endeavors to ensure that the information provided in this document is accurate and up to date as at the time of issue, neither Thomson Reuters nor its third party content providers shall be liable forany errors, inaccuracies or delays in the information, nor for any actions taken in reliance thereon, nor does it endorse any views or opinions of any third party content provider. Thomson Reuters disclaims all warranties, express or implied, as tothe accuracy or completeness of any of the content provided, or as to the fitness of the content for any purpose to the extent permitted by law. The content herein is not appropriate for the purposes of making a decision to carry out a transaction ortrade and does not provide any form of advice (investment, tax, legal) amounting to investment advice, nor make any recommendations or solicitations regarding particular financial instruments, investments or products, including the buying orselling of securities. Thomson Reuters has not undertaken any liability or obligation relating to the purchase or sale of securities for or by any person in connection with this document.
© 2012 Thomson Reuters. All rights reserved.
Thomson Reuters and the Thomson Reuters logo are registered trademarks and trademarks of Thomson Reuters and its affiliated companies. Any third party name or mark herein belongs to the relevant third party.
https://www.thomsonone.com13
Thomson Reuters Solutions for the Deal Making Community
FOR INVESTMENT BANKERS
Thomson Reuters Advanced Analytics for deal making improves efficiency at every step, from screening and targeting, to comparables analysis, building league tables, valuing a company and developing a client pitch book. This set of analytical and presentation tools enables you to undertake all these key tasks without having to leave Microsoft Office®. You can also access our key content sets easily to support your analysis.
ThomsonONE.com Investment Banking is our flagship desktop solution that combines real-time market data and Reuters news with our world class reference data. It includes access to Recent Deals, Active Acquirers and M&A New Issues terms and conditions.
FOR JUNIOR BANKERS
SOLUTION FOR• Managing Client Relationships• Deal Origination• New Issues Pre-Marketing / Roadshows
• Financial Modeling• Customized League Tables • Simple Deals screening • Valuation analysis and comparable deal screening • Full integration into Microsoft Office® for on-brand pitch book creation
SOLUTION FOR
FOR INFORMATION PROFESSIONALS, MARKET DATA, RESEARCHSDC Platinum is the world’s foremost financial transactions database, covering new issues, M&A, syndicated loans, private equity, project finance, poison pills, and more.
• Market Analysis & Trends (Geography, Sector, Asset Class, Deal Type, Deal Size, etc.)• Deal Origination (Debt Maturity Analysis, Company Lifecycle including Private Equity)• Pitch Creation (Firm Credentials, Representative Acquirors)• M&A Targeting (Active Strategic/Sponsor Acquirors, Target Company Screener)• Negotiation (T&C Benchmarking)
Microsoft, Office, Word, Excel and PowerPoint are either registered trademarks or trademarks of Microsoft Corporation in the United States and/or other countries. Copyright 2012 Thomson Reuters. All rights reserved. 48003848 0312.
SOLUTION FOR
Access unique analysis for free anytime using Thomson ReutersDeals Intelligence website and receive regular updates,delivered direct to your inbox.Go to online.thomsonreuters.com/dealsintelligence
SOLUTION FOR
FOR STRATEGY AND PLANNING TEAMS
To purchase individual Thomson Reuters Deals or League Table reports,please contact our Thomson Reuters On Demand group:Web: http://financial.thomsonreuters.com/ondemandEmail: [email protected]
Send us a sales enquiry at: financial.thomsonreuters.com/salesRead more about our products at: financial.thomsonreuters.com/products
Thomson Reuters Deals Business Intelligence enables you to slice and dice our renowned Deals and Fees data to create ad hoc reports, analyze market trends, benchmark your performance and identify opportunities – all within a tool built into your workflow in Excel®, saving you valuable time and giving you a competitive edge.
• Conducting market analysis and identifying trends• Benchmarking your performance and monitoring competitors• Targeting clients by wallet size and banking relationship• Allocating resources more effectively by evaluating and analyzing lost deals
14