Embed Size (px)
Citation preview
International Journal of Business Marketing and Management (IJBMM)
Volume 4 Issue 6 June 2019, P.P. 13-35
ISSN: 2456-4559
www.ijbmm.com
International Journal of Business Marketing and Management (IJBMM) Page 13
Synergizing Growth in A Multi-National Enterprise
Joel Bigley Assistant Professor at California Baptist University, USA
Abstract: The findings of the study suggested that growth is the goal of synergy exploitation. Growth is typically seen in forecasted and realized revenues at a suitable profit margin. Growth synergies, when experienced, will
improve financial performance depending on the revenue opportunity. To ensure profitability, revenue must be
pursued with a margin in mind. Each organizational leader needs to be able to stimulate revenue locally and
globally. Twenty-three propositions were extracted from the participants instigated by a precipitated event that contributed to theory on growth leadership in a multinational with a global supply chain. The result is outcomes
that are influenced by growth leadership. These are described in detail and are useful for understanding the
achievement of sustained corporate advantage across shortened product and service life-cycles.
Keywords:growth leadership; market synergies; competitive advantage; growth synergies; life-cycles; sustained
advantage.
I. Introduction to Synergies
The importance of exploiting synergies in multi-unit firms has been emphasized by researchers for
decades as part of the decision-making process regarding mergers and acquisitions (Larsson & Finkelstein,
1999) and for cross-business collaboration in multi-business firms (Ansoff, 1965; Martin, 2002; Porter, 1985).
The etymological roots of the word „synergy‟ are in the Greek word „synergia‟, or „together work‟ (Boyd
&Headen, 1978, “Synergy”, n.d.). The term is refined further by Fuller (1975) in three ways; (a) where
combined action is favored over the sum of individual actions, (b) where the behavior of whole systems is
unpredictable in relation to the behavior of each part, and (c) where the cooperative behavior of two or more
stimuli results in a different or greater response than the sum of the individual stimuli. Ansoff (1965) is credited
with bringing this concept of combined action into strategic management. He describes the effect of synergy as the effect of a whole being greater than the sum of its individual parts while understanding that there is a cost
associated with combining the parts (Sourabh, n.d.). Martin and Eisenhardt (2001) further define cross-business
synergies as “the value that is created and captured, over time, by the sum of the businesses relative to what it
would be separately” (p. 3). Other scholars express the value added by synergies between dimensions in a
business structure. A substantial contributor is cross-business unit collaboration. Most research suggests that the
differences between firm performances are attributable to industry or business level effects (Rumelt, 1991);
however, more recent studies have suggested substantial corporate effects (Bowman &Helfat, 2001; Roquebert,
Phillips & Westfall, 1996). Furthermore, a more recent study by Anand and Byzalov (2007) suggests that cross-
business synergies do exist.
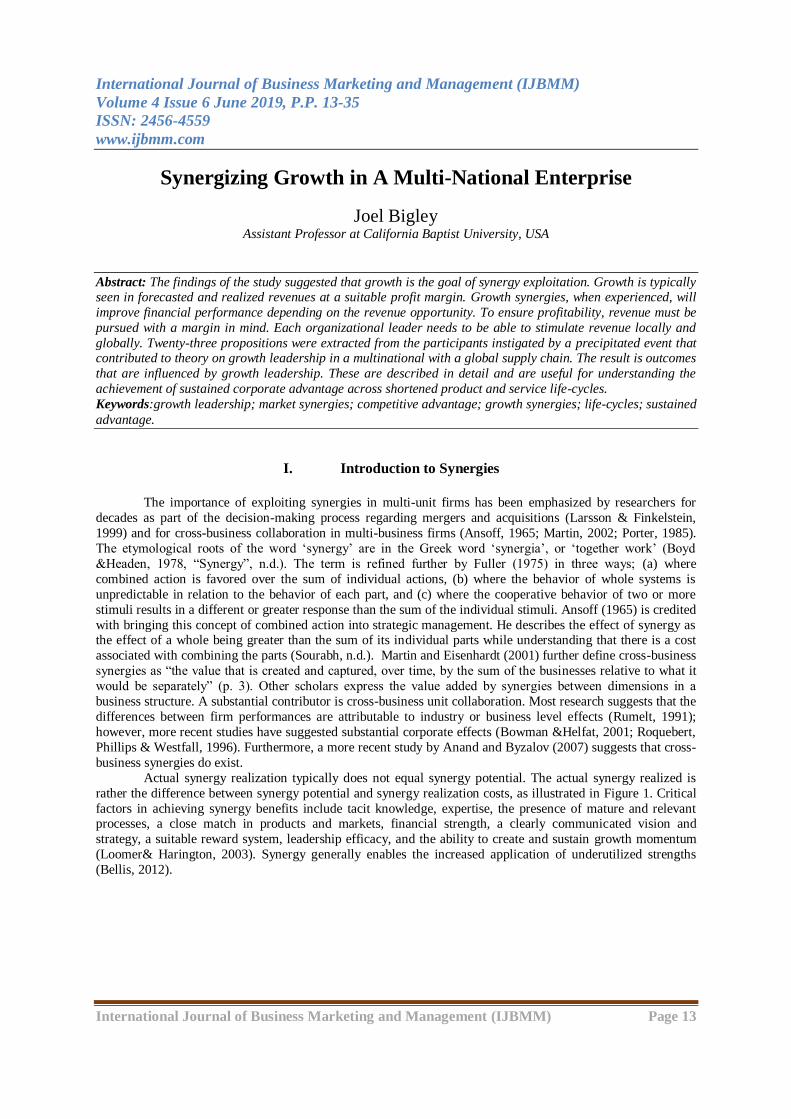
Actual synergy realization typically does not equal synergy potential. The actual synergy realized is
rather the difference between synergy potential and synergy realization costs, as illustrated in Figure 1. Critical
factors in achieving synergy benefits include tacit knowledge, expertise, the presence of mature and relevant processes, a close match in products and markets, financial strength, a clearly communicated vision and
strategy, a suitable reward system, leadership efficacy, and the ability to create and sustain growth momentum
(Loomer& Harington, 2003). Synergy generally enables the increased application of underutilized strengths
(Bellis, 2012).
Synergizing Growth in a Multi-National Enterprise
International Journal of Business Marketing and Management (IJBMM) Page 14
Figure 1. Realized synergy advantage.
This figure illustrates the value of a synergistic opportunity that is exploited.
II. Growth Synergies
The exploitation of growth synergies can lead to profitability, pricing power in the market place, the
ability to leverage strengths, and scalability with minimal cost. Growth synergy has been neglected in the
literature. However, operative synergies, prevalent in the literature, represent sustained performance advantages
of multi-business firms that leverage operative resources across businesses that exhibit relatedness. According to
Mueller-Stewens and Knoll (2006) they are typically prioritized on corporate agendas. Unfortunately, growth
synergies are typically explored through the lens of product and service diversification. Empirical studies typically use operative synergies for describing the impact of relatedness, as described by the presence of similar
activities and shared resources at various points of the value chain (Davis & Thomas, 1993). Relatedness is
discussed at length and may also exist between business units of diversified firms (Amit &Livnat, 1988; Berger
&Ofek, 1995; Christensen & Montgomery, 1981; Grant &Jammine, 1988; Lang &Stulz, 1994;
Ramanujam&Varadarajan, 1989; Rumelt, 1982; Simmonds, 1990).
III. Market Synergies
Conglomerate power, also known as market power synergies, are profitability-based advantages of
multinational firms that are exploited by leveraging relatedness across businesses and market power resources (Dutta, Dutta, & Das, 2011; Martin &Eisenhardt, 2001). Market power resources include all sources the firm
uses for reducing competition and increasing prices. This synergy is achieved through several means, including
mutual forbearance, complementary products, reciprocal buying and selling, bundling, and predatory pricing
(Bernheim&Whinston, 1990; Grant, 1988; Karnami&Wernerfelt, 1985). Predatory pricing occurs when a firm
drives competitors out of the market by selling product or services at below market rates and conceding profits
in one or more business for enabling another business to gain revenue or market share. Short term losses for
long term gain are deemed tolerable. This tactic may also deter new competitors from entering the market.
Bundling is selling the products together to extend the monopoly power of one business into another related
business. Bundling may also be considered to be a form of predatory pricing. Reciprocal buying and selling
happens when a potential customer is a supplier to another business. The firm establishes an advantageous
buying and selling relationship to gain revenue in a supply chain. Mutual forbearance and collusion are similar.
This beneficial economic situation occurs when multinationals keep prices high through regular contact with multi-market competitors. For example, a product may be ceded to a competitor with the understanding that a
concession is made for another product. Or, a predatory pricing scenario for a product may be enacted by a
market leader in a competitor‟s market when the leader encourages a competitor to retreat from a market they
recently penetrated that is dominated by the leader. Multi-unit businesses with substantial market share are at an
advantage, as single-unit firms are not able to exploit these opportunities for corporate advantage. Market power
Synergizing Growth in a Multi-National Enterprise
International Journal of Business Marketing and Management (IJBMM) Page 15
synergies can contribute to corporate advantage; however, anti-trust laws and other factors may restrict
opportunity exploitation (Devos, Kadapakkam& Krishnamurthy, 2009).
IV. Sustainable Growth
Corporate initiatives are dedicated to growth synergy opportunities; however, the sustainable
realization of growth synergies has received little attention in literature, despite often being identified as a goal
for managers (Amit &Livnat, 1988; Bettis, 1981; Eisenhardt&Galunic, 2000; Martin, 2002; Palich, Cardinal, &
Miller, 2000; Ramanujam&Varadarajan, 1989), thereby ultimately leading to unrealized value (Goold&
Campbell, 1998). Specifically, research on diversification concerned with operative synergies explores the
strategic rationale of related diversification (Davis & Thomas, 1993; Tanriverdi&Venkatraman, 2005), but does
not reveal anything about realization. It assumes that cross-business synergies are observed in organizational
constructs and that they are easily realizable when in fact they are complex and difficult to achieve. With the
exception of Martin (2002), research is too empirically immature to provide adequate insight into growth
synergy realization from resource combination, or the unique and timely combination of the elements of the
synergies previously discussed.
Synergy realization costs include both direct and indirect costs. Direct costs could include the cost of coordination and control, while indirect costs may relate to the need for a compromise or an adaptation
(Campbell &Goold, 2000). Coordination costs may be visible in costs associated with collaborative linkages
between business units (Porter, 1985). This could include management time, the cost of a designated liaison, the
cost of an embedded team, the cost of integrating sales forces, human resource related costs, marketing costs,
moving costs, culture assimilation costs, costs of standardization, the cost of outsourcing, or costs associated
with the installation and maintenance of enterprise resource planning (ERP) systems (Loomer& Harington,
2003; Zhou, 2011). Business level managers may spend a significant amount of their disposable time meeting
and negotiating with other business managers for coordinating activities, problem-solving, and making
decisions. Resources for exploiting opportunities may not be easy to share due to specialization, for example
(Teece, 1980). Corporate costs may increase for the same reasons if escalation is needed (Hill, Hitt, &
Hoskisson,1992; Michel &Hambrick, 1992). Furthermore, corporate-level behavior may be unproductive due to self-interest. For example, disruptive technologies that self-cannibalize, or inequitable intercompany pricing,
may be deliberate in the business in order to prop up a favored unit or help penetrate a new market. Corporate
managers may not be capable of resolving conflict as they are not fully aware of the situation and do not have
the needed operational skills for understanding the impact of a decision. These managers typically do not have
to deal with collateral damage wherever it may occur. This damage may lead to less than optimal decisions,
frustrating and alienating business unit managers (Goold& Campbell, 1998; Gold &Luchs, 1993; Michel
&Hambrick, 1992; Vancil, 1980). Business unit managers may also be frustrated by imposed decisions and the
requirement to resource share (Beer, 1964; Fleishman & Harris, 1962; Gupta &Govindarajan, 1986;
Tannenbaum, 1962,) or redeploy (Cappron, 1999). This overall organizational inertia introduces waste that
results in additional cost and smaller profits.
V. Competitive Advantage When competitive advantage creates a higher economic value for the firm than its rivals can produce,
cross-unit synergies contribute to corporate advantage (D‟Aveni,Dagnino, & Smith,2010). The opportunities, as
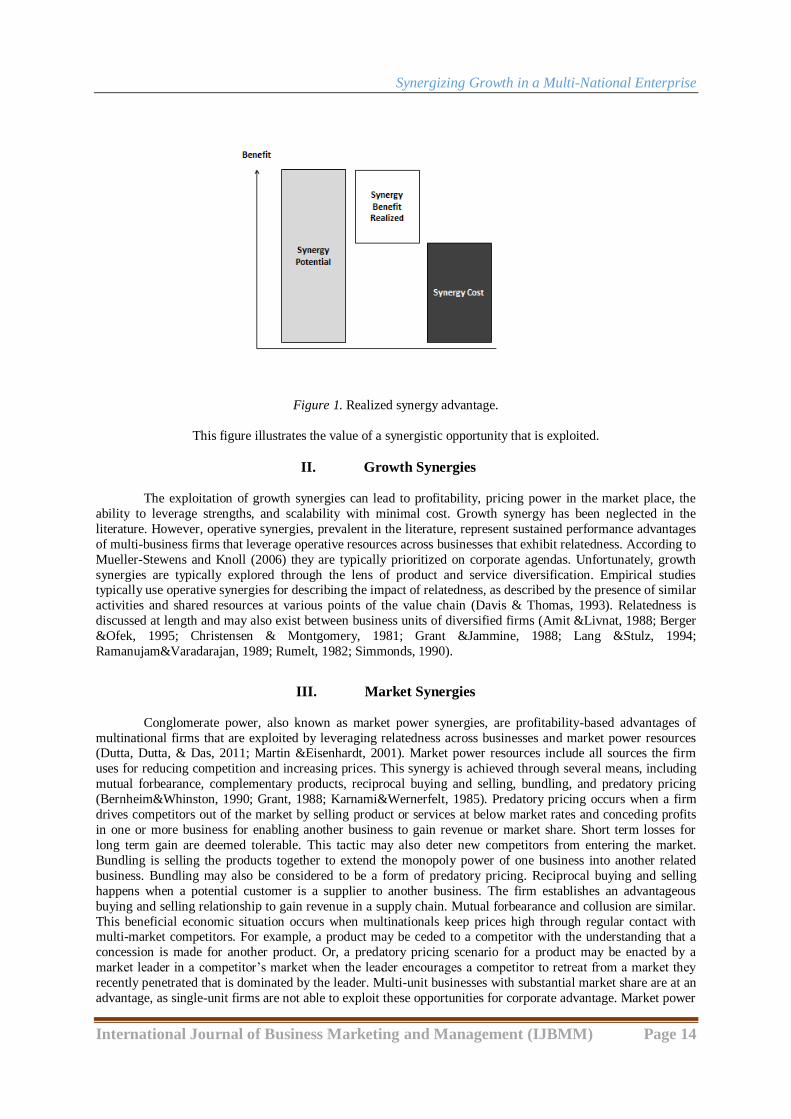
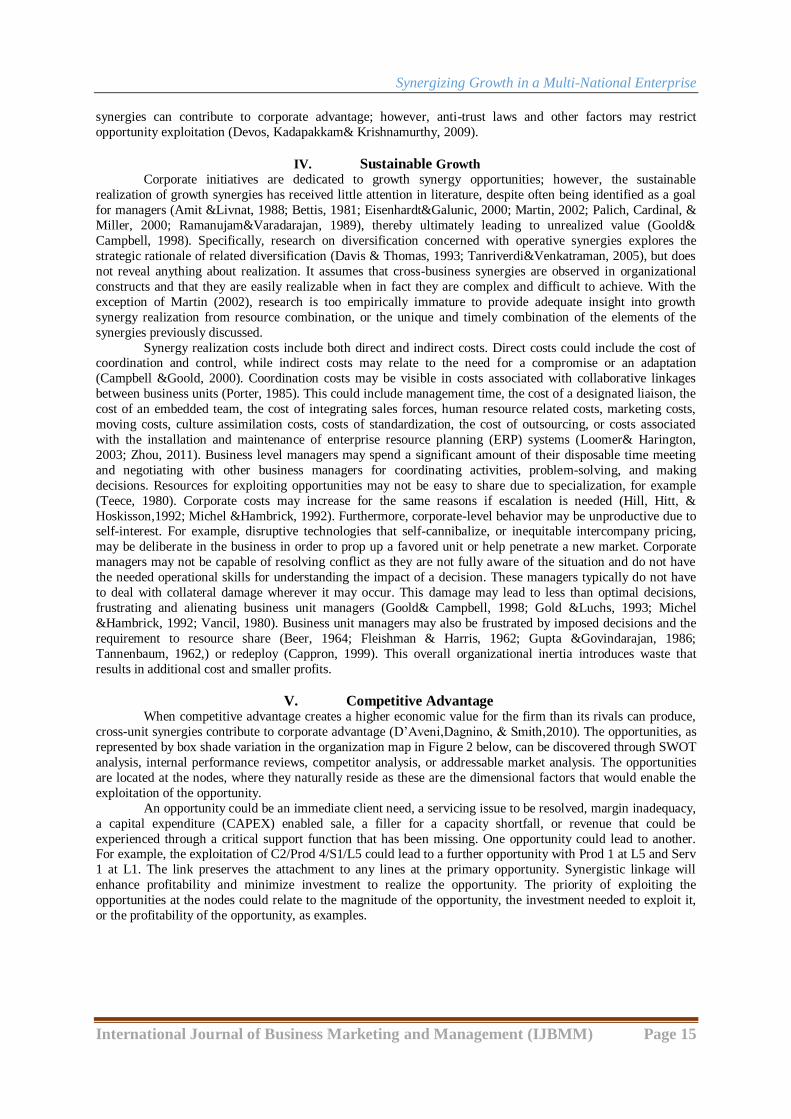
represented by box shade variation in the organization map in Figure 2 below, can be discovered through SWOT
analysis, internal performance reviews, competitor analysis, or addressable market analysis. The opportunities
are located at the nodes, where they naturally reside as these are the dimensional factors that would enable the
exploitation of the opportunity.
An opportunity could be an immediate client need, a servicing issue to be resolved, margin inadequacy,
a capital expenditure (CAPEX) enabled sale, a filler for a capacity shortfall, or revenue that could be
experienced through a critical support function that has been missing. One opportunity could lead to another. For example, the exploitation of C2/Prod 4/S1/L5 could lead to a further opportunity with Prod 1 at L5 and Serv
1 at L1. The link preserves the attachment to any lines at the primary opportunity. Synergistic linkage will
enhance profitability and minimize investment to realize the opportunity. The priority of exploiting the
opportunities at the nodes could relate to the magnitude of the opportunity, the investment needed to exploit it,
or the profitability of the opportunity, as examples.
Synergizing Growth in a Multi-National Enterprise
International Journal of Business Marketing and Management (IJBMM) Page 16
Figure 2. Growth synergy opportunities prioritized at the nodes. This figure illustrates the relatedness of
opportunities and the capability of the model to be used for linkage.
VI. Sustained Advantage
Opportunities can be prioritized based on corporate growth and synergy value. A resource-based view
of cross-unit synergy creates three conditions by which competitive advantage is sustained (Barney, 1991;
Conner, 1991; Peteraf, 1993; Wernerfelt, 1984). First, the synergistic resource needs to have value. This
happens when these resources are relevant to key success factors of the business (Grant, 2005). They enable the
firm to reduce threats to profitability and exploit opportunities available in the environment (Barney, 2007). In
the end, these resources need to contribute to the firm‟s ability to meet customer needs and expectations at a fair
price, better than the competition (Collins & Montgomery, 2005; Rose, 1990). Second, the resource needs to be in short supply. If the resource is widely available, the potential competitive advantage erodes (Grant, 2005).
The best outcome for competitive advantage is that the resource is rare and valuable (Barney, 2007). Finally,
synergistic resources must be difficult to imitate, in order to be a source of sustainable competitive advantage.
This is enhanced if competitors have neither the financial capability nor time to obtain them (Grant, 2005;
Barney, 2007). This situation may be enhanced through the existence of intellectual property protection,
historical conditions, timing disadvantages, the inability of the competitor to assemble the needed resources, and
the existence of socially complex phenomena that cannot be sufficiently influenced (Barney, 2007). To optimize
growth synergy choices, firms need to balance potential incremental value with the associated coordination
costs. This must be accomplished with a view towards complexity, consideration for the overall coordination
capacity constraints, and an understanding of the opportunity itself so that it can be optimally applied
horizontally as well as vertically. Furthermore, the application needs to be accomplished with consideration for the impact of synergy realization on specialization, which may result in a loss of competitive advantage.
Organizational capability like managerial expertise, knowledge creation, and adaptation to offset limitations,
also need to be taken into consideration (Capron, Dussuage, &Michell, 1998; Hill et al., 1992; Nelson & Winter,
1982). All things considered, firms need to understand and optimize coordination costs that arise from managing
complex interdependencies between business units (Zhou, 2011).
Dis-synergies.
In a discussion about synergies it is important to understand the opposite concept as it produces a
counter or negative influence. „Negative spill-overs‟, or „contagion‟, that may spread from one unit to another
Synergizing Growth in a Multi-National Enterprise
International Journal of Business Marketing and Management (IJBMM) Page 17
through integration or collaboration, thereby reducing overall value, may also be referred to as dis-synergies.
There is persuasive support in the literature that synergies and dis-synergies exist (Bloch, 2008; Falk, Schepers,
Hammerschmidt, & Bauer, 2007). As explained earlier, synergy is a micro-level phenomenon that is typically
defined as savings arising from economies of scale or scope that can be exploited. Conversely, dis-synergies
occur when related diversification strategies result in internal transaction costs that outweigh realized economies
of scope (Besanko, Dranove, &Shanely, 2000; Jones & Hill, 1988; Martin &Eisenhardt, 2001). In some
situations, resources do not have synergy potential, or they are not realized, or may not be realizable (Gruca, Nath, &Mehra, 1997). Synergy realization should be measured in terms of outcomes such as revenue
enhancement or creation, rather than just cost mitigation (Martin &Eisenhardt, 2001). Dis-synergies occur when
an integrated entity does not have the potential for realizing better performance than the two entities would if
operating independently. This contagion effect from unit consolidation or collaboration may come from, but not
be limited to, the allocation of work to two entities with slack capacity, deploying systems or talent to an entity
that does not need it, and cross-selling or bundling to increase consumer acceptance and sales. Brand value can
be tarnished by product or service liability, an inability to fulfill orders due to volatility or congestion, increased
costs to meet spike demands from unexpected success, capacity issues that drive poor execution or divert
attention, and the inability of resources to use existing systems (Berger, Hanweck, &Humphery, 1987; Grucaet
al., 1997). In addition, resources may not be critical for the value chain, sufficiently flexible or substitutable, and
may have a fixed capacity. Flexibility, on the other hand, comes with constraints such as; a large acquisition cost, coordination costs may be excessive, they may force miss-alignment, culture, or value shifting to
accommodate, and the resource may not be unique to the firm (Barney, 1986; Berger et al., 1987; Deller,
Chicoine, &Walzer, 1988; Ghemawat, 1988; Hill &Hosskisson, 1994; Prahalad& Hamel, 1990). Additionally,
research on synergy strategy does not provide insights into the actual value of the realization of these synergies,
even though there are persuasive arguments and evidence for their existence (Shaver, 2006).
In summary, the author has briefly introduced and defined synergy types, the substantial empirical
component of this study. Synergy total potential value is the difference between the cumulative synergy
potential across business units minus the synergy realization expense. Similarly, realized synergy value is the
total value of realized synergy minus the realization cost. Realization cost can include controlling cost,
coordination costs, and cost associated with compromise or inflexibility. Additionally, if cross-business unit
synergies are either a source of competitive advantage or if they contribute to the firm‟s ability to realize
synergies, they contribute to corporate advantage. The type of resources, and similarities between common key success factors across business units, relates directly to their exploited value potential. This value is enhanced
through complementarities between resources and activities. Most commonly, operative synergies are thought of
as leading to cost reductions exclusively. The author, on the other hand, intends that synergies are thought of in
the context of incremental revenue. Finally, synergies may become dis-synergies, or negative synergies, over
time in the event that the market changes, invalid assumptions are enacted, or through technology shifts.
VII. Quality of the Research
Creswell (2014) describes validity in qualitative research as being the determination of whether the
findings are accurate from the standpoint of the author, the participant, and the readers of an account. In this
case, language and meaning are the data. Creswell (2014), in parallel with Lincoln and Guba‟s (1985) approach,
offers qualitative researchers eight possible strategies for checking the accuracy of findings; triangulation,
member-checking, rich descriptions, clarification of bias, the use of negative or discrepant information,
prolonged time in the field, peer debriefing, and the use of an external auditor. The author selectively used these
strategies to ensure data validity with a focus on triangulation, peer debriefing, and member checking.
Endogenous validity refers to the validity of established causal relationships (Yin, 1994; Lamnek,
1995) or internal logic of the research (Punch, 1998). This was achieved by establishing a clear thematic focus
that guided the case selection, abstracting and comparing, conducting peer reviews of causal relationships, and
by having an open and comprehensive explanation building. A thematic focus was evident in a clear definition of an overarching research theme (cross-unit synergies), a narrowing research focus (unit operative synergies),
and a specific research question (the sustainable realization of growth synergies as evidence of performance)
along with a compatible case selection in which the constructs of interest could be discovered. Continuous
abstracting and comparing (Strauss & Corbin, 1990, 1996) occurred as the author continuously compared data
sets to build higher order constructs, preliminary results to emerging data to confirm or refine results, and
observed causal patterns within the existing literature. This improved the validity of causal relations (Yin,
1994). Peer reviews of causal relationships were discussed with research colleagues for the purpose of capturing
and testing additional perspectives based on experience in the field. Additionally, it enabled the validation of
internal consistency and theoretical relevance of the author‟s arguments. The final technique for internal validity
Synergizing Growth in a Multi-National Enterprise
International Journal of Business Marketing and Management (IJBMM) Page 18
was through open and comprehensible building of explanations and causal relationships. The results were
documented in such a way that the reader could reconstruct the causal relationship (Mayring, 1996). Openly, the
author indicated initial ideas, deducted assumptions, and challenged potential inconsistencies.
Exogenous validity refers to the generalizability of research results critical for robust theory
development (Sutton & Straw, 1995; Weick, 1995) and depends on the research approach (Yin, 1994). Single
case study empirical findings are difficult to generalize. Yin (1994) emphasizes that case studies do not allow
for statistical generalization. More specifically, it is difficult to make inferences about a population based on empirical data collected in a sample. While issues of generalizability from case studies is severe (Denzin, 1989;
Yin, 1994), single-case studies are recognized to be substantial from an evolutionary perspective (Stake, 1995).
Single case studies can also provide new ideas and new thinking paradigms. They can help modify existing
theories by exposing gaps and helping to fill them. There are several facts about this study that support the
author‟s conclusions that the findings and propositions will be at least somewhat generalizable. Several of the
constructs can be confirmed as being present in existing literature, indicating general theoretical relevance of the
research (Eisenhardt, 1989). The findings were confirmed through consultation with participants, who are
operationally capable with varied experience in the industry, suggesting the potential transferability of the
claims. Finally, the findings were somewhat generalizable due to the continuous comparison of similarities and
differences within case items across different levels of analysis.
Reliability refers to the possibility that researchers can replicate the research activity and produce the same findings (Eisenhardt, 1989; Yin, 1994). A challenge for this replication is the attribute of qualitative
research, in that it is bound to the context in which it is conducted (Lamnek, 1995), including time. Reliability in
qualitative studies is best served by presenting sufficient information so that the reader can draw his/her own
conclusions (Yin, 1994). The author attempted to ensure reliability through the explicit disclosure of the
research design, including a detailed description of the research process, case selection criteria, interview guide,
and methods for collecting and analyzing empirical data.
VIII. Data and Analysis
The purpose of this qualitative phenomenological research study, using Moustakas, (1994) modified
van Kaam method, was to explore the real-time experiences of stakeholders, or co-researchers, as they lived and
influenced events occurring around them. Awareness is a transient experience (Freeman, 2000) that may involve
exerting influence, letting go, and redirecting energy and attention (Depraz, Varela, &Vermersch, 2003). It also
involves being present physically and mentally in daily life. Stakeholders have to anticipate events, make sense
of existing environments, and exert influence over future trends. Weick (1995) suggests that sense-making is a
retrospective cognitive process that explains unanticipated events. He also suggests that events in a socially-
created world both support and constrain action. Weick, Sutcliffe, and Obstfeld (2005) later suggest that individuals form both assumptions and conscious anticipations of future events. By examining sense-making
and the development of mental models through actual lived, shared experiences, this study captures the
subjective processes that have been largely ignored in the context of the influence of synergies on revenue
growth and successfully achieving desired outcomes in a multi-unit firm. Using the experience of stakeholders,
the author presents a conceptualization of how individual participants in this study made sense of their lived
experience. This was an ongoing process for participants as they refined their understanding of lived
experiences and established new equilibriums.
The research included individual textual descriptions as well as composite descriptions concisely
oriented and illustrated in a theme map structure. Moustakas (1994) suggested that the integration of textual and
structural descriptions into a composite description, such as a relational table, is a path for understanding the
essence of an experience. The composite description is an intuitive and reflective integrative description of the meanings and essences of a phenomenon, of which the entire group of individuals is making sense. The
participants create meaning through their awareness of the environment, reflection on their experiences,
consultation with others, focused response to an enquiry, and iterative refinement to these enquiries.
IX. Coding
Data collection was facilitated by an interview protocol with specific questions oriented in a sequenced
schema. Participants were solicited as volunteers from a pool of leaders based on a willingness to share
information about the transformation of the sub-division. Each volunteer co-researcher participated in the
growth personally. Following each question, the participants‟ response was determined to be linked to the question asked and was determined to be meaningful prior to continuing. An answer could trigger a clarifying
Synergizing Growth in a Multi-National Enterprise
International Journal of Business Marketing and Management (IJBMM) Page 19
question, or a question formed to solicit a more fulsome answer, if needed. The additional information modified
the answer and once again was determined to be fulsome or not. The data was given a reference number (ex.
RV313)andadded then to the data sheet and coded. The first two letters refer to the person and the numbers refer
to the entry from the person. Sub-code themes were also determined and grouped by code and sub-code. The
data was surveyed by the author, who, due to personal experience, was able to apply an “analysis for good”
(ANOG). Depending on results slight modifications were made as needed to reduce the noise in the data and
ensure completeness and clarity. This was accomplished by consolidating like data points and simplifying others by stripping out noise and redundancy in the answers. The data was then re-sorted and generalized through
categorizing. A pivot-table was used to extract themes in the wording. The raw data was then posted in a table.
In some cases,most of the themes were unique in which case a table was not used. From this data, dependencies,
relationship, and the sequence of events were determined and organized into a theme relationship map. In some
cases the data collected appeared as though the participant was confused about the question. In these cases the
author followed up with the participant and then added the newly acquired information to the raw data
previously collected.
The raw data was collected from each participant for each data domain and sub-domain in the sequence
in which it is presented in this chapter to promote a progression of thought. The data is separated into exogenous
and endogenous domains as well with selected focus in both areas. In some cases, like roles, the participants
offered information on themselves while commenting on data provided by their peers. Patterns that emerge in the data are presented as textural responses (what happened), structural responses (how did it happen), or
composite descriptions (what the group experienced). Data responses that occurred most frequently within the
theme category were given more significance and were typically mentioned first. Data was interpreted into
theme patterns. These were broken into themes and then concisely into propositions, or findings of the study.
Data items that referred to individuals, functions, line of business, locations, systems, or company names were
obfuscated, eliminated, or given a pseudonym. The propositions, or findings, were formed and listed
numerically. Within each proposition, a two-word summary was formed along with a statement that sums up the
finding. For example, a central theme, norm strategy, or trigger may have emerged from the data as a result of
coding. This data could then be categorized or filtered through the constructs being discussed that may include
the strategic frame, horizontal strategies, or a narrowed scope as examples. This was the beginning of the theme
map, or the outermost layer. The layers could then be elaborated on by breaking the outermost layer into sub-
layers until it was reasonable to stop. This theme map was created to better describe the themes in the data and to show relationships and sequences between unique data items. With the methods understood, now on to the
specific themes from the study as described by the findings.
X. Findings
The findings of the study suggested that growth is the goal of synergy exploitation. Growth is typically
seen in forecasted and realized revenues at a suitable profit margin. The role of those who are „outward‟ facing
is outlined in three categories, each of which is profitability oriented. Synergy is also clear in the figures, as
collaboration between the parties indicated is necessary for the realization of profitable growth. The role of each
entity is listed below their name. The responsibilities are shared between them in a collaborative way, as
indicated between the sales and operational entities. These themes emerged in the data when organizational
leaders were asked about the roles of each function. A total of 73 themes emerged from the data with regard to
five roles. One role was the line of business (LOB) lead. This is the person who is in charge of a set of products.
The second is the account director (AD), who manages the client from the operations side of the business. The
third is the client service representative or project manager (CSR/PM). This person manages the work through
the facility and connects with the supply chain up and downstream. The fourth is the technical project manager (TPM). This person is technically skilled in the product and the workflow. The fifth person is the account
manager (AM). This person manages the client on the sales side of the business. The last person is the sales
manager (SM). This person is primarily in charge of bringing in new business/clients.
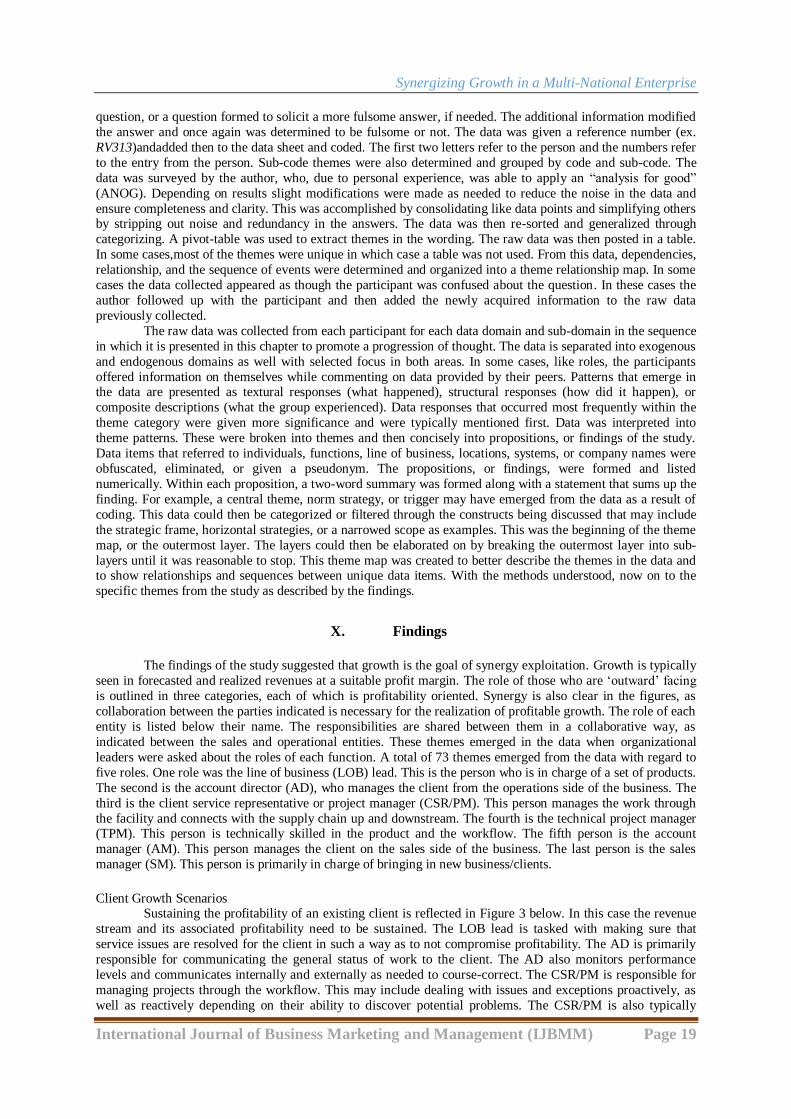
Client Growth Scenarios Sustaining the profitability of an existing client is reflected in Figure 3 below. In this case the revenue
stream and its associated profitability need to be sustained. The LOB lead is tasked with making sure that
service issues are resolved for the client in such a way as to not compromise profitability. The AD is primarily
responsible for communicating the general status of work to the client. The AD also monitors performance
levels and communicates internally and externally as needed to course-correct. The CSR/PM is responsible for
managing projects through the workflow. This may include dealing with issues and exceptions proactively, as
well as reactively depending on their ability to discover potential problems. The CSR/PM is also typically
Synergizing Growth in a Multi-National Enterprise
International Journal of Business Marketing and Management (IJBMM) Page 20
responsible for updating the ERP with status-related information. The TPM has the technical information at
hand with regard to product, workflow, and infrastructure. The TPM optimizes the workflow prior to
introducing new product and while product is running to ensure profitability. The TPM also introduces new
technologies to improve processing efficiencies and reduce waste. The data suggested that AMs are best at
seeing changes internal to the client. These changes may enhance revenue opportunities through proactive
actions. It was also expected that AMs know decision makers in higher positions at the client. The synergistic
tasks include activities regarding the budgeted portfolio, producing the weekly forecast, hosting the monthly review, acquiring a spend outlook from clients, escalating issues and opportunities as needed to those who can
influence the situation for the better, updating clients regarding organizational changes and capabilities, gaining
and disseminating valuable client feedback, optimizing the ability to charge for overages without retribution,
resolving issues that produce negativity in the relationship, conducting informative periodic meetings with
clients, taking the temperature of critical personalities, managing the rates and their structure, and discussing
trend deviations from expectation so as to take a proactive position. These synergistic tasks are best executed
with a high level of collaboration.
Figure 3. Maintaining current client. This figure maps maintaining current clients as a theme category into
descriptive and related sub-groupings.
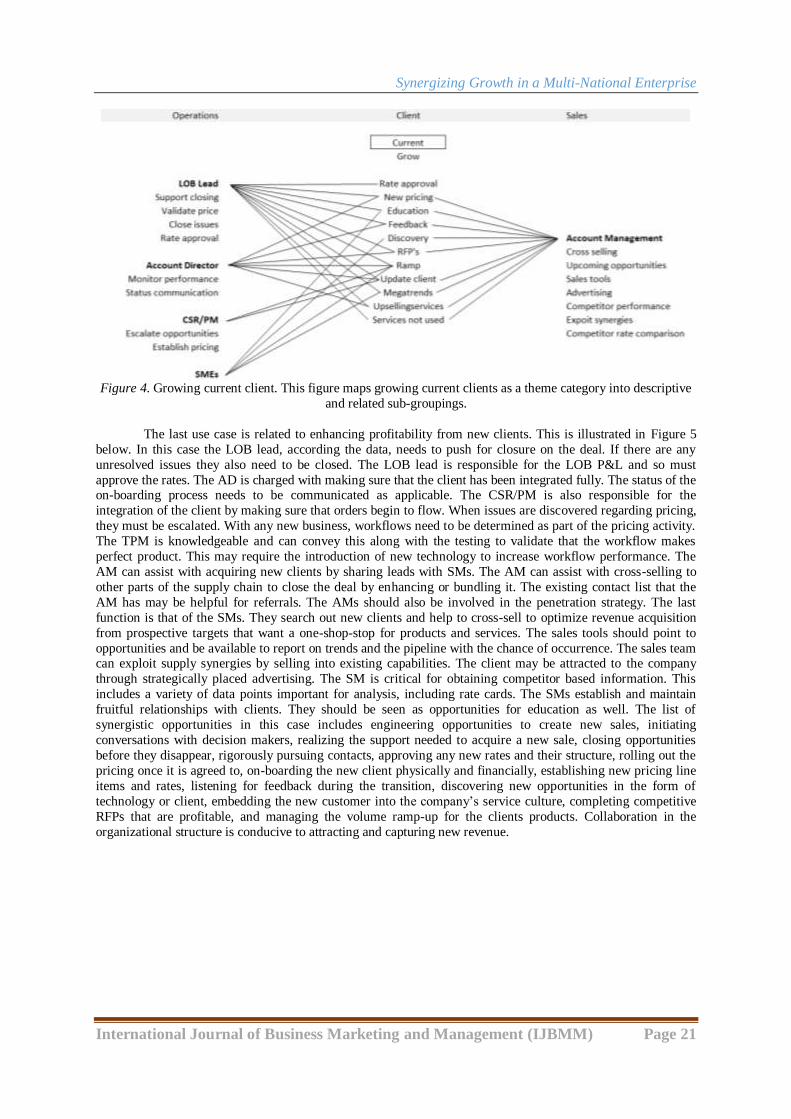
The second way that a multinational can increase profitability exogenously is to assist existing clients
to experience growth. Leveraging existing knowledge and talent for additional revenue is highly synergistic and
therefore, profitability enhancing. In this case the data suggested that the LOB lead is critical for closing the
deal, validating the pricing, dealing with issues, and agreeing with the validity of the rate card structure. The AD
needs to monitor performance for issues and provide status on the fulfillment of the new additional work. The
CSR/PM can help to embed pricing structures in the ERP system so that they can be exploited with the new
work. Getting this right from the first invoice is important for the brand. The CSR/PM staff may also see
opportunities for growth that should be passed on. Exploiting these opportunities in existing supply chain BUs is
highly synergistic. The TPM provides subject matter expertise to the workflow design enhancements needed to
accommodate the new volume or product. The AM in this case needs to cross-sell as well to exploit existing
workflows. As clients discuss upcoming opportunities, the AM should relay these to the right parties. The sales
tools that are used to measure the revenue performance of the client are the responsibility of the AM. This should include a „funnel‟ that indicates the pending work type that is in the pipeline for their client. Knowing the
performance and rates of competitors helps the AM know pricing positioning. The synergistic actions shared
between these functions include the approval of the rate structure for the new work, the establishment of pricing
strategy, education of the client and internal operations on requirements, obtaining feedback on expectations
prior to and during expansion, discovering new opportunities to augment client income, fulfilling requests for
proposals (RFPs), updating the client as needed on status of the ramp-up, interpreting the impact of megatrends
and life-cycles on the business, upselling other services to augment revenues, and discovering services that are
not being exploited by the client, but that could be leveraged. The organizational design enhances the
collaboration of these functional areas to encourage increased revenue and profitability from existing clients.
Synergizing Growth in a Multi-National Enterprise
International Journal of Business Marketing and Management (IJBMM) Page 21
Figure 4. Growing current client. This figure maps growing current clients as a theme category into descriptive
and related sub-groupings.
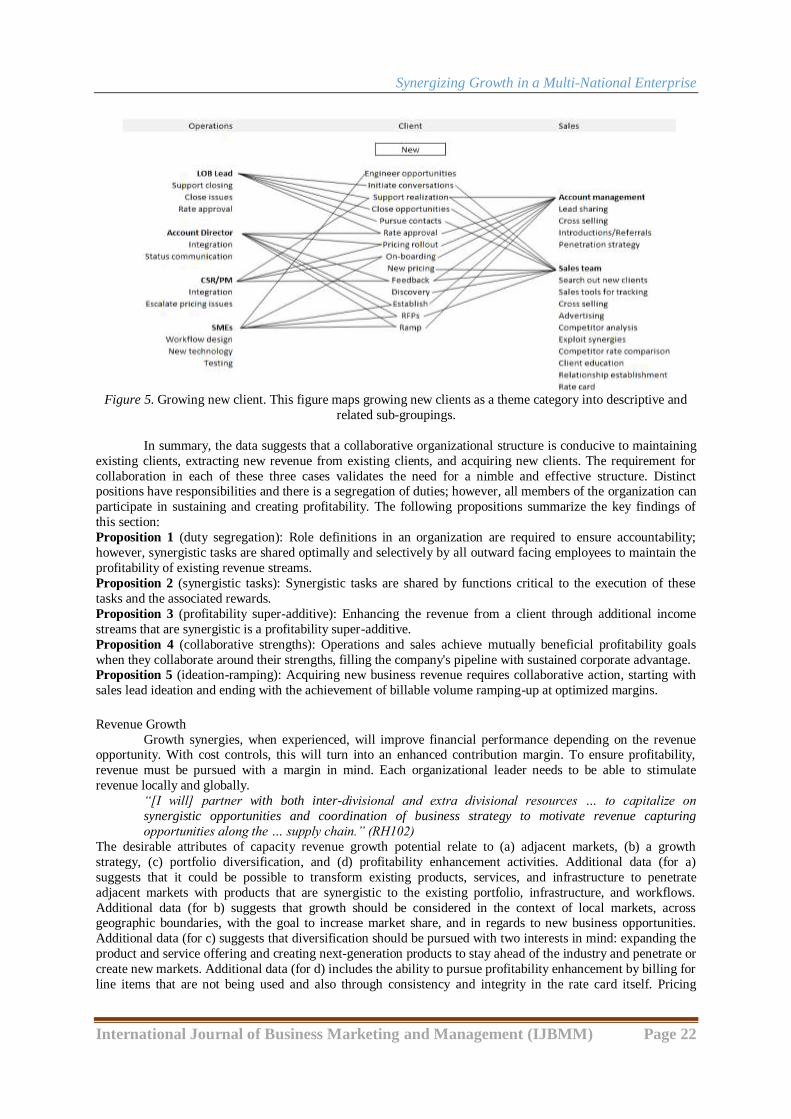
The last use case is related to enhancing profitability from new clients. This is illustrated in Figure 5
below. In this case the LOB lead, according the data, needs to push for closure on the deal. If there are any
unresolved issues they also need to be closed. The LOB lead is responsible for the LOB P&L and so must
approve the rates. The AD is charged with making sure that the client has been integrated fully. The status of the on-boarding process needs to be communicated as applicable. The CSR/PM is also responsible for the
integration of the client by making sure that orders begin to flow. When issues are discovered regarding pricing,
they must be escalated. With any new business, workflows need to be determined as part of the pricing activity.
The TPM is knowledgeable and can convey this along with the testing to validate that the workflow makes
perfect product. This may require the introduction of new technology to increase workflow performance. The
AM can assist with acquiring new clients by sharing leads with SMs. The AM can assist with cross-selling to
other parts of the supply chain to close the deal by enhancing or bundling it. The existing contact list that the
AM has may be helpful for referrals. The AMs should also be involved in the penetration strategy. The last
function is that of the SMs. They search out new clients and help to cross-sell to optimize revenue acquisition
from prospective targets that want a one-shop-stop for products and services. The sales tools should point to
opportunities and be available to report on trends and the pipeline with the chance of occurrence. The sales team can exploit supply synergies by selling into existing capabilities. The client may be attracted to the company
through strategically placed advertising. The SM is critical for obtaining competitor based information. This
includes a variety of data points important for analysis, including rate cards. The SMs establish and maintain
fruitful relationships with clients. They should be seen as opportunities for education as well. The list of
synergistic opportunities in this case includes engineering opportunities to create new sales, initiating
conversations with decision makers, realizing the support needed to acquire a new sale, closing opportunities
before they disappear, rigorously pursuing contacts, approving any new rates and their structure, rolling out the
pricing once it is agreed to, on-boarding the new client physically and financially, establishing new pricing line
items and rates, listening for feedback during the transition, discovering new opportunities in the form of
technology or client, embedding the new customer into the company‟s service culture, completing competitive
RFPs that are profitable, and managing the volume ramp-up for the clients products. Collaboration in the
organizational structure is conducive to attracting and capturing new revenue.
Synergizing Growth in a Multi-National Enterprise
International Journal of Business Marketing and Management (IJBMM) Page 22
Figure 5. Growing new client. This figure maps growing new clients as a theme category into descriptive and
related sub-groupings.
In summary, the data suggests that a collaborative organizational structure is conducive to maintaining
existing clients, extracting new revenue from existing clients, and acquiring new clients. The requirement for
collaboration in each of these three cases validates the need for a nimble and effective structure. Distinct positions have responsibilities and there is a segregation of duties; however, all members of the organization can
participate in sustaining and creating profitability. The following propositions summarize the key findings of
this section:
Proposition 1 (duty segregation): Role definitions in an organization are required to ensure accountability;
however, synergistic tasks are shared optimally and selectively by all outward facing employees to maintain the
profitability of existing revenue streams.
Proposition 2 (synergistic tasks): Synergistic tasks are shared by functions critical to the execution of these
tasks and the associated rewards.
Proposition 3 (profitability super-additive): Enhancing the revenue from a client through additional income
streams that are synergistic is a profitability super-additive.
Proposition 4 (collaborative strengths): Operations and sales achieve mutually beneficial profitability goals
when they collaborate around their strengths, filling the company's pipeline with sustained corporate advantage. Proposition 5 (ideation-ramping): Acquiring new business revenue requires collaborative action, starting with
sales lead ideation and ending with the achievement of billable volume ramping-up at optimized margins.
Revenue Growth
Growth synergies, when experienced, will improve financial performance depending on the revenue opportunity. With cost controls, this will turn into an enhanced contribution margin. To ensure profitability,
revenue must be pursued with a margin in mind. Each organizational leader needs to be able to stimulate
revenue locally and globally.
“[I will] partner with both inter-divisional and extra divisional resources … to capitalize on
synergistic opportunities and coordination of business strategy to motivate revenue capturing
opportunities along the … supply chain.” (RH102)
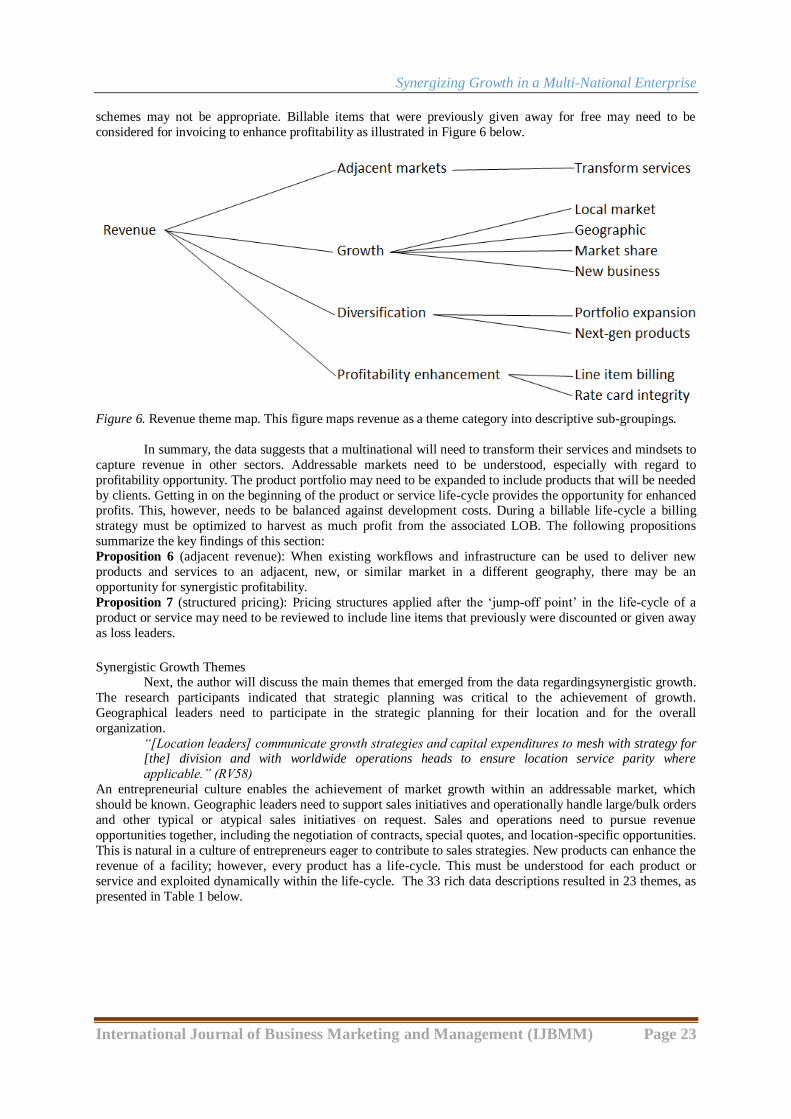
The desirable attributes of capacity revenue growth potential relate to (a) adjacent markets, (b) a growth
strategy, (c) portfolio diversification, and (d) profitability enhancement activities. Additional data (for a)
suggests that it could be possible to transform existing products, services, and infrastructure to penetrate
adjacent markets with products that are synergistic to the existing portfolio, infrastructure, and workflows.
Additional data (for b) suggests that growth should be considered in the context of local markets, across geographic boundaries, with the goal to increase market share, and in regards to new business opportunities.
Additional data (for c) suggests that diversification should be pursued with two interests in mind: expanding the
product and service offering and creating next-generation products to stay ahead of the industry and penetrate or
create new markets. Additional data (for d) includes the ability to pursue profitability enhancement by billing for
line items that are not being used and also through consistency and integrity in the rate card itself. Pricing
Synergizing Growth in a Multi-National Enterprise
International Journal of Business Marketing and Management (IJBMM) Page 23
schemes may not be appropriate. Billable items that were previously given away for free may need to be
considered for invoicing to enhance profitability as illustrated in Figure 6 below.
Figure 6. Revenue theme map. This figure maps revenue as a theme category into descriptive sub-groupings.
In summary, the data suggests that a multinational will need to transform their services and mindsets to
capture revenue in other sectors. Addressable markets need to be understood, especially with regard to
profitability opportunity. The product portfolio may need to be expanded to include products that will be needed
by clients. Getting in on the beginning of the product or service life-cycle provides the opportunity for enhanced profits. This, however, needs to be balanced against development costs. During a billable life-cycle a billing
strategy must be optimized to harvest as much profit from the associated LOB. The following propositions
summarize the key findings of this section:
Proposition 6 (adjacent revenue): When existing workflows and infrastructure can be used to deliver new
products and services to an adjacent, new, or similar market in a different geography, there may be an
opportunity for synergistic profitability.
Proposition 7 (structured pricing): Pricing structures applied after the „jump-off point‟ in the life-cycle of a
product or service may need to be reviewed to include line items that previously were discounted or given away
as loss leaders.
Synergistic Growth Themes Next, the author will discuss the main themes that emerged from the data regardingsynergistic growth.
The research participants indicated that strategic planning was critical to the achievement of growth.
Geographical leaders need to participate in the strategic planning for their location and for the overall
organization.
“[Location leaders] communicate growth strategies and capital expenditures to mesh with strategy for [the] division and with worldwide operations heads to ensure location service parity where
applicable.” (RV58)
An entrepreneurial culture enables the achievement of market growth within an addressable market, which
should be known. Geographic leaders need to support sales initiatives and operationally handle large/bulk orders
and other typical or atypical sales initiatives on request. Sales and operations need to pursue revenue
opportunities together, including the negotiation of contracts, special quotes, and location-specific opportunities.
This is natural in a culture of entrepreneurs eager to contribute to sales strategies. New products can enhance the
revenue of a facility; however, every product has a life-cycle. This must be understood for each product or
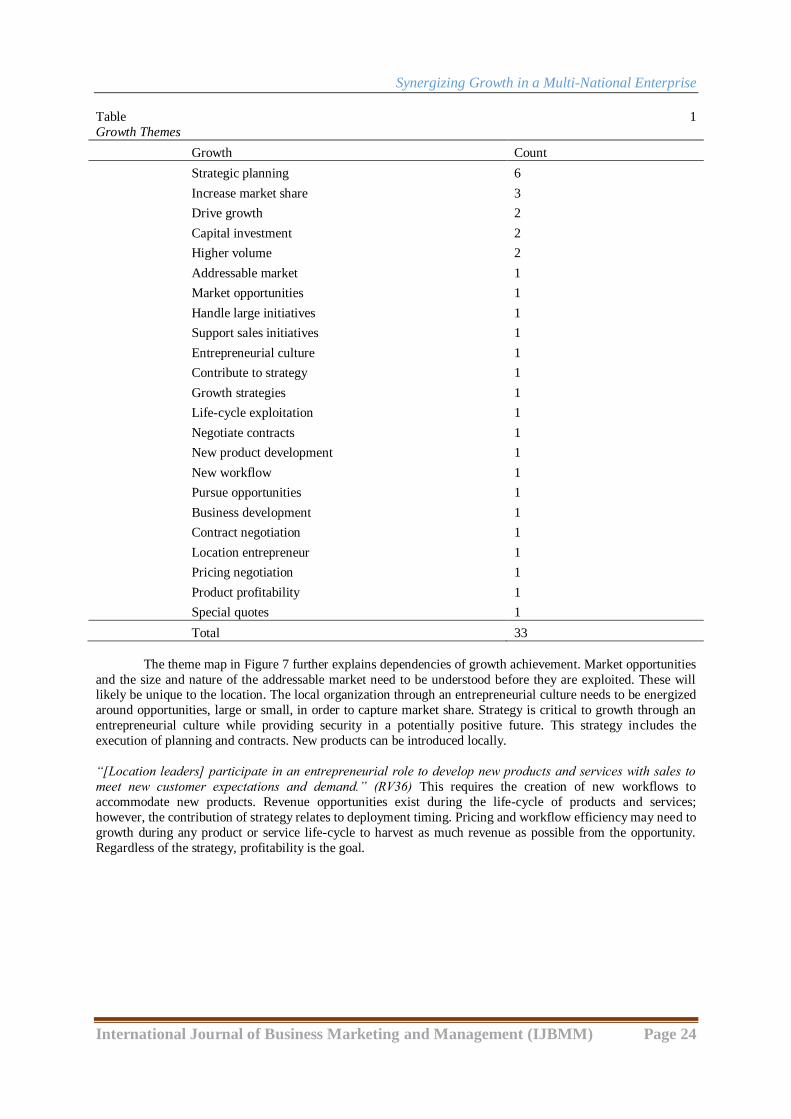
service and exploited dynamically within the life-cycle. The 33 rich data descriptions resulted in 23 themes, as
presented in Table 1 below.
Synergizing Growth in a Multi-National Enterprise
International Journal of Business Marketing and Management (IJBMM) Page 24
Table 1
Growth Themes
Growth Count
Strategic planning 6
Increase market share 3
Drive growth 2
Capital investment 2
Higher volume 2
Addressable market 1
Market opportunities 1
Handle large initiatives 1
Support sales initiatives 1
Entrepreneurial culture 1
Contribute to strategy 1
Growth strategies 1
Life-cycle exploitation 1
Negotiate contracts 1
New product development 1
New workflow 1
Pursue opportunities 1
Business development 1
Contract negotiation 1
Location entrepreneur 1
Pricing negotiation 1
Product profitability 1
Special quotes 1
Total 33
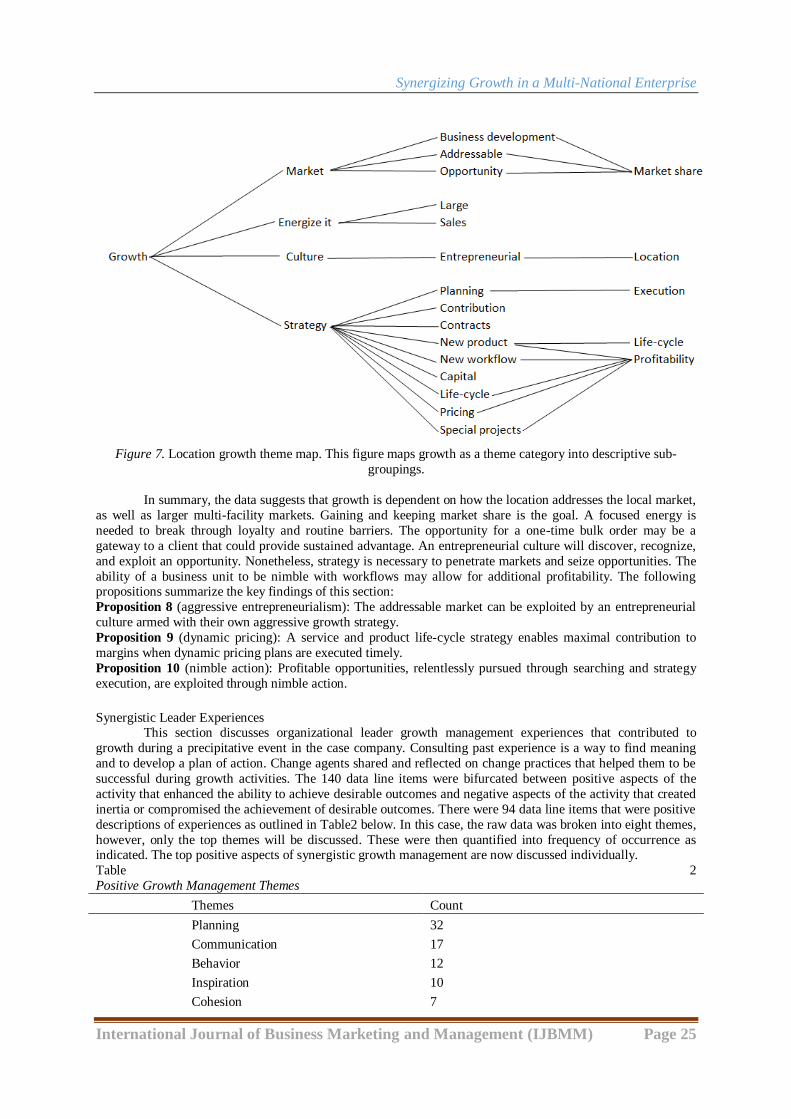
The theme map in Figure 7 further explains dependencies of growth achievement. Market opportunities
and the size and nature of the addressable market need to be understood before they are exploited. These will likely be unique to the location. The local organization through an entrepreneurial culture needs to be energized
around opportunities, large or small, in order to capture market share. Strategy is critical to growth through an
entrepreneurial culture while providing security in a potentially positive future. This strategy includes the
execution of planning and contracts. New products can be introduced locally.
“[Location leaders] participate in an entrepreneurial role to develop new products and services with sales to
meet new customer expectations and demand.” (RV36) This requires the creation of new workflows to
accommodate new products. Revenue opportunities exist during the life-cycle of products and services;
however, the contribution of strategy relates to deployment timing. Pricing and workflow efficiency may need to
growth during any product or service life-cycle to harvest as much revenue as possible from the opportunity.
Regardless of the strategy, profitability is the goal.
Synergizing Growth in a Multi-National Enterprise
International Journal of Business Marketing and Management (IJBMM) Page 25
Figure 7. Location growth theme map. This figure maps growth as a theme category into descriptive sub-
groupings.
In summary, the data suggests that growth is dependent on how the location addresses the local market,
as well as larger multi-facility markets. Gaining and keeping market share is the goal. A focused energy is
needed to break through loyalty and routine barriers. The opportunity for a one-time bulk order may be a
gateway to a client that could provide sustained advantage. An entrepreneurial culture will discover, recognize,
and exploit an opportunity. Nonetheless, strategy is necessary to penetrate markets and seize opportunities. The
ability of a business unit to be nimble with workflows may allow for additional profitability. The following propositions summarize the key findings of this section:
Proposition 8 (aggressive entrepreneurialism): The addressable market can be exploited by an entrepreneurial
culture armed with their own aggressive growth strategy.
Proposition 9 (dynamic pricing): A service and product life-cycle strategy enables maximal contribution to
margins when dynamic pricing plans are executed timely.
Proposition 10 (nimble action): Profitable opportunities, relentlessly pursued through searching and strategy
execution, are exploited through nimble action.
Synergistic Leader Experiences This section discusses organizational leader growth management experiences that contributed to
growth during a precipitative event in the case company. Consulting past experience is a way to find meaning
and to develop a plan of action. Change agents shared and reflected on change practices that helped them to be
successful during growth activities. The 140 data line items were bifurcated between positive aspects of the
activity that enhanced the ability to achieve desirable outcomes and negative aspects of the activity that created
inertia or compromised the achievement of desirable outcomes. There were 94 data line items that were positive
descriptions of experiences as outlined in Table2 below. In this case, the raw data was broken into eight themes,
however, only the top themes will be discussed. These were then quantified into frequency of occurrence as indicated. The top positive aspects of synergistic growth management are now discussed individually.
Table 2
Positive Growth Management Themes
Themes Count
Planning 32
Communication 17
Behavior 12
Inspiration 10
Cohesion 7
Synergizing Growth in a Multi-National Enterprise
International Journal of Business Marketing and Management (IJBMM) Page 26
Execution 7
Capability 6
Relationships 3
Total 94
Positive Synergistic Experiences. The situations where growth management was executed effectively,
based on feedback from the organizational leaders who had experiences with growth management activities over
the precipitative event, resulted in desirable outcomes that were achieved on time. Thematic aspects of how
these activities were managed could be categorized as predictive,
“Involving lower and mid-level management in the planning [as] they can have valuable inputs.” (S23)
proactive,
“Bringing … groups … together and the associated move to [location] worked because it was handled
quickly and openly; once it was time to announce it to the staff… we pulled everyone into conference
rooms and laid out the plan… it got all the employees on board quickly and then everyone was invested and took a piece of the effort to help.” (S27)
and reactive.
“…being the owner of [functional areas] made things simpler… since I had a hand in every piece of
the puzzle, I had the ability to make tweaks and changes where changes were needed and there were no
toes in the way to step on… in the end, once we knew it worked, the hand off to [name] team was
painless.” (S89)
Social and tactical theme categories also emerged from the data. It was beneficial for organizational leaders to
share and discuss these experiences, so that all of the leaders could benefit from each other‟s growth leadership
experiences. Again, the frequency of occurrence of themes does not necessarily imply weighting. Each theme
was individually mapped and the top themes will be discussed below.
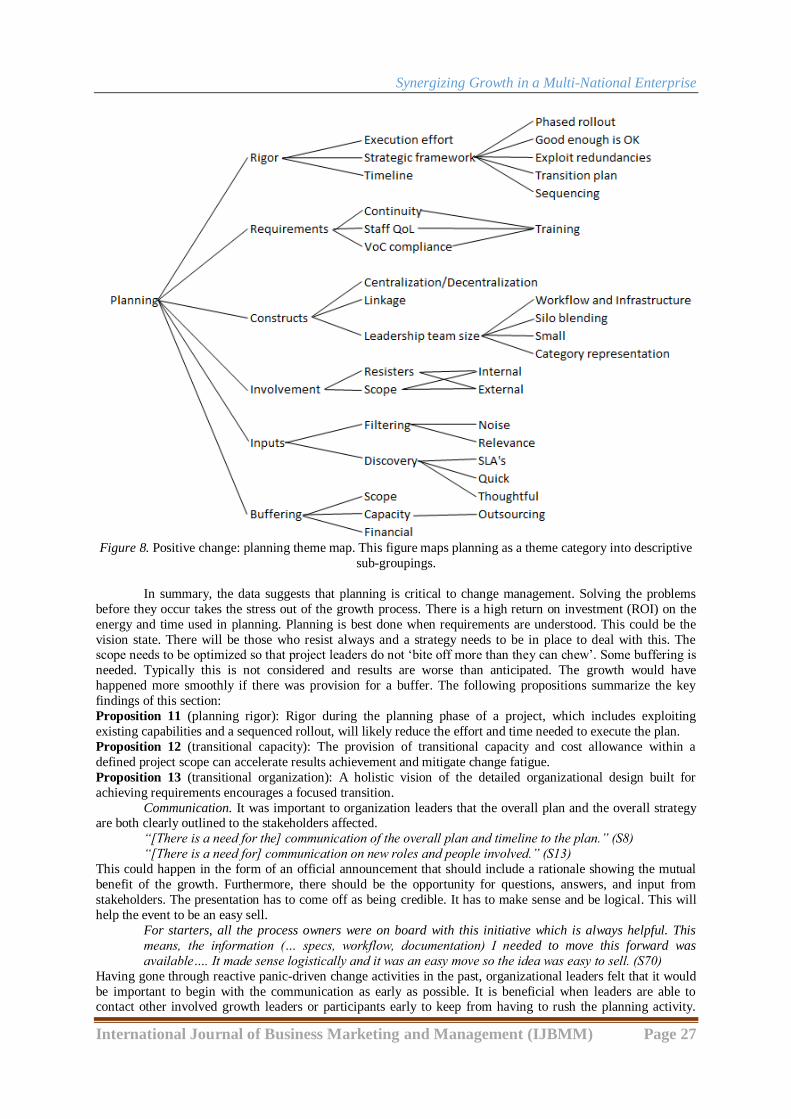
Planning. Not surprisingly, the most frequently occurring driver of growth success was planning. Within this proactive code section, a number of comments came up that were interesting as represented in
Figure 8 below. The organization leaders indicated that significant attention needed to be given to planning,
including critical aspects such as rigor, requirements, constructs, involvement, inputs, and buffering. The data
suggested that there should be broad involvement to get buy-in; however, it should be understood up front that
not everyone is going to get on board. Additionally, the execution team should be small for quick decision
making. The team may be allocated by category or by sector. The opportunity discovery process is critical for
the development of a fulsome plan. Organization leaders indicated that discovery should be focused, quick, and
thoughtful. All the relevant information should be gathered, including service level agreements (SLAs),
specifications, and contractual agreements. The planning activity should include the units involved but also
consider external dependencies. Attention should be given to make the plan easy to execute with a detailed
timeline for the transition. The plan should include exploiting redundancies, working with a centralized service model, not reinventing processes that already work, not creating new silos, and making sure that infrastructure
continuously needs to be aligned with workflows when they are moved. Participants in the research indicated
that a phased rollout is easier for participants to absorb; however, the workflows must be capable to create
deliverables within the specifications prior to a significant migration of work. The strategic framework must be
robust and not be subject to prioritization based on emotional judgments or noise. The integration plan should be
budgeted such that the P&Ls are not damaged during the transition. This does not otherwise incentivize
stakeholders to make the change. Capacity must be considered also, through the allocation of accountability to
make sure local capacity, or outsourced capacity, is available. The plan must optimally preserve the quality of
life of the participants, while maintaining business continuity for clients. There must also be provision for
adequate training, including skills needed for new workflows.
Synergizing Growth in a Multi-National Enterprise
International Journal of Business Marketing and Management (IJBMM) Page 27
Figure 8. Positive change: planning theme map. This figure maps planning as a theme category into descriptive
sub-groupings.
In summary, the data suggests that planning is critical to change management. Solving the problems
before they occur takes the stress out of the growth process. There is a high return on investment (ROI) on the
energy and time used in planning. Planning is best done when requirements are understood. This could be the
vision state. There will be those who resist always and a strategy needs to be in place to deal with this. The scope needs to be optimized so that project leaders do not „bite off more than they can chew‟. Some buffering is
needed. Typically this is not considered and results are worse than anticipated. The growth would have
happened more smoothly if there was provision for a buffer. The following propositions summarize the key
findings of this section:
Proposition 11 (planning rigor): Rigor during the planning phase of a project, which includes exploiting
existing capabilities and a sequenced rollout, will likely reduce the effort and time needed to execute the plan.
Proposition 12 (transitional capacity): The provision of transitional capacity and cost allowance within a
defined project scope can accelerate results achievement and mitigate change fatigue.
Proposition 13 (transitional organization): A holistic vision of the detailed organizational design built for
achieving requirements encourages a focused transition.
Communication. It was important to organization leaders that the overall plan and the overall strategy are both clearly outlined to the stakeholders affected.
“[There is a need for the] communication of the overall plan and timeline to the plan.” (S8)
“[There is a need for] communication on new roles and people involved.” (S13)
This could happen in the form of an official announcement that should include a rationale showing the mutual
benefit of the growth. Furthermore, there should be the opportunity for questions, answers, and input from
stakeholders. The presentation has to come off as being credible. It has to make sense and be logical. This will
help the event to be an easy sell.
For starters, all the process owners were on board with this initiative which is always helpful. This
means, the information (… specs, workflow, documentation) I needed to move this forward was
available…. It made sense logistically and it was an easy move so the idea was easy to sell. (S70)
Having gone through reactive panic-driven change activities in the past, organizational leaders felt that it would
be important to begin with the communication as early as possible. It is beneficial when leaders are able to contact other involved growth leaders or participants early to keep from having to rush the planning activity.
Synergizing Growth in a Multi-National Enterprise
International Journal of Business Marketing and Management (IJBMM) Page 28
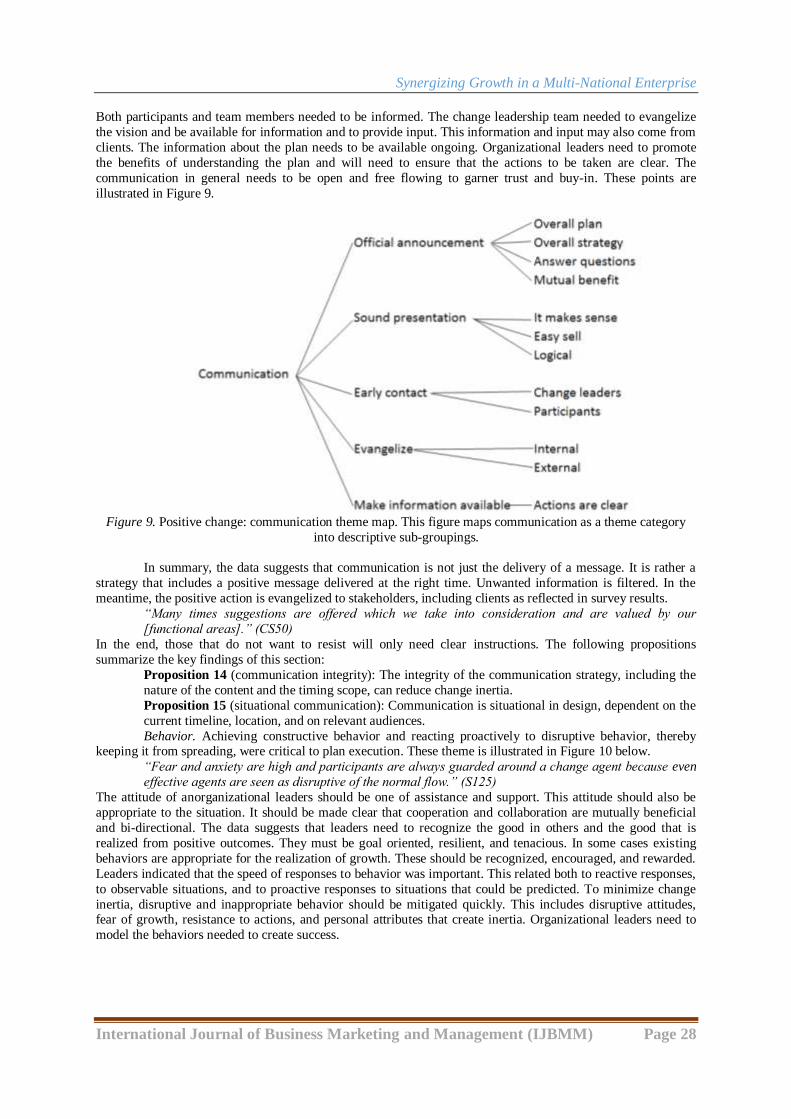
Both participants and team members needed to be informed. The change leadership team needed to evangelize
the vision and be available for information and to provide input. This information and input may also come from
clients. The information about the plan needs to be available ongoing. Organizational leaders need to promote
the benefits of understanding the plan and will need to ensure that the actions to be taken are clear. The
communication in general needs to be open and free flowing to garner trust and buy-in. These points are
illustrated in Figure 9.
Figure 9. Positive change: communication theme map. This figure maps communication as a theme category
into descriptive sub-groupings.
In summary, the data suggests that communication is not just the delivery of a message. It is rather a
strategy that includes a positive message delivered at the right time. Unwanted information is filtered. In the
meantime, the positive action is evangelized to stakeholders, including clients as reflected in survey results.
“Many times suggestions are offered which we take into consideration and are valued by our
[functional areas].” (CS50)
In the end, those that do not want to resist will only need clear instructions. The following propositions
summarize the key findings of this section:
Proposition 14 (communication integrity): The integrity of the communication strategy, including the
nature of the content and the timing scope, can reduce change inertia.
Proposition 15 (situational communication): Communication is situational in design, dependent on the
current timeline, location, and on relevant audiences.
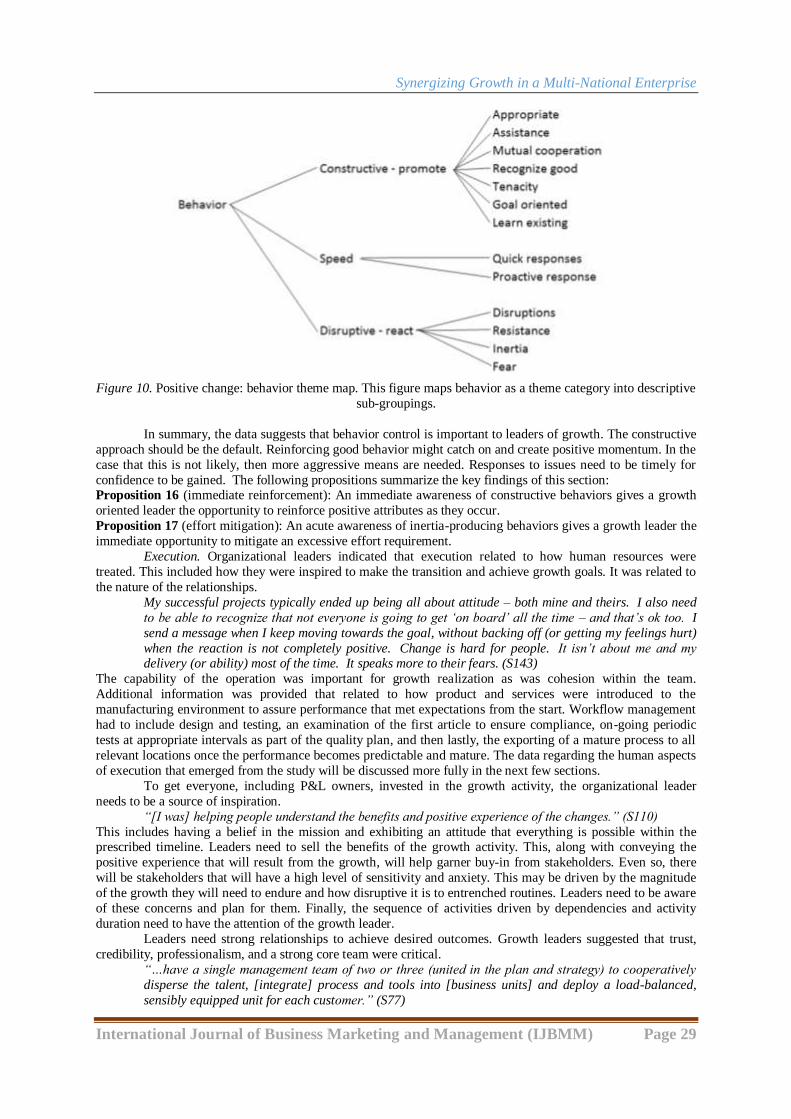
Behavior. Achieving constructive behavior and reacting proactively to disruptive behavior, thereby keeping it from spreading, were critical to plan execution. These theme is illustrated in Figure 10 below.
“Fear and anxiety are high and participants are always guarded around a change agent because even
effective agents are seen as disruptive of the normal flow.” (S125)
The attitude of anorganizational leaders should be one of assistance and support. This attitude should also be
appropriate to the situation. It should be made clear that cooperation and collaboration are mutually beneficial
and bi-directional. The data suggests that leaders need to recognize the good in others and the good that is
realized from positive outcomes. They must be goal oriented, resilient, and tenacious. In some cases existing
behaviors are appropriate for the realization of growth. These should be recognized, encouraged, and rewarded.
Leaders indicated that the speed of responses to behavior was important. This related both to reactive responses,
to observable situations, and to proactive responses to situations that could be predicted. To minimize change
inertia, disruptive and inappropriate behavior should be mitigated quickly. This includes disruptive attitudes, fear of growth, resistance to actions, and personal attributes that create inertia. Organizational leaders need to
model the behaviors needed to create success.
Synergizing Growth in a Multi-National Enterprise
International Journal of Business Marketing and Management (IJBMM) Page 29
Figure 10. Positive change: behavior theme map. This figure maps behavior as a theme category into descriptive
sub-groupings.
In summary, the data suggests that behavior control is important to leaders of growth. The constructive
approach should be the default. Reinforcing good behavior might catch on and create positive momentum. In the
case that this is not likely, then more aggressive means are needed. Responses to issues need to be timely for
confidence to be gained. The following propositions summarize the key findings of this section: Proposition 16 (immediate reinforcement): An immediate awareness of constructive behaviors gives a growth
oriented leader the opportunity to reinforce positive attributes as they occur.
Proposition 17 (effort mitigation): An acute awareness of inertia-producing behaviors gives a growth leader the
immediate opportunity to mitigate an excessive effort requirement.
Execution. Organizational leaders indicated that execution related to how human resources were
treated. This included how they were inspired to make the transition and achieve growth goals. It was related to
the nature of the relationships.
My successful projects typically ended up being all about attitude – both mine and theirs. I also need
to be able to recognize that not everyone is going to get „on board‟ all the time – and that‟s ok too. I
send a message when I keep moving towards the goal, without backing off (or getting my feelings hurt)
when the reaction is not completely positive. Change is hard for people. It isn‟t about me and my delivery (or ability) most of the time. It speaks more to their fears. (S143)
The capability of the operation was important for growth realization as was cohesion within the team.
Additional information was provided that related to how product and services were introduced to the
manufacturing environment to assure performance that met expectations from the start. Workflow management
had to include design and testing, an examination of the first article to ensure compliance, on-going periodic
tests at appropriate intervals as part of the quality plan, and then lastly, the exporting of a mature process to all
relevant locations once the performance becomes predictable and mature. The data regarding the human aspects
of execution that emerged from the study will be discussed more fully in the next few sections.
To get everyone, including P&L owners, invested in the growth activity, the organizational leader
needs to be a source of inspiration.
“[I was] helping people understand the benefits and positive experience of the changes.” (S110)
This includes having a belief in the mission and exhibiting an attitude that everything is possible within the prescribed timeline. Leaders need to sell the benefits of the growth activity. This, along with conveying the
positive experience that will result from the growth, will help garner buy-in from stakeholders. Even so, there
will be stakeholders that will have a high level of sensitivity and anxiety. This may be driven by the magnitude
of the growth they will need to endure and how disruptive it is to entrenched routines. Leaders need to be aware
of these concerns and plan for them. Finally, the sequence of activities driven by dependencies and activity
duration need to have the attention of the growth leader.
Leaders need strong relationships to achieve desired outcomes. Growth leaders suggested that trust,
credibility, professionalism, and a strong core team were critical.
“…have a single management team of two or three (united in the plan and strategy) to cooperatively
disperse the talent, [integrate] process and tools into [business units] and deploy a load-balanced,
sensibly equipped unit for each customer.” (S77)
Synergizing Growth in a Multi-National Enterprise
International Journal of Business Marketing and Management (IJBMM) Page 30
These relationships provide the capability, trust, and resiliency needed during a transition. There also needs to
be a significant amount of cohesion and alignment within the team. When these relationships are strong and
autonomous, leadership teams can push the organization forward quickly.
In order for a leader to be successful during times of radical growth in a moderately dynamic market,
the capacity of the operation and the human resources component needs to be capable. Ideally in a multinational
organization, the facility needs to have a 24-hour service scenario even if it means that increased shift coverage
is hired. This „always on‟ perspective makes it possible for additional capability to be available to transitioning business units and it makes it possible for operational issues to be remedied quickly.
“Adding temporary support help[ed] the team to go through [the] transition.” (S19)
This availability also helps with quick turn-around times and overall business continuity. The business unit
should be load balanced to avoid capacity shocks that could compromise progress along the transformational
roadmap. When a new business unit is created, it should be deployed with capacity that is also load balanced.
Otherwise, it will experience an extra measure of needless stress, retarding the rate at which it will mature. Staff
recruiting is very important to the business. Training should be immersive and happen within the business unit.
A too conservative posture on training will add to effort waste, task complexity, and will create rework. The
staff should be augmented such that the capacity is on the high side during the introduction of the new
production work, or whatever the growth activity is that will happen as previously discussed. Training needs
should be assessed and facilitated as applicable; however, if work can be achieved without additional headcount then this preserves capacity that would have otherwise been redirected to training. The data regarding headcount
and load balancing showed that an awareness of the SLAs in play are critical to know. They should be achieved
from the start while volume throughput is low to avoid negativity. The pace is then set as the volume increases.
The implications of the pace should be thoroughly understood and introduced during times of negotiation, as
overly aggressive SLAs can compromise profitability potential. Each business unit needs to absorb all SLAs as
operative norms into their business unit. Additionally, comments from leaders suggested that thorough rate
negotiations lead to profitability. It is worth the effort. From here the multinational is able to exploit training and
focus on the recruiting effort, assuring that the best people are hired.
Cohesion within the team and external to other teams is critical to the speed of growth achieved. The
plan must be designed to preserve business continuity during any transition.
Part of the success was the continuity between the two teams. We didn‟t just off-load the work, but
created an extension of [the team] in [location]. They do things like we do things in [location]. (S155) Business continuity may be affected by the dispersion of talent and tools. Decision making involves dividing the
processes so that more people could be involved without affecting anyone who already had large tasks to
perform. The data suggested that every stakeholder needed to have a piece of the plan to perform. A cohesive
team will have a united front with regard to the plan, strategy, and organizational goals.
With execution comes the need for workflows to function as expected. Deliverables need to be within
specification tolerances before they are delivered.
“[Function] spec tests …this is the first thing that needs to be verified…can the facility meet the spec
requirements?” (S93)
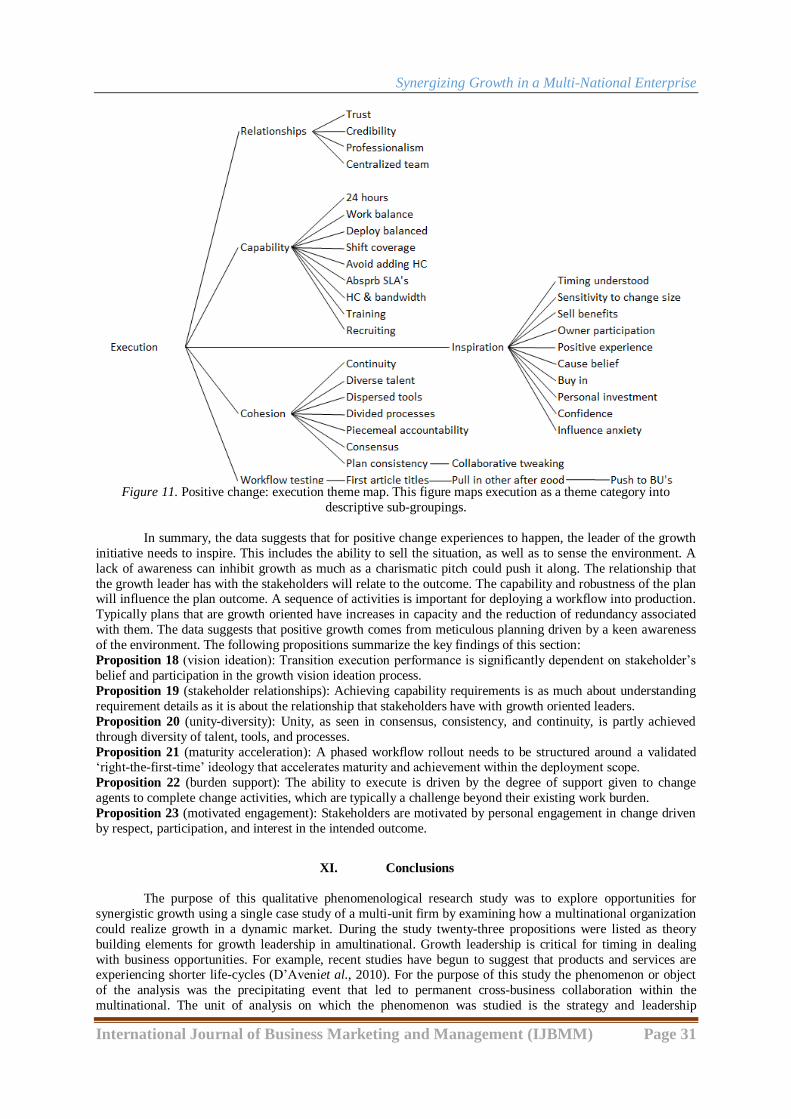
The data that emerged from the leaders, as illustrated in Figure 11 below, suggested that the roadmap for
workflow development and maturity has three critical milestones; (a) pull in „first article‟ products by type, (b)
pull in the rest of the product types individually, and (c) push the workflow out to all business units. Once a workflow proof of concept (POC) has been set up and tested for a deliverable spec, the „first article‟ to be
shipped must be inspected rigorously before any delivery can be made. When the reliability of the deliveries is
at a suitable level, other specifications can be introduced to the workflow. Synergies between product
specifications allow for a variety of deliverables to be executed within the workflow; however, the scope of
deliverables needs to be specified so as to not stress the workflow. This leads to a risk for the introduction of
non-conformities. When the workflow is mature on the designated variety of specifications, it can be exploited
in as many business units as possible. A workflow development plan with these steps can optimize synergy,
utilization of resources, and positively influence profitability.
Synergizing Growth in a Multi-National Enterprise
International Journal of Business Marketing and Management (IJBMM) Page 31
Figure 11. Positive change: execution theme map. This figure maps execution as a theme category into
descriptive sub-groupings.
In summary, the data suggests that for positive change experiences to happen, the leader of the growth
initiative needs to inspire. This includes the ability to sell the situation, as well as to sense the environment. A
lack of awareness can inhibit growth as much as a charismatic pitch could push it along. The relationship that
the growth leader has with the stakeholders will relate to the outcome. The capability and robustness of the plan will influence the plan outcome. A sequence of activities is important for deploying a workflow into production.
Typically plans that are growth oriented have increases in capacity and the reduction of redundancy associated
with them. The data suggests that positive growth comes from meticulous planning driven by a keen awareness
of the environment. The following propositions summarize the key findings of this section:
Proposition 18 (vision ideation): Transition execution performance is significantly dependent on stakeholder‟s
belief and participation in the growth vision ideation process.
Proposition 19 (stakeholder relationships): Achieving capability requirements is as much about understanding
requirement details as it is about the relationship that stakeholders have with growth oriented leaders.
Proposition 20 (unity-diversity): Unity, as seen in consensus, consistency, and continuity, is partly achieved
through diversity of talent, tools, and processes.
Proposition 21 (maturity acceleration): A phased workflow rollout needs to be structured around a validated „right-the-first-time‟ ideology that accelerates maturity and achievement within the deployment scope.
Proposition 22 (burden support): The ability to execute is driven by the degree of support given to change
agents to complete change activities, which are typically a challenge beyond their existing work burden.
Proposition 23 (motivated engagement): Stakeholders are motivated by personal engagement in change driven
by respect, participation, and interest in the intended outcome.
XI. Conclusions
The purpose of this qualitative phenomenological research study was to explore opportunities for
synergistic growth using a single case study of a multi-unit firm by examining how a multinational organization
could realize growth in a dynamic market. During the study twenty-three propositions were listed as theory
building elements for growth leadership in amultinational. Growth leadership is critical for timing in dealing
with business opportunities. For example, recent studies have begun to suggest that products and services are experiencing shorter life-cycles (D‟Aveniet al., 2010). For the purpose of this study the phenomenon or object
of the analysis was the precipitating event that led to permanent cross-business collaboration within the
multinational. The unit of analysis on which the phenomenon was studied is the strategy and leadership

Synergizing Growth in a Multi-National Enterprise
International Journal of Business Marketing and Management (IJBMM) Page 32
elements that result in sustainable desired outcomes. Sustainable outcomes are achievable across multiple
product life-cycles if growth leadership within the sequence of life-cycles is optimized to achieve revenue
opportunity.
XII. Contributions to Theory
The primary contribution of this article is new empirical insights about the effects of leadershipon
growth realization in a multinational. These results are, therefore, relevant to the achievement of sustained
profitability and competitive advantage by focusing a multi-unit firm on business unit capability and
growth.Twenty-threepropositions were extracted from the participants instigated by a precipitated event that
contribute to theory on growth leadership in a multinational with a global supply chain. The result is outcomes
that are influencedby growth leadership. These are described in detail and are useful for understanding the achievement of sustained corporate advantage.
XIII. Limitations and Future Research
The authorattempted to develop generalizable theoretical findings based on the empirical results of a case study. Even so, this study encountered several limitations concerning theory and empirical study. The
limitations were as follows:
There are some weaknesses regarding the generalizability of the findings. The single case study
approach was based on approximately twenty in-depth interviews. Given that the phenomenon under
investigation is novel and complex, this methodological choice seems reasonable. The research method
mandates that in-depth observation is required for collecting and analyzing the resultant holistic data
(Eisenhardt, 1989; Miles & Huberman, 1994; Siggelkow 2007; Yin, 1994). The choice of a phenomenological
case study using a qualitative approach is affirmed; however, the generalizability of results is not exact due to
the context of the case. The context is defined as a moderately dynamic environment, a large size organization
with a multi-national organizational structure, and a business with a relatively low degree of relatedness within a
vertically integrated value chain. Other firm-specific factors, such as company history, may influence the
exactness of the generalizations. The author understands that comparative case studies within similar contexts would help better ground evolving theories.
The author anticipates that the limitations will stimulate further research as organizational performance
is significantly complex and situational. These limitations are meant to stimulate further thinking. By studying
the distinctive features of growth leadership, the author hopes that interest has been sparked on
researchingaspects of growth performance that have not been covered.
References [1] Amit, R. &Livnat, J. (1988). Diversification strategies, business cycles and economic performance.
Strategies Management Journal, 9, 99-110. [2] Anand, B. N. &Byzalov, D. (2007). Diversification and firm value: How important is the
diversification discount versus systematic heterogeneity? (Unpublished working paper). Harvard
Business School, Cambridge, MA.
[3] Ansoff, I. (1965). Corporate strategy: An analytic approach to business policy for growth and
expansion. New York, NY: McGraw-Hill.
[4] Barney, J. B. (1986). Strategic factor markets: Expectations, luck and business strategy. Management
Science, 42, 1231-1341.
[5] Barney, J. B. (1991). Firm resources and sustained competitive advantage. Journal of Management, 17,
151-166.
[6] Barney, J. B. (2007). Gaining and sustaining competitive advantage. (2nd ed.). Upper Saddle River,
NJ: Prentice Hall. [7] Beer, M. (1964). Leadership, employee needs, and motivation. Doctoral dissertation retrieved from
Proquest Digital Dissertations. (AAT 302120390)
[8] Berger, A. N., Hanweck, G. A., & Humphrey, D. B. (1987). Competitive viability in banking: Scale,
scope and product mix economies. Journal of Monetary Economics, 20, 501-520.
[9] Berger, P. &Ofek, E. (1995). Diversificaton‟s effect on firm value. Journal of Financial Economics,
37, 39-65.
[10] Bernheim, B. D. &Whinston, M. D. (1990). Multimarket contact and collusive behavior. The RAND
Journal of Economics, 1-26.
Synergizing Growth in a Multi-National Enterprise
International Journal of Business Marketing and Management (IJBMM) Page 33
[11] Besanko, D., Dranove, D., &Shanley, M. (2000). Economics of Strategy. New York, NY: John Wiley
& Sons.
[12] Bettis, R. (1981). Performance differences in related and unrelated diversified firms. Strategic
Management Journal, 2, 379-393.
[13] Bloch, T. (2008). Dissynergies of mergers among local banks (No. 192). Working paper
series//Johann-Wolfgang-Goethe-Universität, Frankfurt am Main:
FachbereichWirtschaftswissenschaften Finance & Accounting. Retrieved from: http://www.econstor.eu/bitstream/10419/36635/1/587977264.pdf
[14] Bowman, E. H. &Helfat, C. E. (2001). Does corporate strategy matter? Strategic Management Journal,
22(1), 1-23.
[15] Boyd, H. W., &Headen, R. S. (1978). Definition and management of the product-market
portfolio. Industrial Marketing Management, 7(5), 337-346.
[16] Campbell, A. &Goold, M. (2000). The collaborative enterprise: Why links between business units often
fail and how to make them work. New York, NY: Basic Books.
[17] Cappron, L. (1999). The long term performance of horizontal acquisitions. Strategic Management
Journal, 20, 987-1018.
[18] Capron, L., Dussuage, P., &Michell, W. (1998). Resource redeployment following horizontal
acquisitions in Europe and North America, 1988-1992. Strategic Management Journal, 19(7), 631-661. [19] Christensen, H. K. & Montgomery, C. A. (1981). Corporate economic performance: Diversification
strategy versus market structure. Strategic Management Journal, 2(4), 327-343.
[20] Collins, D. J. & Montgomery, C. A. (2005). Corporate strategy: A resource-based approach (2nd ed.).
New York, NY: Irwin McGraw-Hill.
[21] Conner, K. (1991). A historical comparison of resource-based theory and five schools of thought within
industrial organization economics: Do we have a new theory of the firm? Journal of Management, 17,
121-154.
[22] Creswell, J.W. (2014). Research design: Qualitative, quantitative, and mixed methods approaches.
Thousand Oaks, CA: Sage.
[23] D‟Aveni, R.A., Dagnino,G.B.,& Smith, K.G. (2010). The age of temporary advantage. Strategic
Management Journal, 31, 1371-1385.
[24] Davis, R. & Thomas, L. G. (1993). Direct estimation of synergy, a new approach to the diversity-performance debate. Management Science, 39(11), 1334-1346.
[25] Deller, S. C., Chicoine, D. L., &Walzer, N. (1988). Economies of size and scope in rural low-volume
roads. Review of Economics and Statistics, 70(3), 459-465.
[26] Denzin, N. (1989). The research act. Englewood Cliffs, NJ: Prentice Hall.
[27] Depraz, N., Varela, F.,&Vermersch, P. (2003). On becoming aware: A pragmatics of experiencing.
Philadelphia, PA: John Benjamins.
[28] Devos, E., Kadapakkam, P. R., & Krishnamurthy, S. (2009). How do mergers create value? A
comparison of taxes, market power, and efficiency improvements as explanations for synergies. The
Review of Financial Studies, 22(3), 1179-1211.
[29] Dutta, S., Dutta, U., & Das, S. (2011). Creating synergy through merger and acquisition integration: An
overview. International Journal of Multidisciplinary Studies, 1(3), 168-175. [30] Eisenhardt, K.M. (1989). Building theories from case study research. Academy of Management Review,
14: 532-550.
[31] Eisenhardt, K. M. &Galunic, D. (2000). Coevolving: At last, a way to make synergies work. Harvard
Business Review, 78(January-February), 91-101.
[32] Falk, T., Schepers, J., Hammerschmidt, M., & Bauer, H. H. (2007). Identifying cross-channel
dissynergies for multichannel service providers. Journal of Service Research, 10(2), 143-160.
[33] Fleishman, E. & Harris, E. (1962). Patterns of leadership behavior related to employee grievances and
turnover. Personnel Psychology, 15, 43-56.
[34] Freeman, W.J. (2000). How brains make up their minds. New York, NY: Columbia University Press.
[35] Fuller, R. B. (1975). Synergetics: Explorations in the geometry of thinking. New York, NY: Macmillan Publishing Company, Inc.
[36] Ghemawat, P. (1988). Sustainable advantage. Harvard Business Review, 64(5), 53-58.
[37] Gold, M., &Luchs, K. (1993). Why diversity? Four decades of management thinking. Academy of
Management Executive, 7-25.
[38] Goold, M. & Campbell, A. (1998). Desperately seeking synergy. Harvard Business Review, 76, 130-
143.
Synergizing Growth in a Multi-National Enterprise
International Journal of Business Marketing and Management (IJBMM) Page 34
[39] Grant, R. M. &Jammine, A. (1988). Performance differences between the Wrigley/Rumelt strategic
categories. Strategic Management Journal, 9, 333-346.
[40] Grant, R. M. (2005). Contemporary strategy analysis: Concepts, techniques, applications. (5th ed.).
Malden, MA: Blackwell Publishers.
[41] Gruca, T., Nath, D., &Mehra, A. (1997). Exploiting synergy for competitive advantage. Long Range
Planning, 30(4), 481–482, 605–611.
[42] Gupta, A. K. &Govindarajan, V. (1986). Resource sharing among SBUs: Strategic antecedents and administrative implications. Academy of Management Journal. 30, 477-500.
[43] Hill, C. W. L., Hitt, M. A., &Hoskisson, R. E. (1992). Cooperative versus competitive structures in
related and unrelated diversified firms. Organizational Science, 3(4), 501-521.
[44] Hill, C. W. L. &Hosskisson, R. E. (1994). Strategy and structure in the multiproduct firm. Academy of
Management Review, 12(2), 331-341.
[45] Jones, G. R. & Hill, C. W. (1988). Transaction cost analysis of strategy‐structure choice. Strategic
Management Journal, 9(2), 159-172.
[46] Karnani, A. &Wernerfelt, B. (1985). Multiple point competition. Strategic Management Journal, 6(1),
87-96.
[47] Lamnek, S. (1995). Qualitative sozial/forschung. (3rd ed.). Muenchen, Germany: PsychologieVerlags Union.
[48] Lang, L. &Stulz, R. (1994). Tobin‟s corporate diversification and firm performance. Journal of
Political Economy, 102, 1248-1280.
[49] Larsson, R. & Finkelstein, S. (1999). Integrating strategic, organizational, and human resource
perspectives on mergers and acquisitions: A case survey of synergy realization. Organization Science,
10(1), 1-26.
[50] Lincoln, Y.S.,& Guba, E.G. (1985). Naturalistic inquiry. Newbury Park, CA: Sage.
[51] Loomer, S. & Harington, A. (2003). Business valuation-sharing synergies: Ignoring or over-estimating
them is a disservice to vendors and acquirers. CA Magazine-Chartered Accountant, 136(4), 41-42.
[52] Martin, J. (2002). Cross-business synergies: recombination, modularity, and the multi-business team.
Dissertation, Stanford University.
[53] Martin, J. A. &Eisenhardt, K. M. (2001). Exploring cross-business synergies. Academy of Management Proceedings & Membership Directory, H1-H6.
[54] Mayring, P. (1996). Einfuehrung in die qualitative sozialforschung:
Eineanleitungzuqualitativemdenken.Weinheim: Belz/PVU.
[55] Michel, J. &Hambrick, D. (1992). Diversification posture and top management team characteristics.
Academy of Management Journal, 35, 9-37.
[56] Miles, M. B. & Huberman, A. M. (1994). Qualitative data analysis: an expanded sourcebook.
Thousand Oaks, CA: Sage Publishing.
[57] Moustakas, C. (1994). Phenomenological research methods. Thousand Oaks, CA: Sage.
[58] Mueller-Stewens, G. & Knoll, S. (2006). Smart linking: Steigerung von wachstum und
profitabilitaetdurchinnovativesgeschaeftseinheitenuebergreifendessynergienmanagement. University of
St. Gallen, Switzerland. [59] Nelson, R. R. &Winter, S. G. (1982). An evolutionary theory of economic change. Cambridge, MA:
Harvard University Press.
[60] Palich, L., Cardinal, L. & Miller, C. (2000). Curvilinearty in the diversification-performance linkage:
An examination of over three decades of research. Strategic Management Journal, 21, 155-174.
[61] Peteraf, M. (1993). The cornerstones of competitive advantage: A resource-based view. Strategic
Management Journal, 14, 179-191.
[62] Porter, M. E. (1985). Competitive advantage: Creating and sustaining superior performance. New
York, NY: Free Press.
[63] Prahalad, C. K. & Hamel, G. (1990). The core competence of the corporation. Harvard Business
Review, 68(3), 79-91.
[64] Punch, K.F. (1998). Introduction to social research: Quantitative and qualitative approaches. London,
UK: Sage Publications. [65] Ramanujam, V. &Varadarajan, P. (1989). Research on corporate diversification: A synthesis. Strategic
Management Journal, 10, 523-551.
[66] Rose, A. (1990). Synergistics: A strategy for speed in the „90‟s. Business Quarterly, 54(4), 70-75.
[67] Rumelt, R. (1991). How much does industry matter? Strategic Management Journal, 12, 167-185.
[68] Shaver, J. M. (2006). A paradox of synergy: Contagion and capacity effects in mergers and
acquisitions. Academy of Management Review, 31(4), 962-976.
[69] Siggelkow, N. (2007). Persuasion with case studies. Academy of Management Journal, 50, 20-24.
Synergizing Growth in a Multi-National Enterprise
International Journal of Business Marketing and Management (IJBMM) Page 35
[70] Simmonds, P. (1990). The combined diversification breadth and mode dimensions and the performance
of large diversified firms. Strategic Management Journal, 11, 399-411.
[71] Sourabh, S. (n.d.). Calculating synergies in mergers and acquisitions industry. Retrieved from
MBASkool.com.
[72] Stake, R.E. (1995). The art of case study research. Thousand Oaks, CA: Sage Publications.
[73] Strauss, A.,& Corbin, J. (1990). Basics of qualitative research techniques and procedures for
developing grounded theory. New York, NY: Sage Publications. [74] Strauss, A.,& Corbin, J. (1996). Grounded Theory: Grundlagen qualitative sozialforschung.Weinheim,
Germany: Beltz.
[75] Sutton, R.T.& Straw, B.M. (1995). What theory is not.Administrative Studies Quarterly, 40, 371-384.
[76] Synergy. (n.d.). Dictionary.com Unabridged. Retrieved September 30, 2014, from Dictionary.com
website: http://dictionary.reference.com/browse/synergy
[77] Tannenbaum, A. S. (1962). Control in organizations: Individual adjustment and organizational
performance. Administrative Science Quarterly, 236-257.
[78] Tanriverdi, H. &Venkatraman, N. (2005). Knowledge relatedness and the performance of the
multibusiness firm. Strategic Management Journal, 26, 97-119.
[79] Teece, D. (1980). Economies of scope and the scope of the enterprise. Journal of Economic Behavior
and Organization, 1(3), 223-247. [80] Vancil, R. (1980). Decentralization: Managerial ambiguity by design. New York, NY: Financial
Executives Research Foundation.
[81] Weick, K.E. (1995). What theory is not, theorizing is. Administration Science Quarterly, 40, 385-391.
[82] Weick, K.E., Sutcliffe, K.M.,& Obstfeld, D. (2005). Organizing and the process of sensemaking.
Organization Science, 16(4), 409-421.
[83] Wernerfelt, B. (1984). A resource‐based view of the firm. Strategic Management Journal, 5(2), 171-
180.
[84] Yin, R.K. (1994). Case study research: design and methods. Newbury Park, CA: Sage Publications.
[85] Zhou, Y. M. (2011). Synergy, coordination costs, and diversification choices. Strategic Management
Journal, 32, 624-639.