Embed Size (px)
Citation preview

Stock code: 2347
Synnex Technology International Corporation
2016 Annual Review
www.synnex-grp.com
mops.twse.com.tw

Spokesperson
Evans S.W. Tu
President
(02) 2506-3320
Stock registration agent
Stock Affairs Department of Chinatrust Commercial Bank
5F, No.83, Sec. 1, Chongqing S. Rd., Taipei, Taiwan,
R.O.C.
(02) 2181-1911
www.chinatrust.com.tw
Deputy Spokesperson
Oliver Chang
AVP Financial
(02) 2506-3320
CPA for the latest financial statement
PricewaterhouseCoopers
Cuimiao Ye, Yulong Wu
27F., No.333, Sec. 1, Keelung Rd., Taipei, Taiwan, R.O.C.
(02) 2729-6666
www.pwc.tw
Headquarters
4F, No.75, Sec. 3, Minsheng E. Rd., Taipei 104, Taiwan, R.O.C. Global Depository Receipt (GDR) trading center
Luxembourg Stock Exchange
For your convenience, please check London Stock
Exchange for GDR trading information.
(website: www.londonstockexchange.com)
Ticker symbol: SYXZF
(02) 2506-3320
Kaohsiung branch
12F-2., No.290, Ersheng 1st Rd., Kaohsiung, Taiwan, R.O.C.
(07) 716-1001
Hong Kong branch
14F, Hutchison House, Hong Kong
(852) 2846-1888
Linkuo logistics center
No.15, Dinghu 9th St., Guishan Township, Taoyuan County, Taiwan,
R.O.C
(03) 328-9201
Taichung logistics center (Taichung branch)
No.35, Gongyequ 24th Rd., Nantun Dist., Taichung City, Taiwan,
R.O.C
(04) 2350-3456
China logistics center
Shanghai, Beijing, Nanjing, Chengdu, Shenyang, Hangzhou, Tianjin,
Xi'an, Qingdao, Guangzhou, Suzhou, Wuhan, Zhengzhou, Hefei,
Xiamen, Nanchang, Changsha, Jinan, Harbin, Ningbo
Australia logistics center
Melbourne, Sydney www.synnex-grp.com

Important Notice:
This Annual Review is a “short form” overview. It is designed to provide a concise summary of Synnex’s
activities and financial position for the year ending December 31, 2014. This Annual Review does not
represent or summarize all publicly available information about Synnex. There is other publicly available
information from Synnex’s Annual Report (only Chinese version), information that has been notified to the
Taiwan Stock Exchange Corp. and Securities And Futures Bureau, Financial Supervisory Commission,
Executive Yuan, R.O.C., and other information publicly released by Synnex.
Synnex's statements of its current expectations are forward-looking. These statements are subject to risks and
uncertainties that could cause actual results and events to differ materially, including possible fluctuations in
the demand for products and services, possible fluctuations in economic conditions affecting the industry
and its customers, Synnex's ability to provide new products and services and to gain consumer acceptance
for them, Synnex's ability to compete with existing and new competitors, and Synnex's ability to control its
expenses and cash usage. Synnex undertakes no obligation to update forward-looking statements to reflect
events or circumstances occurring after the issuance of Synnex's statements.
This Annual Review has been prepared by Synnex solely for the information of its shareholders. It is not
investment advice or an offer or solicitation for the purchase or sale of any financial instrument. While
reasonable care has been taken to ensure that the information contained herein is not untrue or misleading
at the time of publication, Synnex makes no representation that it is accurate or complete. The information
contained herein is subject to change without notice. Synnex and any of its officers and employees, to the
extent not disclosed above and to the extent permitted by law, may have long or short positions or may
otherwise be interested in any transactions or investments (including derivatives) referred to in this
publication. Neither Synnex nor any of its officers or employees accepts any liability for any direct, indirect
and/or consequential loss arising from any use of this publication or its contents. Copyright and database
rights protection exists in this publication and it may not be reproduced, distributed or published by any
person for any purpose without the prior express consent of Synnex. All rights are reserved.


Synnex……The stagecoach that
never stops Leading distribution services provider The leading 3C logistics and distribution services provider in Asia Pacific region
Globally unique business model
First of all, initiate quadruple channel operation model of sales, distribution, maintenance and CTO
(Configuration To Order).This successful business model has been copied from Taiwan to Australia, New
Zealand, Thailand and China/Hong Kong.
High value added distribution services provider
The solid logistic capabilities of Synnex provides upstream and downstream business partners with high
value added services, so that while the tough back office processing including inventory management,
maintenance and real-time production (CTO) are being taken care of by Synnex, customers from
downstream can concentrate on sales operations; while the complex sales distribution operations are
being taken care of by Synnex, suppliers from upstream can focus on R&D, production and branding.
During the activity chain of product flow, the critical integration role that Synnex played in midstream is
provision of high value-added services.
Non-stop positive growth cycle
Multi-brand franchise→ Increases customer numbers→ Provide high value-added back office logistics
services→ Establish dense distribution network→ Multi-product franchise→ Expand economic scale→
Lower operation expense ratio →Expand market share→ Multi-brand and multi-product
franchise→……….
Efficient back office operation mechanism
- Tailor made, self-developed digital nervous system - ERP information management system.
- Fast and convenient post-sales services network.
- Efficient and quality automatic warehousing and distribution operation.
- Tailor made real time production (CTO) center.
- “Synnex’s e-City” has become a leading 3C content website in Taiwan.
Comprehensive business philosophy
Maximize shareholder value, improve information transparency.
Maximize profits for customers and suppliers.
Provide reliable and satisfactory products and services to end-users.
Cultivate employees and maintain labor-management cooperation.
Satisfy corporate social responsibility.

2016 Consolidated Financial Performance
Unit: NTD
Item / Year 2015 2016 Increase (Decrease) (%)
Consolidated revenue (in bn) 322.1 342.7 6.4
Income before income tax (in bn) 3.74 5.73 53.2
Net Income attributable to owners
of the parent (in bn) 3.19 4.88 53.0
EPS (after retroactive adjustment)
(NTD) 1.91 2.92 52.9
Gross profit margin (%) 3.6 3.5 (2.8)
Operating expense ratio (%) 2.4 2.3 (4.2)
Operating income ratio (%) 1.2 1.2 -
Return on Equity (ROE) (%) 7.2 11.4 58.3
Average Collection Days 52 51 (2.0)
Average Inventory Turnover Days 40 39 (2.5)
Average Payment Turnover Days 36 34 (5.6)
↑58.3%
7.2
5.8 5.3 5
3.2
↑53.0%
310.7 312.6
330.3 331.5
322.1
↑6.4%
Consolidated revenue
Net Income attributable to
owners of parent
NT$ bn
NT$ bn
Return on Equity
342.7
322.1 331.5 330.3
312.6
4.9
3.2
5.0 5.3
5.8

INDEX
Letter to shareholders 1
Synnex highlights 6
Operation highlights 38
Financial information 63
Financial status, results of operations & risk management 67


Letter to shareholders 1
Letter to shareholders
Dear shareholders:
The economy in 2016 was faltering. Advanced countries, including the U.S.A, Japan, and some of the European countries, did
not perform as expected, and the growing dynamics of the emerging countries slowed down continuously. The uncertainty of
the Brexit effect was another factor that not only impacted the financial market and global trading, but also affected the
confidence of both consumers and investors. As the statistics of the Chung Hua Institution for Economic Research showed, the
global economy only grew by 2.4% in 2016, declining to the lowest point since the economic crisis in 2008 and indicating that
the global economy has been running into a “low-growth trap”.
The industries have been developed in a mature saturation period. Though new technologies, application, and products were
introduced to the market continuously, most of them were at the phase of trial, incubation, or endurance. It takes about two or
three years to popularize them to create substantial production value. The fierce fluctuation of the global exchange market and
the sly and changeable political and economic situations all over the world brought about more difficulties in the operation of
the business.
Facing the variation and challenge of the market environment, our global channel businesses spare no efforts and strive
cautiously and conscientiously to drive the IC component business in the Greater China Region by developing new products
and customers, adjusting and creating new business models, and integrating sales channels. The initiative to expand business
opportunities creates a steady growth of the performance to near 100 billion NT dollars. The channel business in Australia and
New Zealand was facing a challenge of economic depression and fierce fluctuation of the exchange rate. However, we take the
lead to establish the “cloud business” system and make use of the intellectual logistic capability to enhance the cooperation
relationship with the upstream and downstream manufacturers. These and the continuous development of new suppliers and
services support us to consolidate the leading position in the local market. Facing the saturated channel business market in
Taiwan, we are actively developing the mobile phone plan and technical service business and have brilliant operating results.
We also speed up the development of new markets including smart consumer electronics, gaming, and Internet of Things (IoT)
products to deploy new growing dynamics. The channel business in China has been facing a fast changing and challenging
operating environment. However, the substantial transformation of the organization and system over the past three years as
well as the streamlined structural operation model and analytical tool progressively improved our productivity, control
capability, and operating know-how and create a growth rate of 10% in 2016. Though the channel business in Hong Kong and
Macao declined in the consumer market, it grew substantially in the commercial and telecom fields and kept the leading
position in the local market. For the joint venture business, in North America, India, Middle East, Thailand, and Indonesia
created outstanding performance thanks to the teamwork. And I would like to take this opportunity to show my appreciation to
all of you.

2016 Annual Review 2
Though the challenge is still tough and the industry needs two to three years to start the transformation and expansion,
Synnex’s management team will root more deeply to enhance the strength and deploy our resources in new areas and business
in 2017. We will spare no efforts to implement our operating philosophy of streamlined channels, overcome the vague and
uncertain market environment, and embrace new opportunities in the transformation of the industry. I hope that all of you, the
shareholders of Synnex, can give us a strong urge and encouragement.
Below are the key 2016 highlights for our company:
1. Revenue and profit
Synnex’s 2016 consolidated revenue was NTD342.7 billion, representing 6.4% growth from the NTD 322.1 billion in
2015. The net profit after tax was NTD 4.88 billion or grew by 53% in comparison with the NTD 3.19 billion in 2015.
The EPS after tax was NTD 2.92, representing a growth rate of 53% in comparison with the NTD1.91 in 2015.
2. Concrete operating results
(1) Despite its market leading position in Taiwan, Australia, Hong Kong, Indonesia, Thailand, Synnex ranks as the
second largest distributor in India and China. The channel business ranks as the third largest distributor in the USA.
Overall, Synnex channel business operation ranks as the third largest distributor worldwide and the largest distributor
in Asia Pacific region.
(2) We set up sales channel with the large-scale chain stores, reinforce strategic cooperation with online shopping
channel, and minimize the stock management burden of the customers through Synnex systems and logistic
capabilities in order to strengthen close cooperation relationship.
(3) We have run the mobile phone plan business in Taiwan for many years and started enjoying the positive results. It
made a great contribution to the revenue and profit.
(4) The internal management system of the channel business in China was further optimized. The operating system and
control capability was improved continuously and created substantial benefits to bring the business back to the
direction of growth.
(5) The IC components business unceasingly enhanced its close cooperation with the upstream and downstream
industries to provide more flexible and resilient industrial chain services and drive the steady growth of the business.
(6) We integrated the logistic resources of the Group and established a company of sole proprietorship to provide
“intellectual logistics service” for both upstream and downstream partners and develop the logistics service business
along the supply chain .
The 2017 important production and sales policy:
1. Expansion of the mobile phone plans business
We takes the leading position in the mobile phone plans business in Taiwan and a brand new mobile phone plans business
system is under development for the year 2017 to improve the operating effectiveness and enhance the customer service.

Letter to shareholders 3
2. Expand new markets in the fields of smart consumer electronics, gaming, and IoT applications
The new fields and applications are currently at a phase of incubation. We will accelerate deployment and build up
dynamics for the growth in the future.
3. Accelerating the development of the “cloud service”
We will invest more in the cloud service business. In addition to the well-established operating system in Australia, we
will speed up the development of the markets in Taiwan, Hong Kong, Macao, China and Indonesia to grasp the
opportunities that this new business model creates.
4. Integration of resources to develop technical service business
We will integrate the technical service resources and operation systems of the Group to develop a technical service
business of high effectiveness. China will be the core market of the development.
5. Acceleration of multiple and flexible logistics service business
“Intellectual logistics service” is one of the most important core capabilities of Synnex. In addition to creating the
competitive advantages in the channel business, the logistics service itself is a business of great potential in the future. We
will speed up the development of this business in 2017.
6. Accelerating the operation management model R&D and innovation and secure the market competitive advantage
To maintain the competitive advantage and cope with the ever-changing market, an ongoing innovation on business and
technology management is necessary. In recent years, Synnex has been working on setting up a planning & management
system at its headquarters that is responsible for design of operations model, planning of operations mechanism, analysis
of operations and management of operational quality, while expanding software R&D team to enhance Synnex’s software
competitiveness. In 2017, the team will develop innovative business management technology and enhance core
competences and identify breakthrough opportunities for the Company.
Future Development Strategies
To pursue continuous and stable growth in this rapidly changing market environment full of uncertainties, Synnex will follow a
three point strategy (see the figure below), made up of multi-product, multi-channel and multi-nation strategies. Through these
strategies, we aim to create greater opportunities while effectively diversifying operational risks.

2016 Annual Review 4
Synnex’s development strategy
Impact of External Competitive Environment, Regulatory Environment, and Macroeconomic Environment
In terms of the external competitive environment, the market has been constantly changing and the service model has been
diversified for years. However, the Company has been continuously researching and developing an innovative business model,
design, and planning; also, implementing business analysis and quality management in response to such changing market
environment.
In terms of the regulatory environment, the Company has always paid close attention to and grasped domestic and foreign
policies and laws that may affect the Company’s finance and business, and adopted appropriate emergency measures to
safeguard the interests of the Company. With the frequent global economic and trade exchanges and the increasing fiscal
pressure faced by each nation, the “Based Erosion and Profit Shifting (BEPS)” issues had caused the government of each nation
to formulate relevant laws and regulations strictly. However, it has little impact on the Company since the Company has always
operated its business in compliance with the law and regulations of each nation.
In terms of the macro-economic environment, the Company has a large-scale business operation in Mainland China. Although
cross-strait relations may become uncertain, it is with little impact on the channel business operation. The Company’s market
development strategy is focusing on a multinational business market that will allow the Company to expand the market and
reduce business risks arising from operating in a single nation.
Multi-Territory
Multi-Category
Multi-Brand
Core
Business
Mechanis
m IC Components
Channel
Thailand
India
Middle East
IT
Channel
Telecom
Channel
Consumer
Electronics Channel
Multi-Channels
Multi-Marketplaces
Indonesia
Taiwan
Australia
New Zealand
Hong Kong
China
Multi-Products
Letter to shareholders 5
Last but not least, we would like to offer our sincere gratitude to our shareholders for their support and encouragement, and we
expect further guidance and support in the coming year. With consistent business philosophy and innovation, the management
team is committed to achieving excellence.
Best regards,

2016 Annual Review 6
I. Company profile .................................................................................................................................................... 7
1) Milestone ................................................................................................................................................................. 7
2) Awards ..................................................................................................................................................................... 9
II. Corporate Governance Report ............................................................................................................................ 11
1) Organization ........................................................................................................................................................... 11
2) Information on directors, supervisors, presidents, senior executives of divisions & department management ...... 14
3) Implementation of Corporate Governance ............................................................................................................. 20
4) Changes in shareholdings of directors, managers, and principal shareholders ....................................................... 32
III. Capital and shares ............................................................................................................................................... 33
1) Category of shares ................................................................................................................................................. 33
2) Shareholder structure ............................................................................................................................................. 33
3) Distribution of shareholding .................................................................................................................................. 33
4) Major shareholders ................................................................................................................................................ 33
5) Market price per share, Net assets per share, earning per share and dividends ...................................................... 34
6) The policy and implementation of dividends ......................................................................................................... 34
7) Uncompensated distribution of shares and its impact on company operation and EPS ......................................... 35
8) Information on employee bonus and compensation for directors and supervisors ................................................. 36
9) Buy back shares: None .......................................................................................................................................... 36
IV. Issuance of global depositary receipts, bonds, preferred shares and employee stock option ......................... 37
1) Global depositary receipts...................................................................................................................................... 37
2) Status of employee stock option: None .................................................................................................................. 37
3) Preferred shares: None ........................................................................................................................................... 37
4) Corporate bonds: None .......................................................................................................................................... 37
Synnex highlights

Synnex highlights 7
Synnex highlights
I. Company profile
1) Milestone
Setup date: September 12, 1988
Year Important significance 1988 ▪ Synnex Technology International Corporation was established with authorized capital of NTD2 hundred
million, and Matthew Feng-Chiang Miau served as chairman and Evans S.W. Tu served as president. ▪ MIS operations reached real-time requirement.
1989 ▪ Establish LEMEL brand. ▪ NTD 20 million was spent to purchase large mainframe computers and accessories to meet the needs of further
computerization. ▪ Established Kaohsiung and Taichung branches to expand south and central Taiwan business.
1990 ▪ Confirmed development information and communicate channel business, determined to adopt “open channel” operation, first initiating triple channel operation model of sales, distribution, and maintenance.
1991 ▪ The computer material management system won “The 1st outstanding information application awards” that conferred by Institute for Information Industry and accredited by all panel of judges.
1992 ▪ Established logistics delivery truck fleet to provide rapid delivery services of “half-day delivery” to customers in Taipei region.
1993 ▪ Linkuo logistics center officially opened. ▪ Established logistics delivery fleet in central and south region to provide rapid delivery services to customers in
south and central region. ▪ Introduced “small quantity, various type and one stop shopping" to the resellers to lower inventory risk for the
resellers and enhanced purchasing convenience. ▪ Introduced LEMEL PC
1994 ▪ Provided resellers with industry-leading "four half-day" (two days) rapid maintenance services ▪ Launched monthly journal of “Synnex’s shopping mall” which had become the resellers’ must-buy tools.
1995 ▪ Shares officially listed on Taiwan Stock Exchange that was the first listed distributor in Taiwan.
1996 ▪ Largest increase in stock price in 362 listed companies in the first half year of 1996.
1997 ▪ Provide rapid maintenance services of “repair tonight, retrieve the day after tomorrow” to customers. ▪ Communication resellers had reached 3000. ▪ Merge Laser Computer Ltd. (name changed to Synnex Technology International (HK) Ltd. in 2005) to expand
its reach to Hong Kong and China.
1998 ▪ The 2nd warehouse with highly automated warehousing operations in Linkou logistics center completed and started operation.
▪ Real time production center (Configuration-To-Order) of PC has completed, it is the first tailor made real time production line of PC for customers in Taiwan.
▪ Merge Australian subsidiary to expand reach to Australian market.
1999 ▪ Establish “cellular phone rapid repair services” throughout Taiwan to provide customers with “30 minutes cellular phone maintenance services.”
▪ Merge Compex Ltd. In Thailand (name changed to Synnex (Thailand) Co., Ltd. in 2002 and changed to Synnex (Thailand) Public Company Ltd. in 2008) to expand its reach to the Thailand market.
▪ The annual turnover of communication business has exceeded NTD10 billion, become one of the three major business of Synnex along with information and electronics components business.
2000 ▪ Provide customers with “cellular phone 2-year warranty” services. ▪ The third warehouse in Linkuo logistics center completed and started operation; it is an automatic guided
warehouse. ▪ Launch “Synnex e-City” website and “Dedicated website for Synnex resellers” to develop electronic marketing
and electronic services. ▪ Considering Synnex’s valuable management experience, Shang-Xun Culture Co., Ltd. decided to publish
“The stagecoach that never stops”.
2001 ▪ The Taichung logistics center with 7,300 pings (equal to 24,131.61 square meters (3.3057*7300)) started operation; its logistics capacity is 1.3 times of the Linkuo logistics center.
▪ The 5,200 ping (17,189.64 square meters) Logistics center in Australia officially started operation. ▪ With “cellular phone rapid maintenance center” upgraded to “Synnex maintenance center,” Synnex has
expanded its maintenance services to all 3C products sold. ▪ Integrate maintenance center, maintenance and collection center and resellers into “Synnex maintenance
network” to become the densest IT and Telecom maintenance network and also provide maintenance services to products not sold by Synnex.
▪ Develop Logistics service Provider (LSP)
(Continue on next page)

8 2016 Annual Review
(Continue last page)
Year Important significance
2002 ▪ The 2,700 ping (8,925.39 square meters) logistics center in Thailand started operation.
▪ The annual visitors of “Synnex e-City” has reach 9.5 million, its content has been referenced by 120
websites, the ICP (Internet Content Provider) role has been formed.
▪ Conduct stock swap strategy with Bestcom Infotech Corporation to cultivate IT commercial market
in Taiwan.
2003 ▪ Logistics center in Australia and Thailand has imported CTO customize real-time production
mechanism to provide customers with customize PC services.
▪ Use the outstanding services of “Synnex products” to develop brand marketing.
▪ The consolidated turnover has exceeded NTD100 billion and reach 108.2 billion.
2004 ▪ Merged and acquired Yongkang Enterprises and Teampo Tech Co., Ltd. to expand component and
parts business scale.
▪ Acquire shares in India’s Redington Group to expand its reach to India, Middle-East and Africa, the
global distribution channel layout has been formed.
2005 ▪ Shanghai logistics center started operation.
▪ Establish New Zealand subsidiary.
2006 ▪ The operation of Linkuo logistics center was officially launched; it has doubled the operation
capacity.
▪ Establish consumer electronics business, it is another core business after components, IT and
Telecom.
2007 ▪ Obtained Nokia cellular phone’s exclusive distribution rights in China region, it has officially
opened the overseas market for communication business.
▪ Thailand logistics center has imported automated warehousing operation.
2008 ▪ Plans to establish logistics center in China has been developed smoothly, the establishment of
Shanghai 2nd period, Chengdu, Nanjing, Beijing logistics center has been activated.
▪ Components business group has competed the comprehensive update of computer system; the
operation efficiency of components has been enhanced.
2009 ▪ Logistics centers in Nanjing, Chengdu, Beijing and Shengyang officially started operation.
▪ Consolidated turnover has exceeded NTD200 billion and reach NTD220.7 billion.
2010 ▪ Tianjin and Hangzhou logistics centers officially started operation.
▪ India’s Redington Group acquired stakes in Turkey’s second largest information distributor Arena,
opening the door to east Europe.
▪ Set up a joint venture with Indonesia’s largest computer group Metrodata Electronics, Synnex has
officially established its presence in Indonesian market and marks another foray in Asia’s emerging
market.
2011 ▪ The Logistics Center in Xian and Qingdao City were officially opened.
▪ Consolidated revenue has exceeded NTD300 billion and reached NTD312.6 billion.
2012 ▪ Logistic centers in Suzhou, Guangzhou, Wuhan and Zhengzhou are officially in service.
▪ A comprehensive computer system update was completed in Australia to enhance effectiveness of
operational management.
2013 ▪ The consolidated revenue reached record high at NTD330.3 billion.
2014 ▪ Sydney (Australia) logistic center officially started operation. ▪ Hefei (China) logistic center officially started operation. ▪ Xiamen (China) logistic center officially started operation.
2015 ▪ Nanchang (China) logistic center officially started operation. ▪ Jinan (China) logistic center officially started operation. ▪ Harbin (China) logistic center officially started operation.
2016 ▪ Changsha (China) logistic center officially started operation. ▪ Ningbo (China) logistic center officially started operation. ▪ Acquisition of Bestcom Infotech Corporation was completed to enhance its future revenues,
technical services, and business opportunities for the commercial network brand agency. ▪ Synlogics Service Corp. was established to expand the logistic business.
Synnex highlights 9
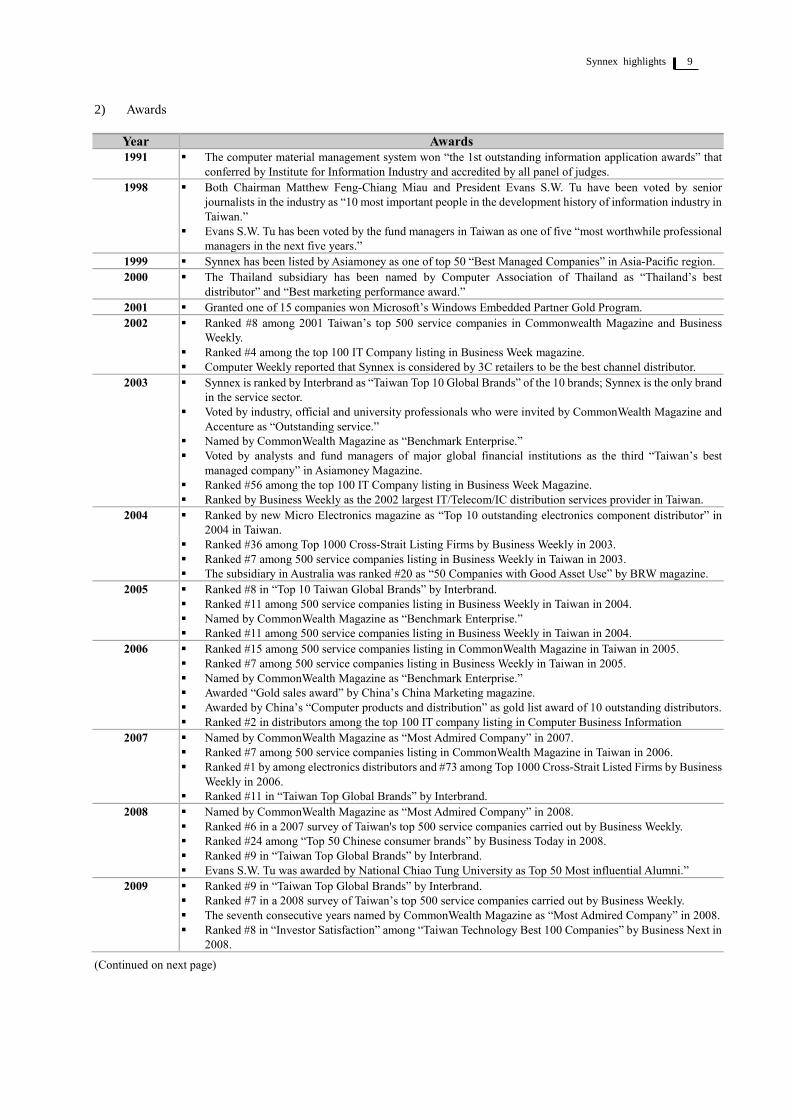
2) Awards
Year Awards
1991 ▪ The computer material management system won “the 1st outstanding information application awards” that
conferred by Institute for Information Industry and accredited by all panel of judges.
1998 ▪ Both Chairman Matthew Feng-Chiang Miau and President Evans S.W. Tu have been voted by senior
journalists in the industry as “10 most important people in the development history of information industry in
Taiwan.”
▪ Evans S.W. Tu has been voted by the fund managers in Taiwan as one of five “most worthwhile professional
managers in the next five years.”
1999 ▪ Synnex has been listed by Asiamoney as one of top 50 “Best Managed Companies” in Asia-Pacific region.
2000 ▪ The Thailand subsidiary has been named by Computer Association of Thailand as “Thailand’s best
distributor” and “Best marketing performance award.”
2001 ▪ Granted one of 15 companies won Microsoft’s Windows Embedded Partner Gold Program.
2002 ▪ Ranked #8 among 2001 Taiwan’s top 500 service companies in Commonwealth Magazine and Business
Weekly.
▪ Ranked #4 among the top 100 IT Company listing in Business Week magazine.
▪ Computer Weekly reported that Synnex is considered by 3C retailers to be the best channel distributor.
2003 ▪ Synnex is ranked by Interbrand as “Taiwan Top 10 Global Brands” of the 10 brands; Synnex is the only brand
in the service sector.
▪ Voted by industry, official and university professionals who were invited by CommonWealth Magazine and
Accenture as “Outstanding service.”
▪ Named by CommonWealth Magazine as “Benchmark Enterprise.”
▪ Voted by analysts and fund managers of major global financial institutions as the third “Taiwan’s best
managed company” in Asiamoney Magazine.
▪ Ranked #56 among the top 100 IT Company listing in Business Week Magazine.
▪ Ranked by Business Weekly as the 2002 largest IT/Telecom/IC distribution services provider in Taiwan.
2004 ▪ Ranked by new Micro Electronics magazine as “Top 10 outstanding electronics component distributor” in
2004 in Taiwan.
▪ Ranked #36 among Top 1000 Cross-Strait Listing Firms by Business Weekly in 2003.
▪ Ranked #7 among 500 service companies listing in Business Weekly in Taiwan in 2003.
▪ The subsidiary in Australia was ranked #20 as “50 Companies with Good Asset Use” by BRW magazine.
2005 ▪ Ranked #8 in “Top 10 Taiwan Global Brands” by Interbrand.
▪ Ranked #11 among 500 service companies listing in Business Weekly in Taiwan in 2004.
▪ Named by CommonWealth Magazine as “Benchmark Enterprise.”
▪ Ranked #11 among 500 service companies listing in Business Weekly in Taiwan in 2004.
2006 ▪ Ranked #15 among 500 service companies listing in CommonWealth Magazine in Taiwan in 2005.
▪ Ranked #7 among 500 service companies listing in Business Weekly in Taiwan in 2005.
▪ Named by CommonWealth Magazine as “Benchmark Enterprise.”
▪ Awarded “Gold sales award” by China’s China Marketing magazine.
▪ Awarded by China’s “Computer products and distribution” as gold list award of 10 outstanding distributors.
▪ Ranked #2 in distributors among the top 100 IT company listing in Computer Business Information
2007 ▪ Named by CommonWealth Magazine as “Most Admired Company” in 2007.
▪ Ranked #7 among 500 service companies listing in CommonWealth Magazine in Taiwan in 2006.
▪ Ranked #1 by among electronics distributors and #73 among Top 1000 Cross-Strait Listed Firms by Business
Weekly in 2006.
▪ Ranked #11 in “Taiwan Top Global Brands” by Interbrand.
2008 ▪ Named by CommonWealth Magazine as “Most Admired Company” in 2008.
▪ Ranked #6 in a 2007 survey of Taiwan's top 500 service companies carried out by Business Weekly.
▪ Ranked #24 among “Top 50 Chinese consumer brands” by Business Today in 2008.
▪ Ranked #9 in “Taiwan Top Global Brands” by Interbrand.
▪ Evans S.W. Tu was awarded by National Chiao Tung University as Top 50 Most influential Alumni.”
2009 ▪ Ranked #9 in “Taiwan Top Global Brands” by Interbrand.
▪ Ranked #7 in a 2008 survey of Taiwan’s top 500 service companies carried out by Business Weekly.
▪ The seventh consecutive years named by CommonWealth Magazine as “Most Admired Company” in 2008.
▪ Ranked #8 in “Investor Satisfaction” among “Taiwan Technology Best 100 Companies” by Business Next in
2008.
(Continued on next page)
10 2016 Annual Review
(Continue last page)
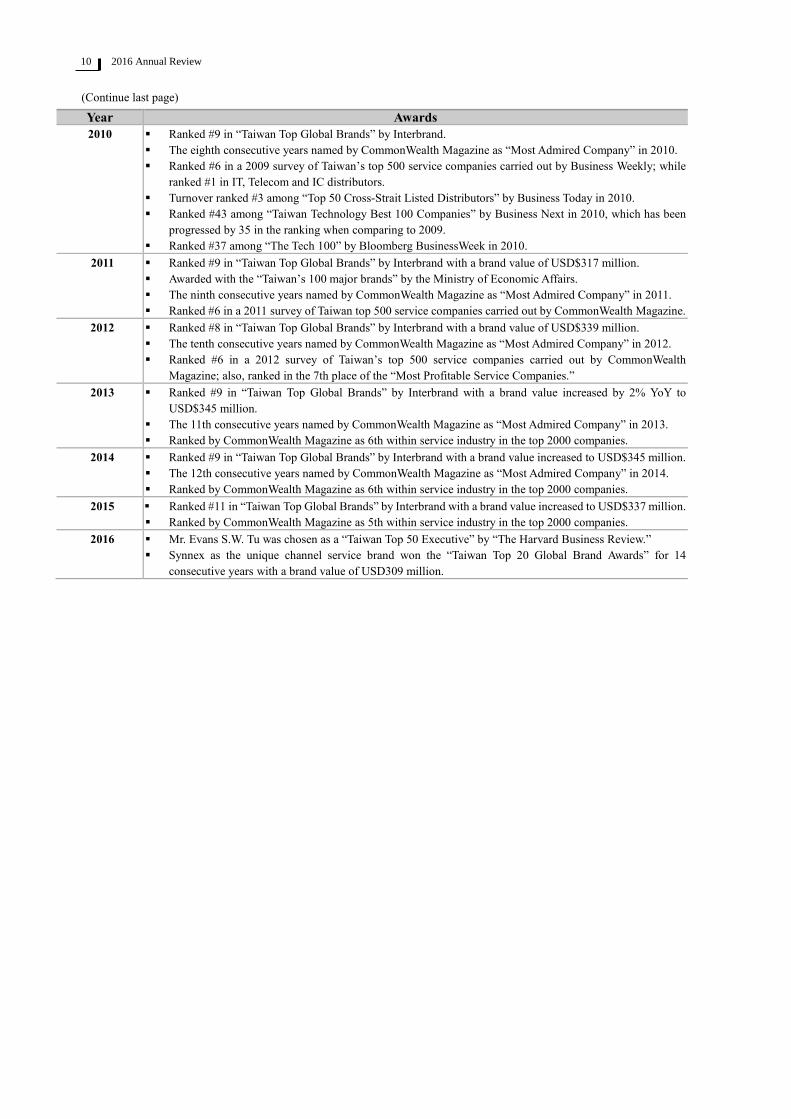
Year Awards
2010 ▪ Ranked #9 in “Taiwan Top Global Brands” by Interbrand.
▪ The eighth consecutive years named by CommonWealth Magazine as “Most Admired Company” in 2010.
▪ Ranked #6 in a 2009 survey of Taiwan’s top 500 service companies carried out by Business Weekly; while
ranked #1 in IT, Telecom and IC distributors.
▪ Turnover ranked #3 among “Top 50 Cross-Strait Listed Distributors” by Business Today in 2010.
▪ Ranked #43 among “Taiwan Technology Best 100 Companies” by Business Next in 2010, which has been
progressed by 35 in the ranking when comparing to 2009.
▪ Ranked #37 among “The Tech 100” by Bloomberg BusinessWeek in 2010.
2011 ▪ Ranked #9 in “Taiwan Top Global Brands” by Interbrand with a brand value of USD$317 million.
▪ Awarded with the “Taiwan’s 100 major brands” by the Ministry of Economic Affairs.
▪ The ninth consecutive years named by CommonWealth Magazine as “Most Admired Company” in 2011.
▪ Ranked #6 in a 2011 survey of Taiwan top 500 service companies carried out by CommonWealth Magazine.
2012 ▪ Ranked #8 in “Taiwan Top Global Brands” by Interbrand with a brand value of USD$339 million.
▪ The tenth consecutive years named by CommonWealth Magazine as “Most Admired Company” in 2012.
▪ Ranked #6 in a 2012 survey of Taiwan’s top 500 service companies carried out by CommonWealth
Magazine; also, ranked in the 7th place of the “Most Profitable Service Companies.”
2013 ▪ Ranked #9 in “Taiwan Top Global Brands” by Interbrand with a brand value increased by 2% YoY to
USD$345 million.
▪ The 11th consecutive years named by CommonWealth Magazine as “Most Admired Company” in 2013.
▪ Ranked by CommonWealth Magazine as 6th within service industry in the top 2000 companies.
2014 ▪ Ranked #9 in “Taiwan Top Global Brands” by Interbrand with a brand value increased to USD$345 million.
▪ The 12th consecutive years named by CommonWealth Magazine as “Most Admired Company” in 2014.
▪ Ranked by CommonWealth Magazine as 6th within service industry in the top 2000 companies.
2015 ▪ Ranked #11 in “Taiwan Top Global Brands” by Interbrand with a brand value increased to USD$337 million.
▪ Ranked by CommonWealth Magazine as 5th within service industry in the top 2000 companies.
2016 ▪ Mr. Evans S.W. Tu was chosen as a “Taiwan Top 50 Executive” by “The Harvard Business Review.”
▪ Synnex as the unique channel service brand won the “Taiwan Top 20 Global Brand Awards” for 14
consecutive years with a brand value of USD309 million.

Synnex highlights 11
聯強國際(股)公司
Synnex Global Ltd.
持股比率:100%
伊凡投資(股)公司
持股比率:100%
嘉榮行銷(股)公司
持股比率:100%
群環科技(股)公司及其子公司
持股比率:100%
通達運籌服務(股)公司
持股比率:100%
Syntech
Asia Ltd.
持股比率
: 100%
Synnex China
Holdings Ltd.
持股比率
:100%
持股比率
:100%
持股比率
:100%
持股比率
:100%
持股比率
:100%
Synnex
Mauritius Ltd.
Peer
Developments
Ltd.
King’s Eye
Investments
Ltd.
Trade
Vanguard
Global Ltd.
聯強國際
(中國)投資
有限公司
持股比率
:23.58%
持股比率
:10.31%
持股比率
:100%
持股比率
:100%
Synnex
Australia
Pty. Ltd.
持股比率
:100%
Fortune
Ideal Ltd.
持股比率
:100%
Golden
Thinking
Ltd.
持股比率
:100%
Synnex
New Zealand
Ltd.
持股比率
:100%
PT. Synnex
Metrodata
Indonesia
持股比率:
50.30%
Synnex
(Thailand)
Public
Company Ltd.
及其子公司
持股比率
:40.00%
Redington
(India) Ltd.Synnex Corp.
聯翔科技
(深圳)
有限公司
Laser
Computer
Holdings Ltd.
及其子公司
持股比率
:100%
Synnex
Electronics
Hong Kong
Ltd.
持股比率
:100%
聯強國際貿易
(中國)
有限公司
持股比率
:100%
聯強國際
(北京)
有限公司
持股比率
:100%
聯強國際
(上海)
有限公司
持股比率
:100%
聯強國際
(成都)科技
有限公司
持股比率
:100%
聯強國際
(南京)電子
有限公司
持股比率
:100%
聯強國際
(瀋陽)科技
有限公司
持股比率
:100%
聯強國際
(天津)科技
有限公司
持股比率
:100%
聯強國際
(杭州)電子
有限公司
持股比率
:100%
聯強國際
(青島)科技
有限公司
持股比率
:100%
聯強國際
(廣州)科技
有限公司
持股比率
:100%
聯強國際
(西安)科技
有限公司
持股比率
:100%
聯強國際
(蘇州)科技
有限公司
持股比率
:100%
聯強國際
(武漢)科技
有限公司
持股比率
:100%
聯強科技發展
有限公司
持股比率
:100%
聯強國際
(濟南)電子
有限公司
持股比率
:100%
聯強國際
(鄭州)科技
有限公司
持股比率
:100%
聯強國際
(長沙)科技
有限公司
持股比率
:100%
聯強國際
(寧波)科技
有限公司
持股比率
:100%
毅都信息
科技(上海)
有限公司
持股比率
:100%
聯強國際
(合肥)科技
有限公司
持股比率
:100%
聯強國際
(南昌)電子
有限公司
持股比率
:100%
聯強國際
(哈爾濱)科技
有限公司
持股比率
:100%
聯強國際
(重慶)科技
有限公司
持股比率
:100%
聯強國際
(廈門)科技
有限公司
持股比率
:100%
育德(上海)
倉儲
有限公司
持股比率
:80%
II. Corporate Governance Report
1) Organization
Group Structure
2016.12.31
Synnex Technology International Corp.
Seper Marketing Corp. 100%
Bestcom Infotech Corp. 100%
Synnex Investments (China) Ltd.
100%
Synnex (Beijing)
Ltd.
100%
Synnex Technology Developme
nt Ltd.
100%
Laser Computer Holdings Ltd. and
subsidiary
100%
E-Fan Investments Corp. 100%
100%
100%
100%
100%
100%
23.58%
10.31%
100%
100%
100%
100%
100%
100%
50.30%
Synnex (Thailand)
Public Company Ltd. and
subsidiary
40.00%
Synnex (Shangha)
Ltd.
100%
Synnex (Chengdu)
Ltd.
100%
Synnex (Nanjing)
Ltd.
100%
Synnex (Shenyang)
Ltd.
100%
Synnex (Tianjin)
Ltd.
100%
Synnex (Hangzho
u) Ltd.
100%
Synnex (Qingdao)
Ltd.
100%
Synnex (Guangzhou
) Ltd.
100%
Synnex (Xi’an)
Ltd.
100%
Synnex (Suzhou)
Ltd.
100%
Synnex (Wuhan)
Ltd.
100%
Synnex (Jinan)
Ltd.
100%
Synnex (Zhengzho
u) Ltd.
100%
Synnex (Changsha)
Ltd.
100%
Synnex (Ningbo)
Ltd.
100%
Synnex (Hefei)
Ltd.
100%
Synnex (Nanchang )
Ltd.
100%
Synnex (Harbin)
Ltd.
100%
Synnex (Chongqing)
Ltd.
100%
Synnex (Xiamen)
Ltd.
100%
Yude (Shanghai) Warehouse
Co., Ltd.
80%
Synnex Technology International
Corporation)
100%
Lianxiang
Technology (Shenzhen)
Co., Ltd.
100%
Synlogics Service Corp. 100%
Yi Du Information Technology (Shanghai) Co., Ltd.
100%
Synnex Global Ltd. 100%

12 2016 Annual Review
Basic Information of group companies 2016.12.31 Unit: thousand
Company name Date established Location Capital Main business or production types
Seper Marketing Corp. 1990.02.23 Taipei NTD 1,000 Sales of IT/Telecom products in Taiwan
E-Fan Investments Corp. 2001.06.28 Taipei NTD 225,000 Investment holding company
Synlogics Service Corp. 2016.10.17 Taipei NTD 50,000 Provision of warehousing, distribution services in
Taiwan
Bestcom Infotech Corp. and its subsidiaries 1987.01.13 Taipei NTD 1,032,033 Sales of IT products in Taiwan
Synnex Global Ltd. 1996.12.27 BVI US$ 548,250 Investment holding company
Synnex Mauritius Ltd. 2004.12.02 Mauritius US$ 24,000 Investment holding company
Peer Development Ltd. 1996.12.27 BVI US$ 31,300 Investment holding company
Synnex China Holdings Ltd. 2002.07.19 BVI US$ 100,200 Investment holding company
King’s Eye Investments Ltd. 1997.01.23 BVI US$ 62,477 Investment holding company
Trade Vanguard Global Ltd. 2014.04.15 BVI US$ 100,000 Investment holding company
LianXiang Technology (Shenzhen) Ltd. 2011.05.26 Shenzhen, China US$ 200 Sales of IC components in China region.
Synnex Investments (China) Ltd. 2007.11.05 Shanghai, China US$ 200,000 Investment holdings company in China
Synnex (Beijing) Ltd. 2002.10.11 Beijing, China US$ 9,000 Production and sales of IT/Telecom products in China
Synnex (Shanghai) Ltd. 2002.10.15 Shanghai, China US$ 22,000 Production and sales IT/Telecom products in China
Synnex Distributions (China) Ltd. 2005.11.25 Shanghai, China US$ 153,000 Production and sales of IT/Telecom products in China
Synnex (Chengdu) Ltd. 2006.11.06 Chengdu, China US$ 5,000 Production and sales of IT/Telecom products in China
Synnex (Nanjing) Ltd. 2006.12.20 Nanjing, China US$ 5,000 Production and sales of IT/Telecom products in China
Synnex (Shenyang) Ltd. 2008.08.19 Shengyang, China US$ 3,000 Production and sales of IT/Telecom products in China
Synnex (Tianjin) Ltd. 2009.04.21 Tianjin, China US$ 4,500 Production and sales of IT/Telecom products in China
Synnex (Hangzhou) Ltd. 2009.11.25 Hangzhou, China US$ 5,000 Production and sales of IT/Telecom products in China
Synnex (Qingdao) Ltd. 2010.03.04 Qingdao, China US$ 5,000 Production and sales of IT/Telecom products in China
Synnex (Guangzhou) Ltd. 2010.03.18 Guangzhou, China US$ 12,000 Production and sales of IT/Telecom products in China
Synnex (Xi’an) Ltd. 2010.03.24 Xi’an, China US$ 4,000 Production and sales of IT/Telecom products in China
Synnex (Suzhou) Ltd. 2010.06.17 Suzhou, China US$ 6,000 Production and sales of IT/Telecom products in China
Synnex (Wuhan) Ltd. 2010.12.08 Wuhan, China US$ 5,000 Production and sales of IT/Telecom products in China
Synnex (Jinan) Ltd. 2010.12.06 Jinan, China US$ 5,000 Production and sales of IT/Telecom products in China
Synnex (Zhengzhou) Ltd. 2011.01.07 Zhengzhou, China US$ 5,000 Production and sales of IT/Telecom products in China
Synnex (Changsha) Ltd. 2011.03.23 Changsha, China US$ 4,000 Production and sales of IT/Telecom products in China
Synnex (Ningbo) Ltd. 2011.06.15 Ningbo, China US$ 4,000 Production and sales of IT/Telecom products in China
Synnex (Hefei) Ltd. 2011.07.15 Hefei, China US$ 6,100 Production and sales of IT/Telecom products in China
Synnex (Nanchang) Ltd. 2011.08.24 Nanchang China US$ 4,000 Production and sales of IT/Telecom products in China
Synnex (Harbin) Ltd. 2012.03.26 Harbin China US$ 5,000 Production and sales of IT/Telecom products in China
Synnex (Chongqing) Ltd. 2012.05.09 Chongqing China US$ 600 Production and sales of IT/Telecom products in China
Synnex (Xiamen) Ltd. 2012.05.07 Xiamen China US$ 6,000 Production and sales of IT/Telecom products in China
Yude (Shanghai) Warehouse Co., Ltd. 2012.06.18 Shanghai, China RMB 2,400 Provision of warehousing services in China
Yi Du Information Technology (Shanghai) Co., Ltd. 2015.04.02 Beijing, China RMB 1,000 Production and sales of IT/Telecom products in China
Synnex Technology Development (Beijing) Ltd. 2007.12.06 Beijing, China RMB 50,000 Production and sales of IT/Telecom products in China
Laser Computer Holding Ltd. and subsidiary 2001.09.06 BVI US$ 36,850 Sales of IT products in Hong Kong/China region.
Synnex Electronics Hong Kong Ltd. 1993.09.09 Hong Kong US$ 300 Sales of IC components in Hong Kong / China region.
Syntech Asia Ltd. 2011.03.11 Hong Kong US$ 300 Sales of IC components in Hong Kong / China region.
Synnex Australia Pty. Ltd. 1991.06.06 Australia AUS 33,250 Sales of IT products in Australia.
Fortune Ideal Ltd. 2000.09.04 Hong Kong HKD 14,500 Operate Australia’s logistics center.
Golden Thinking Ltd. 2010.02.19 Hong Kong HKD 28,000 Operate Australia’s logistics center.
Synnex New Zealand Ltd. 2005.07.18 New Zealand NZD 1,500 Sales of IT products in New Zealand.
PT. Synnex Metrodata Indonesia 2000.05.23 Indonesia IDR 300,000,000 Production and sales of IT/Telecom products in
South-East Asia
Synnex (Thailand) Public Company Ltd. and
subsidiary *
1988.04.05 Thailand THB 770,329 Sales of IT products in Thailand.
Redington (India) Ltd.* 1961 India INR 799,697 Sales of IT/Telecom products in India, Middle East and
Africa
Synnex Corporation* 1980 USA USD 41 Sales of IT products in Europe, US and Japan.
* Adopt equity method.

Synnex highlights 13
Organization and responsibility
Board of Directors
Chairman
President & CEO
Internal Audit Office
President Office
Human Resources Planning &
Management Div.
Business Planning & Management Div.
Logistics Planning & Management Div.
Finance Planning & Management Div.
Risk & Management & Planning
Technical Service Planning &
Management Div.
Group Product Controlling Div.
Overseas Business Management Div.
Component
Business
Unit
Product
Marketing
Bestcom
Business
Unit
Product
Controlling
Field
Application
Technical
Service
Logistic
Business Unit
Software Development Center
Taiwan
Business
Unit
China
Business
Unit
Hong Kong
Business
Unit
Australia
Business
Unit
Indonesia
Business
Unit
Thailand
Business
Unit
India
&
Middle East
Business
Unit
Sales
Remuneration Committee Internal Audit Office
Audit Committee
Back Office
Operation
America
Business
Unit
Group Accounting Center
Property Management center
Financing Control Center
Information & Communication Network Center
14 2016 Annual Review
Description of responsibilities
Board of Directors Software Development Center
Responsible for planning, integration and maintenance of overall ERP
system.
Information & Communication Network Center
Responsible for the procurement, management, and maintenance of IT
and telecom equipment.
Financing Control Center: Responsible for centralized control of the
finance for the Group.
Group Accounting Center: Responsible for the financial, tax and
accounting affairs of the Group.
Property Management center: Responsible for planning and setup of
the Group's logistic centers as well as property management.
Product Marketing: Responsible for planning and implementation of
products’ operational strategies.
Product Controlling: Responsible for planning and implementation of
products’ purchase, sales and inventory strategies.
Sales: Responsible for product sales.
Field Application: Responsible for pre-sale services for product R&D
and technology application support.
Technical Service: Responsible for technical support service before and
after the sale.
Logistics Business Unit: Responsible for operational implementation of
warehousing, distribution and post-sales maintenance services.
Back office operation
Finance: Responsible for financial management and fiscal tax
accounting.
Credit: Responsible for accounts receivable management and credit
collection processing.
Customer Service: Responsible for post-sales customer services.
Personnel & Administration: Responsible for planning and
implementation of human resource systems.
Internal Audit Office: Evaluate and improve the efficiency of risk
management, control, governance, and achieve the performance and
quality of the designated mission.
Remuneration Committee: Responsible for the overall remuneration
system and total prize money review.
Audit Committee: Responsible for overseeing the effective
implementation of the Company’s financial statements, compliance
with related laws and regulations, internal control, and risk control.
President office
Human Resources Planning & Management Div.: Responsible for
development, planning and training of overall human resources.
Business Planning & Management Div.: Responsible for overall
business operation planning, management analysis and process planning.
Logistics Planning & Management Div.: Responsible for overall
operation planning, management analysis and process planning.
Finance Planning & Management Div.: Responsible for overall financial
analysis, planning and management.
Risk Management & Planning: Responsible for the overall accounting
and legal system development, planning, and management
Technical Service Planning & Management Div.: Responsible for
planning of overall technical service and operation.
Group Product Controlling Div.: Responsible for the overall product
purchase, sales, and inventory operating procedure planning and
strategy formulation.
Overseas Business Management Div.: Responsible for planning, support
and management of overseas affairs.
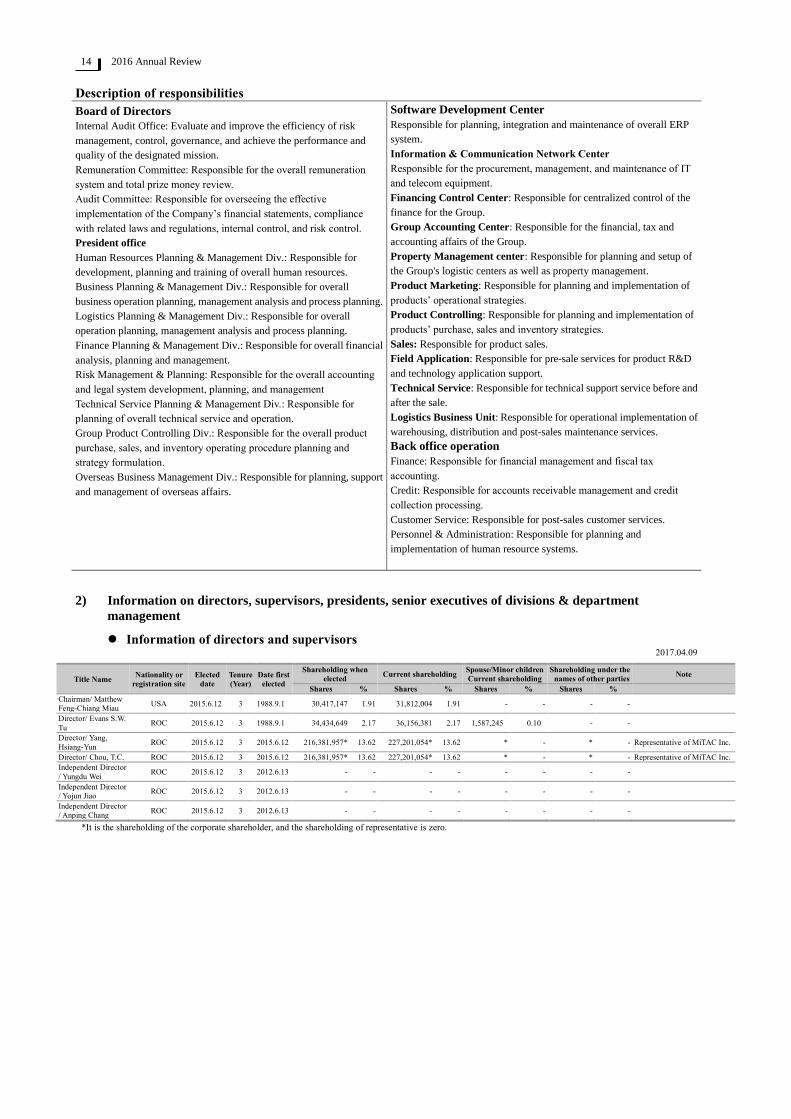
2) Information on directors, supervisors, presidents, senior executives of divisions & department
management
Information of directors and supervisors 2017.04.09
Title Name Nationality or
registration site
Elected
date
Tenure
(Year)
Date first
elected
Shareholding when
elected Current shareholding
Spouse/Minor children
Current shareholding
Shareholding under the
names of other parties Note
Shares % Shares % Shares % Shares %
Chairman/ Matthew
Feng-Chiang Miau USA 2015.6.12 3 1988.9.1 30,417,147 1.91 31,812,004 1.91 - - - -
Director/ Evans S.W.
Tu ROC 2015.6.12 3 1988.9.1 34,434,649 2.17 36,156,381 2.17 1,587,245 0.10 - -
Director/ Yang,
Hsiang-Yun ROC 2015.6.12 3 2015.6.12 216,381,957* 13.62 227,201,054* 13.62 * - * - Representative of MiTAC Inc.
Director/ Chou, T.C. ROC 2015.6.12 3 2015.6.12 216,381,957* 13.62 227,201,054* 13.62 * - * - Representative of MiTAC Inc.
Independent Director
/ Yungdu Wei ROC 2015.6.12 3 2012.6.13 - - - - - - - -
Independent Director
/ Yojun Jiao ROC 2015.6.12 3 2012.6.13 - - - - - - - -
Independent Director
/ Anping Chang ROC 2015.6.12 3 2012.6.13 - - - - - - - -
*It is the shareholding of the corporate shareholder, and the shareholding of representative is zero.

Synnex highlights 15
Title/Name Major experience and education Services concurrently with the Company and other company
Other officers, directors, or supervisors
who are the spouse or 2nd degree relatives
Title Name Relation
Chairman
Matthew
Feng-Chiang
Miau
MBA of Santa Clara University
(USA)
Electrical Engineering BA of the
University of California at Berkeley
Chairman of Synnex Technology
International Corp.
Chairman of Lien Hwa Industrial Corp
Chairman of Union Petrochemical
Corp.
Chairman of MiTAC Holdings Corp.
Chairman of MiTAC Inc.
Director of Getac Technology Corp.
Director of MiTAC Information
Technology Corp.
Director of Lien-Hwa Industrial Gases
Co., Ltd.
Director of Winbond
Electronics Co., Ltd.
Director of Taita Chemical
Company, Limited.
Director of Asia Polymer Corp.
Director of Synnex Corp.
Independent director of Cathay
Financial Holdings
Independent director of Cathay
Life Insurance
Independent director of Cathay
Century Insurance
Independent director of Cathay
United Bank.
None None None
Director
Evans S.W.
Tu
President of Micro Electronics
Corp.
Vice-president of MiTAC Inc.
Electrical and Control Engineering
Degree in National Chiao Tung
University
President of Synnex Technology
International Co., Ltd.
Supervisor of MiTAC Inc.
Chairman of Seper Marketing Corp.
Director of Bestcom Infotech
Corp.
Director of Synlogics Service
Corp.
Supervisor of MiTAC
Information Technology Corp.
None None None
Director
Yang,
Hsiang-Yun
Special assistant in MiTAC
International Corp.
CFO of MiTAC International
Corp.
National Taiwan University MBA Director of Health Food Co., Ltd.
Chairman of Lian-Yuan Investment Co.,
Ltd.
Director of Tsu Fung Investment Co.,
Ltd.
Supervisor of LEF Aerospace Industry
Corp.
Supervisor of MiTAC Inc.
Supervisor of MiTAC
Information Technology Corp
Supervisor of MiTAC
Computing Technology Corp.
None None None
Director
Chou, T.C.
Investment special assistant to
chairman, MiTAC International
Corp.
Ph. D. of engineering, Rutgers, The
State University of New Jersey
Supervisor of Getac Technology Corp.
Supervisor of Waffer Technology Corp.
Supervisor of Intech Biopharm Corp.
Director of MiTAC Inc.
Director of MiTAC
Information Technology Corp.
Director of National Aerospace
Fasteners Corporation
None None None
Independent
Director
/ Yungdu Wei
Acting Director of the System
Board Internal Audit of Georgia
University
Dean of Finance & Accounting
School of Armstrong College of
Georgia
Senior auditor of Deloitte Haskins
& Sells
Director of Auditing Department,
Deloitte and Controller
President and Honorary President
of Deloitte
Director of Deloitte International
Organization
Director of Deloitte China
Chairman of United Way of Taiwan
Director of Child Welfare League
Foundation
U.S. Internal Auditor
CPA, Georgia, USA
CPA, R.O.C.
Georgia University MBA
Chairman of Yongqin Industrial
Company
Director of iron Force Industrial Co.,
Ltd.
Director of Wangsteak
Director of Sercomm Corp.
Director of VIS
Director of MiTAC Holdings
Corp.
Independent Director of Far
Eastern Department Stores
Corp
Independent Director of
Primax Electronics Ltd.
Supervisor of Chilisin
Electronics Corp.
None None None
Independent
Director
Yojun Jiao
Chairman of Walsin Lihwa
Corporation
Master of Electrical Engineering,
University of Washington
Bachelor of Telecommunication
Engineering, National Chiao Tung
University
Chairman and CEO of Winbond
Electronics Co., Ltd.
Chairman of NUVOTON Co., Ltd.
Director of WALSIN TECHNOLOGY
CORPORATION
Chairman of Walsin Lihwa
Corporation
Independent Director of
Taiwan Cement Co., Ltd.
Supervisor of MiTAC Holdings
Corp.
None None None
Independent
Director
Anping
Chang
President and Vice Chairman of
Chia Hsin Cement Corporation
Chairman of WYSE
Chairman of GIGAMEDIA
LIMITED
Chairman of China Network
Systems
Chairman of L’Hotel de Chine
Group
Chairman of WYSE (USA)
Vice Chairman of Taiwan Cement
Co., Ltd.
Executive Consultant of CITIC
President of KGI Securities
Independent Director of Fubon
Holding, Taipei Fubon Bank, and
Fubon Securities
Director of FETNet
Advanced Professional Certificate in
Institute of Business Administration
of New York University
Master of Institute of Business
Administration, New York University
Bachelor of Economics, Princeton
University
Chairman of Taiwan Cement Co., Ltd.
Chairman of China Synthetic Rubber
Co., Ltd.
Chairman of Taiwan Prosperity
Chemical Corporation
None None None
** Other than Evans S.W. Tu’s brother (David Tu) is appointed as the Group’s business development executive, the remaining directors, supervisors, and other executives,
directors or supervisors of the company do not have spouse or consanguineous to 2nd degree relations.
Major shareholders of the corporate directors or supervisors 2017.04.09
Name of corporate director or supervisor Major shareholders of the corporate directors or supervisors*
MiTAC Inc. Lien Hwa Industrial Corp 35.24%
Synnex Technology International Corporation 18.36%
Mei-An Investment Corp. 10.54%
MiTAC International Corp. 8.69%
Tsu Fung Investment Co., Ltd. 4.40%
Matthew Feng-Chiang Miau 3.05%
Hua Cheng Construction Co., Ltd. 1.92%
Omron Corporation 1.70%
Pao Shin International Investment Co., Ltd. 1.18%
Yih Fong Investment Corp. 0.75%
16 2016 Annual Review
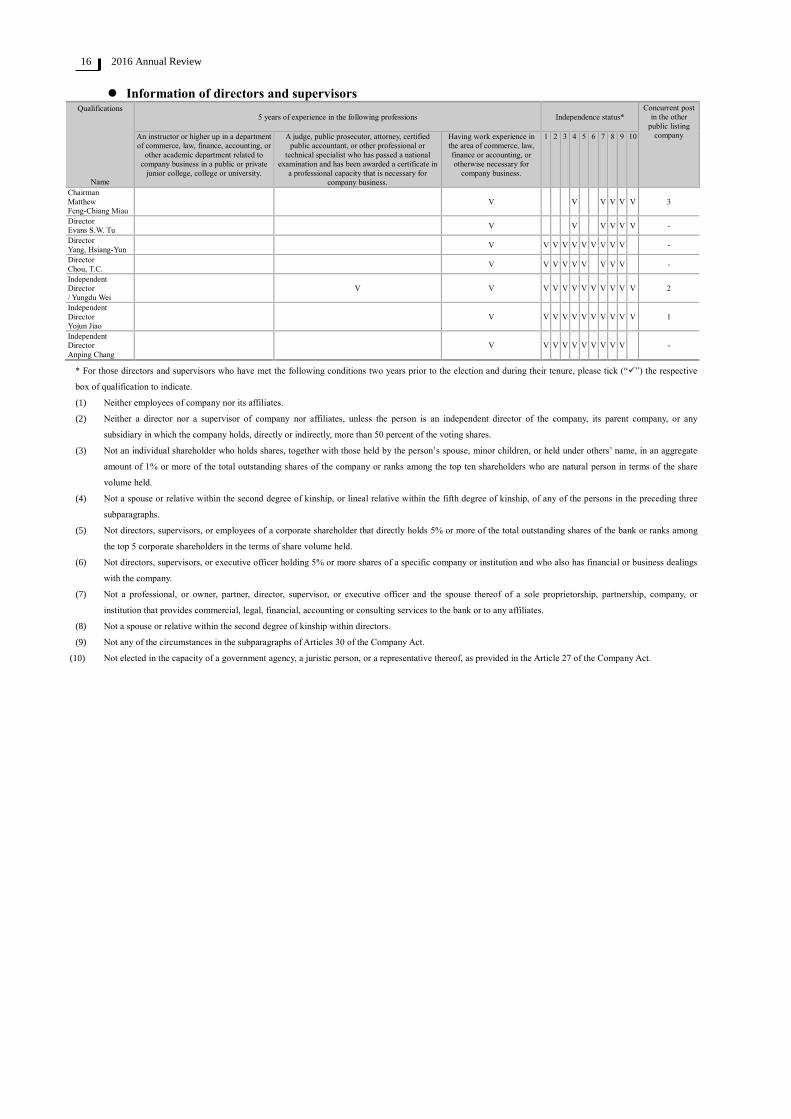
Information of directors and supervisors Qualifications
Name
5 years of experience in the following professions Independence status*
Concurrent post
in the other
public listing
company An instructor or higher up in a department
of commerce, law, finance, accounting, or
other academic department related to
company business in a public or private
junior college, college or university.
A judge, public prosecutor, attorney, certified
public accountant, or other professional or
technical specialist who has passed a national
examination and has been awarded a certificate in
a professional capacity that is necessary for
company business.
Having work experience in
the area of commerce, law,
finance or accounting, or
otherwise necessary for
company business.
1 2 3 4 5 6 7 8 9 10
Chairman
Matthew
Feng-Chiang Miau
V V V V V V 3
Director
Evans S.W. Tu V V V V V V -
Director
Yang, Hsiang-Yun V V V V V V V V V V -
Director
Chou, T.C. V V V V V V V V V -
Independent
Director
/ Yungdu Wei
V V V V V V V V V V V V 2
Independent
Director
Yojun Jiao
V V V V V V V V V V V 1
Independent
Director
Anping Chang
V V V V V V V V V V -
* For those directors and supervisors who have met the following conditions two years prior to the election and during their tenure, please tick (“✓”) the respective
box of qualification to indicate.
(1) Neither employees of company nor its affiliates.
(2) Neither a director nor a supervisor of company nor affiliates, unless the person is an independent director of the company, its parent company, or any
subsidiary in which the company holds, directly or indirectly, more than 50 percent of the voting shares.
(3) Not an individual shareholder who holds shares, together with those held by the person’s spouse, minor children, or held under others’ name, in an aggregate
amount of 1% or more of the total outstanding shares of the company or ranks among the top ten shareholders who are natural person in terms of the share
volume held.
(4) Not a spouse or relative within the second degree of kinship, or lineal relative within the fifth degree of kinship, of any of the persons in the preceding three
subparagraphs.
(5) Not directors, supervisors, or employees of a corporate shareholder that directly holds 5% or more of the total outstanding shares of the bank or ranks among
the top 5 corporate shareholders in the terms of share volume held.
(6) Not directors, supervisors, or executive officer holding 5% or more shares of a specific company or institution and who also has financial or business dealings
with the company.
(7) Not a professional, or owner, partner, director, supervisor, or executive officer and the spouse thereof of a sole proprietorship, partnership, company, or
institution that provides commercial, legal, financial, accounting or consulting services to the bank or to any affiliates.
(8) Not a spouse or relative within the second degree of kinship within directors.
(9) Not any of the circumstances in the subparagraphs of Articles 30 of the Company Act.
(10) Not elected in the capacity of a government agency, a juristic person, or a representative thereof, as provided in the Article 27 of the Company Act.

Synnex highlights 17
Information on president, vice president, assistant vice president, senior executives of divisions &
departments management 2017.04.09
Unit: Share/%
Title
Name
Nation
ality
Date
starts*
Shareholding
Shareholding by
Spouse/Minor
children** Major experience and education Services concurrently with the other
company
Managers who are spouse or
consanguineous to 2nd
degree
Shares % Shares % Title Name Relation
ship
President
Evans S.W. Tu
ROC 1988.
9.12 36,156,381 2.17 1,587,245
0.10 President of Micro Electronics Corp.
Vice-president of MiTAC Inc.
Electrical and Control Engineering
Degree in National Chiao Tung
University
Supervisor of MiTAC Inc.
Chairman of Seper Marketing Corp.
Director of Harbinger Venture Capital
Corp.
Director of Digitimes Inc.
Director of Bestcom Infotech Corp.
Director of Synlogics Service Corp.
Supervisor of MiTAC Information
Technology Corp.
None None None
Vice-President
Beny Weii
ROC 1988.
9.12 1,854,216 0.11 137,194
0.01 Assistant Vice President of Micro
Electronics Corp.
Manager of MiTAC Inc.
Electronic Calculation Bachelor
Degree in Tamking University
Chairman of E-Fan Investments Corp.
Director of Synlogics Service Corp.
None None None
Vice-President
James Lee
ROC 2011.
12.26 342,474 0.02 21,603
0.00 Electrical Engineering Degree in
National Joint Junior College
- None None None
Vice-President
Rex Shiue
ROC 2011.
12.26 383,787 0.02 -
- Manager of Unicom Electronics Co.,
Ltd.
Industrial Management Bachelor
Degree in National Taiwan
University of Science and
Technology
- None None None
Vice-President
Dicky Chang
ROC 2011.
12.26 1,220,507 0.07 69,731
0.00 Senior Manager of World Family
Agent of Bowne International
Library Science Bachelor Degree in
Fu Jen Catholic University
- None None None
Overseas
Operation CEO
Matthew
Feng-Chiang
Miau
USA 2005.
4.1 31,812,004 1.91 -
- MBA of Santa Clara University
(USA)
Electrical Engineering BSc from the
University of California at Berkeley
Chairman of MiTAC Inc.
Chairman of Lien Hwa Industrial Corp.
Chairman of Union Petrochemical Corp.
Director of Mitac Investment (Holdings)
Co., Ltd.
Chairman of MiTAC Information
Technology Corp.
Director of Getac Technology Corporation
Director of BOC Lienhwa Industrial
Gases Co., Ltd.
Director of Winbond Electronics Co., Ltd.
Director of Taita Chemical Company,
Limited
Director of Director of Asia Polymer
Corp.
Director of Synnex Corp.
Independent director of Cathay Financial
Holdings
Independent director of Cathay Life
Insurance
Independent director of Cathay Century
Insurance
Independent director of Cathay United
Bank.
None None None
AVP Financial
Oliver Chang
ROC 1988.
11.1 449,164 0.03 36,634
0.00 Manager of Tait Marketing &
Distribution Co., Ltd
Manager of DIMERCO
Accounting Bachelor Degree in
Soochou University
Supervisor of E-Fan Investments Corp.
Supervisor of Seper Marketing Corp.
None None None
* Date started indicate the date on board, no indication will be made if however the title changed during the period.
** All shares are registered under stockholders’ own name.

18 2016 Annual Review
Remuneration to directors, supervisors and executive officers and employees’ bonus
Remuneration Policy
The Company has established the Remuneration Committee to determine and review the performance evaluation and
remuneration policy, system, standard, and structure for directors and the management. The performance evaluation and
remuneration for directors and the management is conducted by referring to the payment standard of the industry and
considering its reasonable link to personal performance, corporate operating performance, and future risk.
Director’s remuneration 2016
Unit: %/in NTD thousand
Title Name
Directors remuneration*
Ratio of total
remuneration
(A+B+C+D)
to net income
(%)
Relevant remuneration received by directors who are also employees*
Ratio of total
remuneration
(A+B+C+D+E+F+G)
to net income (%)
Compensation
paid to directors
from an
invested
company other
than the
Company’s
subsidiary*
Remuneration
(A)
Pension and
superannuation
(B)
Earnings distribution
(C)
***
Business
execution
(D)
Salary, bonus and special
disbursement
(E)
Pension and
Superannuation (F)
*****
Employee bonus
distribution(G)***
Employee share
subscription
warrants (H)
Restrict employees'
rights shares
(I) Cash
dividends Stock
dividends
Chairman Matthew
Feng-Chiang Miau
- - 6,000 704 0.14 66,480 3,320 - - - - 1.57 -
Director Evans S.W. Tu
Director Yang,
Shih-Chien**
Director Charles H.S.
Ching**
Director Chou, T.C.***
Director Yang,
Hsiang-Yun***
Independent
Director
Yungdu Wei
Independent
Director
Yojun Jiao
Independent
Director
Anping Chang
*
**
***
***
****
The Company’s remuneration paid to directors and relevant remuneration received by directors who are also employees is consistent with the subsidiaries in the financial report.
It is the representative of Mitac Computer Co., Ltd. and the term was expired on June 11, 2015.
Representative of MiTAC Inc.
This amount is estimated as the remuneration to directors for 2016 has not yet been approved by the shareholders’ meeting. Relevant remuneration received by directors who are also employees is
calculated based on the amount actually paid last year. Therefore, this is an estimated amount.
Proposed appropriation, not actually paid.

Synnex highlights 19
Remuneration to the president and vice-president 2016
Unit: %/in NTD thousand
Title Name Salary(A)
**
Pension and
Superannuation
(B)** and ****
Bonus and
special
disbursement
(C)**
Employee bonus distribution(D)** Ratio of total
remuneration
(A+B+C+D) to
net income (%)
Employee
share
subscription
warrants**
Compensation from
an invested company
other than the
Company’s
subsidiary**
Cash
dividends***
Stock
dividends***
President Evans S.W. Tu*
95,840 4,786 - - - 2.06 - -
Overseas
Operation CEO
Matthew
Feng-Chiang
Miau*
Vice-President Beny Weii
Vice-President James Lee
Vice-President Dicky Chang
Vice-President Rex Shiue
*
**
***
****
The cost of transportation vehicles is NTD 9,160 thousand with a book value of NTD 5,733 thousand.
The Company’s remuneration paid to President and Vice President and relevant remuneration received by President and Vice President is consistent with the
subsidiaries in the financial report.
Relevant remuneration received by President and Vice President for 2016 is calculated based on the amount actually paid last year and has not yet been approved by
shareholders’ meeting.
Proposed appropriation, not actually paid.
Name and distribution status of the managers for distribution of employee bonus 2016
Unit: %/in NTD thousand
Title Name
Stock dividends Cash dividends* Total
Ratio of total remuneration to
net income (%) Amount Amount
Man
ager
President Evans S.W. Tu
- - - -
Overseas Operation CEO Matthew Feng-Chiang Miau
Vice President Beny Weii
Vice-President James Lee
Vice-President Dicky Chang
Vice-President Rex Shiue
AVP-Finance Oliver Chang
Treasury Manager Grace Huang
* Relevant remuneration received by managers for 2016 is calculated based on the amount actually paid last year and has not yet been approved by shareholders’
meeting.

20 2016 Annual Review
3) Implementation of Corporate Governance
Information on implementation of Board of Directors
As of April 30, 2017 the Board of Directors (A) has convened 6 meetings, and the records of attendance by directors and supervisors are shown below:
Title Name Attendance in
person (B)
Attendance by
proxy
Actual attendance
rate (%) [B/A] Note
Chairman Matthew Feng-Chiang Miau 10 0 100.00%
Director Representative of MiTAC Inc.: Yang,
Hsiang-Yun
10 0 100.00%
Director Representative of MiTAC Inc.: Chou, T.C 10 0 100.00%
Director Evans S.W. Tu 10 0 100.00%
Independent Director Yungdu Wei 10 0 100.00%
Independent Director Yojun Jiao 9 1 90.00%
Independent Director Anping Chang 7 2 70.00%
Other noteworthy matters:
I. Where one of the following requirements is met in the operation of the Board of Directors, the date of the meeting, the term, the contents of the proposal, the
opinions of all the independent directors, and the methods for dealing with the opinions shall be described.
(1) Article 14-3 of the Securities Exchange Act: See the table below.
(2) In addition to the matters mentioned above, Board resolutions that independent directors have expressed opposition or qualified options and have been
noted in the record or declared in writing: None.
II. Avoidance of Conflict of Interest by Directors: None.
III. Assessment of objectives and implementation status in the area of strengthening the powers of the board of directors for the current and immediately past years
will be carried out (set up audit committee and improve transparency of information): None.
Board meeting terms/date Proposal and processing
1st meeting 2016
March 01, 2016
Synnex purchased the shares of Bestcom Infotech Corp.
Independent directors’ opinion: None
Processing of independent directors’ opinion: None
Since Director Evans S.W. Tu was the Director of Bestcom Infotech Corp., he summarized his stakes in this matter and left
the meeting to avoid exercise of the voting right.
Resolution: Except for the director who had stakes in this matter and left the meeting to avoid the solution, the Chairman
asked the rest directors for their opinions and all the present directors approved the proposal.
2nd meeting 2016
March 14, 2016
1. Audit of the manger transfer.
2. Release of the 2015 remuneration to the employees and directors.
3. 2015 issue of new stocks to increase the capital by earnings.
4. Increase of the loan limit to support Seper Marketing Corp.
Independent directors’ opinion: None
Processing of independent directors’ opinion: None
Resolution: The proposal was approved by all the present directors.
3rd meeting 2016
April 27, 2016
1. Share exchange between Synnex and Bestcom Infotech Corp.
2. Change of the Synnex’s current CPA and assessment of the new CPA for his/her independence and competence.
3. The subsidiary Synnex Global Ltd. increasing the capital by NSD 100 million at phases.
4. Loans to the subsidiary Synnex Global Ltd.
Independent directors’ opinion: None
Processing of independent directors’ opinion: None
Resolution: The proposal was approved by all the present directors.
6th meeting 2016
November 14, 2016
Planning of 2017 manager’s remuneration.
Since Chairman Matthew Feng-Chiang Miau and Director Evans S.W. Tu serve as the mangers concurrently, they
summarized their stakes in this matter and left the meeting to avoid exercise of the voting right.
The Chairman designated Independent Director Yungdu Wei as his deputy to preside over the meeting..
Resolution: Except for the directors who had stakes in this matter and left the meeting to avoid the solution, the Deputy
Chairman asked the rest directors for their opinions and all the present directors approved the proposal.
Synnex highlights 21
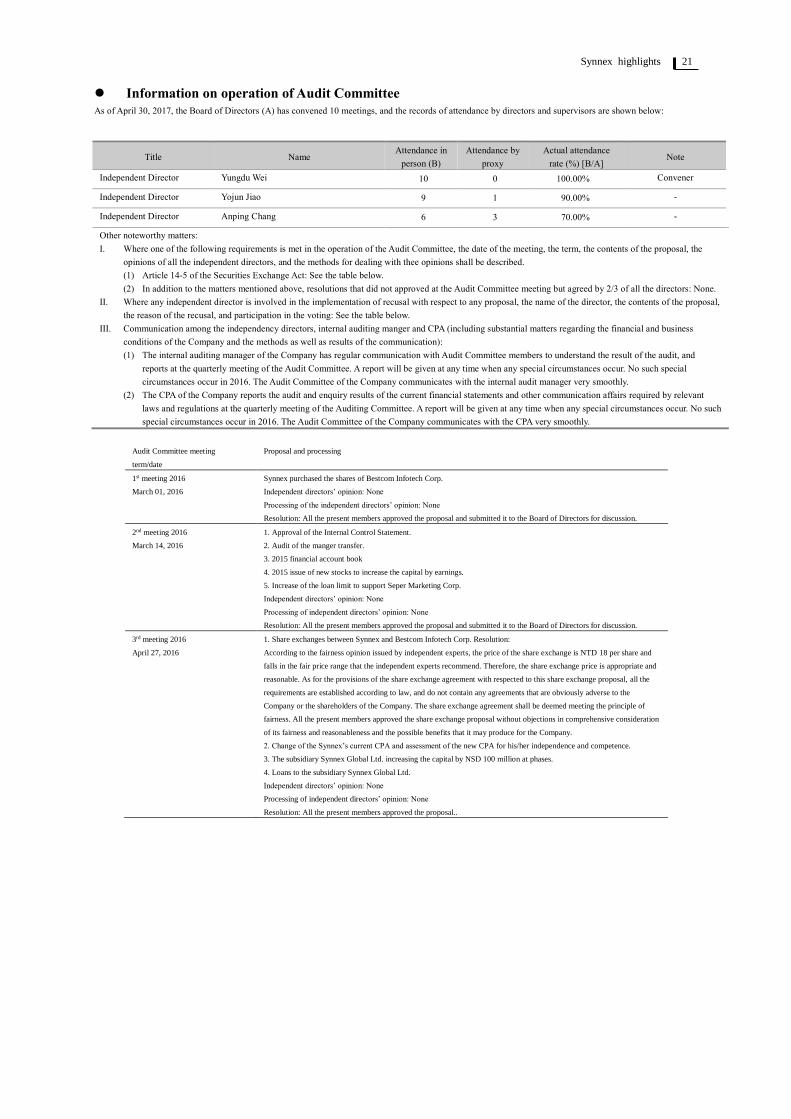
Information on operation of Audit Committee
As of April 30, 2017, the Board of Directors (A) has convened 10 meetings, and the records of attendance by directors and supervisors are shown below:
Title Name Attendance in
person (B)
Attendance by
proxy
Actual attendance
rate (%) [B/A] Note
Independent Director Yungdu Wei 10 0 100.00% Convener
Independent Director Yojun Jiao 9 1 90.00% -
Independent Director Anping Chang 6 3 70.00% -
Other noteworthy matters:
I. Where one of the following requirements is met in the operation of the Audit Committee, the date of the meeting, the term, the contents of the proposal, the
opinions of all the independent directors, and the methods for dealing with thee opinions shall be described.
(1) Article 14-5 of the Securities Exchange Act: See the table below.
(2) In addition to the matters mentioned above, resolutions that did not approved at the Audit Committee meeting but agreed by 2/3 of all the directors: None.
II. Where any independent director is involved in the implementation of recusal with respect to any proposal, the name of the director, the contents of the proposal,
the reason of the recusal, and participation in the voting: See the table below.
III. Communication among the independency directors, internal auditing manger and CPA (including substantial matters regarding the financial and business
conditions of the Company and the methods as well as results of the communication):
(1) The internal auditing manager of the Company has regular communication with Audit Committee members to understand the result of the audit, and
reports at the quarterly meeting of the Audit Committee. A report will be given at any time when any special circumstances occur. No such special
circumstances occur in 2016. The Audit Committee of the Company communicates with the internal audit manager very smoothly.
(2) The CPA of the Company reports the audit and enquiry results of the current financial statements and other communication affairs required by relevant
laws and regulations at the quarterly meeting of the Auditing Committee. A report will be given at any time when any special circumstances occur. No such
special circumstances occur in 2016. The Audit Committee of the Company communicates with the CPA very smoothly.
Audit Committee meeting
term/date
Proposal and processing
1st meeting 2016
March 01, 2016
Synnex purchased the shares of Bestcom Infotech Corp.
Independent directors’ opinion: None
Processing of the independent directors’ opinion: None
Resolution: All the present members approved the proposal and submitted it to the Board of Directors for discussion.
2nd meeting 2016
March 14, 2016
1. Approval of the Internal Control Statement.
2. Audit of the manger transfer.
3. 2015 financial account book
4. 2015 issue of new stocks to increase the capital by earnings.
5. Increase of the loan limit to support Seper Marketing Corp.
Independent directors’ opinion: None
Processing of independent directors’ opinion: None
Resolution: All the present members approved the proposal and submitted it to the Board of Directors for discussion.
3rd meeting 2016
April 27, 2016
1. Share exchanges between Synnex and Bestcom Infotech Corp. Resolution:
According to the fairness opinion issued by independent experts, the price of the share exchange is NTD 18 per share and
falls in the fair price range that the independent experts recommend. Therefore, the share exchange price is appropriate and
reasonable. As for the provisions of the share exchange agreement with respected to this share exchange proposal, all the
requirements are established according to law, and do not contain any agreements that are obviously adverse to the
Company or the shareholders of the Company. The share exchange agreement shall be deemed meeting the principle of
fairness. All the present members approved the share exchange proposal without objections in comprehensive consideration
of its fairness and reasonableness and the possible benefits that it may produce for the Company.
2. Change of the Synnex’s current CPA and assessment of the new CPA for his/her independence and competence.
3. The subsidiary Synnex Global Ltd. increasing the capital by NSD 100 million at phases.
4. Loans to the subsidiary Synnex Global Ltd.
Independent directors’ opinion: None
Processing of independent directors’ opinion: None
Resolution: All the present members approved the proposal..

22 2016 Annual Review
Operations of Remuneration committee
1. There are 3 members of the Remuneration committee.
2. Current term of the Remuneration committee: 2015.6.12 ~ 2018.6.11; as of April 30, 2017, the Remuneration committee (A) has convened 2 meetings. The
qualifications and the records of attendance of committee members are shown below:
Title Name Attendance in
person (B)
Attendance
by proxy
Actual attendance
rate (%) [B/A] Note
Convener Yojun Jiao 3 1 75.00% -
Committee Member Yungdu Wei 4 0 100.00% -
Committee Member Anping Chang 4 0 100.00% -
Other noteworthy matters:
1. If the Board does not accept or amend the proposals of the Remuneration committee, clearly state the date, term, agenda, and resolution of the board and the
Remuneration committee’s opinion processed by the Company
(If the remuneration compensation approved by the Board is greater than the Remuneration committee’s proposal, state the circumstances and reasons for the
differences): None
2. If the committee members have objections or qualified opinions to matters resolved by the Remuneration committee documented or written, state the
Remuneration committee date, term, agenda, the opinions of the members, and the process of the opinions: None
Information on Remuneration committee members
Identity
Qualifications
Name
5 years of experience in the following professions Independence status*
Act as
Remuneration
committee
Member of other
public companies
Note**
An instructor or higher up in a
department of commerce, law, finance,
accounting, or other academic
department related to company
business in a public or private junior
college, college or university.
A judge, public prosecutor, attorney,
certified public accountant, or other
professional or technical specialist who has
passed a national examination and has been
awarded a certificate in a professional
capacity that is necessary for company
business.
Having work
experience in the area
of commerce, law,
finance or accounting,
or otherwise necessary
for company business.
1 2 3 4 5 6 7 8
Independent
Director
Yungdu Wei V V V V V V V V V 9 -
Independent
Director
Yojun Jiao V V V V V V V V V V 1 -
Independent
Director
Anping
Chang V V V V V V V V V - -
* Remuneration committee members are subject to the following conditions for two years before being elected and during tenure:
(1) Neither employees of company nor its affiliates.
(2) Neither a director nor a supervisor of company nor affiliates, unless the person is an independent director of the company, its parent company, or any
subsidiary in which the company holds, directly or indirectly, more than 50 percent of the voting shares.
(3) Not an individual shareholder who holds shares, together with those held by the person’s spouse, minor children, or held under others’ name, in an aggregate
amount of 1% or more of the total outstanding shares of the company or ranks among the top ten shareholders who are natural person in terms of the share
volume held.
(4) Not a spouse or relative within the second degree of kinship, or lineal relative within the fifth degree of kinship, of any of the persons in the preceding three
subparagraphs.
(5) Not directors, supervisors, or employees of a corporate shareholder that directly holds 5% or more of the total outstanding shares of the bank or ranks among
the top 5 corporate shareholders in the terms of share volume held.
(6) Not directors, supervisors, or executive officer holding 5% or more shares of a specific company or institution and who also has financial or business dealings
with the company.
(7) Not a business owner, partner, director, supervisor, manager, and their spouses of professionals, proprietors, partners, corporations, or institutions providing
business, legal, financial, and accounting services to the company or its associated companies.
(8) Not any of the circumstances in the subparagraphs of Articles 30 of the Company Act.

Synnex highlights 23
The current status of corporate governance and its comparison against the Corporate Governance
Best-Practice Principles for TSEC/GTSM Listed Companies and its reasons
Assessment Items
Execution Comparison against the Corporate
Governance Best-Practice Principles for
TSEC/GTSM Listed Companies and its
reasons
Yes No Summary
I. Does the Company base on the “Corporate
Governance Best-Practice Principles for
TWSE/GTSM Listed Companies” to set up and
disclose the Company’s corporate governance
best-practice principles?
V The Company intends to setup and disclose the “Corporate Governance Best-Practice
Principles” in 2016.
In compliance with the concept and
implementation of the “Corporate
Governance Best-Practice Principles for
TWSE/GTSM Listed Companies”
II. Structure of the Company’s shareholders and
equities
(I) Does the Company have the internal procedures
regulated to handle shareholders’ proposals, doubts,
disputes, and litigation matters; also, have the
procedures implemented accordingly?
V (I) The Company intends to setup the “Procedures for Handling Material Inside
Information” in 2015 for compliance. In addition, the company has a
spokesperson system established to properly handle the shareholders’ proposals,
doubts, disputes, and litigation matters.
In compliance with the concept and
implementation of the “Corporate
Governance Best-Practice Principles for
TWSE/GTSM Listed Companies”
(II) Does the Company keep track of the major
controlling shareholders as well as their ownership
structure?
V (II) Our company is able to keep track of the major controlling shareholders as well
as their ownership structure; shareholding of the directors, supervisors and major
shareholders are filed on the monthly basis in accordance with Securities and
Exchange Act.
(III) Are the firewall and risk control mechanism to
reduce the risks involved with the Company’s
related companies?
V (III) The company has established and implemented the related system in accordance
with the governing law and regulations and the internal control system. In
addition to actually handling the self-inspection process, the Board of Directors
and management also regularly and occasionally review the self-inspection
results of each department and the audit reports of the audit unit, substantiate the
company’s internal control system, establish profound financial, operational, and
accounting management system and strengthen the management of the affiliated
companies in accordance with the relevant provisions for the public companies,
and implement the necessary control mechanism in order to reduce operational
risk. Rules of financial and business operation with the related companies are
based on fair and reasonable principle.
(IV) Does the Company set up internal norms to prohibit
the insiders from utilizing the undisclosed
information to trade securities?
V (IV) The company has the code of conduct setup to prohibit the insiders of the
company from utilizing the undisclosed information to trade securities.
III. Board composition and responsibilities
(I) Does the Board of Directors have diversified
policies regulated and implemented substantively
according to the composition of the members?
V (I) The Company has stipulated in the Articles of Association to have 2-3
independent directors appointed in accordance with Article 14.2 of the Securities
Exchange Act. In addition, it is stated in the Articles of Association to have the
independent directors elected by nomination in accordance with Article 192.1 of
the Company Law. The aforementioned amendment to the Articles of Association
was resolved in the Company’s 2011 General Shareholders’ Meeting. The
Company’s independent directors were elected in 2012. The education and
experience, professionalism, and independence of the three independent directors
are in conformity with Article 2, 3, and 4 of the Rules Governing the
Appointment of Independent Directors by Public Companies and Compliances;
also, Article 192.1 Paragraph 4 of the Company Law.
(I) In compliance with the concept and
implementation of the “Corporate
Governance Best-Practice Principles
for TWSE/GTSM Listed
Companies”.
(II) Does the Company, in addition to setting the
Remuneration Committee and Audit Committee
lawfully, have other functional committee set up
voluntarily?
V (II) The company is committed to pursue corporate governance and to strengthen the
mechanism of organization and operation continuously. The Remuneration
Committee was formed in 2012 The Audit Committee will be established in
2015; also, more functional committees will be planned continuously in the
future.
(II) For the consideration of the law and
regulations or the actual operations,
if any, it is to be handled in
accordance with the “Corporate
Governance Best-Practice Principles
for TWSE/GTSM Listed
Companies” and the related law and
regulations.
(III) Does the Company have the performance evaluation
rules and methods for the Board of Directors
regulated and have the performance evaluation
performed regularly every year?
V (III) The Board Chairman is the Chairman of the Company. The promotion of the
business strategy is executed by the professional management. The
responsibilities of the Board of Directors include supervision, appointment, and
guide the company’s management; also, responsible for the company’s overall
operations, improving the supervision mechanism and strengthening the
management capabilities. However, a formal board performance evaluation
method and assessment method is not yet established, which will be established
in the future according to the actual practice in order to protect shareholders’
interests.
(IV) Is the independence of auditors regularly assessed? V (IV) The company has the independence of the CPA assessed regularly and annually;
also, considered whether it is necessary to have the CPA replaced. The
appointment of the CPA is resolved by the Company’s Board of Directors; also,
there is not a conflict of interest and it is a reputable accounting firm in Taiwan;
therefore, the independence and professionalism of the CPA is not in doubt.
IV. Do listed and OTC companies set up designated
(concurrent) company governance units or personnel
responsible for the governance-related matters of the
company (including but not limited to providing
required materials for directors and supervisor to do
their duties, dealing with matters related to the Board
and shareholders’ meetings according to laws,
dealing with company registration and its change,
preparing the minutes of the Board and shareholders’
meetings)?
V The Company has designated personnel responsible for the governance-related matters
including providing required materials for the Board of Directors and independent
directors to do their duties, dealing with matters related to the Board and shareholders’
meetings according to laws, dealing with company registration and its change,
preparing the minutes of the Board and shareholders’ meetings.
In compliance with the concept and
implementation of the “Corporate
Governance Best-Practice Principles for
TWSE/GTSM Listed Companies”

24 2016 Annual Review
V. Does the Company have established a
communication channel for the stakeholders
(including but not limited to shareholders,
employees, customers, and suppliers), set up the
stakeholder column on the Company’s website, and
responded to the stakeholders regarding their
concerns over corporate social responsibilities?
V The Company has set up the stakeholder column and disclosed the contact phone
number and person to respond to the stakeholders appropriately.
In compliance with the concept and
implementation of the “Corporate
Governance Best-Practice Principles for
TWSE/GTSM Listed Companies”
VI. Does the Company have commissioned a
professional stock affairs service agent to handle
shareholders affairs?
V The company commissions China Trust Commercial Bank to handle the shareholders’
meeting related matters.
In compliance with the concept and
implementation of the “Corporate
Governance Best-Practice Principles for
TWSE/GTSM Listed Companies”
VII. Information disclosure
(I) The Company has set up a website (http://www.synnex-grp.com.tw) to disclose
relevant information on financial status and business.
(I) In compliance with the concept and
implementation of the “Corporate
Governance Best-Practice Principles
for TWSE/GTSM Listed
Companies”.
(II) For the consideration of the law and
regulations or the actual operations,
if any, it is to be handled in
accordance with the “Corporate
Governance Best-Practice Principles
for TWSE/GTSM Listed
Companies” and the related law and
regulations.
(I) Does the company have a website setup for the
disclosure of relevant information on financial
status and corporate governance?
V
(II) Are there other methods adopted to disclose
information (i.e., Set up English website, designate
a person engage in gathering and compiling the
Company’s information, implement spokesperson
system, display company website during meeting
with institutional investors.)?
V (II) As required, relevant information of the Company has been disclosed in “Market
Observation Post System” for the understanding and inquiry of the investors.
(III) The company has a spokesman and a deputy spokesman appointed.
(IV) The Company has the corporate governance information disclosed in the
“Investor Relations” section on the Company’s website with the information
updated in a timely manner.
VIII. Are there other important information (including
but not limited to the interests of employees,
employee care, investor relations, supplier relations,
the rights of stakeholders, the continuing education
of directors and supervisors, the implementation of
risk management policies and risk measurement
standards, the execution of customer policy, the
purchase of liability insurance for the Company’s
directors and supervisors) that are helpful in
understanding the corporate governance operation
of the Company?
V (I) Employee benefits:
We firmly believe that staff is the driving force of business growth; therefore, the
company appreciates the importance of employee benefits; also, is committed to
fulfill all the legal rights and interests of employees.
1. System: (1) Labor and health insurance, pension appropriation, employee
education and training, employee health seminars from time to time; (2)
Continuing to provide employees with a variety of benefits, such as: a life
insurance with a coverage of at least NTD3 million (far better than the general
business), free health checkup, weddings, funeral, and maternity benefits,
interest-free loans, external training subsidies, etc.
2. Implementation: (1) Statutory rights and interests of employees are handled
according to law; (2) Various employee benefits are handled by the designated
personnel; (3) The group insurance has provided sufficient coverage to the
employees who had suffered severe injuries or sickness in the recent years
with 3-5 years of economic security provided. Considering the needs of the
employee’s families for insurance coverage, the company provides the
employees and their families with preferential “Vanity” life insurance and
accident insurance policy.
(II) Investor Relations: The company insists on the principle of integrity and
information disclosure fairness; also, exercises corporate governance
transparency, regularly publishes company operational and financial information
to the shareholders, and sets the spokesman and deputy spokesman system to
fulfill the company’s information disclosure responsibility and obligations of the.
(III) Supplier relationships and the rights of interested parties: The company and its
suppliers have maintained a long-term close relation of cooperation.
(IV) Advanced study of the directors and supervisors: The Directors and Supervisors
of the Company have a background in industry and have the advanced studies
disclosed in the “MOPS” for the reference of the shareholders and investors. The
2014 advanced studies are disclosed in the attachment.
(V) Implementation of risk management policies and risk measurement: Internal
regulations are stipulated accordingly for risk management and assessment.
(VI) The recusal of the interested directors: The Directors of the Company must be
recused from voting on any motions in conflict with.
(VII) Implementation of the customers’ policies: The company and its customers
remained a stable and good relationship to create profits for the company.
(VIII) The purchase of liability insurance for the directors and supervisors: The
Company has acquired liability insurance for our directors and supervisors in
accordance with the “Corporate Governance Best-Practice Principles for
TWSE/GTSM Listed Companies” and it has been disclosed in the “MOPS.”
Insured subject Insurance
company
Insured amount
(NTD: Thousand) Insurance period
All directors and
supervisors
Fubon Insurance
Co., Ltd. 608,272
09.01.2015 ~
09.01.2016
All directors and
supervisors
Fubon Insurance
Co., Ltd. 656,860
09.01.2016 ~
09.01.2017
(IX) The directors and supervisors of the Company have fulfilled responsibilities
truthfully and exercised power in good faith.
(X) The Company has the “Rules of Procedure for Board of Directors Meeting”
stipulated and implemented.
(XI) The Company’s board meeting has been convened quarterly at least to strengthen
corporate governance.
In compliance with the concept and
implementation of the “Corporate
Governance Best-Practice Principles for
TWSE/GTSM Listed Companies”

Synnex highlights 25
IX. The companies shall describe the improvements made according to the last corporate governance evaluation results issued by the Corporate Governance Center of Taiwan Securities Exchange and
the measures to be enhanced in the first priority for the matters that have not been improved (not applicable to the companies that are not incorporated in the evaluation). The Company was ranked
in the Top 21%~35% in the result of the 2nd corporate governance evaluation (Year 2015). The improvements that the Company has made and the measures to be enhanced in the first priority for
the matters that have not been improved with respect to the 3rd corporate governance evaluation are described below.
Indicator Description
Improved
(Y/N)
Measures to be enhanced in the first priority for the
matters that have not been improved
Equity maintenance
Faire to shareholders
1.14 Does the annual report of the Company disclose the review of how the
resolution of the regular shareholders’ meeting is implemented?
2.8 Does the Company upload the annual report of English version 7 days before
convention of the regular shareholders’ meeting?
Y
N
The internal and external resources for making English
annual report have not been completely prepared 7 days
before convention of the regular shareholders’ meeting.
The English annual report is simultaneously uploaded to
MOPS and the website of the Company.
Enhancement of the
structure and operation of
the Board of Directors
3.15 Does the Company disclose its established corporate governance code?
3.16 Does the Company establish and disclose the diversification policy of board
of directors?
3.17 Does the Company disclosed the established ethical corporate management
code and corporate social responsibility code?
3.30 Does the Company’s Board of Directors assess the CPAs for their
independence on a regular basis (at least once a year) and disclose the
assessment procedure in the annual report?
Y
N
Y
Y
The Company has amended the corporate governance
code. Enhancement will be carried out with respect to
individual directors to implement the diversification
policy of board of directors.
Improvement of
information transparency
4.13 Does the Company disclose the name list of the principal shareholders,
including the shareholders with a stake of 5 percent or more or the name of
the Top 10 shareholders, in the annual report and on the website?
Y
Fulfillment of corporate
social responsibility
5.1 Does the Company establish CSR policies, systems, or relevant management
guidelines, make concrete implementation plans and results, and disclose
them in the annual report or on the website of the Company?
5.3 Does the Company establish a designated (concurrent) CRS unit and describe
the operation and implementation status of the unit in the annual report?
5.9 Does the Company disclose employee welfare measures, retirement systems,
and their implementation status in the annual report?
5.10 Does the Company disclose the working environment of the employees and
personal safety protection measures in the annual report?
5.12 Does the Company establish a system for reporting illegal (including
corruption) and immoral behaviors of any internal and external personnel, and
comprehensively disclose it on the website of the Company?
Y
Y
Y
Y
N
Regulations has not been established but in progress.
Education of directors and supervisors
Director and Supervisor Educational institutions Course title Training period
Credit hours Credit hours
Director Matthew
Feng-Chiang Miau
Taiwan Institute of Directors Reversal of competitiveness – International situation and
solution after COP 21.
2016.03.08 3 3
Director Matthew
Feng-Chiang Miau
ROC Securities and Futures Institute The prospect of the economy in Taiwan and the
prospective application of the block chain in global
industries
2016.09.07 3
Director Evans S.W. Tu ROC Securities and Futures Institute The prospect of the economy in Taiwan and the
prospective application of the block chain in global
industries
2016.09.07 3
Representative of
corporate director
Chou, T.C. ROC Securities and Futures Institute The prospect of the economy in Taiwan and the
prospective application of the block chain in global
industries
2016.09.07 3
Representative of
corporate director
Hsiang-Yun Yang ROC Securities and Futures Institute The prospect of the economy in Taiwan and the
prospective application of the block chain in global
industries
2016.09.07 3
Independent Director Yungdu Wei Taiwan Institute of Directors Major controversial cases about responsibility of the
supervisors for financial statements
2016.03.04 3 3
Independent Director Yungdu Wei Taiwan Academy of Banking and Finance Corporate governance forum – Wealth management and
tax saving planning for high asset groups
2016.04.13 3 3
Independent Director Yungdu Wei Taiwan Institute of Directors Risk management, internal control, and information
management practices
2016.06.29 3 3
Independent Director Yungdu Wei Taiwan Institute of Directors Practical operation of independent directors and function
committees
2016.07.29 2 3
Independent Director Yungdu Wei ROC Securities and Futures Institute The prospect of the economy in Taiwan and the
prospective application of the block chain in global
industries
2016.09.07 3
3
Independent Director Yungdu Wei ROC Securities and Futures Institute International and domestic anti-avoidance development
and responses to be taken by enterprises
2016.12.06 3 1
Independent Director Anping Chang ROC Securities and Futures Institute The prospect of the economy in Taiwan and the
prospective application of the block chain in global
industries
2016.09.07 3
Independent Director Yojun Jiao Taiwan Institute of Directors Leadership in an innovative epoch – Industrial innovation
from the viewpoint of IoT, cloud service, and big data
2016.09.03 3 3

26 2016 Annual Review
Performance of Social Responsibilities
Assessment Items
Execution Comparison against the Corporate
Governance Best-Practice Principles
for TSEC/GTSM Listed Companies
and its reasons Yes No Summary
I. Exercising corporate governance
(I) Has the company declared its corporate social
responsibility policy and examined the results of the
implantation?
V (I) The company's corporate social responsibility policy is promulgated in accordance with
"Synnex values" and has formed part of corporate culture. The complete "Synnex's
values" (enacted in 1988) is as follows:
1. Maintaining the interests of employees and shareholders is our responsibility. We will
handle each other’s interests based on honest and fair principles.
2. We concentrate on establishing a good corporate culture so as to allow employees
opportunities to realize their full potential within the company's business philosophy
and organizational strategies.
3. We are dedicated to the principles of integrity and highest business ethics, we do not
provide incentive to others to violate the employer or the company's interests while do
not allow our employees to receive the incentive.
4. To us, contribute to the society or the industry is our obligation and mission.
5. Our belief: win trust is an honor and responsibility; accept criticism with grace is seen
as wisdom and courage.
In compliance with the “Corporate
Social Responsibility Best Practice
Principles for TWSE/GTSM listed
companies”.
(II) Does the Company have the CSR education and
training arranged on a regular basis?
V (II) The company has education and training courses arranged for the new recruits on the day
they report to work with the company’s business operation and philosophy advocated,
including the concept of corporate social responsibility. Advocate positive viewpoint
with a subtle effect through long-term internal education and training of Synnex EMBA
articles and Synnex conceptual phrases.
In compliance with the “Corporate
Social Responsibility Best Practice
Principles for TWSE/GTSM listed
companies”.
(III) Does the Company have a specific (or part-time)
unit set up to promote corporate social
responsibility, have the management authorized by
the Board of Directors to handle matters and report
the processing results to the Board of Directors?
V (III) The Company established the CSR Work Team in 2015 with the President designated as
the convener. The promotion of corporate social responsibility is to be coordinated by
the Human Resources Quality Management Department of the President's Office. Four
work teams were formed on the subject with a competent director and employees of
each department elected to fulfill the responsibilities. The CSR Work Team is
responsible for coordinating, managing, and implementing the CSR policies and
activities of Synnex; also, it is responsible for preparing and publishing the annual CSR
report.
In compliance with the “Corporate
Social Responsibility Best Practice
Principles for TWSE/GTSM listed
companies”.
(IV) Does the Company have a reasonable salary and
remuneration policy setup, have the employee
performance evaluation system combined with
corporate social responsibility policies, and have a
clear and effective reward and punishment system
established?
V (IV) The company sets a reasonable remuneration policy with the considerations of external
market, internal fairness, and reasonableness; also, based on the operational goals and
individual performance. The annual gross income reflects individual contribution fairly
and truthfully. The company had integrity and fairness disclosed in the company’s
sense of value when the company was founded, protecting the interests of staff and
shareholders, upholding the highest business ethics, and not infringing the company’s
interests for any personal gains. Each employee commits to comply with the integrity
rules with a contract and integrity commitment letter signed; also, the rewards and
penalties system is set to clearly regulate the code of conduct.
In compliance with the “Corporate
Social Responsibility Best Practice
Principles for TWSE/GTSM listed
companies”.
II. Fostering a sustainable environment
(I) Does the company endeavor to utilize all resources
more efficiently and uses renewable materials which
have a low impact on the environment?
V (I) The company endeavors to utilize all resources more efficiently and uses renewable
materials which have a low impact on the environment.
1. Reuse of recycled packaging materials.
2. Promote paperless operations, such as use electronic signature system to reduce paper
consumption and reach the goal of energy conservation and carbon and greenhouse
gas reduction.
In compliance with the “Corporate
Social Responsibility Best Practice
Principles for TWSE/GTSM listed
companies”.
(II) Does the Company establish proper environment
management systems based on the characteristics of
their industries?
V (II) Though Synnex is a distributor of 3C products instead of highly polluted industry, but
we devote to fulfill environmental responsibility based on the faith that earth is part of
our life.
In compliance with the “Corporate
Social Responsibility Best Practice
Principles for TWSE/GTSM listed
companies”.
(III) Does the Company monitor the impact of climate
change on its operations and should establish company
strategies for energy conservation and carbon and
greenhouse gas reduction?
V (III) The Company engages in consumer electronics products channel sale that is not a
high-polluting industry. The carbon dioxide emissions are mainly generated by the
vehicles used by the operations center. The carbon dioxide emissions are calculated
according to the vehicle mileage. A total of 1,084 metric tons of carbon dioxide
emission was generated by vehicles in 2013 and 1,104 metric tons in 2014. For the
replacement of old vehicles, the vehicles that meet the fifth emission standard are used
to reduce the impact of vehicles on environmental protection. The strategies that the
Company established for energy conservation and carbon and greenhouse gas reduction
are as follows:
1. Main engine of air conditioner cannot be started when office temperature below 26°C.
2. Air conditioner switched off at 7:30PM.
3. All lamps used in the manufacturing plant are T5 energy saving fluorescent lamp and
single fluorescent lamp.
4. All distribution vehicles must turn off engine when parked in the plant site, and air
conditioner is disallowed at low speed.
5. Promote use of the stairs and skip the use of elevators.
In compliance with the “Corporate
Social Responsibility Best Practice
Principles for TWSE/GTSM listed
companies”.
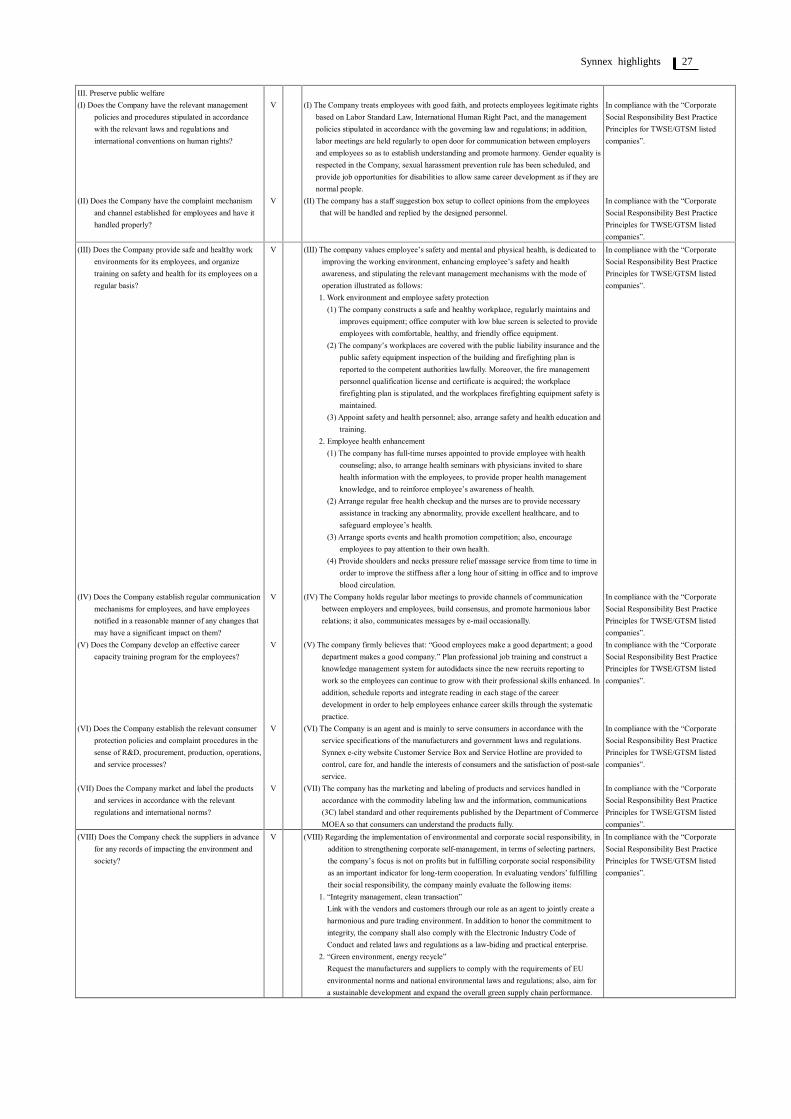
Synnex highlights 27
III. Preserve public welfare
(I) Does the Company have the relevant management
policies and procedures stipulated in accordance
with the relevant laws and regulations and
international conventions on human rights?
V (I) The Company treats employees with good faith, and protects employees legitimate rights
based on Labor Standard Law, International Human Right Pact, and the management
policies stipulated in accordance with the governing law and regulations; in addition,
labor meetings are held regularly to open door for communication between employers
and employees so as to establish understanding and promote harmony. Gender equality is
respected in the Company, sexual harassment prevention rule has been scheduled, and
provide job opportunities for disabilities to allow same career development as if they are
normal people.
In compliance with the “Corporate
Social Responsibility Best Practice
Principles for TWSE/GTSM listed
companies”.
(II) Does the Company have the complaint mechanism
and channel established for employees and have it
handled properly?
V (II) The company has a staff suggestion box setup to collect opinions from the employees
that will be handled and replied by the designed personnel.
In compliance with the “Corporate
Social Responsibility Best Practice
Principles for TWSE/GTSM listed
companies”.
(III) Does the Company provide safe and healthy work
environments for its employees, and organize
training on safety and health for its employees on a
regular basis?
V (III) The company values employee’s safety and mental and physical health, is dedicated to
improving the working environment, enhancing employee’s safety and health
awareness, and stipulating the relevant management mechanisms with the mode of
operation illustrated as follows:
1. Work environment and employee safety protection
(1) The company constructs a safe and healthy workplace, regularly maintains and
improves equipment; office computer with low blue screen is selected to provide
employees with comfortable, healthy, and friendly office equipment.
(2) The company’s workplaces are covered with the public liability insurance and the
public safety equipment inspection of the building and firefighting plan is
reported to the competent authorities lawfully. Moreover, the fire management
personnel qualification license and certificate is acquired; the workplace
firefighting plan is stipulated, and the workplaces firefighting equipment safety is
maintained.
(3) Appoint safety and health personnel; also, arrange safety and health education and
training.
2. Employee health enhancement
(1) The company has full-time nurses appointed to provide employee with health
counseling; also, to arrange health seminars with physicians invited to share
health information with the employees, to provide proper health management
knowledge, and to reinforce employee’s awareness of health.
(2) Arrange regular free health checkup and the nurses are to provide necessary
assistance in tracking any abnormality, provide excellent healthcare, and to
safeguard employee’s health.
(3) Arrange sports events and health promotion competition; also, encourage
employees to pay attention to their own health.
(4) Provide shoulders and necks pressure relief massage service from time to time in
order to improve the stiffness after a long hour of sitting in office and to improve
blood circulation.
In compliance with the “Corporate
Social Responsibility Best Practice
Principles for TWSE/GTSM listed
companies”.
(IV) Does the Company establish regular communication
mechanisms for employees, and have employees
notified in a reasonable manner of any changes that
may have a significant impact on them?
V (IV) The Company holds regular labor meetings to provide channels of communication
between employers and employees, build consensus, and promote harmonious labor
relations; it also, communicates messages by e-mail occasionally.
In compliance with the “Corporate
Social Responsibility Best Practice
Principles for TWSE/GTSM listed
companies”.
(V) Does the Company develop an effective career
capacity training program for the employees?
V (V) The company firmly believes that: “Good employees make a good department; a good
department makes a good company.” Plan professional job training and construct a
knowledge management system for autodidacts since the new recruits reporting to
work so the employees can continue to grow with their professional skills enhanced. In
addition, schedule reports and integrate reading in each stage of the career
development in order to help employees enhance career skills through the systematic
practice.
In compliance with the “Corporate
Social Responsibility Best Practice
Principles for TWSE/GTSM listed
companies”.
(VI) Does the Company establish the relevant consumer
protection policies and complaint procedures in the
sense of R&D, procurement, production, operations,
and service processes?
V (VI) The Company is an agent and is mainly to serve consumers in accordance with the
service specifications of the manufacturers and government laws and regulations.
Synnex e-city website Customer Service Box and Service Hotline are provided to
control, care for, and handle the interests of consumers and the satisfaction of post-sale
service.
In compliance with the “Corporate
Social Responsibility Best Practice
Principles for TWSE/GTSM listed
companies”.
(VII) Does the Company market and label the products
and services in accordance with the relevant
regulations and international norms?
V (VII) The company has the marketing and labeling of products and services handled in
accordance with the commodity labeling law and the information, communications
(3C) label standard and other requirements published by the Department of Commerce
MOEA so that consumers can understand the products fully.
In compliance with the “Corporate
Social Responsibility Best Practice
Principles for TWSE/GTSM listed
companies”.
(VIII) Does the Company check the suppliers in advance
for any records of impacting the environment and
society?
V (VIII) Regarding the implementation of environmental and corporate social responsibility, in
addition to strengthening corporate self-management, in terms of selecting partners,
the company’s focus is not on profits but in fulfilling corporate social responsibility
as an important indicator for long-term cooperation. In evaluating vendors’ fulfilling
their social responsibility, the company mainly evaluate the following items:
1. “Integrity management, clean transaction”
Link with the vendors and customers through our role as an agent to jointly create a
harmonious and pure trading environment. In addition to honor the commitment to
integrity, the company shall also comply with the Electronic Industry Code of
Conduct and related laws and regulations as a law-biding and practical enterprise.
2. “Green environment, energy recycle”
Request the manufacturers and suppliers to comply with the requirements of EU
environmental norms and national environmental laws and regulations; also, aim for
a sustainable development and expand the overall green supply chain performance.
In compliance with the “Corporate
Social Responsibility Best Practice
Principles for TWSE/GTSM listed
companies”.

28 2016 Annual Review
(IX) Does the contract signed by the Company with the
major suppliers entitle the Company to have the
contract cancelled or terminated at any time when
the suppliers violate the CSR policies that have a
significant impact on the environment and society?
V (IX) Currently the agreement of having a contract terminated or cancelled while violating the
“Corporate Social Responsibility Policy” is not signed by all the trade partners of the
company; however, the company is now actively promoting it in order to achieve the
goal of having the company and suppliers worked together to enhance corporate social
responsibility.
Disclose when there is regulatory or
actual requirement.
IV. Enhancing information disclosure
(I) Does the Company have the relevant and reliable CSR
information disclosed on the Company’s website
and MOPS?
V The Company had the CSR section setup on the website with the first 2014 CSR report
published at the end of 2015 and uploaded on the Company’s website and MOPS. The
annual CSR report will be published in the following year for the reference of the
stakeholders with the contact information provided as a communication channel with the
stakeholders.
In compliance with the “Corporate
Social Responsibility Best Practice
Principles for TWSE/GTSM listed
companies”.
V. If the Company has established corporate social responsibility principles based on “Corporate Social Responsibility Best Practice Principles for TWSE/GTSM listed companies”, please describe any
discrepancy between the principles and their implementation:
The implementation of the Company’s CSR is described below. In addition, please refer to the CSR report published in the CSR section on Synnex’s website.
VI. Other important information to facilitate better understanding of the Company’s corporate social responsibility:
It is described below. In addition, please refer to the CSR report published in the CSR section on Synnex’s website.
VII. If the products or corporate social responsibility report have received assurance from external institutions, they should state so below: None.
The implementation of other corporate social responsibilities.
Environmental management
Synnex is engaged in 3C channel business operation that does not involve high pollution. However, Synnex is based on the strong belief of being a global citizen on Earth to strive for environmental
protection.
(I) Reduce the impact of business services on the environment
Synnex has recycling symbols and recycling bins setup for obsoleted or used cellphones, electronic products, and batteries at the maintenance centers in Taiwan. Consumers are reminded to have their
personal information deleted from their cell phones before recycling for personal privacy protection. The recycling and disposition process is handled by contracted vendors on a quarterly basis
(II) Reduce the impact of logistics and transportation delivery on the environment
For the consumables channel business operation, logistics vehicles are the main source of energy consumption and greenhouse gas emissions. Therefore, Synnex was well aware of such issue long
before and has taken the necessary measures for management in order to reduce the impact on the environment throughout the product transportation process. While replacing used vehicles with new
ones, vehicles in compliance with the environmental regulations of the ROC are used to reduce air pollution throughout the product transportation process. Synnex, through the logistics management
information system developed in-house, combined with its own distribution fleet and years of practical experience in distribution, has its distribution routes divided and planned with 2~3 deliveries
made daily by the designated personnel and vehicles in order to reduce inefficient transport routes. Logistics vehicles coming back into the plant must have the engine turned off and the air
conditioning turned off while the vehicles are idling.
Employee Care
Synnex strongly believes: “Good staff makes a good sector; a good sector makes a good company.” We wish to provide each employee with appropriate care and attention, to substantiate employee care, to
offer colleagues with a talent development platform, and to continue bringing a sense of accomplishment and satisfaction at work. Based on the employee-oriented concept, Synnex has constructed a
diversified, equal, warm, and sound workplace; also, we paid attention to employee safety and talent training and development.
(I) Employee diversification and equality
We hire employees without any discrimination in the sense of race, class, language, thought, religion, political party, place of birth, gender, appearance, facial features, sexual orientation, age, marital
status, mental and physical disability, or union membership.
(II) Workplace Safety and Health
Workplace safety and health is an important commitment of Synnex so that employees can work at ease. To strengthen the prevention of occupational hazards, our electromechanical technicians patrol
the workplaces and engineering rooms daily, strengthen electrical safety (For example: Replaced the 1250KW and 750KW transformer insulation oil in the B1 high voltage transformer room at the
end of 2015), test water quality quarterly, perform repair work (For example: Repaired scaffolding and strengthened the lighting of the motorcycle parking lot), renew protection gear (For example:
attic ladder rackmount); and regularly inspect building structural safety, tilt, firefighting equipment, building facilities security, etc. to ensure that our partners are able to work at ease.
We introduced health service doctors since November 2013 with services provided on site every two-months, including health seminars and physician consultation; also, we setup healthcare nurses in
April 2014 to regularly inspect the nursery environment and supplements. The screens (low blue light equipment) in the office have been fully replaced since 2015 to reduce the hazard of eye injury of
colleagues who have to stare at the screens for a long time. We arrange health promotion activities, such as, weight loss programs, Employee Athletic Games, blood donation activities, staff canteen to
provide healthy foods (fruit and bread), etc., and the establishment of corporate group activities (a basketball club).
(III) Peace of mind and Security
1. Emphasizing the creation of an “intelligent and balanced work life style” to encourage colleagues “taking vacation” adequately. In addition to the annual leave required by law, new recruits with
less than one-year seniority are entitled to a 7-day leave (proportionally to the days of work performed) that is more preferential than the requirement of the Labor Standards Law.
2. Obtain life insurance coverage for at least NT$3 million for all full time employees to strengthen the family basic protection for employees.
3. Employees with one-year seniority may apply for interest-free loans for purchasing a family home, home improvement, marriage, birth, car, and emergency relief, so far, more than 500
employees had applied for such loans.
4. Gift money/gift certificate for marriage, funeral, hospitalization, maternity, and birthdays;
5. Statutory protection of full payment of labor insurance, labor pension appropriation, and national health insurance.
(IV) Women Friendly Workplace Environment
1. The Company’s selection and promotion of personnel is not affected by the factor of gender. More than 40% of the managers are women.
2. A comfortable and private nursery is offered for stress-free breast feeding.
3. We provide the employees with a friendly flexible parental leave environment. According to the statistics, 50% of the female colleagues (also a number of male colleagues had applied for parental
leave) had applied for parental leave right after maternity leave in the last three years; also, up to 72% of the colleagues on a parental leave had applied for reinstatement that has helped reduce
female colleagues torn between work and family care, so that female colleagues do not have to cut their career short due to the need for short-term family care.
Social Care
Synnex has upheld the belief of “knowledge and experience sharing is our way of community feedback” for years. Therefore, Synnex’s years of experience and knowledge in internal management is
composed as internal education and training materials of “Synnex EMBA” and “Synnex Concepts” and shared with the world free of charge; moreover, the royalty income of the articles published is
donated entirely for promoting education, culture, and arts. Synnex’s management experience is also provided to the academic community for study. The Business School of National Chengchi University
has chosen Synnex as a case study of Taiwan business management and the case study is issued to business schools worldwide. In addition, the Synnex Operations Center accepts visitation applications
filed by academic institutions for teaching and research purposes in order to promote academic exchanges and to provide students with internship opportunities for talent cultivation.
Synnex held a blood donation activity in 2015 and bought a charity moon cake to share with the colleagues in the Mid-Autumn Festival. In addition to supporting public welfare, Synnex has adopted street
trees, continued to feedback to society, and fulfill corporate social responsibility.

Synnex highlights 29
Status of Implementation of Integrity Operation
Item
Execution Comparison against the Corporate
Governance Best-Practice Principles
for TSEC/GTSM Listed Companies
and its reasons Yes No Summary
I. Set integrity management policies and
programs
(I) Does the company express a clear integrity
management policy in the Articles of
Association and external documents, and the
board and the management are actively
committed to its implementation?
V (I) The Company has established the “Integrity Management Code” and the
Internal Audit Office is responsible for integrity management policies,
prevention programs, and supervision.
In compliance with the concept and
implementation of the “Corporate
Governance Best-Practice Principles for
TWSE/GTSM Listed Companies”.
(II) Does the Company have the prevention
program for any fraud stipulated and have
the respective operating procedures,
guidelines for conduct, disciplinary actions,
and complaints system declared explicitly;
also have it implemented substantively?
V (II) The company has stipulated the “Manufacturers Commitment” to request
all suppliers having transactions conducted faithfully without any acts of
bad faith, and to establish a good procurement system. To ensure the
implementation of integrity management, the Company has established an
effective accounting system and internal control system; also, internal
audit staff has the compliance of the systems referred to above checked
regularly.
(III) Does the Company have preventive
measures adopted in response to the
conducts stated in Article 7 Paragraph 2 of
the “Corporate Governance Best-Practice
Principles for TWSE/GTSM Listed
Companies” or other business activities
subject to higher risk of fraud?
V (III) The company has the “code of conduct” setup. The management measures
are established to prevent bribery and taking bribe and prohibit providing
illegal political contributions, improper charitable donations or
sponsorship, and offering or accepting unreasonable gifts, entertainment,
or other improper benefits for the operating activities stated in Article 7
Paragraph 2 of the “Corporate Governance Best-Practice Principles for
TWSE/GTSM Listed Companies” or other business activities subject to
higher risk of fraud.
II. Implementation of integrity management
(I) Does the company have the integrity of the
trade counterparty assessed and with the
code of integrity expressed in the contract
signed?
V (I) The Company has stipulated the “Manufacturers Commitment” to request
all suppliers having transactions conducted faithfully without any acts of
bad faith, and to establish a good procurement system.
In compliance with the concept and
implementation of the “Corporate
Governance Best-Practice Principles for
TWSE/GTSM Listed Companies”
(II) Does the Company have a specific
(part-time) unit setup under the board of
directors to advocate the code of integrity
and to report on its implementation to the
Board on a regular basis?
V (II) The Company has not set up a dedicated unit for integrity management.
Each department is to fulfill integrity management according to job
responsibilities and operation scope.
(III) Does the Company have developed policies
to prevent conflicts of interest, provided
adequate channel for communication, and
substantiated the policies?
V (III) The Company has stipulated the “Employee Integrity Commitment” to
request that employees shall not commit any form of “improper conduct,”
such as, kickback, commissions, equity interest in any form or improper
gifts, or illegal gains that directly or indirectly benefits oneself, related
parties, or designated personnel; also, to prevent any personal gain at the
expense of the Company.
(IV) Does the Company have established
effective accounting systems and internal
control systems to substantiate ethical
management; also, have audits performed by
the internal audit unit on a regular basis or
by the commission CPAs?
V (IV) To ensure the implementation of integrity management, the Company has
established an effective accounting system and internal control system;
also, internal audit staff have the compliance of the systems referred to
above checked regularly.
(V) Does the Company have organized ethical
management internal and external education
and training programs on a regular basis?
V (V) The company has the “Integrity Management Code” and “Code of
Conduct” setup to have integrity management embedded in corporate
culture; also, to advocate it from time to time in various meetings and
Synnex EMBA advocacy in order to have it substantiated. The related
specifications of the company’s integrity management are advocated
before having a trade agreement signed with the suppliers.
III. The operation of the Company’s Report
System
(I) Does the Company have a specific report and
reward system stipulated, a convenient
report channel established, and a responsible
staff designated to handle the individual
being reported?
V (I) The company has the “code of conduct” setup. Any person who is engaged
in or aware of any violations of the Code and the relevant provisions of the
act or activity is responsible to report it to the immediate supervisor or the
company’s audit unit immediately.
In compliance with the concept and
implementation of the “Corporate
Governance Best-Practice Principles for
TWSE/GTSM Listed Companies”
(II) Does the Company have the standard
investigating procedures and related
confidentiality mechanism established for
the incidents being reported?
V (II) The company’s audit unit accepts anonymous report. The informer must
provide sufficient relevant information to facilitate the company’s
verification.

30 2016 Annual Review
(III) Does the Company have taken proper
measures to protect the whistleblowers from
suffering any consequence of reporting an
incident?
V (III) No informer will be retaliated against or threatened for reporting possible
violation of norms, suspicious violation of the Securities Exchange Act,
and other illegal activities. Any informer who has been retaliated against,
threatened, or warned should immediately report it to the immediate
supervisor or company’s audit unit.
IV. Enhancing information disclosure
(I) Does the Company have the content of ethical
management and its implementation
disclosed on the website and MOPS?
V The company has a website setup to disclose the relevant corporate culture,
business policy, and other information.
The company is currently undergoing the setup the corporate governance in
English and Chinese in the Investor Section of the website; therefore, the
information of corporate governance will be disclosed upon the completion of
the website setup.
In compliance with the concept and
implementation of the “Corporate
Governance Best-Practice Principles for
TWSE/GTSM Listed Companies”
V. If the company has integrity management defined in accordance with the “Corporate Governance Best-Practice Principles for TWSE/GTSM Listed Companies,” please describe the
operational differences from the Code:
The Company has the “Integrity Management Code” setup in compliance with the concept and implementation of the “Corporate Governance Best-Practice Principles for
TWSE/GTSM Listed Companies.”
VI. Other important information that helps understand the company’s integrity management:
1. The Company has complied with the Company Law, the Securities and Exchange Act, the Business Accounting Law, listed and OTC relevant rules, or other publicly traded
commercial activities related law and regulations for the implementation of integrity management.
2. The Company has director conflicts of interest defined in the “Regulations Governing Procedures for Board of Directors Meeting” Board Rules.” If the proposals proposed in
board meetings have a conflict of interest with the directors or the statutory representative that is detrimental to the company’s interest, the directors may present their views and
answer questions but may not join discussion and voting; also, they shall be excused in discussion and voting and shall not exercise their voting rights on behalf of other directors
by proxy.
3. The Company has stipulated the “Manufacturers Commitment” to request all suppliers having transactions conducted faithfully without any acts of bad faith, and to establish a
good procurement system.
4. The company has the company’s Integrity Management Code reviewed and amended in accordance with FSC Certificate Far.Tzi No. 103003989 Letter dated October 31, 2014 by
the Financial Supervisory Commission.
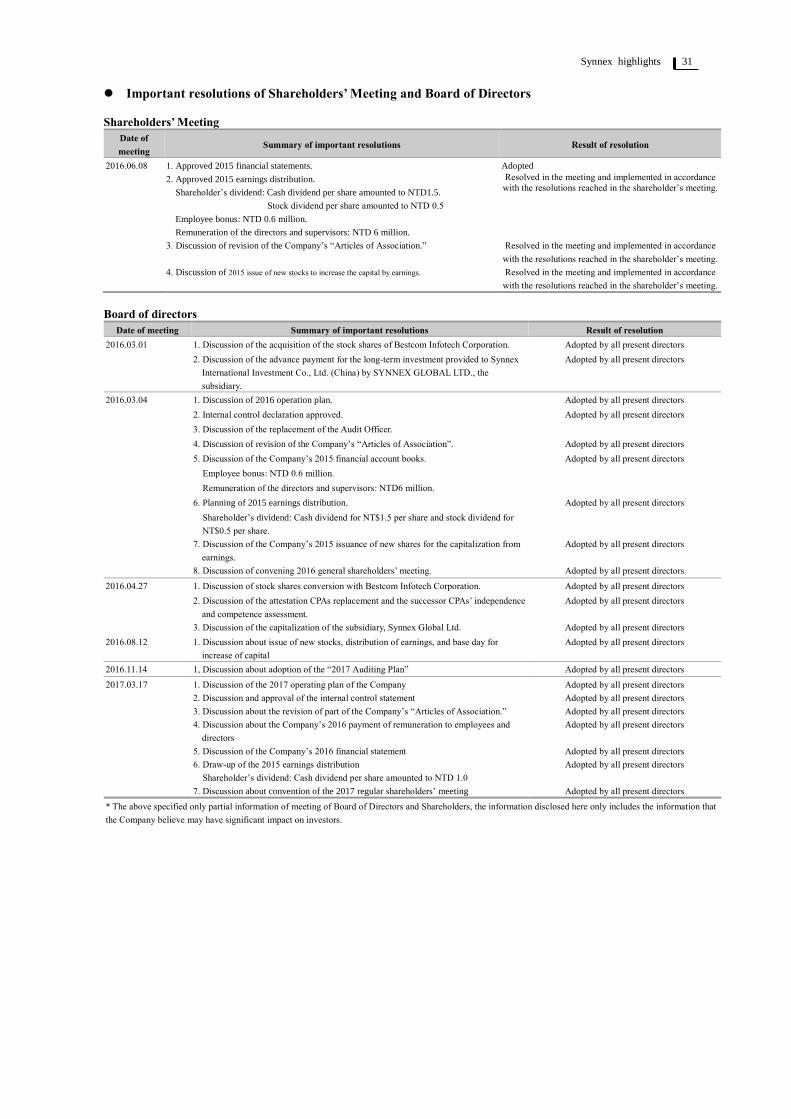
Synnex highlights 31
Important resolutions of Shareholders’ Meeting and Board of Directors
Shareholders’ Meeting
Date of
meeting Summary of important resolutions Result of resolution
2016.06.08 1. Approved 2015 financial statements. Adopted
2. Approved 2015 earnings distribution.
Shareholder’s dividend: Cash dividend per share amounted to NTD1.5.
Stock dividend per share amounted to NTD 0.5
Employee bonus: NTD 0.6 million.
Remuneration of the directors and supervisors: NTD 6 million.
Resolved in the meeting and implemented in accordance
with the resolutions reached in the shareholder’s meeting.
3. Discussion of revision of the Company’s “Articles of Association.” Resolved in the meeting and implemented in accordance
with the resolutions reached in the shareholder’s meeting.
4. Discussion of 2015 issue of new stocks to increase the capital by earnings. Resolved in the meeting and implemented in accordance
with the resolutions reached in the shareholder’s meeting.
Board of directors
Date of meeting Summary of important resolutions Result of resolution
2016.03.01 1. Discussion of the acquisition of the stock shares of Bestcom Infotech Corporation. Adopted by all present directors
2. Discussion of the advance payment for the long-term investment provided to Synnex
International Investment Co., Ltd. (China) by SYNNEX GLOBAL LTD., the
subsidiary.
Adopted by all present directors
2016.03.04 1. Discussion of 2016 operation plan. Adopted by all present directors
2. Internal control declaration approved. Adopted by all present directors
3. Discussion of the replacement of the Audit Officer.
4. Discussion of revision of the Company’s “Articles of Association”. Adopted by all present directors
5. Discussion of the Company’s 2015 financial account books. Adopted by all present directors
Employee bonus: NTD 0.6 million.
Remuneration of the directors and supervisors: NTD6 million.
6. Planning of 2015 earnings distribution. Adopted by all present directors
Shareholder’s dividend: Cash dividend for NT$1.5 per share and stock dividend for
NT$0.5 per share.
7. Discussion of the Company’s 2015 issuance of new shares for the capitalization from
earnings.
Adopted by all present directors
8. Discussion of convening 2016 general shareholders’ meeting. Adopted by all present directors
2016.04.27 1. Discussion of stock shares conversion with Bestcom Infotech Corporation. Adopted by all present directors
2. Discussion of the attestation CPAs replacement and the successor CPAs’ independence
and competence assessment.
Adopted by all present directors
3. Discussion of the capitalization of the subsidiary, Synnex Global Ltd. Adopted by all present directors
2016.08.12 1. Discussion about issue of new stocks, distribution of earnings, and base day for
increase of capital
Adopted by all present directors
2016.11.14 1, Discussion about adoption of the “2017 Auditing Plan” Adopted by all present directors
2017.03.17 1. Discussion of the 2017 operating plan of the Company
2. Discussion and approval of the internal control statement
3. Discussion about the revision of part of the Company’s “Articles of Association.”
4. Discussion about the Company’s 2016 payment of remuneration to employees and
directors
5. Discussion of the Company’s 2016 financial statement
6. Draw-up of the 2015 earnings distribution
Shareholder’s dividend: Cash dividend per share amounted to NTD 1.0
7. Discussion about convention of the 2017 regular shareholders’ meeting
Adopted by all present directors
Adopted by all present directors
Adopted by all present directors
Adopted by all present directors
Adopted by all present directors
Adopted by all present directors
Adopted by all present directors
* The above specified only partial information of meeting of Board of Directors and Shareholders, the information disclosed here only includes the information that
the Company believe may have significant impact on investors.

32 2016 Annual Review
4) Changes in shareholdings of directors, supervisors, managers, and principal shareholders
Title
Name
2016 2017.1.1 ~ 2017.4.10
Note Changes in
shareholding
Changes in pledged
shareholding
Changes in
shareholding
Changes in pledged
shareholding
Chairman and Overseas Operation CEO
Matthew Feng-Chiang Miau
1,514,857 - - -
Director and president
Evans S.W. Tu
1,721,732 - - -
Director
Yang, Hsiang-Yun and Chou, T.C.
10,819,097 - - - Representative of MiTAC Inc.*
Independent Director
Yungdu Wei
- - - -
Independnet Director
Yojun Jiao
- - - -
Independent Director
Anping Chang
- - - -
Vice-President
Beny Weii
88,296 - - -
Vice-President
James Lee
16,308 - - -
Vice-President
Rex Shiue
18,275 - - -
Vice-President
Dicky Chang
58,119 - - -
AVP-Finance
Oliver Chang
21,388 - - (400,000)
Treasury Manager
Grace Huang
4,638
- - -
Major shareholder
MiTAC Inc.
10,819,097 - - -
* Information includes only changes in shareholding and pledges of corporate shareholders.
** The individual was the representative of Lien Haw who was discharged on June 12, 2015.

Synnex highlights 33
III. Capital and shares
1) Category of shares
2017.04.09
Unit: Share
Category of shares Authorized capital
Note Outstanding shares (listed) Un-issued shares Total
Registered ordinary
shares 1,667,946,968 532,053,032 2,200,000,000
2) Shareholder structure
2017.04.09
Item Government
institutions Financial institutions
Other institutional
shareholders
Personal
shareholders
Foreign institutions
and personal
shareholders Total
Number of
shareholders 1 49 199 51,943 582 52,774
Shares 616 224,742,896 451,114,149 405,380,950 586,708,357 1,667,946,968
Shareholding % 0.00 13.47 27.05 24.30 35.18 100.00
3) Distribution of shareholding
NTD 10 par
2017.04.09
Classification of shareholding Number of shareholders Shares Percentage of shareholding (%)
1 - 999 11,186 2,940,816 0.18
1,000 - 5,000 27,173 57,953,512 3.47
5,001 - 10,000 6,521 45,447,519 2.72
10,001 - 15,000 2,877 34,010,411 2.04
15,001 - 20,000 1,164 20,311,285 1.22
20,001 - 30,000 1,325 31,846,297 1.91
30,001 - 40,000 634 21,702,787 1.30
40,001 - 50,000 376 16,915,752 1.01
50,001 - 100,000 730 50,612,032 3.03
100,001 - 200,000 339 47,609,757 2.85
200,001 - 400,000 177 49,716,722 2.98
400,001 - 600,000 69 33,778,546 2.03
600,001 - 800,000 34 23,695,485 1.42
800,001 - 1,000,000 17 15,301,667 0.92
1,000,001 and above 152 1,216,104,380 72.92
Total 52,774 1,667,946,968 100.00
4) Major shareholders
2017.04.09
Major shareholders Shares Percentage of shareholding (%)
MiTAC Inc.
Representative: Matthew Feng-Chiang Miau
227,201,054 13.62
Matthew Pacific Tiger Fund investment accounts
managed with HSBC acting as custodian bank
95,600,921 5.73
Fubon Life Insurance Co., Ltd.
Representative: Benyuan Zheng
58,421,768 3.50
Morgan Stanley Capital International managed
account with HSBC (Taiwan) acting as custodian bank
50,644,627 3.04
Labor Insurance Fund 43,358,318 2.60
Nanshan Life Insurance Co., Ltd.
Representative: Ying-Tsung Tu
38,021,550 2.28
Evans S.W. Tu 36,156,381 2.17
Public Service Pension Fund Management Board 35,419,940 2.12
Lien Hwa Industrial Corp.
Representative: Matthew Feng-Chiang Miau
34,093,125 2.04
Matthew Feng-Chiang Miau 31,812,004 1.91

34 2016 Annual Review
5) Market price per share, Net assets per share, earning per share and dividends
Unit: NTD
Item / Year 2015 2016 2017.03.31
Market price per share
Highest 46.75 39.00 34.20
Lowest 30.10 29.50 32.10
Average 39.60 33.54 32.90
Net worth per share Before distribution 26.95 25.52 *****
After distribution** 24.17 NA NA
Earnings per share
Weighted average shares (in thousands of shares) 1,667,947 1,667,947 1,667,947
Earnings per share – before adjustment 2.01 2.92
Earnings per share – after adjustment* 1.82 2.92 NA
Dividends***
Cash dividend 1.50 1.00 NA
Dividend from retained earnings 0.50 - NA
Dividend from capital reserve - - NA
Accumulated undistributed dividends - - NA
Analysis for return on
investment****
Price/Earnings ratio 19.70 11.49 NA
Price/Dividend ratio 26.40 33.54 NA
Cash dividend yield rate 3.79% 2.98% NA
* As of December 31, 2016, the retroactive adjustment of shares after capital increase out of earnings and employee bonus.
** Based on resolution of shareholders’ meeting of the next year.
*** The earnings distribution for year 2016 is based on Board of Directors’ meeting on March 17, 2017.
**** Price/Earnings ratio =Average market price/Earnings per share before adjustment
Price/Dividends ratio=Average market price/Cash dividend per share
Cash dividends yield rate=Cash dividends per share/Average market price
*****The Q1 consolidated statement in 2017 has not been announced. This information is not disclosed here.
6) The policy and implementation of dividends
The dividend distribution proposed by shareholder meeting
The Board of Directors meeting held on March 17, 2017, proposed cash dividend distribution of NT$1.0 per share.
Dividend policy
The Company’s new Articles of Association was resolved in the Board meeting on November 9, 2015. The new Articles of Association is illustrated
as follows and it is scheduled to be resolved in the shareholders’ meeting on June 8, 2016.
According to Article 38 of the Company’s Articles of Association, the Company’s annual earnings, if any, should be applied to make up losses and
pay taxes first, then appropriate 10% as legal reserve and special reserve for an amount equivalent to the amount debited to the current shareholder’s
equity. The Board of Directors is to plan the earnings distribution proposal according to the balance amount plus the beginning cumulative
unappropriated earnings for acknowledgement in the shareholders’ meeting. For the earnings distribution ratio and shareholders’ cash dividend ratio,
the Board of Directors is to have it determined with the consideration of the additional paid-in capital, retained earnings, and future earnings
situation; however, the cash dividend may not be less than 15% of the total current dividend.
The Company has distributed cash dividends to shareholders since 1999 and cash dividend per share has been more than NT$1.5 since 2010. The
Company intends to continue to maintain a stable dividend policy.

Synnex highlights 35
7) Uncompensated distribution of shares and its impact on company operation and EPS
Unit: NTD
Item / Year 2017 (Estimate)
(Distribution of 2016 earnings)
Beginning issued capital (in NTD thousand) 16,679,470
Distribution of current
year
Cash dividend per share (NTD) 1.0*
Stock dividend per share for capital increment from retained earnings -
Stock dividend per share for capital increment from capital reserve -
Change in operational
performance
Operating income
NA*
% Change in Operating Income (YOY)
Net income
% Change in net income (YOY)
Earnings per share
% Change in Earnings per share (YOY)
Average rate of return on investment (Average E/P ratio)
Conjectural earnings per
share and PE ratio
If retained earnings for capital increment all
converted to cash dividend
Pro-forma Earnings per share (NTD)
NA* Pro-forma Average annual return on
investment
If no increment using capital surplus
Pro-forma Earnings per share (NTD)
NA* Pro-forma Average annual return on
investment
If no increment using capital surplus, it will
be switched to cash dividends
Pro-forma Earnings per share (NTD)
NA* Pro-forma Average annual return on
investment
* As the Company did not publish a financial forecast for 2017, this information is not available; the distribution of 2016 is conducted in accordance
with the earnings distribution approved by the Board of Directors meeting.

36 2016 Annual Review
8) Information on employee bonus and compensation for directors and supervisors
Provisions in Articles of Association
The Company’s new Articles of Association was resolved in the Board meeting on November 9, 2015. The new
Articles of Association is illustrated as follows and it is scheduled to be resolved in the shareholders’ meeting on June
8, 2016.
According to Article 38 of the Company’s Articles of Association, the Company’s net income before tax before
deducting remuneration to employees and directors and after making up losses should be applied to pay remuneration
to employees for an amount not exceeding 10% and not less than 0.01% of the balance; also, applied to pay
remuneration to directors for an amount not more than 1% of the balance.
Estimation criterion and difference treatment
1. The employee bonus and remuneration to directors and supervisors for the financial year 2016 is estimated with
reference to the profitability of the current period on a basis of 1.2 ten-thousandths and 1.2 thousandths,
respectively.
2. Public companies must recognize as expense and liability when there is legal responsibility or assume
responsibility and the value can be reasonably estimated based on “Guideline for employee bonus and
remuneration for directors and supervisors” in accordance with the 16 March 2007 Letter No. Ji-Mi-Zih-052 of
the Accounting Research and Development Foundation in Taiwan. It will be recognized as next year’s profit/loss if
difference between the actual distribution and estimated amount is shown after resolution of the shareholder meeting.
Information on proposed distribution approved by Board of Directors
1. As of March 17, 2017, the Board of Directors approved that the proposed distribution of employee bonus for
2016 is NT$600 thousand and remuneration for directors and shareholders is NT$6,000 thousand. Both are same
as the estimate in 2016.
2. The proposed distribution of stock dividend for employee is NT$0.
3. Impact of the proposed distribution of employee bonus and remuneration for directors and shareholders to
earning per share: None.
Actual distribution of the preceding year and treatment of differences
The employee cash dividend in 2015 was NT$600 thousand and the remuneration for directors and supervisors was
NT$6,000 thousand. The cash dividend for employees is consistent with the 2015 estimation while there is a
difference of NT$1,600 thousand in the remuneration for directors and supervisors. It has been adjusted in the 2016
profit and loss statement.
Information on employee bonus and remuneration for directors and supervisors in the latest five calendar
years
Item / Year of EPS
2012
(Distribution in
2013)
2013
(Distribution in
2014)
2014
(Distribution in
2015)
2015
(Distribution in
2016)
2016
(Distribution in
2017)
Dividend
(NTD/per share)
Cash 2.00 2.80 3.30 1.50 1.00
Stock - - - 0.50 -
Remuneration for directors and supervisors (in NTD
thousand) 10,000 7,600 7,600 6,000 6,000
Employee bonus
Cash 600 600 600 600 600
Stock Amount (in NTD
thousand)
- - - - -
Shares (thousand
shares)
- - - - -
Employee stock bonus / (employee stock bonus +
shareholder stock dividend) None None None None None
Employee stock bonus / outstanding shares at year end None None None None None
Summary of 2015 (distributed in 2016) employee stock bonus information: None
9) Buy back shares: None

Synnex highlights 37
IV. Issuance of global depositary receipts, bonds, preferred shares and
employee stock option
1) Global depositary receipts
Issue date 1997.7.3 1999.9.22
Countries issued Asia, Europe and the US Asia, Europe and the US
Issuance and listing Luxembourg Stock Exchange Luxembourg Stock Exchange
Total amount issued (US$) 139,382,100 245,380,125
Issue price per GDR (US$) 22.23 18.93
Total units issued (unit) 6,270,000 12,962,500
Underlying securities 1. Capital increase by cash and issue new shares
2. Release shareholder: MiTAC Inc., Lex Service (Guernsey)
Limited.
1. Capital increase by cash and issue new shares
2. Release shareholder: Lex Service (Guernsey)
Limited.
Common shares represented (shares) 25,080,000 51,850,000
Rights and obligations of GDR holders Rights and obligation consistent with common shares Rights and obligation consistent with common shares
Trustee None None
Depositary bank Citibank, N.A. Citibank, N.A.
Custodian bank Citibank N. A., Taipei branch Citibank N. A., Taipei branch
04.30.2017 GDR outstanding (unit) 951,681
Apportionment of expenses for issuance and
maintenance
Issuing expense is paid by release shareholder and issuing
company on the pro rata basis, duration expense is paid by
depository institution.
Issuing expense is paid by release shareholder and
issuing company on the pro rata basis, duration expense
is paid by depository institution.
Important notes on depository agreement and
custodian agreement
See depository agreement and custodian agreement for details See depository agreement and custodian agreement for
details
Market price per
unit (US$)
2016
Highest 4.99
Lowest 3.49
Average 4.16
2017. 01.01 -
2017. 04.30
Highest 4.40
Lowest 3.98
Average 4.26
2) Status of employee stock option: None
3) Preferred shares: None
4) Corporate bonds: None

2016 Annual Review 38
I. Scope of Business ................................................................................................................................................. 39
1) Main areas of business operation and revenue distribution in 2016 ..................................................................... 39
2) Developing new products (service) ........................................................................................................................ 40
3) Overview of industry ............................................................................................................................................. 40
4) Report on technology and research development................................................................................................... 44
5) Long and short term business development plan ................................................................................................... 45
II. Business model ..................................................................................................................................................... 46
III. Core competitiveness ........................................................................................................................................... 47
IV. Business strategy .................................................................................................................................................. 48
V. Market and sales conditions ................................................................................................................................ 50
1) Main sales markets ................................................................................................................................................ 50
2) Supply-demand and growth of the future market ................................................................................................... 52
3) Positive factors for our future development ........................................................................................................... 58
4) Negative factors for our future development and our countermeasures ................................................................. 60
5) Essential Purposes of Major Products .................................................................................................................... 60
VI. Employees ............................................................................................................................................................. 61
1) Number of employees in group .............................................................................................................................. 61
2) Employees information .......................................................................................................................................... 61
VII. Report on environmental protection and related expenditures........................................................................ 61
VIII. Labor relations ..................................................................................................................................................... 62
Operation highlights

Operation highlights 39
30,978,019
21,602,832
14,495,974
344,319
Operation highlights
I. Scope of Business
1) Main areas of business operation and revenue distribution for 2016
Personal
computer/Assembly
Kits/Peripherals
Taiwan/Hong Kong/China/New Zealand & Australia/Indonesia
Consumables/
Software network Digital products
Media tablet
Net book
Note book
Home computer
Commercial computer
E-Book
Server
CPU
Main Board
Printer
Display card
Power supply
Hard drive
Mouse, keyboard
CD-ROM Drive
Operation system
Server software
Application software
Network Interface card
Wireless network
Broadband network
products
Ink Cartridge
Toner cartridge
CD
Multi-function
products
Uninterrupted power
system
Computer Video
products…
Flat TV
Xbox game consoles
and software
PC game software
Multimedia player
MP3 players
Digital videotape
recorders
Digital camera
Digital projector
USB
Free within warranty
Maintenance service
Paid repair and
maintenance services
Repair and
maintenance
consigned by vendors
CPU
Memory
Processing components
of logical transactions
Imaging processing
components
Audio processing
components
Video processing
components
Communication
components
Optical transfer modules
LCD panel….
General
communication
products
Cellular phone
Accessories and
consumables
SD card
Bluetooth earphones
Fax machine….
Maintenance services
and others
0.1%
Dealers Dealers /
End-users Manufacturers
Nature of major customers
Taiwan/Hong
Kong/China
Computer, Communication & Consumer Electronics
73.0% IC components
26.9%

2016 Annual Review 40
2) Developing new products (service)
New Product New Service
▪ Cloud services business
▪ Smart Life Related Products
▪ IoT Related Products
▪ CPFR services
▪ Third-party logistics services
▪ Technical services business
3) Overview of industry
Distribution overview of 3C products (IT and Telecom)
1. Overview of supply chain
Supply chain of IT and Telecom can be divided into “supply chain” in the manufacturing side and the “demand chain” in the
sales side. The supply chain focuses on OEM and the demand chain focuses on distributors, the two generated a supply-demand
relationship under the production and purchasing unit and marketing and sales unit of brand company (shown below).
OEM
Manufacturer
Component
vendors
Distributor
Logistics
Service
Provider Bank
Brand company
(Production and
purchasing)
最終使用
者
End users
Home
users Corporate
users Government
agency
(International/
Regional logistics)
Supply
chain Demand chain
(Maintenance Regional logistics)
Brand company
(Marketing and
sales)
經銷
商 門市 加值 商
系統 整合
Dealers
Stores -
shops
Value
added reseller
(VAR)
System integration
(SI)
Supply chain and demand chain
The ecosystem of supply chain and demand chain differs, the former is relatively larger manufacturer in size, lesser in number;
the latter is relatively smaller in size with a larger number and deeper penetration into the market. Therefore, the management
philosophy and operation model of the supply chain and demand chain is very different.
To the distributors focused greatly on integrated demand, its value determines on the channel’s density and solidity of different
products and whether a complete management mechanism of channel operation can be set up to effectively manage product
categories, items, bulk customers, bulk orders, bulk shipment operation and maintenance operation. Failure to establish a sound
operational management mechanism will be unable to generate economic efficiencies.
2. Role of the distributors
The trend of slim-profit has enabled a more sophisticated vertical integration of supply chain, that is, during the evolution of
industrial ecology, the upstream, midstream, and downstream improves the overall efficiency of supply chain operation and lower
overall cost through “Who responsible for what is most effective?”
In addition to research, development, marketing and sales, this trend has also resulted in a more sophisticated inventory
management, assembly and maintenance (shown in graph below). Among them, the distributors’ role in component inventory,

Operation highlights
41
finished goods inventory, CTO assembly and product maintenance is increasingly important, and provides a greater value in
supply chain for the distributors with complete operation mechanism and size.
Industrial Chain and Distributor’s Roles
(Except R&D, manufacturing and sales)
零組件供應商 Components vendors
系統組裝廠 OEM manufacturers
品牌大廠 Brand company
經銷商 Dealers
最終使用者 End-users
通路商 Distributors
Inventory
management Assembly Maintenance
Service
Components
Components
inventory
Finished goods
inventory
Work in process
CTO real-time
assembly
CTO real-time
assembly
Components
Components
Finished goods
repair
3. Overview of upstream suppliers
The bigger upstream suppliers usually grow faster and stronger; especially for the mature products with only few brands
competing in market. The manufacturer’s marketing strategy is going for centralization, that is, reduces the number of agents;
therefore, the large IT agents also grow faster and stronger. In addition, the manufacturers while looking for agents increasingly
stress the importance of agent’s operational capacity and financial solvency in order to avoid agents who do not have sufficient
operational capacities and financial solvency to meet the demand of growing market. Under the circumstance, the agents with
operational capacity, solid management, and financial solvency are obviously with advantage in competition.
4. Overview of downstream dealers
▪ Consumer information channel: The market is moving toward the operation of large-scale information chain stores. The
emerging channels including online shopping and TV shopping are the new trend for the distribution of consumer
information products in recent years. The diversified products sold in chain stores and shopping network have made
management a complex task; moreover, the price of information products drops fast; therefore, the collaboration between
the channel agents and the upstream distributors, in addition to product supply, will grow in the sense of logistics
management, inventory management, maintenance operations, and e-flow. The distributors with logistics capabilities and
powerful information management capabilities are in position to provide support to this type of distribution channels and to
form a close upstream and downstream partnership.
▪ Business information channel: The government agencies, educational institutions, and corporate are the main sales targets
that can be divided into the categories of large-scale systems integrators (SI) and general value-added reseller (VAR). In
terms of market operation, dealers and upstream distributors are to provide total solutions to the end-user. Therefore, a close
cooperation between the dealers and distributors is expected from product planning and technical support and logistics
services before sales to the after-sales maintenance services.
▪ Telecommunication stores channel: It is a consumer market with a focus on store distribution. Cellular phone is with a short

2016 Annual Review 42
lifespan and the price drops faster than IT products. Relatively, the telecommunication stores distribution relies heavily on
the product supply capacity, logistics capability, and after-sale maintenance services of the upstream distributors.
▪ Telecommunications system operators channel: Telecommunication as the core of the direct sale or franchise system by
integrating cellular phone and phone number. The distributors supply cellular phones; also, carriers are also actively looking
for distinctive 3C products for sale with the phone number that relies heavily on the distributor’s inventory management and
logistics mechanism that represents another form of close cooperation.
Overview of IC components distribution
The feature of IC component distribution is different from the same of IT and Telecom channel.
▪ As market exclusivity exists among same product of different vendors, it is unlikely for distributors to obtain a franchise on
the same product on different brands; with its upstream position in the supply chain and rapid update, the supply-demand of
IC components products is not easily controlled and resulted in higher possibility of shortage or excess of supply. To tackle
the situation, IC components distributor must seek the diversification of product types to maintain the stable growth of
business performance.
▪ The downstream customers are mostly modules and systematic products manufacturer, its relatively lesser in number and
larger in size generate a concentrated source of business and high volatility. In customer development, as IC components
distributors are required to assist customers to adopt new design in the new developed products (design-in), their strong
technical support capability to combine business, product planning and technical support is one of the key factors of a
successful business. Besides, the decreasing tolerance to price fall of inventory and capital burden of vendors due to the
rapid change of price of components products and slim-profit trend of overall supply chain, the distributors’ sufficient
logistics management ability to rapidly serve customers’ needs is one of the key factor for IC components distributors to
establish market advantage.
Product development trend
The product line of Synnex covers four major areas including the three terminal products (IT related, telecom products, and
consumer electronics) and the IC components. Since development of the IC component is dependent on the application and
development trend of the terminal products, we describe in more detail about the development and competition status as we may
foresee in this area below.
▪ IT related products
As the Market Intelligence & Consulting Institute (MIC) of the Institute for Information Industry estimates, the global
shipments of information system products in 2017 will reach up to 424 million units with a decline of 4.4% in comparison
with the 444 million units in 2016. Individually, the global shipments of desktop PCs will drop for two consecutive years to
102 million sets in 2017 with a decay rate of 2.3%. The overall market scale of laptop computers is 149 million units. The
decay rate in this area is estimated to 1.8% against the 152 million units in 2016. The market of table computers remains
stagnant. The market scale is estimated to 161 million units and a decline of 8.5% in comparison with the 176 million units
in 2016 is expected. The global market scale of servers is about 11.1 million units and may have a growth rate of 5.4%
against the 10.6 million sets in 2016.
The depressed global economy, mature development of the computer market, and limited contribution of new products and
technologies to the stimulation of market demand result in a continuous shrinking of the desktop, laptop, and tablet
computer markets in 2017. However, the decline has slowed down significantly. The server market may have a steady

Operation highlights
43
growth because enterprises need to upgrade existing or purchase new products for their operation due to the development of
the cloud business model.
In addition, the emerging gaming in recent years bring about rapid growth of the high-end gaming computer shipments.
Though they have a limited contribution to the overall shipments of the desktop computers, the growth of this niche
application market is helpful in the improvement of the average unit price and gross profit of the PC products. Furthermore,
the advantageous and mature market conditions, such as the performance upgrade of the key components, reduction of the
power consumption, and improvement of the cooling function, may promote the universal commercial application of the
advanced products and drive the penetration of the desktop computers in the industrial computer application area. This may
find a new growth space for the desktop computers and become the next competition focus of the manufacturers.
As the MIC analyzes, the threat of competition that smart mobile devices bring may turn the R&D focus of the laptop
computer manufacturers to the slim and thin or high-end gaming products of high unit prices. The slim and thin computers
will become the new development focus of the brand manufacturers. Especially, the brand manufacturers in China is another
indicator to be observed in 2017. Their development will affect the potential of the existing brand manufacturers to develop
in the market.
▪ Telecom products
Digitimes estimates a growth rate of 7.1% in the 2017 global mobile phone market. Samsung and Apple will remain in the
leading position in the global market with a shipment volume of 316 and 236 million mobile phones, respectively, in 2017.
All the rest Top 10 mobile phone brands belong to the manufacturers of China except for the Korean LG. The shipments of
Huwei and Oppo will expectedly grow to 127 and 105 million units, respectively. Both will be the mobile phone brands of
China that have the highest market share in the world.
2017 Smart Phone Shipments and Growth Rate Forecast
Source: DIGITIMES, 2016/10
Note 1: The area of the circle is in direct proportion to the shipments.
Note 2: The global smart phone shipments will have an annual growth rate of 7.1% in 2017.

2016 Annual Review 44
▪ Consumer electronics
The statistics of the Consumer Technology Association (CTA) shows more than 300 types of consumer electronics products
in the market. The global consumer electronics industry may have a scale of US$ 292.5 billion in 2017. It is expected to
grow by 1.5% against the scale in 2016 and create a new record in the history. The market competition of the consumer
electronics products has gradually turned from the hardware equipment to the innovative integration service. When buying a
product, what consumers want is not merely the function of the product. Most of them need the service features that the
product provides. Hence, how to enhance the software, platform, and service experience features based on the hardware and
deploy integrated innovations will be the next competition focus of the industry.
The consumer electronics products will develop with the AI applications as the core. As IDC, a market research institution,
estimates, the global AI market scale will grow from US$17.2 billion in 2014 to 48.6 billion in 2019 with an annual growth
rate of 23.1%. Among the Asia-Pacific, North America, and West Europe regions, Asia will become the region of the highest
growing dynamics thanks to the increase of the funds in the R&D of robots in Japan and the support of the Chinese
government in the development and application of the AIoT.
According to Gartner, a market research institution, the AI technology is stepping in a rapid development phase. The SR
(Speech Recognition) technology will become mature and applied universally within the next 2 years. The NLP (Natural
Language Processing), VPA (Virtual Personal Assistant) and DL (Deep Learning) technologies will become the mainstream
in the coming 5 to 10 years.
The International Federation of Robotics (IFR) expects that the global market scale of service robots may reach up to US$
19.6 billion during the period from 2015 to 2018. The household service robots may have a market share of 74% and is the
most potential market in this field. They provide many applications including control of the TV set and air conditioner via
the voice control system and reporting of household safety status. They may also innovatively integrate with AI, IoT, and
cloud to realize device-to-device communication and introduce household appliances using deep learning algorithms.
4) Report on technology and research development
Research and development operations
The most important core competitiveness of Synnex is business innovation and leading technology. The continuous enhancement
of operation technology and innovative business model to adapt to rapid change of market trend in this slim-profit era is how
Synnex maintain and expand its market leading position. Currently, the Business Planning & Management Div. and Logistics
Planning & Management Div. of Synnex headquarters are responsible for overall planning of the business model and R&D
operations, major operational technology in the process of planning, development and promotion including:
1. Cloud Service Platform
2. Product Accounting Management
3. Collaborative Inventory Management System
4. Mobile Phone Plans Sales System
5. Commercial Business Management System
6. Technical Service Management System

Operation highlights
45
5) Long and short term business development plan
Short term business development plan
▪ Channel: Continue channel’s in-depth development plan to actively develop more terminal customers, establish a complete
sales channel. Especially in China, continuing channel development in-depth in all tiers cities and national chain store
operations and internet shopping channel operations, and will actively seek opportunities for collaboration with China’s
telecommunications industry. In addition to continuing to expand retail store operations in Australia, we will also actively
develop commercial information networks. In terms of Taiwan, the existing distribution network is fairly stable; therefore,
we will actively develop business opportunities for horizontal alliance in the future.
▪ Product: Continuing franchise strategy in Asia Pacific region to expand cooperation with global brands for synergy effect.
At the same time, increase business information, consumer electronics, and software product lines aggressively.
▪ Logistics: Continue the construction and explanation plan of the logistics center and enhance the remote monitoring
management capacity and provide customers with diversified logistics services with the advantage of the logistics network
in response to business growth.
Long term business development plan
In response to the global economic slowdown and stagnation, exchange rates and stock market fluctuations, and political and
economic impact, the Company’s long-term business development plan is to focus on seeking a breakthrough in stable operation.
On one hand, continue to strengthen a sound internal operational management; on the other hand, continue to seek a breakthrough
in products and channel business operation; also, to seek for integrated synergies among business units in order to expand the
advantages of “economies of scale.”

2016 Annual Review 46
II. Business model
Synnex’s business model is based on product management, channel management, and logistics management as the three main
themes (see below) to link the upstream manufacturer and downstream distributors for providing a technology and industry
integrated service.
Actual operating activities are based on core mechanism of channel operation which including digital nervous system (MIS,
Management Information System), order taking through call center of order service, logistics mechanism, rapid maintenance
mechanism, CTO (Configuration-To-Order; a kind of customer made production service) real time production mechanism, the
“cyber logistic centric business model” is established through the above mechanism to effectively operate information flow,
capital flow, logistics flow and maintenance flow. As the core mechanism of operation is interconnected for different types of
business, Synnex is thus able to develop variable channel business through “digital nervous logistics service center” and use
mutual platform with joint-venture partners to facilitate business development while promoting economic efficiency of the
operation, lower operational cost along with business expansion and eventually generated a positive cycle. The business model
is illustrated below:
Product
management
Channel
management
Logistics
management
Ma
nufa
ctu
rer
Cu
sto
me
r
Business themes
Cyber Logistic Centric Business Model
Joint Venture Sales
& Marketing
(3C business)
IC Components Business Group
Distribution (IT/
Telecom business
unit
Joint venture Sales &
Marketing Company
(other business)
Sup
plier
Fast maintenance
service
CTO
Customize
production
Efficient
delivery
(Last Mile)
Inventory
management
(Automatic
warehousing)
Service call center
Logistics Service Group
Purchase flow
Information flow
Inquiry & Order flow
Fulfillment flow
Maintenance flow
Cu
stom
er
Operation highlights
47
III. Core competitiveness
Diversified Channels
With over 30,000 channels in Asia Pacific region covering a wide range of distributors including traditional shops, chain stores,
online shopping, value-added resellers, system integrators and telecom operators, not only Synnex’s commodities are fast in
circulation and large in sales volume, it is a big plus when acquiring new dealerships.
Comprehensive Product Line
With comprehensive product line to suffice customers’ demand and develop channel positioning, Synnex’s products cover
diverse categories and brands including IT related, telecom, consumer electronics and IC components. In addition, the deep and
long-term cooperation with major global brands allow Synnex to be a step ahead of new product development and market trend
than its competitors.
Logistics Mechanism
Synnex has established dozens of logistics centers in major cities of Asia Pacific region, which formed extensive logistics
network coverage. With state-of-the-art automatic equipment, a self-developed management systems, professional and
disciplined operations, Synnex’s logistics centers covering warehousing, distribution, maintenance and assembly functions form
substantial logistics capacities to back up business operations.
The Four Information and Communication Network
In light of the four information and communication networks including Management Information System (MIS), Logistic
Remote Monitoring Network, Video Conference Network, and Telecommunication Network, Synnex has built up a foundation
for transnational management capabilities to enable transnational internal control and communication without the hassle of
distance restriction, so that while seeking more opportunities in the global market, internal control capacity is strengthened.
The development of operational management techniques
Collaborating with the software R&D center, Synnex’s five planning & management functions including business, logistics, risk,
finance and human resource that positioned at the headquarters are responsible for planning business models, laying down
management policy, developing operation systems and conducting business analyses, inspection and quality management. This
substantial support facilitates Synnex to develop innovative business and management techniques and strengthen its core
competence in a continued effort to meet the Group’s strategic performance.

2016 Annual Review 48
Logistics operations area
IV. Business strategy
Multi-brand and multi-product strategy
Synnex adopts multi-brand and multi-product operation strategy to effectively diversify operational risk and offer diversified
products to customers to establish dense reseller network, this business strategy also pushes Synnex to move forward to pursue
new products to prepare for the future growth.
Management philosophy of 51 and 49
In general, both suppliers and customers are important to distributors; however, Synnex places greater value on customers than
on suppliers, a difference between 51 and 49. As distributor should dedicate to management and operation of distribution
channels, thus, the back office support including order, distribution and maintenance should emphasis on customer services. In
this regard, variety of distribution channels are established along with enhancement of service value and a tight reseller network
is generated. With stronger channels, suppliers are willing to sell their products through Synnex’s channels, and Synnex will
assist supplier to gain best possible profit through placement of appropriate channels in accordance with different product types.
From serving channel customers to serving ‘end users
The unique triple channel operation business model of sales, distribution and maintenance has clearly positioned distributor as
professional service provider, a series of complex back office operation is coordinated by Synnex to ensure the efficiency and
quality of services. In this regard, inventory risk of Synnex’s customers is effectively reduced due to unnecessary stock up and
cost of maintenance engineer and inventory maintenance is reserved. Synnex is expanding its services from channel customers
directly to end users, the dense maintenance network and rapid delivery has increased customers satisfaction to post-services, and
CTO assembly production center provide customized computer products to customers is able to meet the needs of customers.
Synnex’s goal is continuously increase resellers’ and end-users’ satisfaction in the days to come.
The advantage of operational process
In this competitive high-tech industry, only those with technology or operational process advantage are able to continuously gain
high profit in this slim-profit era. Through the self-developed, tailored made MIS system, Synnex is able to combine sales,
distribution and maintenance business model into a complex, sophisticated and unique operational process "knowledge-based", at
the same time, it is extremely difficult for competitors to copy this model. In this knowledge economy and slim-profit era,
(1,000 square meters)
Taiwan
Overseas

Operation highlights
49
Synnex is able to utilize this knowledge advantage to establish a goal that no other competitors can reach.
Unique “open channel “strategy
Synnex adopts an open strategy in its distribution business, that is, the decision to work with Synnex is placed in the resellers
hands. As the operation of direct chain retailers is complicated and development is also limited; in addition, contract franchise
involve in management issues. Thus, Synnex attracts customers by offering multi-brand, multi-products and high value-added
services to establish dense reseller network so that all resellers in the industry can be Synnex’s customers.
A distributor with brand name
Synnex was the first company to come up with the idea of “brand name” distributor, through the established value-added services;
the resellers are willing to introduce products to customers and consumers who are willing to purchase Synnex’s products due to
Synnex’s post-services. In addition, Synnex’s own brand “Lemel” is produced not to compete, but to generate a positive
adjustment with the resellers.
Maximizing the advantage of economic scale
Synnex conducts a distribution and maintenance mechanism to ensure quality and efficiency of the services. The significant
growth of revenue triggered from valued services in the recent years has generated a lower operating expense when comparing
with competitors. Synnex realized that the best way to maintain stable profitability and effectively expand market share is
through continuously lowering operating expense in this slim-profit era.
Pursuing steady growth in overseas market
Currently, Synnex has overseas subsidiaries located in Hong Kong, China and Australia that operate in localizes, stable and step
by step strategy to operate local distribution business. The successful Taiwan operation experience and mechanism is copied to
the subsidiaries in accordance with actual needs. To complete product management, channel management and basic logistics
management, MIS system is copied, and followed by CTO assembly, automatic warehousing and maintenance mechanism.
Besides, Synnex also help subsidiaries to obtain complete dealership of international brand through its successful cooperation
experience with the suppliers in Taiwan.
An all-round logistics service provider in the age of e-business
In this e-commerce development trend, Synnex’s business model is positioned as a comprehensive logistics management service
provider to provide back office services of inventory management, distribution and maintenance for B2C industry. In addition,
the “Synnex e-City” launched in November 2000 has become a 3C content website pioneer in Taiwan; the current back office
operation mechanism and MIS system is established to handle “volume” transaction. Thus, Synnex will be able to respond to the
sharp challenges of the E-era in the future.

2016 Annual Review 50
V. Market and sales conditions
1) Main sales markets
Trends in group revenues for the past five years
NTD bn
Overseas subsidiary 229.5 268.9 272.4 260.0 267.7
Taiwan 83.1 61.4 59.1 62.1 75.0
Consolidate 312.6 330.3 331.5 322.1 342.7
* Intercompany transaction is deducted from the selling party’s sales account

Operation highlights
51
Trends for regional revenue within the group in the next five years
↑5% ↑29%
↑1% ↑4%
New Zealand, Australia &
Indonesia
Product sales
NT$ bn IC components
Product sales
NT$ bn
NT$ bn Hong Kong/China (ICT)
Product sales
NT$ bn Taiwan (ICT)
Product sales
53.0
34.5 32.5
33.1
42.8
47.1
128.9
142.1
157.0 156.7
135.4
64.7
70.9 71.4 72.2
55.8
74.0
85.9 88.7
92.3

2016 Annual Review 52
2) Supply-demand and growth of the future market
2017 Global equipment shipments (including PC, tablet computer, Ultramobile and mobile phone) are expected to reach 2.3
billion units, representing 0.9% growth from 2016 and they are expected to reach 2.4 billion units in 2018, according to market
research institute, Gartner, Inc. The device market in 2017 remains affected by the economic development of each country. Gartner
believes the challenges faced by manufacturers are that the market can no longer be divided as simply as “mature market” and
“emerging market.” According to today’s economic development, the market has started to change and should be broken down into
four categories, namely economically challenged mature market, economically stabilized mature market, economically challenged
emerging market, and economically stabilized emerging markets. For example, Russia and Brazil are classified as economically
challenged emerging markets; India is classified as an economically stabilized emerging market, and Japan is classified as an
economically challenged mature market.
The global traditional PC shipments are expected to reach 205 million units in 2017, representing 5.1% decline from 2016 and
are expected to reach 199 million units in 2018, representing 2.9% decline from 2017. The shift from PCs to tablet computers
will continue to decline.
The global shipment of Ultramobile is expected to reach 230 million units and 250 million units in 2017 and 2018, respectively,
representing an increase of 4% and 6% over the previous year. PC manufacturers are facing competition for survival. When it
comes to selecting tablet computers or PCs, as consumers and corporations tend to prefer the ones that are closest to their usage
patterns, Ultramobile PCs (hybrid and clamshell laptop) therefore have become the new market’s newfound rising star.
Mobile phones have become the largest and most profitable division in the global installation device market. Sales are expected
to grow by 1.2% in both 2017 and 2018 for 1.91 billion and 1.93 billion units, respectively. Over the past few years, the average
price of high-end phones continuing to go up has caused the price of mobile phone to go up too. However, due to the saturation of
the smart phone market, added with local branded mobile phone manufacturers in the emerging markets and Made-in-China mobile
phones with better prices and better functions offered to satisfy the needs of mobile phone users, the average price of mobile phones
is gradually declining.
Type 2016 2017 (Estimate) 2018 (Estimate)
Million units Million units Growth rate (%) Million units Growth rate (%)
Traditional PC (desktops and laptops) 216 205 -5.1 199 -2.9
Ultramobile* 225 234 4.0 248 6.0
Mobile phones 1,887 1,910 1.2 1,933 1.2
Total 2,328 2,349 0.9 2,380 1.3
* Ultramobile means all Ultramobile Basic and Utility devices
Traditional PC
Gartner’s research indicates that 85 million PCs were sold in the Asia-Pacific region in 2016, representing 6.6% decline from
2015. Sales amounted to US$47.5 billion, representing 5.1% decline. A total of 84 million units of PCs are expected to be sold in
the Asia-Pacific region in 2017, representing a 0.7% decline from 2016 for sales amounting to US$46.9 billion, representing a
1.3% decline. 84 million PCs will be sold in 2018, representing 0.3% decline from 2017. Sales amounted to US$46.5 billion,
representing 0.8% decline.

Operation highlights
53
Shipments of the PC market in the Asia Pacific region (exclusive of Japan) in 2016 ~ 2018 are as follow:
Asia-Pacific region
Traditional PC 2016 2017 (Estimate) 2018 (Estimate)
1,000 units/USD million Growth rate (%) 1,000 units/USD million Growth rate (%) 1,000 units/USD million Growth rate (%)
Shipment volume 84,700 -6.6 84,090 -0.7 83,810 -0.3
Amount 47,491 -5.1 46,851 -1.3 46,464 -0.8
* Source of information: Gartner Dataquest
Ultramobile
Gartner’s research indicates that 59 million Ultramobile were sold in the Asia-Pacific region in 2016, representing a decline of
10.1% from 2015. Sales amounted to US$20.7 billion. The tablet device market has become saturated due to the popularity of
tablet devices and the extended recycling period of the tablet device. A total of 60 million units of Ultramobile are expected to be
sold in the Asia-Pacific region in 2017, representing a growth of 1.7% from 2016 for sales amounting to US$22.1billion,
representing a 6.8% growth. A total of 610 thousand units are expected to be sold in 2018, representing a decline of 0.7% from
2017, for sales amounting to US$23.0 billion, representing 4.0% growth.
Shipments of the Tablet PC in the Asia Pacific region (exclusive of Japan) in 2016 ~ 2018 are as follow:
Asia Pacific region
Ultramobile 2016 2017(Estimate) 2018(Estimate)
1,000 units/USD million Growth rate (%) 1,000 units/USD million Growth rate (%) 1,000 units/USD million Growth rate (%)
Shipment volume 59,300 -10.1 60,320 1.7 60,770 0.7
Amount 20,691 11.9 22,103 6.8 22,982 4.0
* Source of information:Gartner Dataquest
Mobile phone
Gartner’s research indicates that 990 million mobile phones were sold in the Asia-Pacific region in 2016; representing a decline
of 0.4% from 2015. Gartner forecasts the shipment of mobile phones in the Asia-Pacific region in 2017 to grow by 2.1% from
2016 for a total of 1.010 billion units sold. A total of 1.031 billion units are expected to be shipped in 2018, representing a 2.0%
growth from the year of 2017.
Cellular phone sales in the Asia-Pacific region (excluding Japan) in 2016~2018 are estimated as follows:
Asia-Pacific
mobile phone 2016 2017 (Estimate) 2018 (Estimate)
1,000 units Growth rate (%) 1,000 units Growth rate (%) 1,000 units Growth rate (%)
Shipment volume 989,710 -0.4 1,010,690 2.1 1,031,010 2.0
* Source of information: Gartner Dataquest
Basic information in each region:
Region Population (million) GDP per capita (US$) 2016 economic growth rate (%) Source of information
Taiwan 23.5 23,800 1.0 National Statistics, R.O.C.
China 1,373.5 8,900 6.6 CIA/StockQ
Hong Kong 7.2 44,100 1.4 CIA/StockQ
Australia 23.0 54,200 2.9 CIA/StockQ
Indonesia 258.3 3,900 4.9 CIA/StockQ
Thailand 68.2 5,800 3.2 CIA/StockQ
India 1,266.9 1,900 7.6 CIA/StockQ
A negative number.

2016 Annual Review 54
▪ Taiwan
Traditional PC
Gartner’s research indicates that 2.14 million units of traditional PCs were sold in Taiwan in 2016, representing a 8.9% decline from
2015. Sales of PCs in 2017 are expected to be 2.19 million units, representing a 2.3% growth. The sale of PCs in 2018 is expected
to be 2.20 million units sold, representing a 0.5% growth; also, the sales amount will reach US$1.2 billion (0.2% decline).
Taiwan Traditional PC 2016 2017 (Estimate) 2018 (Estimate)
1,000 units/USD million Growth rate (%) 1,000 units/USD million Growth rate (%) 1,000 units/USD million Growth rate (%)
Shipment volume 2,140 -8.9 2,190 2.3 2,200 0.5
Amount 1,183 -21.2 1,199 1.4 1,197 -0.2
* Source of information: Gartner Dataquest
Ultramobile
Gartner’s research indicates that 1.54 million units of Ultramobile were sold in Taiwan in 2016, representing a decline of 4.3%
from 2015. Sales of tablet PCs in 2017 is expected to be 1.82 million units, representing 18.2% growth, for sales amounting to
US$0.9 billion, representing 22.8% growth and the same for 2018 is 1.85 million units, representing 1.6% growth, for sales
amounting to US$0.96 billion, representing 6.3% growth.
Taiwan
tablet PC 2016 2017 (Estimate) 2018 (Estimate)
1,000 units/USD million Growth rate (%) 1,000 units/USD million Growth rate (%) 1,000 units/USD million Growth rate (%)
Shipment volume 1,540 -4.3 1,820 18.2 1,850 1.6
Amount 734 35.4 901 22.8 958 6.3
* Source of information:Gartner Dataquest
Mobile phone market
Gartner’s research indicates that 9.88 million units of mobile phones were sold in Taiwan in 2016, representing 0.9% growth
from 2015. The estimated shipment in 2017 is approximately 9.98 million units, representing 1.0% growth. The estimated
shipment in 2018 is approximately 9.98 million unit.
Taiwan mobile phone 2016 2017 (Estimate) 2018 (Estimate)
1,000 units Growth rate (%) 1,000 units Growth rate (%) 1,000 units Growth rate (%)
Shipment volume 9,880 0.9 9,980 1.0 9,980 0.0
* Source of information: Gartner Dataquest
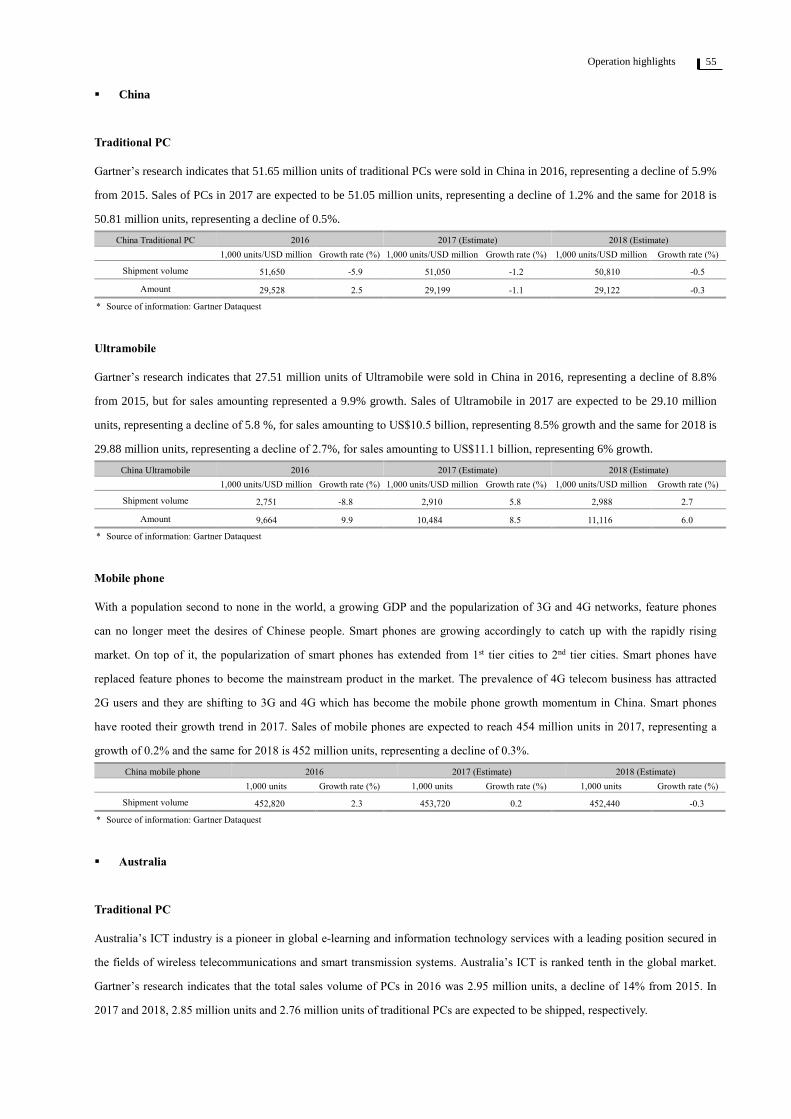
Operation highlights
55
▪ China
Traditional PC
Gartner’s research indicates that 51.65 million units of traditional PCs were sold in China in 2016, representing a decline of 5.9%
from 2015. Sales of PCs in 2017 are expected to be 51.05 million units, representing a decline of 1.2% and the same for 2018 is
50.81 million units, representing a decline of 0.5%.
China Traditional PC 2016 2017 (Estimate) 2018 (Estimate)
1,000 units/USD million Growth rate (%) 1,000 units/USD million Growth rate (%) 1,000 units/USD million Growth rate (%)
Shipment volume 51,650 -5.9 51,050 -1.2 50,810 -0.5
Amount 29,528 2.5 29,199 -1.1 29,122 -0.3
* Source of information: Gartner Dataquest
Ultramobile
Gartner’s research indicates that 27.51 million units of Ultramobile were sold in China in 2016, representing a decline of 8.8%
from 2015, but for sales amounting represented a 9.9% growth. Sales of Ultramobile in 2017 are expected to be 29.10 million
units, representing a decline of 5.8 %, for sales amounting to US$10.5 billion, representing 8.5% growth and the same for 2018 is
29.88 million units, representing a decline of 2.7%, for sales amounting to US$11.1 billion, representing 6% growth.
China Ultramobile 2016 2017 (Estimate) 2018 (Estimate)
1,000 units/USD million Growth rate (%) 1,000 units/USD million Growth rate (%) 1,000 units/USD million Growth rate (%)
Shipment volume 2,751 -8.8 2,910 5.8 2,988 2.7
Amount 9,664 9.9 10,484 8.5 11,116 6.0
* Source of information: Gartner Dataquest
Mobile phone
With a population second to none in the world, a growing GDP and the popularization of 3G and 4G networks, feature phones
can no longer meet the desires of Chinese people. Smart phones are growing accordingly to catch up with the rapidly rising
market. On top of it, the popularization of smart phones has extended from 1st tier cities to 2nd tier cities. Smart phones have
replaced feature phones to become the mainstream product in the market. The prevalence of 4G telecom business has attracted
2G users and they are shifting to 3G and 4G which has become the mobile phone growth momentum in China. Smart phones
have rooted their growth trend in 2017. Sales of mobile phones are expected to reach 454 million units in 2017, representing a
growth of 0.2% and the same for 2018 is 452 million units, representing a decline of 0.3%.
China mobile phone 2016 2017 (Estimate) 2018 (Estimate)
1,000 units Growth rate (%) 1,000 units Growth rate (%) 1,000 units Growth rate (%)
Shipment volume 452,820 2.3 453,720 0.2 452,440 -0.3
* Source of information: Gartner Dataquest
▪ Australia
Traditional PC
Australia’s ICT industry is a pioneer in global e-learning and information technology services with a leading position secured in
the fields of wireless telecommunications and smart transmission systems. Australia’s ICT is ranked tenth in the global market.
Gartner’s research indicates that the total sales volume of PCs in 2016 was 2.95 million units, a decline of 14% from 2015. In
2017 and 2018, 2.85 million units and 2.76 million units of traditional PCs are expected to be shipped, respectively.

2016 Annual Review 56
Australia Traditional PC 2016 2017 (Estimate) 2018 (Estimate)
1,000 units/USD million Growth rate (%) 1,000 units/USD million Growth rate (%) 1,000 units/USD million Growth rate (%)
Shipment volume 2,950 -14.0 2,850 -3.4 2,760 -3.2
Amount 2,346 -23.8 2,212 5.7 2,099 -5.1
* Source of information: Gartner Dataquest
Ultramobile
Gartner’s research indicates that 3.92 million units of Ultramobile were sold in Australia in 2016, representing a decline of 7.3%
from 2015. Sales of Ultramobile in 2017 are expected to be 4.10 million units, representing a growth of 4.6% and the same for
2018 is 4.12 million units, representing 0.5% growth.
Australian Ultramobile 2016 2017 (Estimate) 2018 (Estimate)
1,000 units/USD million Growth rate (%) 1,000 units/USD million Growth rate (%) 1,000 units/USD million Growth rate (%)
Shipment volume 3,920 -7.3 4,100 4.6 4,120 0.5
Amount 2,342 16.1 2,531 8.1 2,595 2.5
* Source of information: Gartner Dataquest
▪ Indonesia
Traditional PC
As the world’s fourth largest country in population and with more than 6% annual economic growth in recent years, Indonesia
has vigorous domestic market demand. According to IDC, the current PC penetration in Indonesia is only 9%, far below standard
in the world. However, the increasing consumer incomes are expected to stimulate the traditional PC market, which marks the
country as having high potential in terms of market scale and profitability. On top of it, Telkom Indonesia is planning a US$600
million project to expand optical fiber networks in Indonesia that will drive up the growth in the local PC market.
Indonesia Traditional PC 2016 2017 (Estimate) 2018 (Estimate)
1,000 units/USD million Growth rate (%) 1,000 units/USD million Growth rate (%) 1,000 units/USD million Growth rate (%)
Shipment volume 3,530 -12.2 3,600 2.0 3,650 1.4
Amount 1,856 0.2 1,870 0.8 1,865 -0.3
* Source of information: Gartner Dataquest
Ultramobile
Gartner’s research indicates that 4.16 million units of Ultramobile were sold in Indonesia in 2016, representing a decline of
17.3% from 2015. Sales of Tablet PCs in 2017 are expected to be 3.90 million units, representing 6.3% decline, for sales
amounting to US$1.05 billion, representing 7.1% growth and the same for 2018 is 3.82 million units, representing a 2.1% decline,
for sales amounting to US$1.09 billion, representing 3.7% growth.
Indonesia Ultramobile 2016 2017 (Estimate) 2018 (Estimate)
1,000 units/USD million Growth rate (%) 1,000 units/USD million Growth rate (%) 1,000 units/USD million Growth rate (%)
Shipment volume 4,160 -17.3 3,900 -6.3 3,820 -2.1
Amount 983 19.9 1,053 7.1 1,092 3.7
* Source of information: Gartner Dataquest

Operation highlights
57
▪ Thailand
Traditional PC
With multiple investment incentives and guidance measures supported by the government, coupled with its critical location in
ASEAN, “The Great Mekong Sub-region” and “golden corridor”, Thailand's e-commerce is growing rapidly. Furthermore,
thanks to new government support to mega-projects and increasing awareness of information technology, the importance of
information technology to business and individual is also on the rise. Gartner expects sales of traditional PC in 2017 to reach 2.46
million units and 2.47 million units in 2018.
Thailand Traditional PC 2016 2017 (Estimate) 2018 (Estimate)
1,000 units/USD million Growth rate (%) 1,000 units/USD million Growth rate (%) 1,000 units/USD million Growth rate (%)
Shipment volume 2,460 3.4 2,460 0.0 2,470 0.4
Amount 1,076 -8.7 1,060 -1.5 1,037 -2.2
* Source of information: Gartner Dataquest
Ultramobile
Gartner’s research indicates that 2.61 million units of Ultramobile were sold in Thailand in 2016, representing a decline of 12.7%
from 2015. Sales of Ultramobile in 2017 are expected to be 2.47 million units, representing 5.4% decline, for sales amounting to
US$0.6 billion, representing 1.0% growth and the same for 2018 is 2.44 million units, representing 1.2% decline, for sales
amounting to US$0.61 billion, representing 2.2% growth.
Thailand Ultramobile 2016 2017 (Estimate) 2018 (Estimate)
1,000 units/USD million Growth rate (%) 1,000 units/USD million Growth rate (%) 1,000 units/USD million Growth rate (%)
Shipment volume 2,610 -12.7 2,470 -5.4 2,440 -1.2
Amount 605 12.2 599 1.0 612 2.2
* Source of information: Gartner Dataquest
▪ India
Traditional PC
According to the global economic outlook report published by the Center for Economics and Business Research (CEBR), India
has the potential to become the world’s fourth largest economy in 2022. With the number of internet users growing at an
unstoppable speed, the demand for ICT products is also growing steadily. India is expected to become the world’s fastest growing
country in terms of IT industry in the future years. Sales of traditional PC in 2017 are expected to be 8.47 million units and 8.63
million units in 2018.
India Traditional PC 2016 2017 (Estimate) 2018 (Estimate)
1,000 units/USD million Growth rate (%) 1,000 units/USD million Growth rate (%) 1,000 units/USD million Growth rate (%)
Shipment volume 8,320 -15.0 8,470 1.8 8,630 1.9
Amount 4,330 -11.7 4,371 0.9 4,405 0.8
* Source of information: Gartner Dataquest
Ultramobile
Gartner’s research indicates that 5.04 million units of Ultramobile were sold in India in 2016, representing a decline of 6.7%
from 2015. Sales of Ultramobile in 2017 are expected to be 4.67 million units, representing 7.3% decline and the same for 2018
is 4.60 million units, representing 1.5% decline.
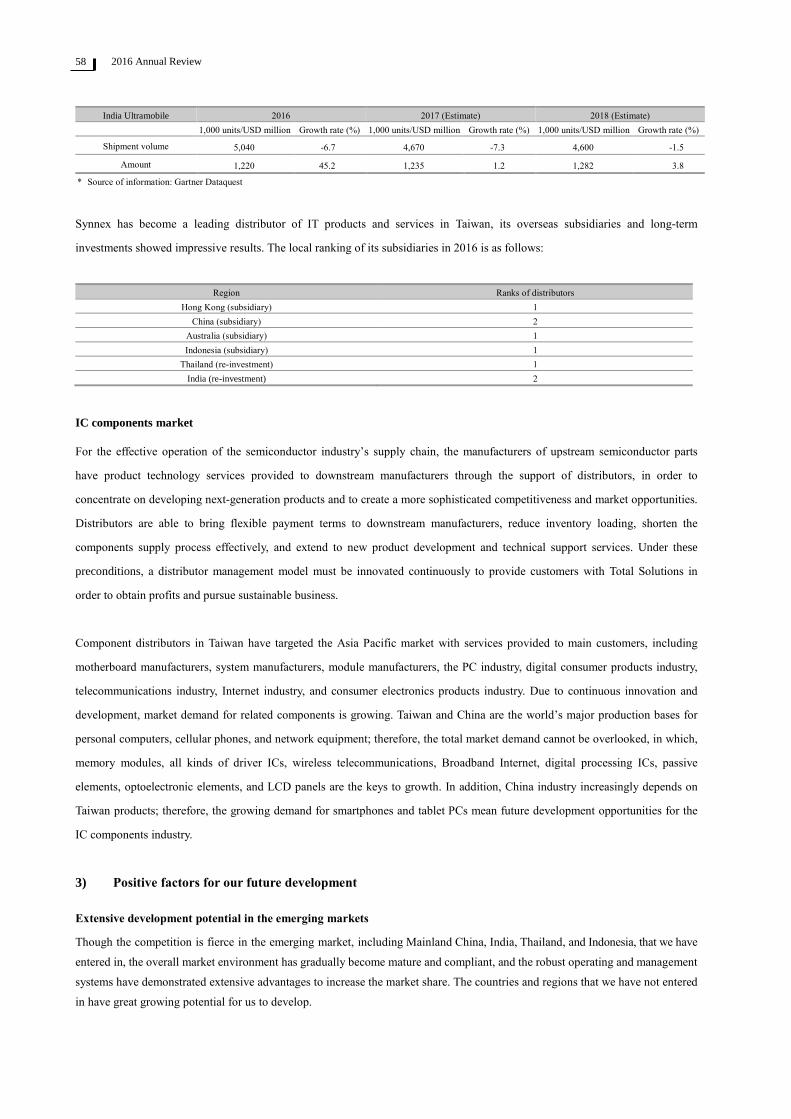
2016 Annual Review 58
India Ultramobile 2016 2017 (Estimate) 2018 (Estimate)
1,000 units/USD million Growth rate (%) 1,000 units/USD million Growth rate (%) 1,000 units/USD million Growth rate (%)
Shipment volume 5,040 -6.7 4,670 -7.3 4,600 -1.5
Amount 1,220 45.2 1,235 1.2 1,282 3.8
* Source of information: Gartner Dataquest
Synnex has become a leading distributor of IT products and services in Taiwan, its overseas subsidiaries and long-term
investments showed impressive results. The local ranking of its subsidiaries in 2016 is as follows:
Region Ranks of distributors
Hong Kong (subsidiary) 1
China (subsidiary) 2
Australia (subsidiary) 1
Indonesia (subsidiary) 1
Thailand (re-investment) 1
India (re-investment) 2
IC components market
For the effective operation of the semiconductor industry’s supply chain, the manufacturers of upstream semiconductor parts
have product technology services provided to downstream manufacturers through the support of distributors, in order to
concentrate on developing next-generation products and to create a more sophisticated competitiveness and market opportunities.
Distributors are able to bring flexible payment terms to downstream manufacturers, reduce inventory loading, shorten the
components supply process effectively, and extend to new product development and technical support services. Under these
preconditions, a distributor management model must be innovated continuously to provide customers with Total Solutions in
order to obtain profits and pursue sustainable business.
Component distributors in Taiwan have targeted the Asia Pacific market with services provided to main customers, including
motherboard manufacturers, system manufacturers, module manufacturers, the PC industry, digital consumer products industry,
telecommunications industry, Internet industry, and consumer electronics products industry. Due to continuous innovation and
development, market demand for related components is growing. Taiwan and China are the world’s major production bases for
personal computers, cellular phones, and network equipment; therefore, the total market demand cannot be overlooked, in which,
memory modules, all kinds of driver ICs, wireless telecommunications, Broadband Internet, digital processing ICs, passive
elements, optoelectronic elements, and LCD panels are the keys to growth. In addition, China industry increasingly depends on
Taiwan products; therefore, the growing demand for smartphones and tablet PCs mean future development opportunities for the
IC components industry.
3) Positive factors for our future development
Extensive development potential in the emerging markets
Though the competition is fierce in the emerging market, including Mainland China, India, Thailand, and Indonesia, that we have
entered in, the overall market environment has gradually become mature and compliant, and the robust operating and management
systems have demonstrated extensive advantages to increase the market share. The countries and regions that we have not entered
in have great growing potential for us to develop.

Operation highlights
59
Integration of the brand manufacturers and the bigger in the economic scale, the bigger the growth potential will be
In recent years, information and communications brand manufacturers have sped up the integration and the formation of alliances
between leading manufacturers and distributors has become a trend to create a bigger economic scale, lower operating cost, and
more efficient collaboration. The economy of scale is not only helpful in the consolidation of the market position, but also
accelerates the reduction of the operating cost and vice versa.
New technologies and application changing the market rules and creating new business opportunities
New applications are introduced to the market continuously as the technology progresses. They change the living style of the
human beings and game rules. The mobile networking, cloud service, and IoT, among other technological applications, are
currently the most obvious examples. For Synnex, this is a challenge that brings us new opportunities.
Continuously increasing of customers’ demand to "small quantity, various types and one stop shopping"
A variety of Synnex’s products offer the convenience of “small quantity, various type and one stop shopping” to customers so as
to lower their inventory risk resulted from a short life cycle of IT and Telecom products and price variation while saving time and
cost for suppliers. This is one of Synnex’s major feature and the service that other suppliers and agents cannot offer.
Provide quality service in the slim-profit era
Distributors’ profit is close to none in this slim-profit era, thus, quality service determines who wins the game. Synnex’s
operating strategy is “to be a professional channel business service provider with integrated services provided to the high-tech
industrial chain” in response to the industrial chain development trend and the service demands of the upstream and downstream
manufacturers, provide solutions for operational problems, continue to research and develop innovation service mechanism,
gradually enhance close cooperation with upstream and downstream manufacturers, and establish the Company’s indispensable
role in the industrial value chain.

2016 Annual Review 60
4) Negative factors for our future development and our countermeasures
Negative factors Countermeasures
The regional chain reaction and interaction is enhanced under
the trend of globalization; also, the impact of local natural
disaster or economic and political turbulence is broadened.
1. Diversify risk and reduce the impact of natural disaster and economic and political turbulence
through multi-nation, multi-product, and multi-channel business strategy.
2. Focus on the operation of the industry, commit to upgrade internal operational management,
strengthen the constitution of the enterprise, and build up ability for withstanding the
environment variables and systematic risk.
Short life cycle of products
The rapid advancement of technology has facilitated the speed of
products innovation, thus product cycle is shortened to half year
and resulted in uncertainty of sales performance and increased
inventory risk.
1. Utilize ERP information management system to manage purchase, sales and inventory so as to
lower inventory weeks and increase number of turnover and meet the target of inventory
optimization.
2. Adjust inventory weeks in according with the development of life cycle of the respective
products to avoid over-stocking and interest burden.
3. Remove the no-value item to avoid diversified concentration of management.
4. Follow up product and technology development, in addition to popular products, introduce
next-star products at appropriate timing to optimize product combination, control product
opportunity and lower management risk.
Era of marginal profit, profit is low and hard to improve
Mature technology and transparent information cause 3C industry
upstream and downstream to work for marginal profit and with
difficulty in improving profit.
1. Committed to improve operational efficiency, continue to reduce operating costs, and increase
market share with the advantage of low-cost in order to maintain stable profitability.
2. Compute product cost structure through precise operation analysis and develop accurate
product strategies.
3. Enhancement of operating control through computer systems to reduce loss of gross earnings.
5) Essential Purposes of Major Products
Major products Use
IT related Products
Personal Computer Note Book, Home Computer, Business Computer, Server, Mini
Mobile Computer
Personal or commercial Data Processing
Equipment
Tablet Computer Multimedia Tablet, Ebook Entertainment, data processing equipment for
personal or commercial use
Computer
Component
Main board, Graphics Card, Inputs/Outputs Control Card,
Keyboard, Power Supply, Case, Cooling Fan
Major components for custom built PC
Prin
ting Device
InkJet Printer, Laser Printer, Multi-Function Printer, Photo
Printer, 3D Printer
Computer printing device
Display Device LCD Monitor Computer display device
Storage Device Hard Disk Drive, Floppy Disk Drive, Tape Drives, CD
Rewritable Drive
Computer storage device
Input Device Scanner, Digital Camera Computer input device
Multimedia
Products
CD-Rom Drive, Sound Card, Video Card, Multemedia Suite,
CD-ROM machine, CD Software, Leisure Software,
Multimedia Speaker, PC Camera, LCD Projector
Processing device and software for multimedia
audio, image and information
Networking
Product
Network Card, Routers, Bridge, Internet Connected Device,
Uninterruptible Power Supply, Modem, Network Operating
System, Wireless Network System, Wireless Base Station,
Broadband Router
Networking device and operating software
Application
Software
Operating System, Electronic Spreadsheet, Word Processing,
Integration Software, Database, Utilities Software, Anti-Virus
Software and other application software
Activation or Application Utilities Software
Consumables Mouse, Floppy Disks, CD-ROM, Inked Ribbons, Ink
Cartridges, Toner Cartridges, Purchase equipment,
consumables
Consumables and purchased goods of computer
storage, printing and input devices
Digital Products LCD TV, Xbox Game Consoles and Software, DVD, Digital
Cameras, Smart Wearable Device, Smart TV Dongle, GPS
Navigation System, Event Data Recorder, Electronic Lock,
Anti-thief Safe, Drone, and Webcam
Personal or home digital products
Telecom Products General Telecom
Products
Mobile Phone, Consumables & Accessories for Mobile Phone,
Fax Machine and Mobile Power Supply
Consumable communication products for personal
or commercial use
IC Components CPU, Memory, Logic, Audio, Visual, Multimedia Processing
Components, Industrial Components, Linear Components,
Optoelectronic Components, Information Appliance
Components, LCD Panel
Integrated circuit and components for the
manufacturing of personal computer and electronic
products

Operation highlights
61
VI. Employees
1) Number of employees in group
Year
Item
2015.12.31 2016.12.31 2017.04.30
Taiwan Overseas
subsidiaries Total Taiwan
Overseas
subsidiaries Total Taiwan
Overseas
subsidiaries Total
Full time employees 1,255 3,371 4,626 1,775 3,473 5,248 1,778 3,476 5,254
Part-time employees 45 208 253 109 175 284 99 202 301
Total 1,300 3,579 4,879 1,884 3,648 5,532 1,877 3,678 5,555
2) Employees information of Synnex
Year
Item 2015.12.31 2016.12.31 2017.04.30
Number of
employees in group
Sales 2,362 2,609 2,590
Operators 491 772 796
Computers 203 222 224
Administrators 585 620 613
Logistics 985 1,025 1,031
Total 4,626 5,248 5,254
Average age 34.2 34.3 34.9
Average years of service in company 5.8 6.1 6.3
Education (%)
Doctoral degree - 0.1 0.1
Master’s degree 5.9 5.8 5.8
College 82.0 83.5 83.3
High school 11.1 9.8 10.0
Below high school 1.0 0.5 0.9
Note: Part-time employees are not included.
VII. Report on environmental protection and related expenditures
Though distribution industry is not categorized as highly polluted industry, based on the believe that earth is part of
ourselves, Synnex devoted to fulfill its environmental protection responsibility,
▪ Obtained ISO 14001 Certification of Environment at Management System:
ISO 14001 Certification of Environment at Management System is recognized internationally as the highest standard of
environmental management. Synnex’s CTO assembly plant has a complete environmental management policy, process and
monitoring mechanism, it has obtained as early as 1999 and has successfully passed the annual inspection thereafter.
▪ Environmental consideration of packaging materials:
Quality control of logistics operation department is placed in Synnex’s logistics center, one of its function is to achieve the
minimum use of packaging materials in logistics operation so as to reduce environmental burden and cost of packaging
material, for example: re-using paper boxes, using non-toxic or biodegradable material in shipment packaging and
establishing recycling mechanism to effectively reduce usage of packaging material.

2016 Annual Review 62
VIII. Labor relations
Welfare and benefits for employees
In addition to participating in labor insurance and national health insurance in Taiwan, Synnex also purchases group life insurance
for its employees and established the Employee Benefits Committee, arranged various group construction activities and established
a health-promoting environment, and provides employees with sufficient securities and a secured work environment to attract
employees’ devotion. In terms of overseas subsidiaries, the employee welfare system was established in accordance with the
regulations and environment of the foreign country.
Retirement system
Synnex has reemployment retirement matters handled in accordance with the requirements of the Labor Standards Law and Labor
Pension Act with the Employee Pension Reserve Committee formed. The new pension system has been implemented in accordance
with the Labor Pension Act since July 2005 with pensions reported and withheld in the personal pension account with the Bank of
Taiwan according to the related regulations so that employees can work for the Company permanently without any worry. In terms
of overseas subsidiaries, pension reserves are appropriated and withheld periodically in accordance with the regulations and
environment of the foreign country.
Labor agreement
In addition to normal organizational system, labor-employee relations can be communicated through regular competency
assessment system, labor-management meeting and employee welfare committee in order establish channel of communication
between employees and management and generate harmony atmosphere in the Company. No significant labor dispute or loss has
occurred in 2016 and 2017 up to now.
Employee training
As Synnex regards employees as important intangible asset, thus has devoted to employee training, a complete employee training
system has been constructed after years of effort (see below graph). It is believed that the outstanding employee quality will be
one of the major advantages in Synnex’s future competition.
Training method and channel
Case Guidance
▪ On Job Training of executive
▪ Project execution guidance
Education in knowledge
(Tangible training courses)
▪ Training of scheme and operational system
▪ Professional training ▪ Training of
professional functions (Including expatriate training)
▪ Functional training….
Final goal (7P)
Professionalism
Planning
Perfection
Performance
Profit
Pleasure
Prestige
Em
plo
ye
e
Education in concept and method
(Intangible dissipation method)
▪ Synnex EMBA ▪ Selective concept and
articles ▪ 3% transcendence ▪ Department meeting ……….
Actual practice
Foster the capacity and habit of "sort→
analyze→realization"
through systematic practicing
▪ New-recruit report
▪ Duty transfer
report
▪ Monthly report
meeting
▪ Promotion report
▪ Supervision
promotion report
▪ ”System for
evaluation of
self-advancement
Show results
Raising capacity level
Capable→Good→Excel→
Excellent
Strengthen capacity
Single sided→Multiple sided
Tangible →Intangible
Short term→Long term
Absolute →Relative
Improve professional capacity
(Learning ability+ professional knowledge+ execution ability) → Parallel
development

Financial information 63
I. Consolidated condensed balance sheet for the past five years .......................................................................... 64
II. Consolidated income statement/condensed income statement for the past five years ..................................... 65
III. Name of CPA and their audited opinions in the latest five years ...................................................................... 66
Financial information

Financial information 64
Financial information
I. Consolidated condensed balance sheet for the past five years
Unit: NTD million
Item / Year ROC GAAP IFRS
2012* 2012* 2013* 2014* 2015* 2016*
Current assets 94,597 97,669 102,131 111,760 108,630 102,183
Fixed assets/Property, plant and
equipment 4,656 4,715 5,848 6,737 7,061
6,835
Intangible assets 1,340 407 408 413 450 703
Funds and investments/Other
assets 14,031 14,413 16,068 17,006 18,646
18,110
Total assets 114,624 117,204 124,455 135,916 134,787 127,831
Current liabilities
Before distribution 68,527 71,115 80,664 84,996 90,345 83,323
After distribution 71,701 74,289 85,112 90,238 92,728 84,991
Long term and other
liabilities/Noncurrent liabilities 5,139 5,296 442 4,712 567
626
Total liabilities
Before distribution 73,666 76,411 81,106 89,708 90,912 83,949
After distribution 76,840 79,585 85,554 94,950 93,295 85,617
Equity attributable to
shareholders of the parent 40,958 40,793 42,584 45,327 42,818
42,572
Capital stock 15,839 15,839 15,885 15,885 15,885 16,679
Capital reserve 13,975 14,030 14,265 14,331 14,140 14,196
Retained earnings
Before distribution 12,815 12,290 14,400 14,986 12,920 14,534
After distribution 9,641 9,116 9,952 9,744 10,537 12,866
Other adjustments on
Stockholder’s equities/Other
equity
(1,671) (1,366) (1,966) 124 (127)
(2,837)
Treasury stock - - - - - -
Non-controlling interests - - 764 882 1,057 1,310
Total shareholder’s equity
Before distribution 40,958 40,793 43,348 46,208 43,875 43,882
After distribution 37,784 37,619 38,900 40,966 41,492 42,214
* Financial statement of the respective years has been audited.
**
***
Asset revaluation had not been processed in the last five years.
The amount after distribution of the respective years was based on the resolution of the Annual Shareholders’ meeting in the following
year, except for 2016, based on the board resolution in the following year.

Financial information 65
II. Consolidated income statement/condensed income statement for the past
five years
Unit: NTD million.
(Except for earnings per share in NTD)
Item / Year ROC GAAP IFRS
2012* 2012* 2013* 2014* 2015* 2016*
Operating revenues 312,585 312,585 330,260 331,533 322,133 342,696
Gross Profit 11,532 11,532 11,059 11,525 11,592 12,131
Operating income 4,472 4,558 3,879 4,450 3,949 4,269
Non-operating income and expenses 2,429 2,294 2,513 1,767 (211) 1,456
Net income before tax 6,901 6,853 6,392 6,217 3,738 5,725
Net income from continuing
department 5,816 5,767 5,433 5,255 3,419
5,124
Loss from discounted department - - - - - -
Net income 5,816 5,767 5,433 5,255 3,419 5,124
Other comprehensive income (net of
tax) NA (1,474) (590) 1,986 (318)
(2,724)
Total comprehensive income NA 4,293 4,843 7,241 3,101 2,400
Net income attributable to
shareholders of the parent NA 5,767 5,274 5,024 3,186
4,876
Net income attributable to
non-controlling interests NA - 159 231 233 248
Total comprehensive income
attributable to shareholders of the
parent
NA 4,293 4,684 7,124 2,926
2,147
Total comprehensive income
attributable to non-controlling interests NA - 159 117 175
253
Earnings per share - before retroactive
adjustment 3.69 3.66 3.32 3.16 2.01
2.92
- after retroactive adjustment*** 3.51 3.48 3.17 3.01 1.91 2.92
* Financial statement of the respective years has been audited.
** Retroactive adjustment is made with the stock shares from earnings, capital reserve, and employees’ bonus as of December 31, 2016.

2016 Annual Review 66
III. Name of CPA and their audited opinions in the latest five years
Auditing year Name of CPA firm Name of CPA Audited opinions
2011 PricewaterhouseCoopers Jenny Yeh, Tseng, Hui-Chin Modified unqualified audited opinion
2012 PricewaterhouseCoopers Jenny Yeh, Tseng, Hui-Chin Modified unqualified audited opinion
2013 PricewaterhouseCoopers Jenny Yeh, Tseng, Hui-Chin Modified unqualified audited opinion
2014 PricewaterhouseCoopers Eric Wu, Chou, Chien-Hung Modified unqualified audited opinion
2015 PricewaterhouseCoopers Eric Wu, Chou, Chien-Hung Modified unqualified audited opinion
2016 PricewaterhouseCoopers Jenny Yeh, Eric Wu Unqualified audited opinion

Financial status, results of operations & risk management 67
I. Analysis and review of financial position and results of operations ................................................................. 68
1) Analysis of financial position ................................................................................................................................. 68
2) Analysis of the results of operation ........................................................................................................................ 69
3) Liquidity analysis ................................................................................................................................................... 70
4) Important capital expenditure in the most recent calendar year and its effect on the company’s operational and
financial situation ................................................................................................................................................... 70
5) Review and analysis of investment ......................................................................................................................... 71
II. Risk management ................................................................................................................................................. 72
1) Changes in interest and foreign exchange rates and inflation all exert a material effect on profit/loss of the
Company and call for appropriate measures by the company to protect itself ........................................................ 72
2) High risk, high leverage investment, granting loans to outsiders, doing endorsement and guarantees and
derivatives trading .................................................................................................................................................. 72
3) Others ..................................................................................................................................................................... 73
4) Summarized operating results of group enterprises ................................................................................................ 74
Financial status, results of operations & risk management

2016 Annual Review 68
Financial status, results of operations & risk management
I. Analysis and review of financial position and results of operations
1) Analysis of financial position
Unit: NTD million
Item / Year 2015 2016 Increase (Decrease) (%)
Amount %
Current assets 108,630 102,183
(6,447) (6)
Investments under equity method 11,161 11,132
(29) (3)
Properties, plants and equipment 7,061 6,835
(226) (3)
Intangible and other assets 7,935 7,681
(254) (3)
Total assets 134,787 127,831
(6,956) (5)
Current liabilities 90,345 83,323
(7,022) (8)
Non-current liabilities 567 626
59 10
Total liabilities 90,912 83,949
(6,963) (8)
Capital stock 15,885 16,679
794 5
Capital reserve 14,140 14,196
56 -
Retained earnings 12,920 14,534
1,614 12
Other shareholder’s equity (127) (2,837)
(2,710) (2,134)
Non-controlling interest 1,057 1,310
253 24
Total shareholder’s equity 43,875 43,882
7 -
Analysis:
Current assets and current liabilities (↓NTD6,447million, 6%; ↓NTD7,022 million, 8%)
The decrease in current assets is mainly due to the decrease of cash and cash equivalent by NTD6,424 million (↓46%). The decrease in current liabilities is mainly due to
the decrease of short term borrowing by NTD8,966 million (↓19%), the reasons are:
1. For the increase in notes and accounts receivable and payable, in terms of the business cycle days, days sales in accounts receivable and days average payment days for
2016 were 51 days and 34 days, respectively; also, inventory turnover days were 39 days, and net business cycle days were 56 days (days sales in accounts receivable +
inventory turnover days- average payment days) that was same as the year 2015. In addition to continuing the implementation of the Group’s effective management of
accounts receivable and inventory, with the advantage of expanding Group purchasing, future efforts remain committed to seeking an extension of payment terms from
suppliers or a higher purchase discount.
2. The net loan outstanding (short-term loan + short-term bills payable + long-term loan due in one year + corporate bond payable + long-term loan - cash and cash
equivalents) in 2016 amounted to NTD36,633 million that represented an decrease of NTD2,422 million from the NTD39,055 million in 2015 thanks to the appropriate
management of receivables and inventories and increase of the cash inflows. The Group’s solvency indexes are good with sufficient borrowing quota to support
short-term high funding needs; therefore, there is no problem in the short-term liquidity. In prospect of long-term funding needs, the financial leverage risk and return
on equity will be considered equally, if necessary, funds will be raised from the capital market in time.
Capital stock (↑NTD784million, 5%)
Mainly due to distribution of dividends NTD0.5/share in 2016
Other shareholder’s equities (↓NTD2,710 million, 2,134%)
Mainly due to the negative figure in the conversion of the fluctuating foreign currencies from the accumulated long-term investments under the shareholder’s equity

Financial status, results of operations & risk management 69
2) Analysis of the results of operation
Unit: NTD million
Item / Year 2015 2016 Increase (Decrease) (%)
Amount %
Total revenue 322,133 342,696 20,563 6
Operating cost (310,541) (330,565) 20,024 6
Net gross profit 11,592 12,131 539 5
Operating expense (7,643) (7,862) 219 3
Operating income 3,949 4,269 320 8
Non-operating revenue and expenditure (211) 1,456 1,667 790
Income before tax 3,738 5,725 1,987 53
Income tax expense (319) (600) 281 88
Net income 3,419 5,125 1,706 50
Analysis:
Total revenue, Operating cost and Gross profit (↑NTD20,563 million, 6%; ↑NTD 20,024 million,6%; ↑NTD539 million, 5%)
Synnex Taiwan saw revenue up by 29%; Hong Kong/China saw revenue up by 5%, Australia, New Zealand, and Indonesia revenue up by 1%. The scale of overseas
market where subsidiaries operate is extensive but local industry is relatively uncompetitive due to lack of logistics operations or ERP information management
systems, high growth forecast is maintained.
Gross margin ratio for the year is 3.5%, decrease by 0.1% from previous year.
Operating expenses (↑NTD219 million, 3%)
Mainly due to the increase of operating expense arising from the expansion of business scale. The operating expense rate had gone down from 2.37% in 2015 to 2.29%
in 2016 which was relatively low compared to the operating expense rate of the other companies in this industry, indicating that the Company had actively controlled
expense and expenditure and the effect of “economies of scale” was gradually showing.
Net operating income (↑NTD320 million, 8%)
To sum up, there was an increase in net operating income by NTD320 million in 2016. In the days to come, as the world as a whole is on the way to a period of tiny
interests, the Group plans to focus in expanding revenue growth coupled with enhancing or maintaining net profit margins to maximize operating income and
increase returns on equity (ROE).
Non-operating revenues and expenditures (↑NTD1,667 million, 790%)
The net foreign exchange loss was decreased by NTD1,718 million mainly due to less foreign currency loans to subsidies.
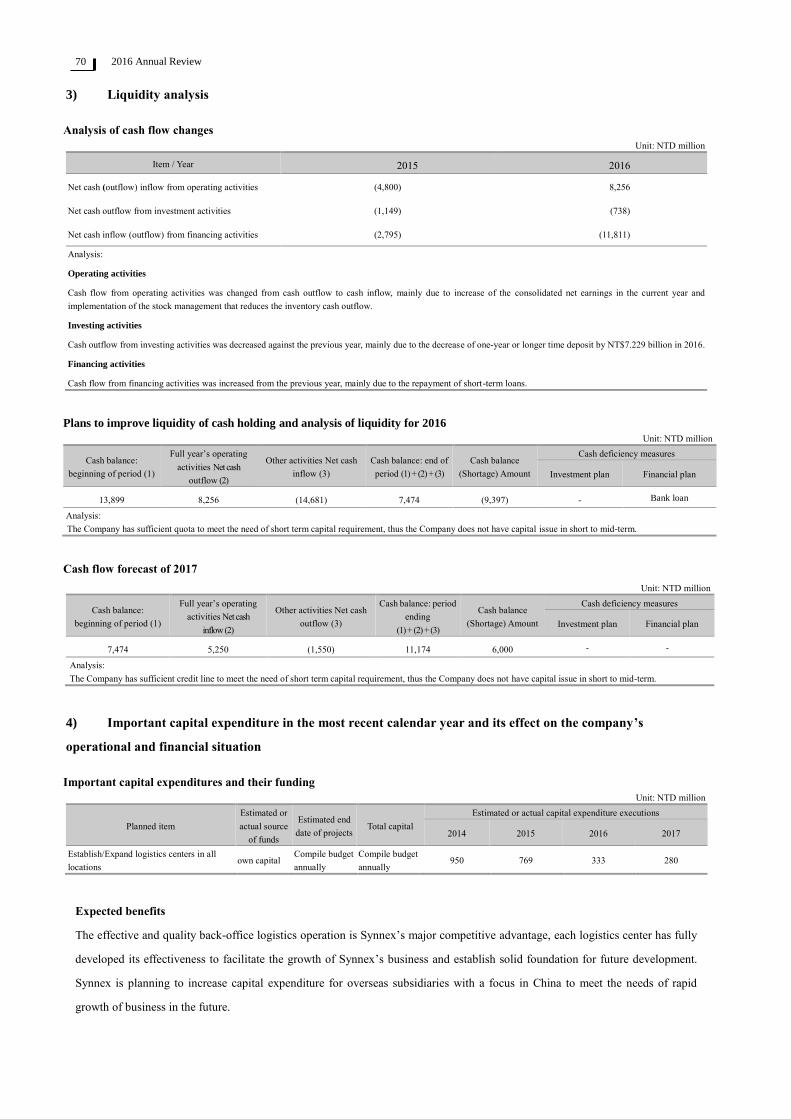
2016 Annual Review 70
3) Liquidity analysis
Analysis of cash flow changes
Unit: NTD million
Item / Year 2015 2016
Net cash (outflow) inflow from operating activities (4,800) 8,256
Net cash outflow from investment activities (1,149) (738)
Net cash inflow (outflow) from financing activities (2,795) (11,811)
Analysis:
Operating activities
Cash flow from operating activities was changed from cash outflow to cash inflow, mainly due to increase of the consolidated net earnings in the current year and
implementation of the stock management that reduces the inventory cash outflow.
Investing activities
Cash outflow from investing activities was decreased against the previous year, mainly due to the decrease of one-year or longer time deposit by NT$7.229 billion in 2016.
Financing activities
Cash flow from financing activities was increased from the previous year, mainly due to the repayment of short-term loans.
Plans to improve liquidity of cash holding and analysis of liquidity for 2016
Unit: NTD million
Cash balance:
beginning of period (1)
Full year’s operating
activities Net cash
outflow (2)
Other activities Net cash
inflow (3)
Cash balance: end of
period (1) + (2) + (3)
Cash balance
(Shortage) Amount
Cash deficiency measures
Investment plan Financial plan
13,899 8,256 (14,681) 7,474 (9,397) - Bank loan
Analysis:
The Company has sufficient quota to meet the need of short term capital requirement, thus the Company does not have capital issue in short to mid-term.
Cash flow forecast of 2017
Unit: NTD million
Cash balance:
beginning of period (1)
Full year’s operating
activities Net cash
inflow (2)
Other activities Net cash
outflow (3)
Cash balance: period
ending
(1) + (2) + (3)
Cash balance
(Shortage) Amount
Cash deficiency measures
Investment plan Financial plan
7,474 5,250 (1,550) 11,174 6,000 - -
Analysis:
The Company has sufficient credit line to meet the need of short term capital requirement, thus the Company does not have capital issue in short to mid-term.
4) Important capital expenditure in the most recent calendar year and its effect on the company’s
operational and financial situation
Important capital expenditures and their funding
Unit: NTD million
Planned item
Estimated or
actual source
of funds
Estimated end
date of projects Total capital
Estimated or actual capital expenditure executions
2014 2015 2016 2017
Establish/Expand logistics centers in all
locations own capital
Compile budget
annually
Compile budget
annually 950 769 333 280
Expected benefits
The effective and quality back-office logistics operation is Synnex’s major competitive advantage, each logistics center has fully
developed its effectiveness to facilitate the growth of Synnex’s business and establish solid foundation for future development.
Synnex is planning to increase capital expenditure for overseas subsidiaries with a focus in China to meet the needs of rapid
growth of business in the future.

Financial status, results of operations & risk management 71
5) Review and analysis of investment
Overall investment policy
Unit: NTD million
Item 2016.12.31 Balance of
investment Investment policy of the coming year
Investment under equity method 11,132 The Group does not have any significant investment or disposition plan on Synnex
Corporation (US), Redington Group (India), and Synnex Thailand.
Long-term investment – others and financial
assets carried at cost
1,723 In addition to the disposition of non-performing minor investment, the Company does not
have any investment or disposition plan.
Available-for-sale financial asset 1,557 It will be disposed gradually.
Review and analysis of important analysis
Unit: NTD million
Item
2016.12.31
Percentage of
shareholding
2016
Investment
gain
Policy Major reason of operating profit or loss Improvement
plan
Investment plan of
the coming year
Synnex Corporation
(US)
10.31% 785 Long term
holding
The Company is categorized as IT product and
communication channel service provider, its coverage
including Europe, US and Japan. The Company’s net
income was NTD7,456 million in 2016. Synnex
recognized investment income under the equity
method.
NA No current
investment or
disposition plan.
Redington (India) Ltd.
(India)
23.58% 505 Long term
holding
The Company is categorized as an IT and Telecom
product distribution service provider, its coverage
includes India, Middle-East and Africa. The
Company’s net income was NTD2,142 million in
2016. Synnex recognized investment income under
the equity method.
NA No current
investment or
disposition plan.
Synnex (Thailand)
Public Company Ltd.
(Thailand)
40.00% 153 Long term
holding
The Company is categorized as an IT product and
communication channel service provider, its coverage
is focused solely in the Thailand market. The
Company’s net income was NTD383 million in 2016.
Synnex recognized investment income under the
equity method.
NA No current
investment or
disposition plan.
MiTAC Inc.
(Taiwan)
18.36% 52 Long term
holding
The Company is categorized as a systematic
integration value-added service provider. With cash
dividend of NTD1.0 per share in 2015, it is recorded
by Synnex in financial asset carried at cost and
recognized as dividend income.
NA No current
investment or
disposition plan.

2016 Annual Review 72
Risk management
1) Changes in interest and foreign exchange rates and inflation all exert a material effect on profit/loss of
the Company and call for appropriate measures by the company to protect itself
Risk items Risk factors Loss/gain caused by risk factors Countermeasure
Interest As interest rate remains low in recent years, the
company adopts flexible financial leverage
operation by raising capital at low cost to replace
capital injection from its own capital and effectively
increase return on equity. However, the fluctuation
of interest rate may have certain risk on the
Company’s operation.
Unit: NTD million 1. Financial leverage must be balanced with increase in
return on equity; therefore, when financial leverage
reaches certain target, the Company must raise capital
from the market to reduce risk.
2. Regular evaluation and supervision of overseas
subsidiaries’ financial leverage, when certain risk target is
reached, the parent company must inject capital to reduce
financing proportion.
3. Utilize the advantage of group’s size and performance
to negotiate prime rate.
2015 2016 Change (%)
Average loan 51,696 48,531 (6)
Average net outstanding
loans*
33,431 37,844 13
Interest expense 831 657 (21)
Net interest expense** (196) 227 216
* Balance of average net outstanding loans=average loans-average cash and cash equivalent-average short term investment
bond funds.
** Net interest expense = interest expense – interest income – gain on disposal of bond funds
Foreign
exchange
The characteristics of each product line is described
below:
IT products: Certain percentage of this product line
is imported (mostly denominated in US$), sale of
goods is mostly denominated in local currency, and
there is certain exchange risk.
Telecom products: Purchase and sales of goods
locally and is denominated in local currency,
therefore, no exchange risk.
IC components: Certain percentage in this product
line is imported (mostly denominated in US$),
though certain percentage of sales is denominated in
US$, there still remains certain degree of exchange
risk.
Unit: NTD million 1. For NTD to US$, purchase US$ and transfer to term
deposit when there is a purchase denominated in US$ and
use the term deposit to settle goods payable to obtain total
hedge.
2. The overseas subsidiaries use forward exchange
contract to avoid exchange risk.
3. RMB to US$ is reducing the fluctuation of exchange
gain (loss) through lowering RMB position.
2015 2016 Change (%)
Net exchange gain (2,419) (701) (71)
Note: The net foreign exchange loss in 2016 was around NTD701
mainly due to the depreciation of RMB.
Inflation As the end-user of our IT and Telecom products are
consumers, therefore, high unit price products will
be impacted by inflation and resulted in investment
risk of reduction in sales or gross margin on sales.
The inflation (deflation) rate in 2016 of where the Company and its
overseas subsidiaries located are:
Taiwan: 1.3% Hong Kong: 2.6%
China: 2.3% Australia: 1.4%
Description: As inflation in the subsidiaries’ countries remains at a
low level, therefore, only minor impact on the Company’s operations
is seen in 2016
“Multi-brand, multi-product” is an important policy of our
company’s product management. Therefore, there will be
small percentage of our products impacted by inflation to
avoid the operational risk of over-centralized products.
2) High risk, high leverage investment, granting loans to outsiders, doing endorsement and guarantees and
derivatives trading
Risk items 2016 Execution Group policies and countermeasures
High risk and high leverage
investment
None The operational policy of the group is focus on operation of regular business; therefore, we do not invest in this type
of products.
Lending to others Lending exists only between parent-subsidiaries
relations in 2016.
1. Loan to others will require Board of Directors’ resolution.
2. Lending to: (1) companies that have business relationship with the Group.
(2)Companies with short-term capital requirement.
3. The Group has stipulated “procedures for lending funds to others” to control lending operation.
Endorsement and guarantees 1. Endorsement exists only between
parent-subsidiaries relations in 2016.
2. No endorsement loss in 2016.
1. Endorsement requires Board of Directors’ approval.
2. Endorse for: (1) companies that have business relationship with the Group.
(2) Directly and indirectly holding over 50% of voting right.
(3) Inter-company or co-builder endorsement due to contract requirement, or co-investment
relationship and each shareholder endorse for the company in accordance with their
shareholding.
(4) Directly and indirectly holding 100% of voting right.
3. The Group has stipulated “procedures for endorsement and guarantees” to control endorsement operation.
(Continued on next page)

Financial status, results of operations & risk management 73
Risk items 2016 Execution Group policies and countermeasures
Derivative products
transactions
The Group has purchased forward exchange contracts
to avoid foreign exchange risk in 2016, as gain/loss
from hedging transactions have been offset by its
gain/loss, therefore, no actual gain/loss is generated.
Our group does not carry out speculative derivative trading; trading of derivative products is for hedging purpose
only. All transactions are managed in accordance with “procedures for derivative trading”.
3) Others
Risk items Risk factors Impact on the company in 2016 Countermeasure
Product R&D As the Company is distribution services provider, therefore, the risk
of product R&D focuses solely on suppliers or customers. However,
in order to expand IC components business, the Group has
established a dedicated group responsible for research and
development which result will be transferred to customers to attract
future purchase orders of IC components. As the manufacturing and
sales of the R&D result will be responsible by the clients, the
Group’s R&D risk is limited to the control of R&D expense.
None The research and development of the group’s products is positioned
as “assist the sales of IC components through pre-sales services”, the
R&D department can avoid excessive input of company’s resources
if insist in this position, and the final risk of R&D is borne by the
customers.
Change of
government policy
and regulations
As the Company is distribution services provider, therefore, the risk
of product R&D focuses solely on suppliers or customers. However,
in order to expand IC components business, the Group has
established a dedicated group responsible for research and
development which result will be transferred to customers to attract
future purchase orders of IC components. As the manufacturing and
sales of the R&D result will be responsible by the clients, the
Group’s R&D risk is limited to the control of R&D expense.
No significant change in government
policy and regulations.
The Company continues to monitor and analyze the future trend of
each country’s government policy and regulations for immediate
respond where necessary.
Change of
technology
The Company’s product range is mostly high-tech products,
therefore, sales change triggered by change of technology will result
in operational risk, for example: unable to obtain innovative
products’ franchise.
Product franchises obtained by the
Company are increasing or decreasing
in 2012.
“Multi-brand, multi-products” is the important policy of the product
operation. The products that our Company represented includes
global brands, in general, most global brands have good control of
the technology advantage; thus, reduce the Group’s operational risk.
Change of
corporate image
As the end-user of our Company’s IT and Telecom products are
consumers, therefore, corporate image is very important to our
Company’s operation.
The corporate image of the Company
remains positive, no significant damage
to the Company’s image.
1. Improve customer services and fully elaborate the functions of
customer’s opinion and consumer complains feedback.
2. In case of major consumer disputes, inter-departmental team is
formed to avoid the worsening of the situation.
M&A
Mergers and Acquisitions can facilitate the expansion of product
agency and range while expanding market share. But there are risks
of overpriced, under-valued liability and failure in integration.
The Company did not participate in any
M&A.
NA
Expansion of
plants
Synnex’s major competitive advantage is effective and quality back
office logistics operation that enhances value added services, expand
market share and enhance overall performance. However, there exist
risks of negative cash flow resulted from over-expansion, low usage
rate or idle.
The cost of establishment or expansion
of logistics centers was NTD333
million.
Before expansion: Prudent evaluation of investment effectiveness
and cost.
After expansion: Import successful operational experience and
management to develop its effectiveness.
Centralized
suppliers or
customers
Risk of centralized supplier is the impact to the Company’s
performance when losing a franchise or the represented product
loosing competitiveness.
See “List of major suppliers and
customers in the latest two calendar
years”. The Company does not have
over centralized supplier and customers
issues.
“Multi-brand, multi-products” and “open channel management to
establish dense reseller network” is the Company’s operational
strategy, it can also effectively avoid risk of centralized supplier and
customers.
Transfer or change
of shares of
directors,
supervisors or
shareholders of
over 10%
May have significant impact to shareholder rights and Synnex’s
share price
No significant equity transfer or
change.
The Company has established reporting mechanism to effectively
manage the progress and publish information.
Change of
managerial
authority
May have significant impact to shareholder rights and Synnex’s
share price
No change of managerial authority. The Company will publish material information shall there be any
change in managerial authority.
Litigation or
non-litigation
event
Material litigation, non-litigation of the Company, the Company’s
directors, supervisors, president, actual owner, major shareholders
with over 10% of shareholding and subsidiaries will damage the
Company’s image, shareholder rights and the Company’s share
price.
See the description below. With the established reporting system, the Company will minimize
the damage through honest, fast and open process.
Litigation, non-litigation and administrative litigation cases that have been finally judged or in pendency as of the day on which this annual report was printed:
Yojun Jiao, the independent director of the Company, was only involved in one litigation in pendency as of the day on which this annual report was printed. The cased involved and the current status are
described below:
The Securities and Futures Investors Protection Center (SFIPC) asserted on April 27, 2003, that Mr. Yojun Jiao acted as the director of the Pacific Electric Wire & Cable Co., Ltd. (PEWC) during the
period from 1999 to 2001 and requested Mr. Yojun Jiao and other co-defendants (including the rest directors, supervisor, and CPA firms) to take joint and several liability for the alleged fraudulent
financial statements. The case is pending in Taipei District Court of first sentence.
After the assessment, the Company finds that the litigation of the independent director, Yojun Jiao, is his personal affair. It is not related to the financial business of the Company or have significant

2016 Annual Review 74
effect on the shareholder’s equity or the stock price of the Company.
4) Summarized operating results of group enterprises
The financial position and operating results of the group enterprises as of December 31, 2015
Unit: NTD thousands
(Except for earnings per share in NTD)
Company name Capital Total Assets Total
liabilities
Net Asset
Value
Operating
income
Operating
income Net Income
Earnings
per share
(after tax)
Note*
Seper Marketing Corp. 1,000 826,803 752,053 74,750 5,266,691 88,163 71,318 713.18
E-Fan Investments Corp. 225,000 630,483 150 630,333 - (151) 139,581 6.20
Synlogics Service Corp. 50,000 73,500 23,825 49,675 - (334) (325) (0.07)
Bestcom Infotech Corp. 1,032,033 3,872,581 2,280,984 1,591,597 11,189,542 217,741 208,832 2.02
Synnex Global Ltd. 17,607,318 68,590,462 8,061,533 60,528,929 2,921,576 2,861,216 4,205,314 7.67
Synnex Mauritius Ltd. 775,200 3,602,535 79 3,602,456 505,017 504,380 504,380 21.02
Peer Developments Ltd. 975,460 7,156,689 10,196 7,146,493 796,093 796,001 887,051 29.37
Synnex China Holdings Ltd. 3,236,460 7,814,464 3,223,411 4,591,053 (1,319,214) (518,387) (518,387) (5.17)
King’s Eye Investments Ltd. 2,018,007 10,230,112 279,888 9,950,224 2,006,504 2,006,330 1,921,560 30.76
Trade Vanguard Global Ltd. 6,460,000 6,052,357 (190,944) 6,243,301 - (167) 126,972 0.21
LianXiang Technology (Shenzhen)
Co., Ltd. 6,460 209,762 120,724 89,038 632,326 18,825 11,018 55.09
Laser Computer Holdings Ltd. ** 1,190,158 2,275,277 - 2,275,277 614,517 614,507 614,539 16.68
Laser Computer (China) Ltd. 33 613,197 64,569 548,628 - 65,587 131,955 16,917.27
Synnex Technology International (HK)
Ltd.
250,196 12,895,060 11,169,262 1,725,798 61,598,882 543,499 482,562 8.04
Synnex Electronics Hong Kong Ltd. 9,690 587,913 509,326 78,587 (88) (406) (870) (2.90)
Syntech Asia Ltd. 9,690 15,403,838 13,040,391 2,363,447 82,096,107 701,000 629,020 2,096.73
Synnex Australia Pty. Ltd. 958,826 16,816,688 14,368,294 2,448,394 49,152,119 659,189 328,905 9.89
Fortune Ideal Ltd. 60,464 311,508 202,610 108,898 43,919 36,867 20,015 1.38
Golden Thinking Ltd. 116,758 1,235,993 1,219,604 16,389 81,731 49,900 11,410 0.41
Synnex New Zealand Ltd. 32,994 1,366,670 1,296,262 70,408 3,456,076 22,607 1,420 0.95
PT. Synnex Metrodata Indonesia 1,083,287 5,946,438 3,322,006 2,624,432 19,422,417 744,479 496,969 1,656.56
Synnex Investments (China) Ltd. 6,460,000 21,541,660 13,727,198 7,814,462 84,008 129,929 (1,319,214) -
Synnex (Beijing) Ltd. 290,700 428,387 103,746 324,641 40,883 (16,381) (9,544) -
Synnex (Shanghai) Ltd. 710,600 2,416,026 1,329,536 1,086,490 240,220 (79,894) 117,182 -
Synnex Distributions (China) Ltd. 7,429,000 29,837,657 21,266,092 8,571,565 101,909,365 380,173 295,264 -
Synnex (Chengdu) Ltd. 161,500 384,614 237,038 147,576 23,663 (1,945) (11,428) -
Synnex (Nanjing) Ltd. 161,500 309,230 138,377 170,853 16,577 (8,695) (618) -
Synnex (Shenyang) Ltd. 96,900 192,677 102,052 90,625 19,012 991 (2,681) -
Synnex (Tianjin) Ltd. 145,350 146,349 22,297 124,052 6,928 (4,486) (4,841) -
Synnex (Hangzhou) Ltd. 161,500 193,128 17,881 175,247 19,414 5,882 6,181 -
Synnex (Qingdao) Ltd. 161,500 182,712 39,599 143,113 8,443 (2,434) (3,676) -
Synnex (Guangzhou) Ltd. 387,600 369,353 2,504 366,849 24,411 (2,098) 182 -
Synnex (Xi’an) Ltd. 129,200 223,286 103,157 120,129 17,050 2,403 1,728 -

Financial status, results of operations & risk management 75
(Continued on next page)
(Continue last page)
Company name Capital Total Assets Total liabilities Net Asset
Value
Operating
income
Operating
income Net Income
Earnings
per share
(after tax)
Note*
Synnex (Suzhou) Ltd. 193,800 173,945 471 173,474 4,930 (6,852) (4,926) -
Synnex (Wuhan) Ltd. 161,500 184,267 27,576 156,691 14,060 (1,205) 1,574 -
Synnex (Jinan) Ltd. 161,500 432,734 332,192 100,542 11,340 (3,340) (22,703) -
Synnex (Zhengzhou) Ltd. 161,500 228,676 104,991 123,685 14,515 (636) (2,801) -
Synnex (Changsha) Ltd. 129,200 331,019 238,262 92,757 11,422 (1,221) (13,130) -
Synnex (Ningbo) Ltd. 129,200 263,427 180,394 83,033 - (9,468) (13,920) -
Synnex (Hefei) Ltd. 197,030 294,410 162,397 132,013 5,000 (10,413) (15,773) -
Synnex (Nanchang) Ltd. 129,200 302,157 213,706 88,451 6,882 (10,193) (17,190) -
Synnex (Harbin) Ltd. 161,500 379,391 300,314 79,077 5,822 (13,308) (32,287) -
Synnex (Chongqing) Ltd. 19,380 19,191 68 19,123 - (4) 1,104 -
Synnex (Xiamen) Ltd. 193,800 211,074 60,634 150,440 5,145 (8,930) (10,720) -
Yude (Shanghai) Warehousing Co.,
Ltd. 11,175 21,774 31,346 (9,572) 5,642 (5,084) (4,821) -
Yidu Information Technology
(Shanghai) Co., Ltd.*** - 56 17,162 (17,106) - (10,382) (10,373) -
Synnex Technology Development Ltd. 232,810 296,844 9,277 287,567 488,982 19,956 16,570 -
Bizwave Tech Co., Ltd. 20,000 58,098 34,899 23,199 119,760 2,782 2,423 1.21
Bestcom Infotech Holding Ltd. 84,545 64,364 - 64,364 - - 16,115 1.91
Bestcom Infotech (Shanghai) Corp. 90,944 149,246 84,976 64,270 289,866 16,406 16,115 -
Bestcom International Ltd. 84,545 64,287 - 64,287 - - 16,115 1.91
* The capital of the overseas group enterprises is calculated based on historical exchange rate; balance sheet is calculated based on the exchange rate of the reporting date;
income statement is calculated based on the average exchange rate of the current year and denominated in NT Dollars. The exchange rate is as follows:
Reporting date exchange rate for 2016.12.31: US$1=NT$32.30 HK$1=NT$4.17 A$1=NT$23.32 THB$1=NT$0.92 RMB$1=NT$4.66
Average exchange rate for 2016: US$1=NT$32.31 HK$1=NT$4.18 A$1=NT$24.04 THB$1=NT$0.94 RMB$1=NT$4.86
** Refers to Consolidated Financial Statements.
*** Fund injection was not yet completed as of 12.31.2016.

76
SYNNEX TECHNOLOGY INTERNATIONAL
CORPORATION AND SUBSIDIARIES
CONSOLIDATED FINANCIAL STATEMENTS AND
REPORT OF INDEPENDENT ACCOUNTANTS
DECEMBER 31, 2016 AND 2015
----------------------------------------------------------------------------------------------------------------------------- ---------
For the convenience of readers and for information purpose only, the auditors’ report and the accompanying
financial statements have been translated into English from the original Chinese version prepared and used in
the Republic of China. In the event of any discrepancy between the English version and the original Chinese
version or any differences in the interpretation of the two versions, the Chinese-language auditors’ report and
financial statements shall prevail.

77
SYNNEX TECHNOLOGY INTERNATIONAL
CORPORATION AND ITS SUBSIDIARIES
Declaration of Consolidated Financial Statements of Affiliated Enterprises
For the year ended December 31, 2016, pursuant to “Criteria Governing Preparation of
Affiliation Reports, Consolidated Business Reports and Consolidated Financial Statements of
Affiliated Enterprises,” the company that is required to be included in the consolidated
financial statements of affiliates, is the same as the company required to be included in the
consolidated financial statements of parent and subsidiary companies under International
Financial Reporting Standard 10. If relevant information that should be disclosed in the
consolidated financial statements of affiliates has all been disclosed in the consolidated
financial statements of parent and subsidiary companies, it shall not be required to prepare
separate consolidated financial statements of affiliates.
Hereby declare,
Matthew Miau Feng Chiang
SYNNEX TECHNOLOGY INTERNATIONAL
CORPORATION AND ITS SUBSIDIARIES
March 17, 2017

78
Report of Independent Accountant Translated From Chinese
PWCR16000355
To the Board of Directors and Stockholders of Synnex Technology International Corporation
Opinion
We have audited the accompanying consolidated balance sheets of Synnex Technology
International Corporation and its subsidiaries (the “Group”) as at December 31, 2016 and
2015, and the related consolidated statements of comprehensive income, of changes in equity
and of cash flows for the years then ended, and notes to the consolidated financial statements,
including a summary of significant accounting policies.
In our opinion, based on our audit and the reports of other independent accountants (see
information disclosed in the Other Matter - Scope of the Audit section of our report), the
accompanying consolidated financial statements present fairly, in all material respects, the
consolidated financial position of the Group as at December 31, 2016 and 2015, and its
consolidated financial performance and its consolidated cash flows for the years then ended in
accordance with the “Regulations Governing the Preparations of Financial Reports by
Securities Issuers” and the International Financial Reporting Standards, International
Accounting Standards, IFRIC Interpretations, and SIC Interpretations as endorsed by the
Financial Supervisory Commission.
Basis for opinion
We conducted our audits in accordance with the “Regulations Governing Auditing and
Attestation of Financial Statements by Certified Public Accountants” and generally accepted
auditing standards in the Republic of China (ROC GAAS). Our responsibilities under those
standards are further described in the Auditor’s Responsibilities for the Audit of the
Consolidated Financial Statements section of our report. We are independent of the Group in
accordance with the Code of Professional Ethics for Certified Public Accountants in the
Republic of China (the “Code”), and we have fulfilled our other ethical responsibilities in
accordance with the Code. We believe that the audit evidence we have obtained is sufficient

79
and appropriate to provide a basis for our opinion.
Key audit matters
Key audit matters are those matters that, in our professional judgment, were of most
significance in our audit of the consolidated financial statements of the current period. These
matters were addressed in the context of our audit of the consolidated financial statements as
a whole and, in forming our opinion thereon, we do not provide a separate opinion on these
matters.
Key audit matter – Assessment of allowance for uncollectible accounts
Description
Please refer to Note 4(9) & (10), for accounting policies adopted for accounts receivable.
Please refer to Note 5(2), for critical accounting estimates and key sources of assumption
uncertainty. Please refer to Note 6(6) for details of accounts receivable.
The Group is primarily engaged in the sale of communication products, consumer electronic
products, electronic products and components The Group manages the collection of accounts
receivable from customers and bears the associated credit risk. The management categorized
the accounts receivable assessment into individual provision and group provison. For
individually assessed accounts receivable, allowance is recognised on a case by case basis.
The assessment process is affected by management’s judgment on various factors: customers’
financial conditions, internal credit ratings, historical transaction records, current economic
conditions, etc. For group assessed accounts receivable, assessment process is affected by
management’s judgment on historical uncollectible records and makes adjustments in
accordance with current economic conditions. As management’s judgment on determining
allowance for uncollectible accounts is relatively subjective and the estimated amount is
material to the financial statements, therefore, we indicated that the assessment of allowance
for uncollectible accounts as one of the key audit matters.
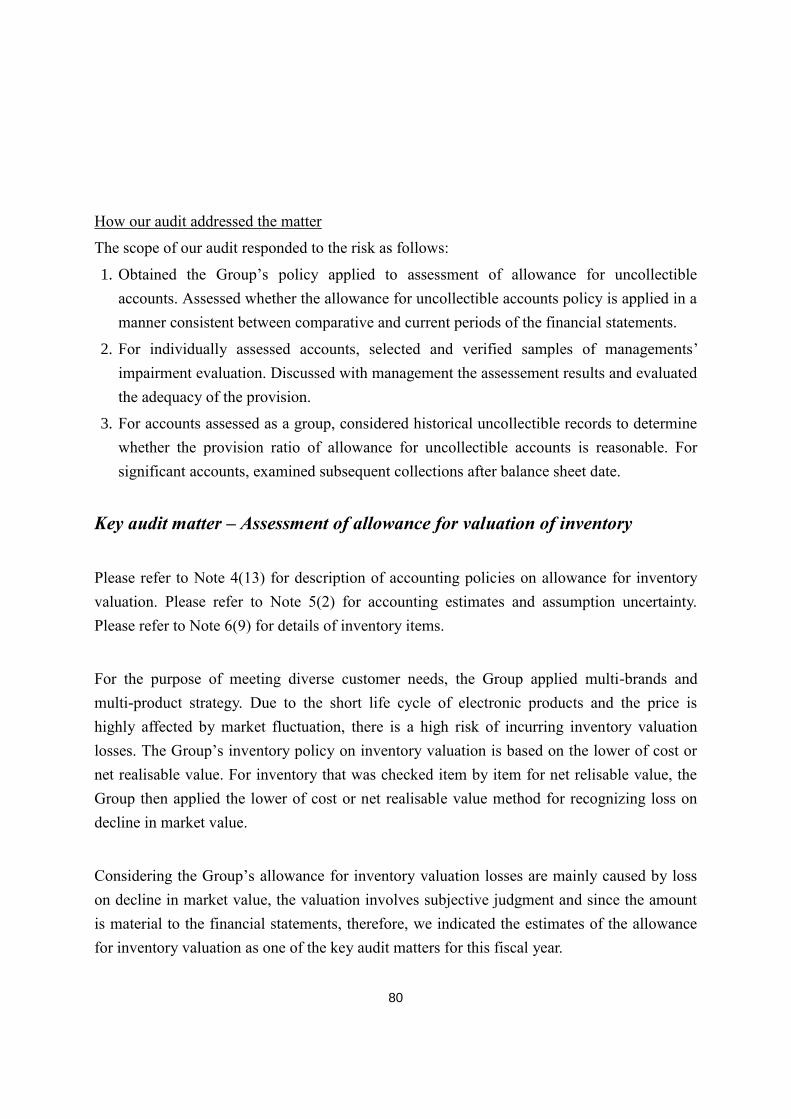
80
How our audit addressed the matter
The scope of our audit responded to the risk as follows:
1. Obtained the Group’s policy applied to assessment of allowance for uncollectible
accounts. Assessed whether the allowance for uncollectible accounts policy is applied in a
manner consistent between comparative and current periods of the financial statements.
2. For individually assessed accounts, selected and verified samples of managements’
impairment evaluation. Discussed with management the assessement results and evaluated
the adequacy of the provision.
3. For accounts assessed as a group, considered historical uncollectible records to determine
whether the provision ratio of allowance for uncollectible accounts is reasonable. For
significant accounts, examined subsequent collections after balance sheet date.
Key audit matter – Assessment of allowance for valuation of inventory
Please refer to Note 4(13) for description of accounting policies on allowance for inventory
valuation. Please refer to Note 5(2) for accounting estimates and assumption uncertainty.
Please refer to Note 6(9) for details of inventory items.
For the purpose of meeting diverse customer needs, the Group applied multi-brands and
multi-product strategy. Due to the short life cycle of electronic products and the price is
highly affected by market fluctuation, there is a high risk of incurring inventory valuation
losses. The Group’s inventory policy on inventory valuation is based on the lower of cost or
net realisable value. For inventory that was checked item by item for net relisable value, the
Group then applied the lower of cost or net realisable value method for recognizing loss on
decline in market value.
Considering the Group’s allowance for inventory valuation losses are mainly caused by loss
on decline in market value, the valuation involves subjective judgment and since the amount
is material to the financial statements, therefore, we indicated the estimates of the allowance
for inventory valuation as one of the key audit matters for this fiscal year.

81
How our audit addressed the matter
The scope of our audit responded to the risk as follows:
1. Obtained the Group’s policy applied to the assessment of allowance for valuation of
inventory loss. Assessed whether the allowance recognition policy is applied in a manner
consistent between comparative and current periods of the financial statements.
2. Obtained net realisable value report for inventory items and verified that a consistent
systematic logic was applied to the calculation. First, tested the assumptions such as:
sources of sales or purchases data and relevant supporting estimation documents. Second,
recalculated net realisable value item by item, then applied the lower of cost or net
realizable value method for valuation and whether reasonable allowance was recognised.
3. Compared current and previous year’s allowance for valuation of inventory loss. Reviewed
each period’s days sales of inventory in order to assess the adequacy and reasonableness of
allowance recognised.
Key audit matter – Assessment of purchase rebate
Description
Please refer to Note 4(13) for accounting policies adopted for the recognition of purchase
rebate. Please refer to Note 5(2) for critical accounting estimates and assumptions applied in
the accounting policy for the recognition of purchase rebate.
The Group engages in various purchase contracts for different items with different suppliers.
There are various types of rebate programs including incentives for certain purchase volume
from vendors, purchase discounts and allowances are obtained due to decline in market value,
participations in special purchase promotions, and subsidies for marketing. The Group
estimates rebates that shall be recognised in accordance with the percentage of achievement
of the rebate contract terms. There are various types of rebate programs, complicated
calculations and transactions with different suppliers as well as the manual process involved
in the verification and calculation of rebates. All of these aforementioned factors adds to the
complexity of assessing purchasing rebate. Thus, we indicated that the assessment of purchase
rebate as one of the key audit matters for this fiscal year.

82
How our audit addressed the matter
The scope of our audit responded to the risk as follows:
1. Obtained an understanding and tested the effectiveness of internal control over the
estimation of purchase rebate. Tested the appropriate controls over contractual terms
regarding rebates. Checked whether the recognition and drawing of rebate amount has been
approved by the proper authority.
2. Selected samples of details of purchase rebate estimation, reviewed the inventory item and
checked its supporting document in order to assess the reasonableness of estimation.
3. First, sampled details of purchased rebate estimation without notice from suppliers that has
been recognised as of the balance sheet date. Second, after the balance sheet date, selected
samples that has received debit note or other supporting documents from suppliers to check
whether actual rebate approximated the estimation. In addition, after balance sheet date,
checked whether there was significant new rebates that should be recognised as of the
balance sheet date.
4. For significant outstanding rebate receivable accounts, we sampled accounts and checked
the existence of original vouchers or supporting documents or tested subsequent collections
after the balance sheet date.
Other matters – Scope of the Audit
We did not audit the financial statements of certain consolidated subsidiaries. The financial
statements of these subsidiaries were audited by other independent accountants whose reports
thereon have been furnished to us, and our opinion expressed herein, in so far as it relates to
the amounts and the information disclosed in Note 13 included in these financial statements,
is based solely on the reports of the other independent accountants. The subsidiaries held
assets of $1,388,665 thousand and $1,472,480 thousand, constituting 1% and 1% of the total
consolidated assets as of December 31, 2016 and 2015, respectively, and generated net
operating income of $0, constituting 0% of the total consolidated net operating income for
both the years then ended. Furthermore, information disclosed in Note 6(10) relative to
investments accounted for under equity method and information on certain investees
disclosed in Note 13 for the years ended December 31, 2016 and 2015 is based solely on the
reports of the other independent accountants. Among the investees, certain investees financial

83
reports were prepared under different accounting standards, we have performed required
additional auditing procedures and adjusted these reports in conformity with “Rules
Governing the Preparation of Financial Statements by Securities Issuers” and the international
Financial Reporting Standards, International Accounting Standards, IFRIC Interpretations,
and SIC Interpretations as endorsed by the Financial Supervisory Commission. The related
investment income before adjustments (including share of profit or loss of associates
accounted for using equity method) was $1,457,700 thousand and $1,322,836 thousand for
the years ended December 31, 2016 and 2015, respectively, constituting 28% and 39% of the
consolidated total net operating income for the years then ended, respectively. The
comprehensive income recognised for these investments accounted for using equity method
was $1,277,236 thousand and $1,216,660 thousand, constituting 53% and 39% of
consolidated total comprehensive income for the years then ended, respectively. The balance
of related long-term equity investments amounted to $11,063,339 thousand and $10,382,364
thousand, constituting 9% and 8% of the total consolidated assets as of December 31, 2016
and 2015, respectively.
Other matter – Parent company only financial reports
We have audited and expressed an unmodified opinion on the parent company only financial
statements of Synnex Technology International Corporation as at and for the years ended
December 31, 2016 and 2015.
Responsibilities of management and those charged with governance for the
consolidated financial statements
Management is responsible for the preparation and fair presentation of the consolidated
financial statements in accordance with the “Regulations Governing the Preparations of
Financial Reports by Securities Issuers” and the International Financial Reporting Standards,
International Accounting Standards, IFRIC Interpretations, and SIC Interpretations as
endorsed by the Financial Supervisory Commission, and for such internal control as
management determines is necessary to enable the preparation of consolidated financial
statements that are free from material misstatement, whether due to fraud or error.

84
In preparing the consolidated financial statements, management is responsible for assessing
the Group’s ability to continue as a going concern, disclosing, as applicable, matters related to
going concern and using the going concern basis of accounting unless management either
intends to liquidate the Group or to cease operations, or has no realistic alternative but to do
so.
Those charged with governance, including audit committee, are responsible for overseeing the
Group’s financial reporting process.
Auditor’s responsibilities for the audit of the consolidated financial statements
Our objectives are to obtain reasonable assurance about whether the consolidated financial
statements as a whole are free from material misstatement, whether due to fraud or error, and
to issue an auditor’s report that includes our opinion. Reasonable assurance is a high level of
assurance, but is not a guarantee that an audit conducted in accordance with ROC GAAS will
always detect a material misstatement when it exists. Misstatements can arise from fraud or
error and are considered material if, individually or in the aggregate, they could reasonably be
expected to influence the economic decisions of users taken on the basis of these consolidated
financial statements.
As part of an audit in accordance with ROC GAAS, we exercise professional judgment and
maintain professional skepticism throughout the audit. We also:
1. Identify and assess the risks of material misstatement of the consolidated financial
statements, whether due to fraud or error, design and perform audit procedures responsive
to those risks, and obtain audit evidence that is sufficient and appropriate to provide a basis
for our opinion. The risk of not detecting a material misstatement resulting from fraud is
higher than for one resulting from error, as fraud may involve collusion, forgery, intentional
omissions, misrepresentations, or the override of internal control.
2. Obtain an understanding of internal control relevant to the audit in order to design audit
procedures that are appropriate in the circumstances, but not for the purpose of expressing
an opinion on the effectiveness of the Group’s internal control.

85
3. Evaluate the appropriateness of accounting policies used and the reasonableness of
accounting estimates and related disclosures made by management.
4. Conclude on the appropriateness of management’s use of the going concern basis of
accounting and, based on the audit evidence obtained, whether a material uncertainty exists
related to events or conditions that may cast significant doubt on the Group’s ability to
continue as a going concern. If we conclude that a material uncertainty exists, we are
required to draw attention in our auditor’s report to the related disclosures in the
consolidated financial statements or, if such disclosures are inadequate, to modify our
opinion. Our conclusions are based on the audit evidence obtained up to the date of our
auditor’s report. However, future events or conditions may cause the Group to cease to
continue as a going concern.
5. Evaluate the overall presentation, structure and content of the consolidated financial
statements, including the disclosures, and whether the consolidated financial statements
represent the underlying transactions and events in a manner that achieves fair presentation.
6. Obtain sufficient appropriate audit evidence regarding the financial information of the
entities or business activities within the Group to express an opinion on the consolidated
financial statements. We are responsible for the direction, supervision and performance of
the group audit. We remain solely responsible for our audit opinion.
We communicate with those charged with governance regarding, among other matters, the
planned scope and timing of the audit and significant audit findings, including any significant
deficiencies in internal control that we identify during our audit.
We also provide those charged with governance with a statement that we have complied with
relevant ethical requirements regarding independence, and to communicate with them all
relationships and other matters that may reasonably be thought to bear on our independence,
and where applicable, related safeguards.
86
From the matters communicated with those charged with governance, we determine those
matters that were of most significance in the audit of the consolidated financial statements of
the current period and are therefore the key audit matters. We describe these matters in our
auditor’s report unless law or regulation precludes public disclosure about the matter or when,
in extremely rare circumstances, we determine that a matter should not be communicated in
our report because the adverse consequences of doing so would reasonably be expected to
outweigh the public interest benefits of such communication.
Yeh, Tsui Miao Wu, Yu Lung
For and on behalf of PricewaterhouseCoopers, Taiwan
March 17, 2017
-----------------------------------------------------------------------------------------------------------------
The accompanying consolidated financial statements are not intended to present the financial position and results of operations and cash
flows in accordance with accounting principles generally accepted in countries and jurisdictions other than the Republic of China. The
standards, procedures and practices in the Republic of China governing the audit of such financial statements may differ from those generally
accepted in countries and jurisdictions other than the Republic of China. Accordingly, the accompanying consolidated financial statements
and report of independent accountants are not intended for use by those who are not informed about the accounting principles or auditing
standards generally accepted in the Republic of China, and their applications in practice. As the financial statements are the responsibility of
the management, PricewaterhouseCoopers, Taiwan cannot accept any liability for the use of, or reliance on, the English translation or for any
errors or misunderstandings that may derive from the translation.

87
Assets Notes Amount % Amount %
Current assets
1100 Cash and cash equivalents 6(1) 7,474,322$ 6 13,898,657$ 11
1110 Financial assets at fair value through profit or loss-current 6(2) 534,178 1 424,108 -
1125 Available-for-sale financial assets-current 6(3) 1,506,147 1 1,415,009 1
1150 Notes receivable-net 6(5) 7,685,827 6 8,187,190 6
1160 Notes receivable-related parties-net 7 240 - - -
1170 Accounts receivable-net 6(6) 40,830,646 32 38,147,636 28
1180 Accounts receivable-related parties-net 7 384,225 - 104,175 -
1200 Other receivables 6(8) 7,344,037 6 7,723,546 6
1210 Other receivables-related parties 7 590 - 62,718 -
1220 Current tax assets 6(29) 222,828 - 172,509 -
130X Inventories, net 6(9) 33,648,105 26 35,258,681 26
1410 Prepayments 2,394,068 2 2,769,713 2
1470 Other current assets 8 158,110 - 466,222 1
11XX Total current assets 102,183,323 80 108,630,164 81
Non-current assets
1523 Available-for-sale financial assets-noncurrent 6(3) 51,269 - 18,290 -
1543 Financial assets measured at cost-noncurrent 6(4) 1,723,497 1 1,805,312 2
1550 Investments accounted for under the equity method 6(10) 11,132,423 9 11,161,302 8
1600 Property, plant and equipment, net 6(11) 6,835,286 5 7,060,838 5
1760 Investment property, net 6(12) 1,331,010 1 1,511,552 1
1780 Intangible assets, net 6(13) 702,559 1 449,841 -
1840 Deferred income tax assets 6(29) 1,307,316 1 1,188,197 1
1900 Other non-current assets
6(6)(14)
and 8 2,564,487 2 2,962,022 2
15XX Total non-current assets 25,647,847 20 26,157,354 19
1XXX Total assets 127,831,170$ 100 134,787,518$ 100
(Continued)
SYNNEX TECHNOLOGY INTERNATIONAL CORPORATION AND SUBSIDIARIES
CONSOLIDATED BALANCE SHEETS
DECEMBER 31, 2016 AND 2015
(EXPRESSED IN THOUSANDS OF NEW TAIWAN DOLLARS)
December 31, 2016 December 31, 2015

88
Liabilities and Equity Notes Amount % Amount %
Current liabilities
2100 Short-term borrowings 6(15) 38,687,813$ 30 47,654,101$ 36
2110 Short-term notes and bills payable 6(16) 5,420,000 4 5,300,000 4
2120
Financial liabilities at fair value through profit or loss
-current 6(2) - - 7,684 -
2150 Notes payable 7 1,564,010 1 1,252,099 1
2170 Accounts payable 29,540,632 23 28,783,381 21
2180 Accounts payable-related parties 7 - - 12,196 -
2200 Other payables 6(17) 6,749,042 6 5,842,171 4
2220 Other payables-related parties 7 3,953 - 8,809 -
2230 Current income tax liabilities 6(29) 1,043,353 1 1,229,110 1
2300 Other current liabilities 314,517 - 255,156 -
21XX Total current liabilities 83,323,320 65 90,344,707 67
Non-current liabilities
2570 Deferred income tax liabilities 6(29) 144,304 - 111,979 -
2600 Other non-current liabilities 6(18) 481,050 1 455,540 -
25XX Total non-current liabilities 625,354 1 567,519 -
2XXX Total liabilities 83,948,674 66 90,912,226 67
Equity attributable to owners of parent
Share capital 6(19)
3110 Share capital-common stock 16,679,470 13 15,885,209 12
Capital surplus 6(20)
3200 Capital surplus 14,196,063 11 14,139,722 10
Retained earnings 6(21)
3310 Legal reserve 6,415,402 5 6,096,802 5
3320 Special reserve 126,513 - - -
3350 Unappropriated retained earnings 7,992,064 6 6,823,082 5
Other equity interest 6(22)
3400 Other equity interest 2,837,318)( 2)( 126,513)( -
31XX Equity attributable to owners of the parent 42,572,194 33 42,818,302 32
36XX Non-controlling interest 1,310,302 1 1,056,990 1
3XXX Total equity 43,882,496 34 43,875,292 33
S ignificant contingent liabilities and unrecognized
contract commitments 9
3X2X Significant events after the balance sheet date 11
Total liabilities and equity 127,831,170$ 100 134,787,518$ 100
The accompanying notes are an integral part of these consolidated financial statements.
See report of independent accountants dated March 17, 2017.
SYNNEX TECHNOLOGY INTERNATIONAL CORPORATION AND SUBSIDIARIES
CONSOLIDATED BALANCE SHEETS
DECEMBER 31, 2016 AND 2015
(EXPRESSED IN THOUSANDS OF NEW TAIWAN DOLLARS)
December 31, 2016 December 31, 2015

89
Notes Amount % Amount %
4000 O perating revenues 6(23) and 7 342,696,453$ 100 322,133,452$ 100
5000 O perating costs 6(9) 330,565,489)( 97)( 310,541,679)( 97)(
5950 Gross profit, net 12,130,964 3 11,591,773 3
O perating expenses 6(18)(27)(28)
6100 Selling expenses 4,301,741)( 1)( 4,357,619)( 1)(
6200 General and administrative expenses 3,559,991)( 1)( 3,285,583)( 1)(
6000 Total operating expenses 7,861,732)( 2)( 7,643,202)( 2)(
6900 O perating income 4,269,232 1 3,948,571 1
Non-operating income and expenses
7010 Other income 6(24) 1,297,200 - 1,909,629 1
7020 Other gains and losses 6(25) 647,223)( - 2,693,726)( 1)(
7050 Finance costs 6(26) 656,692)( - 831,145)( -
7060 Share of profit of associates and joint ventures accounted for under
the equity method 6(10) 1,462,960 1 1,404,223 -
7000 Total non-operating income and expenses 1,456,245 1 211,019)( -
7900 Profit before tax 5,725,477 2 3,737,552 1
7950 Income tax expense 6(29) 600,741)( - 318,875)( -
8200 Profit 5,124,736$ 2 3,418,677$ 1
O ther comprehensive income
Components of other comprehensive income that will not be
reclassified to profit or loss
8311 Gains (losses) on remeasurements of defined benefit plans 22,502)($ - 11,426)($ -
8349 Income tax related to components of other comprehensive
income that will not be reclassified to profit or loss 6(29) 3,785 - 1,563 -
8310 Components of other comprehensive (loss) income that will
not be reclassified to profit or loss 18,717)( - 9,863)( -
Components of other comprehensive income that will be
reclassified to profit or loss
8361 Cumulative translation differences of foreign operations 6(22) 2,788,753)( 1)( 85,034)( -
8362 Unrealized loss on valuation of available-for-sale financial assets 6(3)(22) 263,666 - 116,226)( -
8370 Share of other comprehensive income of associates and joint
ventures accounted for using equity method, components of
other comprehensive income that will be reclassified to profit
or loss 6(10)(22) 180,463)( - 106,669)( -
8360 Components of other comprehensive (loss) income that will be
reclassified to profit or loss 2,705,550)( 1)( 307,929)( -
8300 Other comprehensive loss for the year, net of tax 2,724,267)($ 1)( 317,792)($ -
8500 Total comprehensive income for the year 2,400,469$ 1 3,100,885$ 1
Profit, attributable to:
8610 Owners of parent 4,876,679$ 2 3,185,995$ 1
8620 Non-controlling interest 248,057 - 232,682 -
Profit 5,124,736$ 2 3,418,677$ 1
Comprehensive income attributable to:
8710 Owners of parent 2,147,157$ 1 2,925,730$ 1
8720 Non-controlling interest 253,312 - 175,155 -
Total comprehensive income for the year 2,400,469$ 1 3,100,885$ 1
Earnings per share
9750 Basic earnings per share 6(29)
9850 Diluted earnings per share 6(29)
See report of independent accountants dated March 17, 2017.
SYNNEX TECHNOLOGY INTERNATIONAL CORPORATION AND SUBSIDIARIES
CONSOLIDATED STATEMENTS OF COMPREHENSIVE INCOME
YEARS ENDED DECEMBER 31, 2016 AND 2015
(EXPRESSED IN THOUSANDS OF NEW TAIWAN DOLLARS, EXCEPT FOR EARNINGS PER SHARE AMOUNTS)
Years ended December 31,
2016 2015
2.92$ 1.91$
2.92$ 1.91$
The accompanying notes are an integral part of these consolidated financial statements.
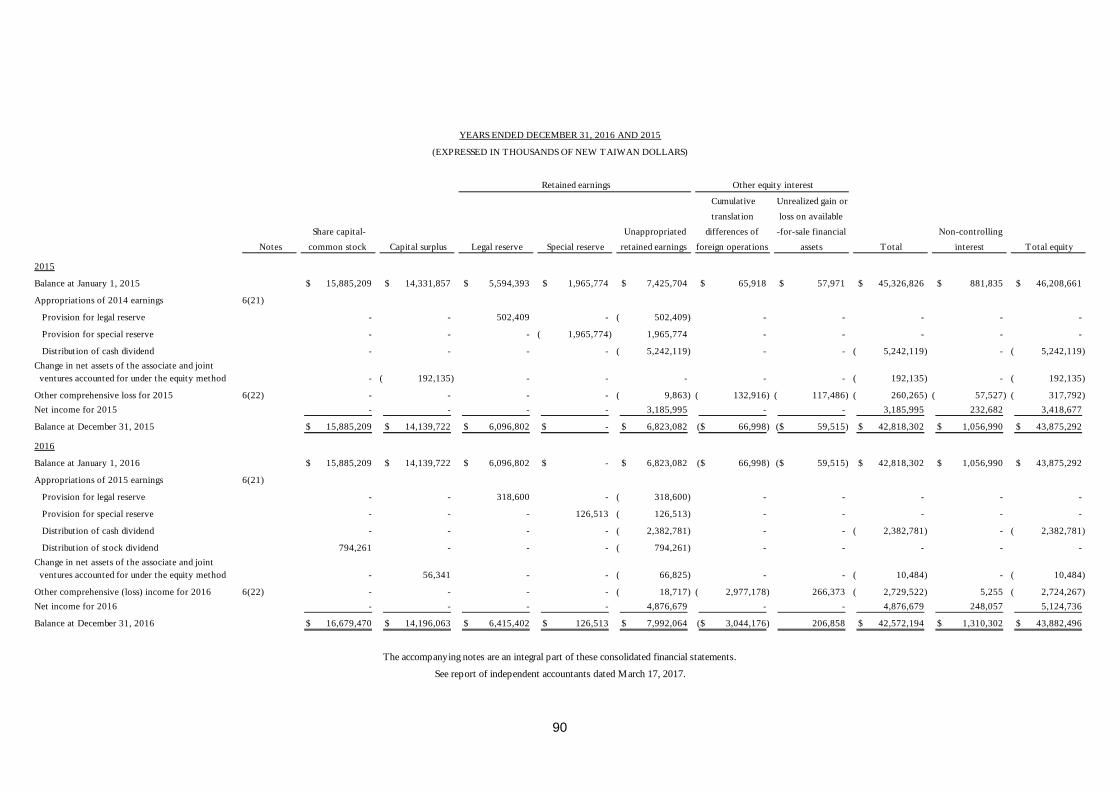
90
Notes
Share capital-
common stock Capital surplus Legal reserve Special reserve
Unappropriated
retained earnings
Cumulative
translation
differences of
foreign operations
Unrealized gain or
loss on available
-for-sale financial
assets Total
Non-controlling
interest Total equity
2015
Balance at January 1, 2015 15,885,209$ 14,331,857$ 5,594,393$ 1,965,774$ 7,425,704$ 65,918$ 57,971$ 45,326,826$ 881,835$ 46,208,661$
Appropriations of 2014 earnings 6(21)
Provision for legal reserve - - 502,409 - 502,409)( - - - - -
Provision for special reserve - - - 1,965,774)( 1,965,774 - - - - -
Distribution of cash dividend - - - - 5,242,119)( - - 5,242,119)( - 5,242,119)(
Change in net assets of the associate and joint
ventures accounted for under the equity method - 192,135)( - - - - - 192,135)( - 192,135)(
Other comprehensive loss for 2015 6(22) - - - - 9,863)( 132,916)( 117,486)( 260,265)( 57,527)( 317,792)(
Net income for 2015 - - - - 3,185,995 - - 3,185,995 232,682 3,418,677
Balance at December 31, 2015 15,885,209$ 14,139,722$ 6,096,802$ -$ 6,823,082$ 66,998)($ 59,515)($ 42,818,302$ 1,056,990$ 43,875,292$
2016
Balance at January 1, 2016 15,885,209$ 14,139,722$ 6,096,802$ -$ 6,823,082$ 66,998)($ 59,515)($ 42,818,302$ 1,056,990$ 43,875,292$
Appropriations of 2015 earnings 6(21)
Provision for legal reserve - - 318,600 - 318,600)( - - - - -
Provision for special reserve - - - 126,513 126,513)( - - - - -
Distribution of cash dividend - - - - 2,382,781)( - - 2,382,781)( - 2,382,781)(
Distribution of stock dividend 794,261 - - - 794,261)( - - - - -
Change in net assets of the associate and joint
ventures accounted for under the equity method - 56,341 - - 66,825)( - - 10,484)( - 10,484)(
Other comprehensive (loss) income for 2016 6(22) - - - - 18,717)( 2,977,178)( 266,373 2,729,522)( 5,255 2,724,267)(
Net income for 2016 - - - - 4,876,679 - - 4,876,679 248,057 5,124,736
Balance at December 31, 2016 16,679,470$ 14,196,063$ 6,415,402$ 126,513$ 7,992,064$ 3,044,176)($ 206,858 42,572,194$ 1,310,302$ 43,882,496$
The accompanying notes are an integral part of these consolidated financial statements.
See report of independent accountants dated March 17, 2017.
YEARS ENDED DECEMBER 31, 2016 AND 2015
(EXPRESSED IN THOUSANDS OF NEW TAIWAN DOLLARS)
Retained earnings Other equity interest

91
Notes 2016 2015
CASH FLOWS FROM OPERATING ACTIVITIES
Profit before income tax for the year 5,725,477$ 3,737,552$
Adjustments to reconcile profit before income tax to net cash (used in)
provided by operating activities
Income and expenses having no effect on cash flows
Depreciation 6(11)(27) 347,261 310,258
Amortization 6(13)(27) 57,596 31,981
Amortization of land use rights 6(14) 21,610 -
Provision for bad debts expense 6(5)(6) 379,780 1,050,386
Net gain on financial assets/liabilities at fair value through profit
or loss6(2)(25) 103,820)( 18,437)(
Decline in (gain from reversal of) market value and loss for obsolete and
slow-moving inventories6(9) 13,408 40,569)(
Loss on obsolescence 6(9) 5,941 5,449
Interest expense 6(26) 656,692 831,145
Interest income 6(24) 429,641)( 1,027,500)(
Dividend income 6(24) 143,936)( 124,749)(
Gain on disposal of financial asset investments 6(25) 135,699)( -
Impairment loss on financial assets 6(25) 40,000 85,000
Share of profit of associates and joint ventures accounted for under the
equity method6(10) 1,462,960)( 1,404,223)(
Cash dividends on investments accounted for under the equity method 302,920 282,889
Gain on disposal of investments accounted for under the equity
method 127,709)( -
Loss on remeasurement recognition of investments accounted for under
the equity method at fair value6(25)(31) 42,359 -
Loss on disposal of property, plant and equipment and investment
property6(25) 303 12,739
Depreciation of investment property 6(12) 62,411 63,942
Changes in assets/liabilities relating to operating activities
Net changes in assets relating to operating activities
Financial assets at fair value through profit or loss 13,934)( 391,320)(
Notes and accounts receivable 545,345)( 1,181,364)(
Inventories 2,210,520 4,041,646)(
Other receivables 483,004 314,521)(
Prepayments 393,035 4,582
Other current assets 334,430 251,729
Overdue receivables 71,577)( 883,799)(
Long-term lease and installment receivables 22,988 -
Net changes in liabilities relating to operating activities
Notes and accounts payable 438,042 651,601)(
Other payables 730,522 722,012)(
Other current liabilities 52,330 69,505)(
Other non-current liabilities 36,557 12,049
Cash inflow (outflow) generated from operations 9,322,565 4,191,545)(
Interest paid 667,896)( 834,406)(
Interest received 429,641 1,027,500
Dividend received 143,936 124,749
Income tax paid 972,001)( 926,725)(
Net cash provided by (used in) operating activities 8,256,245 4,800,427)(
(Continued)
SYNNEX TECHNOLOGY INTERNATIONAL CORPORATION AND SUBSIDIARIES
CONSOLIDATED STATEMENTS OF CASH FLOWS
YEARS ENDED DECEMBER 31, 2016 AND 2015
(EXPRESSED IN THOUSANDS OF NEW TAIWAN DOLLARS)
Years ended December 31,

92
Notes 2016 2015
CASH FLOWS FROM INVESTING ACTIVITIES
Proceeds from disposal of available-for-sale financial assets 232,517$ -$
Proceeds from capital reduction of financial assets carried at cost 114,827 800
Proceeds from disposal of investments accounted for using equity method 250,357 -
Net cash flow from acquisition of subsidiaries 6(31) 945,088)( -
Acquisition of property, plant and equipment 513,982)( 970,911)(
Proceeds from disposal of property, plant and equipment and investment
property7,780 34,353
Increase in investment property 438)( 3,969)(
Acquisition of intangible assets 6(33) 86,271)( 31,287)(
(Increase) decrease in refundable deposits 465,345)( 19,621
Decrease (increase) in restricted time deposits 799,858 202,397)(
(Increase) decrease in other non-current assets 132,281)( 4,535
Net cash used in investing activities 738,066)( 1,149,255)(
CASH FLOWS FROM FINANCING ACTIVITIES
(Decrease) increase in short-term loans 9,216,677)( 7,687,743
Decrease in short-term notes and bills payable 180,000)( 1,130,000)(
Decrease in guarantee deposits received 31,642)( 68,873)(
Decrease in long-term loans - 4,041,750)(
Payment of cash dividends 6(21) 2,382,781)( 5,242,119)(
Net cash used in financing activities 11,811,100)( 2,794,999)(
Effects of changes in foreign exchange rates 2,131,414)( 11,150
Decrease in cash and cash equivalents 6,424,335)( 8,733,531)(
Cash and cash equivalents at beginning of the year 13,898,657 22,632,188
Cash and cash equivalents at end of the year 7,474,322$ 13,898,657$
See report of independent accountants dated March 17, 2017.
SYNNEX TECHNOLOGY INTERNATIONAL CORPORATION AND SUBSIDIARIES
CONSOLIDATED STATEMENTS OF CASH FLOWS
YEARS ENDED DECEMBER 31, 2016 AND 2015
(EXPRESSED IN THOUSANDS OF NEW TAIWAN DOLLARS)
Years ended December 31,
The accompanying notes are an integral part of these consolidated financial statements.
93
SYNNEX TECHNOLOGY INTERNATIONAL CORPORATION AND SUBSIDIARIES
NOTES TO CONSOLIDATED FINANCIAL STATEMENTS
DECEMBER 31, 2016 AND 2015
(EXPRESSED IN THOUSANDS OF NEW TAIWAN DOLLARS,
EXCEPT AS OTHERWISE INDICATED)
1. HISTORYAND ORGANIZATION
Synnex Technology International Corporation (the “Company”) was incorporated in September 1988
under the provisions of the Company Law of the Republic of China (R.O.C.). The Company and its
subsidiaries (collectively referred herein as the “Group”) are primarily engaged in:
A. Assembly and sale of computers and computer peripherals;
B. Sale of communication products;
C. Sale of consumer electronic products;
D. Sale of electronic products and components; and
E. Maintenance services for the products mentioned above.
The Company's shares have been traded on the Taiwan Stock Exchange since December 1995.
2. THE DATE OF AUTHORIZATION FOR ISSUANCE OF THE CONSOLIDATED FINANCIAL
STATEMENTS AND PROCEDURES FOR AUTHORIZATION
These consolidated financial statements were authorized for issuance by the Board of Directors on
March 17, 2017.
3. APPLICATION OF NEW STANDARDS, AMENDMENTS AND INTERPRETATIONS
(1) Effect of the adoption of new issuances of or amendments to International Financial Reporting
Standards (“IFRSs”) as endorsed by the Financial Supervisory Commission (“FSC”)
None.
(2) Effect of new issuances of or amendments to IFRSs as endorsed by the FSC but not yet adopted by
the Group
New standards, interpretations and amendments endorsed by FSC effective from 2017 are as
follows:

94
New Standards, Interpretations and Amendments
Effective Date by
International Accounting
Standards Board
Investment entities: applying the consolidation exception
(amendments to IFRS 10, IFRS 12 and IAS 28)
January 1, 2016
Accounting for acquisition of interests in joint operations
(amendments to IFRS 11)
January 1, 2016
IFRS 14,‘Regulatory deferral accounts’ January 1, 2016
Disclosure initiative (amendments to IAS 1) January 1, 2016
Clarification of acceptable methods of depreciation and amortization
(amendments to IAS 16 and IAS 38)
January 1, 2016
Agriculture: bearer plants (amendments to IAS 16 and IAS 41) January 1, 2016
Defined benefit plans: employee contributions (amendments to IAS
19R)
July 1, 2014
Equity method in separate financial statements (amendments to IAS
27)
January 1, 2016
Recoverable amount disclosures for non-financial assets
(amendments to IAS 36)
January 1, 2014
Novation of derivatives and continuation of hedge accounting
(amendments to IAS 39)
January 1, 2014
IFRIC 21, ‘Levies’ January 1, 2014
Improvements to IFRSs 2010-2012 July 1, 2014
Improvements to IFRSs 2011-2013 July 1, 2014
Improvements to IFRSs 2012-2014 January 1, 2016
The above standards and interpretations have no significant impact to the Group’s financial
condition and operating result based on the Group’s assessment.
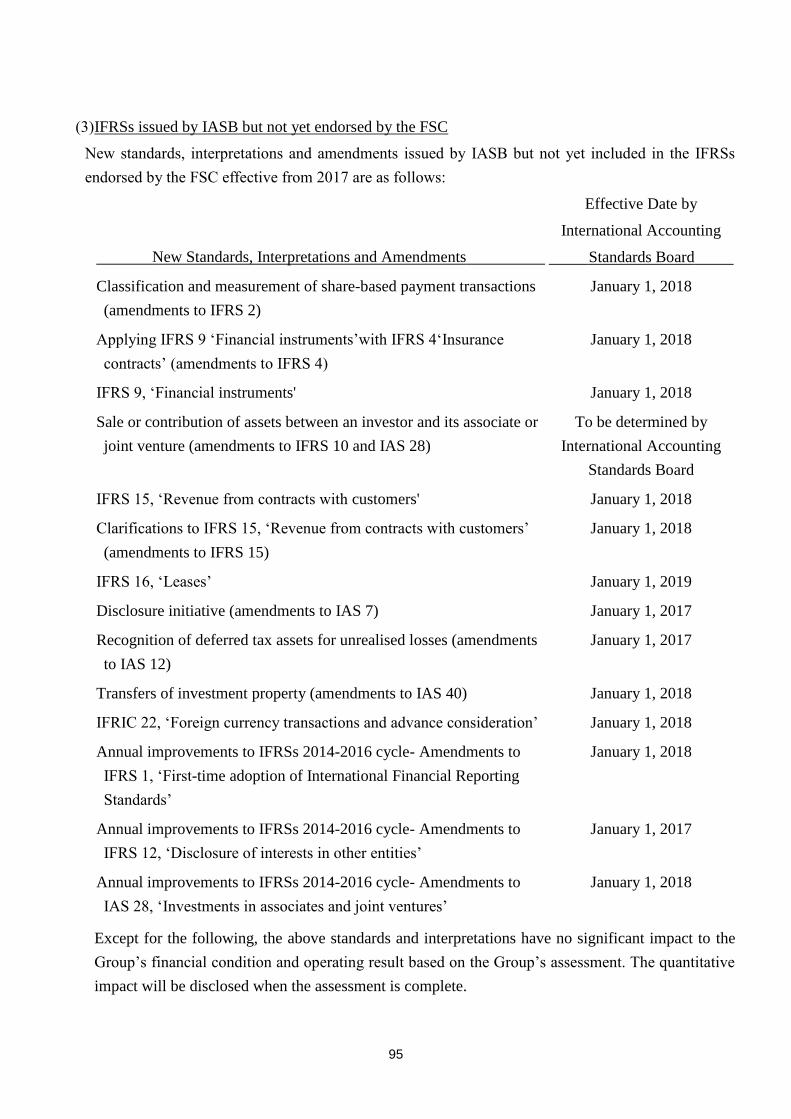
95
(3) IFRSs issued by IASB but not yet endorsed by the FSC
New standards, interpretations and amendments issued by IASB but not yet included in the IFRSs
endorsed by the FSC effective from 2017 are as follows:
New Standards, Interpretations and Amendments
Effective Date by
International Accounting
Standards Board
Classification and measurement of share-based payment transactions
(amendments to IFRS 2)
January 1, 2018
Applying IFRS 9 ‘Financial instruments’with IFRS 4‘Insurance
contracts’ (amendments to IFRS 4)
January 1, 2018
IFRS 9, ‘Financial instruments' January 1, 2018
Sale or contribution of assets between an investor and its associate or
joint venture (amendments to IFRS 10 and IAS 28)
To be determined by
International Accounting
Standards Board
IFRS 15, ‘Revenue from contracts with customers' January 1, 2018
Clarifications to IFRS 15, ‘Revenue from contracts with customers’
(amendments to IFRS 15)
January 1, 2018
IFRS 16, ‘Leases’ January 1, 2019
Disclosure initiative (amendments to IAS 7) January 1, 2017
Recognition of deferred tax assets for unrealised losses (amendments
to IAS 12)
January 1, 2017
Transfers of investment property (amendments to IAS 40) January 1, 2018
IFRIC 22, ‘Foreign currency transactions and advance consideration’ January 1, 2018
Annual improvements to IFRSs 2014-2016 cycle- Amendments to
IFRS 1, ‘First-time adoption of International Financial Reporting
Standards’
January 1, 2018
Annual improvements to IFRSs 2014-2016 cycle- Amendments to
IFRS 12, ‘Disclosure of interests in other entities’
January 1, 2017
Annual improvements to IFRSs 2014-2016 cycle- Amendments to
IAS 28, ‘Investments in associates and joint ventures’
January 1, 2018
Except for the following, the above standards and interpretations have no significant impact to the
Group’s financial condition and operating result based on the Group’s assessment. The quantitative
impact will be disclosed when the assessment is complete.

96
A. IFRS 9, ‘Financial instruments’
(a) Classification of debt instruments is driven by the entity’s business model and the contractual
cash flow characteristics of the financial assets, which would be classified as financial asset at
fair value through profit or loss, financial asset measured at fair value through other
comprehensive income or financial asset measured at amortised cost. Equity instruments would
be classified as financial asset at fair value through profit or loss, unless an entity makes an
irrevocable election at inception to present in other comprehensive income subsequent changes
in the fair value of an investment in an equity instrument that is not held for trading.
(b) The impairment losses of debt instruments are assessed using an ‘expected credit loss’ approach.
An entity assesses at each balance sheet date whether there has been a significant increase in
credit risk on that instrument since initial recognition to recognise 12-month expected credit
losses or lifetime expected credit losses (interest revenue would be calculated on the gross
carrying amount of the asset before impairment losses occurred); or if the instrument that has
objective evidence of impairment, interest revenue after the impairment would be calculated on
the book value of net carrying amount (i.e. net of credit allowance). The Company shall always
measure the loss allowance at an amount equal to lifetime expected credit losses for trade
receivables that do not contain a significant financing component.
B. IFRS 15, ‘Revenue from contracts with customers’
IFRS 15, ‘Revenue from contracts with customers’ replaces IAS 11 ‘Construction contracts’,
IAS 18 ‘Revenue’ and relevant interpretations. According to IFRS 15, revenue is recognised
when a customer obtains control of promised goods or services. A customer obtains control of
goods or services when a customer has the ability to direct the use of, and obtain substantially all
of the remaining benefits from, the asset.
The core principle of IFRS 15 is that an entity recognises revenue to depict the transfer of
promised goods or services to customers in an amount that reflects the consideration to which
the entity expects to be entitled in exchange for those goods or services. An entity recognises
revenue in accordance with that core principle by applying the following steps:
Step 1: Identify contracts with customer.
Step 2: Identify separate performance obligations in the contract(s).
Step 3: Determine the transaction price.
Step 4: Allocate the transaction price.
Step 5: Recognise revenue when the performance obligation is satisfied.
97
Further, IFRS 15 includes a set of comprehensive disclosure requirements that requires an entity
to disclose sufficient information to enable users of financial statements to understand the nature,
amount, timing and uncertainty of revenue and cash flows arising from contracts with customers.
C. Amendments to IFRS 15, ‘Clarifications to IFRS 15 Revenue from Contracts with Customers‘
The amendments clarify how to identify a performance obligation (the promise to transfer a good
or a service to a customer) in a contract; determine whether a company is a principal (the
provider of a good or service) or an agent (responsible for arranging for the good or service to be
provided); and determine whether the revenue from granting a licence should be recognised at a
point in time or over time. In addition to the clarifications, the amendments include two
additional reliefs to reduce cost and complexity for a company when it first applies the new
Standard.
D. IFRS 16, ‘Leases’
IFRS 16, ‘Leases’, replaces IAS 17, ‘Leases’ and related interpretations and SICs. The standard
requires lessees to recognise a 'right-of-use asset' and a lease liability (except for those leases
with terms of 12 months or less and leases of low-value assets). The accounting stays the same
for lessors, which is to classify their leases as either finance leases or operating leases and
account for those two types of leases differently. IFRS 16 only requires enhanced disclosures to
be provided by lessors.
E. Amendments to IAS 7, ‘Disclosure initiative’
This amendment requires that an entity shall provide more disclosures related to changes in
liabilities arising from financing activities, including both changes arising from cash flows and
non-cash changes.
4. SUMMARY OF SIGNIFICANT ACCOUNTING POLICIES
The principal accounting policies applied in the preparation of these consolidated financial statements
are set out below. These policies have been consistently applied to all the periods presented, unless
otherwise stated.
(1) Compliance statement
The consolidated financial statements of the Group have been prepared in accordance with the
“Regulations Governing the Preparation of Financial Reports by Securities Issuers” and the
International Financial Reporting Standards, International Accounting Standards, IFRIC
Interpretations, and SIC Interpretations as endorsed by the FSC (collectively referred herein as the
“IFRSs”).

98
(2) Basis of preparation
A. Except for the following items, these consolidated financial statements have been prepared under
the historical cost convention:
(a) Financial assets and financial liabilities (including derivative instruments) at fair value through
profit or loss.
(b) Available-for-sale financial assets measured at fair value.
(c) Defined benefit liabilities recognised based on the net amount of pension fund assets less
present value of defined benefit obligation.
B. The preparation of financial statements in conformity with IFRSs requires the use of certain
critical accounting estimates. It also requires management to exercise its judgment in the process
of applying the Group’s accounting policies. The areas involving a higher degree of judgment or
complexity, or areas where assumptions and estimates are significant to the consolidated financial
statements are disclosed in Note 5
(3) Basis of consolidation
A. Basis for preparation of consolidated financial statements:
(a) All subsidiaries are included in the Group’s consolidated financial statements. Subsidiaries are
all entities (including structured entities) controlled by the Group. The Group controls an entity
when the Group is exposed, or has rights, to variable returns from its involvement with the
entity and has the ability to affect those returns through its power over the entity. Consolidation
of subsidiaries begins from the date the Group obtains control of the subsidiaries and ceases
when the Group loses control of the subsidiaries.
(b) Inter-company transactions, balances and unrealised gains or losses on transactions between
companies within the Group are eliminated. Accounting policies of subsidiaries have been
adjusted where necessary to ensure consistency with the policies adopted by the Group.
(c) Profit or loss and each component of other comprehensive income are attributed to the owners
of the parent and to the non-controlling interests. Total comprehensive income is attributed to
the owners of the parent and to the non-controlling interests even if this results in the
non-controlling interests having a deficit balance.
(d) Changes in a parent’s ownership interest in a subsidiary that do not result in the parent losing
control of the subsidiary (transactions with non-controlling interests) are accounted for as equity
transactions, i.e. transactions with owners in their capacity as owners. Any difference between
the amount by which the non-controlling interests are adjusted and the fair value of the
consideration paid or received is recognised directly in equity.

99
(e) When the Group loses control of a subsidiary, the Group remeasures any investment retained in
the former subsidiary at its fair value. That fair value is regarded as the fair value on initial
recognition of a financial asset or the cost on initial recognition of the associate or joint venture.
Any difference between fair value and carrying amount is recognised in profit or loss. All
amounts previously recognised in other comprehensive income in relation to the subsidiary are
reclassified to profit or loss on the same basis as would be required if the related assets or
liabilities were disposed of. That is, when the Group loses control of a subsidiary, all gains or
losses previously recognised in other comprehensive income in relation to the subsidiary should
be reclassified from equity to profit or loss, if such gains or losses would be reclassified to profit
or loss when the related assets or liabilities are disposed of.
B. Subsidiaries included in the consolidated financial statements:
December 31, 2016 and 2015:
Ownership (%)
Name of investor Name of subsidiary
Main business
Activities
December
31, 2016
December
31, 2015 Description
Synnex Technology
International Corporation
Synnex Global Ltd. Investment holding
company
100 100 PwC
Synnex Technology
International Corporation
Seper Marketing
Corporation
Sales of computers
and computer
peripherals
100 100 PwC
Synnex Technology
International Corporation
E-Fan Investments
CO., LTD.
Investment company 100 100 PwC
Synnex Technology
International Corporation
Synlogics Service
Corporation (Note
2)
Freight forwarders 100 - PwC
Synnex Technology
International Corporation
Bestcom Infotech
Corp.(Note 3)
Sales of computers
and computer
peripherals
100 40.86 PwC
Bestcom Infotech Corp. Bizwave Tech Co.,
Ltd. (Note 3)
Retailing of
computer software,
accreditation
service and
consulting services
100 - PwC
Bestcom Infotech Corp. Bestcom Infotech
Holding Ltd. (Note
3)
Investment holding
company
100 - PwC
Bestcom Infotech Holding
Ltd.
Bestcom
International Ltd.
(Note 3)
Investment holding
company
100 - PwC
Bestcom International Ltd. Bestcom Infotech
Shanghai Ltd.
(Note 3)
Sales of computers
and computer
peripherals,
maintenance and
consulting services
100 - PwC
Synnex Global Ltd. King's Eye
Investments Ltd.
Investment holding
company
100 100 PwC

100
Ownership (%)
Name of investor Name of subsidiary
Main business
Activities
December
31, 2016
December
31, 2015 Description
Synnex Global Ltd. Peer Developments
Ltd.
Investment holding
company
100 100 PwC
Synnex Global Ltd. Synnex Mauritius
Ltd.
Investment holding
company
100 100 PwC
Synnex Global Ltd. Synnex China
Holdings Ltd.
Investment holding
company
100 100 PwC
Synnex Global ltd. Trade Vanguard
Global Ltd.
Investment holding
company
100 100 PwC
King's Eye Investments
Ltd.
Laser Computer
Holdings Ltd.
Investment holding
company
100 100 PwC
King's Eye Investments
Ltd.
Synnex Australia
Pty. Ltd.
Sales of computers
and computer
peripherals
100 100 PwC
King's Eye Investments
Ltd.
Synnex New
Zealand Ltd.
Sales of computers
and computer
peripherals
100 100 PwC
King's Eye Investments
Ltd.
Synnex Electronics
Hong Kong Ltd.
Sales of electronic
components
100 100 PwC
King's Eye Investments
Ltd.
Syntech Asia Ltd. Sales of electronic
components
100 100 PwC
King's Eye Investments
Ltd.
Fortune Ideal Ltd. Real estate
investments
100 100 Other
King's Eye Investments
Ltd.
Golden Thinking Ltd. Real estate
investments
100 100 Other
King's Eye Investments
Ltd.
PT. Synnex
Metrodata
Indonesia
Sales of computers
and computer
peripherals
50.3 50.3 PwC
Laser Computer Holdings
Ltd.
Laser Computer
(China) Ltd.
Sales of computers
and computer
peripherals
100 100 PwC
Laser Computer Holdings
Ltd.
Synnex Technology
International (HK)
Ltd.
Sales of computers
and computer
peripherals
100 100 PwC
Peer Developments Ltd. LianXiang
Technology
(Shenzhen) Ltd.
Sales of electronic
components
100 100 PwC
Synnex China Holdings
Ltd.
Synnex Investments
(China) Ltd.
Investment holding
company
100 100 PwC
Synnex Investments
(China) Ltd.
Synnex Distributions
(China) Ltd.
Sale of computers
and computer
peripherals
100 100 PwC
Synnex Investments
(China) Ltd.
Synnex (Beijing)
Ltd.
Sale of computers
and computer
peripherals
100 100 PwC
Synnex Investments
(China) Ltd.
Synnex (Shanghai)
Ltd.
Sale of computers
and computer
peripherals
100 100 PwC
Synnex Investments
Sale of computers

101
Ownership (%)
Name of investor Name of subsidiary
Main business
Activities
December
31, 2016
December
31, 2015 Description
(China) Ltd. Synnex (Tianjin)
Ltd.
and computer
peripherals
100 100 PwC
Synnex Investments
(China) Ltd.
Synnex (Chengdu)
Ltd.
Sale of computers
and computer
peripherals
100 100 PwC
Synnex Investments
(China) Ltd.
Synnex (Nanjing)
Ltd.
Sale of computers
and computer
peripherals
100 100 PwC
Synnex Investments
(China) Ltd.
Synnex (Shenyang)
Ltd.
Sale of computers
and computer
peripherals
100 100 PwC
Synnex Investments
(China) Ltd.
Synnex (Hangzhou)
Ltd.
Sale of computers
and computer
peripherals
100 100 PwC
Synnex Investments
(China) Ltd.
Synnex (Qingdao)
Ltd.
Sale of computers
and computer
peripherals
100 100 PwC
Synnex Investments
(China) Ltd.
Synnex (Guangzhou)
Ltd.
Sale of computers
and computer
peripherals
100 100 PwC
Synnex Investments
(China) Ltd.
Synnex (Xi’an) Ltd. Sale of computers
and computer
peripherals
100 100 PwC
Synnex Investments
(China) Ltd.
Synnex (Suzhou)
Ltd.
Sale of computers
and computer
peripherals
100 100 PwC
Synnex Investments
(China) Ltd.
Synnex (Wuhan) Ltd. Sale of computers
and computer
peripherals
100 100 PwC
Synnex Investments
(China) Ltd.
Synnex (Jinan) Ltd. Sale of computers
and computer
peripherals
100 100 PwC
Synnex Investments
(China) Ltd.
Synnex (Changsha)
Ltd.
Sale of computers
and computer
peripherals
100 100 PwC
Synnex Investments
(China) Ltd.
Synnex (Zhengzhou)
Ltd.
Sale of computers
and computer
peripherals
100 100 PwC
Synnex Investments
(China) Ltd.
Synnex (Ningbo)
Ltd.
Sale of computers
and computer
peripherals
100 100 PwC
Synnex Investments
(China) Ltd.
Synnex (Hefei) Ltd. Sale of computers
and computer
peripherals
100 100 PwC
Synnex Investments
(China) Ltd.
Synnex (Nanchang)
Ltd.
Sale of computers
and computer
peripherals
100 100 PwC
Synnex Investments
Synnex (Harbing)
Sale of computers
100
100
PwC

102
Ownership (%)
Name of investor Name of subsidiary
Main business
Activities
December
31, 2016
December
31, 2015 Description
(China) Ltd. Ltd. and computer
peripherals
Synnex Investments
(China) Ltd.
Synnex (Chongqing)
Ltd.
Sale of computers
and computer
peripherals
100 100 PwC
Synnex Investments
(China) Ltd.
Synnex (Xiamen)
Ltd.
Sale of computers
and computer
peripherals
100 100 PwC
Synnex Investments
(China) Ltd.
Yude (Shanghai)
Warehouse Co., Ltd.
Warehouse services 80 80 PwC
Synnex Distributions
(China) Ltd.
YD Information
Technology (SH)
LTD. (Note 1)
Information
technology service
and sale of
computers and
computer
peripherals
100 100 PwC
Synnex Distributions
(China) Ltd.
Synnex Technology
Development
(Beijing) Ltd.
Sale of computers
and computer
peripherals
100 100 PwC
Note 1: These companies were incorporated in 2015.
Note 2: These companies were incorporated in 2016.
Note 3: The Company acquired Bestcom Infotech Corp., an equity investment accounted under
equity method, by tender offer. The original ownership ratio was 40.86% before the
tender offer and after the acquisition, the Company obtained 100% share ownership of
Bestcom Infotech Corp. As of April 7, 2016, Bestcom Infotech Corp. and its
subsidiaries shall be included in the consolidated entities.
C. Subsidiaries not included in the consolidated financial statements: None.
D. Adjustments for subsidiaries with different balance sheet dates: None.
E. Significant restrictions: None.
F. Subsidiaries that have non-controlling interests that are material to the Group: None.

103
(4) Foreign currency translation
Items included in the financial statements of each of the Group’s entities are measured using the
currency of the primary economic environment in which the entity operates (the “functional
currency”). The consolidated financial statements are presented in New Taiwan dollars, which is the
Company’s functional and the Group’s presentation currency.
A. Foreign currency transactions and balances
(a) Foreign currency transactions are translated into the functional currency using the exchange
rates prevailing at the dates of the transactions or valuation where items are remeasured. Foreign
exchange gains and losses resulting from the settlement of such transactions are recognised in
profit or loss in the period in which they arise.
(b) Monetary assets and liabilities denominated in foreign currencies at the period end are
re-translated at the exchange rates prevailing at the balance sheet date. Exchange differences
arising upon re-translation at the balance sheet date are recognised in profit or loss.
(c) Non-monetary assets and liabilities denominated in foreign currencies held at fair value through
profit or loss are re-translated at the exchange rates prevailing at the balance sheet date; their
translation differences are recognised in profit or loss. Non-monetary assets and liabilities
denominated in foreign currencies held at fair value through other comprehensive income are
re-translated at the exchange rates prevailing at the balance sheet date; their translation
differences are recognised in other comprehensive income. However, non-monetary assets and
liabilities denominated in foreign currencies that are not measured at fair value are translated
using the historical exchange rates at the dates of the initial transactions.
(d) All foreign exchange gains and losses are presented in the statement of comprehensive income
within ‘other gains and losses’.
B. Translation of foreign operations
(a) The operating results and financial position of all the group entities and associates that have a
functional currency different from the presentation currency are translated into the presentation
currency as follows:
i. Assets and liabilities for each balance sheet presented are translated at the closing exchange
rate at the date of that balance sheet;
ii. Income and expenses for each statement of comprehensive income are translated at average
exchange rates of that period; and
iii. All resulting exchange differences are recognised in other comprehensive income.

104
(b) When the foreign operation partially disposed of or sold is an associate, exchange differences
that were recorded in other comprehensive income are proportionately reclassified to profit or
loss as part of the gain or loss on sale. In addition, even when the Group still retains partial
interest in the former foreign associate after losing significant influence over the former foreign
associate, such transactions should be accounted for as disposal of all interest in these foreign
operations.
(c) When the foreign operation partially disposed of or sold is a subsidiary, cumulative exchange
differences that were recorded in other comprehensive income are proportionately transferred to
the non-controlling interest in this foreign operation. In addition, even when the Group still
retains partial interest in the former foreign subsidiary after losing control of the former foreign
subsidiary, such transactions should be accounted for as disposal of all interest in the foreign
operation.
(5) Classification of current and non-current items
A. Assets that meet one of the following criteria are classified as current assets; otherwise they are
classified as non-current assets:
(a) Assets arising from operating activities that are expected to be realised, or are intended to be
sold or consumed within the normal operating cycle;
(b) Assets held mainly for trading purposes;
(c) Assets that are expected to be realised within twelve months from the balance sheet date;
(d) Cash and cash equivalents, excluding restricted cash and cash equivalents and those that are to
be exchanged or used to pay off liabilities more than twelve months after the balance sheet date.
B. Liabilities that meet one of the following criteria are classified as current liabilities; otherwise they
are classified as non-current liabilities:
(a) Liabilities that are expected to be paid off within the normal operating cycle;
(b) Liabilities arising mainly from trading activities;
(c) Liabilities that are to be paid off within twelve months from the balance sheet date;
(d) Liabilities for which the repayment date cannot be extended unconditionally to more than
twelve months after the balance sheet date. Terms of a liability that could, at the option of the
counterparty, result in its settlement by the issue of equity instruments do not affect its
classification.

105
(6) Cash equivalents
Cash equivalents refer to short-term, highly liquid investments that are readily convertible to known
amounts of cash and which are subject to an insignificant risk of changes in value. Time deposits that
meet the definition above and are held for the purpose of meeting short-term cash commitments in
operations are classified as cash equivalents.
(7) Financial assets at fair value through profit or loss
A. Financial assets at fair value through profit or loss are financial assets held for trading or financial
assets designated as at fair value through profit or loss on initial recognition. Financial assets are
classified in this category of held for trading if acquired principally for the purpose of selling in
the short-term. Derivatives are also categorised as financial assets held for trading unless they are
designated as hedges. Financial assets that meet one of the following criteria are designated as at
fair value through profit or loss on initial recognition:
(a) Hybrid (combined) contracts; or
(b) They eliminate or significantly reduce a measurement or recognition inconsistency; or
(c) They are managed and their performance is evaluated on a fair value basis, in accordance with a
documented risk management or investment strategy.
B. On a regular way purchase or sale basis, financial assets at fair value through profit or loss are
recognised and derecognised using trade date accounting.
C. Financial assets at fair value through profit or loss are initially recognised at fair value. Related
transaction costs are expensed in profit or loss. These financial assets are subsequently remeasured
and stated at fair value, and any changes in the fair value of these financial assets are recognised in
profit or loss.
(8) Available-for-sale financial assets
A. Available-for-sale financial assets are non-derivatives that are either designated in this category
or not classified in any of the other categories.
B. On a regular way purchase or sale basis, available-for-sale financial assets are recognised and
derecognised using trade date accounting.
C. Available-for-sale financial assets are initially recognised at fair value plus transaction costs.
These financial assets are subsequently remeasured and stated at fair value, and any changes in
the fair value of these financial assets are recognised in other comprehensive income.
Investments in equity instruments that do not have a quoted market price in an active market
and whose fair value cannot be reliably measured or derivatives that are linked to and must be
settled by delivery of such unquoted equity instruments are presented in ‘financial assets
measured at cost’.
106
(9) Accounts receivable
Accounts receivable are loans and receivables originated by the entity. They are created by the entity
by selling goods or providing services to customers in the ordinary course of business. Accounts
receivable are initially recognised at fair value and subsequently measured at amortised cost using the
effective interest method, less provision for impairment. However, short-term accounts receivable
without bearing interest are subsequently measured at initial invoice amount as effect of discounting
is immaterial.
(10) Impairment of financial assets
A. The Group assesses at each balance sheet date whether there is objective evidence that a financial
asset or a group of financial assets is impaired as a result of one or more events that occurred
after the initial recognition of the asset (a ‘loss event’) and that loss event (or events) has an
impact on the estimated future cash flows of the financial asset or group of financial assets that
can be reliably estimated.
B. The criteria that the Group uses to determine whether there is objective evidence of an
impairment loss is as follows:
(a) Significant financial difficulty of the issuer or debtor;
(b) A breach of contract, such as a default or delinquency in interest or principal payments;
(c) The Group, for economic or legal reasons relating to the borrower’s financial difficulty,
granted the borrower a concession that a lender would not otherwise consider;
(d) It becomes probable that the borrower will enter bankruptcy or other financial reorganisation;
(e) The disappearance of an active market for that financial asset because of financial difficulties;
(f) Observable data indicating that there is a measurable decrease in the estimated future cash
flows from a group of financial assets since the initial recognition of those assets, although the
decrease cannot yet be identified with the individual financial asset in the group, including
adverse changes in the payment status of borrowers in the group or national or local economic
conditions that correlate with defaults on the assets in the group;
(g) Information about significant changes with an adverse effect that have taken place in the
technology, market, economic or legal environment in which the issuer operates, and indicates
that the cost of the investment in the equity instrument may not be recovered;
(h) A significant or prolonged decline in the fair value of an investment in an equity instrument
below its cost.
107
C. When the Group assesses that there has been objective evidence of impairment and an
impairment loss has occurred, accounting for impairment is made as follows according to the
category of financial assets:
(a) Financial assets measured at amortised cost
The amount of the impairment loss is measured as the difference between the asset’s carrying
amount and the present value of estimated future cash flows discounted at the financial asset’s
original effective interest rate, and is recognised in profit or loss. If, in a subsequent period, the
amount of the impairment loss decreases and the decrease can be related objectively to an event
occurring after the impairment loss was recognised, the previously recognised impairment loss
is reversed through profit or loss to the extent that the carrying amount of the asset does not
exceed its amortised cost that would have been at the date of reversal had the impairment loss
not been recognised previously. Impairment loss is recognised and reversed by adjusting the
carrying amount of the asset through the use of an impairment allowance account.
(b) Financial assets measured at cost
The amount of the impairment loss is measured as the difference between the asset’s carrying
amount and the present value of estimated future cash flows discounted at current market return
rate of similar financial asset, and is recognised in profit or loss. Impairment loss recognised for
this category shall not be reversed subsequently. Impairment loss is recognised by adjusting the
carrying amount of the asset through the use of an impairment allowance account.
(c) Available-for-sale financial assets
The amount of the impairment loss is measured as the difference between the asset’s acquisition
cost (less any principal repayment and amortisation) and current fair value, less any impairment
loss on that financial asset previously recognised in profit or loss, and is reclassified from ‘other
comprehensive income’ to ‘profit or loss’. If, in a subsequent period, the fair value of an
investment in a debt instrument increases, and the increase can be related objectively to an
event occurring after the impairment loss was recognised, then such impairment loss is reversed
through profit or loss. Impairment loss of an investment in an equity instrument recognised in
profit or loss shall not be reversed through profit or loss. Impairment loss is recognised and
reversed by adjusting the carrying amount of the asset through the use of an impairment
allowance account.
(11) Derecognition of financial assets
The Group derecognises a financial asset when one of the following conditions is met:
A. The contractual rights to receive the cash flows from the financial asset expire.
B. The contractual rights to receive cash flows of the financial asset have been transferred and the
Group has transferred substantially all risks and rewards of ownership of the financial asset.

108
C. The contractual rights to receive cash flows of the financial asset have been transferred; however,
the Group has not retained control of the financial asset.
(12) Lease receivables/operating leases (lessor)
A. Based on the terms of a lease contract, a lease is classified as a finance lease if the lessee assumes
substantially all the risks and rewards incidental to ownership of the leased asset.
(a) At commencement of the lease term, the lessor should record a finance lease in the balance
sheet as ‘lease receivables’ at an amount equal to the net investment in the lease (including
initial direct costs). The difference between gross lease receivable and the present value of the
receivable is recognised as ‘unearned finance income of finance lease’.
(b) The lessor should allocate finance income over the lease term based on a systematic and
rational basis reflecting a constant periodic rate of return on the lessor’s net investment in the
finance lease.
(c) Lease payments (excluding costs for services) relating to the lease term are applied against the
gross investment in the lease to reduce both the principal and the unearned finance income.
B. Lease income from an operating lease (net of any incentives given to the lessee) is recognised in
profit or loss on a straight-line basis over the lease term.
(13) Inventories
A. Cost of inventory purchase includes purchasing price, import taxes and all the related costs
involved in the process of obtaining inventory. Discounts, allowances and etc. shall be deducted
from the cost of inventory purchases.
B. Inventories are stated at the lower of cost and net realisable value. Cost is determined using the
the moving-average method. The item by item approach is used in applying the lower of cost and
net realisable value. Net realisable value is the estimated selling price in the ordinary course of
business, less the estimated cost of completion and applicable variable selling expenses.
(14) Investments accounted for using equity method / associates
A. Associates are all entities over which the Group has significant influence but not control. In
general, it is presumed that the investor has significant influence, if an investor holds, directly or
indirectly 20 percent or more of the voting power of the investee. Investments in associates are
accounted for using the equity method and are initially recognised at cost.

109
B. The Group’s share of its associates’ post-acquisition profits or losses is recognised in profit or
loss, and its share of post-acquisition movements in other comprehensive income is recognised in
other comprehensive income. When the Group’s share of losses in an associate equals or exceeds
its interest in the associate, including any other unsecured receivables, the Group does not
recognise further losses, unless it has incurred legal or constructive obligations or made payments
on behalf of the associate.
C. When changes in an associate’s equity that are not recognised in profit or loss or other
comprehensive income of the associate and such changes not affecting the Group’s ownership
percentage of the associate, the Group recognises change in ownership interests in the associate
in ‘capital surplus’ in proportion to its ownership.
D. Unrealised gains on transactions between the Group and its associates are eliminated to the extent
of the Group’s interest in the associates. Unrealised losses are also eliminated unless the
transaction provides evidence of an impairment of the asset transferred. Accounting policies of
associates have been adjusted where necessary to ensure consistency with the policies adopted by
the Group.
E. In the case that an associate issues new shares and the Group does not subscribe or acquire new
shares proportionately, which results in a change in the Group’s ownership percentage of the
associate but maintains significant influence on the associate, then ‘capital surplus’ and
‘investments accounted for under the equity method’ shall be adjusted for the increase or
decrease of its share of equity interest. If the above condition causes a decrease in the Group’s
ownership percentage of the associate, in addition to the above adjustment, the amounts
previously recognised in other comprehensive income in relation to the associate are reclassified
to profit or loss proportionately on the same basis as would be required if the relevant assets or
liabilities were disposed of.
F. When the Group disposes its investment in an associate, if it loses significant influence over this
associate, the amounts previously recognised in other comprehensive income in relation to the
associate, are reclassified to profit or loss, on the same basis as would be required if the relevant
assets or liabilities were disposed of. If it still retains significant influence over this associate, then
the amounts previously recognised in other comprehensive income in relation to the associate are
reclassified to profit or loss proportionately in accordance with the aforementioned approach.
G. When the Group disposes its investment in an associate, if it loses significant influence over this
associate, the amounts previously recognised as capital surplus in relation to the associate are
transferred to profit or loss. If it still retains significant influence over this associate, then the
amounts previously recognised as capital surplus in relation to the associate are transferred to
profit or loss proportionately.

110
(15) Property, plant and equipment
A. Property, plant and equipment are initially recorded at cost. Borrowing costs incurred during the
construction period are capitalised.
B. Subsequent costs are included in the asset’s carrying amount or recognised as a separate asset, as
appropriate, only when it is probable that future economic benefits associated with the item will
flow to the Group and the cost of the item can be measured reliably. The carrying amount of the
replaced part is derecognised. All other repairs and maintenance are charged to profit or loss
during the financial period in which they are incurred.
C. Land is not depreciated. Other property, plant and equipment apply cost model and are
depreciated using the straight-line method to allocate their cost over their estimated useful lives.
If each part of an item of property, plant, and equipment with a cost that is significant in relation
to the total cost of the item must be depreciated separately.
D. The assets’ residual values, useful lives and depreciation methods are reviewed, and adjusted if
appropriate, at each financial year-end. If expectations for the assets’ residual values and useful
lives differ from previous estimates or the patterns of consumption of the assets’ future economic
benefits embodied in the assets have changed significantly, any change is accounted for as a
change in estimate under IAS 8, ‘Accounting Policies, Changes in Accounting Estimates and
Errors’, from the date of the change.
The estimated useful lives of property, plant and equipment are as follows:
Buildings 5 - 55 years
Utilities equipment 7 - 24 years
Computer equipment 3 - 13 years
Transportation equipment 7 - 14 years
Furniture and fixtures 5 - 8 years
Machinery and equipment 5 - 20 years
Leasehold improvements 3 years
(16) Leased assets/operating leases (lessee)
Payments made under an operating lease (net of any incentives received from the lessor) are
recognised in profit or loss on a straight-line basis over the lease term.
(17) Investment property
An investment property is stated initially at its cost and measured subsequently using the cost model.
Except for land, investment property is depreciated on a straight-line basis. The estimated useful
lives of property, plant and equipment are as follows:

111
Buildings 3 - 47 years
Utilities equipment 7 - 15 years
(18) Intangible assets
A. Computer software
Computer software is stated at cost and amortised on a straight-line basis over its estimated useful
life of 1 to 7 years.
B. Goodwill
Goodwill arises in a business combination accounted for by applying the acquisition method.
(19) Impairment of non-financial assets
A. The Group assesses at each balance sheet date the recoverable amounts of those assets where
there is an indication that they are impaired. An impairment loss is recognised for the amount by
which the asset’s carrying amount exceeds its recoverable amount. The recoverable amount is the
higher of an asset’s fair value less costs to sell or value in use. Except for goodwill, when the
circumstances or reasons for recognizing impairment loss for an asset in prior years no longer
exist or diminish, the impairment loss is reversed. The increased carrying amount due to reversal
should not be more than what the depreciated or amortised historical cost would have been if the
impairment had not been recognised.
B. The recoverable amounts of goodwill, intangible assets with an indefinite useful life and
intangible assets that have not yet been available for use are evaluated periodically. An
impairment loss is recognised for the amount by which the asset’s carrying amount exceeds its
recoverable amount. Impairment loss of goodwill previously recognised in profit or loss shall not
be reversed in the following years.
C. For the purpose of impairment testing, goodwill acquired in a business combination is allocated
to each of the cash-generating units, or groups of cash-generating units, that is/are expected to
benefit from the synergies of the business combination. Each unit or group of units to which the
goodwill is allocated represents the lowest level within the entity at which the goodwill is
monitored for internal management purposes. Goodwill is monitored at the operating segment
level.

112
(20) Borrowings
A. Borrowings are recognised initially at fair value, net of transaction costs incurred. Borrowings
are subsequently stated at amortised cost; any difference between the proceeds (net of transaction
costs) and the redemption value is recognised in profit or loss over the period of the borrowings
using the effective interest method.
B. Fees paid on the establishment of loan facilities are recognised as transaction costs of the loan to
the extent that it is probable that some or all of the facility will be drawn down. In this case, the
fee is deferred until the draw-down occurs. To the extent there is no evidence that it is probable
that some or all of the facility will be drawn down, the fee is capitalised as a pre-payment for
liquidity services and amortised over the period of the facility to which it relates.
(21) Notes and accounts payable
Notes and accounts payable are obligations to pay for goods or services that have been acquired in
the ordinary course of business from suppliers. They are recognised initially at fair value and
subsequently measured at amortised cost using the effective interest method. However, short-term
accounts payable without bearing interest are subsequently measured at initial invoice amount as
effect of discounting is immaterial.
(22) Financial liabilities at fair value through profit or loss
A. Financial liabilities at fair value through profit or loss are financial liabilities held for trading or
financial liabilities designated as at fair value through profit or loss on initial recognition.
Financial liabilities are classified in this category of held for trading if acquired principally for
the purpose of repurchasing in the short-term. Derivatives are also categorised as financial
liabilities held for trading unless they are designated as hedges. Financial liabilities that meet one
of the following criteria are designated as at fair value through profit or loss on initial
recognition:
(a) Hybrid (combined) contracts; or
(b) They eliminate or significantly reduce a measurement or recognition inconsistency; or
(c) They are managed and their performance is evaluated on a fair value basis, in accordance with
a documented risk management policy.
B. Financial liabilities at fair value through profit or loss are initially recognised at fair value.
Related transaction costs are expensed in profit or loss. These financial liabilities are
subsequently remeasured and stated at fair value, and any changes in the fair value of these
financial liabilities are recognised in profit or loss.

113
(23) Derecognition of financial liabilities
A financial liability is derecognised when the obligation under the liability specified in the contract
is discharged or cancelled or expires.
(24) Offsetting financial instruments
Financial assets and liabilities are offset and reported in the net amount in the balance sheet when
there is a legally enforceable right to offset the recognised amounts and there is an intention to settle
on a net basis or realise the asset and settle the liability simultaneously.
(25) Derivative financial instruments
Derivatives are initially recognised at fair value on the date a derivative contract is entered into and
are subsequently remeasured at their fair value. Any changes in the fair value are recognised in
profit or loss.
(26) Provisions
Warranties provisions are recognised when the Group has a present legal or constructive obligation
as a result of past events, and it is probable that an outflow of economic resources will be required
to settle the obligation and the amount of the obligation can be reliably estimated. Warranties
provisions are measured at the present value of the expenditures expected to be required to settle the
obligation on the balance sheet date, which is discounted using a pre-tax discount rate that reflects
the current market assessments of the time value of money and the risks specific to the obligation.
When discounting is used, the increase in the provision due to passage of time is recognised as
interest expense.
(27) Employee benefits
A. Short-term employee benefits
Short-term employee benefits are measured at the undiscounted amount of the benefits expected
to be paid in respect of service rendered by employees in a period and should be recognised as
expenses in that period when the employees render service.
B. Pensions
(a) Defined contribution plans
For defined contribution plans, the contributions are recognised as pension expenses when they
are due on an accrual basis. Prepaid contributions are recognised as an asset to the extent of a
cash refund or a reduction in the future payments.

114
(b) Defined benefit plans
i. Net obligation under a defined benefit plan is defined as the present value of an amount of
pension benefits that employees will receive on retirement for their services with the Group
in current period or prior periods. The liability recognised in the balance sheet in respect of
defined benefit pension plans is the present value of the defined benefit obligation at the
balance sheet date less the fair value of plan assets. The defined benefit net obligation is
calculated annually by independent actuaries using the projected unit credit method. The rate
used to discount is determined by using interest rates of government bonds (at the balance
sheet date) of a currency and term consistent with the currency and term of the employment
benefit obligations.
ii. Remeasurement arising on defined benefit plans are recognised in other comprehensive
income in the period in which they arise and recorded as retained earning.
iii. Past service costs are recognised immediately in profit or loss.
C. Termination benefits
Termination benefits are employee benefits provided in exchange for the termination of
employment as a result from either the Group’s decision to terminate an employee’s employment
before the normal retirement date, or an employee’s decision to accept an offer of redundancy
benefits in exchange for the termination of employment. The Group recognises expense as it can
no longer withdraw an offer of termination benefits or it recognises relating restructuring costs,
whichever is earlier. Benefits that are expected to be due more than 12 months after balance sheet
date shall be discounted to their present value.
D. Employees’ compensation and directors’ and supervisors’ remuneration
Employees’ compensation and directors’ and supervisors’ remuneration are recognised as
expenses and liabilities, provided that such recognition is required under legal obligation or
constructive obligation and those amounts can be reliably estimated. Any difference between the
resolved amounts and the subsequemtly actual distributed amounts is accounted for as changes in
etimates.
(28) Income tax
A. The tax expense for the period comprises current and deferred tax. Tax is recognised in profit or
loss, except to the extent that it relates to items recognised in other comprehensive income or
items recognised directly in equity, in which cases the tax is recognised in other comprehensive
income or equity.

115
B. The current income tax expense is calculated on the basis of the tax laws enacted or substantively
enacted at the balance sheet date in the countries where the Company and its subsidiaries operate
and generate taxable income. Management periodically evaluates positions taken in tax returns
with respect to situations in accordance with applicable tax regulations. It establishes provisions
where appropriate based on the amounts expected to be paid to the tax authorities. An additional
10% tax is levied on the unappropriated retained earnings and is recorded as income tax expense
in the year the stockholders resolve to retain the earnings.
C. Deferred income tax is recognised, using the balance sheet liability method, on temporary
differences arising between the tax bases of assets and liabilities and their carrying amounts in
the consolidated balance sheet. However, the deferred income tax is not accounted for if it arises
from initial recognition of goodwill or of an asset or liability in a transaction other than a
business combination that at the time of the transaction affects neither accounting nor taxable
profit or loss. Deferred income tax is provided on temporary differences arising on investments in
subsidiaries and associates, except where the timing of the reversal of the temporary difference is
controlled by the Group and it is probable that the temporary difference will not reverse in the
foreseeable future. Deferred income tax is determined using tax rates (and laws) that have been
enacted or substantially enacted by the balance sheet date and are expected to apply when the
related deferred income tax asset is realised or the deferred income tax liability is settled.
D. Deferred income tax assets are recognised only to the extent that it is probable that future taxable
profit will be available against which the temporary differences can be utilised. At each balance
sheet date, unrecognised and recognised deferred income tax assets are reassessed.
E. Current income tax assets and liabilities are offset and the net amount reported in the balance
sheet when there is a legally enforceable right to offset the recognised amounts and there is an
intention to settle on a net basis or realise the asset and settle the liability simultaneously.
Deferred income tax assets and liabilities are offset on the balance sheet when the entity has the
legally enforceable right to offset current tax assets against current tax liabilities and they are
levied by the same taxation authority on either the same entity or different entities that intend to
settle on a net basis or realise the asset and settle the liability simultaneously.
F. A deferred tax asset shall be recognised for the carryforward of unused tax credits resulting from
acquisitions of equipment or technology, research and development expenditures and equity
investments to the extent that it is possible that future taxable profit will be available against
which the unused tax credits can be utilised.

116
(29) Dividends
Dividends are recorded in the Company’s financial statements in the period in which they are
resolved by the Company’s shareholders. Cash dividends are recorded as liabilities; stock dividends
are recorded as stock dividends to be distributed and are reclassified to ordinary shares on the
effective date of new shares issuance.
(30) Revenue recognition
Sales of goods
The Group sells information, communication, electronic and consumer electronic products. Revenue
is measured at the fair value of the consideration received or receivable taking into account of
business tax, returns, rebates and discounts for the sale of goods to external customers in the
ordinary course of the Group’s activities. Revenue arising from the sales of goods should be
recognised when the Group has delivered the goods to the customer, the amount of sales revenue
can be measured reliably and it is probable that the future economic benefits associated with the
transaction will flow to the entity. The delivery of goods is completed when the significant risks and
rewards of ownership have been transferred to the customer, the Group retains neither continuing
managerial involvement to the degree usually associated with ownership nor effective control over
the goods sold, and the customer has accepted the goods based on the sales contract or there is
objective evidence showing that all acceptance provisions have been satisfied.
(31) Business combinations
A. The Group uses the acquisition method to account for business combinations. The
consideration transferred for an acquisition is measured as the fair value of the assets
transferred, liabilities incurred or assumed and equity instruments issued at the acquisition date,
plus the fair value of any assets and liabilities resulting from a contingent consideration
arrangement. All acquisition-related costs are expensed as incurred. Identifiable assets acquired
and liabilities and contingent liabilities assumed in a business combination are measured
initially at their fair values at the acquisition date. For each business combination, the Group
measures at the acquisition date components of non-controlling interests in the acquiree that are
present ownership interests and entitle their holders to the proportionate share of the entity’s net
assets in the event of liquidation at either fair value or the present ownership instruments’
proportionate share in the recognised amounts of the acquiree’s identifiable net assets. All other
non-controlling interests should be measured at the acquisition-date fair value.

117
B. The excess of the consideration transferred, the amount of any non-controlling interest in the
acquiree and the fair value of any previous equity interest in the acquiree over the fair value of
the identifiable assets acquired and the liabilities assumed is recorded as goodwill at the
acquisition date. If the total of consideration transferred, non-controlling interest in the acquiree
recognised and the fair value of previously held equity interest in the acquiree is less than the
fair value of the identifiable assets acquired and the liabilities assumed, the difference is
recognized directly in profit or loss on the acquisition date.
(32) Operating segments
Operating segments are reported in a manner consistent with the internal reporting provided to the
Chief Operating Decision-Maker. The Group’s Chief Operating Decision-Maker is responsible for
allocating resources and assessing performance of the operating segments.
5. CRITICAL ACCOUNTING JUDGEMENTS, ESTIMATES AND KEY SOURCES OF ASSUMPTION
UNCERTAINTY
The preparation of these consolidated financial statements requires management to make critical
judgements in applying the Group’s accounting policies and make critical assumptions and estimates
concerning future events. Assumptions and estimates may differ from the actual results and are
continually evaluated and adjusted based on historical experience and other factors. Such assumptions
and estimates have a significant risk of causing a material adjustment to the carrying amounts of assets
and liabilities within the next financial year; and the information is addressed below:
(1) Critical judgements in applying the Group’s accounting policies
A. Revenue recognition on a net/gross basis
The determination of whether the Group is acting as principal or agent in a transaction is based on
an evaluation of Group’s exposure to the significant risks and rewards associated with the sale of
goods or the rendering of service in accordance with the business model and substance of the
transaction. Where the Group acts as a principal, the amount of received or receivable from
customer is recognised as revenue on a gross basis. Where the Group acts as an agent, net revenue
is recognised representing commissions earned.
The following characteristics of a principal are used as indicators to determine whether the Group
shall recognise revenue on a gross basis:
(a) The Group has primary responsibilities for the goods or services it provides;
(b) The Group bears inventory risk;
(c) The Group has the latitude in establishing prices for the goods or services, either directly or
indirectly.
(d) The Group bears credit risk of customers.
118
B. Financial assets measured at cost
Investments in equity instruments that do not have a quoted market price in an active market and
whose fair value cannot be reliably measured due to lack of sufficient information, are presented in
‘financial assets measured at cost’.
(2) Critical accounting estimates and assumptions
A. Assessment of allowance for uncollectible accounts receivable
During the assessment process of allowance for uncollectible accounts receivable, the Group has to
use assessment and judgement to determine the future recoverable amount of accounts receivable.
The future recoverable amount is affected by various factors such as customers’ financial
conditions, Group’s internal credit ratings, historical transaction records, current economic
conditions and other factors that could affect customers’ paying ability. If there is a concern
regarding accounts receivable collectability, the Group shall assess each individual account’s
collectability and recognize appropriate allowances. Management make critical assumptions and
estimates concerning future events as of balance sheet date. Assumptions and estimates may differ
from the actual results, thus, there might be material changes to the assessment.
B. Evaluation of inventories
As inventories are stated at the lower of cost and net realisable value, the Group must determine
the net realisable value of inventories on balance sheet date using judgements and estimates. Due
to the rapid technology innovation, the Group evaluates the amounts of normal inventory
comsumption, obsolete inventories or inventories without market selling value on balance sheet
date, and writes down the cost of inventories to the net realisable value. Such an evaluation of
inventories is principally based on the demand for the products within the specified period in the
future. Therefore, there might be material changes to the evaluation.
C. Accrual of inventory purchase rebate
Accrual of inventory purchase rebate is based on contract terms and expected achievement rate.
However, contract terms for rebate could be in various types, with complicated calculations and
engaged with different counterparties. Therefore, massive amount of purchase and sale information
has to be matched with individual merchandise item number manually in order to calculate the
rebate. Management make critical assumptions and estimates concerning future events as of
balance sheet date. Assumptions and estimates may differ from the actual results, thus, there might
be material changes to the assessment.

119
6. DETAILS OF SIGNIFICANT ACCOUNTS
(1) Cash and cash equivalents
December 31, 2016 December 31, 2015
Cash on hand and revolving funds 1,490$ 1,268$
Checking accounts and demand deposits 3,239,594 2,435,712
Time deposits 4,233,238 11,461,677
7,474,322$ 13,898,657$
A. The Group transacts with a variety of financial institutions all with high credit quality to disperse
credit risk, so it expects that the probability of counterparty default is remote.
B. For information regarding cash and cash equivalents pledged as collateral and is reclassified to
other current and other non-current assets, please refer to Note 8.
(2) Financial assets/liabilities at fair value through profit or loss – current
December 31, 2016 December 31, 2015
Financial assets held for trading
Listed (TSE and OTC) stocks 396,820$ 396,988$
Valuation adjustment of financial assets held for
trading137,266 27,120
Non-hedging derivatives-foreign exchange forward 92 -
Total 534,178$ 424,108$
Financial liabilities held for trading
Non-hedging derivatives-foreign exchange forward -$ 7,684$
A. The Group recognised net (loss) gain of $103,820 and $18,437 on financial assets held for
trading for the years ended December 31, 2016 and 2015, respectively,
B. The related information of derivative financial instruments of the subsidiaries is as follows:
Foreign exchange forward
December 31, 2016
The subsidiaries Items Book Value
Nominal Principal
(in thousands)
Synnex New Zealand Buy USD sell NZD $ 321 USD 1,900
Synnex New Zealand Buy AUD sell NZD ( 229) AUD 1,430
$ 92
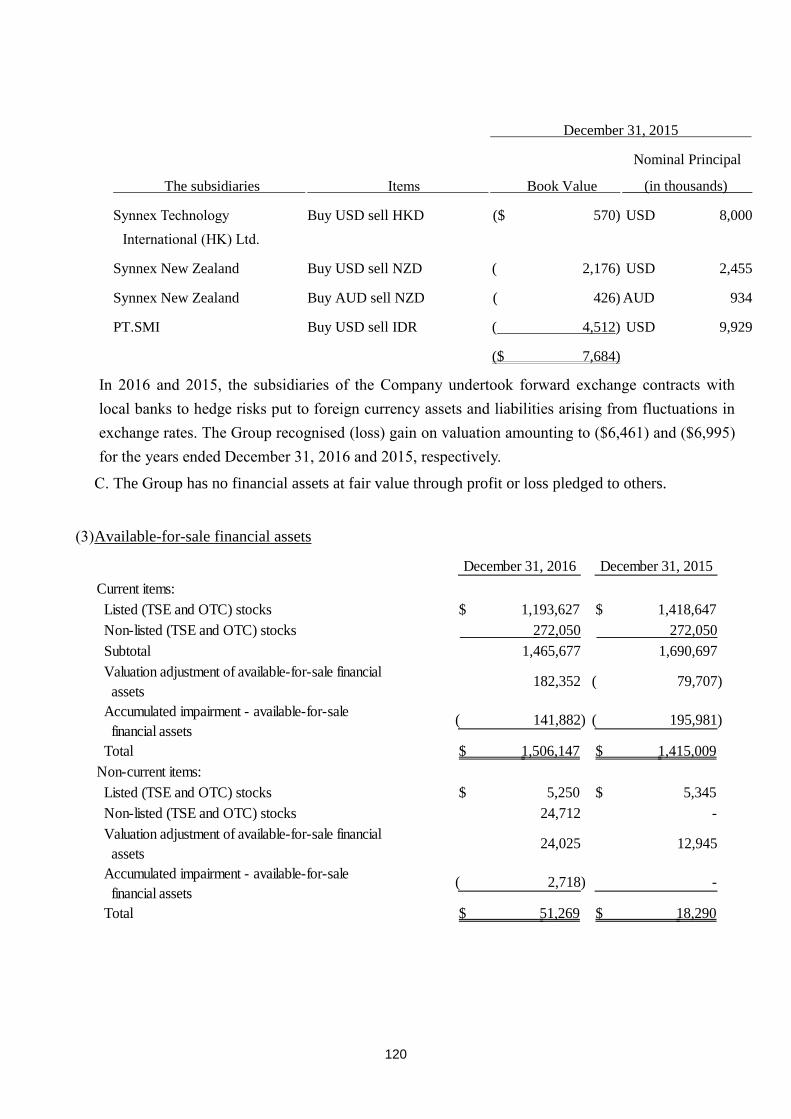
120
December 31, 2015
The subsidiaries Items Book Value
Nominal Principal
(in thousands)
Synnex Technology
International (HK) Ltd.
Buy USD sell HKD ($ 570) USD 8,000
Synnex New Zealand Buy USD sell NZD ( 2,176) USD 2,455
Synnex New Zealand Buy AUD sell NZD ( 426) AUD 934
PT.SMI Buy USD sell IDR ( 4,512) USD 9,929
($ 7,684)
In 2016 and 2015, the subsidiaries of the Company undertook forward exchange contracts with
local banks to hedge risks put to foreign currency assets and liabilities arising from fluctuations in
exchange rates. The Group recognised (loss) gain on valuation amounting to ($6,461) and ($6,995)
for the years ended December 31, 2016 and 2015, respectively.
C. The Group has no financial assets at fair value through profit or loss pledged to others.
(3) Available-for-sale financial assets
December 31, 2016 December 31, 2015
Current items:
Listed (TSE and OTC) stocks 1,193,627$ 1,418,647$
Non-listed (TSE and OTC) stocks 272,050 272,050
Subtotal 1,465,677 1,690,697
Valuation adjustment of available-for-sale financial
assets182,352 79,707)(
Accumulated impairment - available-for-sale
financial assets 141,882)( 195,981)(
Total 1,506,147$ 1,415,009$
Non-current items:
Listed (TSE and OTC) stocks 5,250$ 5,345$
Non-listed (TSE and OTC) stocks 24,712 -
Valuation adjustment of available-for-sale financial
assets24,025 12,945
Accumulated impairment - available-for-sale
financial assets 2,718)( -
Total 51,269$ 18,290$
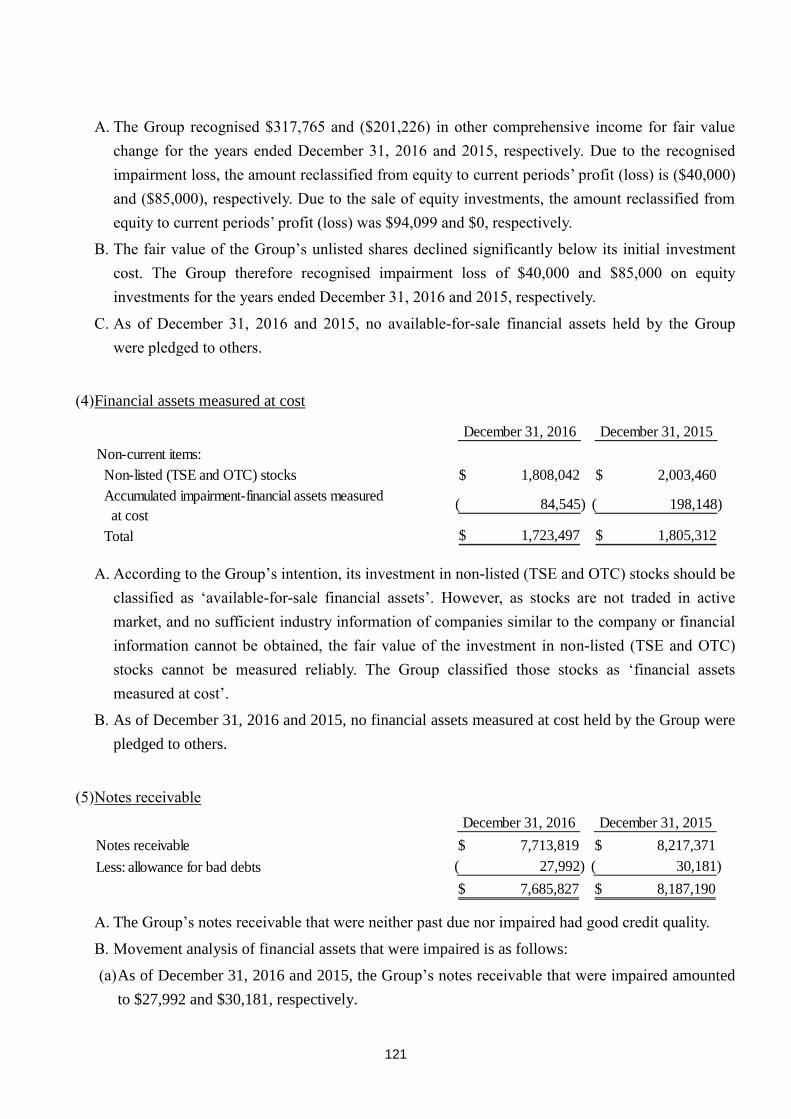
121
A. The Group recognised $317,765 and ($201,226) in other comprehensive income for fair value
change for the years ended December 31, 2016 and 2015, respectively. Due to the recognised
impairment loss, the amount reclassified from equity to current periods’ profit (loss) is ($40,000)
and ($85,000), respectively. Due to the sale of equity investments, the amount reclassified from
equity to current periods’ profit (loss) was $94,099 and $0, respectively.
B. The fair value of the Group’s unlisted shares declined significantly below its initial investment
cost. The Group therefore recognised impairment loss of $40,000 and $85,000 on equity
investments for the years ended December 31, 2016 and 2015, respectively.
C. As of December 31, 2016 and 2015, no available-for-sale financial assets held by the Group
were pledged to others.
(4) Financial assets measured at cost
December 31, 2016 December 31, 2015
Non-current items:
Non-listed (TSE and OTC) stocks 1,808,042$ 2,003,460$
Accumulated impairment-financial assets measured
at cost 84,545)( 198,148)(
Total 1,723,497$ 1,805,312$
A. According to the Group’s intention, its investment in non-listed (TSE and OTC) stocks should be
classified as ‘available-for-sale financial assets’. However, as stocks are not traded in active
market, and no sufficient industry information of companies similar to the company or financial
information cannot be obtained, the fair value of the investment in non-listed (TSE and OTC)
stocks cannot be measured reliably. The Group classified those stocks as ‘financial assets
measured at cost’.
B. As of December 31, 2016 and 2015, no financial assets measured at cost held by the Group were
pledged to others.
(5) Notes receivable
December 31, 2016 December 31, 2015
Notes receivable 7,713,819$ 8,217,371$
Less: allowance for bad debts 27,992)( 30,181)(
7,685,827$ 8,187,190$
A. The Group’s notes receivable that were neither past due nor impaired had good credit quality.
B. Movement analysis of financial assets that were impaired is as follows:
(a) As of December 31, 2016 and 2015, the Group’s notes receivable that were impaired amounted
to $27,992 and $30,181, respectively.

122
(b)Movements on the Group’s provision for impairment of notes receivable are as follows:
Individual
provision Group provision Total
At January 1 -$ 30,181$ 30,181$
Provision for impairment - 230 230
Net exchange differences - 2,419)( 2,419)(
At December 31 -$ 27,992$ 27,992$
2016
Individual
provision Group provision Total
At January 1 -$ 16,411$ 16,411$
Provision for impairment - 14,252 14,252
Net exchange differences - 482)( 482)(
At December 31 -$ 30,181$ 30,181$
2015
(6) Accounts receivable and overdue receivables
December 31, 2016 December 31, 2015
Accounts receivable 40,807,815$ 38,250,922$
Lease payments receivable (current portion) 127,431 -
Less: allowance for bad debts 104,600)( 103,286)(
40,830,646 38,147,636
Overdue receivables (recorded as other non-current
assets) 2,194,573 2,710,133
Less: allowance for bad debts 1,773,204)( 2,090,718)(
421,369 619,415
41,252,015$ 38,767,051$
Overdue receivables consist primarily of amounts due from customers under bankruptcy proceedings
and are stated at their estimated net realizable value. As of December 31, 2016 and 2015, the Group
received certain security for a portion of the amounts due.
A. The ageing analysis of financial assets that was not impaired is as follows:
December 31, 2016 December 31, 2015
Not past due 35,102,535$ 32,575,000$
Up to 60 days past due 4,957,445 4,624,908
61-120 days past due 352,822 493,375
121-180 days past due 152,483 113,802
More than 181 days past due 686,730 959,966
41,252,015$ 38,767,051$

123
The above amounts are net of deduction of allowance for bad debts.
B. Movement analysis of financial assets that were impaired is as follows:
(a) As of December 31, 2016 and 2015, the Group’s accounts receivable that were impaired
amounted to $1,877,804 and $2,194,004, respectively.
(b)Movements on the Group’s provision for impairment of accounts receivable are as follows:
Individual
provision Group provision Total
At January 1 2,090,718$ 103,286$ 2,194,004$
Provision for impairment 365,198 14,352 379,550
Write off of uncollectibles 587,137)( 28,379)( 615,516)(
Effect of business combination 14,823 29,133 43,956
Net exchange differences 110,398)( 13,792)( 124,190)(
At December 31 1,773,204$ 104,600$ 1,877,804$
2016
Individual
provision Group provision Total
At January 1 1,138,436$ 59,614$ 1,198,050$
Provision for impairment 983,211 52,923 1,036,134
Write off of uncollectibles 15,513)( 7,696)( 23,209)(
Net exchange differences 15,416)( 1,555)( 16,971)(
At December 31 2,090,718$ 103,286$ 2,194,004$
2015
C. The counterparties of the Group’s accounts receivable are customers from different industries
and geographical regions; in order to maintain the quality of the receivables, the Group
established credit risk management procedures related to operations and continues to evaluate.
The risk evaluation of individual customers takes into consideration the customers’ financial
position, internal and external credit ratings and historical transaction records and current
economic situation amongst other factors that may affect the customers’ payment ability. The
Group utilises certain credit enhancement instruments when necessary; for example: require
customers to pay in advance or provide collaterals to lower the customers’ credit risk.
D. The computer and computer peripherals were leased under finance lease and leasing period is
over 3 years. The Group expects all lease payments would be collected on schedule. The gross
investments in those leases and present value of total minimum lease payments receivable as at
December 31, 2016 was as follows:

124
Total lease Net lease
payments Unearned finance payments
receivable income receivable
Current
Not later than one year (recorded as
net accounts receivable)149,044$ 21,613)($ 127,431$
Non-current
Later than one year but not later than
five years (recorded as other non
-current assets)
115,277 14,300)( 100,977
264,321$ 35,913)($ 228,408$
December 31, 2016
December 31, 2015:None.
E. Information about accounts receivable that were pledged to others as collaterals is provided in
Note 8.
(7) Transfer of financial assets
Transferred financial assets that are derecognised in their entirety
The Group entered into a factoring agreement with a bank to sell its accounts receivable. Under the
agreement, the Group is not obligated to bear the default risk of the transferred accounts receivable,
but is liable for the losses incurred on any business dispute. The Group does not have any
continuing involvement in the transferred accounts receivable. Thus, the Group derecognised the
transferred accounts receivable, and the related information is as follows:
(Unit: USD thousand)
December 31, 2016
Accounts receivable
transferred
Amount derecognized Facilities Amount advanced
The Company
$360 $360 US$43,500 $360
(US$11) (US$11) (US$11)
$181,011 $181,011 US$10,000 $181,011
(US$5,610) (US$5,610) (US$5,610)
$190,525 $190,525 US$45,000 $190,525
(US$6,067) (US$6,067) (US$6,067)
Subsidiaries
$914,463 $914,463 US$60,000 $914,463
(US$28,312) (US$28,312) (US$28,312)
$688,437 $688,437 US$42,000 $688,437
(US$21,314) (US$21,314) (US$21,314)

125
(Unit: USD thousand)
December 31, 2015
Accounts receivable
transferred
Amount derecognized Facilities Amount advanced
The Company
$644,106
(US$19,660)
$644,106
(US$19,660)
US$32,000 $644,106
(US$19,660)
$131,851
(US$4,039)
$131,851
(US$4,039)
US$10,000 $131,851
(US$4,039)
Subsidiaries
$304,097
(US$9,249)
$304,097
(US$9,249)
US$10,000 $304,097
(US$9,249)
$327,958
(US$9,947)
$327,958
(US$9,947)
US$17,000 $327,958
(US$9,947)
$205,136
(US$6,239)
$205,136
(US$6,239)
US$15,000 $205,136
(US$6,239)
(8) Other receivables
December 31, 2016 December 31, 2015
Rebate receivable from suppliers 5,271,900$ 4,819,930$
Refund receivable from suppliers 499,929 556,400
Tax refund receivable- business tax 560,360 1,352,205
Other non-operating receivables, others 1,011,848 995,011
7,344,037$ 7,723,546$
(9) Inventories
Allowance for
Cost Valuation loss Book value
Merchandise inventories 33,933,503$ 638,876)($ 33,294,627$
Inventory in transit 353,478 - 353,478
Total 34,286,981$ 638,876)($ 33,648,105$
December 31, 2016
Allowance for
Cost Valuation loss Book value
Merchandise inventories 35,491,586$ 603,356)($ 34,888,230$
Inventory in transit 370,451 - 370,451
Total 35,862,037$ 603,356)($ 35,258,681$
December 31, 2015

126
The cost of inventories recognised as expense for the period:
2016 2015
Cost of inventories sold 330,546,140$ 310,576,799$
Loss on decline in (gain on reversal of ) market value 13,408 40,569)(
Loss on retirement 5,941 5,449
330,565,489$ 310,541,679$
Years ended December 31,
In 2015, gain from price recovery of inventory was caused by the reversal of loss on market value
decline and obsolete inventories when the related inventory items were scrapped or sold.
(10) Investments accounted for under equity method
A. The details are as follows:
Percentage Percentage
Balance ownership Balance ownership
Associates:
Synnex Corporation 6,667,079$ 10.31% 6,378,209$ 10.61%
Redington (India) Ltd. 3,498,088 23.58% 3,151,986 23.59%
Synnex (Thailand) Public Company
Ltd. 901,561 40.00% 852,169 40.00%
Bestcom Infotech Corporation
(Note) - - 778,938 40.86%
Other 65,695 20%~40% - -
11,132,423$ 11,161,302$
December 31, 2016 December 31, 2015
B. The above investments accounted for under the equity method are profit/(loss) and share of
other comprehensive income of associates recognised based on annual audited financial
statements issued by the investees’ independent accountants. Details are as follows:
2016 2015
Synnex Corporation 785,075$ 704,109$
Redington (India) Ltd. 505,017 481,897
Synnex (Thailand) Public Company Ltd. 153,042 136,830
Bestcom Infotech Corporation (Note) 17,844 81,387
Other 1,982 -
1,462,960$ 1,404,223$
Profit/(loss) of associates
Years ended December 31,

127
2016 2015
Synnex Corporation 126,289)($ 163,953)($
Redington (India) Ltd. 56,989)( 59,037
Synnex (Thailand) Public Company Ltd. 2,814 1,260)(
Bestcom Infotech Corporation (Note) - 493)(
180,464)($ 106,669)($
Share of other comprehensive
Years ended December 31,
income of associates
Note: Bestcom Infotech Corporation has been included in the consolidated financial statements
as of April 7, 2016.
C. Associates
(a) The basic information of the associates that are material to the Group is as follows:
Company name
Principal place
of business
Nature of relationship
Methods of
measurement
Synnex Corporation USA Financial investment Equity method
The Group is one of the major shareholders of Synnex Corporation, and the Group’s
Chairman Mr. Matthew Miau serves as Synnex’s honorary chairman. Thus, the Group has
significant influence over Synnex.
(b)The summarized financial information of the associates that are material to the Group is as
follows:
Balance sheet
December 31, 2016 December 31, 2015
Current assets 129,070,574$ 118,672,831$
Non-current assets 39,708,327 27,627,469
Current liabilities 80,033,844)( 63,069,002)(
Non-current liabilities 24,859,275)( 23,873,938)(
Total net assets 63,885,782$ 59,357,360$
Share in associate's net assets 6,593,884 6,303,699
Goodwill 73,195 74,510
Carrying amount of the associate 6,667,079$ 6,378,209$
Synnex Corporation

128
Statement of comprehensive income
2016 2015
Revenue 454,337,953$ 424,027,641$
Profit for the period from continuing operations 7,455,608 6,586,617
Other comprehensive loss, net of tax 1,223,870)( 1,545,280)(
Total comprehensive income 6,231,738$ 5,041,337$
Dividends received from associates 83,028$ 78,288$
Synnex Corporation
Years ended December 31,
(c) The carrying amount of the Group’s interests in all individually immaterial associates and
the Group’s share of the operating results are summarized below:
As of December 31, 2016 and 2015, the carrying amount of the Group’s individually
immaterial associates amounted to $4,465,344 and $4,783,093, respectively.
2016 2015
Profit for the period from continuing operations 677,885$ 700,114$
Other comprehensive (loss) income, net of tax 54,175)( 57,284
Total comprehensive income 623,710$ 757,398$
Years ended December 31,
(d)The Group’s material associates with quoted market price and its fair value has been
calculated based on ownership shares proportionately is as follows:
December 31, 2016 December 31, 2015
Synnex Corporation 16,452,333$ 12,664,092$

129
(11) Property, plant and equipment
Construction
in progress
Utilities Computer Transportation Furniture and Leasehold and equipment
Land Buildings equipment equipment equipment fixtures Tools improvements to be inspected Total
At January 1, 2016
Cost 973,906$ 5,058,231$ 633,155$ 497,906$ 173,235$ 76,673$ 1,057,751$ 131,779$ 557,740$ 9,160,376$
Accumulated depreciation - 694,971)( 273,141)( 283,469)( 102,807)( 42,760)( 610,087)( 92,303)( - 2,099,538)(
973,906$ 4,363,260$ 360,014$ 214,437$ 70,428$ 33,913$ 447,664$ 39,476$ 557,740$ 7,060,838$
2016
Opening net book amount 973,906$ 4,363,260$ 360,014$ 214,437$ 70,428$ 33,913$ 447,664$ 39,476$ 557,740$ 7,060,838$
Additions 148,291 5,558 10,679 52,031 33,804 23,405 19,853 34,817 179,038 507,476
Acquired from business
combinations- - - 12,023 - - 2,501 6,008 - 20,532
Disposals - 1,527)( 7)( 5,507)( 165)( 208)( 97)( 184)( 388)( 8,083)(
Reclassifications - 275,705 17,088 847)( - - - - 311,106)( 19,160)(
Depreciation charge - 120,250)( 43,657)( 75,707)( 15,591)( 13,639)( 57,302)( 21,115)( - 347,261)(
Net exchange differences 13,732)( 279,264)( 25,887)( 2,985)( 617)( 847)( 14,387)( 2,048)( 39,289)( 379,056)(
Closing net book amount 1,108,465$ 4,243,482$ 318,230$ 193,445$ 87,859$ 42,624$ 398,232$ 56,954$ 385,995$ 6,835,286$
At December 31, 2016
Cost 1,108,465$ 5,028,226$ 621,652$ 506,631$ 202,193$ 81,247$ 953,378$ 156,538$ 385,995$ 9,044,325$
Accumulated depreciation - 784,744)( 303,422)( 313,186)( 114,334)( 38,623)( 555,146)( 99,584)( - 2,209,039)(
1,108,465$ 4,243,482$ 318,230$ 193,445$ 87,859$ 42,624$ 398,232$ 56,954$ 385,995$ 6,835,286$

130
Construction
in progress
Utilities Computer Transportation Furniture and Leasehold and equipment
Land Buildings equipment equipment equipment fixtures Tools improvements to be inspected Total
At January 1, 2015
Cost 1,006,329$ 4,418,805$ 626,772$ 662,718$ 170,107$ 132,439$ 1,067,101$ 165,856$ 924,730$ 9,174,857$
Accumulated depreciation - 713,502)( 260,035)( 459,383)( 106,114)( 71,911)( 707,859)( 118,686)( - 2,437,490)(
1,006,329$ 3,705,303$ 366,737$ 203,335$ 63,993$ 60,528$ 359,242$ 47,170$ 924,730$ 6,737,367$
2015
Opening net book amount 1,006,329$ 3,705,303$ 366,737$ 203,335$ 63,993$ 60,528$ 359,242$ 47,170$ 924,730$ 6,737,367$
Additions - 49,377 8,771 47,390 22,126 13,695 168,444 9,239 608,708 927,750
Disposals - 18,693)( 14,823)( 1,043)( 616)( 1,021)( 405)( 303)( - 36,904)(
Reclassifications - 879,055 50,551 30,886 - 24,285)( 6,809)( 176 958,268)( 28,694)(
Depreciation charge - 112,922)( 36,768)( 63,324)( 14,401)( 11,744)( 56,243)( 14,856)( - 310,258)(
Net exchange differences 32,423)( 138,860)( 14,454)( 2,807)( 674)( 3,260)( 16,565)( 1,950)( 17,430)( 228,423)(
Closing net book amount 973,906$ 4,363,260$ 360,014$ 214,437$ 70,428$ 33,913$ 447,664$ 39,476$ 557,740$ 7,060,838$
At December 31, 2015
Cost 973,906$ 5,058,231$ 633,155$ 497,906$ 173,235$ 76,673$ 1,057,751$ 131,779$ 557,740$ 9,160,376$
Accumulated depreciation - 694,971)( 273,141)( 283,469)( 102,807)( 42,760)( 610,087)( 92,303)( - 2,099,538)(
973,906$ 4,363,260$ 360,014$ 214,437$ 70,428$ 33,913$ 447,664$ 39,476$ 557,740$ 7,060,838$
Note 1: The significant components of buildings include office buildings and warehouse with main buildings and improvements, which are depreciated
over 15~55 and 5~35 years, respectively.
Note 2: Information about the property, plant and equipment that were pledged to others as collateral is provided in Note 8.
Note 3: The Group has no interest capitalization for the years ended December 31, 2016 and 2015.

131
(12) Investment property
Utilities
Buildings equipment Total
At January 1, 2016
Cost 1,549,896$ 275,297$ 1,825,193$
Accumulated depreciation 174,332)( 139,309)( 313,641)(
1,375,564$ 135,988$ 1,511,552$
2016
Opening net book amount 1,375,564$ 135,988$ 1,511,552$
Additions - 438 438
Reclassifications 86 - 86
Depreciation charge 34,879)( 27,562)( 62,441)(
Net exchange differences 108,834)( 9,791)( 118,625)(
Closing net book amount 1,231,937$ 99,073$ 1,331,010$
At December 31, 2016
Cost 1,425,748$ 253,651$ 1,679,399$
Accumulated depreciation 193,811)( 154,578)( 348,389)(
1,231,937$ 99,073$ 1,331,010$
Utilities
Buildings equipment Total
At January 1, 2015
Cost 1,582,060$ 286,067$ 1,868,127$
Accumulated depreciation 141,286)( 132,352)( 273,638)(
1,440,774$ 153,715$ 1,594,489$
2015
Opening net book amount 1,440,774$ 153,715$ 1,594,489$
Additions 3,373 596 3,969
Reclassifications - 22,546 22,546
Disposals - 10,188)( 10,188)(
Depreciation charge 36,517)( 27,425)( 63,942)(
Net exchange differences 32,066)( 3,256)( 35,322)(
Closing net book amount 1,375,564$ 135,988$ 1,511,552$
At December 31, 2015
Cost 1,549,896$ 275,297$ 1,825,193$
Accumulated depreciation 174,332)( 139,309)( 313,641)(
1,375,564$ 135,988$ 1,511,552$

132
A. Rental income from the lease of the investment property and direct operating expenses arising
from the investment property are shown below:
2016 2015
Rental income from the lease of the investment property 477,562$ 449,419$
Direct operating expenses arising from the investment
property that generated rental income in the period 134,992$ 142,153$
Direct operating expenses arising from the investment
property that did not generate rental income in the period 43,071$ 50,195$
Years ended December 31,
B. The fair value of the investment property held by the Group as of December 31, 2016 and 2015
was $2,803,345 and $2,893,554, respectively, which is based on the present value of rental
revenue for the next 10 years and disposal value, which is categorized within level 3 in the fair
value hierarchy. The growth rates used are consistent with the forecasts included in market
quotation reports and historical experiences. The discount rates used are pre-tax and reflect
specific risks relating to the relevant operating segments.
(13) Intangible assets
Computer
software cost Goodwill Total
At January 1, 2016
Cost 234,838$ 326,527$ 561,365$
Accumulated amortisation 111,524)( - 111,524)(
123,314$ 326,527$ 449,841$
2016
Opening net book amount 123,314$ 326,527$ 449,841$
Additions-acquired separately 70,672 - 70,672
Acquired through business combinations 7,114 239,479 246,593
Amortisation charge 57,596)( - 57,596)(
Net exchange differences 1,191)( 5,760)( 6,951)(
Closing net book amount 142,313$ 560,246$ 702,559$
At December 31, 2016
Cost 285,653$ 560,246$ 845,899$
Accumulated amortisation 143,340)( - 143,340)(
142,313$ 560,246$ 702,559$

133
Computer
software cost Goodwill Total
At January 1, 2015
Cost 177,977$ 314,809$ 492,786$
Accumulated amortisation 79,543)( - 79,543)(
98,434$ 314,809$ 413,243$
2015
Opening net book amount 98,434$ 314,809$ 413,243$
Additions-acquired separately 56,861 - 56,861
Amortisation charge 31,981)( - 31,981)(
Net exchange differences - 11,718 11,718
Closing net book amount 123,314$ 326,527$ 449,841$
At December 31, 2015
Cost 234,838$ 326,527$ 561,365$
Accumulated amortisation 111,524)( - 111,524)(
123,314$ 326,527$ 449,841$
A. Amortization charges on intangible assets were recognised as administrative expenses amounting
to $57,596 and $31,981 for the years ended December 31, 2016 and 2015, respectively.
B. Goodwill is allocated as follows to the Group’s cash-generating units identified according to
operating segment:
December 31, 2016 December 31, 2015
Taiwan 239,479$ -$
Hong Kong/China 320,767 326,527
560,246$ 326,527$
C. Impairment of non-financial assets
Goodwill is allocated to the Group’s cash-generating units identified according to operation
segment. The recoverable amount of all cash-generating units has been determined based on
value-in-use calculations. These calculations use pre-tax cash flow projections based on
financial budgets approved by the management covering a five-year period.
The recoverable amount of all cash-generating units calculated using the value-in-use exceeded
their carrying amount, so goodwill was not impaired. The key assumptions used for
value-in-use calculations are consideration into gross margin, growth rate and discount rate.
Management determined budgeted gross margin based on past performance and its
expectations of market development. The growth rates used are consistent with the forecasts
included in market quotation reports and historical experiences. The discount rates used are
pre-tax and reflect specific risks relating to the relevant operating segments.

134
(14) Other non-current assets
December 31, 2016 December 31, 2015
Refundable deposits 696,530$ 223,270$
Long-term notes and overdue receivables 421,369 619,415
Long-term prepaid rent 873,626 979,775
Pledged time deposits 260,562 1,060,420
Long-term lease and installment receivables 100,977 -
Others 211,423 79,142
2,564,487$ 2,962,022$
A. The above long-term prepaid rent was mainly due to the Group signing a land use right
contract for use of the land in the People’s Republic of China. All rentals had been paid on the
contract date. The Group recognised rental expenses of $21,610 and $23,024 and for the
years ended December 31, 2016 and 2015, respectively.
B. For details of long-term lease and installment receivables, please refer to Note 6(6).
(15) Short-term borrowings
Type of borrowings December 31, 2016 Interest rate range Collateral
Bank borrowings
Unsecured borrowings 38,687,813$ 0.933%~5.58% None Type of borrowings December 31, 2015 Interest rate range Collateral
Bank borrowings
Secured borrowings 1,245,169$ 1.359%~10.25% Accounts receivable and
inventories
Unsecured borrowings 46,408,932 0.88%~5.95% None
47,654,101$
(16) Short-term notes and bills payable
December 31, 2016 December 31, 2015
Commercial paper payable 5,420,000$ 5,300,000$
Interest rate range 0.35%~1.168% 0.45%~0.93%
The above-mentioned short-term notes and bills payables are issued and accepted by financial
institutions.

135
(17) Other payables
December 31, 2016 December 31, 2015
Dealers’ bonus payable 2,172,733$ 2,442,642$
Temporary receipt of suppliers’ payment on behalf
of others 1,761,165 1,239,906
Salary payable and bonus 813,298 588,478
Accrued expenses-others 651,789 540,484
Other payables-others 1,350,057 1,030,661
6,749,042$ 5,842,171$
(18) Pensions
A.(a) The Company has a defined benefit pension plan in accordance with the Labor Standards Law,
covering all regular employees’ service years prior to the enforcement of the Labor Pension
Act on July 1, 2005 and service years thereafter of employees who chose to continue to be
subject to the pension mechanism under the Law. Under the defined benefit pension plan, two
units are accrued for each year of service for the first 15 years and one unit for each additional
year thereafter, subject to a maximum of 45 units. Pension benefits are based on the number of
units accrued and the average monthly salaries and wages of the last 1 month prior to
retirement. The Company contributes monthly an amount equal to 2% of the employees’
monthly salaries and wages to the retirement fund deposited with Bank of Taiwan, the trustee,
under the name of the independent retirement fund committee. Also, the Company would
assess the balance in the aforementioned labor pension reserve account by the end of
December 31, every year. If the account balance is insufficient to pay the pension calculated by
the aforementioned method, to the employees expected to be qualified for retirement next year,
the Company will make contributions to cover the deficit by next March. The subsidiary, PT.
Synnex Metrodata Indonesia, adopted a defined benefit plan.
(b) The amounts recognized in the balance sheet are as follows:
December 31, 2016 December 31, 2015
Present value of defined benefit obligations 598,817)($ 484,066)($
Fair value of plan assets 257,523 198,503
Net defined benefit liability (recorded as other
non-current liabilities) 341,294)($ 285,563)($
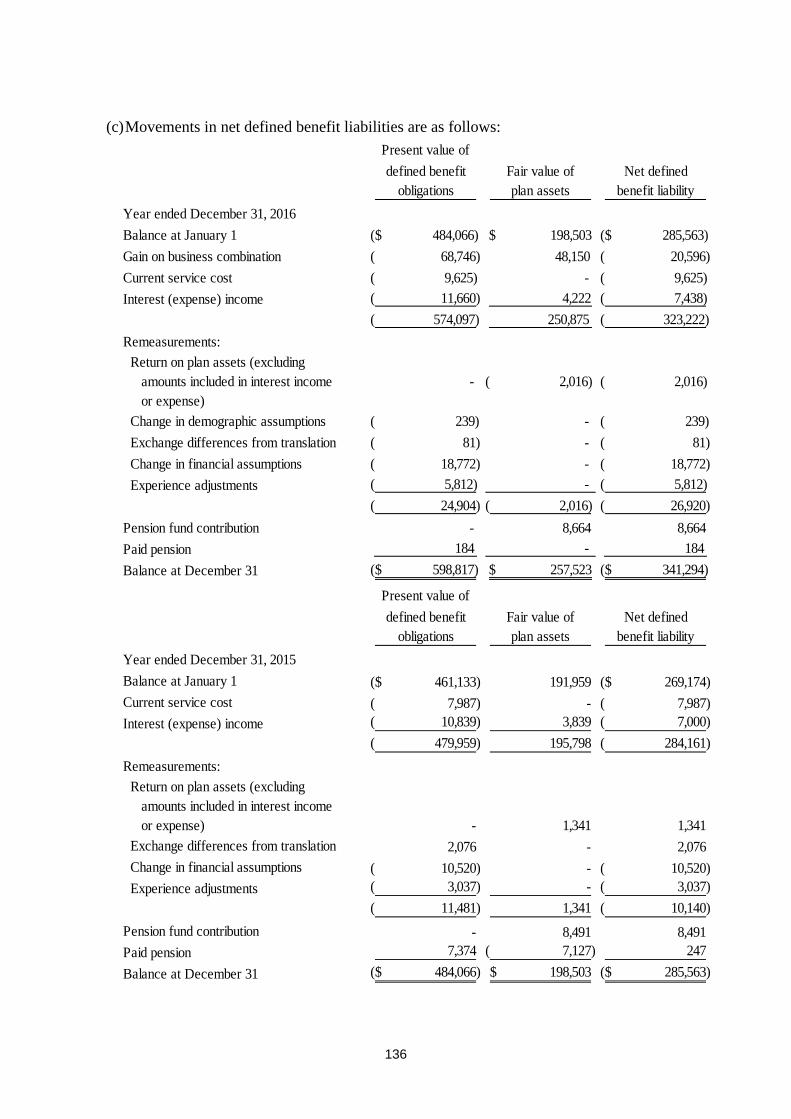
136
(c) Movements in net defined benefit liabilities are as follows:
Present value of
defined benefit Fair value of Net defined
obligations plan assets benefit liability
Year ended December 31, 2016
Balance at January 1 ($ 484,066) $ 198,503 ($ 285,563)
Gain on business combination ( 68,746) 48,150 ( 20,596)
Current service cost ( 9,625) - ( 9,625)
Interest (expense) income ( 11,660) 4,222 ( 7,438)
( 574,097) 250,875 ( 323,222)
Remeasurements:
Return on plan assets (excluding
amounts included in interest income
or expense)
- ( 2,016) ( 2,016)
Change in demographic assumptions ( 239) - ( 239)
Exchange differences from translation ( 81) - ( 81)
Change in financial assumptions ( 18,772) - ( 18,772)
Experience adjustments ( 5,812) - ( 5,812)
( 24,904) ( 2,016) ( 26,920)
Pension fund contribution - 8,664 8,664
Paid pension 184 - 184
Balance at December 31 ($ 598,817) $ 257,523 ($ 341,294)
Present value of
defined benefit Fair value of Net defined
obligations plan assets benefit liability
Year ended December 31, 2015
Balance at January 1 461,133)($ 191,959 269,174)($
Current service cost 7,987)( - 7,987)(
Interest (expense) income 10,839)( 3,839 7,000)(
479,959)( 195,798 284,161)(
Remeasurements:
Return on plan assets (excluding
amounts included in interest income
or expense) - 1,341 1,341
Exchange differences from translation 2,076 - 2,076
Change in financial assumptions 10,520)( - 10,520)(
Experience adjustments 3,037)( - 3,037)(
11,481)( 1,341 10,140)(
Pension fund contribution - 8,491 8,491
Paid pension 7,374 7,127)( 247
Balance at December 31 484,066)($ 198,503$ 285,563)($

137
(d) The Bank of Taiwan was commissioned to manage the Fund of the Company’s and domestic
subsidiaries’ defined benefit pension plan in accordance with the Fund’s annual investment and
utilisation plan and the “Regulations for Revenues, Expenditures, Safeguard and Utilisation of
the Labor Retirement Fund” (Article 6: The scope of utilisation for the Fund includes deposit
in domestic or foreign financial institutions, investment in domestic or foreign listed,
over-the-counter, or private placement equity securities, investment in domestic or foreign real
estate securitization products, etc.). With regard to the utilisation of the Fund, its minimum
earnings in the annual distributions on the final financial statements shall be no less than the
earnings attainable from the amounts accrued from two-year time deposits with the interest
rates offered by local banks. If the earnings is less than aforementioned rates, government shall
make payment for the deficit after being authorized by the Regulator. The Company has no
right to participate in managing and operating that fund and hence the Company is unable to
disclose the classification of plan asset fair value in accordance with IAS 19 paragraph 142.
The composition of fair value of plan assets as of December 31, 2016 and 2015 is given in the
Annual Labor Retirement Fund Utilisation Report announced by the government.
(e) The principal actuarial assumptions used were as follows:
i. The principal actuarial assumptions used for the Company and its subsidiaries in Taiwan
were as follows:
2016 2015
Discount rate 1.375%~1.40% 1.70%
Future salary increases 3.00%~4.00% 4.00%
Years ended December 31,
Future mortality rate was estimated based on the 5th Taiwan Standard Ordinary
Experience Mortality Table.
Because the main actuarial assumption changed, the present value of defined benefit
obligation is affected. The analysis was as follows:
Increase 0.25% Decrease 0.25% Increase 0.25% Decrease 0.25%
December 31, 2016
Effect on present value of defined
benefit obligation 14,626$ 15,124)($ 13,568)($ 13,143$
Discount rate Future salary increases
Increase 1% Decrease 1% Increase 1% Decrease 1%
December 31, 2015
Effect on present value of defined
benefit obligation 46,415$ 54,438)($ 47,768)($ 41,915$
Discount rate Future salary increases

138
The sensitivity analysis above is based on other conditions that are unchanged but only one
assumption is changed. In practice, more than one assumption may change all at once. The
method of analysing sensitivity and the method of calculating net pension liability in the
balance sheet are the same.
The method and assumptions used for the preparation of sensitivity analysis during 2016 and
during 2015 are the same, except the actuarial assumption of discount rate and future salary
increases.
ii. The principal actuarial assumptions used for foreign subsidiaries were as follows:
2016 2015
Discount rate 8.50% 9.00%
Future salary increases 9.00% 9.00%
Future mortality rate was estimated based on TMI 3 issued by Insurance Council of
Indonesia.
Because the main actuarial assumption changed, the present value of defined benefit
obligation is affected. The analysis were as follows:
Increase 1% Decrease 1% Increase 1% Decrease 1%
December 31, 2016
Effect on present value of defined
benefit obligation 4,962$ 5,901)($ 6,002)($ 5,128$
Discount rate Future salary increases
Increase 1% Decrease 1% Increase 1% Decrease 1%
December 31, 2015
Effect on present value of defined
benefit obligation 3,544$ 4,218)($ 4,309)($ 3,675$
Discount rate Future salary increases
(f) As of December 31, 2016, the weighted average duration of that retirement plan is 11~17.89
years.
(g) Expected contributions to the defined benefit pension plans of the Group for the year ending
December 31, 2017 amounts to $8,642.
B.(a) Effective July 1, 2005, the Company and its domestic subsidiaries have established a defined
contribution pension plan (the “New Plan”) under the Labor Pension Act (the “Act”), covering
all regular employees with R.O.C. nationality. Under the New Plan, the Company and its
domestic subsidiaries contribute monthly an amount based on 6% of the employees’ monthly
salaries and wages to the employees’ individual pension accounts at the Bureau of Labor
Insurance. The benefits accrued are paid monthly or in lump sum upon termination of
employment.
(b) The pension costs under defined contribution pension plans of the Group for the years ended
December 31, 2016 and 2015 were $60,773 and $43,341, respectively.

139
(c) No pension plan is established for Synnex Global Ltd., King's Eye Investments Ltd., Peer
Developments Ltd., Synnex China Holdings Ltd., Synnex Mauritius Ltd., Laser Computer
Holdings Ltd., and Trade Vanguard Golobal Ltd. since these companies are not required to
have an employee pension plan in accordance with the local legislation. Except for the above,
other consolidated overseas subsidiaries have established a funded defined contribution
pension plan and therefore, contribute monthly a certain percentage of the employees’ monthly
salaries and wages to the retirement fund. Except for monthly contributions to the retirement
fund, these companies have no further obligations. The pension costs under the defined
contribution pension plan for the years ended December 31, 2016 and 2015 were $242,689 and
$241,972, respectively.
(19) Share capital
A. As of December 31, 2016, the Company’s authorized capital was $22,000,000 (including
$500,000 reserved for the conversion of employees’ stock options which have not been issued).
The total number of shares of common stock, at $10 (in dollars) par value per share, issued and
outstanding, was 1,667,946,968 shares. All proceeds from shares issued have been collected.
Movements in the number of the Company’s ordinary shares outstanding are as follows:
2016 2015
At January 1 1,588,520,922 1,588,520,922
Stock dividends 79,426,046 -
At December 31 1,667,946,968 1,588,520,922
B. The stockholders at their annual stockholders’ meeting on June 8, 2016 adopted a resolution to
distribute dividends of common stock of $794,261 with the effective date set on September 5,
2016.
C. The Company issued common stock (Deposited Shares) through global depository shares
(GDSs) in Europe, Asia and the USA in 1997 and 1999. Each GDS represents 4 Deposited
Shares. The GDSs may not be offered, sold or delivered, directly or indirectly, in the R.O.C.
As of December 31, 2016, the total number of GDSs outstanding was 951,681 units,
representing 3,806,736 shares of common stock. The main terms and conditions of the GDSs
are as follows:
(a) Voting
Holders of GDSs have no right to directly exercise voting rights or attend the Company’s
stockholders’ meeting, except that a holder or holders together holding at least 51% of the
GDSs outstanding at the relevant record date of the stockholders’ meeting, can instruct the
Depositary to vote in the same direction in respect of one or more resolutions to be proposed
at the meeting.

140
(b) Sale and withdrawal of GDSs
Commencing three months after the initial issuance of GDSs, a holder of GDSs may,
provided that the Company has delivered to the custodian physical share certificates in
respect of the Deposited Shares, request the Depositary to sell or cause to be sold on behalf
of such holder the shares represented by such GDSs.
(c) Dividends
GDS holders are entitled to receive dividends to the same extent as the holders of common
stock subject to the terms of the Deposit Agreement and applicable laws of the R.O.C.
(20) Capital surplus
Pursuant to the R.O.C. Company Law, capital reserve arising from paid-in capital in excess of par
value on issuance of common stocks and donations can be used to cover accumulated deficit or to
issue new stocks or cash to shareholders in proportion to their share ownership, provided that the
Company has no accumulated deficit. Further, the R.O.C. Securities and Exchange Law requires
that the amount of capital reserve to be capitalized mentioned above should not exceed 10% of the
paid-in capital each year. Capital reserve should not be used to cover accumulated deficit unless
the legal reserve is insufficient.
Changes in equity
Treasury share of associates and
Share premium transactions joint ventures Stock options Total
At January 1 13,626,940$ 340,678$ 56,341)($ 228,445$ 14,139,722$
Changes in equity of associates
and joint ventures - - 56,341 - 56,341
At December 31 13,626,940$ 340,678$ -$ 228,445$ 14,196,063$
2016
Changes in equity
Treasury share of associates and
Share premium transactions joint ventures Stock options Total
At January 1 13,626,940$ 340,678$ 135,794$ 228,445$ 14,331,857$
Changes in equity of associates
and joint ventures - - 192,135)( - 192,135)(
At December 31 13,626,940$ 340,678$ 56,341)($ 228,445$ 14,139,722$
2015

141
(21) Retained earnings / Events after the balance sheet date
A. The Company’s Articles of Incorporation provide that current year’s net income, after
recovering any past losses and deducting all taxes in accordance with the law, shall be
distributed in the following order: (a) set aside 10% of the net income as legal reserve, (b) set
aside the special reserve in the amount of the net reduction of adjustments under the
stockholders’ equity for the current year related mainly to cumulative translation adjustments
and unrealized loss on long-term investments, (c) 30% to 100% of the remaining portion (plus
the retained earnings carried over from the last fiscal year as permitted by the Company Law)
shall be distributed as dividends to all stockholders in proportion to their individual holdings as
proposed by the Board of Directors and approved at the stockholders’ meeting. No less than
15% of total stockholders’ dividends may be distributed in the form of cash dividends.
B. Except for covering accumulated deficit or issuing new stocks or cash to shareholders in
proportion to their share ownership, the legal reserve shall not be used for any other purpose.
The use of legal reserve for the issuance of stocks or cash to shareholders in proportion to their
share ownership is permitted, provided that the distribution of the reserve is limited to the
portion in excess of 25% of the Company’s paid-in capital.
C. In accordance with the regulations, the Company shall set aside special reserve from the debit
balance on other equity items at the balance sheet date before distributing earnings. When debit
balance on other equity items is reversed subsequently, the reversed amount could be included
in the distributable earnings.
D. (a) The appropriation of 2015 and 2014 earnings had been resolved at the stockholders’
meeting on June 8, 2016 and June 12, 2015, respectively. Details are summarized below:
Dividends per Dividends per
Amount share (in dollars) Amount share (in dollars)
Legal reserve 318,600$ -$ 502,409$ -$
Special reserve 126,513 - 1,965,774)( -
Cash dividends 2,382,781 1.50 5,242,119 3.30
Stock dividends 794,261 0.50 - -
2015 2014
Years ended December 31,
(b) The appropriation of 2016 earnings had been proposed at the Board of Directors’ meeting
on March 17, 2017. Details are summarized below:
Dividends per
Amount share (in dollars)
Legal reserve 487,668$ -$
Special reserve 2,710,804 -
Cash dividends 1,667,947 1.00
E. For information relating to employees’ remuneration (bonus) and directors’ and supervisors’
remuneration, please refer to Note 6(28).

142
(22) Other equity items
Currency Available-for-sale
translation investments Total
At January 1, 2016 66,998)($ 59,515)($ 126,513)($
Transfer out for provision of
impairment- 40,000 40,000
Transfer out for revaluation - 94,099)( 94,099)(
Revaluation:
–Group - 317,765 317,765
–Associates - 2,707 2,707
Currency translation differences: -
–Group 2,794,008)( - 2,794,008)(
–Associates 183,170)( - 183,170)(
At December 31, 2016 3,044,176)($ 206,858$ 2,837,318)($
Currency Available-for-sale
translation investments Total
At January 1, 2015 65,918$ 57,971$ 123,889$
Transfer out for provision of
impairment- 85,000 85,000
Revaluation:
–Group - 201,226)( 201,226)(
–Associates - 1,260)( 1,260)(
Currency translation differences:
–Group 27,507)( - 27,507)(
–Associates 105,409)( - 105,409)(
At December 31, 2015 66,998)($ 59,515)($ 126,513)($
(23) Operating revenue
2016 2015
Sales revenue 342,085,713$ 321,650,942$
Other revenue 610,740 482,510
Total 342,696,453$ 322,133,452$
Years ended December 31,

143
(24) Other income
2016 2015
Rental revenue 577,169$ 528,059$
Interest income:
Interest income from bank deposits 294,035 930,379
Other interest income 135,606 97,121
Dividend income 143,936 124,749
Others 146,454 229,321
Total 1,297,200$ 1,909,629$
Years ended December 31,
(25) Other gains and losses
2016 2015
Net gains on financial assets at fair value
through profit or loss 103,820$ 18,437$
Net currency exchange losses 700,965)( 2,418,535)(
Gains on disposal of invested financial
assets 135,699 -
Impairment loss on financial assets 40,000)( 85,000)(
Gain on disposal of investments accounted
for using equity method 127,709 -
Losses on revaluation of investments
accounted for using equity method 42,359)( -
Losses on disposal of property, plant and
equipment and investment property 303)( 12,739)(
Related expense charges on investment property 178,063)( 192,348)(
Others 52,761)( 3,541)(
Total 647,223)($ 2,693,726)($
Years ended December 31,
(26) Finance costs
2016 2015
Interest expense:
Bank borrowings 601,847$ 760,813$
Short-term notes and bills payable 54,845 70,332
Finance costs 656,692$ 831,145$
Years ended December 31,
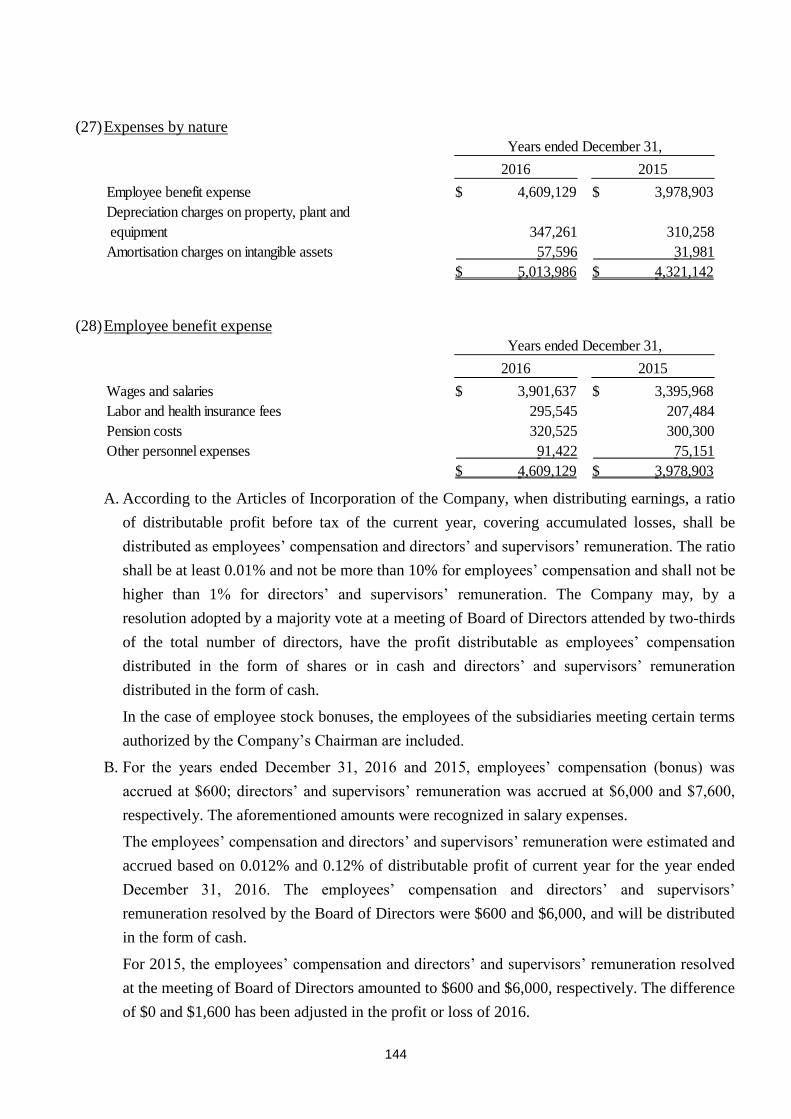
144
(27) Expenses by nature
2016 2015
Employee benefit expense 4,609,129$ 3,978,903$
Depreciation charges on property, plant and
equipment 347,261 310,258
Amortisation charges on intangible assets 57,596 31,981
5,013,986$ 4,321,142$
Years ended December 31,
(28) Employee benefit expense
2016 2015
Wages and salaries 3,901,637$ 3,395,968$
Labor and health insurance fees 295,545 207,484
Pension costs 320,525 300,300
Other personnel expenses 91,422 75,151
4,609,129$ 3,978,903$
Years ended December 31,
A. According to the Articles of Incorporation of the Company, when distributing earnings, a ratio
of distributable profit before tax of the current year, covering accumulated losses, shall be
distributed as employees’ compensation and directors’ and supervisors’ remuneration. The ratio
shall be at least 0.01% and not be more than 10% for employees’ compensation and shall not be
higher than 1% for directors’ and supervisors’ remuneration. The Company may, by a
resolution adopted by a majority vote at a meeting of Board of Directors attended by two-thirds
of the total number of directors, have the profit distributable as employees’ compensation
distributed in the form of shares or in cash and directors’ and supervisors’ remuneration
distributed in the form of cash.
In the case of employee stock bonuses, the employees of the subsidiaries meeting certain terms
authorized by the Company’s Chairman are included.
B. For the years ended December 31, 2016 and 2015, employees’ compensation (bonus) was
accrued at $600; directors’ and supervisors’ remuneration was accrued at $6,000 and $7,600,
respectively. The aforementioned amounts were recognized in salary expenses.
The employees’ compensation and directors’ and supervisors’ remuneration were estimated and
accrued based on 0.012% and 0.12% of distributable profit of current year for the year ended
December 31, 2016. The employees’ compensation and directors’ and supervisors’
remuneration resolved by the Board of Directors were $600 and $6,000, and will be distributed
in the form of cash.
For 2015, the employees’ compensation and directors’ and supervisors’ remuneration resolved
at the meeting of Board of Directors amounted to $600 and $6,000, respectively. The difference
of $0 and $1,600 has been adjusted in the profit or loss of 2016.

145
Information about employees’ compensation and directors’ and supervisors’ remuneration of
the Company as resolved by the Board of Directors will be posted in the “Market Observation
Post System” at the website of the Taiwan Stock Exchange.
(29) Income tax
A. Income tax expense
(a) Components of income tax expense:
2016 2015
Current tax:
Current tax liabilities 1,043,353$ 1,229,110$
Current tax assets 222,828)( 172,509)(
Tax payable from prior years 712,675)( 604,567)(
Current tax on profits for the period 107,850 452,034
(Over) underestimation of prior year’s income tax 39,335)( 78,865)(
Prepaid income tax 676,933 631,342
Gain on business combinations 9,523)( -
Additional 10% tax on undistributed earnings - 125,518)(
Total current tax 735,925 878,993
Deferred tax:
Origination and reversal of temporary differences 135,184)( 685,636)(
Total deferred tax 135,184)( 685,636)(
Others:
Additional 10% tax on undistributed earnings - 125,518
Income tax expense 600,741$ 318,875$
Years ended December 31,
(b) The income tax relating to components of other comprehensive income is as follows:
2016 2015
Remeasurement of defined benefit obligations 3,785$ 1,563$
Years ended December 31,

146
B. Reconciliation between income tax expense and accounting profit
2016 2015
Tax calculated based on profit before tax and statutory
tax rate 1,483,667$ 667,824$
Effects from items disallowed by tax regulation 290,131)( 123,542
Tax exempted income by tax regulation 66,908)( 31,491)(
Temporary difference not recognised as deferred tax
liabitities 714,903)( 487,653)(
Taxable loss not recognised as deferred tax assets 228,351 -
Additional 10% tax on undistributed earnings - 125,518
Overestimation of prior year’s income tax 39,335)( 78,865)(
Income tax expense 600,741$ 318,875$
C. Amounts of deferred tax assets or liabilities as a result of temporary difference and loss
carryforward are as follows:
Recognized
Acquired from in other
business Recognized in comprehensive Effects on
January 1, combinations profit or loss income exchange rate December 31,
Temporary differences:
-Deferred tax assets:
Unrealized bad debts 375,216$ 1,185$ 82,817$ -$ 21,839)($ 437,379$
Unrealized loss on inventory value
decline75,009 9,081 20,654 - 4,981)( 99,763
Depreciation 16,674 - 1,779 - 877)( 17,576
Unrealised exchange loss 7,740 - 23,696)( - 164 15,792)(
Unused compensated absences 41,191 1,196 3,343 - 1,705)( 44,025
Accrued pensions 42,368 4,733 1,745 3,785 217 52,848
Unrealized accrued expenses 130,186 572 77,868)( - 2,515)( 50,375
Loss carryforward (Note) 499,813 680 165,551 - 44,902)( 621,142
Subtotal 1,188,197$ 17,447$ 174,325$ 3,785$ 76,438)($ 1,307,316$
-Deferred tax liabilities:
Unrealised purchase discount 62,845)($ -$ 48,039)($ -$ 5,033$ 105,851)($
Unrealised exchange gain - 45)( 985)( - - 1,030)(
Others 49,134)( - 9,883 - 1,828 37,423)(
Subtotal 111,979)($ 45)($ 39,141)($ -$ 6,861$ 144,304)($
Total 1,076,218$ 17,402$ 135,184$ 3,785$ 69,577)($ 1,163,012$
Year ended December 31, 2016

147
Recognized
in other
Recognized in comprehensive Effects on
January 1, profit or loss income exchange rate December 31,
Temporary differences:
-Deferred tax assets:
Unrealized bad debts 274,523$ 119,821$ -$ 19,128)($ 375,216$
Unrealized loss on inventory value decline 84,115 5,282)( - 3,824)( 75,009
Depreciation 17,353 171 - 850)( 16,674
Unrealised exchange loss 8,362 227)( - 395)( 7,740
Unused compensated absences 43,461 601)( - 1,669)( 41,191
Accrued pensions 40,645 645)( 1,563 805 42,368
Unrealized accrued expenses 78,072 58,751 - 6,637)( 130,186
Loss carryforward (Note) 51,379 473,914 - 25,480)( 499,813
Subtotal 597,910$ 645,902$ 1,563$ 57,178)($ 1,188,197$
-Deferred tax liabilities:
Unrealised purchase discount 132,851)($ 66,919$ -$ 3,087$ 62,845)($
Others 24,361)( 27,185)( - 2,412 49,134)(
Subtotal 157,212)($ 39,734$ -$ 5,499$ 111,979)($
Total 440,698$ 685,636$ 1,563 51,679)($ 1,076,218$
Year ended December 31, 2015
Note: Realised but unused loss carryforward from expected future taxable profits.
D. Expiration dates of unused tax losses and amounts of unrecognised deferred tax assets are as
follows:
Amount filed Deferred tax
Year incurred /assessed Unused amount assets Expiry year
2012~2016 3,750,405$ 3,750,405$ 1,333,165$ 2017~2022
December 31, 2016
Amount filed Deferred tax
Year incurred /assessed Unused amount assets Expiry year
2012~2015 2,346,421$ 2,346,421$ 372,195$ 2016~2022
December 31, 2015
E. The amounts of deductible temporary difference that are not recognised as deferred tax assets
are as follows:
December 31, 2016 December 31, 2015
Deductible temporary differences 15,935$ 79,922$
F. The subsidiaries’ losses are allowed to be carried forward from 2017 to 2022.
G. The Company has not recognised taxable temporary differences associated with investment in
subsidiaries as deferred tax liabilities. As of December 31, 2016 and 2015, the amounts of
temporary difference unrecognised as deferred tax liabilities were $7,296,663 and $7,089,038,
respectively.

148
H. As of December 31, 2016, the Company’s income tax returns through 2014 have been assessed
and approved by the Tax Authority.
I. Unappropriated retained earnings:
December 31, 2016 December 31, 2015
Earnings generated in and after 1998 7,992,064$ 6,823,082$
J. As of December 31, 2016 and 2015, the balance of the imputation tax credit account was
$182,135 and $205,499, respectively. The creditable tax rate was 5.31% for 2015 and is
estimated to be 2.53% for 2016.
(30) Earnings per share
Weighted average
number of ordinary
shares outstanding Earnings per
Amount after tax (share in thousands) share (in dollars)
Basic earnings per share
Profit attributable to ordinary shareholders
of the parent 4,876,679$ 1,667,947 2.92$
Diluted earnings per share
Profit attributable to ordinary shareholders
of the parent 4,876,679 1,667,947
Assumed conversion of all dilutive potential
ordinary shares
Employees’ bonus - 28
Profit attributable to ordinary shareholders
of the parent plus assumed conversion of
all dilutive potential ordinary shares 4,876,679$ 1,667,975 2.92$
Year ended December 31, 2016

149
Weighted average
number of ordinary
shares outstanding Earnings per
Amount after tax (share in thousands) share (in dollars)
Basic earnings per share
Profit attributable to ordinary shareholders
of the parent 3,185,995$ 1,667,947 1.91$
Diluted earnings per share
Profit attributable to ordinary shareholders
of the parent 3,185,995 1,667,947
Assumed conversion of all dilutive potential
ordinary shares
Employees’ bonus - 31
Profit attributable to ordinary shareholders
of the parent plus assumed conversion of
all dilutive potential ordinary shares 3,185,995$ 1,667,978 1.91$
Year ended December 31, 2015
(31) Business combinations
A. To expand the scale of entire operation and exert synergy of economic of scale, on April 7,
2016, the Group acquired 55.41% of the share capital of Bestcom Infotech Corp for $1,029,289,
and also acquired 3.73% of the share capital for $69,369 through Section 30 of the Business
Mergers And Acquisitions Act, and with 40.86% of the share capital it already held, the Group
now had 100% of the share capital and obtained the control.
B. The following table summarizes the consideration paid for Bestcom Infotech Corp and the fair
values of the assets acquired and liabilities assumed at the acquisition date, as well as the
non-controlling interest’s proportionate share of the recognised amounts of acquiree’s
identifiable net assets at the acquisition date:

150
April 7, 2016
Purchase consideration – cash paid 1,098,658$
Fair value of equity interest in Bestcom Infotech Corp held before the
business combination759,002
1,857,660
Fair value of the identifiable assets acquired and liabilities assumed
Cash and cash equivalents 153,570
Notes receivable 76,668
Accounts receivable (including lease payments receivable) 1,867,428
Other receivables 40,842
Inventories 619,293
Other current assets 43,708
Non-current available-for-sale financial assets 31,466
Investments accounted for using equity method 63,755
Property, plant and equipment 20,532
Intangible assets 7,114
Other non-current assets 149,328
Short-term borrowings 250,389)(
Short-term notes and bills payable 300,000)(
Notes payable 60,548)(
Accounts payable 558,376)(
Other payable 229,940)(
Current tax liabilities 28,598)(
Other current liabilities 7,031)(
Other non-current liabilities 20,641)(
Total identifiable net assets 1,618,181
Goodwill 239,479$
C. The Group recognised a loss of $42,359 as a result of measuring at fair value its 40.86% equity
interest in Bestcom Infotech Corp held before the business combination.
D. The operating revenue included in the consolidated statement of comprehensive income since
April 7, 2016 contributed by Bestcom Infotech Corp was $9,135,149. Bestcom Infotech Corp
also contributed profit before income tax of $196,432 over the same period. Had Bestcom
Infotech Corp been consolidated from January 1, 2016, the consolidated statement of
comprehensive income would increase operating revenue of $2,301,849 and profit before
income tax of $33,522.

151
(32) Operating leases
The Group leases office buildings to others under non-cancellable operating lease agreements. For
the years ended December 31, 2016 and 2015, the Group recognised rental revenue of $577,169
and $528,059, respectively. The Group has leased a series of operating leases to several
companies, and these leases have terms expiring between 2017 and 2022, and some leases are
renewable at the end of the lease period. The future aggregate minimum lease payments receivable
under non-cancellable operating leases are as follows:
December 31, 2016 December 31, 2015
Not later than one year 367,490$ 430,751$
Later than one year but not later than five years 908,578 1,159,086
Later than five years 131,490 247,881
1,407,558$ 1,837,718$
(33) Supplemental cash flow information
A. Investing activities with partial cash payments:
2016 2015
Purchase of property, plant and equipment 507,476$ 927,750$
Add: opening balance of payable on equipment 53,078 95,253
Less: ending balance of payable on equipment 43,626)( 53,078)(
Effects on exchange rate 2,946)( 986
Cash paid during the period 513,982$ 970,911$
Years ended December 31,
2016 2015
Purchase of intangible assets 70,672$ 56,861$
Add: opening balance of other payables 33,756 8,182
Less: ending balance of other payables 17,899)( 33,756)(
Effects on exchange rate 258)( -
Cash paid during the period 86,271$ 31,287$
Years ended December 31,
B. The Group acquired 100% of the share capital of Bestcom Infotech Corp. on April 7, 2016. For
the summary of the consideration paid for Bestcom Infotech Corp. and the fair values of the
assets acquired and liabilities, please refer to Note 6(31).
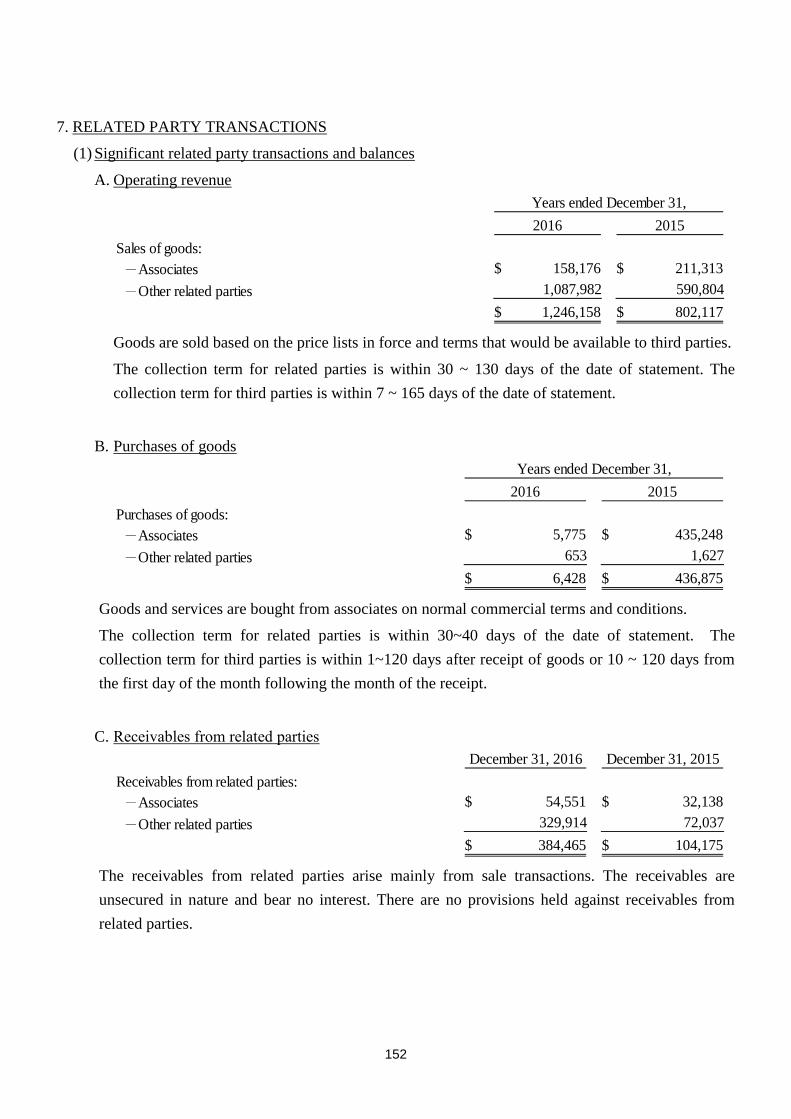
152
7. RELATED PARTY TRANSACTIONS
(1) Significant related party transactions and balances
A. Operating revenue
2016 2015
Sales of goods:
-Associates 158,176$ 211,313$
-Other related parties 1,087,982 590,804
1,246,158$ 802,117$
Years ended December 31,
Goods are sold based on the price lists in force and terms that would be available to third parties.
The collection term for related parties is within 30 ~ 130 days of the date of statement. The
collection term for third parties is within 7 ~ 165 days of the date of statement.
B. Purchases of goods
2016 2015
Purchases of goods:
-Associates 5,775$ 435,248$
-Other related parties 653 1,627
6,428$ 436,875$
Years ended December 31,
Goods and services are bought from associates on normal commercial terms and conditions.
The collection term for related parties is within 30~40 days of the date of statement. The
collection term for third parties is within 1~120 days after receipt of goods or 10 ~ 120 days from
the first day of the month following the month of the receipt.
C. Receivables from related parties
December 31, 2016 December 31, 2015
Receivables from related parties:
-Associates 54,551$ 32,138$
-Other related parties 329,914 72,037
384,465$ 104,175$
The receivables from related parties arise mainly from sale transactions. The receivables are
unsecured in nature and bear no interest. There are no provisions held against receivables from
related parties.
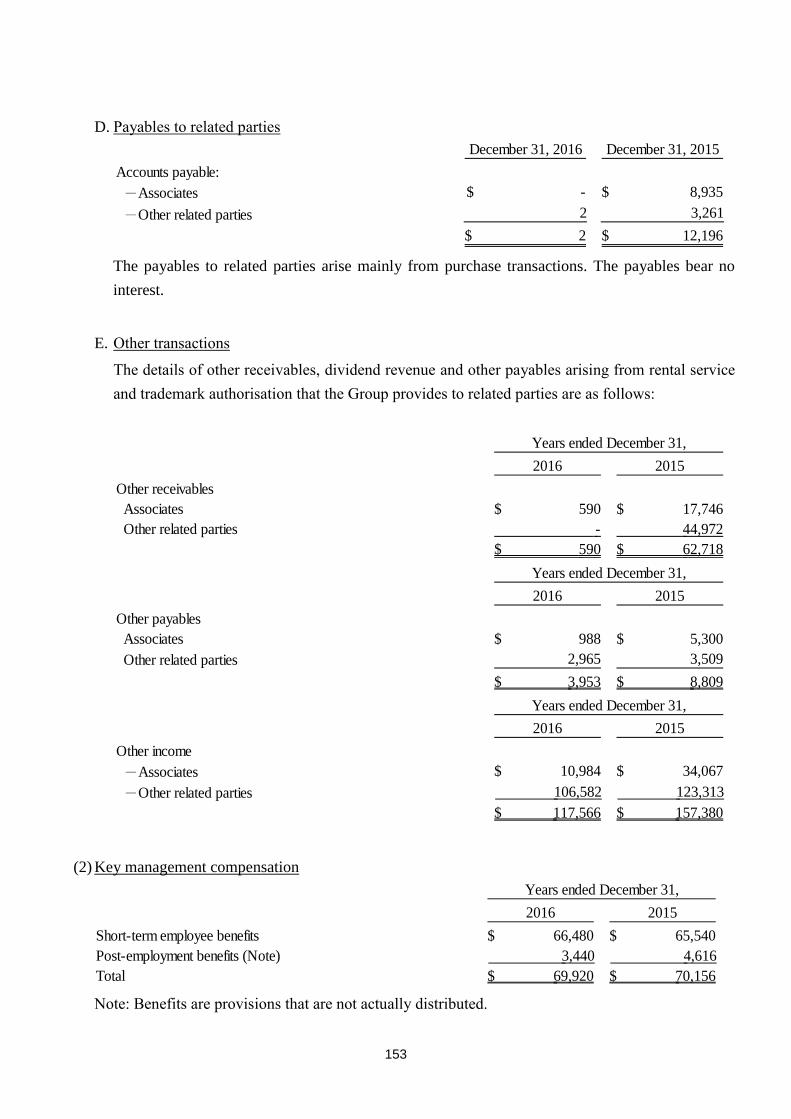
153
D. Payables to related parties
December 31, 2016 December 31, 2015
Accounts payable:
-Associates -$ 8,935$
-Other related parties 2 3,261
2$ 12,196$
The payables to related parties arise mainly from purchase transactions. The payables bear no
interest.
E. Other transactions
The details of other receivables, dividend revenue and other payables arising from rental service
and trademark authorisation that the Group provides to related parties are as follows:
2016 2015
Other receivables
Associates 590$ 17,746$
Other related parties - 44,972
590$ 62,718$
Years ended December 31,
2016 2015
Other payables
Associates 988$ 5,300$
Other related parties 2,965 3,509
3,953$ 8,809$
Years ended December 31,
2016 2015
Other income
-Associates 10,984$ 34,067$
-Other related parties 106,582 123,313
117,566$ 157,380$
Years ended December 31,
(2) Key management compensation
2016 2015
Short-term employee benefits 66,480$ 65,540$
Post-employment benefits (Note) 3,440 4,616
Total 69,920$ 70,156$
Years ended December 31,
Note: Benefits are provisions that are not actually distributed.

154
8. PLEDGED ASSETS
The Group’s assets pledged as collateral are as follows:
Pledged asset December 31, 2016 December 31, 2015 Purpose
Accounts receivable -$ 1,486,160$ Pledged for short-term borrowings
Inventories - 1,411,021 Pledged for short-term borrowings
Other current assets:
Pledged time deposits 20,015 - Secured loans and warranty
guarantees
Other non-current assets:
Pledged time deposits 260,562 1,060,420 Guarantees for purchases; short-term
secured loans and promissory notes.
Property, plant and equipment:
225,353 238,390
505,930$ 4,195,991$
Book value
Land and buildings Guarantees for secured loans of
Fortune Ideal Ltd. (Actual but not
used)
9. SIGNIFICANT CONTINGENT LIABILITIES AND UNRECOGNISED CONTRACT COMMITMENTS
(1) Contingencies
A. As of December 31, 2016 and 2015, the Group issued promissory notes to guarantee the
suppliers’ credit limit amounting to $2,130,210 and $713,960, respectively, for inventory
purchases.
B. On November 24, 2015, Kunshan Kunhao Electromechanical Co.Ltd. (Kunhao) filed a lawsuit
against Syntech Asia Ltd. (SAL), the Company’s indirect wholly-owned subsidiary, in the Hong
Kong High Court for breach of oral contract of sales on July 7, 2014 and requested SAL to
compensate Kunhao for its losses amounting to USD 2,964 thousands. SAL disagreed with the
request and raised an appeal in accordance with Hong Kong laws. SAL submitted an application
to the Hong Kong High Court in February 1, 2016 and requested the Hong Kong High Court to
deny the claim of Kunhao. The Hong Kong High Court has not yet begun formal court hearings
on the lawsuit, so the result of the litigation is uncertain. Therefore, the Group has not estimated
the potential losses in the financial statements.

155
C. On December 22, 2014, Fairchild Semiconductor International, Inc. and Fairchild
Semiconductor Corporation filed a third party lawsuit against the Company and Synnex
Electronic Hong Kong Ltd, in United States District Court for Massachusetts for breach of
agency contract since the Company and Synnex Electronic Hong Kong Ltd did not state the limit
of warranty liability. This caused Fairchild to bear a significant amount of warranty liability that
Fairchild requested the Company and Synnex Electronic Hong Kong Ltd to compensate for its
losses amounting to USD 30,000 thousand. For this lawsuit, the Company and Synnex Electronic
Hong Kong Ltd advocated that Fairchild breached the personal jurisdiction and had insufficient
reason to prosecute. The United States District Court agreed with the Company and Synnex
Electronic Hong Kong Ltd and dismissed the lawsuit by Fairchild on June 18, 2015. In the first
quarter of 2016, Fairchild Semiconductor Hong Kong Limited filed a lawsuit against the
Company again in Hong Kong International Arbitration Centre. The Hong Kong International
Arbitration Centre has not yet begun formal court hearings on the lawsuit, so the result of the
litigation is uncertain. Therefore, the Company has not estimated the potential losses in the
financial statements.
(2) Commitments
A. Capital expenditure contracted for at the balance sheet date but not yet incurred is as follows:
December 31, 2016 December 31, 2015
Property, plant and equipment 512,989$ 140,668$
B. Operating lease agreements
The Group leases in offices under non-cancellable operating lease agreements. The future aggregate
minimum lease payments under non-cancellable operating leases are as follows:
December 31, 2016 December 31, 2015
Not later than one year 377,077$ 312,262$
Later than one year but not later than five years 199,963 373,471
Later than five years 591 89
Total 577,631$ 685,822$
10. SIGNIFICANT DISASTER LOSS
None.
11. SIGNIFICANT EVENTS AFTER THE BALANCE SHEET DATE
The appropriations of 2016 earnings had been proposed at the Board of Directors’ meeting on March
17, 2017, please refer to Note 6(21).

156
12. OTHERS
(1) Capital management
The Group’s objectives when managing capital are to safeguard the Group’s ability to continue as
a going concern in order to provide returns for shareholders and to maintain an optimal capital
structure to reduce the cost of capital. In order to maintain or adjust the capital structure, the
Group may adjust the amount of dividends paid to shareholders, return capital to shareholders,
issue new shares or sell assets to reduce debt. The Group monitors capital on the basis of the
gearing ratio. This ratio is calculated as net debt divided by total capital. Net debt is calculated as
total borrowings (including ‘current and non-current borrowings’ as shown in the consolidated
balance sheet) less cash and cash equivalents. Total capital is calculated as ‘equity’ as shown in
the consolidated balance sheet plus net debt.
During 2016, the Group’s strategy was unchanged from 2015. The gearing ratios at December 31,
2016 and 2015 were 66% and 67%, respectively.
(2) Financial instruments
A. Fair value information of financial instruments
Except for those listed in the table below, the carrying amounts of the Group’s financial
instruments not measured at fair value (including cash and cash equivalents, notes receivable,
accounts receivable, other receivables, short-term borrowing, notes payable, accounts payable
and other payables) are approximate to their fair values. The fair value information of financial
instruments measured at fair value is provided in Note 12(3).
Book value Fair value
Financial assets:
Other financial assets (shown as other non-current
assets) 957,092$ 957,092$
Financial liabilities:
Deposits received (shown as other non-current
liabilities) 138,333$ 138,333$
December 31, 2016
Book value Fair value
Financial assets:
Other financial assets (shown as other non-current
assets) 1,283,690$ 1,283,690$
Financial liabilities:
Deposits received (shown as other non-current
liabilities) 169,975$ 169,975$
December 31, 2015

157
B. Financial risk management policies
The Group’s activities expose it to a variety of financial risks: market risk (including foreign
exchange risk, interest rate risk and price risk), credit risk and liquidity risk. The Group’s
overall risk management programme focuses on the unpredictability of financial markets and
seeks to minimise potential adverse effects on the Group’s financial position and financial
performance.
C. Significant financial risks and degrees of financial risks
(a) Market risk
Foreign exchange risk
i. The Group operates internationally and is exposed to foreign exchange risk arising from
various currency exposures, primarily with respect to the USD and RMB. Foreign
exchange risk arises from future commercial transactions, recognised assets and
liabilities and net investments in foreign operations.
ii. Management has set up a policy to require group companies to manage their foreign
exchange risk against their functional currency. The group companies are required to
hedge their entire foreign exchange risk exposure with the Group treasury. To manage
their foreign exchange risk arising from future commercial transactions and recognised
assets and liabilities, entities in the Group use forward foreign exchange contracts,
transacted with Group treasury. Foreign exchange risk arises when future commercial
transactions or recognised assets or liabilities are denominated in a currency that is not
the entity’s functional currency.
iii. The Group’s businesses involve some non-functional currency operations (the
Company’s and certain subsidiaries’ functional currency: NTD; other certain
subsidiaries’ functional currency: RMB, USD and AUD). The information on assets and
liabilities denominated in foreign currencies whose values would be materially affected
by the exchange rate fluctuations is as follows:

158
December 31, 2016
Foreign currency
amount
(In thousands)
(Note 2)
Exchange
rate
Book value
(NTD)
(Foreign currency: functional
currency)
Financial assets
Monetary items
USD:NTD $ 198,058 32.30 $ 6,397,273
USD:HKD (Note 1) 123,346 7.75 3,984,153
USD:AUD (Note 1) 4,779 1.39 154,358
Non-monetary items
INR:USD (Note 1) $ 7,367,343 0.0147 $ 3,498,088
THB:USD (Note 1) 975,948 0.0286 901,561
Financial liabilities
Monetary items
USD:NTD $ 71,879 32.30 $ 2,321,685
USD:HKD (Note 1) 166,392 7.75 5,374,552
USD:AUD (Note 1) 4,397 1.39 142,019
USD:RMB (Note 1) 312,781 6.93 10,099,654
December 31, 2015
Foreign currency
amount
(In thousands)
(Note 2)
Exchange
rate
Book value
(NTD)
(Foreign currency: functional
currency)
Financial assets
Monetary items
USD:NTD $ 91,924 32.88 $ 3,022,461
USD:HKD (Note 1) 144,507 7.75 4,749,677
USD:AUD (Note 1) 5,113 1.37 168,125
Non-monetary items
INR:USD (Note 1) $ 6,348,564 0.0151 $ 3,151,986
THB:USD (Note 1) 909,387 0.0285 852,169
Financial liabilities
Monetary items
USD:NTD $ 43,107 32.88 $ 1,417,353
USD:HKD (Note 1) 253,148 7.75 8,320,523

159
USD:AUD (Note 1) 4,405 1.37 144,844
USD:RMB (Note 1) 983,095 6.49 32,324,160
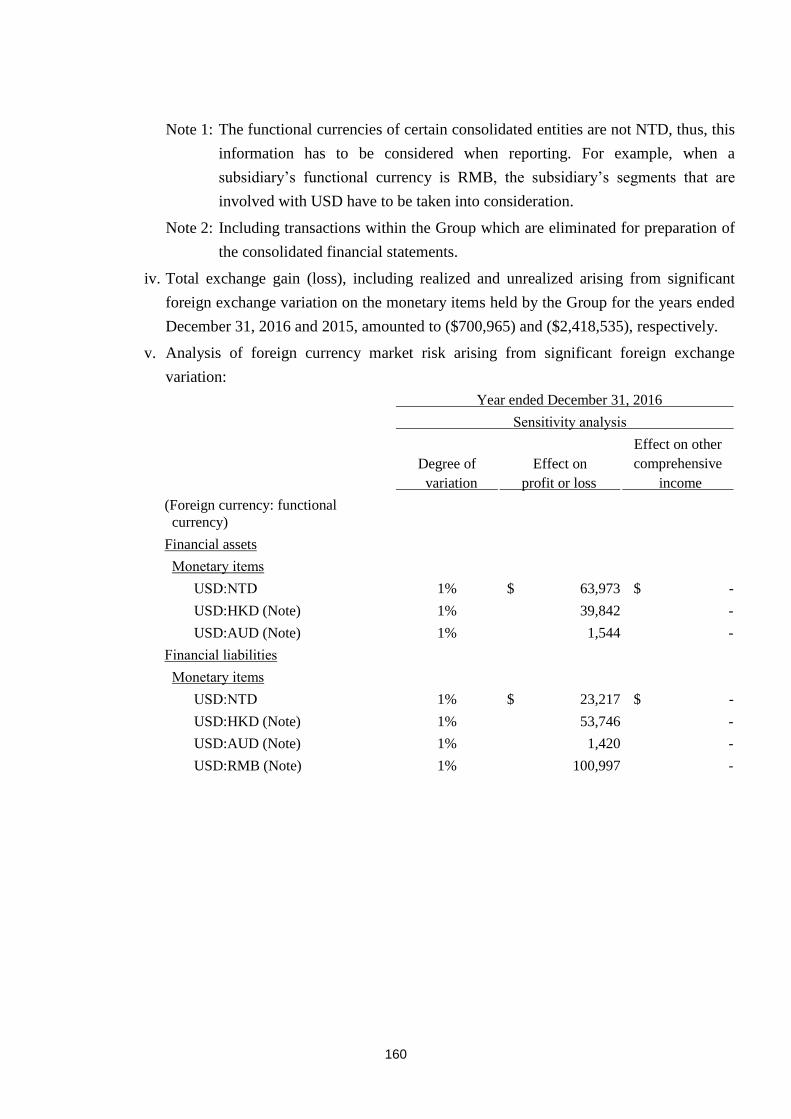
160
Note 1: The functional currencies of certain consolidated entities are not NTD, thus, this
information has to be considered when reporting. For example, when a
subsidiary’s functional currency is RMB, the subsidiary’s segments that are
involved with USD have to be taken into consideration.
Note 2: Including transactions within the Group which are eliminated for preparation of
the consolidated financial statements.
iv. Total exchange gain (loss), including realized and unrealized arising from significant
foreign exchange variation on the monetary items held by the Group for the years ended
December 31, 2016 and 2015, amounted to ($700,965) and ($2,418,535), respectively.
v. Analysis of foreign currency market risk arising from significant foreign exchange
variation:
Year ended December 31, 2016
Sensitivity analysis
Degree of
variation
Effect on
profit or loss
Effect on other
comprehensive
income
(Foreign currency: functional
currency)
Financial assets
Monetary items
USD:NTD 1% $ 63,973 $ -
USD:HKD (Note) 1% 39,842 -
USD:AUD (Note) 1% 1,544 -
Financial liabilities
Monetary items
USD:NTD 1% $ 23,217 $ -
USD:HKD (Note) 1% 53,746 -
USD:AUD (Note) 1% 1,420 -
USD:RMB (Note) 1% 100,997 -

161
Year ended December 31, 2015
Sensitivity analysis
Degree of
variation
Effect on
profit or loss
Effect on other
comprehensive
income
(Foreign currency: functional
currency)
Financial assets
Monetary items
USD:NTD 1% $ 30,225 $ -
USD:HKD (Note) 1% 47,497 -
USD:AUD (Note) 1% 1,681 -
Financial liabilities
Monetary items
USD:NTD 1% $ 14,174 $ -
USD:HKD (Note) 1% 83,205 -
USD:AUD (Note) 1% 1,448 -
USD:RMB (Note) 1% 323,242 -
Note: The functional currencies of certain subsidiaries belonging to the Group are not
NTD, thus, this information has to be considered when reporting. For example,
when a subsidiary’s functional currency is RMB, the subsidiary’s segments that
are involved with USD have to be taken into consideration.
Price risk
The Group is exposed to equity securities price risk because of investments held by the
Group and classified on the consolidated balance sheet either as available-for-sale or at fair
value through profit or loss. To manage its price risk arising from investments in equity
securities, the Group diversifies its portfolio. Diversification of the portfolio is done in
accordance with the limits set by the Group.
The Group’s investments in equity securities comprise domestic listed and unlisted stocks.
The prices of equity securities would change due to the change of the future value of
investee companies. If the prices of these equity securities had increased/decreased by 1%
with all other variables held constant, post-tax profit for the years ended December 31, 2016
and 2015 would have increased/decreased by $5,342 and $4,241, respectively, as a result of
gains/losses on equity securities classified as at fair value through profit or loss. Other
components of equity would have increased/decreased by $15,574 and $14,333, respectively,
as a result of gains/losses on equity securities classified as available-for-sale.
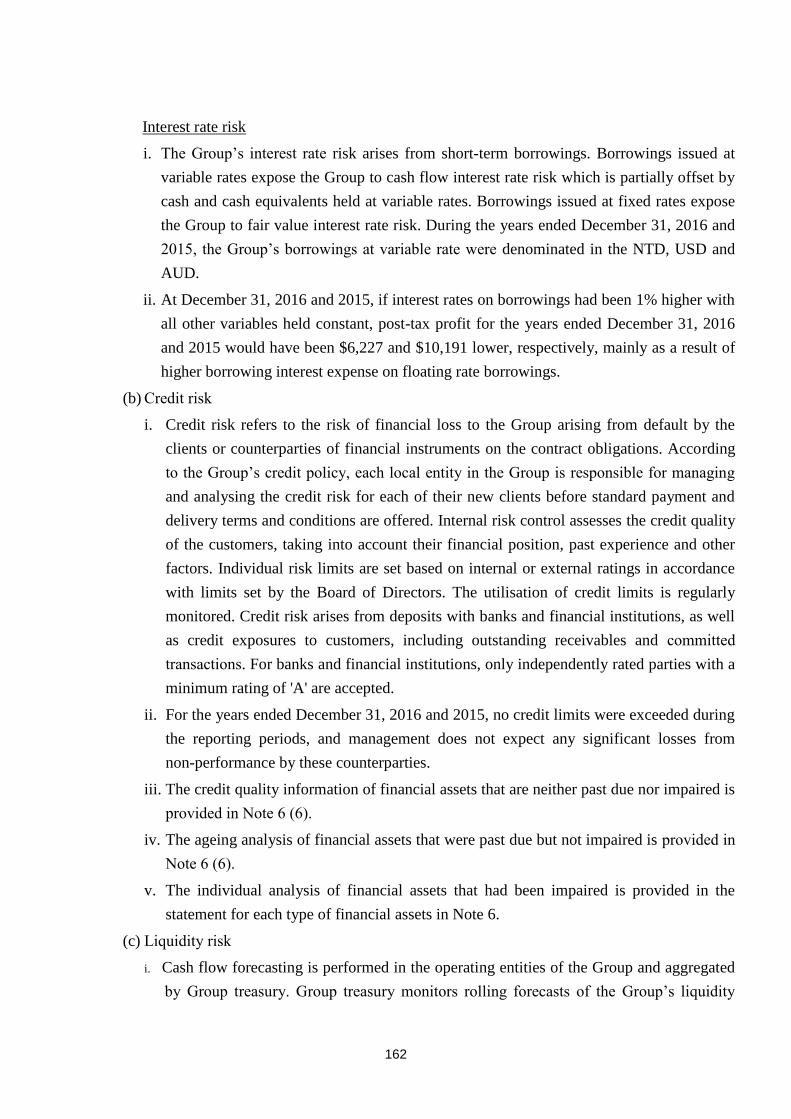
162
Interest rate risk
i. The Group’s interest rate risk arises from short-term borrowings. Borrowings issued at
variable rates expose the Group to cash flow interest rate risk which is partially offset by
cash and cash equivalents held at variable rates. Borrowings issued at fixed rates expose
the Group to fair value interest rate risk. During the years ended December 31, 2016 and
2015, the Group’s borrowings at variable rate were denominated in the NTD, USD and
AUD.
ii. At December 31, 2016 and 2015, if interest rates on borrowings had been 1% higher with
all other variables held constant, post-tax profit for the years ended December 31, 2016
and 2015 would have been $6,227 and $10,191 lower, respectively, mainly as a result of
higher borrowing interest expense on floating rate borrowings.
(b) Credit risk
i. Credit risk refers to the risk of financial loss to the Group arising from default by the
clients or counterparties of financial instruments on the contract obligations. According
to the Group’s credit policy, each local entity in the Group is responsible for managing
and analysing the credit risk for each of their new clients before standard payment and
delivery terms and conditions are offered. Internal risk control assesses the credit quality
of the customers, taking into account their financial position, past experience and other
factors. Individual risk limits are set based on internal or external ratings in accordance
with limits set by the Board of Directors. The utilisation of credit limits is regularly
monitored. Credit risk arises from deposits with banks and financial institutions, as well
as credit exposures to customers, including outstanding receivables and committed
transactions. For banks and financial institutions, only independently rated parties with a
minimum rating of 'A' are accepted.
ii. For the years ended December 31, 2016 and 2015, no credit limits were exceeded during
the reporting periods, and management does not expect any significant losses from
non-performance by these counterparties.
iii. The credit quality information of financial assets that are neither past due nor impaired is
provided in Note 6 (6).
iv. The ageing analysis of financial assets that were past due but not impaired is provided in
Note 6 (6).
v. The individual analysis of financial assets that had been impaired is provided in the
statement for each type of financial assets in Note 6.
(c) Liquidity risk
i. Cash flow forecasting is performed in the operating entities of the Group and aggregated
by Group treasury. Group treasury monitors rolling forecasts of the Group’s liquidity
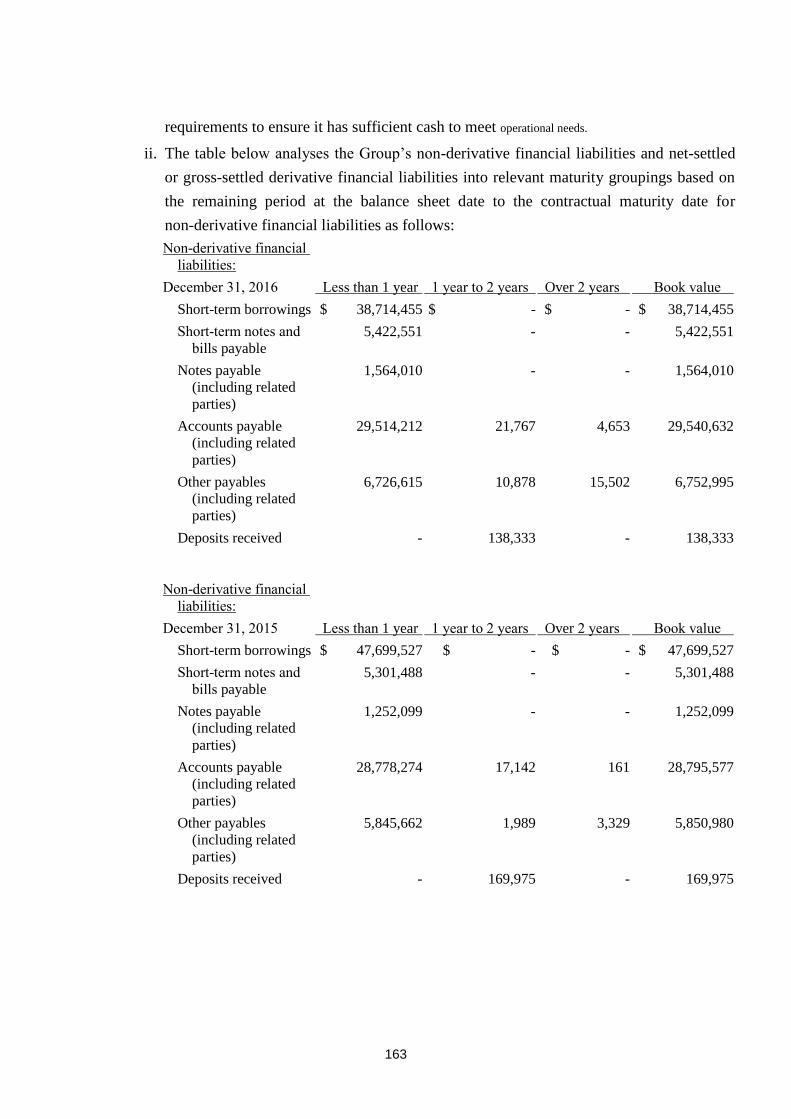
163
requirements to ensure it has sufficient cash to meet operational needs.
ii. The table below analyses the Group’s non-derivative financial liabilities and net-settled
or gross-settled derivative financial liabilities into relevant maturity groupings based on
the remaining period at the balance sheet date to the contractual maturity date for
non-derivative financial liabilities as follows:
Non-derivative financial
liabilities:
December 31, 2016 Less than 1 year 1 year to 2 years Over 2 years Book value
Short-term borrowings $ 38,714,455 $ - $ - $ 38,714,455
Short-term notes and
bills payable
5,422,551 - - 5,422,551
Notes payable
(including related
parties)
1,564,010 - - 1,564,010
Accounts payable
(including related
parties)
29,514,212 21,767 4,653 29,540,632
Other payables
(including related
parties)
6,726,615 10,878 15,502 6,752,995
Deposits received - 138,333 - 138,333
Non-derivative financial
liabilities:
December 31, 2015 Less than 1 year 1 year to 2 years Over 2 years Book value
Short-term borrowings $ 47,699,527 $ - $ - $ 47,699,527
Short-term notes and
bills payable
5,301,488 - - 5,301,488
Notes payable
(including related
parties)
1,252,099 - - 1,252,099
Accounts payable
(including related
parties)
28,778,274 17,142 161 28,795,577
Other payables
(including related
parties)
5,845,662 1,989 3,329 5,850,980
Deposits received - 169,975 - 169,975

164
Derivative financial
liabilities:
December 31, 2016 Less than 1 year 1 year to 2 years Over 2 years Book value
Forward exchange
contracts
$ - $ - $ - $ -
Derivative financial
liabilities:
December 31, 2015 Less than 1 year 1 year to 2 years Over 2 years Book value
Forward exchange
contracts
$ 7,684 $ - $ - $ 7,684
iii. The Group does not expect the timing of occurrence of the cash flows estimated through
the maturity date analysis will be significantly earlier, nor expect the actual cash flow
amount will be significantly different.
(3) Fair value information
A. Details of the fair value of the Group’s financial assets and financial liabilities not measured at
fair value are provided in Note 12(2)A. Details of the fair value of the Group’s investment
property measured at cost are provided in Note 6(12).
B. The different levels that the inputs to valuation techniques are used to measure fair value of
financial and non-financial instruments have been defined as follows:
Level 1: Quoted prices (unadjusted) in active markets for identical assets or liabilities that the
entity can access at the measurement date. A market is regarded as active where a
market in which transactions for the asset or liability take place with sufficient
frequency and volume to provide pricing information on an ongoing basis. The fair
value of the Group’s investment in listed stocks is included in Level 1.
Level 2: Inputs other than quoted prices included within Level 1 that are observable for the
asset or liability, either directly or indirectly. The fair value of the Group’s investment
in unlisted stocks and derivative instruments is included in Level 2.
Level 3: Unobservable inputs for the asset or liability. The fair value of the Group’s
investment in equity investment without active market is included in Level 3.
C. The related information of financial and non-financial instruments measured at fair value by
level on the basis of the nature, characteristics and risks of the assets and liabilities at
December 31, 2016 and 2015 is as follows:

165
December 31, 2016 Level 1 Level 2 Level 3 Total
Assets:
Recurring fair value measurements
Financial assets at fair value
through profit or loss
Equity securities $ 534,086 $ - $ - $ 534,086
Forward exchange contracts - 92 - 92
Available-for-sale financial assets
Equity securities 1,393,983 88,337 75,096 1,557,416
Total $ 1,928,069 $ 88,429 $ 75,096 $ 2,091,594
Liabilities:
Recurring fair value measurements
Financial liabilities at fair value
through profit or loss
Forward exchange contracts $ - $ - $ - $ -
December 31, 2015 Level 1 Level 2 Level 3 Total
Assets:
Recurring fair value measurements
Financial assets at fair value
through profit or loss
Equity securities $ 424,108 $ - $ - $ 424,108
Available-for-sale financial assets
Equity securities 1,288,640 56,029 88,630 1,433,299
Total $ 1,712,748 $ 56,029 $ 88,630 $ 1,857,407
Liabilities:
Recurring fair value measurements
Financial liabilities at fair value
through profit or loss
Forward exchange contracts $ - $ 7,684 $ - $ 7,684
D. The methods and assumptions the Group used to measure fair value are as follows:
(a) For the instruments the Group used market quoted prices as their fair values (that is, Level
1), listed shares use closing price at the balance sheet date.

166
(b) Except for financial instruments with active markets, the fair value of other financial
instruments is measured by using valuation techniques or by reference to counterparty quotes.
The fair value of financial instruments measured by using valuation techniques can be
referred to current fair value of instruments with similar terms and characteristics in substance,
discounted cash flow method or other valuation methods, including calculated by applying
model using market information available at the consolidated balance sheet date.
(c) When assessing non-standard and low-complexity financial instruments, the Group adopts
valuation technique that is widely used by market participants. The inputs used in the
valuation method to measure these financial instruments are normally observable in the
market.
(d) The output of valuation model is an estimated value and the valuation technique may not be
able to capture all relevant factors of the Group’s financial and non-financial instruments.
Therefore, the estimated value derived using valuation model is adjusted accordingly with
additional inputs, for example, model risk or liquidity risk and etc. In accordance with the
Group’s management policies and relevant control procedures relating to the valuation models
used for fair value measurement, management believes adjustment to valuation is necessary in
order to reasonably represent the fair value of financial and non-financial instruments at the
consolidated balance sheet. The inputs and pricing information used during valuation are
carefully assessed and adjusted based on current market conditions.
(e) Forward exchange contracts are usually valued based on the current forward exchange rate.
(f) The Group takes into account adjustments for credit risks to measure the fair value of financial
and non-financial instruments to reflect credit risk of the counterparty and the Group’s credit
quality.
E. For the years ended December 31, 2016 and 2015, there was no transfer between Level 1 and
Level 2.
F. The following chart is the movement of Level 3 for the years ended December 31, 2016 and
2015:
2016 2015
Non-derivative Non-derivative
equity instrument equity instrument
At January 1 88,630$ 172,453$
Losses recognised in profit or loss 40,000)( 85,000)(
Gains and losses recognised in other
comprehensive income (Note) 26,466 1,177
At December 31 75,096$ 88,630$
Note: Shown as unrealised gain (loss) on available-for-sale financial assets.

167
G. For the years ended December 31, 2016 and 2015, there was no transfer into or out from Level
3.
H. Financial quality management segment is in charge of valuation procedures for fair value
measurements being categorised within Level 3, which is to verify independent fair value of
financial instruments. Such assessment is to ensure the valuation results are reasonable by
applying independent information to make results close to current market conditions,
confirming the resource of information is independent, reliable and in line with other resources
and represented as the exercisable price, and frequently calibrating valuation model,
performing back-testing, updating inputs used to the valuation model and making any other
necessary adjustments to the fair value.
I. The following is the qualitative information of significant unobservable inputs and sensitivity
analysis of changes in significant unobservable inputs to valuation model used in Level 3 fair
value measurement:
Fair value at
December 31, 2016 Valuation technique
Significant
unobservable input
Range
(weighted average)
Relationship of
inputs to fair value
Non-derivative equity instrument:
Unlisted shares $ 75,096 Market comparable
companies
Discount for lack of
marketability
0.7 The higher the
discount for lack of
marketability, the
lower the fair value
Fair value at
December 31, 2015 Valuation technique
Significant
unobservable input
Range
(weighted average)
Relationship of
inputs to fair value
Non-derivative equity instrument:
Unlisted shares $ 88,630 Market comparable
companies
Discount for lack of
marketability
0.7 The higher the
discount for lack of
marketability, the
lower the fair value
J. The Group has carefully assessed the valuation models and assumptions used to measure fair
value; therefore, the fair value measurement is reasonable. However, use of different valuation
models or assumptions may result in difference measurement. The following is the effect of
profit or loss or of other comprehensive income from financial assets and liabilities categorized
within Level 3 if the inputs used to valuation models have changed:

168
December 31, 2016
Recognised in profit or loss
Recognised in other
comprehensive income
Input Change Favourable change
Unfavourable
change Favourable change
Unfavourable
change
Financial assets
Equity instrument Discount for lack
of marketability
± 10% $ - $ - $ 7,510 $ 7,510
December 31, 2015
Recognised in profit or loss
Recognised in other
comprehensive income
Input Change Favourable change
Unfavourable
change Favourable change
Unfavourable
change
Financial assets
Equity instrument Discount for lack
of marketability
± 10% $ - $ - $ 8,863 $ 8,863
13. SUPPLEMENTARY DISCLOSURES
(1) Significant transactions information
A. Loans to others: Please refer to table 1.
B. Provision of endorsements and guarantees to others: Please refer to table 2.
C. Holding of marketable securities at the end of the period (not including subsidiaries, associates
and joint ventures): Please refer to table 3.
D. Acquisition or sale of the same security with the accumulated cost exceeding $300 million or
20% of the Company’s paid-in capital: Please refer to table 4.
E. Acquisition of real estate reaching NT$300 million or 20% of paid-in capital or more: None.
F. Disposal of real estate reaching NT$300 million or 20% of paid-in capital or more: None.
G. Purchases or sales of goods from or to related parties reaching NT$100 million or 20% of
paid-in capital or more: Please refer to table 5.
H. Receivables from related parties reaching NT$100 million or 20% of paid-in capital or more:
Please refer to table 6.
I. Trading in derivative instruments undertaken during the reporting periods: Please refer to Note
6(2).
J. Significant inter-company transactions during the reporting periods: Please refer to table 7.

169
(2) Information on investees
Names, locations and other information of investee companies (not including investees in Mainland
China): Please refer to table 8.
(3) Information on investments in Mainland China
A. Basic information: Please refer to table 9.
B. Significant transactions, either directly or indirectly through a third area, with investee
companies in the Mainland Area: None.

170
14. SEGMENT INFORMATION
(1) General information
The Group is primarily engaged in the sale of communication, computers and computer peripherals, electronic
components and consumer electronic products. The Group operates business by geographic areas. The Board of
Directors and management team set up operating strategies and allocate resources based on the operating performance
of each area of sales.
(2) Measurement of segment information
The accounting policies of operating segments are the same as those in Note 4. The Chief Operating Decision-Maker
assesses the performance of operating segments based on operating income (loss).
(3) Information about segments
The segment information provided to the Chief Operating Decision-Maker for the reportable segments for the years
ended December 31, 2016 and 2015 was as follows:
Year ended December 31, 2016
Australia and New
Taiwan Hong Kong/China Zealand/Indonesia Reconciliation Total
Revenue from external customers 57,162,715$ 213,537,633$ 71,996,105$ -$ 342,696,453$
Inter-segment revenue 2,693,842 33,355,487 160,157 36,209,486)( -
Segment revenue 59,856,557$ 246,893,120$ 72,156,262$ 36,209,486)($ 342,696,453$
Segment profit 744,810$ 2,011,641$ 1,512,781$ -$ 4,269,232$
Segment profit, including depreciation 111,681$ 154,990$ 80,590$ -$ 347,261$
Segment assets 21,859,504$ 80,802,246$ 25,169,420$ -$ 127,831,170$

171
Year ended December 31, 2015
Australia and New
Taiwan Hong Kong/China Zealand/Indonesia Reconciliation Total
Revenue from external customers 47,932,451$ 202,797,949$ 71,403,052$ -$ 322,133,452$
Inter-segment revenue 2,647,796 51,540,462 152,528 54,340,786)( -
Segment revenue 50,580,247$ 254,338,411$ 71,555,580$ 54,340,786)($ 322,133,452$
Segment profit 537,168$ 2,164,150$ 1,247,253$ -$ 3,948,571$
Segment profit, including depreciation 103,004$ 138,870$ 68,384$ -$ 310,258$
Segment assets 18,124,356$ 88,295,331$ 28,367,831$ -$ 134,787,518$
Note: Consolidated liabilities are not disclosed because it is not provided to the Chief Operating Decision-Maker.
(4) Reconciliation for segment income (loss)
A. The operating income (loss) of each area reported to the Chief Operating Decision-Maker is measured in a manner
consistent with revenues and expenses in the statement of comprehensive income.
A reconciliation of reportable segment profit to the income before income tax for the years ended December 31, 2016
and 2015 is provided as follows:
Year ended Year ended
December 31, 2016 December 31, 2015
Reportable segment profit 4,269,232$ 3,948,571$
Total non-operating revenue and expenses 1,456,245 211,019)(
Income before income tax 5,725,477$ 3,737,552$
B. The amounts provided to the Chief Operating Decision-Maker with respect to total assets are measured in a manner
consistent with that of the financial statements. The reconciliation and offset of the reportable segments’ assets are
provided in Note 14(3).

172
(5) Information on products and services
Year ended Year ended
December 31, 2016 December 31, 2015
Product revenue 342,085,713$ 321,650,942$
Others 610,740 482,510
Total 342,696,453$ 322,133,452$
(6) Geographical information
The external revenue is grouped according to the locations of the customers, and the non-current assets are grouped
according to the locations of the non-current assets. Breakdown of revenue and non-current assets by geographic area is
as follows:
Revenue Non-current assets Revenue Non-current assets
Taiwan 57,162,715$ 1,543,314$ 47,932,451$ 1,357,429$
China and Hong Kong 213,537,633 6,461,041 202,797,949 7,050,613
Australia, New Zealand and Indonesia 71,996,105 1,738,126 71,403,052 1,593,964
Total 342,696,453$ 9,742,481$ 322,133,452$ 10,002,006$
Years ended December 31,
2016 2015
(7) Major customer information
In 2016 and 2015, no single customer accounted for more than 10% of net operating revenue. Accordingly, no major
customer information is presented.

173