Embed Size (px)
Citation preview
C H A P T E R 1
xviiSynopsis and Executive SummarySynopsis _ _ _ _ _ _ _ _ _ _ _ _ _ _ _ _ _ _ _ _ _ _ _ _ _ _ _ _ _ _ _ _ _ _ _ _ _ _ _ _ _ _ _ _ _11
Scope _ _ _ _ _ _ _ _ _ _ _ _ _ _ _ _ _ _ _ _ _ _ _ _ _ _ _ _ _ _ _ _ _ _ _ _ _ _ _ _ _ _ _11
Motivation _ _ _ _ _ _ _ _ _ _ _ _ _ _ _ _ _ _ _ _ _ _ _ _ _ _ _ _ _ _ _ _ _ _ _ _ _ _ _ _ _ _11
Pursuing the geothermal option _ _ _ _ _ _ _ _ _ _ _ _ _ _ _ _ _ _ _ _ _ _ _ _ _ _ _ _ _ _12
Approach _ _ _ _ _ _ _ _ _ _ _ _ _ _ _ _ _ _ _ _ _ _ _ _ _ _ _ _ _ _ _ _ _ _ _ _ _ _ _ _ _ _13
Findings _ _ _ _ _ _ _ _ _ _ _ _ _ _ _ _ _ _ _ _ _ _ _ _ _ _ _ _ _ _ _ _ _ _ _ _ _ _ _ _ _ _ 13
Major recommendations _ _ _ _ _ _ _ _ _ _ _ _ _ _ _ _ _ _ _ _ _ _ _ _ _ _ _ _ _ _ _ _ _ _17
Executive Summary _ _ _ _ _ _ _ _ _ _ _ _ _ _ _ _ _ _ _ _ _ _ _ _ _ _ _ _ _ _ _ _ _ _ _ _ _18
1.1 Motivation and Scope _ _ _ _ _ _ _ _ _ _ _ _ _ _ _ _ _ _ _ _ _ _ _ _ _ _ _ _ _ _ _ _ _ _ _ _18
1.2 Defining EGS _ _ _ _ _ _ _ _ _ _ _ _ _ _ _ _ _ _ _ _ _ _ _ _ _ _ _ _ _ _ _ _ _ _ _ _ _ _ _ _19
1.3 U.S. Geothermal Resource Base _ _ _ _ _ _ _ _ _ _ _ _ _ _ _ _ _ _ _ _ _ _ _ _ _ _ _ _ _111
1.4 Estimating the Recoverable Portion of EGS _ _ _ _ _ _ _ _ _ _ _ _ _ _ _ _ _ _ _ _ _ _ _116
1.5 Geothermal Drilling Technology and Costs _ _ _ _ _ _ _ _ _ _ _ _ _ _ _ _ _ _ _ _ _ _ _118
1.6 EGS Reservoir Stimulation – Status of International Field Testing and Design Issues _ _ _ _ _ _ _ _ _ _ _ _ _ _ _ _120
1.7 Geothermal Energy Conversion Technology _ _ _ _ _ _ _ _ _ _ _ _ _ _ _ _ _ _ _ _ _ _ _123
1.8 Environmental Attributes of EGS _ _ _ _ _ _ _ _ _ _ _ _ _ _ _ _ _ _ _ _ _ _ _ _ _ _ _ _ _126
1.9 Economic Feasibility Issues for EGS _ _ _ _ _ _ _ _ _ _ _ _ _ _ _ _ _ _ _ _ _ _ _ _ _ _ _127
References _ _ _ _ _ _ _ _ _ _ _ _ _ _ _ _ _ _ _ _ _ _ _ _ _ _ _ _ _ _ _ _ _ _ _ _ _ _ _ _ _ _ _134
Chapter 1 Synopsis and Executive Summary
Synopsis Scope: A comprehensive assessment of enhanced, or engineered, geothermal systems was carried out by an 18member panel assembled by the Massachusetts Institute of Technology (MIT) to evaluate 11 the potential of geothermal energy becoming a major energy source for the United States.Geothermal resources span a wide range of heat sources from the Earth, including not only the moreeasily developed, currently economic hydrothermal resources; but also the Earth’s deeper, storedthermal energy, which is present anywhere. Although conventional hydrothermal resources are usedeffectively for both electric and nonelectric applications in the United States, they are somewhatlimited in their location and ultimate potential for supplying electricity. Beyond these conventionalresources are EGS resources with enormous potential for primary energy recovery using heatminingtechnology, which is designed to extract and utilize the earth’s stored thermal energy. In betweenthese two extremes are other unconventional geothermal resources such as coproduced water andgeopressured geothermal resources. EGS methods have been tested at a number of sites around theworld and have been improving steadily. Because EGS resources have such a large potential for thelong term, we focused our efforts on evaluating what it would take for EGS and other unconventionalgeothermal resources to provide 100,000 MWe of baseload electricgenerating capacity by 2050.
Although somewhat simplistic, the geothermal resource can be viewed as a continuum in severaldimensions. The grade of a specific geothermal resource would depend on its temperaturedepthrelationship (i.e., geothermal gradient), the reservoir rock’s permeability and porosity, and the amount offluid saturation. Highgrade hydrothermal resources have high average thermal gradients, high rockpermeability and porosity, sufficient fluids in place, and an adequate reservoir recharge of fluids – allEGS resources lack at least one of these. For example, reservoir rock may be hot enough but not producesufficient fluid for viable heat extraction, either because of low formation permeability/connectivity andinsufficient reservoir volume, and/or the absence of naturally contained fluids.
Three main components were considered in the analysis:
1. Resource – estimating the magnitude and distribution of the U.S. EGS resource.
2. Technology – establishing requirements for extracting and utilizing energy from EGS reservoirsincluding drilling, reservoir design and stimulation, and thermal energy conversion to electricity.
3. Economics – estimating costs for EGSsupplied electricity on a national scale using newlydeveloped methods for mining heat from the earth. Developing levelized energy costs and supplycurves as a function of invested R&D and deployment levels in evolving U.S. energy markets.
There are several compelling reasons why the United States should be concerned aboutMotivation: the security of its energy supply for the long term. They include growth in demand, as a result of anincreasing U.S. population, along with increased electrification of our society. According to the EnergyInformation Administration (EIA, 2006), U.S. nameplate generating capacity has increased morethan 40% in the past 10 years and is now more than 1 TWe. Most of this increase resulted from addinggasfired combinedcycle generation plants. In addition, the electricity supply system is threatenedwith losing existing capacity in the near term, as a result of retirement of existing nuclear and coalfired generating plants (EIA, 2006). It is likely that 50 GWe or more of coalfired capacity will need tobe retired in the next 15 to 25 years because of environmental concerns. In addition, during thatperiod, 40 GWe or more of nuclear capacity will be beyond even the most generous relicensingprocedures and will have to be decommissioned.
Chapter 1 Synopsis and Executive Summary
The current nonrenewable options for replacing this anticipated loss of U.S. baseload generating capacity
12 are coalfired thermal, nuclear, and combinedcycle gascombustion turbines. While these are clearly practical options, there are some concerns. First, demand and prices for cleaner natural gas will escalate substantially during the next 25 years, making it difficult to reach gasfired capacity. Large increases in imported gas will be needed to meet growing demand – further compromising U.S. energy security beyond just importing the majority of our oil for meeting transportation needs. Second, local, regional, and global environmental impacts associated with increased coal use will most likely require a transition to cleancoal power generation, possibly with sequestration of carbon dioxide. The costs and uncertainties associated with such a transition are daunting. Also, adopting this approach would accelerate our consumption of coal significantly, compromising its use as a source of liquid transportation fuel for the long term. It is also uncertain whether the American public is ready to embrace increasing nuclear power capacity, which would require siting and constructing many new reactor systems.
On the renewable side, there is considerable opportunity for capacity expansion of U.S. hydropower potential using existing dams and impoundments. But outside of a few pumped storage projects, hydropower growth has been hampered by reductions in capacity imposed by the Federal Energy Regulatory Commission (FERC), as a result of environmental concerns. Concentrating solar power (CSP) provides an option for increased baseload capacity in the Southwest where demand is growing. Although renewable solar and wind energy also have significant potential for the United States and are likely to be deployed in increasing amounts, it is unlikely that they alone can meet the entire demand. Furthermore, solar and wind energy are inherently intermittent and cannot provide 24houraday base load without megasized energy storage systems, which traditionally have not been easy to site and are costly to deploy. Biomass also can be used as a renewable fuel to provide electricity using existing heattopower technology, but its value to the United States as a feedstock for biofuels for transportation may be much higher, given the current goals of reducing U.S. demand for imported oil.
Clearly, we need to increase energy efficiency in all enduse sectors; but even aggressive efforts cannot eliminate the substantial replacement and new capacity additions that will be needed to avoid severe reductions in the services that energy provides to all Americans.
Pursuing the geothermal option: Could U.S.based geothermal energy provide a viable option for providing large amounts of generating capacity when it is needed? This is exactly the question we are addressing in our assessment of EGS.
Although geothermal energy has provided commercial baseload electricity around the world for more than a century, it is often ignored in national projections of evolving U.S. energy supply. This could be a result of the widespread perception that the total geothermal resource is often associated with identified highgrade, hydrothermal systems that are too few and too limited in their distribution in the United States to make a longterm, major impact at a national level. This perception has led to undervaluing the longterm potential of geothermal energy by missing an opportunity to develop technologies for sustainable heat mining from large volumes of accessible hot rock anywhere in the United States. In fact, many attributes of geothermal energy, namely its widespread distribution, baseload dispatchability without storage, small footprint, and low emissions, are desirable for reaching a sustainable energy future for the United States.
Expanding our energy supply portfolio to include more indigenous and renewable resources is a sound approach that will increase energy security in a manner that parallels the diversification ideals that have

Chapter 1 Synopsis and Executive Summary
made America strong. Geothermal energy provides a robust, longlasting option with attributes that wouldcomplement other important contributions from clean coal, nuclear, solar, wind, hydropower, and biomass. 13
Approach: The composition of the panel was designed to provide indepth expertise in specific technology areas relevant to EGS development, such as resource characterization and assessment,drilling, reservoir stimulation, and economic analysis. Recognizing the potential that some bias mightemerge from a panel of knowledgeable experts who, to varying degrees, are advocates for geothermalenergy, panel membership was expanded to include experts on energy technologies and economics,and environmental systems. The panel took a completely new look at the geothermal potential of theUnited States. This was partly in response to short and longterm needs for a reliable lowcost electricpower and heat supply for the nation. Equally important was a need to review and evaluateinternational progress in the development of EGS and related extractive technologies that followed thevery active period of U.S. fieldwork conducted by Los Alamos National Laboratory during the 1970sand 1980s at the Fenton Hill site in New Mexico.
The assessment team was assembled in August 2005 and began work in September, following aseries of discussions and workshops sponsored by the Department of Energy (DOE) to map out futurepathways for developing EGS technology.
The first phase of the assessment considered the geothermal resource in detail. Earlier projectionsfrom studies in 1975 and 1978 by the U.S. Geological Survey (USGS Circulars 726 and 790) wereamplified by ongoing research and analysis being conducted by U.S. heatflow researchers andanalyzed by David Blackwell’s group at Southern Methodist University (SMU) and other researchers.In the second phase, EGS technology was evaluated in three distinct parts: drilling to gain access tothe system, reservoir design and stimulation, and energy conversion and utilization. Previous andcurrent field experiences in the United States, Europe, Japan, and Australia were thoroughly reviewed.Finally, the general economic picture and anticipated costs for EGS were analyzed in the context ofprojected demand for baseload electric power in the United States.
Findings: Geothermal energy from EGS represents a large, indigenous resource that can provide baseload electric power and heat at a level that can have a major impact on the United States, whileincurring minimal environmental impacts. With a reasonable investment in R&D, EGS could provide100 GWe or more of costcompetitive generating capacity in the next 50 years. Further, EGS providesa secure source of power for the long term that would help protect America against economicinstabilities resulting from fuel price fluctuations or supply disruptions. Most of the key technicalrequirements to make EGS work economically over a wide area of the country are in effect, withremaining goals easily within reach. This achievement could provide performance verification at acommercial scale within a 10 to 15year period nationwide.
In spite of its enormous potential, the geothermal option for the United States has been largelyignored. In the short term, R&D funding levels and government policies and incentives have notfavored growth of U.S. geothermal capacity from conventional, highgrade hydrothermal resources.Because of limited R&D support of EGS in the United States, field testing and supporting appliedgeoscience and engineering research has been lacking for more than a decade. Because of this lack ofsupport, EGS technology development and demonstration recently has advanced only outside theUnited States with accompanying limited technology transfer. This has led to the perception that
Chapter 1 Synopsis and Executive Summary
insurmountable technical problems or limitations exist for EGS. However, in our detailed review of
14 international fieldtesting data so far, the panel did not uncover any major barriers or limitations to the technology. In fact, we found that significant progress has been achieved in recent tests carried out at Soultz, France, under European Union (EU) sponsorship; and in Australia, under largely private sponsorship. For example, at Soultz, a connected reservoirwell system with an active volume of more than 2 km3 at depths from 4 to 5 km has been created and tested at fluid production rates within a factor of 2 to 3 of initial commercial goals. Such progress leads us to be optimistic about achieving commercial viability in the United States in a next phase of testing, if a nationalscale program is supported properly. Specific findings include:
1. EGS is one of the few renewable energy resources that can provide continuous baseload power with minimal visual and other environmental impacts. Geothermal systems have a small footprint and virtually no emissions, including carbon dioxide. Geothermal energy has significant baseload potential, requires no storage, and, thus, it complements other renewables – solar (CSP and PV), wind, hydropower – in a lowercarbon energy future. In the shorter term, having a significant portion of our base load supplied by geothermal sources would provide a buffer against the instabilities of gas price fluctuations and supply disruptions, as well as nuclear plant retirements.
2. The accessible geothermal resource, based on existing extractive technology, is large and contained in a continuum of grades ranging from today’s hydrothermal, convective systems through high and midgrade EGS resources (located primarily in the western United States) to the very large, conductiondominated contributions in the deep basement and sedimentary rock formations throughout the country. By evaluating an extensive database of bottomhole temperature and regional geologic data (rock types, stress levels, surface temperatures, etc.), we have estimated the total EGS resource base to be more than 13 million exajoules (EJ). Using reasonable assumptions regarding how heat would be mined from stimulated EGS reservoirs, we also estimated the extractable portion to exceed 200,000 EJ or about 2,000 times the annual consumption of primary energy in the United States in 2005. With technology improvements, the economically extractable amount of useful energy could increase by a factor of 10 or more, thus making EGS sustainable for centuries.
3. Ongoing work on both hydrothermal and EGS resource development complement each other. Improvements to drilling and power conversion technologies, as well as better understanding of fractured rock structure and flow properties, benefit all geothermal energy development scenarios. Geothermal operators now routinely view their projects as heat mining and plan for managed injection to ensure long reservoir life. While stimulating geothermal wells in hydrothermal developments are now routine, the understanding of why some techniques work on some wells and not on others can only come from careful research.
4. EGS technology has advanced since its infancy in the 1970s at Fenton Hill. Field studies conducted worldwide for more than 30 years have shown that EGS is technically feasible in terms of producing net thermal energy by circulating water through stimulated regions of rock at depths ranging from 3 to 5 km. We can now stimulate large rock volumes (more than 2 km3), drill into these stimulated regions to establish connected reservoirs, generate connectivity in a controlled way if needed, circulate fluid without large pressure losses at near commercial rates, and generate power using the thermal energy produced at the surface from the created EGS system. Initial concerns regarding five key issues – flow short circuiting, a need for high injection pressures, water losses, geochemical impacts, and induced seismicity – appear to be either fully resolved or manageable with proper monitoring and operational changes.
Chapter 1 Synopsis and Executive Summary
5. At this point, the main constraint is creating sufficient connectivity within the injection and production well system in the stimulated region of the EGS reservoir to allow for high perwell 15 production rates without reducing reservoir life by rapid cooling. U.S. field demonstrations have been constrained by many external issues, which have limited further stimulation and development efforts and circulation testing times – and, as a result, risks and uncertainties have not been reduced to a point where private investments would completely support the commercial deployment of EGS in the United States. In Europe and Australia, where government policy creates a more favorable climate, the situation is different for EGS. There are now seven companies in Australia actively pursuing EGS projects and two commercial projects in Europe.
6. Research, Development, and Demonstration (RD&D) in certain critical areas could greatly enhance the overall competitiveness of geothermal in two ways. First, it would lead to generally lower development costs for all grade systems, which would increase the attractiveness of EGS projects for private investment. Second, it could substantially lower power plant, drilling, and stimulation costs, which increases accessibility to lowergrade EGS areas at depths of 6 km or more. In a manner similar to the technologies developed for oil and gas and mineral extraction, the investments made in research to develop extractive technology for EGS would follow a natural learning curve that lowers development costs and increases reserves along a continuum of geothermal resource grades.
Examples of impacts that would result from researchdriven improvements are presented in three areas:
• Drilling technology – both evolutionary improvements building on conventional approaches to drilling such as more robust drill bits, innovative casing methods, better cementing techniques for high temperatures, improved sensors, and electronics capable of operating at higher temperature in downhole tools; and revolutionary improvements utilizing new methods of rock penetration will lower production costs. These improvements will enable access to deeper, hotter regions in highgrade formations or to economically acceptable temperatures in lowergrade formations.
• Power conversion technology – improving heattransfer performance for lowertemperature fluids, and developing plant designs for higher resource temperatures to the supercritical water region would lead to an order of magnitude (or more) gain in both reservoir performance and heattopower conversion efficiency.
• Reservoir technology – increasing production flow rates by targeting specific zones for stimulation and improving downhole lift systems for higher temperatures, and increasing swept areas and volumes to improve heatremoval efficiencies in fractured rock systems, will lead to immediate cost reductions by increasing output per well and extending reservoir lifetimes. For the longer term, using CO2 as a reservoir heattransfer fluid for EGS could lead to improved reservoir performance as a result of its low viscosity and high density at supercritical conditions. In addition, using CO2 in EGS may provide an alternative means to sequester large amounts of carbon in stable formations.
7. EGS systems are versatile, inherently modular, and scalable from 1 to 50 MWe for distributed applications to large “power parks,” which could provide thousands of MWe of baseload capacity. Of course, for most directheating and heat pump applications, effective use of shallow geothermal energy has been demonstrated at a scale of a few kilowattsthermal (kWt) for individual buildings or homes. For these applications, stimulating deeper reservoirs using EGS technology is not relevant. However, EGS also can be easily deployed in largerscale district heating and combined heat and power (cogeneration) applications to service both electric power and heating and cooling for buildings without a need for storage onsite. For other renewable options such as wind, hydropower, and solar PV, these applications are not possible.
Chapter 1 Synopsis and Executive Summary
8. Using coproduced hot water, available in large quantities at temperatures up to 100°C or more
16 from existing oil and gas operations, it is possible to generate up to 11,000 MWe of new generating capacity with standard binarycycle technology, and increase hydrocarbon production by partially offsetting parasitic losses consumed during production.
9. A cumulative capacity of more than 100,000 MWe from EGS can be achieved in the United States within 50 years with a modest, multiyear federal investment for RD&D in several field projects in the United States.
Because the fielddemonstration program involves staged developments at different sites, committed support for an extended period will be needed to demonstrate the viability, robustness, and reproducibility of methods for stimulating viable, commercialsized EGS reservoirs at several locations. Based on the economic analysis we conducted as part of our study, a $300 million to $400 million investment over 15 years will be needed to make earlygeneration EGS power plant installations competitive in evolving U.S. electricity supply markets.
These funds compensate for the higher capital and financing costs expected for earlygeneration EGS plants, which would be expected as a result of somewhat higher field development (drilling and stimulation) costs per unit of power initially produced. Higher generating costs, in turn, lead to higher perceived financial risk for investors with corresponding higherdebt interest rates and equity rates of return. In effect, the federal investment can be viewed as equivalent to an “absorbed cost” of deployment. In addition, investments in R&D will also be needed to reduce costs in future deployment of EGS plants.
To a great extent, energy markets and government policies will influence the private sector’s interest in developing EGS technology. In today’s economic climate, there is reluctance for private industry to invest its funds without strong guarantees. Thus, initially, it is likely that government will have to fully support EGS fieldwork and supporting R&D. Later, as field sites are established and proven, the private sector will assume a greater role in cofunding projects – especially with government incentives accelerating the transition to independently financed EGS projects in the private sector. Our analysis indicates that, after a few EGS plants at several sites are built and operating, the technology will improve to a point where development costs and risks would diminish significantly, allowing the levelized cost of producing EGS electricity in the United States to be at or below market prices.
Given these issues and growing concerns over longterm energy security, the federal government will need to provide funds directly or introduce other incentives in support of EGS as a longterm “public good,” similar to early federal investments in large hydropower dam projects and nuclear power reactors.
Based on growing markets in the United States for clean, baseload capacity, the panel thinks that with a combined public/private investment of about $800 million to $1 billion over a 15year period, EGS technology could be deployed commercially on a timescale that would produce more than 100,000 MWe or 100 GWe of new capacity by 2050. This amount is approximately equivalent to the total R&D investment made in the past 30 years to EGS internationally, which is still less than the cost of a single, newgeneration, cleancoal power plant.
The panel thinks that making such an investment now is appropriate and prudent, given the enormous potential of EGS and the technical progress that has been achieved so far in the field. Having EGS as an option will strengthen America’s energy security for the long term in a manner that complements other renewables, clean fossil, and nextgeneration nuclear.

Chapter 1 Synopsis and Executive Summary
Because prototype commercialscale EGS will take a few years to developMajor recommendations: and fieldtest, the time for action is now. Supporting the EGS program now will move us along the 17 learning curve to a point where the design and engineering of wellconnected EGS reservoir systems is technically reliable and reproducible.
We believe that the benefittocost ratio is more than sufficient to warrant such a modest investment in EGS technology. By enabling 100 GWe of new baseload capacity, the payoff for EGS is large, especially in light of how much will have to be spent for deployment of conventional gas, nuclear, or coalfired systems to meet replacement of retiring plants and capacity increases, as there are no other options with sufficient scale on the horizon.
The panel specifically recommends that:
1. There should be a federal commitment to supporting EGS resource characterization and assessment. An aggressive, sufficiently supported, multiyear national program with USGS and DOE and other agency participation is needed to further quantify and refine the EGS resource as extraction and conversion technologies improve.
2. Highgrade EGS resources should be developed first at targets of opportunity on the margins of existing hydrothermal systems and in areas with sufficient natural recharge, or in oil fields with hightemperature water and abundant data, followed by field efforts at sites with aboveaverage temperature gradients. Representative sites in highgrade areas, where field development and demonstration costs would be lower, should be selected initially to prove that EGS technology will work at a commercial scale. These nearterm targets of opportunity include EGS sites that are currently under consideration at Desert Peak (Nevada), and Coso and Clear Lake (both in California), as well as others that would demonstrate that reservoirstimulation methods can work in other geologic settings, such as the deep, hightemperature sedimentary basins in Louisiana, Texas, and Oklahoma. Such efforts would provide essential reservoir stimulation and operational information and would provide working “field laboratories” to train the next generation of scientists and engineers who will be needed to develop and deploy EGS on a national scale.
3. In the first 15 years of the program, a number of sites in different regions of the country should be under development. Demonstration of the repeatability and universality of EGS technologies in different geologic environments is needed to reduce risk and uncertainties, resulting in lower development costs.
4. Like all new energysupply technologies, for EGS to enter and compete in evolving U.S. electricity markets, positive policies at the state and federal levels will be required. These policies must be similar to those that oil and gas and other mineralextraction operations have received in the past – including provisions for accelerated permitting and licensing, loan guarantees, depletion allowances, intangible drilling writeoffs, and accelerated depreciations, as well as those policies associated with cleaner and renewable energies such as production tax credits, renewable credits and portfolio standards, etc. The success of this approach would parallel the development of the U.S. coalbed methane industry.
5. Given the significant leveraging of supporting research that will occur, we recommend that the United States actively participate in ongoing international field projects such as the EU project at Soultz, France, and the Cooper Basin project in Australia.
6. A commitment should be made to continue to update economic analyses as EGS technology improves with field testing, and EGS should be included in the National Energy Modeling System (NEMS) portfolio of evolving energy options.
Chapter 1 Synopsis and Executive Summary
Executive Summary 18
1.1 Motivation and Scope
The goal of this assessment is to provide an evaluation of geothermal energy as a major supplier of energy in the United States. An 18member assessment panel with broad experience and expertise was formed to conduct the study beginning in September 2005. The work evaluated three major areas of Enhanced Geothermal Systems (EGS):
1. Magnitude and distribution of the EGS resource
2. Status and remaining requirements of EGS technology needed to demonstrate feasibility at a commercialscale
3. Economic projections of impact of EGS on U.S. energy supply to 2050
Although there have been earlier assessments of EGS technology and economics, none has been as comprehensive as this one – ranging from providing a detailed evaluation of the geothermal resource to analyzing evolving energy markets for EGS. Our group was able to review technical contributions and progress, spanning more than 30 years of field testing, as well as several earlier economic and resource estimates.
Substantial progress has been made in developing and demonstrating certain components of EGS technology in the United States, Europe, Australia, and Japan, but further work is needed to establish the commercial viability of EGS for electrical power generation, cogeneration, and direct heat supply.
Based on the analysis of experienced researchers, it is important to emphasize that while further advances are needed, none of the known technical and economic barriers limiting widespread development of EGS as a domestic energy source are considered to be insurmountable.
Our assessment evaluates the status of EGS technology, details lessonslearned, and prioritizes R&D needs for EGS. It will inform the ongoing debate of how to provide a more sustainable and secure energy supply for Americans for the long term, without compromising our economic capacity and political and social stability, and while minimizing environmental impacts. Therefore, energy researchers and developers, utility analysts and executives, and government policy makers should find our report useful.
The study addresses two critical questions facing the future of EGS: 1. Can EGS have a major impact on national energy supply? 2. How much investment in R&D is needed to realize that impact?
One means of illustrating the potential of any alternative energy technology is to predict how a supply curve of energy costs vs. energy supply capacity would evolve as a result of moving down a learning curve and lowering capital costs. These positive economic effects reflect both R&D improvements to individual technology components, as well as lower risks and uncertainties in investments to deploy EGS by repeating the process at several field locations. In addition, given that the grade of the EGS resource varies widely in the United States, the supply curve analysis also indicates a gradual transition from deployment of higher to lowergrade resources.
Chapter 1 Synopsis and Executive Summary
The panel has defined the impact threshold for EGS technology as being able to provide 100,000 MW of additional electrical capacity competitively by 2050. While we recognize that this specific goal is not 19 part of the current DOE program, a 10% impact is a reasonable goal for EGS to become a major player as a domestic energy supply. Our assessment deals directly with the technical and economic feasibility of having EGS achieve this goal, emphasizing the quantitative requirements of both science and engineering in subsurface environments. We develop supply curves for EGS and lay out a rationale that specifies what technology and learning improvements will be needed to reduce risks and lower costs to a point where EGS could have a major impact on the U.S. energy supply. A key aspect of our work is to evaluate whether the costs of the additional R&D needed to demonstrate the technology at a commercial scale are low enough, and the potential energy security benefits high enough, to justify federal and private investment in EGS.
This first chapter of our report summarizes our overall approach, as well as the main findings in the three focus areas. Included in this chapter are recommendations for research and development, regulatory and governmental policies, and evolving energy markets for EGS that would achieve this high level of impact on the U.S. energy supply.
1.2 Defining EGS
In general terms, geothermal energy consists of the thermal energy stored in the Earth’s crust. Thermal energy in the earth is distributed between the constituent host rock and the natural fluid that is contained in its fractures and pores at temperatures above ambient levels. These fluids are mostly water with varying amounts of dissolved salts; typically, in their natural in situ state, they are present as a liquid phase but sometimes may consist of a saturated, liquidvapor mixture or superheated steam vapor phase. The amounts of hot rock and contained fluids are substantially larger and more widely distributed in comparison to hydrocarbon (oil and gas) fluids contained in sedimentary rock formations underlying the United States.
Geothermal fluids of natural origin have been used for cooking and bathing since before the beginning of recorded history; but it was not until the early 20th century that geothermal energy was harnessed for industrial and commercial purposes. In 1904, electricity was first produced using geothermal steam at the vapordominated field in Larderello, Italy. Since that time, other hydrothermal developments, such as the steam field at The Geysers, California; and the hotwater systems at Wairakei, New Zealand; Cerro Prieto, Mexico; and Reykjavik, Iceland; and in Indonesia and the Philippines, have led to an installed world electrical generating capacity of nearly 10,000 MWe and a directuse, nonelectric capacity of more than 100,000 MWt (thermal megawatts of power) at the beginning of the 21st century.
The source and transport mechanisms of geothermal heat are unique to this energy source. Heat flows through the crust of the Earth at an average rate of almost 59 mW/m2 [1.9 x 10² Btu/h/ft2]. The intrusion of large masses of molten rock can increase this normal heat flow locally; but for most of the continental crust, the heat flow is due to two primary processes:
1. Upward convection and conduction of heat from the Earth’s mantle and core, and
2. Heat generated by the decay of radioactive elements in the crust, particularly isotopes of uranium, thorium, and potassium.

Chapter 1 Synopsis and Executive Summary
Local and regional geologic and tectonic phenomena play a major role in determining the location (depth
110 and position) and quality (fluid chemistry and temperature) of a particular resource. For example, regions of higher than normal heat flow are associated with tectonic plate boundaries and with areas of geologically recent igneous activity and/or volcanic events (younger than about 1 million years). This is why people frequently associate geothermal energy only with places where such conditions are found – such as Iceland, New Zealand, or Japan (plate boundaries), or with Yellowstone National Park (recent volcanism) – and neglect to consider geothermal energy opportunities in other regions.
In all cases, certain conditions must be met before one has a viable geothermal resource. The first requirement is accessibility. This is usually achieved by drilling to depths of interest, frequently using conventional methods similar to those used to extract oil and gas from underground reservoirs. The second requirement is sufficient reservoir productivity. For hydrothermal systems, one normally needs to have large amounts of hot, natural fluids contained in an aquifer with high natural rock permeability and porosity to ensure longterm production at economically acceptable levels. When sufficient natural recharge to the hydrothermal system does not occur, which is often the case, a reinjection scheme is necessary to ensure production rates will be maintained.
Thermal energy is extracted from the reservoir by coupled transport processes (convective heat transfer in porous and/or fractured regions of rock and conduction through the rock itself ). The heatextraction process must be designed with the constraints imposed by prevailing in situ hydrologic, lithologic, and geologic conditions. Typically, hot water or steam is produced and its energy is converted into a marketable product (electricity, process heat, or space heat). Any waste products must be properly treated and safely disposed of to complete the process. Many aspects of geothermal heat extraction are similar to those found in the oil, gas, coal, and mining industries. Because of these similarities, equipment, techniques, and terminology have been borrowed or adapted for use in geothermal development, a fact that has, to some degree, accelerated the development of geothermal resources. Nonetheless, there are inherent differences that have limited development such as higher wellflow requirements and temperature limitations to drilling and logging operations (see Chapters 4 and 6 for details).
The U.S. Department of Energy has broadly defined Enhanced (or engineered) Geothermal Systems (EGS) as engineered reservoirs that have been created to extract economical amounts of heat from low permeability and/or porosity geothermal resources. For this assessment, we have adapted this definition to include all geothermal resources that are currently not in commercial production and require stimulation or enhancement. EGS would exclude highgrade hydrothermal but include conductiondominated, lowpermeability resources in sedimentary and basement formations, as well as geopressured, magma, and lowgrade, unproductive hydrothermal resources. In addition, we have added coproduced hot water from oil and gas production as an unconventional EGS resource type that could be developed in the short term and possibly provide a first step to more classical EGS exploitation.
EGS concepts would recover thermal energy contained in subsurface rocks by creating or accessing a system of open, connected fractures through which water can be circulated down injection wells, heated by contact with the rocks, and returned to the surface in production wells to form a closed loop (Figure 1.1). The idea itself is a simple extrapolation that emulates naturally occurring hydrothermal circulation systems – those now producing electricity and heat for direct application commercially in some 71 countries worldwide.

Chapter 1 Synopsis and Executive Summary
injection pump
Power Plant
310km Depth 10,00030,000ft Depth
makeup water
Injection Well Production Well
111
Sediments and/or Volcanics
Low Permeability Crystalline
Basement Rocks
Figure 1.1 Schematic of a conceptual twowell Enhanced Geothermal System in hot rock in a lowpermeability crystalline basement formation.
In principle, conductiondominated EGS systems in lowpermeability sediments and basement rock are available all across the United States. The first step would be exploration to identify and characterize the best candidate sites for exploitation. Holes then would be drilled deep enough to encounter useful rock temperature to further verify and quantify the specific resource at relevant depths for exploitation. If lowpermeability rock is encountered, it would be stimulated hydraulically to produce a largevolume reservoir for heat extraction and suitably connected to an injectionproduction well system. If rock of sufficient natural permeability is encountered in a confined geometry, techniques similar to waterflooding or steamdrive employed for oil recovery might be used effectively for heat mining (Tester and Smith, 1977; Bodvarsson and Hanson, 1977). Other approaches for heat extraction employing downhole heat exchangers or pumps, or alternating injection and production (huffpuff ) methods, have also been proposed.
1.3 U.S. Geothermal Resource Base
The last published comprehensive study of geothermal energy by the U.S. Geological Survey appeared in 1979 (USGS Circular 790). As a result, we have relied on published data and projections that have appeared since 1979 to update and refine the earlier USGS estimates.
We have not tried to improve on USGS estimates of the hydrothermal resources, as they represent a highgrade component of the geothermal resource that is already undergoing commercial development in the United States. For this assessment, we have divided the EGS resource into categories as shown in Table 1.1. (For information on energy conversion factors, see Appendix A.) In addition to the conductiondominated portions of the EGS resource in sediments and basement rock formations, we added three categories: geopressured, volcanic, and coproduced fluids. Resource base estimates for geopressured and supercritical volcanic systems were taken directly from the USGS Circulars 726 and 790. Coproduced fluids is a new category of EGS that was also included in our assessment. It represents heated water that is produced as an integral part of oil and gas production. Estimates in this category were based on ongoing work in Blackwell’s group (McKenna et al., 2005, in Chapter 2).
Chapter 1 Synopsis and Executive Summary
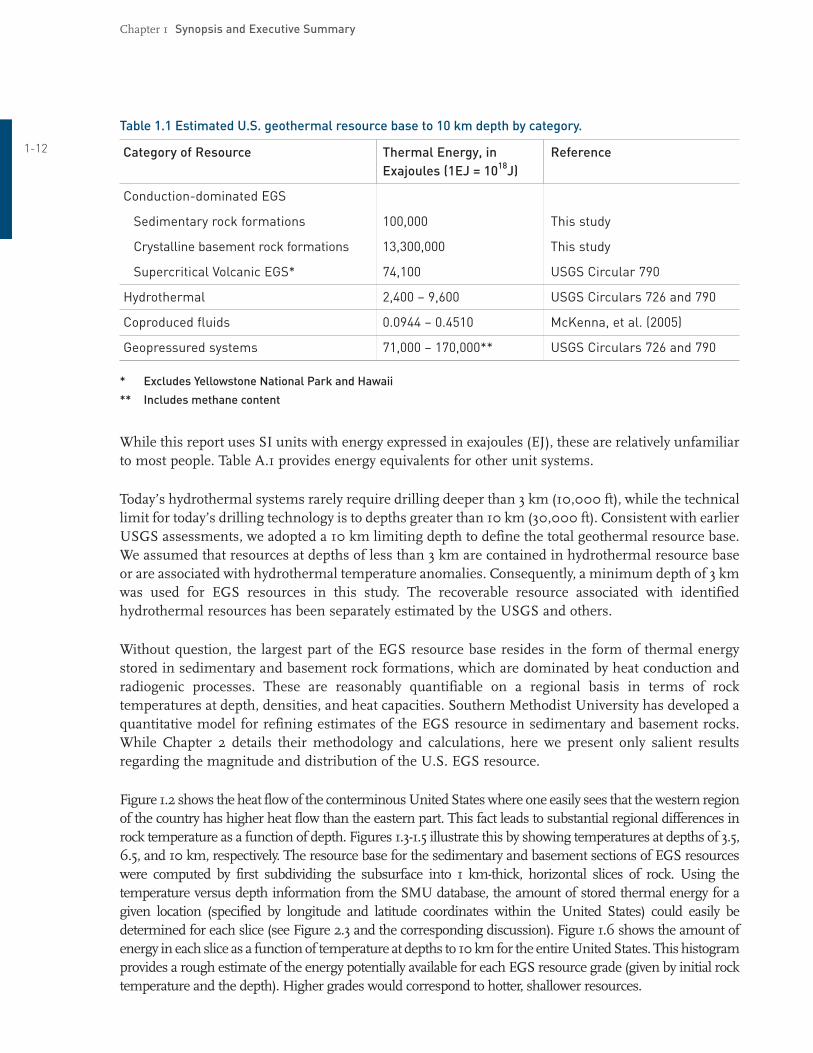
Table 1.1 Estimated U.S. geothermal resource base to 10 km depth by category.
112 Category of Resource Thermal Energy, in Reference Exajoules (1EJ = 1018J)
Conductiondominated EGS
Sedimentary rock formations 100,000 This study
Crystalline basement rock formations 13,300,000 This study
Supercritical Volcanic EGS* 74,100 USGS Circular 790
Hydrothermal 2,400 – 9,600 USGS Circulars 726 and 790
Coproduced fluids 0.0944 – 0.4510 McKenna, et al. (2005)
Geopressured systems 71,000 – 170,000** USGS Circulars 726 and 790
* Excludes Yellowstone National Park and Hawaii
** Includes methane content
While this report uses SI units with energy expressed in exajoules (EJ), these are relatively unfamiliar to most people. Table A.1 provides energy equivalents for other unit systems.
Today’s hydrothermal systems rarely require drilling deeper than 3 km (10,000 ft), while the technical limit for today’s drilling technology is to depths greater than 10 km (30,000 ft). Consistent with earlier USGS assessments, we adopted a 10 km limiting depth to define the total geothermal resource base. We assumed that resources at depths of less than 3 km are contained in hydrothermal resource base or are associated with hydrothermal temperature anomalies. Consequently, a minimum depth of 3 km was used for EGS resources in this study. The recoverable resource associated with identified hydrothermal resources has been separately estimated by the USGS and others.
Without question, the largest part of the EGS resource base resides in the form of thermal energy stored in sedimentary and basement rock formations, which are dominated by heat conduction and radiogenic processes. These are reasonably quantifiable on a regional basis in terms of rock temperatures at depth, densities, and heat capacities. Southern Methodist University has developed a quantitative model for refining estimates of the EGS resource in sedimentary and basement rocks. While Chapter 2 details their methodology and calculations, here we present only salient results regarding the magnitude and distribution of the U.S. EGS resource.
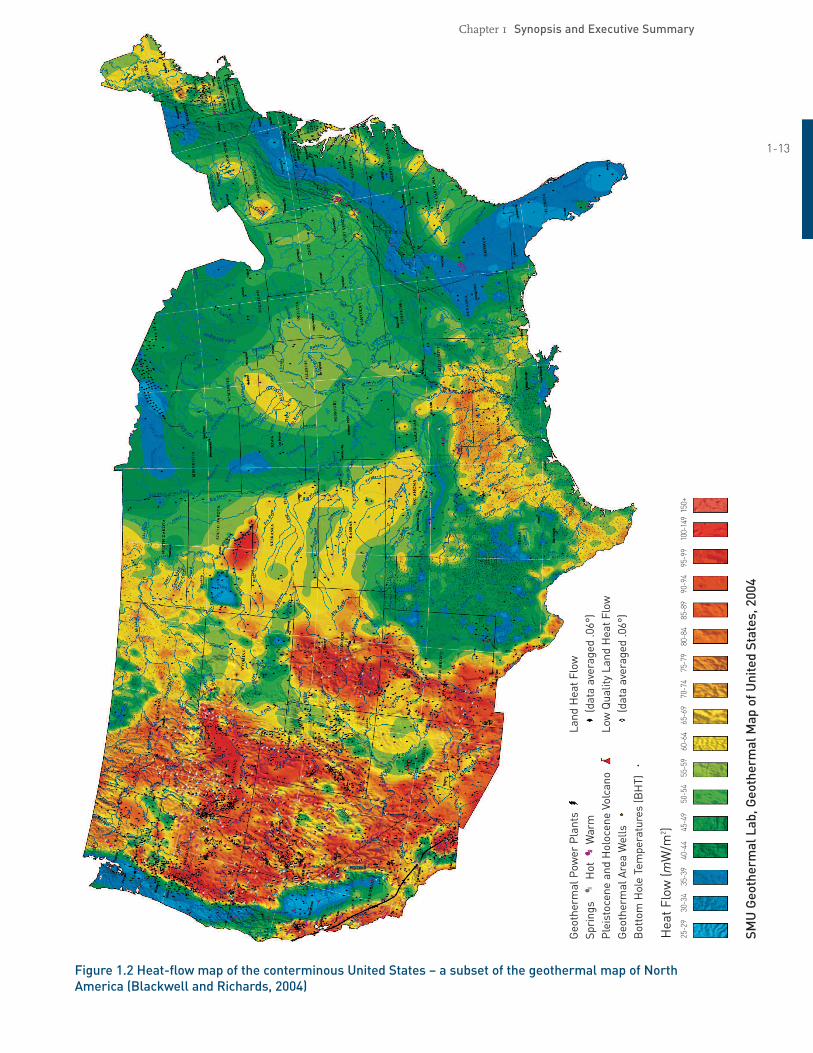
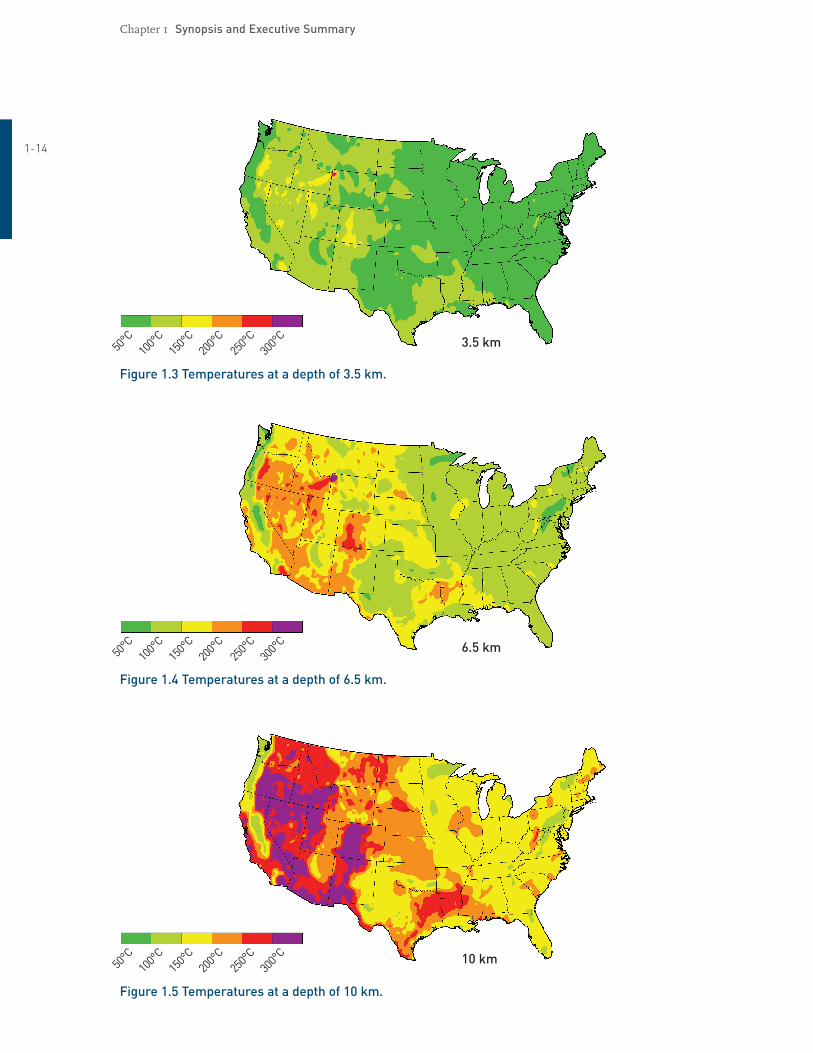
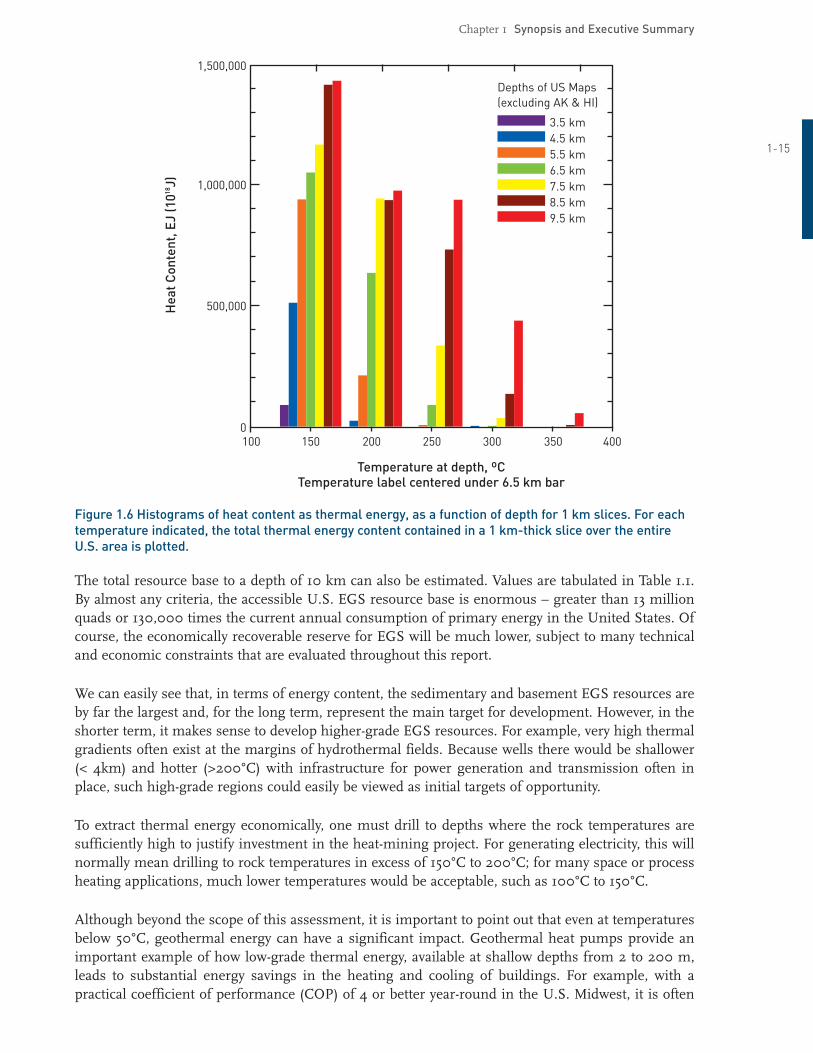
Figure 1.2 shows the heat flow of the conterminous United States where one easily sees that the western region of the country has higher heat flow than the eastern part. This fact leads to substantial regional differences in rock temperature as a function of depth. Figures 1.31.5 illustrate this by showing temperatures at depths of 3.5, 6.5, and 10 km, respectively. The resource base for the sedimentary and basement sections of EGS resources were computed by first subdividing the subsurface into 1 kmthick, horizontal slices of rock. Using the temperature versus depth information from the SMU database, the amount of stored thermal energy for a given location (specified by longitude and latitude coordinates within the United States) could easily be determined for each slice (see Figure 2.3 and the corresponding discussion). Figure 1.6 shows the amount of energy in each slice as a function of temperature at depths to 10 km for the entire United States. This histogram provides a rough estimate of the energy potentially available for each EGS resource grade (given by initial rock temperature and the depth). Higher grades would correspond to hotter, shallower resources.
Chapter 1 Synopsis and Executive Summary
Land
Hea
t Flo
w
Geo
ther
mal
Pow
er P
lant
s (d
ata
aver
aged
.06°
)Sp
ring
s H
ot
War
m
Ple
isto
cene
and
Hol
ocen
e Vo
lcan
o Lo
w Q
ualit
y La
nd H
eat F
low
Geo
ther
mal
Are
a W
ells
(d
ata
aver
aged
.06°
) B
otto
m H
ole
Tem
pera
ture
s (B
HT)
Hea
t Flo
w (m
W/m
2 ) 25
29
303
4 35
39
404
4 45
49
505
4 55
59
606
4 65
69
707
4 75
79
808
4 85
89
909
4 95
99
100
149
150+
Figure 1.2 Heatflow map of the conterminous United States – a subset of the geothermal map of North America (Blackwell and Richards, 2004)
113
SMU
Geo
ther
mal
Lab
, Geo
ther
mal
Map
of U
nite
d St
ates
, 200
4
Chapter 1 Synopsis and Executive Summary
114
C C C C C C0° 00
° 0° 00° 0° 00
°5 5 5 3.5 km
1 21 2 3
Figure 1.3 Temperatures at a depth of 3.5 km.
C C C C C C0° 00
° 0° 00° 0° 00
° 6.5 km5 5 51 21 2 3
Figure 1.4 Temperatures at a depth of 6.5 km.
C C C C C C0° 00
° 0° 00° 0° 00
°5 5 5 10 km
1 21 2 3
Figure 1.5 Temperatures at a depth of 10 km.
Chapter 1 Synopsis and Executive Summary
115
1,500,000
1,000,000
500,000
0
(J)
4.5 km
7.5 km
Depths of US Maps
Hea
t Con
tent
, EJ
10 18
3.5 km
5.5 km 6.5 km
8.5 km 9.5 km
(excluding AK & HI)
100 150 200 250 300 350 400
Temperature at depth, ºC Temperature label centered under 6.5 km bar
Figure 1.6 Histograms of heat content as thermal energy, as a function of depth for 1 km slices. For each temperature indicated, the total thermal energy content contained in a 1 kmthick slice over the entire U.S. area is plotted.
The total resource base to a depth of 10 km can also be estimated. Values are tabulated in Table 1.1. By almost any criteria, the accessible U.S. EGS resource base is enormous – greater than 13 million quads or 130,000 times the current annual consumption of primary energy in the United States. Of course, the economically recoverable reserve for EGS will be much lower, subject to many technical and economic constraints that are evaluated throughout this report.
We can easily see that, in terms of energy content, the sedimentary and basement EGS resources are by far the largest and, for the long term, represent the main target for development. However, in the shorter term, it makes sense to develop highergrade EGS resources. For example, very high thermal gradients often exist at the margins of hydrothermal fields. Because wells there would be shallower (< 4km) and hotter (>200°C) with infrastructure for power generation and transmission often in place, such highgrade regions could easily be viewed as initial targets of opportunity.
To extract thermal energy economically, one must drill to depths where the rock temperatures are sufficiently high to justify investment in the heatmining project. For generating electricity, this will normally mean drilling to rock temperatures in excess of 150°C to 200°C; for many space or process heating applications, much lower temperatures would be acceptable, such as 100°C to 150°C.
Although beyond the scope of this assessment, it is important to point out that even at temperatures below 50°C, geothermal energy can have a significant impact. Geothermal heat pumps provide an important example of how lowgrade thermal energy, available at shallow depths from 2 to 200 m, leads to substantial energy savings in the heating and cooling of buildings. For example, with a practical coefficient of performance (COP) of 4 or better yearround in the U.S. Midwest, it is often
Chapter 1 Synopsis and Executive Summary
possible to achieve more than 75% savings in electrical energy consumption per unit of heating or
116 cooling delivered to the building. Because the use of geothermal heat pumps is often treated as an energy efficiency measure rather than as energy supply – and because they are readily available commercially – more than 1 million units had been installed in the United States by the end of 2005.
For a geothermal resource to be viable, in addition to having sufficiently high temperature, in situ hydrologic and lithologic conditions need to be favorable. In existing vapor and liquiddominated hydrothermal systems, this amounts to having a rock system (reservoir) that has high permeability and high porosity filled with steam or water under pressure. If such conditions do not exist naturally, then the rock system must be stimulated to generate or modify a reservoir to make it sufficiently productive. This is the essence of EGS, where the reservoir is engineered to have it emulate the productivity of a viable hydrothermal system. A range of lithologic and geologic properties are important for determining EGS stimulation approaches. Most important, the state of stress at depths of interest must be known. In addition, other features of the rock mass that influence the probability of creating suitable interwell connectivity include natural fracture spacing, rock strength, and competence.
1.4 Estimating the Recoverable Portion of EGS
Estimating the recoverable fraction of any underground resource is inherently speculative, whether it is for oil or gas, geothermal energy, or a specific mineral. Typically, some type of reservoir simulation model is used to estimate how much can be extracted. To reduce errors, predicted results are validated with field data when available. This type of “history matching” is commonly used in reservoir analysis.
Sanyal and Butler (2005) have modeled flow in fractured reservoirs using specified geometries to determine the sensitivity of the calculated recoverable heat fraction to rock temperature, fractured volume, fracture spacing, fluid circulation rate, well configuration, and poststimulation porosity and permeability. They used a 3dimensional finite difference model and calculated the fraction of the thermal energy in place that could be mined for a specified set of reservoir properties and geometry. Interestingly, for a range of fracture spacings, well geometries, and fracture permeabilities, the
3percentage of recoverable thermal energy from a stimulated volume of at least 1 x 10⁸ m (0.1 km3) under economic production conditions is nearly constant at about 40 ± 7% (see Figure 3.1). Furthermore, this recovery factor is independent of well arrangements, fracture spacing, and
3permeability, as long as the stimulated volume exceeds 1 x 10⁸ m – a value significantly below what has been already achieved in several field projects.
The SanyalButler model was used as a starting point to make a conservative estimate for EGS resource recovery. Channeling, short circuiting, and other reservoirflow problems sometimes have been seen in early field testing, which would require remediation or they would limit capacity. Furthermore, multiple EGS reservoirs would have a specified spacing between them in any developed field, which reduces the reservoir volume at depth per unit surface area. Given the early stage of EGS technology, SanyalButler estimated 40% recovery factor was lowered to 20% and 2% to account for these effects, and reservoir spacings of 1 km at depth were specified to provide a more conservative range for EGS.
With a reservoir recovery factor specified, another conservative feature was introduced by limiting the thermal drawdown of a region where heat mining is occurring. The resource base figures given in Table 1.1 use the surface temperature as the reference temperature to calculate the total thermal energycontent. A much smaller interval was selected to limit the amount of energy extracted by specifying a reservoir abandonment temperature just 10°C below the initial rock temperature at depth.
Chapter 1 Synopsis and Executive Summary
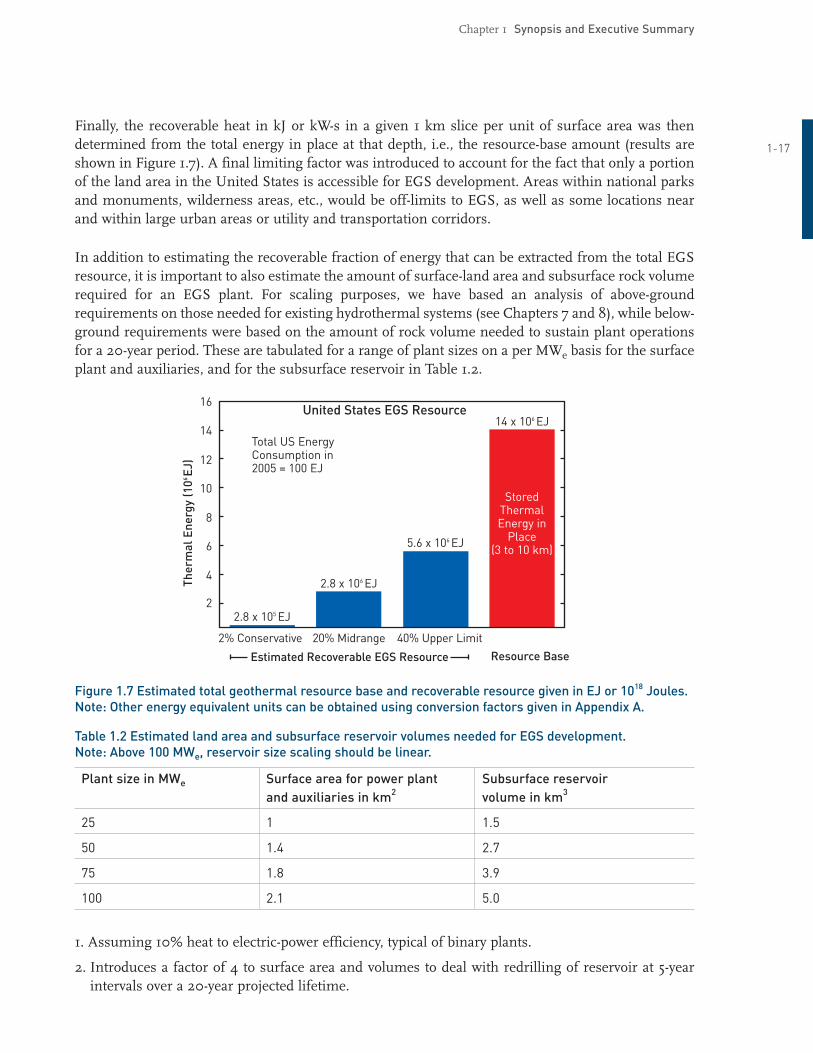
Finally, the recoverable heat in kJ or kWs in a given 1 km slice per unit of surface area was then determined from the total energy in place at that depth, i.e., the resourcebase amount (results are 117 shown in Figure 1.7). A final limiting factor was introduced to account for the fact that only a portion of the land area in the United States is accessible for EGS development. Areas within national parks and monuments, wilderness areas, etc., would be offlimits to EGS, as well as some locations near and within large urban areas or utility and transportation corridors.
In addition to estimating the recoverable fraction of energy that can be extracted from the total EGS resource, it is important to also estimate the amount of surfaceland area and subsurface rock volume required for an EGS plant. For scaling purposes, we have based an analysis of aboveground requirements on those needed for existing hydrothermal systems (see Chapters 7 and 8), while belowground requirements were based on the amount of rock volume needed to sustain plant operations for a 20year period. These are tabulated for a range of plant sizes on a per MWe basis for the surface plant and auxiliaries, and for the subsurface reservoir in Table 1.2.
16
14
12
10
8
6
4
2
14 x 106 EJ
5.6 x 10⁶ EJ
2.8 x 10⁶ EJ
2.8 x 10⁵ EJ
Consumption in
(6
)
Thermal
Total US Energy
2005 = 100 EJ
Ther
mal
Ene
rgy
10 E
J
Stored
Energy in Place
(3 to 10 km)
United States EGS Resource
2% Conservative 20% Midrange 40% Upper Limit
Resource Base Estimated Recoverable EGS Resource
Figure 1.7 Estimated total geothermal resource base and recoverable resource given in EJ or 1018 Joules. Note: Other energy equivalent units can be obtained using conversion factors given in Appendix A.
Table 1.2 Estimated land area and subsurface reservoir volumes needed for EGS development. Note: Above 100 MWe, reservoir size scaling should be linear.
Plant size in MWe Surface area for power plant and auxiliaries in km2
Subsurface reservoir volume in km3
25 1 1.5
50 1.4 2.7
75 1.8 3.9
100 2.1 5.0
1. Assuming 10% heat to electricpower efficiency, typical of binary plants.
2. Introduces a factor of 4 to surface area and volumes to deal with redrilling of reservoir at 5year intervals over a 20year projected lifetime.
Chapter 1 Synopsis and Executive Summary
1.5 Geothermal Drilling Technology and Costs
118 Well costs are a significant economic component of any geothermal development project. For lowergrade EGS, the cost of the well field can account for 60% or more of the total capital investment. For making economic projections, estimates of well drilling and completion costs to depths of 10,000 m (30,000 ft) are needed for all grades of EGS resources. Drillsite specifics, stimulation approaches, well diameters and depths, and well production interval lengths and diameters are just some of the parameters that need to be considered. Drilling records for geothermal wells do not exist in sufficient quantity or detail for making such projections. In recent years, there have been fewer than 100 geothermal wells drilled per year in the United States and very few of them are deeper than 2,800 m (9,000 ft), which provides no direct measure of well costs for deeper EGS targets for the long term.
Insight into geothermal well costs is gained by examining trends from experience in the oil and gas welldrilling industry. Thousands of oil and gas wells are drilled each year in the United States, and data on their costs are available on a yearly basis from the American Petroleum Institute’s Joint Association Survey (JAS) (see API, 2006). Additionally, the similarity between oil and gas wells and geothermal wells makes it possible to develop a drilling cost index that can be used to normalize any geothermal well cost from the past three decades to present current values, so that the well costs can be compared on a common dollar basis.
Because of the limited data available for geothermal drilling, our analysis employed the Wellcost Lite model, developed by Bill Livesay and coworkers at Sandia National Laboratories during the past 20 years, to estimate the cost of EGS wells. The model can accommodate expected ranges in a multitude of parameters (well diameter, bit life, penetration rate, casing design, geologic formation conditions, etc.). Improvements in drilling technology can also be incorporated into the model, as well as directional drilling with multilateral completion legs. Wells in the depth ranges from 1,500 m (4,920 ft) to 10,000 m (32,800 ft) were modeled in three categories: shallow wells (1,5003,000 m), midrange wells (4,0005,000 m), and deep wells (6,00010,000 m).
EGS well costs are significantly influenced by the number of casing strings used. For example, two 5,000 mdeep wells were modeled, one with four casing intervals and another with five casing intervals. Whereas the former requires fewer casing intervals, the increased lengths of individual sections may raise concerns about wellbore stability. This is less of a risk if more casing strings are used, but costs will be adversely affected by an increase in the diameter of the upper casing strings, the size of the rig required, and a number of other parameters. The 6,000 m well was modeled with both five and sixcasing intervals. Costs for the 7,500 m and 10,000 m wells were estimated using six casing intervals.
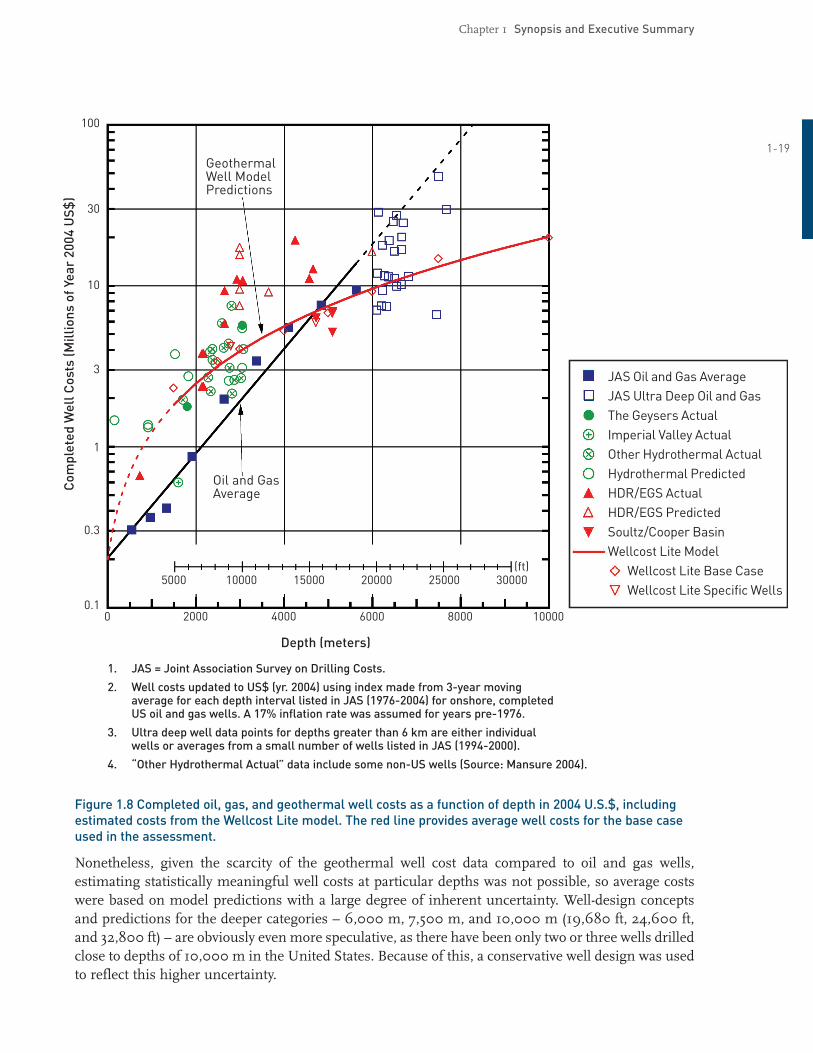
Shallow wells at depths of 1,500, 2,500, and 3,000 m are representative of current hydrothermal practice. Predicted costs from the Wellcost Lite model were compared to actual EGS and hydrothermal well drillingcost records, where available. Figure 1.8 shows the actual costs of geothermal wells, including some EGS wells. The costs predicted by the Wellcost Lite model show adequate agreement with actual geothermal well costs, within the normal ranges of expected variation for all depths.
JAS Oil and Gas AverageJAS Ultra Deep Oil and GasThe Geysers ActualImperial Valley ActualOther Hydrothermal ActualHydrothermal PredictedHDR/EGS ActualHDR/EGS PredictedSoultz/Cooper BasinWellcost Lite Model Wellcost Lite Base Case Wellcost Lite Specific Wells
5000
00.1
0.3
1
3
10
30
GeothermalWell ModelPredictions
Oil and GasAverage
100
2000 4000
Depth (meters)
Com
plet
edW
ellC
osts
(Mill
ions
ofYe
ar20
04U
S$)
6000 8000 10000
10000 15000 20000 25000 30000(ft)
Chapter 1 Synopsis and Executive Summary
119
1. JAS = Joint Association Survey on Drilling Costs.
2. Well costs updated to US$ (yr. 2004) using index made from 3year moving average for each depth interval listed in JAS (19762004) for onshore, completed US oil and gas wells. A 17% inflation rate was assumed for years pre1976.
3. Ultra deep well data points for depths greater than 6 km are either individual wells or averages from a small number of wells listed in JAS (19942000).
4. “Other Hydrothermal Actual” data include some nonUS wells (Source: Mansure 2004).
Figure 1.8 Completed oil, gas, and geothermal well costs as a function of depth in 2004 U.S.$, including estimated costs from the Wellcost Lite model. The red line provides average well costs for the base case used in the assessment.
Nonetheless, given the scarcity of the geothermal well cost data compared to oil and gas wells, estimating statistically meaningful well costs at particular depths was not possible, so average costs were based on model predictions with a large degree of inherent uncertainty. Welldesign concepts and predictions for the deeper categories – 6,000 m, 7,500 m, and 10,000 m (19,680 ft, 24,600 ft, and 32,800 ft) – are obviously even more speculative, as there have been only two or three wells drilled close to depths of 10,000 m in the United States. Because of this, a conservative well design was used to reflect this higher uncertainty.

Chapter 1 Synopsis and Executive Summary
Emerging technologies, which have yet to be demonstrated in geothermal applications and are still
120 going through development and commercialization, can be expected to significantly reduce the cost of these wells, especially those at 4,000 m and deeper. One technology that will potentially reduce the cost of the well construction (casing and cementing) is expandable tubular casing, a patented invention by Shell Oil (Lohbeck, 1993). The concept has been licensed to two commercial firms. There are still concerns about the effect of thermal expansion and the depth of reliable application of the expanded casing when in place.
Drillingwithcasing is another new technology that has the potential to reduce cost. This approach may permit longer casing intervals, leading to fewer strings and, therefore, reduced costs. Research is needed to improve our understanding of cementing practices that apply to the drillingwithcasing technique.
Welldesign changes, particularly involving the use of smaller increments in casing diameters with depth, are likely to significantly reduce EGS well costs. This welldesign approach requires detailed analysis to resolve concerns about pressure drops during cementing. It may be limited to cemented liners.
Being able to increase borehole diameter by underreaming is a key enabling technology for almost all of the EGS drilling applications, including current and future drilling technologies. The development of an underreamer that is reliable and can penetrate at the same rate as the lead bit is a necessity. Current work at Sandia on smallelement drag cutters in geothermal formations may enable dragcutter underreamers (the standard for oil and gas applications) to be a viable tool for geothermal application.
Rateofpenetration (ROP) issues can significantly affect drilling costs in crystalline formations. ROP problems can cause wellcost increases by as much as 15% to 20% above those for more easily drilled basin and range formations.
Casing diameters that decrease with depth are commonplace in conventional casing designs for the hydrothermal, and oil and gas industries. Unfortunately, geothermal wells currently require largerdiameter casings than oil/gas wells. However, this simply means that EGS wells will benefit even more from the use of successful evolving technologies, which have the potential to reduce the cost of the deep wells by as much as $2.5 million to $3 million per well.
In the longer term, particularly when lowergrade EGS resources are being developed, more revolutionary approaches could have a large impact on lowering EGS drilling costs, in that they could increase both ROP and bit lifetime as well as facilitate underreaming. For example, such approaches would reduce the number of times the drill string would have to be removed from the hole to change drill bits. Three revolutionary drilling technology examples include hydrothermal flame spallation and fusion drilling (Potter and Tester, 1998), chemically enhanced drilling (Polizotti, 2003), and metal shot abrasiveassisted drilling (Curlett and Geddes, 2006). Each of these methods augments or avoids the traditional method of penetration based on crushing and grinding rock with a hardened material in the drill bit itself, thereby reducing the tendency of the system to wear or fail.
1.6 EGS Reservoir Stimulation – Status of International Field Testing and Design Issues
Creating an Enhanced Geothermal System requires improving the natural permeability of hot rock. Rocks are naturally porous by virtue of minute fractures and pore spaces between mineral grains.

Chapter 1 Synopsis and Executive Summary
When some of this porosity is interconnected so that fluids (water, steam, natural gas, crude oil) can flow through the rock, such interconnected porosity is called permeability. 121
Rock permeability extends in a continuum over several orders of magnitude, from rocks that are highly permeable and whose contained fluids can be produced by merely drilling wells (e.g., oil and gas wells, water wells, hydrothermal systems), to those that are almost completely impermeable (e.g., tight gas sands, hot dry rock). Extensive drilling for petroleum, geothermal, and mineral resources during the past century has demonstrated that the largest heat resource in the Earth’s crust, by far, is contained in rocks of low natural permeability. Recovery of heat from such rocks at commercial rates and competitive costs is the object of the EGS program.
This EGS assessment draws heavily on research funded by the DOE and ongoing EGS work around the world. The knowledge gained from this research in the United States and elsewhere, reviewed below, forms a robust basis for the future enhancements of this growing knowledge base.
Since the 1970s, research projects aimed at developing techniques for the creation of geothermal reservoirs in areas that are considered noncommercial for conventional hydrothermal power generation have been – and are being – conducted around the world. These include the following:
• United States: Fenton Hill, Coso, Desert Peak, Glass Mountain, and The Geysers/Clear Lake
• United Kingdom: Rosemanowes
• France: Soultz, Le Mayet de Montagne
• Japan: Hijiori and Ogachi
• Australia: Cooper Basin, Hunter Valley, and others
• Sweden: Fjallbacka
• Germany: Falkenberg, Horstberg, and Bad Urach
• Switzerland: Basel and Geneva
Techniques for extracting heat from lowpermeability, hot dry rock (HDR) began at the Los Alamos National Laboratory in 1974 (Armstead and Tester, 1987). For lowpermeability formations, the initial concept is quite straightforward: drill a well to sufficient depth to reach a useful temperature, create a large heattransfer surface area by hydraulically fracturing the rock, and intercept those fractures with a second well. By circulating water from one well to the other through the stimulated region, heat can be extracted from the rock. Fundamentally, this early approach – as well as all later refined methods – requires that good hydraulic conductivity be created between injection and production wells through a large enough volume of rock to sustain economically acceptable energyextraction rates and reservoir lifetimes. Ultimately, field testing will need to produce a commercialsized reservoir that can support electricity generation or cogeneration of electrical power and heat for a variety of applications such as heat for industrial processes and local district heating.
As expected in the early development of any new technology, many lessons have been learned from 30 years of EGS field research in the eight countries listed above. For example, the initial concept of producing discrete hydraulic fractures has largely been replaced by stimulating the natural fracture system. Although the goal of operating a commercialsized EGS reservoir has not been achieved yet,

Chapter 1 Synopsis and Executive Summary
field testing has successfully demonstrated that reservoirs of sufficient size with nearly sufficient
122 connectivity to produce fluids at commercial rates can be established.
Through field tests in lowpermeability crystalline rock, researchers have made significant progress in understanding reservoir characteristics, including fracture initiation, dilation and propagation, thermal drawdown, water loss rates, flow impedance, fluid mixing, and fluid geochemistry. In addition to using hydraulic stimulation methods to establish connectivity in the far field, it is feasible to create permeability near injection or production wellbores by explosive fracturing, chemical leaching, and thermal stress cracking (Armstead and Tester, 1987; Tester et al., 1989).
Included among the milestones that have been achieved are:
• Drilling deep directionally oriented wells to specific targets.
• Creation of contained fracture systems in large volumes of rock of 1 km3 or more.
• Improved understanding of the thermalhydraulic mechanisms controlling the opening of fracture apertures.
• Improved methods for sequencing the drilling of wells, stimulating reservoirs, and managing fluid flow and other hydraulic characteristics.
• Circulation of fluid at wellflow rates of up to 25 kg/s on a continuous basis.
• Methods to monitor and manage induced microseismicity during stimulation and circulation.
• Extraction of heat from welldefined regions of hot fractured rock without excessive thermal drawdown.
• Generation of electrical power in small pilot plants.
Nonetheless, there are outstanding issues that must be resolved before EGS can be considered commercial. In general, these are all connected to enhancing the connectivity of the stimulated reservoir to the injection and production well network. Notably, they are incremental in their scope, representing extending current knowledge and practical field methods. There are no anticipated “showstoppers” or fundamental constraints that will require new technologies to be discovered and implemented to achieve success. The remaining priority issue is demonstrating commercial levels of fluid production from several engineered EGS reservoirs over acceptable production periods. Specific research and fieldtesting goals can be placed into two categories:
1. Primary goals for commercial feasibility:
• Develop and validate methods to achieve a twofold to fourfold increase in production wellflow rate from current levels, while maintaining sufficient contact with the rock within the reservoir and ensuring sufficient reservoir lifetime.
• Validate longterm operability of achieving commercial rates of heat production from EGS reservoirs for sustained periods of time at several U.S. sites.
2. Secondary goals connected to EGS technology improvement:
• Develop better methods of determining the distribution, density, and orientation of preexisting and stimulated fractures to optimize overall hydraulic connectivity within the stimulated reservoir.
Chapter 1 Synopsis and Executive Summary
• Improve methods to repair or remedy any flow short circuits that may develop.
• Understand the role of major, preexisting faults in constraining or facilitating the flow in the reservoir. 123
• Develop robust downhole tools to measure temperature, pressure, flow rate, and natural gamma emissions, capable of surviving in a well at temperatures of 200°C or higher for longterm monitoring.
• Predict scaling or deposition through better understanding of the rockfluid geochemistry.
The advancement of EGS greatly depends on our understanding of the preexisting, unstimulated, rockfracture system – and on our ability to predict how the reservoir will behave under stimulation and production. So far, no EGS reservoir has been operated long enough to provide the data needed to validate a simulation model. A reliable reservoirsimulation model will allow us to better estimate the operating and maintenance costs of an EGS energy facility.
As we demonstrate in Chapter 2, the heat stored in the earth beneath the United States – at a depth accessible with today’s drilling technology – is truly vast. However, the fraction of this resource base that can be economically recovered is dependent on improving the technology to map, penetrate, fracture, and maintain productive EGS reservoirs – and on improving our understanding of reservoir behavior under longterm energy extraction. These improvements, in turn, are directly connected to the level of research, development, testing, and demonstration of EGS.
While support of research will pay rapid dividends in providing measurable improvements to these important components of EGS technology – as well as technologies for drilling and power conversion mentioned earlier – there is also an opportunity for developing more revolutionary, potentially groundbreaking technologies in the longer term that could make EGS even more useful and universally accessible. For example, in Section 1.5, we mentioned three revolutionary drilling methods that could, if perfected, provide increased economic access to EGS by dramatically lowering costs, particularly for lowgrade, lowgradient resources. In the reservoir area, there are possibilities as well. One such possibility involves the proposed use of carbon dioxide (in a supercritical state) as a fluid for heat extraction within an EGS reservoir (Brown, 2000). Recently, Pruess and Azaroual (2006) estimated reservoir performance using supercritical carbon dioxide in place of water. Early modeling results suggest improvements in heatextraction efficiency, as well as the ability to store and sequester carbon dioxide within the confined EGS reservoir for carbon management.
With a fully supported federal R&D program and anticipated market price increases for electric power, the technology developed in this program could be implemented in a relatively short period of time in high and midgrade areas in the Western United States. The knowledge and momentum generated during this early deployment would enable EGS methods to be applied widely across the United States, including lowergrade areas of the Midwest and the East, which have not had any hydrothermal geothermal development yet.
1.7 Geothermal Energy Conversion Technology
There are several options for utilizing the thermal energy produced from geothermal systems. The most common is baseload electric power generation, followed by direct use in process and spaceheating applications. In addition, combined heat and power in cogeneration and hybrid systems, and as a heat source and sink for heat pump applications, are options that offer improved energy savings.

Chapter 1 Synopsis and Executive Summary
Today, with nearly 10,000 MWe of electricity generated by geothermal worldwide, there are several
124 energy conversion technologies commercially available at various stages of maturity. These include direct steam expansion, single and multistage steam flashing, organic binary Rankine cycles, and twophase flow expanders. Figure 1.9 shows several representative flow sheets of conversion options applicable for a range of EGS resource grades. Directuse and heat pump applications are also having an increasing impact, with a combined, estimated market penetration of about 100,000 MWt worldwide.
E
P
IP
(a) (b)
(c)
PW
CP
C
T/G T/GCT CT
CWP
CS
PW
BCV
IW IW
C
CP
CWP
PW
CS
SPT
BCV
F
HPP
HPT
LPT
G
CW
C
LPPIW
Figure 1.9 Schematics of EGS power conversion systems: (a) a basic binary power plant; (b) a singleflash power plant; (c) a tripleexpansion power plant for supercritical EGS fluids.
There are inherent limitations on converting geothermal energy to electricity, because of the lower temperature of geothermal fluids in comparison to much higher combustion temperatures for fossil fuels. Lower energy source temperatures result in lower maximum workproducing potential in terms of the fluid’s availability or exergy; and in lower heattopower efficiencies as a consequence of the Second Law of thermodynamics. The value of the availability determines the maximum amount of electrical power that could be produced for a given flow rate of produced geofluid, given a specified temperature and density or pressure. Figure 1.10 illustrates how the availability of the geofluid (taken as pure water) varies as a function of temperature and pressure. It shows that increasing pressure and increasing temperature have a nonlinear effect on the maximum workproducing potential. For example, an aqueous geofluid at supercritical conditions with a temperature of 400°C and pressure of 250 bar has more than five times the powerproducing potential than a hydrothermal liquid water geofluid at 225°C. Ultimately, this performance enhancement provides an incentive for developing supercritical EGS reservoirs.

Chapter 1 Synopsis and Executive Summary
125 1400
200
50 100 150 200 250 300 350 400 450 5000
400
600
800
1000
1200
Temperature, T(°C)
Avai
labi
lity,B
(kJ/
kg)
SupercriticalFluid
Vapor
Liquid
VLE
P = 1 bar
P = 10 bar
P = 50 bar
P = 100 bar
P = 150 bar
P = 200 bar
P = 250 bar
Figure 1.10 Availability diagram for water. The magnitude of the availability is a direct measure of the maximum electrical work or powerproducing potential of aqueousproduced geofluid at specificstate conditions of temperature and pressure.
The large capital investment that is contained in the wellfield/reservoir portion of the system places a premium on achieving as high an efficiency as possible for a given geothermal resource, so it is worth putting considerable effort into mitigating these thermodynamic limitations. A utilization efficiency, defined as the ratio of actual net power to maximum possible power, provides a measure of how close the conversion system comes to ideal, reversible operation. Current practice for geothermal conversion systems shows utilization efficiencies typically range from 25% to 50%. Future engineering practice would like to increase these to 60% or more, which requires further investments in R&D to improve heattransfer steps by minimizing temperature differences and increasing heattransfer coefficients, and by improving mechanical efficiencies of converters such as turbines, turboexpanders, and pumps.
Keeping these issues in mind, the panel considered specific cases for a range of EGS resource types and applications:
1. Electricity generation using EGS geofluids from sedimentary and basement rock formations and similar reservoirs, ranging in temperature from 100°C to 400°C, including one case at supercritical conditions;
2. Electricity generation from coproduced oil and gas operations using organic binary power plant designs over resource temperatures ranging from 100°C to 180°C;
3. Combined heat and power – cogeneration of electricity and thermal energy where the conditions at the MIT COGEN plant (nominally 20 MWe and 140,000 lb/h steam) were used as a model system.

Chapter 1 Synopsis and Executive Summary
Each case in (1)(3) involved the following steps, using standard methods of engineering design
126 and analysis:
a) identification of the most appropriate conversion system;
b) calculation of the net power per unit mass flow of geofluid;
c) calculation of mass flow required for 1, 10, and 50 MW plants;
d) estimation of capital and installed plant costs
Our analysis of surfaceconversion systems shows the following:
• Practical, commercialscale energy conversion systems exist for all EGS geofluid types from lowtemperature liquid water at 100°C to supercritical water at 400°C.
• 6,000 to 11,000 MWe of generating capacity exists in coproduced hot waters associated with landbased domestic oil and gas production operations.
• Installed capital costs for surface conversion plants ranged from $2,300/kWe for 100°C resource temperatures to $1,500/kWe for 400°C resource temperature.
General EGS system properties were treated in one part of the analysis to provide design equations and costs, while several nearterm targets of opportunity were also evaluated in somewhat more detail. Chapter 7 describes the technologies analyzed, along with plantflow sheets and layouts for specific cases.
1.8 Environmental Attributes of EGS
When examining the full life cycle of geothermal energy developments, their overall environmental impacts are markedly lower than conventional fossilfired and nuclear power plants. In addition, they may have lower impacts in comparison to other renewables such as solar, biomass, and wind on an equivalent energyoutput basis. This is primarily because a geothermal energy source is contained underground, and the surface energy conversion equipment is relatively compact, making the overall footprint of the entire system small. EGS geothermal power plants operating with closedloop circulation also provide environmental benefits by having minimal greenhouse gas and other emissions. Being an indigenous resource, geothermal – like other renewable resources – can reduce our dependence on imported fossil fuels. As it provides dispatchable baseload capacity, geothermal – even at high levels of penetration – would have no storage or backuppower requirements.
With geothermal energy, there is no need to physically mine materials from a subsurface resource, or to modify the earth’s surface to a significant degree as, for example, in strip mining of coal or uranium. Unlike fossil and biomass fuels, geothermal energy is not processed and transported over great distances (an energyconsuming and potentially environmentally damaging process), there are minimal discharges of nitrogen or sulfur oxides or particulate matter resulting from its use, and there is no need to dispose of radioactive materials. However, there still are impacts that must be considered and managed if this energy resource is to be developed as part of a more environmentally sound, sustainable energy portfolio for the future.
Chapter 1 Synopsis and Executive Summary
The major environmental issues for EGS are associated with groundwater use and contamination, with related concerns about induced seismicity or subsidence as a result of water injection and 127 production. Issues of noise, safety, visual impacts, and land use associated with drilling and production operations are also important but fully manageable.
As geothermal technology moves away from hydrothermal and more toward larger EGS developments, it is likely that environmental impacts and risks will be further reduced relative to those associated with hydrothermal systems. For example, EGS plants should only rarely have a need for abatement of hydrogen sulfide (H2S), ammonia (NH3), and other chemical emissions.
1.9 Economic Feasibility Issues for EGS
This section highlights the role that EGS can play in supplying baseload and distributed electricity in evolving U.S. energy markets. Important factors that favor having EGS as an option will be discussed, including projected demand growth, retirement of existing conventional capacity, transmission access, fuel supply limitation, environmental, and other constraints on expanding fossil and nuclear supply.
Major components affecting risk in geothermalbased electricity and thermal energy production are discussed in Section 9.7.
Geothermal energy, which is transformed into delivered energy (electricity or direct heat), is an extremely capitalintensive and technologydependent industry. Capital investment can be divided into three distinct phases:
1. Exploration, and drilling of test and production wells
2. Construction of power conversion facilities
3. Discounted future redrilling and well stimulation.
Estimated levelized costs were used as a basis for comparing EGS projections to existing and new energysupply technologies. The methodology used for the supply curves was analyzed in detail to show how access to potential growth in EGS generation capacity would be available in the United States as a result of the diversity, large size, and distribution of the EGS resource.
Two different economic models – Geothermal Electric Technology Evaluation Model (GETEM) and MIT EGS – were updated and modified to estimate levelized electricity prices for EGS technology over a range of conditions. Starting with specified basecase values that represent financial parameters (debt interest, equity rate of return, etc.), system performance (thermal drawdown rate or reservoir lifetime, well flow rate, number of production and injection wells, etc.), capital costs (site exploration, drilling and redrilling, reservoir stimulation, and surface plant facilities), and operating and maintenance costs, we calculated and validated predicted costs for EGS at targeted, representative sites using both models (see Table 1.3), and explored the effects of sensitivity to uncertain parameters, as shown in Figures 1.11 and 1.12.

Chapter 1 Synopsis and Executive Summary
128
% Change From Base Case
-60
3.0
3.5
4.0
4.5
-40 -20 0 20 40 60
Thermal Drawdown RateBond Debt Interest RateEquity Rate of Return% Bond vs Equity Debt
Drilling & Completion CostStimulation CostSurface Plant Capital CostFlow Rate/Production Well
Leve
lized
Cos
tofE
lect
rici
ty(c
/kW
h)
Figure 1.11 Sensitivity for mature technology at a representative highgrade EGS site: 80 kg/s flow rate per production well in a quartet configuration (1 injector : 3 producers) for the Clear Lake (Kelseyville, Calif.) scenario showing levelized cost of electricity. (MIT EGS economic model results shown.)
% Change From Base Case
-60
7
8
10
11
-40 -20 0 20 40 60
9
6
Thermal Drawdown RateBond Debt Interest RateEquity Rate of Return% Bond vs Equity Debt
Drilling & Completion CostStimulation CostSurface Plant Capital CostFlow Rate/Production Well
Leve
lized
Cos
tofE
lect
rici
ty(c
/kW
h)
Figure 1.12 Sensitivity for mature technology at a representative lowgrade EGS site: 80 kg/s flow rate per production well in a quartet configuration (1 injector : 3 producers) for the Conway, N.H., scenario showing levelized cost of electricity. (MIT EGS economic model results shown.)
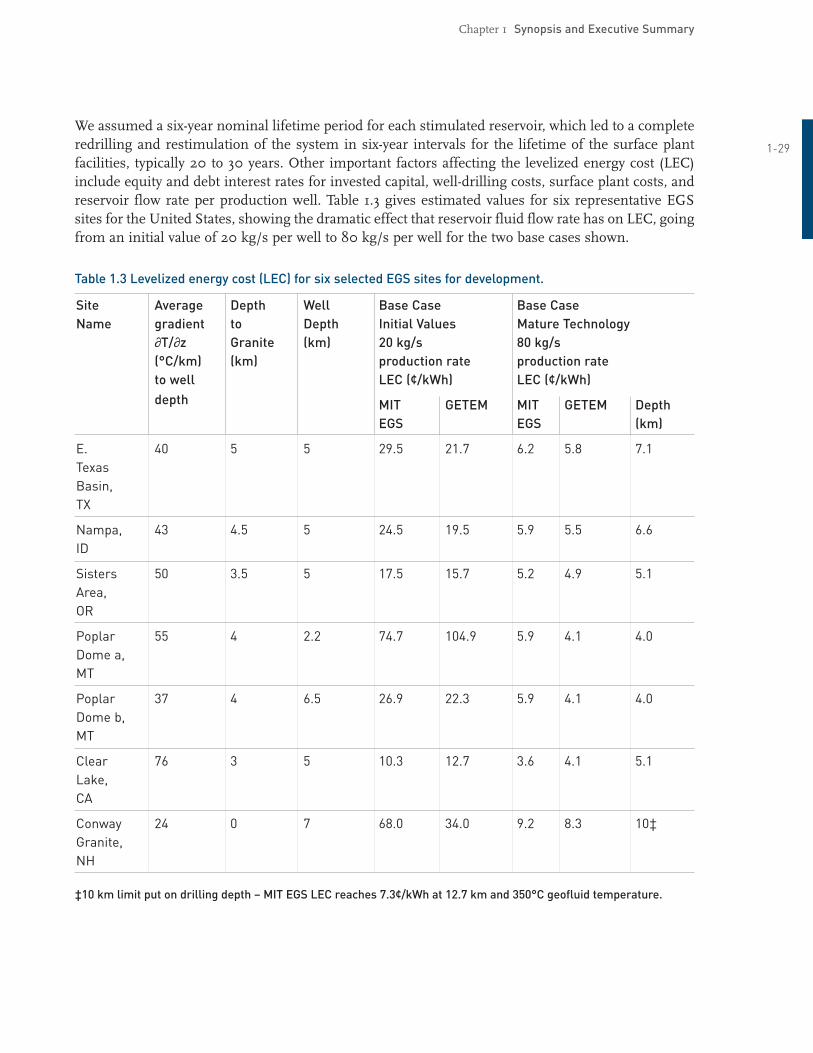
Chapter 1 Synopsis and Executive Summary
We assumed a sixyear nominal lifetime period for each stimulated reservoir, which led to a complete redrilling and restimulation of the system in sixyear intervals for the lifetime of the surface plant 129 facilities, typically 20 to 30 years. Other important factors affecting the levelized energy cost (LEC) include equity and debt interest rates for invested capital, welldrilling costs, surface plant costs, and reservoir flow rate per production well. Table 1.3 gives estimated values for six representative EGS sites for the United States, showing the dramatic effect that reservoir fluid flow rate has on LEC, going from an initial value of 20 kg/s per well to 80 kg/s per well for the two base cases shown.
Table 1.3 Levelized energy cost (LEC) for six selected EGS sites for development.
Site Average Depth Well Base Case Base Case
Name gradient to Depth Initial Values Mature Technology
∂T/∂z Granite (km) 20 kg/s 80 kg/s
(°C/km) (km) production rate production rate
to well LEC (¢/kWh) LEC (¢/kWh) depth MIT GETEM MIT GETEM Depth
EGS EGS (km)
E. 40 5 5 29.5 21.7 6.2 5.8 7.1
Texas Basin, TX
Nampa, 43 4.5 5 24.5 19.5 5.9 5.5 6.6
ID
Sisters 50 3.5 5 17.5 15.7 5.2 4.9 5.1
Area, OR
Poplar 55 4 2.2 74.7 104.9 5.9 4.1 4.0
Dome a, MT
Poplar 37 4 6.5 26.9 22.3 5.9 4.1 4.0
Dome b, MT
Clear 76 3 5 10.3 12.7 3.6 4.1 5.1
Lake, CA
Conway 24 0 7 68.0 34.0 9.2 8.3 10‡
Granite, NH
‡10 km limit put on drilling depth – MIT EGS LEC reaches 7.3¢/kWh at 12.7 km and 350°C geofluid temperature.

Chapter 1 Synopsis and Executive Summary
Figure 1.13 illustrates a predicted aggregate supply curve for the U.S. EGS resource, regardless of
130 region and not described by a particular depth or stored thermal energy content, using the variable rate of return (VRR) MIT EGS costing model. As expected for any new technology, costs at low levels of penetration are higher than existing markets for electric power, but rapidly decline. When EGS increases above 100 MWe of capacity, which amounts to only a few EGS projects, costs begin to become competitive. The segmented structure of the supply curve is a reflection of dividing the EGS resource into 1 kmthick segments (see Figure 1.6). The slight increase in breakeven price that occurs at higher levels of penetration (above 5,000 MWe) is due to extraction of heat from somewhat lowergrade EGS resources (with lower average gradient and heat flow) that require deeper, more costly drilling. However, by the time these levels are reached, it is expected that competitive electricity prices will be equal to or greater than the EGS values, so that further deployment will
EGS Capacity Scenario (MW )
Bre
ak-e
ven
Pri
ce(¢
/kW
h)
010 100 1,000 10,000 100,000
2
4
6
8
10
12
e
not be constrained.
Figure 1.13 Aggregate supply using MIT EGS, variable rate of return (VRR) model with quartet well configurations and a maximum flow per well of 80 kg/s.
Next, we analyzed the effects of experience. Learning curves were developed to reflect cost reductions resulting from improvements in drilling, reservoir stimulation, and surface plant technologies. These stem from the combination of R&D investments that lower costs, and experience gained by repeating the deployment of EGS plants at different U.S. sites as part of a focused national initiative. Figures 1.14 to 1.16 illustrate these supply curves using both GETEM and MIT EGS models over a range ofassumed conditions. When the EGS breakeven prices are greater than competitive market prices for electricity, additional institutional investment is needed. For example, on Figure 1.14, this corresponds to the period from 0 to about 12 years. The total amount of investment required is proportional to the area between the EGS price curve and the market price curve. weighted by the amount of EGS capacity online.
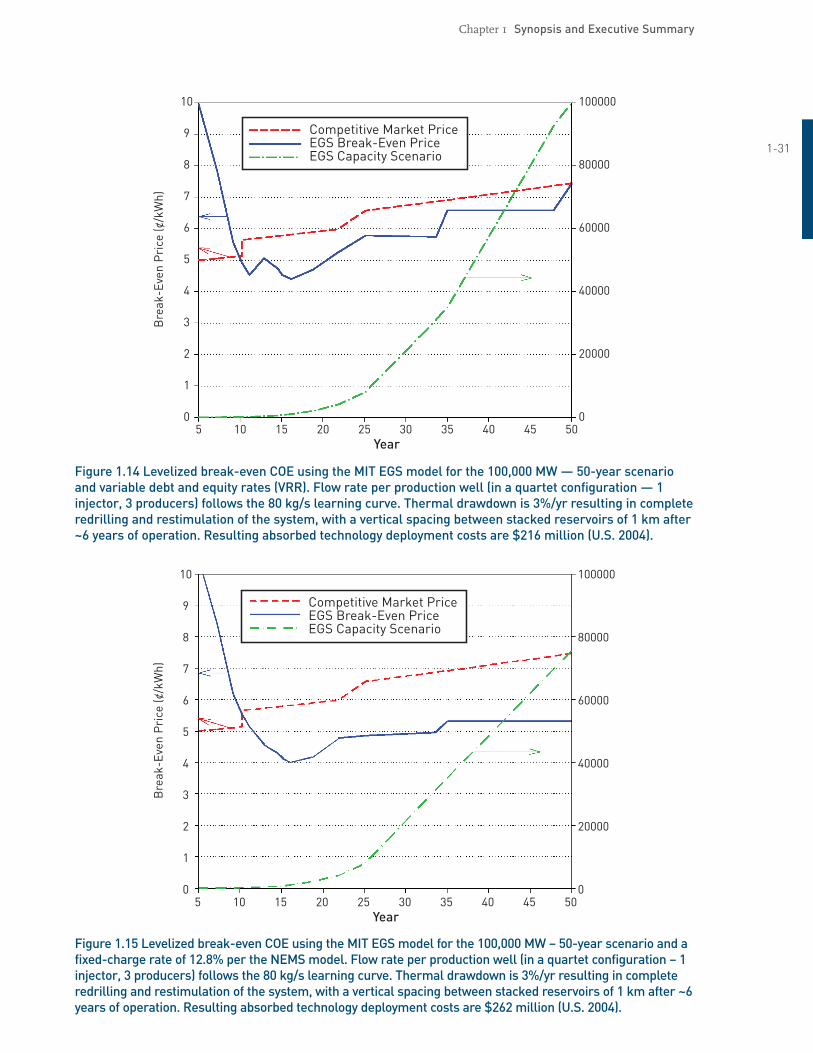
0 0
20000
40000
60000
80000
100000
5 10 15 20 25 30 35 40 45 50
1
2
3
4
5
6
7
8
9
10
Year
Competitive Market PriceEGS Break-Even PriceEGS Capacity Scenario
Bre
ak-E
ven
Pri
ce(c
/kW
h)
Chapter 1 Synopsis and Executive Summary
131
0 0
20000
40000
60000
80000
100000
5 10 15 20 25 30 35 40 45 50
1
2
3
4
5
6
7
8
9
10
Year
Competitive Market PriceEGS Break-Even PriceEGS Capacity Scenario
Bre
ak-E
ven
Pri
ce(c
/kW
h)
Figure 1.14 Levelized breakeven COE using the MIT EGS model for the 100,000 MW — 50year scenario and variable debt and equity rates (VRR). Flow rate per production well (in a quartet configuration — 1 injector, 3 producers) follows the 80 kg/s learning curve. Thermal drawdown is 3%/yr resulting in complete redrilling and restimulation of the system, with a vertical spacing between stacked reservoirs of 1 km after ~6 years of operation. Resulting absorbed technology deployment costs are $216 million (U.S. 2004).
Figure 1.15 Levelized breakeven COE using the MIT EGS model for the 100,000 MW – 50year scenario and a fixedcharge rate of 12.8% per the NEMS model. Flow rate per production well (in a quartet configuration – 1 injector, 3 producers) follows the 80 kg/s learning curve. Thermal drawdown is 3%/yr resulting in complete redrilling and restimulation of the system, with a vertical spacing between stacked reservoirs of 1 km after ~6 years of operation. Resulting absorbed technology deployment costs are $262 million (U.S. 2004).
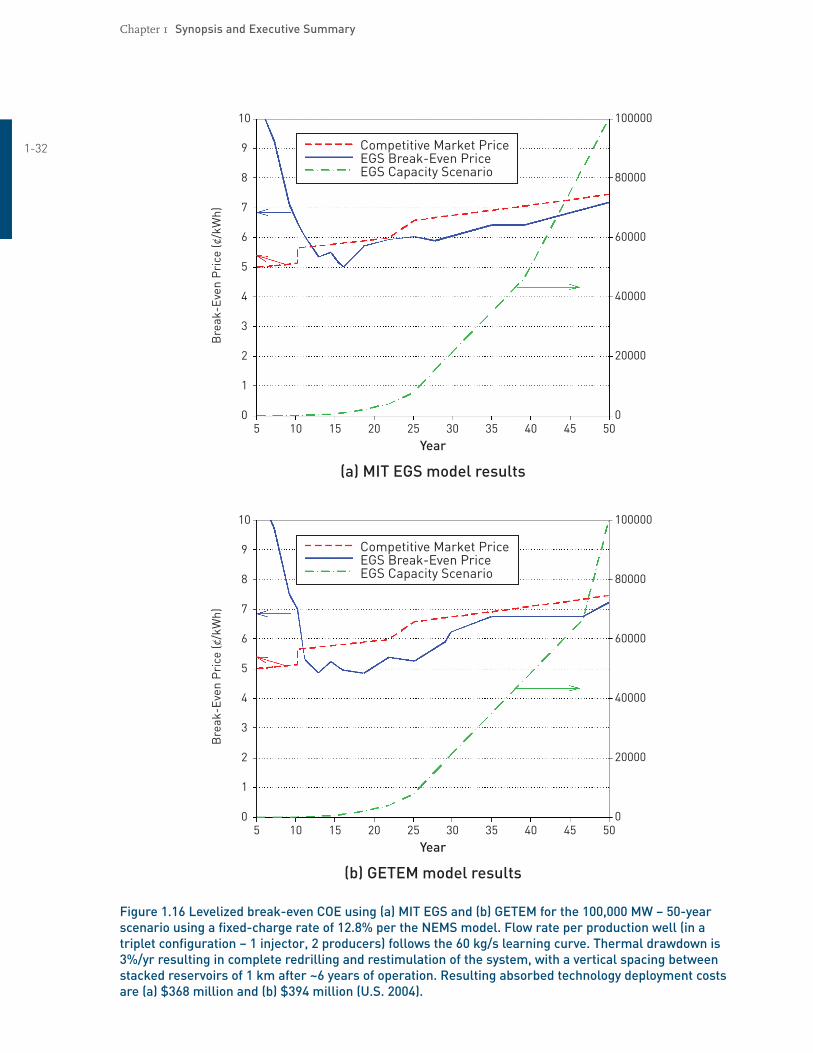
Chapter 1 Synopsis and Executive Summary
132
0 0
20000
40000
60000
80000
100000
5 10 15 20 25 30 35 40 45 50
1
2
3
4
5
6
7
8
9
10
(b) GETEM model results
Year
0 0
20000
40000
60000
80000
100000
5 10 15 20 25 30 35 40 45 50
1
2
3
4
5
6
7
8
9
10
(a) MIT EGS model results
Year
Competitive Market PriceEGS Break-Even PriceEGS Capacity Scenario
Competitive Market PriceEGS Break-Even PriceEGS Capacity Scenario
Bre
ak-E
ven
Pri
ce(c
/kW
h)B
reak
-Eve
nP
rice
(c/k
Wh)
Figure 1.16 Levelized breakeven COE using (a) MIT EGS and (b) GETEM for the 100,000 MW – 50year scenario using a fixedcharge rate of 12.8% per the NEMS model. Flow rate per production well (in a triplet configuration – 1 injector, 2 producers) follows the 60 kg/s learning curve. Thermal drawdown is 3%/yr resulting in complete redrilling and restimulation of the system, with a vertical spacing between stacked reservoirs of 1 km after ~6 years of operation. Resulting absorbed technology deployment costs are (a) $368 million and (b) $394 million (U.S. 2004).
Chapter 1 Synopsis and Executive Summary
As a result of technology improvements from research and learning curve effects, we have found a strong positive correlation between the early deployment of new EGS facilities and the significant 133 decline in the levelized cost of delivered electricity. This finding reflects not only the economies from new techniques and access to highervalue resources, but also the inevitable changes in availability and increased cost of conventional energy sources. For example, for hydroelectric power, reduced capacity occurs as a result of changed weather patterns and lower resource flows to existing facilities, as well as competition for the resource for alternate uses such as fish and wildlife, recreation, flood control, and capacity losses in dammed areas. In the case of coalfired electricity, increased busbar costs are predicted as result of three effects occurring over time: (i) fuel cost increases, (ii) higher capital costs of new facilities to satisfy higher efficiency and environmental quality goals, including capture and sequestration of CO2, and (iii) retirement of a significant number of lowcost units in the existing fleet due to their age or failure to comply with stiffer environmental standards. In the case of nuclear facilities, we anticipate a shortfall in nuclear supplies through the forecast period, reflecting retirement of the existing power reactors and difficulties in siting and developing new facilities. Without corresponding baseload replacements to meet existing and increased demand, the energy security of the United States will be compromised. It would seem prudent to invest now in developing a portfolio of options that could meet this need.
To sum up, based on our technical and economic analysis, a reasonable investment in R&D and a proactive level of deployment in the next 10 years could make EGS a major player in supplying 10% of U.S. baseload electricity by 2050. Further, the analysis shows that the development of new EGS resources will not be limited by the size and location of the resource in the United States, and it will occur at a critical time when grid stabilization with both replacement and new baseload power will be needed. Adding the EGS option to the U.S. portfolio will reduce growth in natural gas consumption and slow the need for adding expensive natural gas facilities to handle imported liquefied natural gas (LNG).
Although EGSproduced commercial power currently lacks a demonstration of its capability, this can be realized in the short term with a proven application of R&D support. The potential of EGS in evolving U.S. energy markets is large and warrants a comprehensive research and demonstration effort to move this technology to commercial viability, especially as the country approaches a period when gap between demand for and generation of electricity will most affect the existing system capacity.
Chapter 1 Synopsis and Executive Summary
References 134
The references listed below are cited within the text of the Synopsis and Executive Summary of this report. For a list of all the literature that was reviewed and evaluated, see the Reference sections of the individual chapters in the full report.
American Petroleum Institute (API). 2006. “Joint Association Survey on Drilling Costs (19762004).” Washington, D.C.
Armstead, H. C. H. and J. W. Tester. 1987. Heat Mining. E and F. N. Spon, London.
Blackwell, D. D. and M. Richards. 2004. Geothermal Map of North America. Amer. Assoc. Petroleum Geologists, Tulsa, Oklahoma, 1 sheet, scale 1:6,500,000.
Bodvarsson, G. and J.M. Hanson. 1977. “Forced Geoheat Extraction from Sheetlike Fluid Conductors.” Proceedings of the Second NATOCCMS Information Meeting on dry hot rock geothermal energy. Los Alamos Scientific Laboratory report, LA7021:85.
Brown, D.W. 2000. “A Hot Dry Rock Geothermal Energy Concept Utilizing Supercritical CO2 Instead of Water,” Proceedings of the TwentyFifth Workshop on Geothermal Reservoir Engineering, Stanford University, Stanford, CA, Jan. 24–26, 2000, Paper SGPTR165.
Curlett, H.B. and Geddes, C.J. 2006. “Leveraging a New Energy Source to Enhance Heavy Oil and Oil Sands Production.” GRC Bulletin, January/February 2006, Vol. 35/No. 1, pp. 3236.
Energy Information Administration (EIA). 2006. U.S. Department of Energy (DOE) Web site http://www.eia.doe.gov/
Lohbeck, W. C. M. 1993. “Method of completing an uncased section of a borehole.” Patent publication date: December 23, 1993.
McKenna, J., D. Blackwell, C. Moyes, and P. D. Patterson. 2005. “Geothermal electric power supply possible from Gulf Coast, Midcontinent oil field waters.” Oil & Gas Journal, Sept. 5, pp. 3440.
Polizzotti, R.S., L.L. Hirsch, A.B. Herhold, and M.D. Ertas. 2003. “Hydrothermal Drilling Method and System.” Patent publication date: July 3, 2003.
Potter, R.M. and J.W. Tester. 1998. “Continuous Drilling of Vertical Boreholes by Thermal Processes: Including Rock Spallation and Fusion.” Patent publication date: June 30, 1998.
Pruess, K. and M. Azaroual. 2006. “On the Feasibility of Using Supercritical CO2 as Heat Transmission Fluid in an Engineered Hot Dry Rock Geothermal System,” Proceedings of the ThirtyFirst Workshop on Geothermal Reservoir Engineering, Stanford University, Stanford, Calif., Jan. 30Feb. 1, 2006.
Sanyal, S. K. and S. J. Butler. 2005. “An Analysis of Power Generation Prospects From Enhanced Geothermal Systems.” Geothermal Resources Council Transactions, 29.
Tester, J.W. and M.C. Smith. 1977. “Energy Extraction Characteristics of Hot Dry Rock Geothermal Systems.” Proceedings of the Twelfth Intersociety Energy Conversion Engineering Conference, Washington, D.C. American Nuclear Society, 1:816.
Tester, J. W., H. D. Murphy, C. O. Grigsby, R. M. Potter, and B.A. Robinson. 1989. “Fractured Geothermal Reservoir Growth Induced by Heat Extraction.” SPE J. Reservoir Engineering, 3:97104.


![Food security and nutrition: building a global narrative ... · EXECUTIVE SUMMARY EXECUTIVE SUMMARY EXECUTIVE SUMMARY EXECUTIVE SUMMAR Y [ 2 ] This document contains the Summary and](https://img.pdfslide.net/doc/110x75/5ff5433612d22125fb06e6b5/food-security-and-nutrition-building-a-global-narrative-executive-summary-executive.jpg)