Embed Size (px)
Citation preview
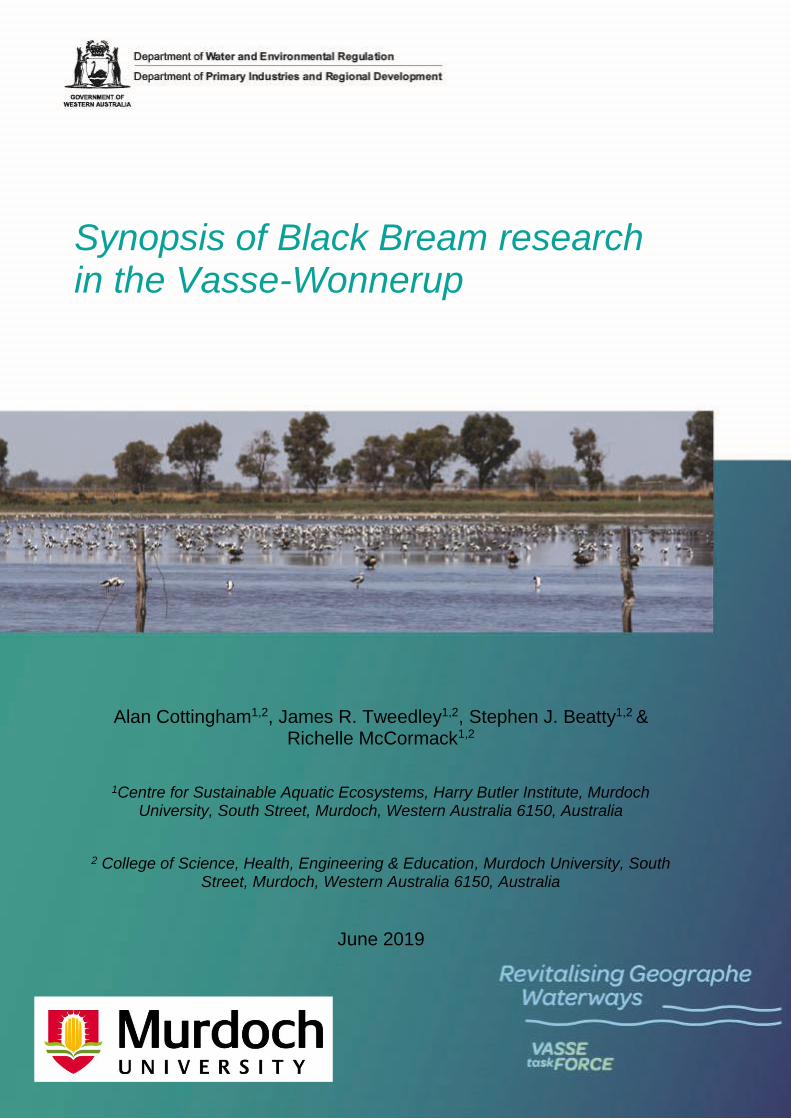
Synopsis of Black Bream research in the Vasse-Wonnerup
Alan Cottingham1,2, James R. Tweedley1,2, Stephen J. Beatty1,2 & Richelle McCormack1,2
1Centre for Sustainable Aquatic Ecosystems, Harry Butler Institute, Murdoch University, South Street, Murdoch, Western Australia 6150, Australia
2 College of Science, Health, Engineering & Education, Murdoch University, South Street, Murdoch, Western Australia 6150, Australia
June 2019
Synopsis of Black Bream in the Vasse-Wonnerup
Department of Water and Environmental Regulation ii
Contents
Acknowledgements ..................................................................................................... 1
Summary ..................................................................... Error! Bookmark not defined.
Introduction .................................................................................................................. 2
Abundance of Black Bream ......................................................................................... 4
Nearshore waters .................................................................................................... 4
Offshore waters ....................................................................................................... 7
Black Bream ................................................................................................... 7
Fish faunal composition .................................................................................. 9
Biology of Black Bream ............................................................................................. 13
Growth rates .......................................................................................................... 13
Body condition ....................................................................................................... 16
Dietary composition ............................................................................................... 17
Reproduction ......................................................................................................... 18
Length and age at maturity .................................................................................... 19
Fishing in the Vasse-Wonnerup ................................................................................. 20
Black Bream as an indicator of estuary health........................................................... 22
Tracking the movements of Black Bream .................................................................. 23
References ................................................................................................................ 25
Appendices ................................................................................................................ 30
Synopsis of Black Bream in the Vasse-Wonnerup
1
Acknowledgements The authors gratefully acknowledge the support given to them throughout this and earlier studies in the Vasse-Wonnerup from James Keleher, Dr Joel Williams and Sian Glazier (Murdoch University), Dr Kath Lynch (Department of Water and Environmental Regulation) and Sally Clifton Parks (Geocatch). Commercial catch and effort data were kindly provided by the Department of Primary Industries and Regional Development, with the permission of the commercial fisher. Financial support for this project was kindly provided by the Department of Water Western Australia, through the Revitalising Geographe Waterways project. This is a State Government initiative to improve water quality, waterway health and management of Geographe Waterways and is overseen by the Vasse Taskforce. The current project utilised data from completed projects on the fish fauna of the Vasse-Wonnerup, which were supported by the Australian Federal Government’s Caring for our Country program together with the Geographe Bay Catchment Council (GeoCatch) and the State Natural Resource Management Office of Western Australia.
Synopsis of Black Bream in the Vasse-Wonnerup
2
Introduction Estuaries are among the most productive of all aquatic ecosystems [1-3] and thus provide valuable nursery areas for the juveniles of many commercially and recreationally
important fish species [4, 5]. Despite their huge ecological significance, estuaries are also among the most degraded of all aquatic ecosystems [6, 7], reflecting the long use of these systems by humans as sources of food and water, shelter and later trade/ transport and industry [8]. As a result of a rapidly increasing human population, the number of estuaries around the world that have become degraded has increased dramatically during recent decades [9, 10]. Recognition of this has led to programs and legislation being implemented into improve the health of some estuaries by reducing pollution and undertaking rehabilitation/restoration activities. These have been most successful in estuaries with large tidal regimes, where any organic (e.g. nutrients) and inorganic (e.g. heavy metals) particles are flushed out of the estuary into the ocean where they are diluted [2, 11, 12].
Estuaries in south-western Australia, however, are microtidal and so have a tidal range of < 2 m, which reduces the ability of tidal water exchange to flush any pollutants and contaminants out of the estuary [13]. This, combined with the Mediterranean climate, results in highly seasonal rainfall and, in some cases, the formation of sand bars at the mouth of the estuary, further reducing their connectivity to the ocean results in many of these estuaries being poorly flushed and thus any deleterious influences being amplified [14-16]. In the Vasse-Wonnerup, human influences have led to a multitude of detrimental effects, including increases in the prevalence of eutrophication, algal blooms, anoxia (lack of oxygen), fish kills, introduced species, undesirable odours, mosquito problems and the death of fringing vegetation [17-19].
Fish kills, in particular, occur regularly in the Vasse-Wonnerup, with reports of such events dating back to 1905, with the causes ranging from low oxygen, high temperatures, macroalgal blooms and toxic phytoplankton both in isolation or combination [17, 20]. A fish kill event in April 2013 caused the mortality of > 30,000 fish, primarily adult Sea Mullet Mugil cephalus, Yelloweye Mullet Aldrichetta forsteri and Black Bream Acanthopagrus butcheri (Kath Lynch, Department of Water and Environmental Regulation, pers. com.). The two mullet species are the target of commercial fishers, while the vast majority of recreational fishers who utilise the Vasse-Wonnerup target Black Bream, which is an iconic recreational fish species in estuaries across southern Australia [8, 21].
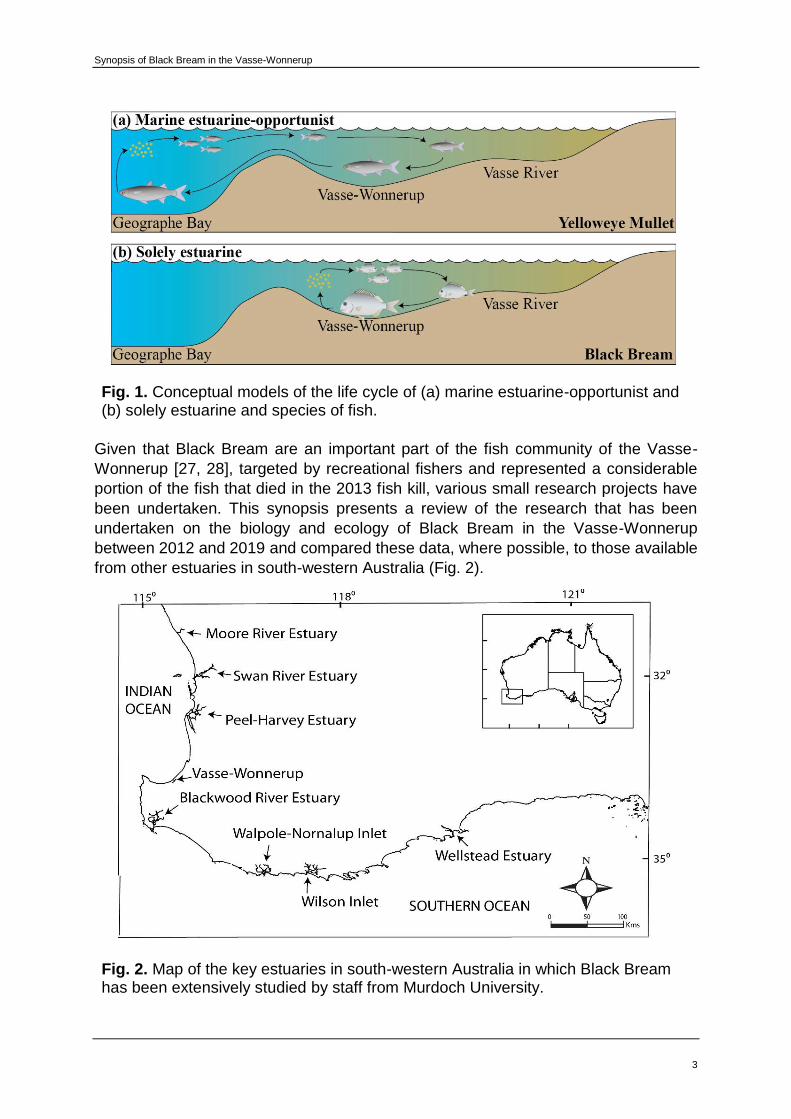
While the Sea and Yelloweye mullets are marine estuarine-opportunists [5, 8], i.e. spawn in the ocean and enter the estuary as juveniles (Fig. 1a), and thus their stocks can be replenished, Black Bream is a solely estuarine species, with individuals completing their life cycle within their natal estuaries (Fig. 1b), which they seldom leave [22]. Not only has this life history strategy resulted in populations of Black Bream in different estuaries being genetically distinct from one another [23], but it also means that if a population in an estuary declines, that population will not be supplemented with individuals from elsewhere. Furthermore, because Black Bream, which can live for up to 30 years, reside in their natal estuary they are subjected throughout life to the environmental condition of that estuary [24]. The biological characteristics, e.g. growth and maturity and spawning time, are considered “plastic” and differ in response to the changes in environmental condition (e.g. climate change and ecosystem health). Thus Black Bream is a particularly good indicator species [22, 25, 26].
Synopsis of Black Bream in the Vasse-Wonnerup
3
Fig. 1. Conceptual models of the life cycle of (a) marine estuarine-opportunist and (b) solely estuarine and species of fish.
Given that Black Bream are an important part of the fish community of the Vasse-
Wonnerup [27, 28], targeted by recreational fishers and represented a considerable
portion of the fish that died in the 2013 fish kill, various small research projects have
been undertaken. This synopsis presents a review of the research that has been
undertaken on the biology and ecology of Black Bream in the Vasse-Wonnerup
between 2012 and 2019 and compared these data, where possible, to those available
from other estuaries in south-western Australia (Fig. 2).
Fig. 2. Map of the key estuaries in south-western Australia in which Black Bream has been extensively studied by staff from Murdoch University.
Synopsis of Black Bream in the Vasse-Wonnerup
4
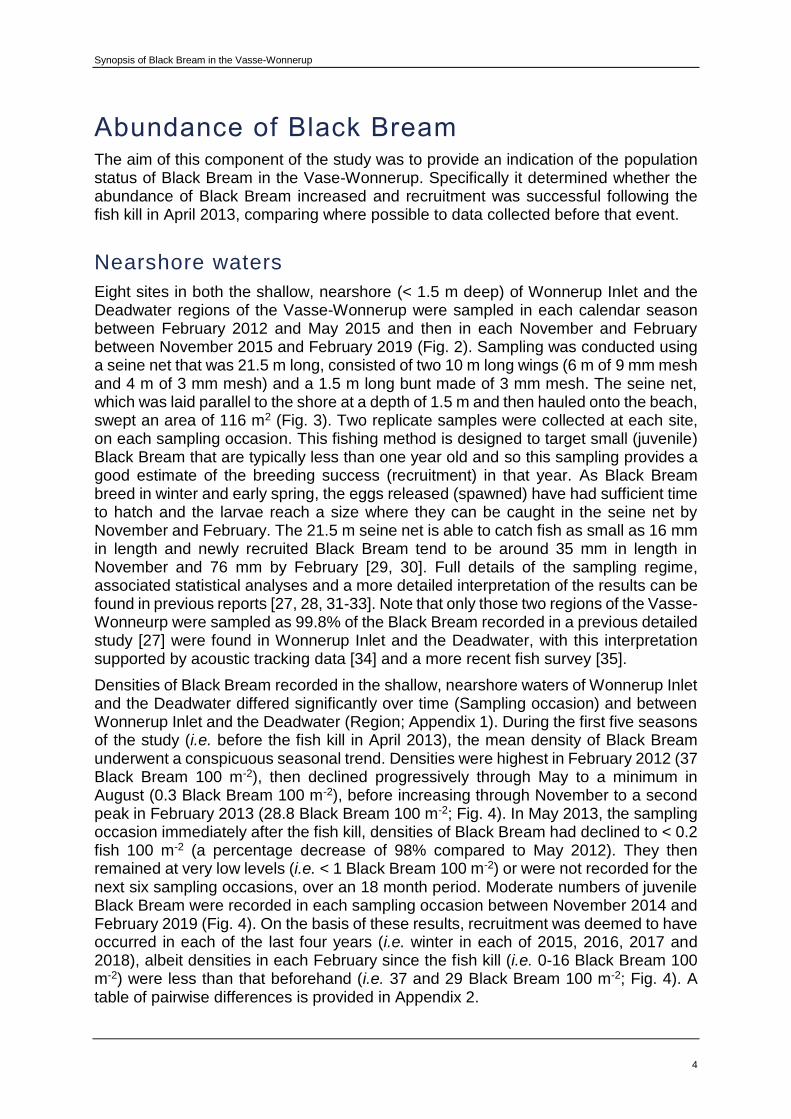
Abundance of Black Bream The aim of this component of the study was to provide an indication of the population status of Black Bream in the Vase-Wonnerup. Specifically it determined whether the abundance of Black Bream increased and recruitment was successful following the fish kill in April 2013, comparing where possible to data collected before that event.
Nearshore waters
Eight sites in both the shallow, nearshore (< 1.5 m deep) of Wonnerup Inlet and the Deadwater regions of the Vasse-Wonnerup were sampled in each calendar season between February 2012 and May 2015 and then in each November and February between November 2015 and February 2019 (Fig. 2). Sampling was conducted using a seine net that was 21.5 m long, consisted of two 10 m long wings (6 m of 9 mm mesh and 4 m of 3 mm mesh) and a 1.5 m long bunt made of 3 mm mesh. The seine net, which was laid parallel to the shore at a depth of 1.5 m and then hauled onto the beach, swept an area of 116 m2 (Fig. 3). Two replicate samples were collected at each site, on each sampling occasion. This fishing method is designed to target small (juvenile) Black Bream that are typically less than one year old and so this sampling provides a good estimate of the breeding success (recruitment) in that year. As Black Bream breed in winter and early spring, the eggs released (spawned) have had sufficient time to hatch and the larvae reach a size where they can be caught in the seine net by November and February. The 21.5 m seine net is able to catch fish as small as 16 mm in length and newly recruited Black Bream tend to be around 35 mm in length in November and 76 mm by February [29, 30]. Full details of the sampling regime, associated statistical analyses and a more detailed interpretation of the results can be found in previous reports [27, 28, 31-33]. Note that only those two regions of the Vasse-Wonneurp were sampled as 99.8% of the Black Bream recorded in a previous detailed study [27] were found in Wonnerup Inlet and the Deadwater, with this interpretation supported by acoustic tracking data [34] and a more recent fish survey [35].
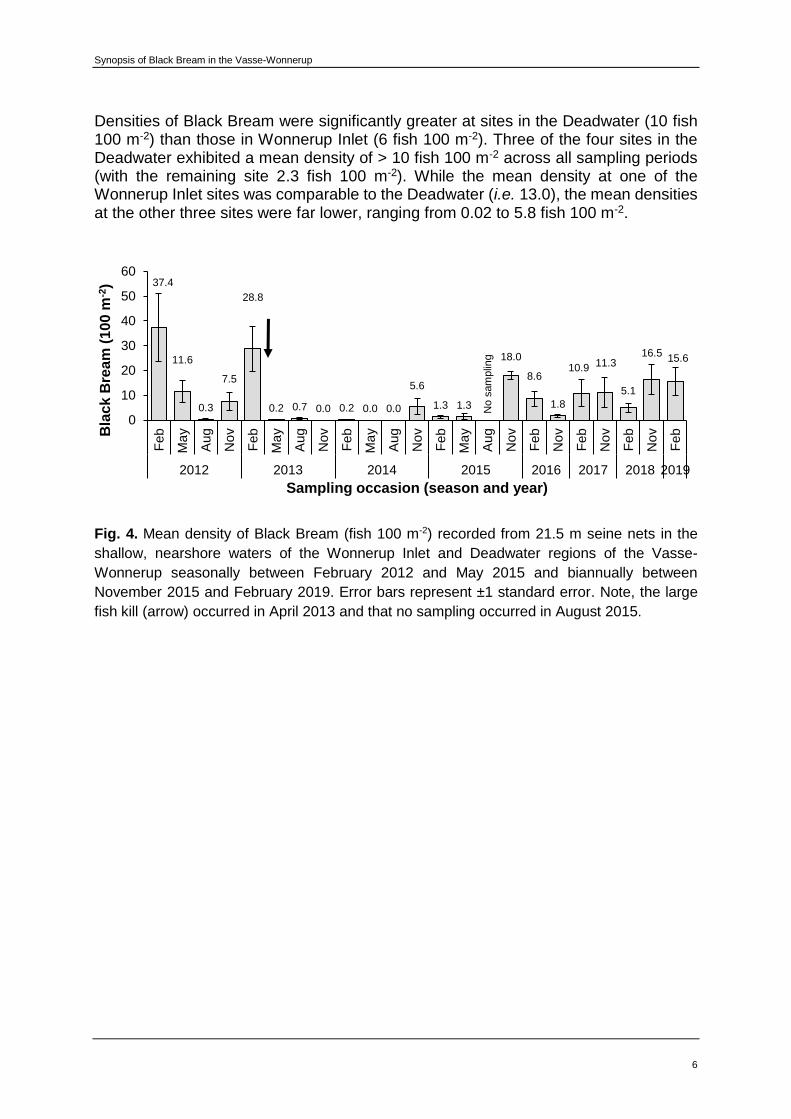
Densities of Black Bream recorded in the shallow, nearshore waters of Wonnerup Inlet and the Deadwater differed significantly over time (Sampling occasion) and between Wonnerup Inlet and the Deadwater (Region; Appendix 1). During the first five seasons of the study (i.e. before the fish kill in April 2013), the mean density of Black Bream underwent a conspicuous seasonal trend. Densities were highest in February 2012 (37 Black Bream 100 m-2), then declined progressively through May to a minimum in August (0.3 Black Bream 100 m-2), before increasing through November to a second peak in February 2013 (28.8 Black Bream 100 m-2; Fig. 4). In May 2013, the sampling occasion immediately after the fish kill, densities of Black Bream had declined to < 0.2 fish 100 m-2 (a percentage decrease of 98% compared to May 2012). They then remained at very low levels (i.e. < 1 Black Bream 100 m-2) or were not recorded for the next six sampling occasions, over an 18 month period. Moderate numbers of juvenile Black Bream were recorded in each sampling occasion between November 2014 and February 2019 (Fig. 4). On the basis of these results, recruitment was deemed to have occurred in each of the last four years (i.e. winter in each of 2015, 2016, 2017 and 2018), albeit densities in each February since the fish kill (i.e. 0-16 Black Bream 100 m-2) were less than that beforehand (i.e. 37 and 29 Black Bream 100 m-2; Fig. 4). A table of pairwise differences is provided in Appendix 2.

Synopsis of Black Bream in the Vasse-Wonnerup
5
Fig. 2. Map showing the location of the eight sites in Wonnerup Inlet and the Deadwater at which fish were sampled in the shallow, nearshore (< 1.5 m) and deeper, offshore waters (> 1.5 m). Insets (top left) show the location of the Vasse-Wonnerup in Western Australia and (top right) the location of Wonnerup Inlet and the Deadwater within the Vasse-Wonnerup.
Fig. 3. Sampling fish in the nearshore waters of the Deadwater using a 21.5 m seine net.
Synopsis of Black Bream in the Vasse-Wonnerup
6
Densities of Black Bream were significantly greater at sites in the Deadwater (10 fish 100 m-2) than those in Wonnerup Inlet (6 fish 100 m-2). Three of the four sites in the Deadwater exhibited a mean density of > 10 fish 100 m-2 across all sampling periods (with the remaining site 2.3 fish 100 m-2). While the mean density at one of the Wonnerup Inlet sites was comparable to the Deadwater (i.e. 13.0), the mean densities at the other three sites were far lower, ranging from 0.02 to 5.8 fish 100 m-2.
Fig. 4. Mean density of Black Bream (fish 100 m-2) recorded from 21.5 m seine nets in the
shallow, nearshore waters of the Wonnerup Inlet and Deadwater regions of the Vasse-
Wonnerup seasonally between February 2012 and May 2015 and biannually between
November 2015 and February 2019. Error bars represent ±1 standard error. Note, the large
fish kill (arrow) occurred in April 2013 and that no sampling occurred in August 2015.
37.4
11.6
0.3
7.5
28.8
0.2 0.7 0.0 0.2 0.0 0.0
5.6
1.3 1.3
18.0
8.6
1.8
10.9 11.3
5.1
16.515.6
0
10
20
30
40
50
60
Feb
Ma
y
Aug
No
v
Feb
Ma
y
Aug
No
v
Feb
Ma
y
Aug
No
v
Feb
Ma
y
Aug
No
v
Feb
No
v
Feb
No
v
Feb
No
v
Feb
2012 2013 2014 2015 2016 2017 2018 2019
Bla
ck
Bre
am
(1
00
m-2
)
Sampling occasion (season and year)N
o s
am
plin
g

Synopsis of Black Bream in the Vasse-Wonnerup
7
Offshore waters
Black Bream
Sites in the adjacent and deeper offshore waters were sampled using a sunken
composite multifilament gill nets (i.e. same method was used by commercial fishers
only with a wider range of meshes, some of which are smaller). It comprised eight 20 m
long panels, each with a height of 2 m and containing a different stretched mesh size,
i.e. 35, 51, 63, 76, 89, 102, 115 or 127 mm. Gill nets were set for one hour, to minimise
any fish deaths and allow the release of fish alive to the water [36]. All fish were
identified to species, counted and measured to the nearest 1 mm before being
released. Unfortunately sampling was only conducted in response to the fish kill and
so no data are available from which to estimate the population prior to the event.
Sampling started in August 2013 and occurred concurrently with that in nearshore
waters in each season until February 2019.
Fig. 5. Sampling using a gill net to catch and release fish in deeper, offshore waters.
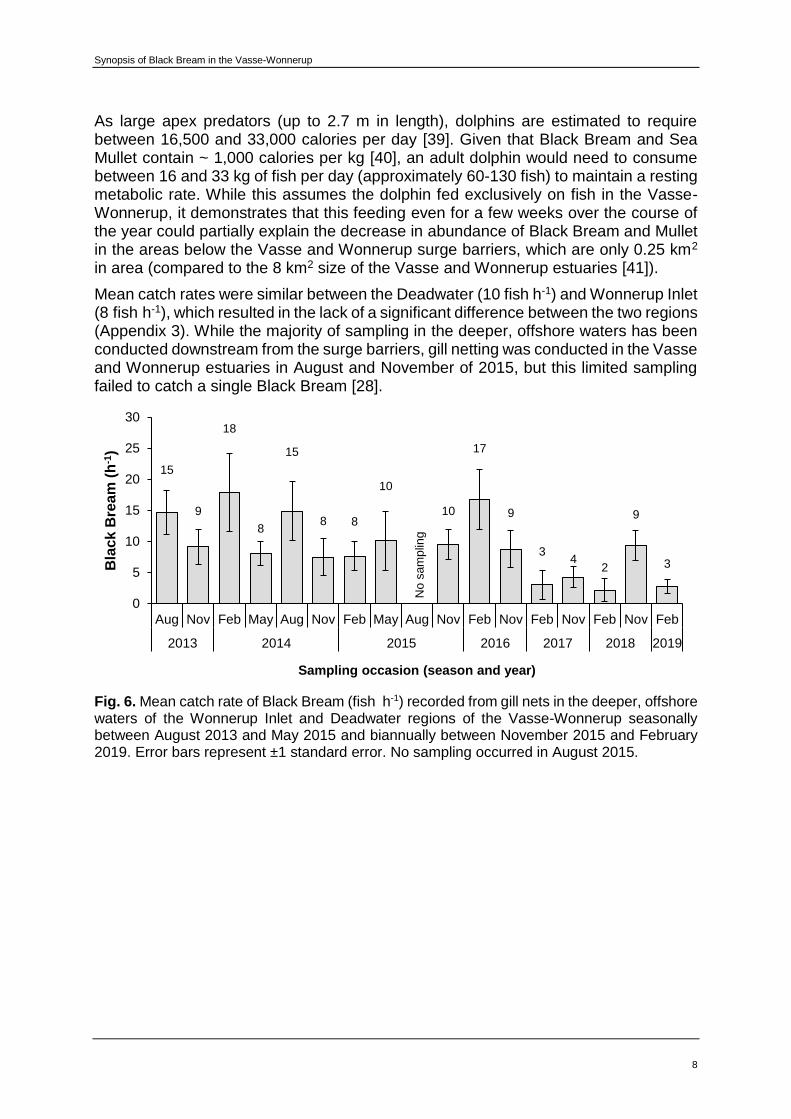
Catch rates of larger (adult) Black Bream in offshore waters of Wonnerup Inlet and the Deadwater regions of the Vasse-Wonnerup were shown to be different among the sampling occasions, but similar between Wonnerup Inlet and the Deadwater (Appendix 3). In the 11 sampling events between August 2013 and November 2016, catch rates were fairly stable ranging from 8 to 18 Black Bream h-1, which is amongst the highest catch rates in an estuary in south-western Australia and more than in the nearby Toby Inlet [37, 38].
Significantly lower catches were recorded in February 2017, 2018 and 2019 and November 2017, i.e. never exceeding 4 Black Bream h-1 (Fig. 6). In addition to the low catches recorded between February 2017 and February 2018, there was also a decrease in the mean length of the fish from 232-243 mm to 220 mm total length. This also coincided with a decrease in the abundance of other dominant fish species in Wonnerup Inlet and the Deadwater (e.g. Sea and Yelloweye Mullet – see below). As Black Bream complete their lifecycle in the estuary, it is thought that the decline in abundance of Black Bream could be due, in part, to the presence of an Indo-Pacific Bottlenose Dolphin (Tursiops aduncus). A single dolphin was sighted by staff from Murdoch University and separately by those from the Department of Water and Environmental Regulation in February of both 2017 and 2018.
Synopsis of Black Bream in the Vasse-Wonnerup
8
As large apex predators (up to 2.7 m in length), dolphins are estimated to require between 16,500 and 33,000 calories per day [39]. Given that Black Bream and Sea Mullet contain ~ 1,000 calories per kg [40], an adult dolphin would need to consume between 16 and 33 kg of fish per day (approximately 60-130 fish) to maintain a resting metabolic rate. While this assumes the dolphin fed exclusively on fish in the Vasse-Wonnerup, it demonstrates that this feeding even for a few weeks over the course of the year could partially explain the decrease in abundance of Black Bream and Mullet in the areas below the Vasse and Wonnerup surge barriers, which are only 0.25 km2 in area (compared to the 8 km2 size of the Vasse and Wonnerup estuaries [41]).
Mean catch rates were similar between the Deadwater (10 fish h-1) and Wonnerup Inlet (8 fish h-1), which resulted in the lack of a significant difference between the two regions (Appendix 3). While the majority of sampling in the deeper, offshore waters has been conducted downstream from the surge barriers, gill netting was conducted in the Vasse and Wonnerup estuaries in August and November of 2015, but this limited sampling failed to catch a single Black Bream [28].
Fig. 6. Mean catch rate of Black Bream (fish h-1) recorded from gill nets in the deeper, offshore waters of the Wonnerup Inlet and Deadwater regions of the Vasse-Wonnerup seasonally between August 2013 and May 2015 and biannually between November 2015 and February 2019. Error bars represent ±1 standard error. No sampling occurred in August 2015.
15
9
18
8
15
8 8
10
10
17
9
34
2
9
3
0
5
10
15
20
25
30
Aug Nov Feb May Aug Nov Feb May Aug Nov Feb Nov Feb Nov Feb Nov Feb
2013 2014 2015 2016 2017 2018 2019
Bla
ck
Bre
am
(h
-1)
Sampling occasion (season and year)
No s
am
plin
g
Synopsis of Black Bream in the Vasse-Wonnerup
9
Fish faunal composition
A total of 6,788 fish from 20 species were caught and released from the deeper, offshore waters of the Vasse-Wonnerup (Table 2). Among these the three most abundant were the Sea Mullet (33%), Yelloweye Mullet (17%) and Black Bream (17%), with the combined abundance of these species representing almost 70% of all fish recorded. Sixteen of the 20 species (80%) are marine estuarine-opportunists, i.e. species that breed in the ocean, but whose juveniles migrate into estuaries and use them as a nursery area. The only abundant species that do not have this lifestyle were the Black Bream and Yellowtail Grunter, both of which complete their lifecycle within estuaries [42, 43]. While a wide range of species were caught below the surge barriers (i.e. 17 and 19 in the Deadwater and Wonnerup Inlet, respectively), only two and one species were found in the Vasse and Wonnerup estuaries, respectively, above the barriers (Table 2). This reflects the fact that species must swim through the surge barrier and the shallow and fresher waters upstream [28]. It should, however, be noted far fewer samples were collected from these shallow regions. Catch rates were also far lower below the surge barriers (i.e. ~50 above and ~15 below; Table 2).
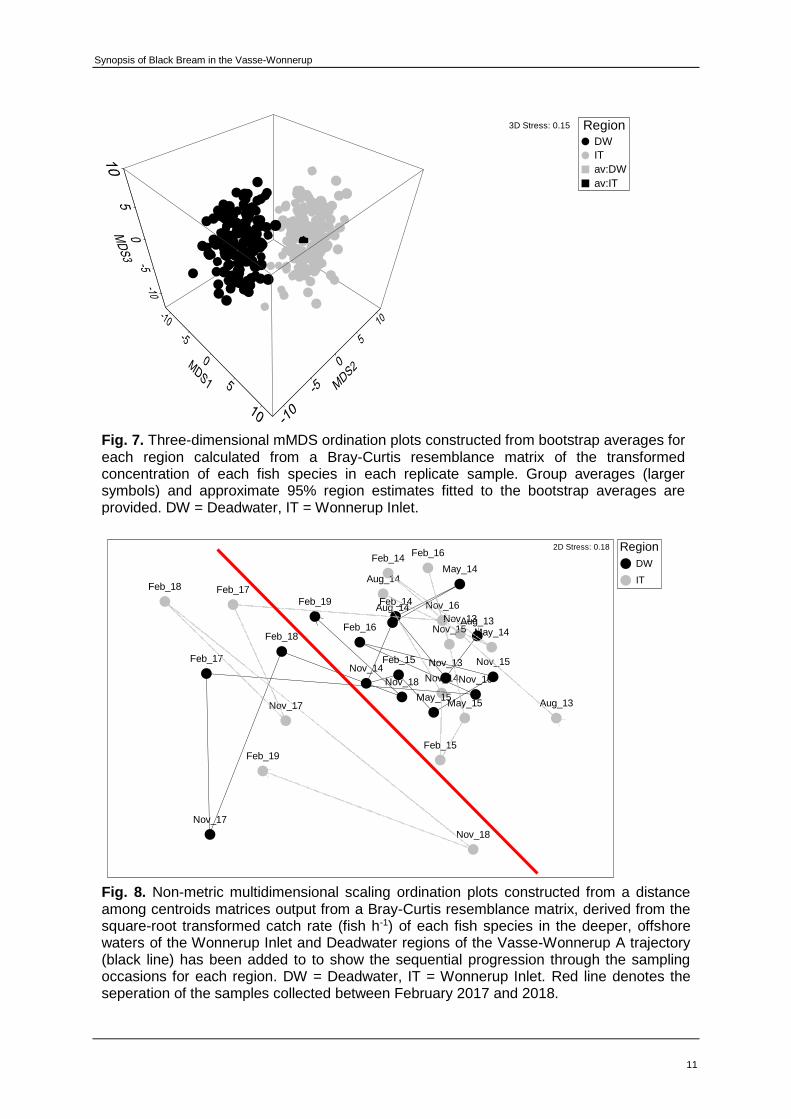
When the catches in the regions downstream of the surge barriers were analysed statistically, the fish community differed significantly both spatially (between regions) and over time (among sampling occasions) and their also being an interaction between these effects (Appendix 5). The graph in Fig. 7 shows the fish community, where the two colours of dots (each representing a different region) are separated and do not overlap, indicating they contained different suites of fish. Species such as Sea Mullet, Yelloweye Mullet, Common Silver Biddy (Roach) and Yellowtail Grunter were more abundant in Wonnerup Inlet, whereas Black Bream, Tarwhine (a species in the same family as Black Bream) and Western Striped Grunter were caught in larger numbers in the Deadwater.
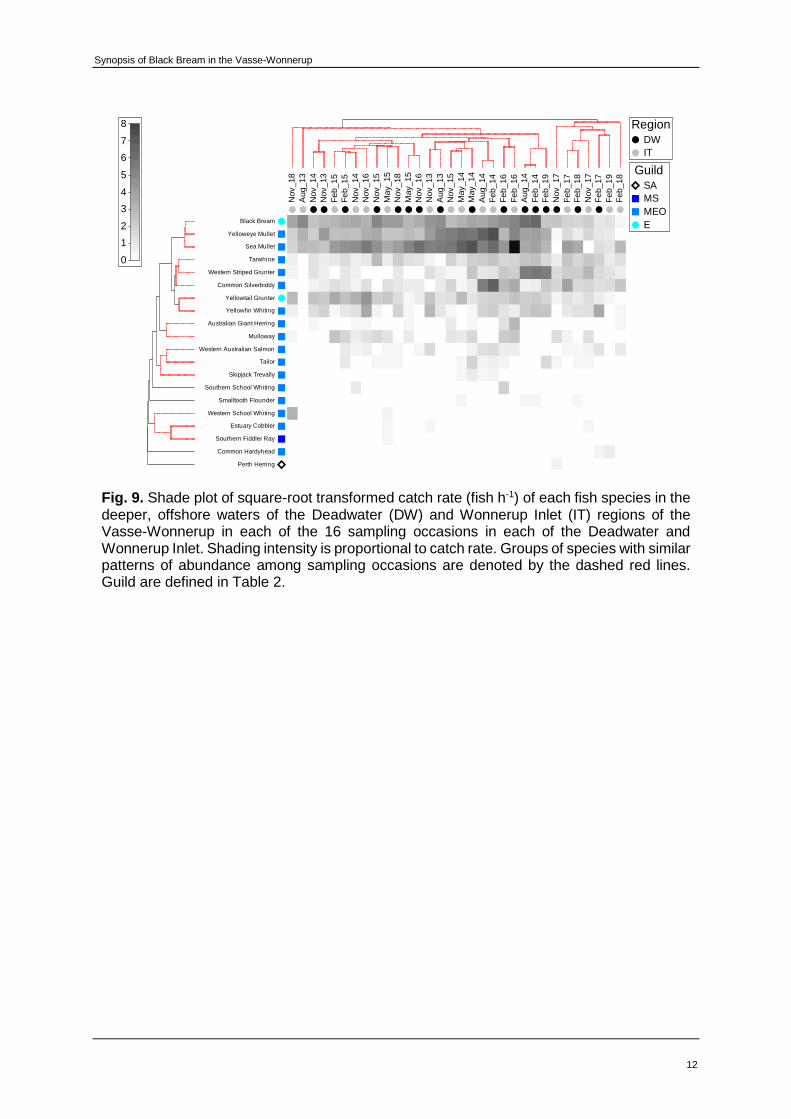
There were also so large differences in the fish community over time. On the MDS plot in Fig. 8 each of the points represents the data for a region (symbol) particular sampling occasion (text). The closer together any two points are the more similar their fish fauna are and vice versa. On this plot, there is group of points, namely February 2017, 2018 and November 2017 in the Deadwater and these three seasons and also February 2019 in Wonnerup Inlet, that are located on the left side of the MDS plot and well away from the rest of the samples, indicating they had a very different fish fauna (see also Appendix 6). The shade plot shows the abundance of each species in each season and region with darker shadings meanings that species had a greater abundance [44]. In the case of those seasons from around February 2017 to February 2018, the abundance of Sea Mullet, Yelloweye Mullet and Black Bream all declined substantially (Fig. 9). As these species are, by far, the most abundant fishes in the deeper, offshore waters (Table 2), but also have differing lifecycles [45, 46] it seems likely that their decrease is not linked to recruitment either from Geographe Bay for the mullets or juveniles in the Vasse-Wonnerup for Black Bream (see also Fig. 4). Furthermore, as, based on their lifecycle, Black Bream are unlikely to leave the estuary and that these three species are amongst the most common and largest fish in the offshore waters and so would be easy to find and represent a good quantity of calories per fish, they would have been a suitable target for predation by the dolphin. It is thus relevant that following the sighting of the dolphin, the mean size of fish decreased, perhaps as the larger ones were preferentially being eaten and they would provide more calories.

Synopsis of Black Bream in the Vasse-Wonnerup
10
Table 2. The total number of individuals caught (# Fish) and percentage contribution (%C) of each species caught in the offshore waters of the Vasse-Wonneurp seasonally between August 2013 and May 2015 and biannually between November 2015 and February 2019. The mean catch rate per hour (Avg), standard deviation (SD) and %C are provided for the Deadwater, Wonnerup Inlet and the Vasse and Wonnerup estuaries. The family and life cycle guild (LC) to which each species belongs is provided and those species that contributed ≥ 5% of the total catch in each season are shaded in grey. Data for Black Bream are highlighted in bold and the colour gradient for #Fish and %C shows the most (green) to least (red) abundant fish species.
Total Deadwater Wonnerup Inlet Vasse Estuary Wonnerup Estuary
Common name Species Guild # Fish %C x
Avg SD % x
Avg SD % x
Avg SD % x
Avg SD %
Sea Mullet Mugil cephalus MEO 2,256 33.24 13.80 18.78 29.20 17.70 23.66 32.20 12.88 27.18 95.37 17.13 18.64 100.00 Yelloweye Mullet Aldrichetta forsteri MEO 1,174 17.30 7.02 6.72 14.85 11.25 18.89 20.46 0.63 1.06 4.63 Black Bream Acanthopagrus butcheri E 1,170 17.24 10.28 11.26 21.76 8.00 8.70 14.55 Common Silverbiddy Gerres subfasciatus MEO 457 6.73 1.44 2.49 3.04 5.70 12.82 10.37 Yellowtail Grunter Amniataba caudavittata E 434 6.39 2.20 3.02 4.66 4.58 7.29 8.33 Western Striped Grunter Pelates octolineatus MEO 432 6.36 5.44 10.93 11.51 1.31 2.85 2.39 Tarwhine Rhabdosargus sarba MEO 307 4.52 2.81 4.26 5.95 1.98 2.88 3.61 Yellowfin Whiting Sillago schomburgkii MEO 245 3.61 2.20 4.16 4.66 1.63 3.14 2.96 Mulloway Argyrosomus japonicus MEO 106 1.56 0.80 1.80 1.69 0.86 1.54 1.56 Western Australian Salmon Arripis truttaceus MEO 57 0.84 0.28 0.88 0.60 0.61 1.39 1.11 Australian Giant Herring Elops machnata MEO 47 0.69 0.17 0.90 0.36 0.56 2.49 1.02 Tailor Pomatomus saltatrix MEO 34 0.50 0.41 0.97 0.86 0.13 0.49 0.23 Western School Whiting Sillago vittata MEO 25 0.37 0.39 1.48 0.71 Southern School Whiting Sillago bassensis MEO 21 0.31 0.25 1.41 0.53 0.08 0.63 0.14 Skipjack Trevally Pseudocaranx wrighti MEO 7 0.10 0.05 0.28 0.10 0.06 0.30 0.11 Common Hardyhead Atherinomorus vaigiensis MEO 6 0.09 0.03 0.25 0.07 0.06 0.50 0.11 Smalltooth Flounder Pseudorhombus jenynsii MEO 4 0.06 0.05 0.21 0.10 0.02 0.13 0.03 Estuary Cobbler Cnidoglanis macrocephalus MEO 3 0.04 0.05 0.21 0.09 Perth Herring Nematalosa vlaminghi SA 2 0.03 0.03 0.25 0.07 Southern Fiddler Ray Trygonorrhina dumerilii MS 1 0.01 0.02 0.13 0.03
Number of species 20 17 19 2 1
Total catch 6,788 47.25 54.98 13.50 17.13 Number of samples 144 64 64 8 8
Guild. Marine straggler (MS) guild, i.e. species that spawn at sea and typically enter estuaries sporadically and in low numbers and are most common in the lower reaches, where salinities typically do not decline far below ~35. Marine estuarine-opportunist (MEO) guild, i.e. species that spawn at sea and regularly enter estuaries in substantial numbers, particularly as juveniles, but can also use coastal marine waters (e.g. Geographe Bay) as alternative nursery areas. Solely estuarine (E) guild, i.e. species typically found only in estuaries. Semi-anadromous (SA) guild, i.e. species that migrate between the sea and fresh water but the spawning run from the sea extends only as far as the upper estuary rather than into fresh water [5, 8].
Synopsis of Black Bream in the Vasse-Wonnerup
11
Fig. 7. Three-dimensional mMDS ordination plots constructed from bootstrap averages for each region calculated from a Bray-Curtis resemblance matrix of the transformed concentration of each fish species in each replicate sample. Group averages (larger symbols) and approximate 95% region estimates fitted to the bootstrap averages are provided. DW = Deadwater, IT = Wonnerup Inlet.
Fig. 8. Non-metric multidimensional scaling ordination plots constructed from a distance among centroids matrices output from a Bray-Curtis resemblance matrix, derived from the square-root transformed catch rate (fish h-1) of each fish species in the deeper, offshore waters of the Wonnerup Inlet and Deadwater regions of the Vasse-Wonnerup A trajectory (black line) has been added to to show the sequential progression through the sampling occasions for each region. DW = Deadwater, IT = Wonnerup Inlet. Red line denotes the seperation of the samples collected between February 2017 and 2018.
RegionDW
IT
av:DW
av:IT
3D Stress: 0.15
RegionDW
IT
av:DW
av:IT
3D Stress: 0.15
Region
DW
IT
Aug_13
Aug_13
Nov_13
Nov_13
Feb_14
Feb_14May_14
May_14
Aug_14
Aug_14
Nov_14Nov_14
Feb_15
Feb_15
May_15May_15
Nov_15
Nov_15Feb_16
Feb_16
Nov_16
Nov_16
Feb_17
Feb_17
Nov_17
Nov_17
Feb_18
Feb_18
Nov_18
Nov_18
Feb_19
Feb_19
2D Stress: 0.18
Synopsis of Black Bream in the Vasse-Wonnerup
12
Fig. 9. Shade plot of square-root transformed catch rate (fish h-1) of each fish species in the deeper, offshore waters of the Deadwater (DW) and Wonnerup Inlet (IT) regions of the Vasse-Wonnerup in each of the 16 sampling occasions in each of the Deadwater and Wonnerup Inlet. Shading intensity is proportional to catch rate. Groups of species with similar patterns of abundance among sampling occasions are denoted by the dashed red lines. Guild are defined in Table 2.
Nov_18
Aug_13
Nov_14
Nov_13
Feb_15
Feb_15
Nov_14
Nov_16
Nov_15
May_15
Nov_18
May_15
Nov_16
Nov_13
Aug_13
Nov_15
May_14
May_14
Aug_14
Feb_14
Feb_16
Feb_16
Aug_14
Feb_14
Feb_19
Nov_17
Feb_17
Feb_18
Nov_17
Feb_17
Feb_19
Feb_18
Perth Herring
Common Hardyhead
Southern Fiddler Ray
Estuary Cobbler
Western School Whiting
Smalltooth Flounder
Southern School Whiting
Skipjack Trevally
Tailor
Western Australian Salmon
Mulloway
Australian Giant Herring
Yellowfin Whiting
Yellowtail Grunter
Common Silverbiddy
Western Striped Grunter
Tarwhine
Sea Mullet
Yelloweye Mullet
Black Bream
0
1
2
3
4
5
6
7
8 RegionDW
IT
GuildSA
MS
MEO
E
Synopsis of Black Bream in the Vasse-Wonnerup
13
Biology of Black Bream
Growth rates
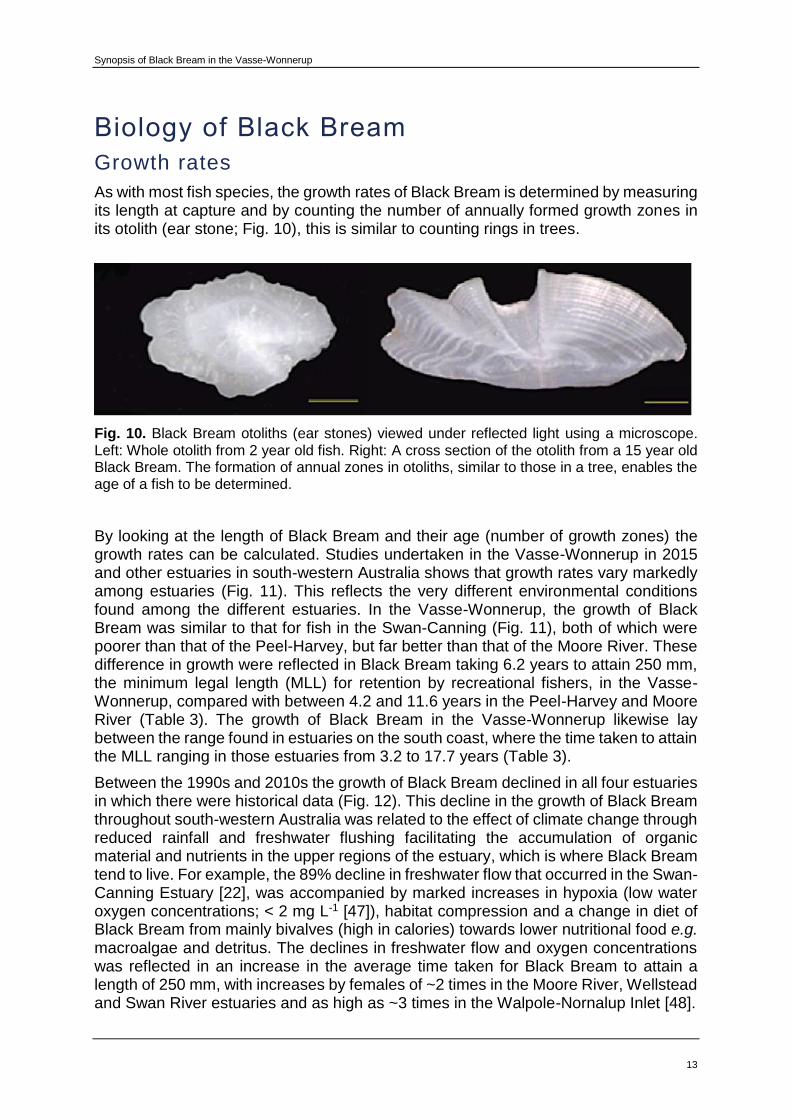
As with most fish species, the growth rates of Black Bream is determined by measuring its length at capture and by counting the number of annually formed growth zones in its otolith (ear stone; Fig. 10), this is similar to counting rings in trees.
Fig. 10. Black Bream otoliths (ear stones) viewed under reflected light using a microscope. Left: Whole otolith from 2 year old fish. Right: A cross section of the otolith from a 15 year old Black Bream. The formation of annual zones in otoliths, similar to those in a tree, enables the age of a fish to be determined.
By looking at the length of Black Bream and their age (number of growth zones) the growth rates can be calculated. Studies undertaken in the Vasse-Wonnerup in 2015 and other estuaries in south-western Australia shows that growth rates vary markedly among estuaries (Fig. 11). This reflects the very different environmental conditions found among the different estuaries. In the Vasse-Wonnerup, the growth of Black Bream was similar to that for fish in the Swan-Canning (Fig. 11), both of which were poorer than that of the Peel-Harvey, but far better than that of the Moore River. These difference in growth were reflected in Black Bream taking 6.2 years to attain 250 mm, the minimum legal length (MLL) for retention by recreational fishers, in the Vasse-Wonnerup, compared with between 4.2 and 11.6 years in the Peel-Harvey and Moore River (Table 3). The growth of Black Bream in the Vasse-Wonnerup likewise lay between the range found in estuaries on the south coast, where the time taken to attain the MLL ranging in those estuaries from 3.2 to 17.7 years (Table 3).
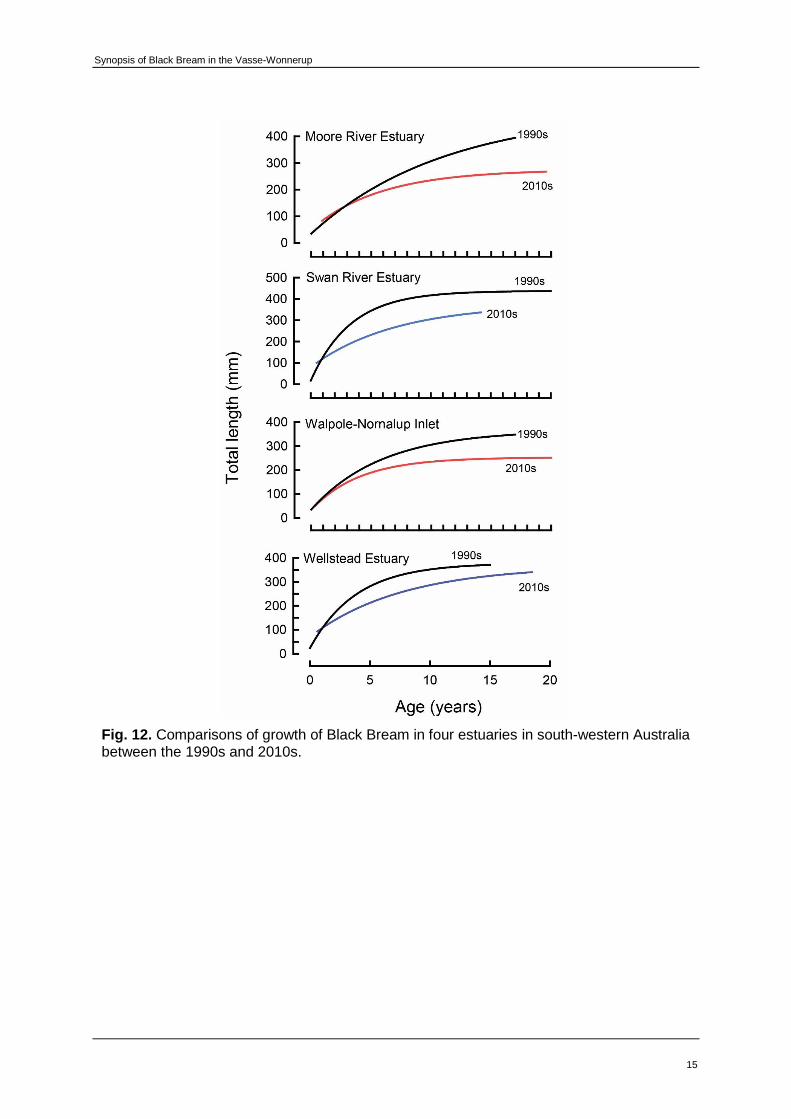
Between the 1990s and 2010s the growth of Black Bream declined in all four estuaries in which there were historical data (Fig. 12). This decline in the growth of Black Bream throughout south-western Australia was related to the effect of climate change through reduced rainfall and freshwater flushing facilitating the accumulation of organic material and nutrients in the upper regions of the estuary, which is where Black Bream tend to live. For example, the 89% decline in freshwater flow that occurred in the Swan-Canning Estuary [22], was accompanied by marked increases in hypoxia (low water oxygen concentrations; < 2 mg L-1 [47]), habitat compression and a change in diet of Black Bream from mainly bivalves (high in calories) towards lower nutritional food e.g. macroalgae and detritus. The declines in freshwater flow and oxygen concentrations was reflected in an increase in the average time taken for Black Bream to attain a length of 250 mm, with increases by females of ~2 times in the Moore River, Wellstead and Swan River estuaries and as high as ~3 times in the Walpole-Nornalup Inlet [48].

Synopsis of Black Bream in the Vasse-Wonnerup
14
Table 3. Age of Black Bream at 250 mm in length (the minimum legal size for retention of this species by recreational and commercial fishers) in south-western Australian estuaries in the 1990s and 2010s. Data for the Vasse-Wonnerup shaded in grey.
West coast estuaries
2010s Age (years) at 250 mm
1990s Age (years) at 250 mm
Moore River 11.6 7.0 Swan-Canning 6.1 2.8 Peel-Harvey 4.2 No data Vasse-Wonnerup 6.2 No data
South coast estuaries
Blackwood River 3.2 No data Walpole-Nornalup 17.7 6.2 Wellstead 7.1 3.9
Fig. 11. Growth curves fitted to lengths-at-age of Black Bream in the Vasse-Wonnerup (top), comparisons of the growth of Black Bream in the Vasse-Wonnerup with three other estuaries on the west coast of south-western Australia (middle) and the growth of Black Bream in four estuaries on the south coast of south-western Australia (bottom).
Synopsis of Black Bream in the Vasse-Wonnerup
15
Fig. 12. Comparisons of growth of Black Bream in four estuaries in south-western Australia between the 1990s and 2010s.
Synopsis of Black Bream in the Vasse-Wonnerup
16
Body condition
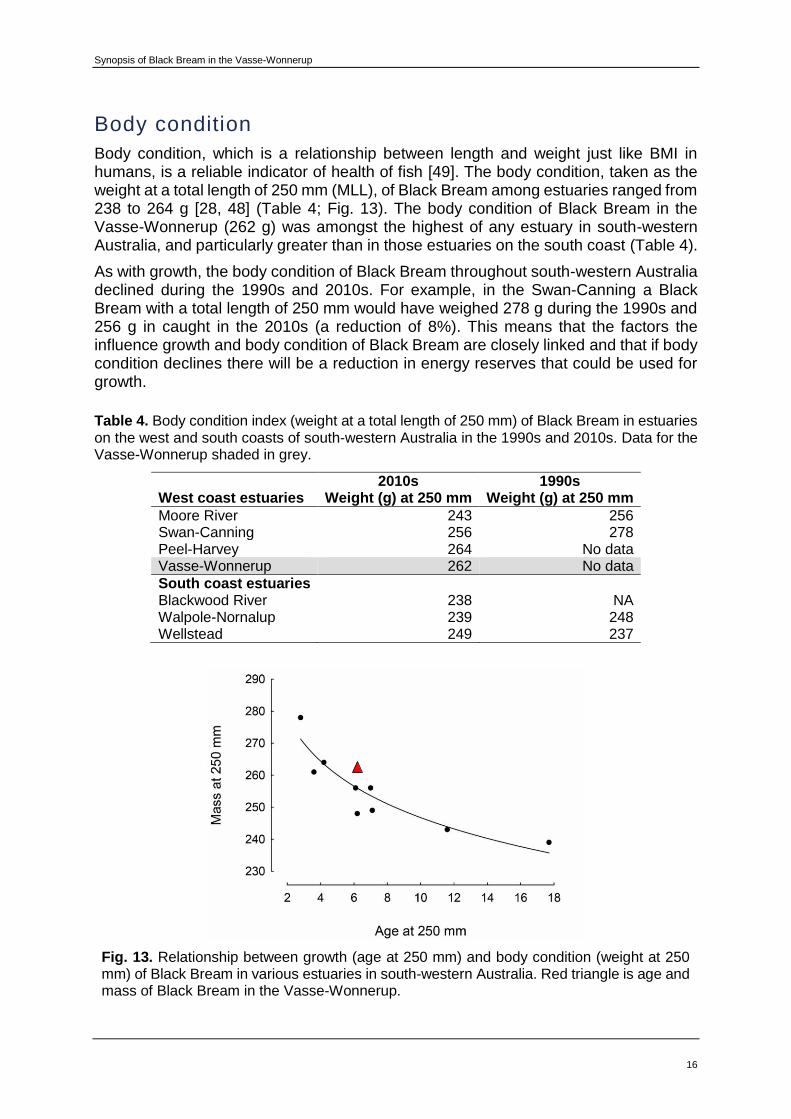
Body condition, which is a relationship between length and weight just like BMI in humans, is a reliable indicator of health of fish [49]. The body condition, taken as the weight at a total length of 250 mm (MLL), of Black Bream among estuaries ranged from 238 to 264 g [28, 48] (Table 4; Fig. 13). The body condition of Black Bream in the Vasse-Wonnerup (262 g) was amongst the highest of any estuary in south-western Australia, and particularly greater than in those estuaries on the south coast (Table 4).
As with growth, the body condition of Black Bream throughout south-western Australia declined during the 1990s and 2010s. For example, in the Swan-Canning a Black Bream with a total length of 250 mm would have weighed 278 g during the 1990s and 256 g in caught in the 2010s (a reduction of 8%). This means that the factors the influence growth and body condition of Black Bream are closely linked and that if body condition declines there will be a reduction in energy reserves that could be used for growth.
Table 4. Body condition index (weight at a total length of 250 mm) of Black Bream in estuaries on the west and south coasts of south-western Australia in the 1990s and 2010s. Data for the Vasse-Wonnerup shaded in grey.
West coast estuaries
2010s Weight (g) at 250 mm
1990s Weight (g) at 250 mm
Moore River 243 256 Swan-Canning 256 278 Peel-Harvey 264 No data Vasse-Wonnerup 262 No data
South coast estuaries Blackwood River 238 NA Walpole-Nornalup 239 248 Wellstead 249 237
Fig. 13. Relationship between growth (age at 250 mm) and body condition (weight at 250 mm) of Black Bream in various estuaries in south-western Australia. Red triangle is age and mass of Black Bream in the Vasse-Wonnerup.
Synopsis of Black Bream in the Vasse-Wonnerup
17
Dietary composition
Black Bream are an omnivorous species predating on a wide range of prey from macroalgae through to small fish [50-52]. Their diet can vary, for example, during the 1990s Black Bream fed mainly on bivalve molluscs in the Swan-Canning, but consumed large volumes of the macroalgae in the Moore River. This presumably reflects differences in the relative abundances of food sources in those estuaries [50, 51]. Major differences in the dietary composition of Black Bream in a range of estuaries [50-52] could also help explain the variations in growth [53, 54].
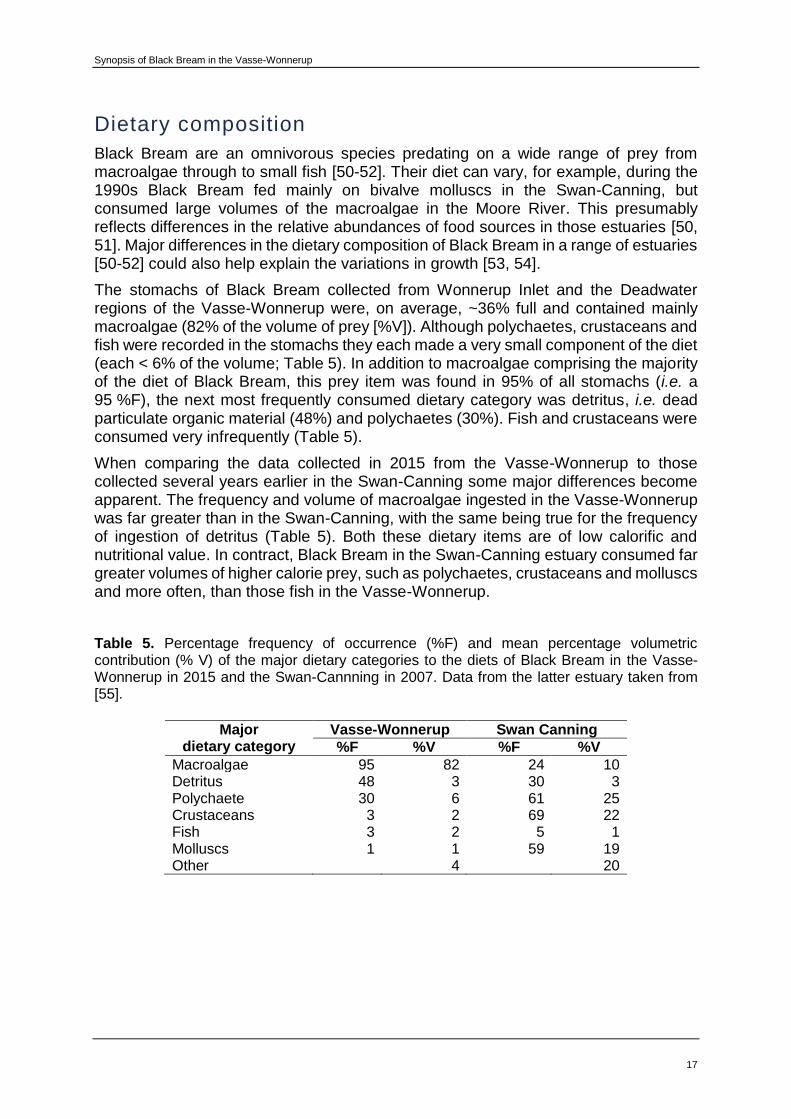
The stomachs of Black Bream collected from Wonnerup Inlet and the Deadwater regions of the Vasse-Wonnerup were, on average, ~36% full and contained mainly macroalgae (82% of the volume of prey [%V]). Although polychaetes, crustaceans and fish were recorded in the stomachs they each made a very small component of the diet (each < 6% of the volume; Table 5). In addition to macroalgae comprising the majority of the diet of Black Bream, this prey item was found in 95% of all stomachs (i.e. a 95 %F), the next most frequently consumed dietary category was detritus, i.e. dead particulate organic material (48%) and polychaetes (30%). Fish and crustaceans were consumed very infrequently (Table 5).
When comparing the data collected in 2015 from the Vasse-Wonnerup to those collected several years earlier in the Swan-Canning some major differences become apparent. The frequency and volume of macroalgae ingested in the Vasse-Wonnerup was far greater than in the Swan-Canning, with the same being true for the frequency of ingestion of detritus (Table 5). Both these dietary items are of low calorific and nutritional value. In contract, Black Bream in the Swan-Canning estuary consumed far greater volumes of higher calorie prey, such as polychaetes, crustaceans and molluscs and more often, than those fish in the Vasse-Wonnerup.
Table 5. Percentage frequency of occurrence (%F) and mean percentage volumetric contribution (% V) of the major dietary categories to the diets of Black Bream in the Vasse-Wonnerup in 2015 and the Swan-Cannning in 2007. Data from the latter estuary taken from [55].
Major
dietary category Vasse-Wonnerup Swan Canning
%F %V %F %V
Macroalgae 95 82 24 10 Detritus 48 3 30 3 Polychaete 30 6 61 25 Crustaceans 3 2 69 22 Fish 3 2 5 1 Molluscs 1 1 59 19 Other 4 20
Synopsis of Black Bream in the Vasse-Wonnerup
18
Reproduction
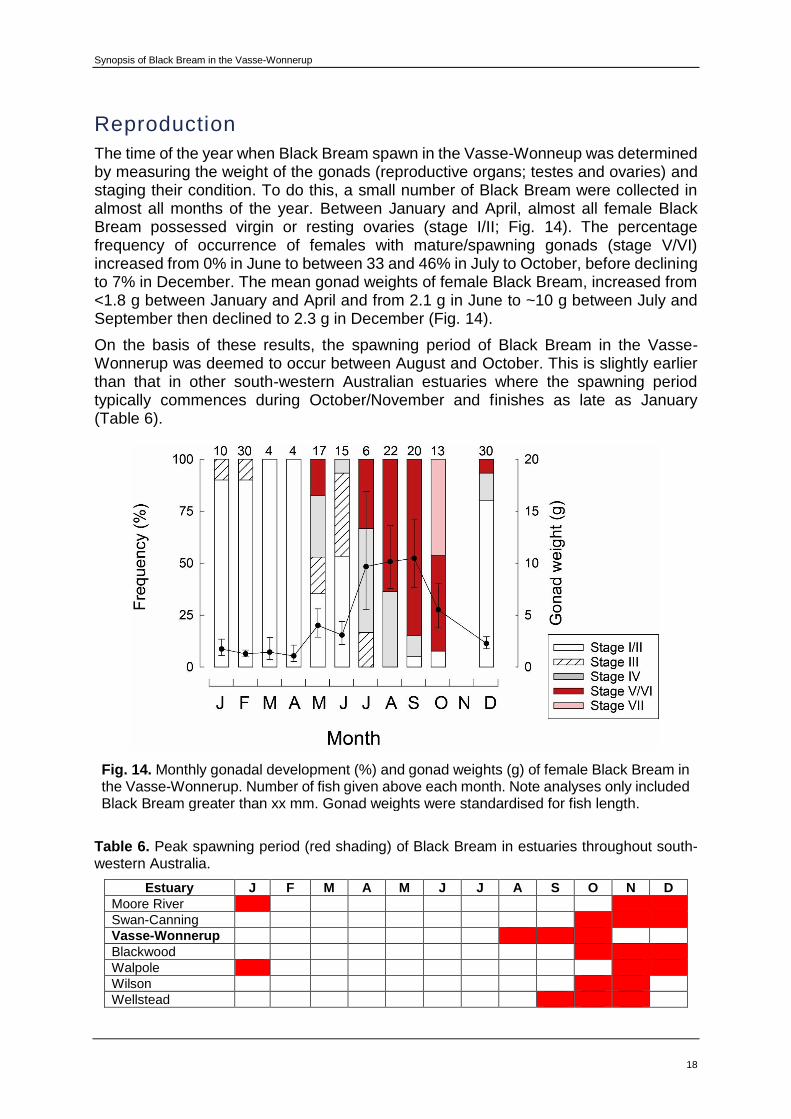
The time of the year when Black Bream spawn in the Vasse-Wonneup was determined by measuring the weight of the gonads (reproductive organs; testes and ovaries) and staging their condition. To do this, a small number of Black Bream were collected in almost all months of the year. Between January and April, almost all female Black Bream possessed virgin or resting ovaries (stage I/II; Fig. 14). The percentage frequency of occurrence of females with mature/spawning gonads (stage V/VI) increased from 0% in June to between 33 and 46% in July to October, before declining to 7% in December. The mean gonad weights of female Black Bream, increased from <1.8 g between January and April and from 2.1 g in June to ~10 g between July and September then declined to 2.3 g in December (Fig. 14).
On the basis of these results, the spawning period of Black Bream in the Vasse-Wonnerup was deemed to occur between August and October. This is slightly earlier than that in other south-western Australian estuaries where the spawning period typically commences during October/November and finishes as late as January (Table 6).
Fig. 14. Monthly gonadal development (%) and gonad weights (g) of female Black Bream in the Vasse-Wonnerup. Number of fish given above each month. Note analyses only included Black Bream greater than xx mm. Gonad weights were standardised for fish length.
Table 6. Peak spawning period (red shading) of Black Bream in estuaries throughout south-western Australia.
Estuary J F M A M J J A S O N D
Moore River
Swan-Canning
Vasse-Wonnerup
Blackwood
Walpole
Wilson
Wellstead
Synopsis of Black Bream in the Vasse-Wonnerup
19
Length and age at maturity
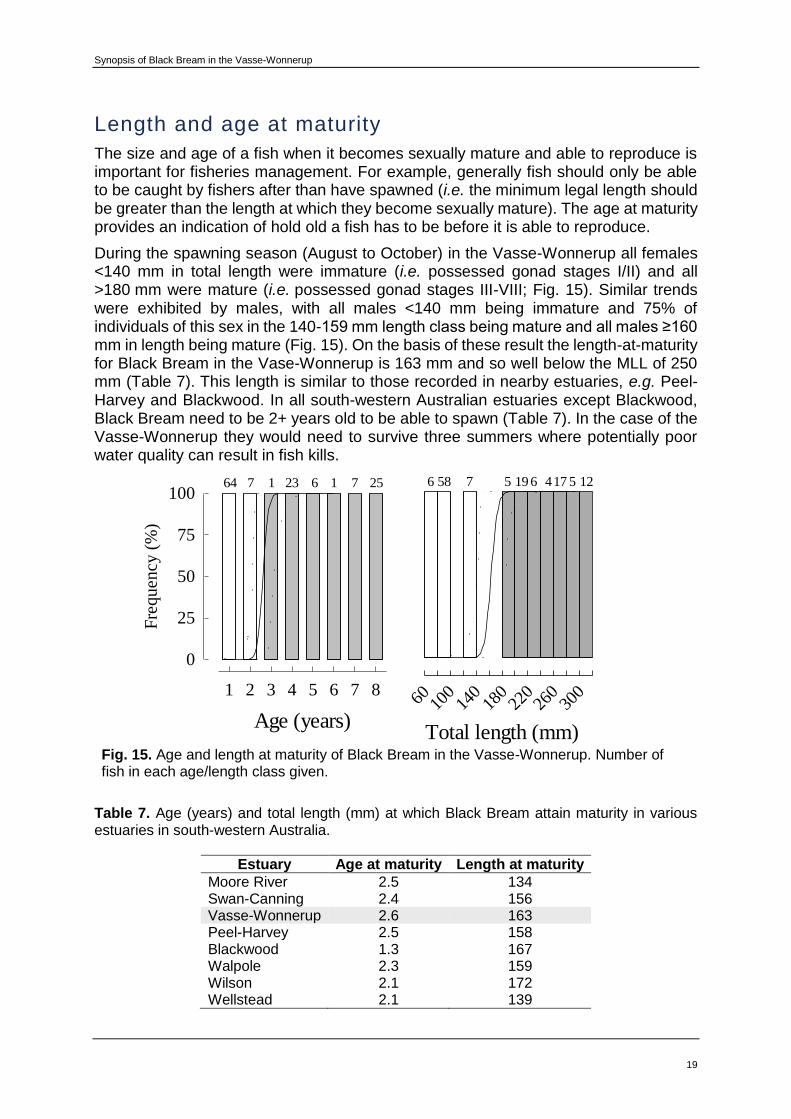
The size and age of a fish when it becomes sexually mature and able to reproduce is important for fisheries management. For example, generally fish should only be able to be caught by fishers after than have spawned (i.e. the minimum legal length should be greater than the length at which they become sexually mature). The age at maturity provides an indication of hold old a fish has to be before it is able to reproduce.
During the spawning season (August to October) in the Vasse-Wonnerup all females <140 mm in total length were immature (i.e. possessed gonad stages I/II) and all >180 mm were mature (i.e. possessed gonad stages III-VIII; Fig. 15). Similar trends were exhibited by males, with all males <140 mm being immature and 75% of individuals of this sex in the 140-159 mm length class being mature and all males ≥160 mm in length being mature (Fig. 15). On the basis of these result the length-at-maturity for Black Bream in the Vase-Wonnerup is 163 mm and so well below the MLL of 250 mm (Table 7). This length is similar to those recorded in nearby estuaries, e.g. Peel-Harvey and Blackwood. In all south-western Australian estuaries except Blackwood, Black Bream need to be 2+ years old to be able to spawn (Table 7). In the case of the Vasse-Wonnerup they would need to survive three summers where potentially poor water quality can result in fish kills.
6 58 7 5 19 6 4 12517
60 220
100
140
180
300
260
Age (years)
1 2 3 4 5 6 7 8
Fre
qu
en
cy
(%
)
0
25
50
75
10064 7 1 6 1
Total length (mm)
23 7 25
Fig. 15. Age and length at maturity of Black Bream in the Vasse-Wonnerup. Number of fish in each age/length class given.
Table 7. Age (years) and total length (mm) at which Black Bream attain maturity in various estuaries in south-western Australia.
Estuary Age at maturity Length at maturity
Moore River 2.5 134 Swan-Canning 2.4 156 Vasse-Wonnerup 2.6 163 Peel-Harvey 2.5 158 Blackwood 1.3 167 Walpole 2.3 159 Wilson 2.1 172 Wellstead 2.1 139
Synopsis of Black Bream in the Vasse-Wonnerup
20
Fishing in the Vasse-Wonnerup Fish in the Vasse-Wonnerup are utilized by both commercial and recreational fishers. However, unlike in many estuaries, the two sectors are spatially separated. Recreational fishers tend to fish from boats and kayaks in the Deadwater and Wonnerup Inlet and near to the surge barriers and Layman Road Bridge and target Black Bream and King George and Yellowfin Whiting. In contrast, commercial fishers are only able to operate on the upstream side of the surge barriers. In an interview in 2000, one of the commercial operators stated that most fishing effort occurs in the Vasse Estuary and that he used to fish much further up the estuary including up to the old butter factory, but shifted effort further downstream [56]. In the Wonnerup Estuary this fisher only set nets in the bottom 500 m due to the presence of wire fences.
The Vasse-Wonnerup was first opened commercial fishing between August and October in 1960 to help reduce the magnitude of fish kills by allowing fishers to harvest those fish that would otherwise die over summer during fish kills [17]. By 1965, following objection from recreational fishers, Wonnerup Inlet and the Deadwater were then closed to commercial fishers, but the Vasse and Wonnerup estuaries were declared open all year. By 2007 there were five active commercial licenses in the Vasse-Wonnerup with only two or three of those actively fishing [41]. Commercial fishers target Sea Mullet and Yelloweye Mullet to reduce competition with recreational fishers, with much of the catch sold as bait for crayfish and pet food [17, 41].
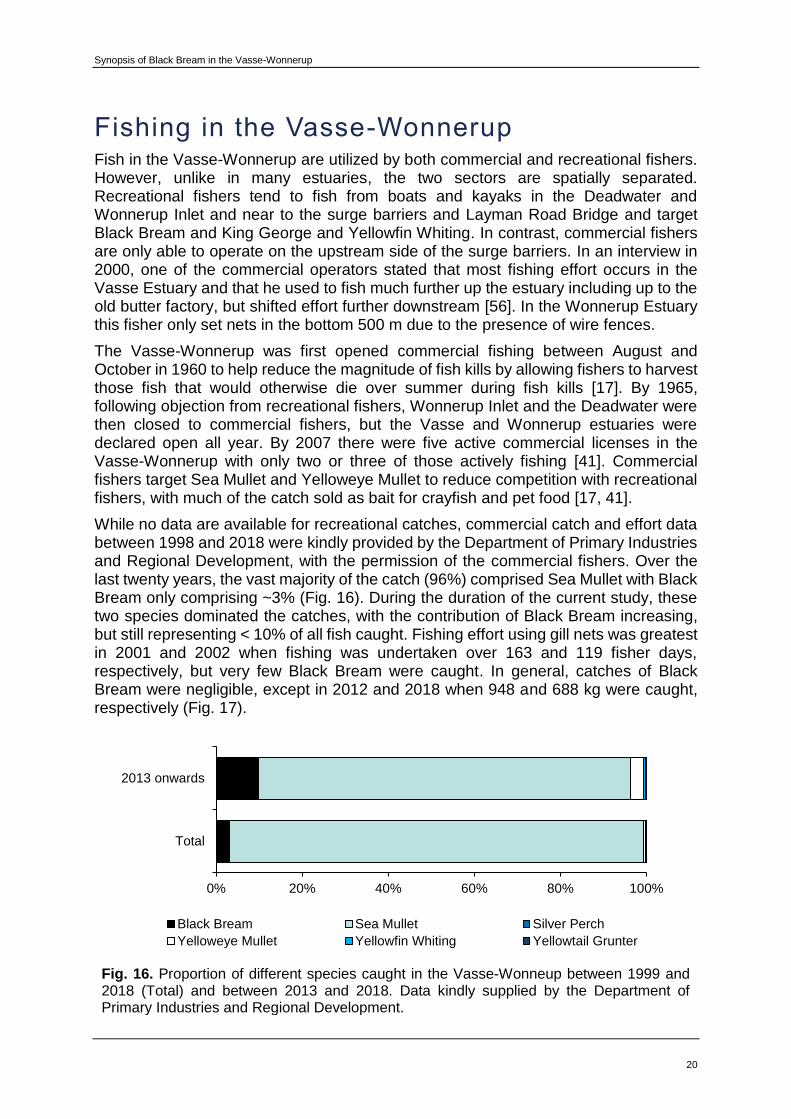
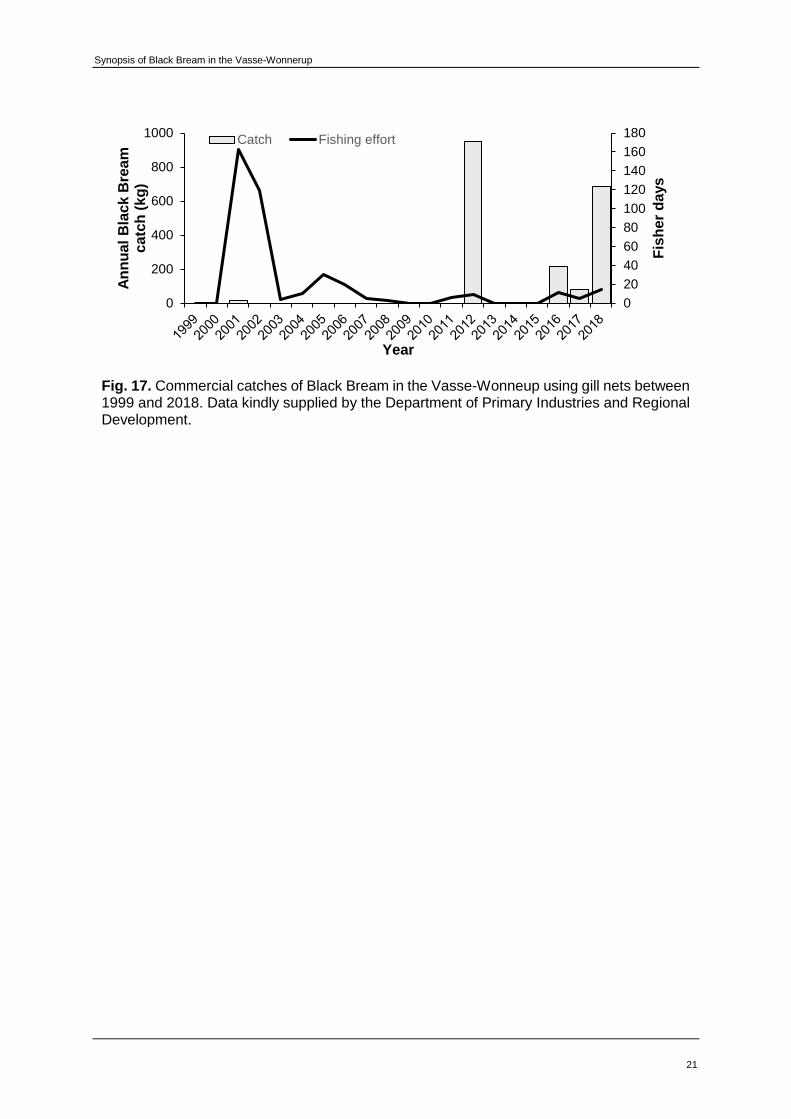
While no data are available for recreational catches, commercial catch and effort data between 1998 and 2018 were kindly provided by the Department of Primary Industries and Regional Development, with the permission of the commercial fishers. Over the last twenty years, the vast majority of the catch (96%) comprised Sea Mullet with Black Bream only comprising ~3% (Fig. 16). During the duration of the current study, these two species dominated the catches, with the contribution of Black Bream increasing, but still representing < 10% of all fish caught. Fishing effort using gill nets was greatest in 2001 and 2002 when fishing was undertaken over 163 and 119 fisher days, respectively, but very few Black Bream were caught. In general, catches of Black Bream were negligible, except in 2012 and 2018 when 948 and 688 kg were caught, respectively (Fig. 17).
Fig. 16. Proportion of different species caught in the Vasse-Wonneup between 1999 and 2018 (Total) and between 2013 and 2018. Data kindly supplied by the Department of Primary Industries and Regional Development.
0% 20% 40% 60% 80% 100%
Total
2013 onwards
Black Bream Sea Mullet Silver Perch
Yelloweye Mullet Yellowfin Whiting Yellowtail Grunter
Synopsis of Black Bream in the Vasse-Wonnerup
21
Fig. 17. Commercial catches of Black Bream in the Vasse-Wonneup using gill nets between 1999 and 2018. Data kindly supplied by the Department of Primary Industries and Regional Development.
0
20
40
60
80
100
120
140
160
180
0
200
400
600
800
1000
Fis
her
days
An
nu
al
Bla
ck
Bre
am
c
atc
h (
kg
)
Year
Catch Fishing effort
Synopsis of Black Bream in the Vasse-Wonnerup
22
Black Bream as an indicator of estuary health As Black Bream remain in the estuary in which they were born for their entire life and have highly “plastic” biological characteristics they are an ideal indicator species of the health of these systems. Monitoring changes in growth, body condition and age at maturity can provide important implicit information on the environmental conditions of an estuary and also the nutrition value/availability of prey, which are typically available in a ‘healthy’ ecological functioning system. However, the assessment of growth and age at maturity require the removal of otoliths (the ear stones that are used for ageing purposes) and thus the mortality of the animal, which may be counterproductive in populations whose abundances have been reduced, due to, for example fish kills.
In contrast, body condition indices, such as the mass of a fish at a reference length, requires data on only mass (weight) and length and thus can be undertaken with minimal stress on the fish. While the factor(s) regulating the growth and body condition of Black Bream have also been shown to be closely linked and that any tendency for body condition to decline will be accompanied by a reduction in energy reserves that could be used for growth [48]. Thus, tracking changes in body condition of Black Bream is an effective and non-lethal approach to detecting changes in the environment of an estuary.
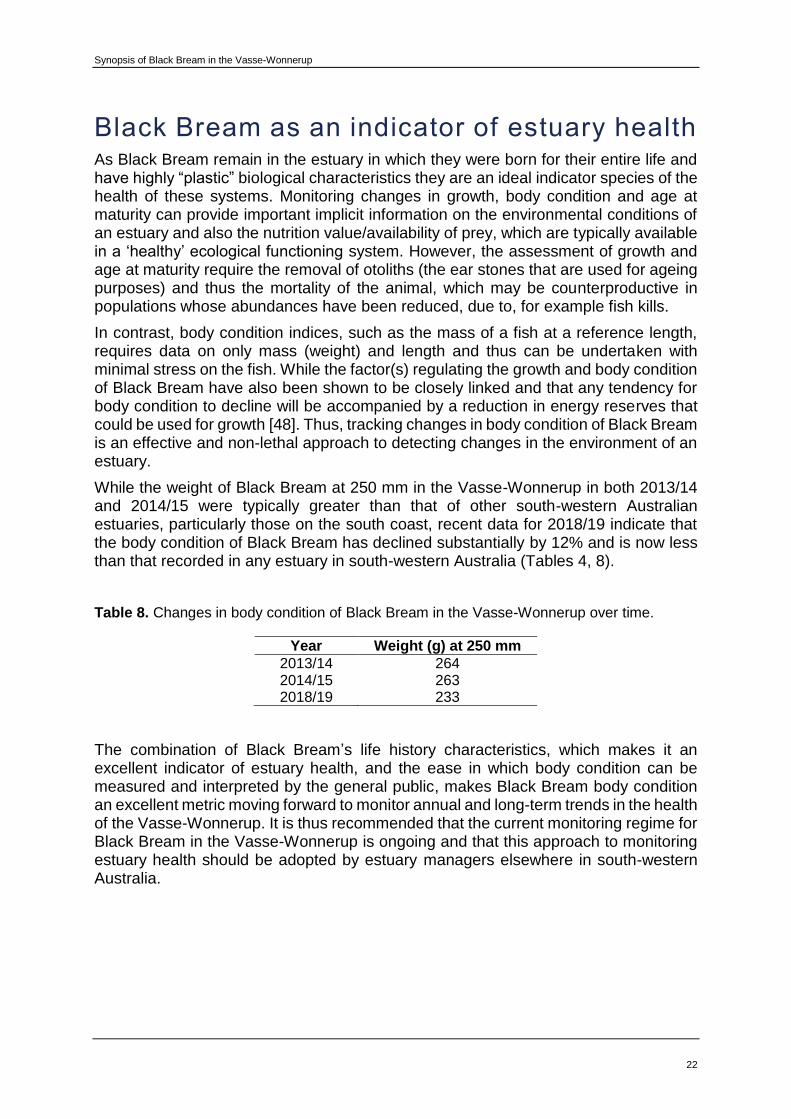
While the weight of Black Bream at 250 mm in the Vasse-Wonnerup in both 2013/14 and 2014/15 were typically greater than that of other south-western Australian estuaries, particularly those on the south coast, recent data for 2018/19 indicate that the body condition of Black Bream has declined substantially by 12% and is now less than that recorded in any estuary in south-western Australia (Tables 4, 8).
Table 8. Changes in body condition of Black Bream in the Vasse-Wonnerup over time.
Year Weight (g) at 250 mm
2013/14 264 2014/15 263 2018/19 233
The combination of Black Bream’s life history characteristics, which makes it an excellent indicator of estuary health, and the ease in which body condition can be measured and interpreted by the general public, makes Black Bream body condition an excellent metric moving forward to monitor annual and long-term trends in the health of the Vasse-Wonnerup. It is thus recommended that the current monitoring regime for Black Bream in the Vasse-Wonnerup is ongoing and that this approach to monitoring estuary health should be adopted by estuary managers elsewhere in south-western Australia.
Synopsis of Black Bream in the Vasse-Wonnerup
23
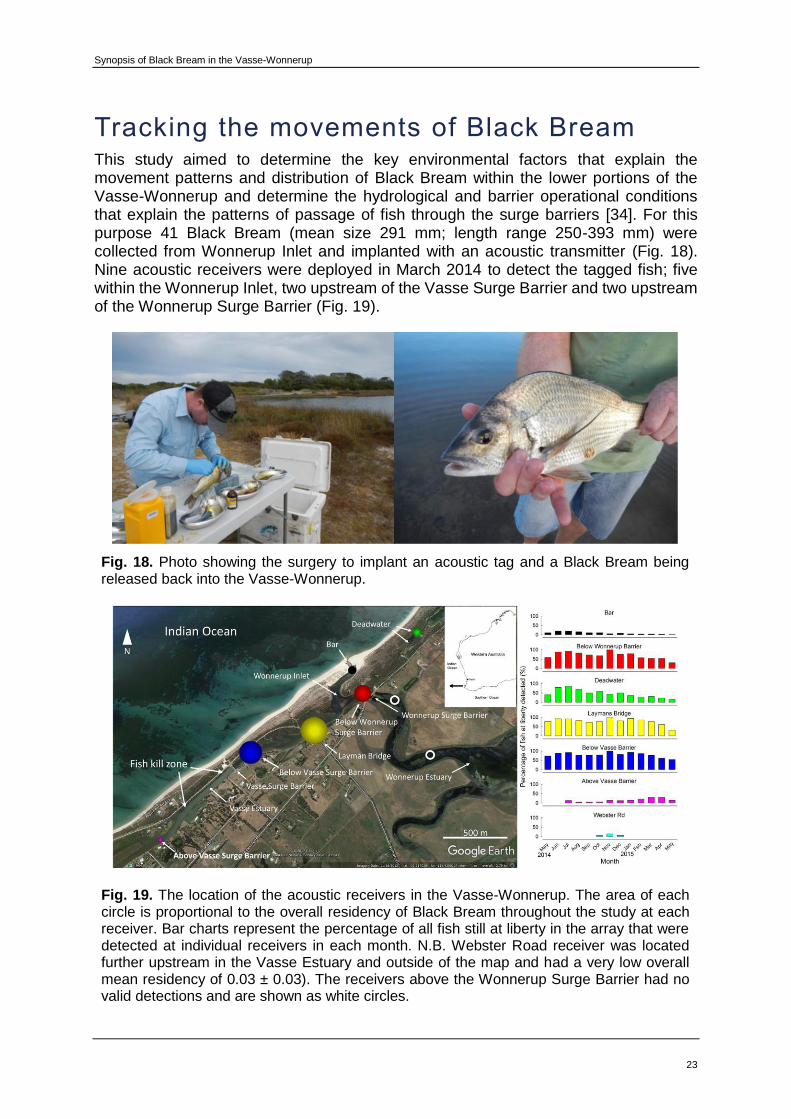
Tracking the movements of Black Bream This study aimed to determine the key environmental factors that explain the movement patterns and distribution of Black Bream within the lower portions of the Vasse-Wonnerup and determine the hydrological and barrier operational conditions that explain the patterns of passage of fish through the surge barriers [34]. For this purpose 41 Black Bream (mean size 291 mm; length range 250-393 mm) were collected from Wonnerup Inlet and implanted with an acoustic transmitter (Fig. 18). Nine acoustic receivers were deployed in March 2014 to detect the tagged fish; five within the Wonnerup Inlet, two upstream of the Vasse Surge Barrier and two upstream of the Wonnerup Surge Barrier (Fig. 19).
Fig. 18. Photo showing the surgery to implant an acoustic tag and a Black Bream being released back into the Vasse-Wonnerup.
Fig. 19. The location of the acoustic receivers in the Vasse-Wonnerup. The area of each circle is proportional to the overall residency of Black Bream throughout the study at each receiver. Bar charts represent the percentage of all fish still at liberty in the array that were detected at individual receivers in each month. N.B. Webster Road receiver was located further upstream in the Vasse Estuary and outside of the map and had a very low overall mean residency of 0.03 ± 0.03). The receivers above the Wonnerup Surge Barrier had no valid detections and are shown as white circles.

Synopsis of Black Bream in the Vasse-Wonnerup
24
Over the course of the study (May 2014 to May 2015), > 2.3 million tag detections were received. The most frequented areas of the estuary by Black Bream were Layman Road Bridge and the Vasse Surge Barrier, which are deeper sites in close proximity to complex structure and that remain relatively salty during the spawning period. The least used areas were Webster Road and immediately upstream of the Vasse Surge Barrier (Fig. 18). Not a single detection was recorded at either of the acoustic receivers upstream of the Wonnerup Surge Barrier. This could be due to the fact that, during the study, the height of the fish gate opening on the Wonnerup surge barrier was much less that the Vasse surge barrier for the duration of the study. This may have enabled passage for the shallow-bodied mullets that occur upstream in the Wonnerup estuary (Fig. 9), but not the deeper-bodied Black Bream (see body shapes in Fig. 1).
On average, Black Bream moved 2.7 km per day, with one fish swimming as far as 45
km in 24 hours in November 2015. The distance travelled by fish changed throughout
the year, being greatest between August to September and, to a lesser extent, in late
October to November, with these times of the year coinciding with the greatest volumes
of freshwater flow from rivers.
Only seven of the 41 Black Bream were detected at one or both of the acoustic receivers upstream of the Vasse Surge Barrier throughout the study, suggesting they moved through the barrier. Two of these fish travelled during a period of high freshwater discharge in early July 2014 when the surge barriers were forced opened by downstream water flow. Four did so during the period when the slot boards were in place and the fish gate was operational (i.e. swam through the fish gate). Moreover, each passed through the gate at a time when the water level was higher on the downstream side of the surge barrier. Only one of the fish that moved upstream from Wonnerup Inlet into the Vasse Estuary returned, with the others possibly ‘trapped’ on the upstream side during summer and autumn; a period of the year when fish kills can occur in that region. Thus it was recommended that a passive integrated transponder (PIT) tagging study be done to determine what fish gate operations and water conditions allowed Black Bream to travel downstream through the gate.
The fine-scale movement patterns of PIT tagged Black Bream were monitored through the Vasse Surge Barrier between March 2017 and May 2018. This study showed that Black Bream were able to move downstream from the Vasse Estuary into Wonnerup Inlet. Hourly upstream and downstream passages through the fish gate were nocturnal (night time) and crepuscular (dawn and dusk), respectively. Downstream passages were also associated with declines in dissolved oxygen concentrations on the upstream side of the surge barrier (Vasse Exit Channel); suggesting that Black Bream were seeking to escape poor water quality. However, the hourly and daily upstream and downstream passages of fish were also strongly associated with times of minimal flow velocity within the fish gate that occurred when water levels were equal on both sides of the barrier. Therefore, while Black Bream appear to be avoiding poor water quality by passaging through the fish gate, this could only occur during certain hydrological conditions. This likely limited its ability to freely escape from times of poor water quality, thus explaining the periodic fish kills that occur mostly upstream of the Vasse Surge Barrier.
Synopsis of Black Bream in the Vasse-Wonnerup
25
References 1. Schelske, C.L. and E.P. Odum, Mechanisms maintaining high productivity in
Georgia estuaries. Proceedings of the Gulf and Caribbean Fisheries Institute, 1961. 14: p. 75-80.
2. McLusky, D.S. and M. Elliott, The Estuarine Ecosystem: Ecology, Threats and Management. 3rd ed. 2004, Oxford: Oxford University Press.
3. Hoellein, T.J., D.A. Bruesewitz, and D.C. Richardson, Revisiting Odum (1956): A synthesis of aquatic ecosystem metabolism. Limnology and Oceanography, 2013. 58(6): p. 2089-2100.
4. Able, K.W. and M.P. Fahay, Ecology of Estuarine Fishes: temperate waters of the western north Atlantic. 2010, Baltimore, USA: Johns Hopkins University Press.
5. Potter, I.C., et al., The ways in which fish use estuaries: a refinement and expansion of the guild approach. Fish and Fisheries, 2015. 16(2): p. 230-239.
6. Jackson, J.B.C., et al., Historical overfishing and the recent collapse of coastal ecosystems. Science, 2001. 293(5530): p. 629-638.
7. Kennish, M.J., Environmental threats and environmental future of estuaries. Environmental Conservation, 2002. 29: p. 78-107.
8. Potter, I.C., et al., The physico-chemical characteristics, biota and fisheries of estuaries, in Freshwater Fisheries Ecology, J. Craig, Editor. 2015, Wiley-Blackwell. p. 48-79.
9. Vaquer-Sunyer, R. and C.M. Duarte, Thresholds of hypoxia for marine biodiversity. Proceedings of the National Academy of Sciences, 2008. 105(40): p. 15452-15457.
10. Bricker, S.B., et al., Effects of nutrient enrichment in the nation's estuaries: A decade of change. Harmful Algae, 2008. 8(1): p. 21-32.
11. Tweedley, J.R., R.M. Warwick, and I.C. Potter, Can biotic indicators distinguish between natural and anthropogenic environmental stress in estuaries? Journal of Sea Research, 2015. 102(0): p. 10-21.
12. Plenty, S.J., et al., Long-term annual and monthly changes in mysids and caridean decapods in a macrotidal estuarine environment in relation to climate change and pollution. Journal of Sea Research, 2018. 137: p. 35-46.
13. Warwick, R.M., J.R. Tweedley, and I.C. Potter, Microtidal estuaries warrant special management measures that recognise their critical vulnerability to pollution and climate change. Marine Pollution Bulletin, 2018. 135: p. 41-46.
14. Tweedley, J.R., et al., Family-level AMBI is valid for use in the north-eastern Atlantic but not for assessing the health of microtidal Australian estuaries. Estuarine, Coastal and Shelf Science, 2014. 141: p. 85-96.
15. Tweedley, J.R., R.M. Warwick, and I.C. Potter, The contrasting ecology of temperate macrotidal and microtidal estuaries. Oceanography and Marine Biology: An Annual Review, 2016. 54: p. 73-171.

Synopsis of Black Bream in the Vasse-Wonnerup
26
16. Tweedley, J.R., et al., Fish-based indicators of estuarine condition that do not require reference data. Estuarine, Coastal and Shelf Science, 2017. 191: p. 209-220.
17. Lane, J.A., et al., Management of the Vasse-Wonnerup wetland system in relation to sudden, mass fish deaths. 1997, Vasse Estuary Technical Working Group: Busselton, Australia. p. 55.
18. Brearley, A., Ernest Hodgkin's Swanland. 1st ed. 2005, Crawley: University of Western Australia Press. 550.
19. Tweedley, J.R., C.S. Hallett, and S.J. Beatty, Baseline survey of the fish fauna of a highly eutrophic estuary and evidence for its colonisation by Goldfish (Carassius auratus). International Aquatic Research, 2017. 9(3): p. 259-270.
20. Hart, B.T., Independent review of the current and future management of water assests in the Geographe catchment, WA. 2014, Water Science: Echuca, Australia. p. 59.
21. Kailola, P.J., et al., Australian Fisheries Resources. 1993, Canberra, Australia: Bureau of Resource Sciences and Fisheries Research Development Corporation.
22. Cottingham, A., et al., Differential changes in production measures for an estuarine-resident sparid in deep and shallow waters following increases in hypoxia. Estuarine, Coastal and Shelf Science, 2018. 202: p. 155-163.
23. Chaplin, J.A., et al., Are assemblages of black bream (Acanthopagrus butcheri) in different estuaries genetically distinct. International Journal of Salt Lake Research, 1998. 6: p. 303-321.
24. Morison, A.K., P.C. Coutin, and S.G. Robertson, Age determination of black bream, <i>Acanthopagrus butcheri</i> (Sparidae), from the Gippsland Lakes of south-eastern Australia indicates slow growth and episodic recruitment. Marine and Freshwater Research, 1998. 49(6): p. 491-498.
25. Valesini, F.J., et al., Interdecadal changes in the community, population and individual levels of the fish fauna of an extensively modified estuary. Journal of Fish Biology, 2017. 90(5): p. 1734-1767.
26. Cottingham, A., N.G. Hall, and I.C. Potter, Factors influencing growth of Acanthopagrus butcheri (Sparidae) in a eutrophic estuary have changed over time. Estuarine, Coastal and Shelf Science, 2016. 168: p. 29-39.
27. Tweedley, J.R., et al., The fish fauna of the Vasse-Wonnerup and the impact of a substantial fish kill event. 2014, Murdoch University: Perth, Australia. p. 113.
28. Cottingham, A., et al., Key biological information for the management of Black Bream in the Vasse-Wonnerup. 2015, Murdoch University: Perth, Australia. p. 40.
29. Tweedley, J.R., The Relationships Between Habitat Types and Faunal Community Structure in Broke Inlet, Western Australia. 2011, Murdoch University, Australia: Perth. p. 259.
Synopsis of Black Bream in the Vasse-Wonnerup
27
30. Cottingham, A., J.R. Tweedley, and S.J. Beatty, Continued monitoring of the recovery of the Black Bream population in the Vasse-Wonnerup. 2018, Murdoch University: Perth, Australia. p. 36.
31. Beatty, S.J., et al., Introduced and native fishes in the Vasse‐Wonnerup Ramsar Wetland and its rivers. 2014, Murdoch University: Perth, Australia. p. 139.
32. Tweedley, J.R., A. Cottingham, and S.J. Beatty, Monitoring the recruitment success of Black Bream in the Vasse-Wonnerup two years after a large fish kill. 2016, Murdoch University: Perth, Australia. p. 23.
33. Tweedley, J.R., A. Cottingham, and S.J. Beatty, Continuation of the monitoring of the recruitment success of the Black Bream population in the Vasse-Wonnerup. 2018, Murdoch University: Perth, Australia. p. 33.
34. Beatty, S.J., et al., Entrapment of an estuarine fish associated with a coastal surge barrier can increase the risk of mass mortalities. Ecological Engineering, 2018. 122: p. 229-240.
35. Tweedley, J.R., A. Cottingham, and S.J. Beatty, Vasse-Wonnerup Integrated Monitoring 2017-18: Fish component. 2019, Report for the Department of Water and Environmental Regulation, Western Australia: Murdoch University, Perth, Western Australia. p. 33.
36. Grixti, D., A. Morison, and J.D. Bell, Undersized Acanthopagrus butcheri caught and released from commercial gill nets show high survival rates in the Gippsland Lakes, southeastern Australia. North American Journal of Fisheries Management, 2010. 30(3): p. 723-731.
37. Chuwen, B.M., S.D. Hoeksema, and I.C. Potter, Factors influencing the characteristics of the fish faunas in offshore, deeper waters of permanently-open, seasonally-open and normally-closed estuaries. Estuarine, Coastal and Shelf Science, 2009. 81(3): p. 279-295.
38. Tweedley, J.R., et al., Influence of bar opening on the fish fauna of Toby Inlet. 2018, Report for the City of Busselton and Coastwest, Western Australia. : Murdoch University, Perth, Western Australia. p. 36.
39. Fahlman, A., et al., Field energetics and lung function in wild bottlenose dolphins, Tursiops truncatus, in Sarasota Bay Florida. Royal Society Open Science, 2018. 5(1).
40. McCluskey, S.M., L. Bejder, and N.R. Loneragan, Dolphin Prey Availability and Calorific Value in an Estuarine and Coastal Environment. Frontiers in Marine Science, 2016. 3(30).
41. Wetland Research & Management, Ecological character description: Vasse-Wonnerup wetlands Ramsar site south-west Western Australia. 2007, Wetland Research & Management: Perth, Australia. p. 319.
42. Sarre, G.A., Age compositions, growth rates, reproductive biology and diets of the Black Bream Acanthopagrus butcheri in four estuaries and a coastal saline lake in south-western Australia. 1999, Murdoch University: Perth, Australia. p. 130.

Synopsis of Black Bream in the Vasse-Wonnerup
28
43. Wise, B., I. Potter, and J. Wallace, Growth, movements and diet of the terapontid Amniataba caudivittata in an Australian estuary. Journal of Fish Biology, 1994. 45: p. 917-931.
44. Clarke, K.R., J.R. Tweedley, and F.J. Valesini, Simple shade plots aid better long-term choices of data pre-treatment in multivariate assemblage studies. Journal of the Marine Biological Association of the United Kingdom, 2014. 94(1): p. 1-16.
45. Chubb, C.F., et al., Age, stucture, growth rates and movements of sea mullet, Mugil cephalus L., and Yellow-eye Mullet, Aldrichetta forsteri (Valenciennes), in the Swan-Avon river system, Western Australia. Marine and Freshwater Research, 1981. 32(4): p. 605-628.
46. Sarre, G.A. and I.C. Potter, Comparisons between the reproductive biology of black bream Acanthopagrus butcheri (Teleostei: Sparidae) in four estuaries with widely differing characteristics. International Journal of Salt Lake Research, 1999. 8(3): p. 179-210.
47. Tweedley, J.R., et al., The hypoxia that developed in a microtidal estuary following an extreme storm produced dramatic changes in the benthos. Marine and Freshwater Research, 2016. 67(3): p. 327-341.
48. Cottingham, A., et al., Growth, condition, and maturity schedules of an estuarine fish species change in estuaries following increased hypoxia due to climate change. Ecology and Evolution, 2018. 8(14): p. 7111-7130.
49. Peig, J. and A.J. Green, New perspectives for estimating body condition from mass/length data: the scaled mass index as an alternative method. Oikos, 2009. 118(12): p. 1883-1891.
50. Chuwen, B., M. Platell, and I. Potter, Dietary compositions of the sparid Acanthopagrus butcheri in three normally closed and variably hypersaline estuaries differ markedly. Environmental Biology of Fishes, 2007. 80(4): p. 363-376.
51. Sarre, G.A., M.E. Platell, and I.C. Potter, Do the dietary compositions of Acanthopagrus butcheri in four estuaries and a coastal lake vary with body size and season and within and amongst these water bodies? Journal of Fish Biology, 2000. 56(1): p. 103-122.
52. Poh, B., et al., Estimating predation rates of restocked individuals: The influence of timing-of-release on metapenaeid survival. Fisheries Research, 2018. 198: p. 165-179.
53. Cottingham, A., et al., Changes in condition, growth and maturation of Acanthopagrus butcheri (Sparidae) in an estuary reflect the deleterious effects of environmental degradation. Estuarine, Coastal and Shelf Science, 2014. 149: p. 109–119.
54. Sarre, G.A. and I.C. Potter, Variation in age compositions and growth rates of Acanthopagrus butcheri (Sparidae) among estuaries: some possible contributing factors. Fisheries Bulletin, 2000. 98: p. 785-799.
Synopsis of Black Bream in the Vasse-Wonnerup
29
55. Linke, T.E., Trophic interactions among abundant members of the fish fauna in a permanently-open and seasonally-open estuary in south-western Australia. 2011, Murdoch University: Perth, Australia.
56. Elscot, S.V., Monitoring of fish behaviour in the lower reaches of the Vasse-Wonnerup Wetland System during the summer of 1999/2000. 2000, Department of Conservation & Land Management and the Geographe Catchment Council: Busselton, Australia. p. 54.
Synopsis of Black Bream in the Vasse-Wonnerup
30
Appendices
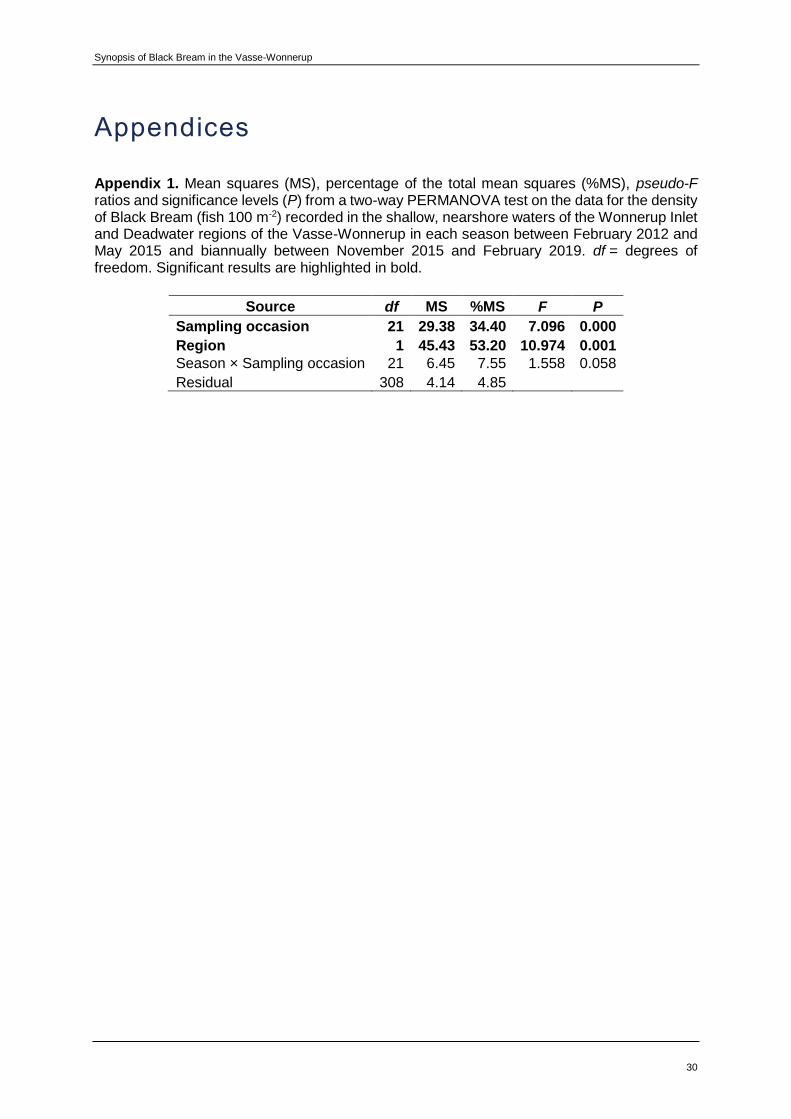
Appendix 1. Mean squares (MS), percentage of the total mean squares (%MS), pseudo-F ratios and significance levels (P) from a two-way PERMANOVA test on the data for the density of Black Bream (fish 100 m-2) recorded in the shallow, nearshore waters of the Wonnerup Inlet and Deadwater regions of the Vasse-Wonnerup in each season between February 2012 and May 2015 and biannually between November 2015 and February 2019. df = degrees of freedom. Significant results are highlighted in bold.
Source df MS %MS F P
Sampling occasion 21 29.38 34.40 7.096 0.000
Region 1 45.43 53.20 10.974 0.001
Season × Sampling occasion 21 6.45 7.55 1.558 0.058
Residual 308 4.14 4.85

Synopsis of Black Bream in the Vasse-Wonnerup
31
Appendix 2. Pairwise t-statistic values and significance levels (P) for a pairwise PERMANOVA test on the data for the density of Black Bream
(fish 100 m-2) recorded in the shallow, nearshore waters of the Vasse-Wonnerup seasonally between February 2012 and May 2015 and
biannually between November 2015 and February 2019. Significant pairwise comparisons (P < 0.05) are highlighted in grey.
2012 2013 2014 2015 2016 2017 2018
Feb May Aug Nov Feb May Aug Nov Feb May Aug Nov Feb May Nov Feb Nov Feb Nov Feb Nov
2012
May 0.88 Aug 2.79 3.84 Nov 1.52 1.07 2.55
2013
Feb 0.33 1.79 5.26 2.75
May 2.85 4.01 0.41 2.72 5.40 Aug 2.65 3.48 0.71 2.21 4.97 1.12 Nov 3.00 4.34 1.77 3.06 5.66 2.05 2.14
2014
Feb 2.93 4.17 1.00 2.88 5.52 0.78 1.57 1.00
May 3.00 4.34 1.77 3.06 5.66 2.05 2.14 0.00 1.00 Aug 3.00 4.34 1.77 3.06 5.66 2.05 2.14 0.00 1.00 0.00 Nov 2.22 2.47 1.82 1.25 4.10 2.10 1.28 2.69 2.37 2.69 2.69
2015
Feb 2.48 3.09 1.33 1.82 4.64 1.70 0.65 2.54 2.08 2.54 2.54 0.71 May 2.59 3.26 0.68 2.03 4.78 0.95 0.12 1.64 1.28 1.64 1.64 1.05 0.44 Nov 0.60 0.37 3.59 1.32 1.29 3.72 3.32 3.98 3.84 3.98 3.98 2.52 3.00 3.16
2016 Feb 1.08 0.30 4.53 0.91 2.21 4.80 4.02 5.28 5.01 5.28 5.28 2.62 3.46 3.65 0.67 Nov 2.24 2.61 2.60 1.31 4.27 3.12 1.75 4.11 3.52 4.11 4.11 0.06 0.97 1.35 2.61 2.87
2017 Feb 1.28 0.67 2.62 0.33 2.31 2.75 2.33 3.04 2.90 3.04 3.04 1.49 1.99 2.18 0.96 0.46 1.54 Nov 1.10 0.38 3.28 0.68 2.11 3.44 2.95 3.77 3.60 3.77 3.77 1.99 2.57 2.75 0.70 0.12 2.09 0.31
2018 Feb 1.66 1.36 3.10 0.17 3.13 3.35 2.60 3.84 3.57 3.84 3.84 1.31 2.07 2.31 1.58 1.25 1.42 0.51 0.92 Nov 0.61 0.44 4.29 1.50 1.38 4.46 3.94 4.79 4.61 4.79 4.79 2.93 3.55 3.72 0.02 0.79 3.09 1.07 0.80 1.83
2019 Feb 0.50 0.60 4.44 1.65 1.22 4.61 4.10 4.92 4.75 4.92 4.92 3.09 3.71 3.87 0.17 0.97 3.26 1.22 0.96 2.00 0.16

Synopsis of Black Bream in the Vasse-Wonnerup
32
Appendix 3. Mean squares (MS), percentage of the total mean squares (%MS), pseudo-F ratios and significance levels (P) from a two-way PERMANOVA test on the data for the catch rate of Black Bream (fish h-1) recorded in the deeper, offshore waters of the Wonnerup Inlet and Deadwater regions of the Vasse-Wonnerup seasonally between August 2013 and May 2015 and biannually between November 2015 and February 2019. df = degrees of freedom. Significant results are highlighted in bold.
Source df MS %MS F P
Sampling occasion 15 7.15 52.7 2.97 0.001
Region 1 2.29 16.9 0.95 0.332
Season × Sampling occasion 15 1.73 12.7 0.72 0.761
Residual 96 2.41 17.7
Appendix 4. Pairwise R-statistic values and significance levels (P) for a two-way ANOSIM test
on the data for the fish faunal community recorded in the deeper, offshore waters of the
Wonnerup Inlet and Deadwater regions of the Vasse-Wonnerup seasonally between August
2013 and August 2015 and biannually between November 2015 and February 2019.
Significant pairwise comparisons (P < 0.05) are highlighted in grey.
2013 2014 2015 2016 2017 2018
Aug Nov Feb May Aug Nov Feb May Nov Feb Nov Feb Nov Feb Nov
2013 Nov 1.12
2014
Feb 0.44 1.59
May 1.32 0.18 1.80 Aug 0.03 1.27 0.46 1.50 Nov 1.53 0.50 1.97 0.34 1.70
2015
Feb 1.43 0.37 1.90 0.20 1.61 0.15 May 1.00 0.04 1.40 0.12 1.10 0.40 0.28 Nov 1.04 0.32 1.61 0.57 1.25 0.89 0.75 0.30
2016 Feb 0.07 1.00 0.30 1.16 0.05 1.37 1.28 0.93 0.90 Nov 1.25 0.30 1.66 0.15 1.37 0.16 0.03 0.23 0.60 1.15
2017 Feb 3.15 2.18 3.63 2.05 3.50 1.54 1.75 1.82 2.94 2.72 1.58 Nov 2.48 1.42 2.98 1.26 2.80 0.80 0.99 1.15 2.10 2.12 0.90 0.86
2018 Feb 3.76 2.76 4.29 2.64 4.25 2.03 2.28 2.27 3.82 3.17 2.01 0.40 1.35 Nov 0.93 0.33 1.46 0.55 1.09 0.86 0.73 0.31 0.05 0.83 0.59 2.74 1.94 3.49
2019 Feb 3.24 2.15 3.80 2.00 3.72 1.41 1.65 1.71 3.21 2.69 1.44 0.36 0.62 0.86 2.88
Synopsis of Black Bream in the Vasse-Wonnerup
33
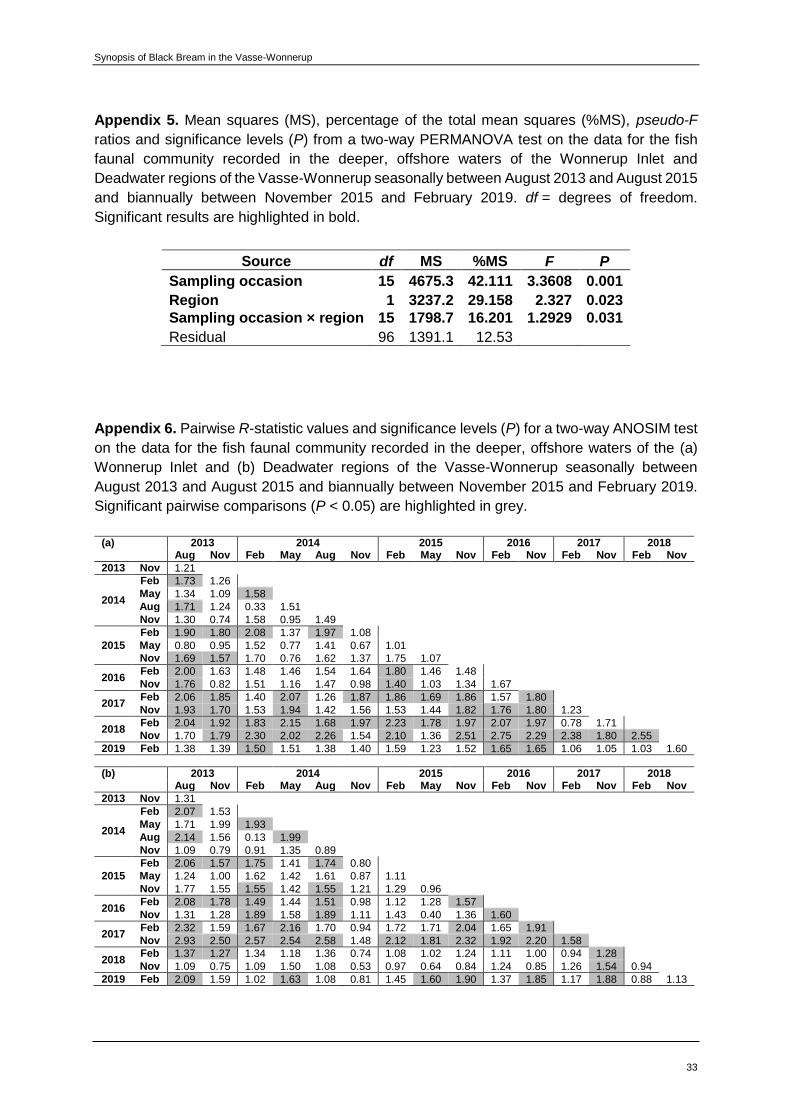
Appendix 5. Mean squares (MS), percentage of the total mean squares (%MS), pseudo-F
ratios and significance levels (P) from a two-way PERMANOVA test on the data for the fish
faunal community recorded in the deeper, offshore waters of the Wonnerup Inlet and
Deadwater regions of the Vasse-Wonnerup seasonally between August 2013 and August 2015
and biannually between November 2015 and February 2019. df = degrees of freedom.
Significant results are highlighted in bold.
Source df MS %MS F P
Sampling occasion 15 4675.3 42.111 3.3608 0.001
Region 1 3237.2 29.158 2.327 0.023
Sampling occasion × region 15 1798.7 16.201 1.2929 0.031
Residual 96 1391.1 12.53
Appendix 6. Pairwise R-statistic values and significance levels (P) for a two-way ANOSIM test
on the data for the fish faunal community recorded in the deeper, offshore waters of the (a)
Wonnerup Inlet and (b) Deadwater regions of the Vasse-Wonnerup seasonally between
August 2013 and August 2015 and biannually between November 2015 and February 2019.
Significant pairwise comparisons (P < 0.05) are highlighted in grey.
(a) 2013 2014 2015 2016 2017 2018
Aug Nov Feb May Aug Nov Feb May Nov Feb Nov Feb Nov Feb Nov
2013 Nov 1.21
2014
Feb 1.73 1.26
May 1.34 1.09 1.58 Aug 1.71 1.24 0.33 1.51 Nov 1.30 0.74 1.58 0.95 1.49
2015
Feb 1.90 1.80 2.08 1.37 1.97 1.08 May 0.80 0.95 1.52 0.77 1.41 0.67 1.01 Nov 1.69 1.57 1.70 0.76 1.62 1.37 1.75 1.07
2016 Feb 2.00 1.63 1.48 1.46 1.54 1.64 1.80 1.46 1.48 Nov 1.76 0.82 1.51 1.16 1.47 0.98 1.40 1.03 1.34 1.67
2017 Feb 2.06 1.85 1.40 2.07 1.26 1.87 1.86 1.69 1.86 1.57 1.80 Nov 1.93 1.70 1.53 1.94 1.42 1.56 1.53 1.44 1.82 1.76 1.80 1.23
2018 Feb 2.04 1.92 1.83 2.15 1.68 1.97 2.23 1.78 1.97 2.07 1.97 0.78 1.71 Nov 1.70 1.79 2.30 2.02 2.26 1.54 2.10 1.36 2.51 2.75 2.29 2.38 1.80 2.55
2019 Feb 1.38 1.39 1.50 1.51 1.38 1.40 1.59 1.23 1.52 1.65 1.65 1.06 1.05 1.03 1.60
(b) 2013 2014 2015 2016 2017 2018
Aug Nov Feb May Aug Nov Feb May Nov Feb Nov Feb Nov Feb Nov
2013 Nov 1.31
2014
Feb 2.07 1.53
May 1.71 1.99 1.93 Aug 2.14 1.56 0.13 1.99 Nov 1.09 0.79 0.91 1.35 0.89
2015
Feb 2.06 1.57 1.75 1.41 1.74 0.80 May 1.24 1.00 1.62 1.42 1.61 0.87 1.11 Nov 1.77 1.55 1.55 1.42 1.55 1.21 1.29 0.96
2016 Feb 2.08 1.78 1.49 1.44 1.51 0.98 1.12 1.28 1.57 Nov 1.31 1.28 1.89 1.58 1.89 1.11 1.43 0.40 1.36 1.60
2017 Feb 2.32 1.59 1.67 2.16 1.70 0.94 1.72 1.71 2.04 1.65 1.91 Nov 2.93 2.50 2.57 2.54 2.58 1.48 2.12 1.81 2.32 1.92 2.20 1.58
2018 Feb 1.37 1.27 1.34 1.18 1.36 0.74 1.08 1.02 1.24 1.11 1.00 0.94 1.28 Nov 1.09 0.75 1.09 1.50 1.08 0.53 0.97 0.64 0.84 1.24 0.85 1.26 1.54 0.94
2019 Feb 2.09 1.59 1.02 1.63 1.08 0.81 1.45 1.60 1.90 1.37 1.85 1.17 1.88 0.88 1.13