Embed Size (px)
Citation preview

Chapter 6
Synthesis and Characterisation of Magnetic Iron Oxide Nanostructures
Nano magnetic oxides are promising candidates for high density magnetic storage and bio-medical applications. This chapter discusses the synthesis
and studies on spherical and non-spherical (acicular) Iron Oxide (yFe20,)
nanoparticles using complexing media such as starch. Non-spherical mesoscopic iron oxides are also candidate materials for studying the shape,
size, and strain induced modifications of various physical properties viz.
optical, magnetic, and stmctural. Magnetic and optical properties of spherical as well as non-spherical iron oxide nanoparticles are subjected to
detailed investigations. The role of a complexing medium like starch in
aiding the directional growth of yFe103 is studied. Thermo-gravimetric and
Fourier Transform Infrared spectroscopic studies are conducted to identify
the impurity phases present.
*A parI oj"lhe work disClIssed in this chapter has heen plIhlished in "BIIII. Mater.
Sci." (2008,31,5, 759)

Chapter 6
6.1 Introduction
Mesoscopic magnetic iron oxides have attracted the attention of scientists for
a variety of reasons. Magnetic iron oxides are candidate materials for audio,
video and compact memories.[I] Recently efforts are underway to find new
applications of these materials as dnlg delivery agents, as
superparamagnetic iron oxide (SPJON) particles for hyperthennia, contrast
enhancing agents in magnetic resonance imaging (MRI)'2J and also as
biosensorsYJ They are biocompatible and inexpensive. From a fundamental
point of view, magnetic iron oxides are ideal templates for studying
ferrimagnetism at the nano level since they possess an ideal two sub lattice
with magnetic ions on either sites.
Magnetic iron oxides belong to the class of inverse spinels having
their cation distributed on the octahedral sites (B) and tetrahedral sites (A).
Maghemite or gamma ferric oxide also crystallizes in the inverse spinel
structure. The structure of maghemite is said to possess a vacancy ordered
spine I structure with vacancies situated exclusively on the octahedral sites.[4 i
The preparation of gamma iron oxide from precursors is tricky because the
material turns easily in to its nonmagnetic phase during synthesis if adequate
precautions are not taken.
Nonsphericity is an essential criterion for enhancing signal to noise
ratio during recording. iS .(,] But y Fe20 3 is a cubic crystal and does not easily
crystallizes in to elongated ellipsoidal particles. Earlier, workers have
attempted to synthesize nonspherical precursors using complexing
medium.17] Nucleation will be greatly influenced by external conditions, like
pH, temperature and constant stirring. Complexing agents like starch retard
the growth of the precursors in the crystallographic a-directions, so that
growth proceeds in the c-directions, leading to needles.lX] However, with the
advent of nanosciencc and nanotechnology, shape and size induced
197
Synthesis and characterisation ...
modifications of various properties like optical, magnetic, structural
properties is a rich area of physics where quantum mechanical phenomenon
like quantum size effects can be investigated on candidates materials like
gamma iron oxide./91 1t is also known that size dependent magnetic properties
manifest itself in to superparamagnetism and single domain characteristics.
Reduction of size results in large red shift in Fe)04 nanoparticles.[lOl
Most of earlier studies on nonspherical particles are limited to the
synthesis of nonspherical r Fe,Ol particles. Most of the particles lie well
above the nanometer dimensionYl However, size, shape and strain
dependent optical and magnetic properties are a virgin area where the effect
of size and shape can be studied in a single shot ifnanosize particles can be
synthesized. Such a study assumes importance because of the resulting
magneto optical properties of the nanocrystals.
In this chapter spherical and elongated mesoscopic gamma iron
oxide particles are synthesized employing a novel technique and using
starch/water/ethylene glycol as Complexing agents. Their stmctural,
magnetic, optical properties are evaluated. Emphasis is laid in studying the
shape induced optical properties of gamma iron oxide nanoparticles.
Thermo Gravimetric (TG) and FTIR analysis are carried out to probe the
retention of organic residues in the sample. Attempts are made to correlate
the optical, magnetic properties with size and shape.
6.2. Experimental
6.2.1 Preparation of spherical yFe z 0) nanoparticles
In order to prepare spherical yFe1 0 J particles, 20<Yo of starch solution is
prepared by adding 20 g of soluble starch in to IOOcc of hot water. The
resultant solution is heated with constant magnetic stirring to 50° C till it
became transparent. 25g of anhydrous ferrous sulphate is dissolved in 75 cc

Chapter 6
starch solution. This solution was heated to 70°C. To this solution 0.2 molar
ethylene glycol is added. It is presumed that ethylene glycol inhibits the
growth of the particles along one particular direction. Addition of ethylene
glycol must be drop wise with constant stirring in order to ensure the
formation of spherical particles. These particles are filtered off and dried in a
furnace at 370°C dried in ambient atmosphere to ensure the formation of
y Fe10 J .[11) This leads to a brown magnetic powder confirming the
formation of y Fe10, nanoparticles. 1I1] These samples are hereafter named
N-l.
6.2.2 Preparation of el1ipsoidal yFe 20)
The above procedure for the synthesis of spherical iron oxide particles is
modified to prepare ellipsoidal gamma iron oxide (here after named N-2) in
the sense, that instead of ethylene glycol and starch, water and starch are the
employed as the complexing for this medium. 25g of anhydrous ferrous
sulphate was dissolved in 75 cc starch solution. This solution was heated to
70°C. To this solution 0.2 molar solution of oxalic acid is added to
precipitate nonspherical ferrous oxalate precursors from the medium. It is
found that as the concentration of starch increases aspect ratio also increases.
6.2.3 Characterization
The stnlctural analysis and the identification of the phase are conducted
using an X-ray diffractometer (Rigaku Dmax-C) llsing ClI Ka radiation (A =
1.5418 A). A scanning rate of SO min- I is applied in the 28 range of 10° - 700.
The grain size is estimated by employing Debye-Schcrer's formula
D = 0.9'A/ /~cosB
199
6.1
Synthesis alld characterisation ...
where A. is the wavelength of X ray used, P is the FWHM of the XRD
peak with maximum intensity and 8 is the angle of diffraction. A JOEL
JEM 2200 FS electron microscope using an accelerating voltage of 200 kV is
used to deduce the particle size distribution of nanoparticles. The
Transmission Electron Microscope (TEM) images, High Resolution
Transmission Electron Microscope (HRTEM) images and Energy Dispersed
Spectra (EDS) are recorded for morphological and compositional studies.
Room temperature magnetic properties are obtained from the hysteresis loop
recorded in a Vibrating Sample Magnetometer (VSM) model EG&G Par
4500. A Thenno Nicolete Avatar 370 DTGS model spectrophotometer using
the KEf method was used to record the FTIR spectrum of the samples. A
Jasco V 530 UV - Visible spectrophotometer was used to determine the
diffused retlectance studies. DTG studies are conducted using Perk in Elmer
Thermal Analysis in the Nitrogen atmosphere in the temperature range 30 -
550°e.
6.3 Results and Discussion
6.3.1 Structural and Morphological Studies using XRD and TEM
The x ray powder diffraction pattern of the spherical (N-I) and the
nonspherical (N-2) Iron Oxide nanoparticles are depicted in Figure 6.1. and
they represent a spectrum typical of an inverse spine!. The planes are
identified and listed. The peaks (Ill), (220), (311), (400), (511) and (440)
correspond to that of yFe}O) (ICDD: 39-1346).
:wo

t I
'311.
,00 • ,. .. Figure 6.1: XRD patterns of yFe~01' N-\ (left). (h) N-2(right).
Chaplerfi
, ..
There are no indications for the existence of any impurity phase,
corresponding to a Fe~Oi . However, the base line is found to be shifted
due to the presence of amorphous phase probably due to the organic
inclusion of the samples. The average particle size was detennined from line
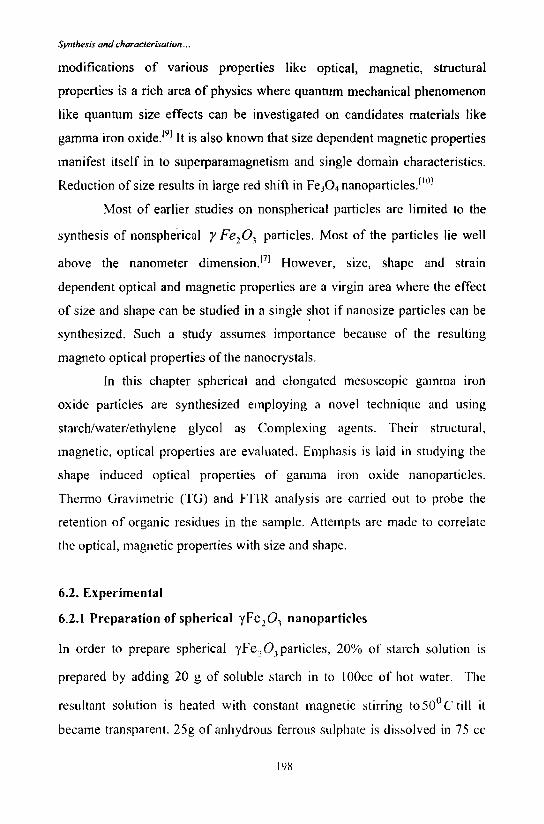
broadening and the spherical particles have an average size of 10 nm. TEM
images of N-2 indicate that the fl)rrnations of nonspherical pm1icles (Figure
6.3), \vhile particles coded N-I are sphcrical in shape (Figure 6.2). The
spherical particles have an average size of 10 nm. Nonspherical particles
have an average length of 19 nm and breadth 9 nm with an average aspect
ratio of2.
201
fuJ° · 0.. -.. := E
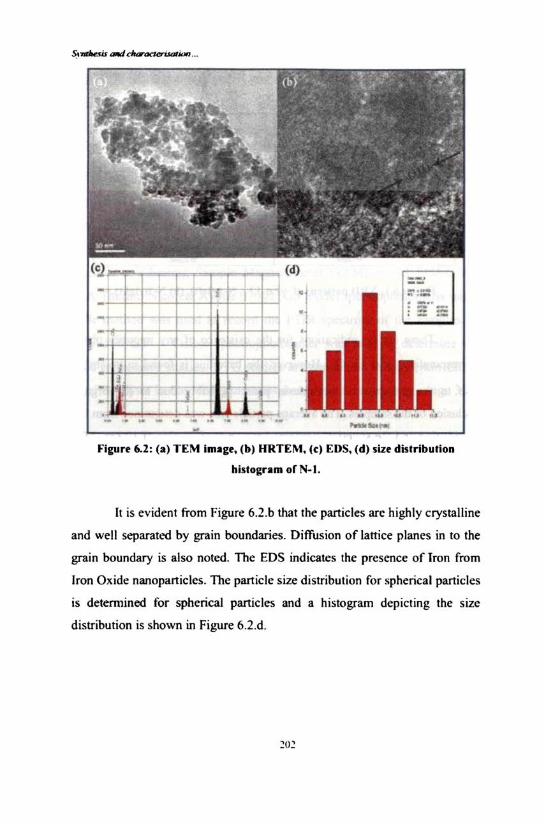
fiprt 6.2: (.I) TEM Im.lgt, (b) HRTEM. (e) [DS. (d) 'in distribution
histogum or N·I.
It is evident from Figure 6.2 .h that the particles arc highly crystalline
and well separated by grain boundaries. Diffusion of Janice planes in 10 the
grain boundary is also noted. The EDS indicates the presence of Iron from
Iron Oxide nanoparticlcs. The panicle size distribution for spherical particles
is detennined for spherical panicles and a histogram depicting the size
distribution is shown in Figure 6 .2.d .
=+= .
t t
1-q
• ~ L
, . '~ 11
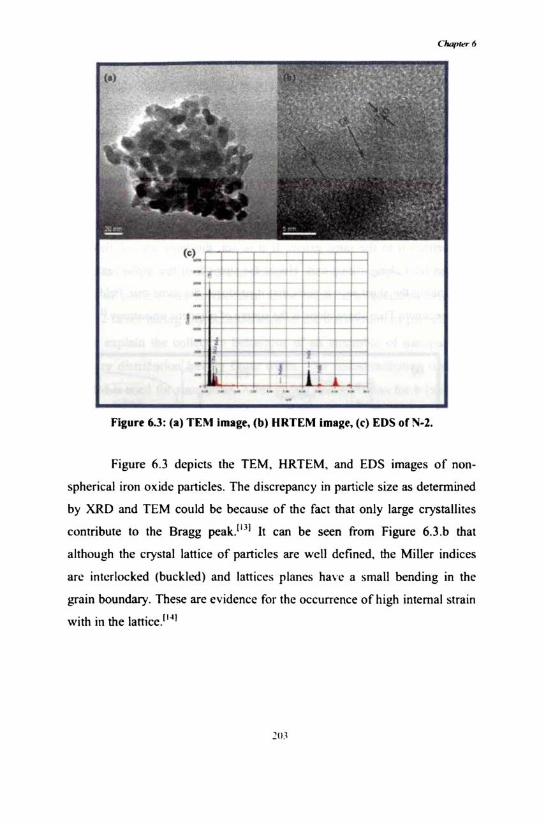
'- - - - .. - .. - - .. -Figu re 6.3: (11) TEM image, (b) HRTEM image. (c) [OS orN-2.
Figure 6.3 depicts the TEM. HRTEM. and EDS images of non
spherical iron oxide particles. The discrepancy in particle size as detennined
by XRD and TEM could be because of the fact that only large crystallitcs
contribute to the Bragg peak,tU) It can be seen from Figure 6.3.b that
although the crystal laniee of particles are well defined. the MiUer indices
an.: interlocked (buckled) and 13nices planes have a small bending in the
grain boundary. These arc evidence for the occurrence of high internal strain
with in the lanicc.[I~1
Synth esis and characterisation ...
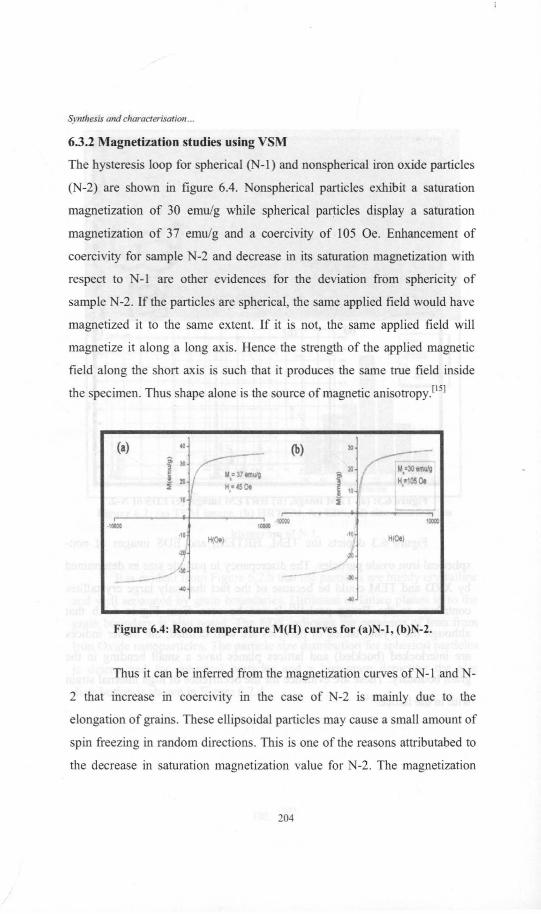
6.3.2 Magnetization studies using VSM
The hysteresis loop for spherical (N-I) and nonspherical iron oxide particles
(N-2) are shown in figure 6.4. Nonspherical particles exhibit a saturation
magnetization of 30 emu/g while spherical particles display a saturation
magnetization of 37 emu/g and a coercivity of 105 Oe. Enhancement of
coercivity for sample N-2 and decrease in its saturation magnetization with
respect to N-I are other evidences for the deviation from sphericity of
sample N-2. If the particles are spherical , the same applied field would have
magnetized it to the same extent. If it is not, the same applied field will
magnetize it along a long axis. Hence the strength of the applied magnetic
field along the short axis is such that it produces the same true field inside
the specimen. Thus shape alone is the source of magnetic anisotropy.l"
(a) 44 (b)Ci ~Ir::gi 20 •i H; 45Ot
10
.,1lOQO
·10H(Oo)
I.2<)
~-./-- ~
ICllOO ' 1OOOO
·' 0 HIOe) -Figure 6.4: Room temp erature M(H) curves for (a)N-l , (b)N-2.
Thus it can be inferred from the magnetization curves ofN-1 and N
2 that increase in coercivity in the case of N-2 is mainly due to the
elongation of grains. These ellipsoidal particles may cause a small amount of
spin freezing in random directions. This is one of the reasons attributabed to
the decrease in saturation magnetization value for N-2. The magnetization
204

Chapter 6
curve of N -1 shows almost negligible remanence and small coercivity
showing their superparamagnetic nature.
Additional evidence for superparamagnetism exhibited by N-l can
be obtained by simulating the magnetization curve using the Langevin
function L(x). Here it is assumed that the individual grains are single crystals
with the number of crystals equal to the number of domains. We have
Langevin function represented by
1L(x) = cothx-
x6.2
Size plays a crucial role in deciding the overall magnetization. The
variation of particle size is also then to be taken in to account. Since the
equation 2 is not taking any consideration to the distribution of particle size,
it cannot explain the collective behaviour of an ensemble of nanoparticles
with a size distribution having finite width. The size distribution obtained
from TEM is used for simulation. After giving due provision for b (width of
the size distribution histogram) the Langevin function can be modified as,l16 J
x(l+h)
L(x) = hbx fL(x')dx'x(l-h)
= ~ In{(l-b)Sinh[x(l+b)]}2bx (l+b)sinh[x(l-b)
6.3
6.4
The simulated Langevin function using Eq.(4) is carried out and is
shown in Figure 6.
205

Synthesis und churacterisation ...
12
UI
IIXII :ma :DII 4IDI IIQI II1II 7DII am IIJIII
Field,H (Oe)
Figure 6.5: Modified Langevin function fit for N-t.
The fitting (Figure 6.5) is catTied out after giving due weightage for
particle size distribution. Thus simulated curve (linear) fits very well
(particularly at average sizes) with experimental curve (dotted).
6.3.3 TG-DTG Studies
Bulk maghemite in the micron regime possess a saturation magnetization of
-74 emu/g \15] and coercivity of 250 Oe, /1 1] and they are generally
multidomain in character. However, as particle size reduces they became
single domain and exhibit superparamagnetic characteristics. Although we
have procured evidence for superparamagnetism by Langevin fitting, the
reduction in magnetization is to be probed by supplementary techniques. For
this TG DTG studies are carried. The TG-DTG curves are shown in Figure
0.6.
~()6
Chupler6
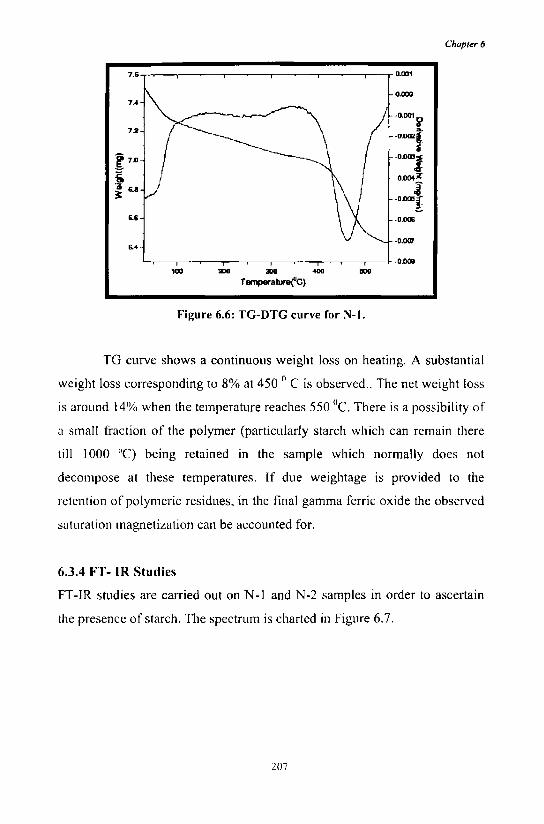
Figure 6.6: TG-DTG curve for :'01-1.
TG curve shows a continuous weight loss on heating. A substantial
weight loss corresponding to 8% at 450 0 C is observed .. The net weight loss
is around 14(% when the temperature reaches 550 °e. There is a possibility of
a small fraction of the polymer (particularly starch which can remain there
till 1000 °e) being retained in the sample which normally does not
decompose at these temperatures. If due weightage is provided to the
retention of polymeric residues, in the final gamma ferric oxide the observed
snturation magnetization can be accounted for.
6.3.4 FT- IR Studies
FT-IR studies are carried out on N-l and N-2 samples in order to ascertain
the presence of starch. The spectrum is charted in Figure 6.7.
207

Synthesis and characterisation ...
g o
3500 3J00
i I
2500 1000
i I
1500
Figure 6.7: FT-IR spectrum ofN-1.
il I I
1000 ~o
The peak at 3384.82 corresponds to -OH group and the broadening
shows the presence of hydrogen bonding. This strengthens the evidence for
the presence of starch in the samples.1I7] This -OH group with hydrogen
bonding is coming from starch. Peaks between 500 and 700 cm· 1 correspond
to Fe-O bonds. llk]
6.3.5 Energy band gap calculation
Band gap calculation plays an important role in characterising the materials
at nano level. In the case of nanoparticles, various factors like lattice strain,
plasmonic confinements, surface and shape effects and quantum
confinement effects can alter and engineer the band gap and hence. the
determination of band gap plays a seminal role in nanoparticle
characterisation. Diffused Reflectance Spectroscopic (DRS) studies of
samples N-l and N-2 are conducted usmg UV-Visible NIR
Spectrophotometer. Energy band calculations are carried out usmg the
relation,[19]
2()X
Chapler6
A.(hv-E f" a = 2: a = 2: I gr
hv 6.5
where the value of Egi and mi correspond to the energy and the nature of the
particular optical transition with absorption coefficient ai For allowed
direct, allowed indirect, forbidden direct and forbidden indirect transitions,
the value of m, corresponds to rh, 2, 3/2 and 3, respectively.[20J Since the
particles are nanocrysrtalline, the values of Eg; and m; are determined without
presuming the nature of electronic transition.[21] Eq.5. can be rewritten in the
following form
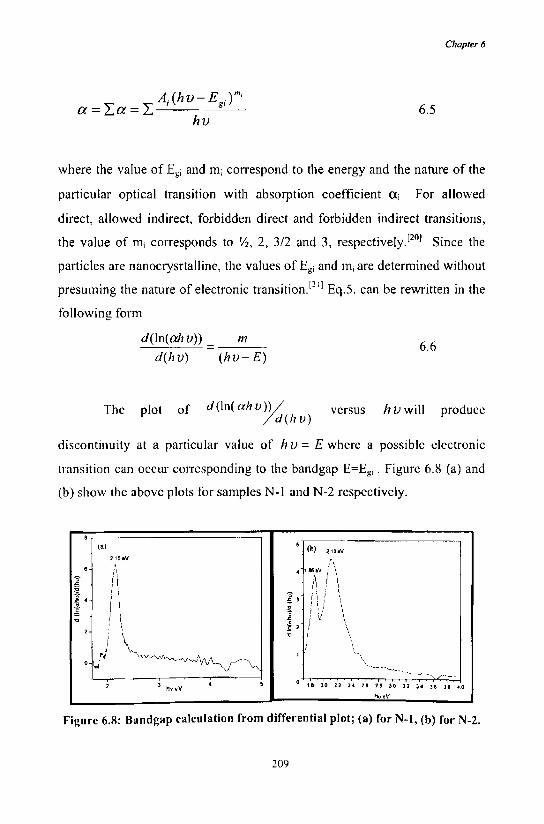
d(ln(ahu) m 6.6
d(hu) (hu- £)
The plot of d(\n( ah v»/ / d(h v)
versus hv will produce
discontinuity at a particular value of h V = E where a possible electronic
transition can oecur corresponding to the bandgap E=Egi . Figure 6.8 (a) and
(b) show the above plots for samples N-l and N-2 respectively.
la)
, , , l
'. 0\1
215aV , 'i
I1 i I:
.1 j I I,
\.
3 h\' "V
• (h) 21".
111 2.0 22 24 211 U 30 12 34 311 ]8 40
huev
Figure 6.R: Bandgap calculation from differential plot; (a) for N-t, (b) for N-2.
209

Synrhesis and characrerisurion ...
The red shifted electronic band (-0.24 eV) is due to the presence of
ellipsoidal particles which are under very high stress. This is further
supported by HRTEM (Figure 3.b.).This shows that, although the crystal
lattice of particles is well defined, the Miller indices are buckled (Figure
3.b.). The nature of electronic transition is found using In(alhv-E) vs
In(alhv) curves (figure 6.9) and it is found that the slope of the curves is
-0.5. This indicates that the electronic transition involved is 'allowed direct'.
(8) (b) EoE,.-,a.v
1&~~lOoVl ...0..
1Il00.41
!. . ..c •
• .!Iou ....
.. U ... 14 .. u u u
UUDlUUI.JU
~
Figure 6.9: In(hv-E) vs In(a, hv) curves for; (a) N-I, (b) N-2.
From thc lattice constants for spherical and nonsphcrical yFe 1 0)
particles unit cell compression of (ll V IV ) -10% was observed in the casc of
nonspherical particles. Stress increases as the size is reduced. The reduction
in bandgap is governed by the narrowing of the direct bandgap due to the
enhanced pressure from the surface tension, where pressure P=2y/r, y is the
surface tension and r is the size of the grain. So the strain induced
modification of band gap provides a phenomenological explanation for the
anomalolls red shift observed in mesoscopie iron oxide particles. Thc effect
of matrix or any other impurities in the red shift has been removed, since the
entire measured band gaps are well above the red shifted valuc.
2]0

Chapter 6
Conclusion
The employment of a complexing medium like starch for the synthesis of
nonspherical iron oxide particles can be modified to tailor the aspect ratio of
nonspherical nanoparticles of gamma ferric oxide, since shape controlled
particles are of interest both from a fundamental and application point of
view. The observed reduction in saturation magnetization with respect to the
saturation magnetization of bulk maghemite is due to the presence of
superparamagnetism and residual organic impurities in the final product.
Strain induced modification of band gap is possible by carefully
controlling the acicularity of these particles. Shape control can also induce
anisotropy and thus modify the coercivity of these particles. A simple
phenomelogical explanation was provided to explain the red shift found ill
the optical band gap of nonspherical maghernite particles.
211

Synlhesis and characlerisalion ...
References 1. Taeghwan, H. Chem.Commun. (2003) 927.
2. Sabino,V.-verdaguer; Maria, del P.; Morales; Oscar, Bomati-M.;
Carmen, B.; Xinquing, Z.; Pierre, B.; Rigoberto, Perez de A.; Jesus,
Ruiz-cabcllo; Martin, S.; Fransisco, J. Tendillo-Cortijo; Joaquin, F.
J. Phys. D: Appl. Phys. (2004) 37 2054.
3. Panagiotis, D.; Nicolas, M.; Eamonn, D.; Dimitrios, N.; Dimitros, P.
Nanotcchnology (2006) 17 5019.
4. Viswanathan, B. Ferrite materials: Science and Technology (1990)
Narosa Publishing House, New Delhi.
5. Deng, M. c.; Hsu, S. L.; Chin, T. S. IEEE Trans. Magn. (1992) 28
2385.
6. Bate, G. J.Magn. Magn.Mater. (1991) 100413.
7. Anantharaman, M. R.; Joseph, K. V.; Keer, H. V. Bull. Mater. Sci.
(1997) 20 7 975. 8. Arndt, V.; BASH, A. G.; Ludwigshafer. Magnctics, IEEE
Transactions (1998) 24 2 1796.
9. Kaehkachi, H.; Ezzir, A.; Nogues, M.; Tronc, E. Eur. Phys. J. B
(2000) 14 6Xl.
10. Swapna, S. Nair; Mercy Mathcws; Anantharaman, M. R. Chcm.
Phys. Let!. (2005) 406 398.
11. Venkatesh Rao; Shashimohan, A. L.; Biswas, A. B. Journal of
Material Science (1974) 9 430.
12. Abbas, A.; Khaleel. Chem. Eur. J. (2004) 10925.
13. Cohen,1. B. Ultramicroscopy (1990) 3441.
14. John,K.; Vassiliou; Vivek Mehrotra.; Michal. W. Russel1;
McMichacl, R. D.; Shull, R. D.; Ronald F. Ziolo. J. Appl. Phys.
(1993) 73 10.
15. Cullity, B. D. Introduction to magnetic materials (1972) Addison
Wesley Publishing company Philippines.
16. Chikazumi. Physics of Magnetism (1964) John Wiley & Sons, New
York, USA.
17. Robert, M. Silverstcin; Francis, X. Webstcr; Spectroscopic
identification of organic compounds (1964) John Wiley & Sons,
New York, USA.
1 X. Raksha Shar11la; Subhalakshmi Lamba; Annupoorni, S. J. Phys. [) .
Appl. Phys. (2005) 38 3354.
212

Chopter 6
19. Pankov, J. J. Optical Processes in Semiconductors (1971) PrinticeHall, New Jersey, USA.
20. Bhattacharyya, D.; Chaudhuri, S.; Pal, A. K. Vacuum (1992) 43313. 21. Chakrabarti, S.; Ganguli, D.; Chaudhuri, S. Physica E (2004) 24
333.
213


![The Uses of Iron (II) Oxide By: Isabel Rimando. Iron (II) oxide [FeO] Not to be confused with iron (III) oxide (rust)](https://img.pdfslide.net/doc/110x75/5a4d1bbd7f8b9ab0599d1c20/the-uses-of-iron-ii-oxide-by-isabel-rimando-iron-ii-oxide-feo-not-to.jpg)