Embed Size (px)
Citation preview
Synthesis and characterization of palladium based carbon nanostructure-composites and their clean-energy application
Florian Nitze
Department of Physics
Umeå University, Sweden
Doctoral Thesis, 2013

© Florian Nitze
ISBN: 978-91-7459-632-8
Electronic version available at http://umu.diva-portal.org/
Printed by: Print & Media
Umeå, Sweden 2013

To Justyna
i
Abstract
Carbon nanostructures are a wide field with many applications. The use of
carbon nanostructures as support in heterogeneous catalysis is a key
development that led together with the use of nanoparticles to a significant
cost reduction of catalysts. Catalysts designed in this way are widely applied
in fuel cell technologies. For portable devices especially low temperature fuel
cells are desirable with low hazards for the user. One technology which
fulfills these requirements is the direct formic acid fuel cell (DFAFC). DFAFC
have many promising characteristics, such as high electromotive force and
easy fuel handling. However, they still suffer from too low power output and
lifetime for commercialization.
This thesis focusses on two main aspects: the synthesis of carbon
nanostructures by chemical vapor deposition (CVD) and their application as
catalyst support. The materials are investigated by many different techniques
ranging from transmission electron microscopy (TEM) to fuel cell tests.
Different carbon nanostructures could be synthesized by catalytic CVD on
palladium (Pd) nanoparticles. Multi-walled carbon nanotubes (MWCNTs),
carbon nanofibers (CNFs) and helical carbon nanofibers (HCNFs) were
grown, selectively, dependent on temperature, using acetylene as carbon
precursor. Especially HCNF raised further interest due to their unique
structure. A growth model for HCNFs was developed based on an anisotropic
extrusion model. The synthesis conditions for HCNFs were optimized until
an almost 100 % purity with very high efficiency was obtained.
The unique helical but fiber-like structure made the material very
interesting as support for heterogeneous catalysis. Several catalysts based on
Pd nanoparticle decorated HCNFs were developed. The synthesis methods
ranged from standard methods like the polyol method to phase-transfer
methods. The catalysts showed very promising results for the electro-
oxidation of methanol, ethanol and formic acid. This makes them highly
attractive for fuel cell applications. The catalysts were tested in DFAFC. The
superiority of HCNF-based catalysts is attributed to the good attachment of
nanoparticles to the defect-rich and easy to functionalize surface of HCNFs
in combination with adequate film forming properties during electrode
preparation.
ii
Sammanfattning på svenska
Nanostrukturerat kol är ett mycket brett fält med ett stort antal
tillämpningar. Användning av kolnanostrukturer som support för
heterogena katalysmaterial har tillsammans med utvecklingen av
nanopartiklar lett till en avsevärd minskning av kostnaden för katalysatorer.
Katalysatorer designade på detta sätt används frekvent i bränsleceller. För
portabla tillämpningar är utvecklingen av säkra och miljövänliga
lågtemperaturceller mycket viktig. En teknologi som uppfyller dessa kriterier
är bränsleceller som drivs med myrsyra (DFAFC). Sådana bränsleceller har
många önskvärda egenskaper, såsom en hög elektromotorisk kraft och en
enkel hantering av bränslet. Trots dessa goda egenskaper har de också en del
nackdelar som hindrar en full kommersialisering. De två mest problematiska
är en för låg genererad effekt samt en för kort livslängd på katalysatorerna.
Denna avhandling fokuserar på två huvudpunkter som adresserar dessa
problem; tillverkning och karaktärisering av kolnanostrukturer producerade
med CVD, och deras tillämpningar som support för katalysatorer. Materialen
karaktäriseras med en rad olika tekniker, allt från transmission-
elektronmikroskopi till bränslecellstester.
Olika kolnanostrukturer har syntetiserats med katalytisk CVD på
palladium (Pd) nanopartiklar. Produktionen av flerväggiga kolnanorör,
kolfibrer och heliska kolnanofibrer har tillverkats med acetylen som kolkälla
och genom att variera temperaturen kunde innehållet av olika typer av
nanostrukturerat kol kontrolleras. Särskilt stort intresse har de heliska
kolnanofibrerna rönt på grund av deras unika struktur. Vi beskriver en
tillväxtmekanism baserad på en anisotrop diffusionsmodell. Genom att
justera produktionsparametrarna visar vi att heliska kolnanofibrer kunde
tillverkas med nära 100 %-ig renhet och hög effektivitet.
Den unika heliska och fiberlika strukturen är mycket intressant for
tillämpningar som support för heterogena katalysatorer. Ett flertal
kompositer för katalytiska tillämpningar har utvecklats baserade på heliska
kolnanofibrer, dekorerade med heterogena katalysatorer genom en rad olika
kemiska/fysikaliska tekniker. De syntetiserade materialen visar mycket goda
katalytiska egenskaper för att oxidera metanol, etanol och myrsyra.
Därigenom blir de mycket attraktiva för användning i bränsleceller. Vi
korrelerar de goda katalytiska egenskaperna med en bra vidhäftning av
nanopartiklarna på de heliska kolnanofibrerna defekter, deras goda
ledningsförmåga, bra egenskaper för att förbereda elektroder, samt deras
stora yta i förhållande till deras volym och vikt.
iii
Table of Contents Abstract i Sammanfattning på svenska ii Table of Contents iii Most commonly used abbreviations v 1. Introduction 1 2. Theory 5
2.1. Carbon nanostructures 5 2.1.1. Carbon nanotubes 5 2.1.2. Carbon nanofibers 6 2.1.3. Helical carbon nanostructures 7 2.2. Synthesis of carbon nanostructures 7 2.2.1. Chemical vapor deposition 8 2.2.1.1. Choice of palladium 9 2.2.2. Growth mechanism in chemical vapor deposition 9 2.2.3. General applications of carbon nanostructures 10 2.3. Fuel cells 10 2.3.1. Direct formic acid fuel cells 13 2.3.2. Electrochemical sensing 14 2.4. Decoration of carbon nanostructures 15
3. Synthesis 18 3.1. Chemical vapor deposition catalyst preparation 18 3.2. Chemical vapor deposition 18 3.2.1. Synthesis of different carbon nanostructures 18 3.2.2. Efficient synthesis of helical carbon nanofibers 19 3.3. Preparation of catalysts 19 3.3.1. Functionalization of support 20 3.3.1.1. Polyol method 20 3.3.1.2. Benzyl mercaptan method 21 3.3.1.3. Combined decoration and electrode preparation 21 3.3.2. Anchoring of palladium nanoparticle 21 3.3.2.1. Polyol method 21 3.3.2.2. Benzyl mercaptan method 21 3.3.2.3. Combined decoration and electrode preparation 21 3.3.3. Anchoring of functionalized nanoparticles 22 3.3.3.1. Phenyl mercaptan phase-transfer approach 22 3.3.3.2. Dimethyl sulfoxide approach 23 3.3.3.3. Catalyst for hydrogen peroxide and glucose detection 23
4. Characterization 24 4.1. Electron microscopy 24 4.1.1. Low and high resolution transmission electron microscopy 24 4.1.1.1. Image formation 25
iv
4.1.1.2. Selected area diffraction 25 4.1.1.3. Transmission electron tomography 26 4.1.2. Scanning electron microscopy 26 4.2. Spectroscopy and crystallography 27 4.2.1. X-ray diffraction 27 4.2.2. Raman spectroscopy 27 4.2.3. X-ray photoelectron spectroscopy 27 4.3. Electrochemical testing 28 4.3.1. Cyclic voltammetry 28 4.3.2. Fuel cell tests 28 4.4. Other methods 29 4.4.1. Thermogravimetric analysis 29
5. Results and discussion 31 5.1. Chemical vapor deposition growth products 31 5.1.1. Growth model of helical carbon nanofibers 33 5.1.2. Transmission electron tomography of helical carbon nanofibers 34 5.2. Analysis of the chemical vapor deposition catalyst 35 5.3. Decorated helical carbon nanofibers 37 5.3.1. Polyol method 38 5.3.2. Structural improvement of the composites 38 5.3.2.1. Benzyl mercaptan method 39 5.3.2.2. Phenyl mercaptan phase-transfer approach 40 5.3.2.3. Dimethyl sulfoxide phase transfer approach 40 5.3.3. Combined decoration and electrode preparation 41 5.3.4. Dimethylformamide based method 42 5.4. Analysis of the metal loading 42 5.5. Electrocatalytic activity and fuel cell tests 43 5.5.1. Oxidation of small molecules in cyclic voltammetry 44 5.5.2. Polyol and benzyl mercaptan methods for fuel cell catalysts 45 5.5.3. Simplification of the electrode preparation 46 5.5.4. Sensing of hydrogen peroxide and glucose 48
6. Conclusion 49 6.1. Outlook 49
7. Summary of the appended articles 51 8. Acknowledgements 57 9. References 59
v
Most commonly used abbreviations
C60 - C60 fullerene dba - Dibenzylideneacetone DFAFC - Direct formic acid fuel cell DMF - Dimethylformamide DMFC - Direct methanol fuel cell DMSO - Dimethyl sulfoxide CNF - Carbon nanofiber CNT - Carbon nanotube CV - Cyclic voltammetry CVD - Chemical vapor deposition FA - Formic acid HCNF - Helical carbon nanofiber HOR - Hydrogen oxidation reaction HRTEM - High resolution transmission electron microscopy MEA - Membrane electrode assembly MWCNT - Multi-walled carbon nanotube NMR - Nuclear magnetic resonance NP - Nanoparticle OCV - Open cell voltage ORR Oxygen reduction reaction Pd2dba3 - Tris(dibenzylideneacetone)dipalladium(0) PEM - Proton exchange membrane PEMFC - Proton exchange membrane fuel cell SAED - Selected area electron diffraction SCNF - Straight hollow carbon nanofiber SEM - Scanning electron microscopy STEM - Scanning transmission electron microscopy SWCNT - Single-walled carbon nanotube TEM - Transmission electron microscopy TGA - Thermo gravimetric analysis XRD - X-ray diffraction
1
1. Introduction
How to solve the problem of sustainable energy generation and conversion
is a topic widely discussed throughout the society. Many approaches are in
development and a huge public and research interest is focused towards this
subject. Within the field of clean energy conversion, meaning conversion of
an energy rich medium such as hydrogen, methanol or formic acid into
usable power, fuel cells are considered as the number one candidate for
converting fuel to electricity. All fuel cells are based on the spatial separation
of the oxidation and reduction reactions. This principle is not new; it was
developed already in the 19th century. In modern times, the major drawback
for fuel cells concerns the extremely high cost of platinum (Pt) based
catalysts. For proton-exchange membrane fuel cells (PEMFC) the catalyst
cost could in the past easily add up to half of the total cost [1-3], which has
severely hindered a wide-use of fuel cells in common life. This cost could be
significantly reduced by the use of nano catalysts [1-4] as discussed in detail
later in the thesis. Related to and partially explaining the high cost of Pt [5]
is the low abundance of Pt in the earth crust. Low abundance or low mining
capabilities can heavily influence prices of precious metals, exemplified by
the appearance of palladium-based catalytic converter for the car industry in
the end of 1990’s [6], leading to a significant increase in the commodity price
for palladium. However, in a hydrogen fuel cell Pt and its alloys are so far
hard to outperform. The situation looks quite different when it comes to fuel
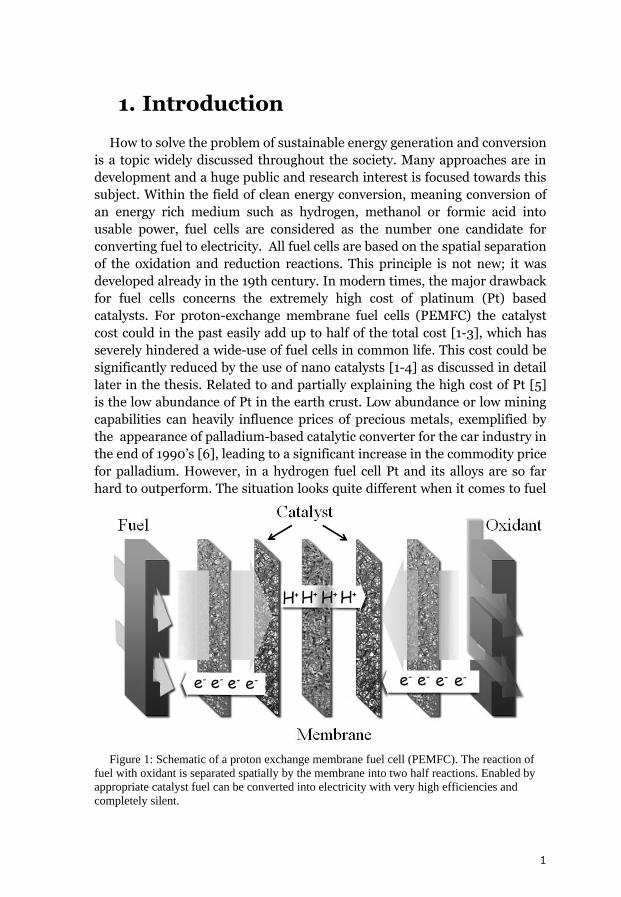
Figure 1: Schematic of a proton exchange membrane fuel cell (PEMFC). The reaction of
fuel with oxidant is separated spatially by the membrane into two half reactions. Enabled by
appropriate catalyst fuel can be converted into electricity with very high efficiencies and
completely silent.
2
cells driven by different fuels such
as methanol, ethanol or formic acid.
Pt is easily poisoned by fuel
crossover or reaction intermediates
leading to deactivation and lower
activity per mass of precious metal
[7, 8]. A good alternative, both
regarding cost, estimated higher
abundance in a long perspective, as
well as higher poison resistance has
been found in palladium (Pd) [9,
10]. The high costs of noble metal
catalysts evidently mean that the
catalyst materials need to be
utilized as efficient as possible.
Since the reactions in
heterogeneous catalysis solely occur
in the very upper layers it has the consequence that nano-sized catalysts can
show significantly higher catalytic efficiency per unit mass than a continuous
film. A problem with this approach is however that nano-sized catalyst has a
tendency to agglomerate, following the thermodynamic rule to minimize
surface energy. There are several good approaches to solve this, but one of
the most successful is to create stable and highly active catalyst by the
decoration of suitable supports with precious metal nanoparticles [4, 11-20].
The choice of support depends on many conditions but some basic
characteristics are essential. The most important are: high surface to volume
ratio, excellent ability for anchoring nanoparticles, good film forming
properties with large enough pores to allow efficient diffusion of the fuel,
good electrical conduction and good ionic conduction in combination with
for example Nafion. Many studies have used carbon nanostructures as
support which fulfills most of the requirements [4, 11, 14-16, 18-21].
Most catalysis related applications, as presented in this thesis, use carbon
nanostructures only as support for precious metal based catalysts [16, 22-
25]. However, some recent studies report that certain modified carbon
nanostructures possess an intrinsic catalytic activity, such as in the case of
nitrogen-doped structures which have the ability to catalyze the oxygen
reduction reaction (ORR) [26, 27] needed on the cathodic side of a PEMFC.
When discussing carbon nanostructures it is however important to point out
that the family of carbon nanostructures is very large and that the properties
of materials built up by all-carbon atoms vary widely among the different
structures within the carbon family. Three major landmarks in carbon
research are important to mention, which have boosted both scientific as
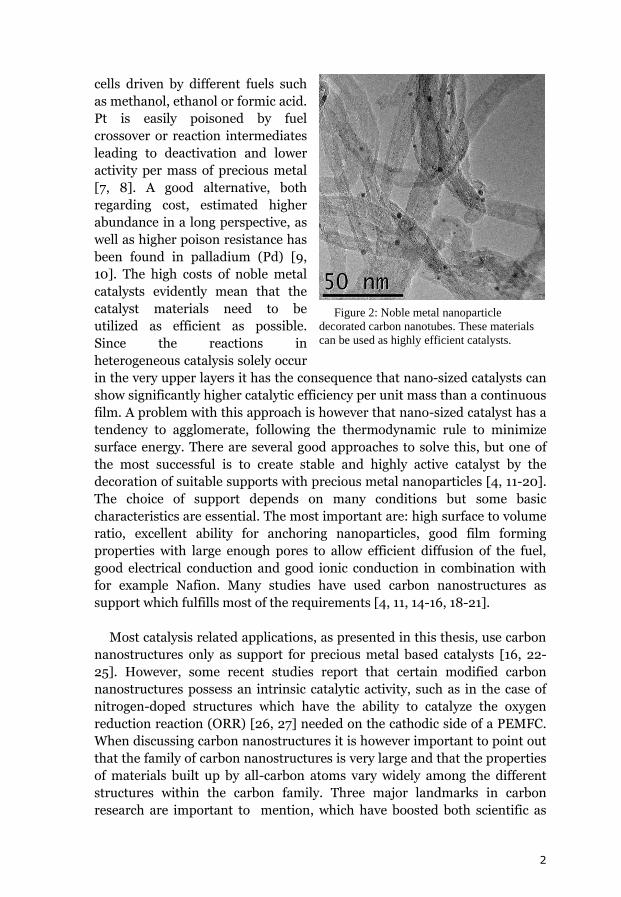
Figure 2: Noble metal nanoparticle
decorated carbon nanotubes. These materials
can be used as highly efficient catalysts.
3
well as public interest; fullerenes
[28], carbon nanotubes (CNTs) [29]
and just recently graphene [30], The
discovery, and the synthesis,
respectively, of the first and the last
have even been awarded with the
Nobel price. Besides the
applications described in this thesis
for carbon materials regarding
catalysis [31, 32], carbon based
technology spans over a vast area of
other fields ranging from electronics
like field-emission displays [33, 34]
to actuators [35].
During the intense research on
carbon nanostructures in the last 20
years, many synthesis methods for carbon nanostructures have been
developed. Chemical vapor deposition (CVD) [36-39], arc discharge [40, 41]
or laser ablation [42], just to mention three, are widely used, where the first
is probably the most versatile. An important note is that many of these
methods actually utilize catalyst material themselves to grow structures
efficiently. For many applications this is disadvantageous since the catalyst
materials, often consisting of transition metals such as iron, cobalt and
nickel can have detrimental effects on the performance of the materials. This
can lead to higher cost in the final applications due to the need of
purification of the material in order to remove potentially disturbing
material. In this thesis we have invented an ingenious approach to solve this.
By synthesizing the nanostructures from the same noble metal element as
used for decoration, the purification step can be completely avoided. As
mentioned earlier, Pd has very good properties as fuel cell catalyst and is
non-magnetic which makes it very interesting as potential chemical vapor
deposition catalyst. Magnetic impurities can make studies on carbon
materials by nuclear magnetic resonance (NMR) almost impossible. Another
example are studies on magnetism in nano-carbons. It has been discussed if
the magnetism originates from magnetic impurity or if it is an intrinsic
property of the carbon material [43-46].
During my time as Ph.D. and master student I was strongly involved in the
very time consuming building of a state of the art synthesis laboratory,
basically from scratch. This work involved designing setups, application for
funding and purchase of components and equipment and is summarized in
my licentiate thesis [39, 47]. However, in this thesis I will focus on the solely
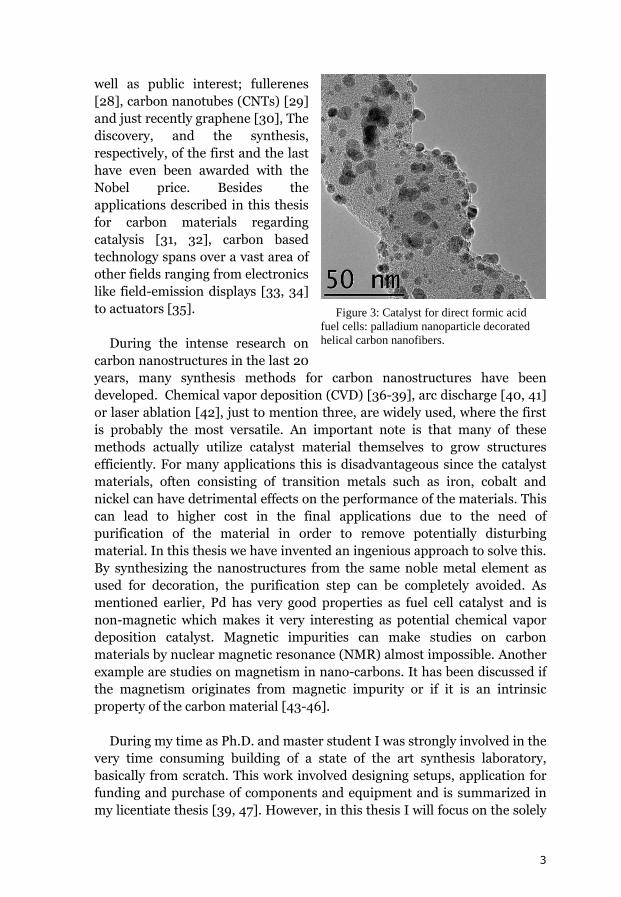
Figure 3: Catalyst for direct formic acid
fuel cells: palladium nanoparticle decorated
helical carbon nanofibers.
4
scientific aspects of my work [48-55]. The main focus lies on the synthesis,
characterization and application of carbon nanostructures and palladium
based composites.
As briefly mentioned above, CVD is the most versatile method to produce
carbon nanostructures. Although we have utilized many different catalyst
materials in this process, my main interest has been directed towards the
synthesis of carbon nanostructures using Pd as catalyst. A variety of different
nanostructures can be synthesized on C60 supported Pd nanoparticles
depending on the synthesis conditions. The growth temperature is the
parameter with largest impact for the growth product in CVD. The main
products are straight hollow carbon nanofibers (SCNFs), helical carbon
nanofibers (HCNFs) and CNTs. In chapter 5.1.1 and in paper II we propose a
growth model to explain the growth of straight and helical carbon
nanofibers. The highly pure (in regards to other impurities than Pd) HCNFs
are decorated by a variety of methods and applied as fuel cell catalysts.
Finally a new low-cost, highly efficient approach to combine decoration and
fuel cell electrode preparation is developed and successfully tested. The main
tools of investigation are transmission electron microscopy (TEM), high
resolution transmission electron microscopy (HRTEM) and of course fuel
cell tests. Other methods of investigation are thermogravimetric analysis
(TGA), cyclic voltammetry (CV) and X-ray diffraction (XRD).
5
2. Theory
2.1. Carbon nanostructures
In the following I will introduce some general aspects of the field of
carbon related research. I will focus on carbon nanotubes, carbon
nanofibers, helical carbon nanofibers, and the synthesis of carbon
nanostructures.
2.1.1. Carbon nanotubes
A key discovery in carbon related research are certainly carbon nanotubes.
CNTs were first thoroughly described by Iijima in 1991 [29] just after the
discovery of fullerenes (Kroto and Smalley [28]) which boosted the interest
in carbon related research in 1985. In fact, carbon nanotubes were
potentially described earlier by for example Bacon [56, 57] with the
discovery of carbon fibers, but due to lacking characterization methods they
were not acknowdledged. More recently, graphene represents a similar
major breakthrough. Carbon nanotubes can be classified by many different
criteria such as number of walls, conductivity or doping of the carbon lattice.
A good illustration of the most common way to classify CNTs is to describe
single-walled (SWCNTs) and multi-walled carbon nanotubes (MWCNTs) as
one, respectively several, concentrically rolled up graphene sheets. In this
case, the wall structure of a nanotube is a perfect hexagonal carbon honey-
comb lattice. In the multi-walled case, the nanotube is built up by several
walls with an inter-layer spacing corresponding to the layer distance 0.34
nm of graphite [29]. The diameter of CNTs ranges from below one to few to
several tens of nanometer [27, 29, 38, 58]. Additionally, there exist many
other interesting structures such as bamboo-shaped [39, 59] or helical
nanotubes [37, 60-63]. The main reason for the large interest in carbon
nanotubes are their unique properties, such as extreme strength in
combination with low weight or their unique electrical properties which can
range from high conductivity, comparable to the best conducting metals, to
large band-gap semiconductors [58, 64, 65].
6
2.1.2. Carbon nanofibers
Carbon nanofibers (CNFs) and CNTs can be distinguished by two simple
facts. First, carbon nanofibers are not hollow and second they are not built
from well aligned in-fiber-axis aligned carbon sheets. CNFs can be classified
by the arrangement of their building blocks. Platelet, ribbon and fishbone
CNFs have been described; the arrangement and the orientation of the
carbon sheets are perpendicular, tilted by one or by two angles with respect
to the fiber-axis. A fourth case, named amorphous CNFs refers to the case
where the sheets do not have any clear orientation with respect to the fiber
axis [66-73]. The properties of CNFs are generally more graphitic-like
compared to carbon nanotubes. As an example, CNFs never exhibit
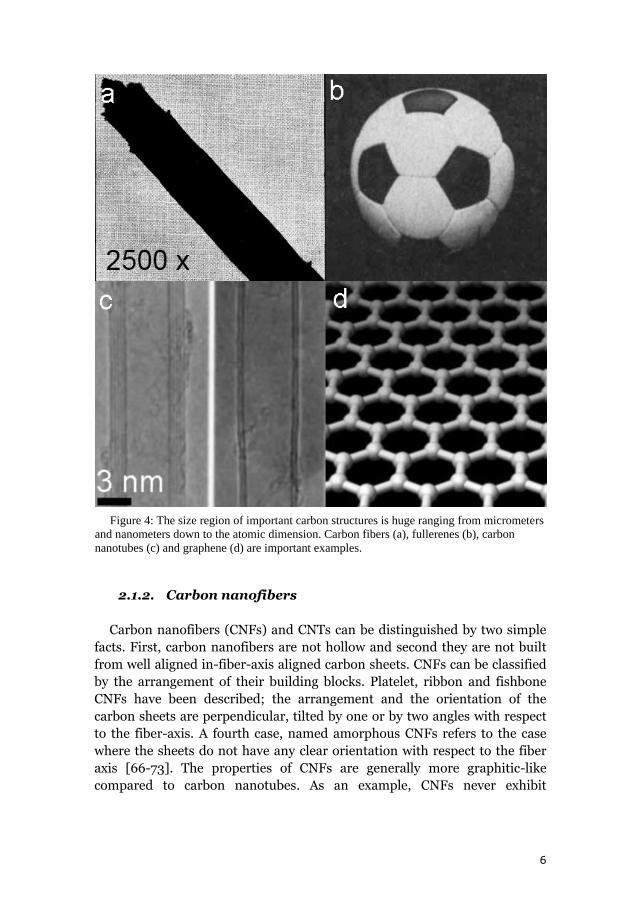
Figure 4: The size region of important carbon structures is huge ranging from micrometers
and nanometers down to the atomic dimension. Carbon fibers (a), fullerenes (b), carbon
nanotubes (c) and graphene (d) are important examples.
7
semiconducting properties, but rather have a relatively high metallic like
conductivity, as the in-plane conductivity in graphite.
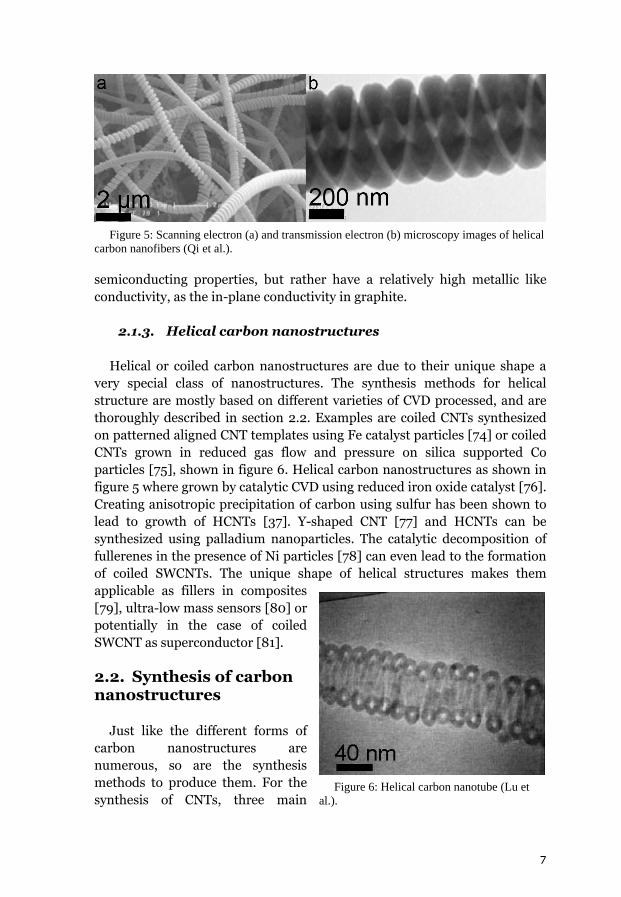
2.1.3. Helical carbon nanostructures
Helical or coiled carbon nanostructures are due to their unique shape a
very special class of nanostructures. The synthesis methods for helical
structure are mostly based on different varieties of CVD processed, and are
thoroughly described in section 2.2. Examples are coiled CNTs synthesized
on patterned aligned CNT templates using Fe catalyst particles [74] or coiled
CNTs grown in reduced gas flow and pressure on silica supported Co
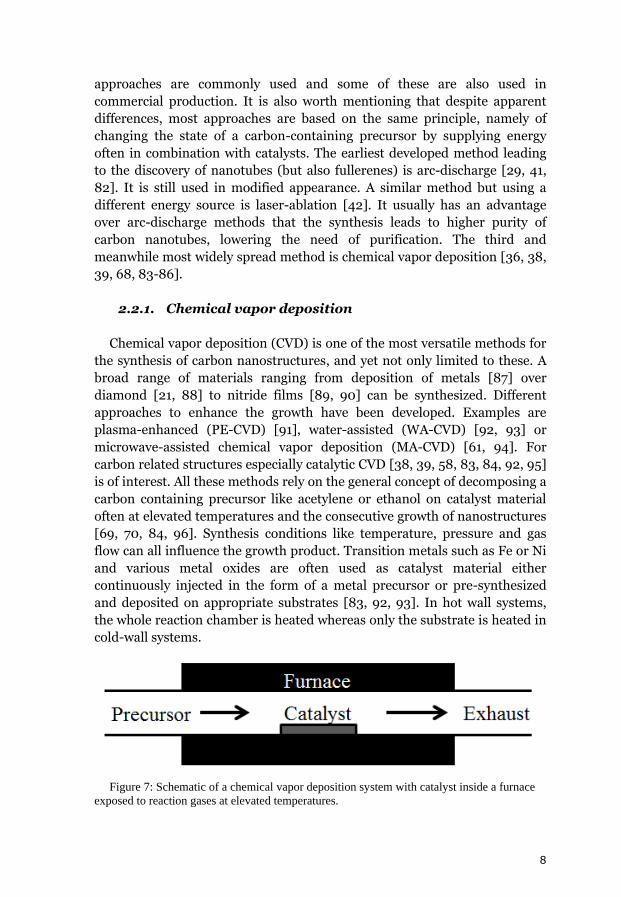
particles [75], shown in figure 6. Helical carbon nanostructures as shown in
figure 5 where grown by catalytic CVD using reduced iron oxide catalyst [76].
Creating anisotropic precipitation of carbon using sulfur has been shown to
lead to growth of HCNTs [37]. Y-shaped CNT [77] and HCNTs can be
synthesized using palladium nanoparticles. The catalytic decomposition of
fullerenes in the presence of Ni particles [78] can even lead to the formation
of coiled SWCNTs. The unique shape of helical structures makes them
applicable as fillers in composites
[79], ultra-low mass sensors [80] or
potentially in the case of coiled
SWCNT as superconductor [81].
2.2. Synthesis of carbon nanostructures
Just like the different forms of
carbon nanostructures are
numerous, so are the synthesis
methods to produce them. For the
synthesis of CNTs, three main
Figure 5: Scanning electron (a) and transmission electron (b) microscopy images of helical
carbon nanofibers (Qi et al.).
Figure 6: Helical carbon nanotube (Lu et
al.).
8
approaches are commonly used and some of these are also used in
commercial production. It is also worth mentioning that despite apparent
differences, most approaches are based on the same principle, namely of
changing the state of a carbon-containing precursor by supplying energy
often in combination with catalysts. The earliest developed method leading
to the discovery of nanotubes (but also fullerenes) is arc-discharge [29, 41,
82]. It is still used in modified appearance. A similar method but using a
different energy source is laser-ablation [42]. It usually has an advantage
over arc-discharge methods that the synthesis leads to higher purity of
carbon nanotubes, lowering the need of purification. The third and
meanwhile most widely spread method is chemical vapor deposition [36, 38,
39, 68, 83-86].
2.2.1. Chemical vapor deposition
Chemical vapor deposition (CVD) is one of the most versatile methods for
the synthesis of carbon nanostructures, and yet not only limited to these. A
broad range of materials ranging from deposition of metals [87] over
diamond [21, 88] to nitride films [89, 90] can be synthesized. Different
approaches to enhance the growth have been developed. Examples are
plasma-enhanced (PE-CVD) [91], water-assisted (WA-CVD) [92, 93] or
microwave-assisted chemical vapor deposition (MA-CVD) [61, 94]. For
carbon related structures especially catalytic CVD [38, 39, 58, 83, 84, 92, 95]
is of interest. All these methods rely on the general concept of decomposing a
carbon containing precursor like acetylene or ethanol on catalyst material
often at elevated temperatures and the consecutive growth of nanostructures
[69, 70, 84, 96]. Synthesis conditions like temperature, pressure and gas
flow can all influence the growth product. Transition metals such as Fe or Ni
and various metal oxides are often used as catalyst material either
continuously injected in the form of a metal precursor or pre-synthesized
and deposited on appropriate substrates [83, 92, 93]. In hot wall systems,
the whole reaction chamber is heated whereas only the substrate is heated in
cold-wall systems.
Figure 7: Schematic of a chemical vapor deposition system with catalyst inside a furnace
exposed to reaction gases at elevated temperatures.
9
2.2.1.1. Choice of
palladium
The choice of catalyst can
influence not only the growth
product but can also be considered
as an impurity in the growth
product. This can introduce
problems both for characterization
and later in the applications. For
example, magnetic impurities can
be problematic in nuclear
resonance measurements or in
transmission electron microscopy.
If used as support in catalysis the CVD catalyst can negatively influence the
performance of the (for the final application) designed catalyst. This often
makes it necessary to purify the CVD growth product by for example acid
treatment [97-100]. However, a 100 % purification is almost impossible and
costs both time and money. The choice of Pd as CVD catalyst can therefore
have many advantages; Pd does not introduce any magnetic impurities, as a
noble metal Pd is also relatively chemically inert, and it is well known to be a
good catalyst for many reactions thereby being ideal for the synthesis of
supports used for catalysis applications like fuel cells.
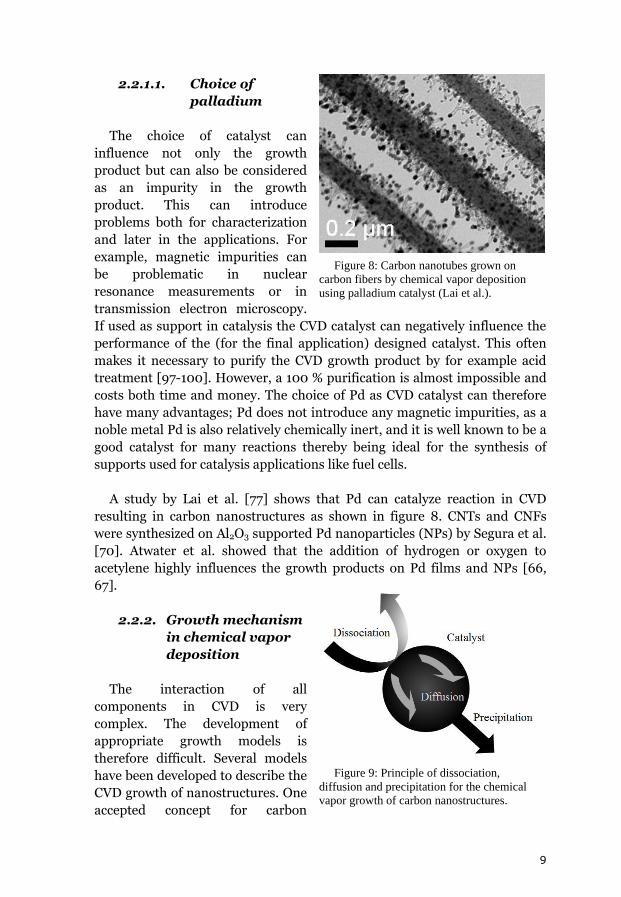
A study by Lai et al. [77] shows that Pd can catalyze reaction in CVD
resulting in carbon nanostructures as shown in figure 8. CNTs and CNFs
were synthesized on Al2O3 supported Pd nanoparticles (NPs) by Segura et al.
[70]. Atwater et al. showed that the addition of hydrogen or oxygen to
acetylene highly influences the growth products on Pd films and NPs [66,
67].
2.2.2. Growth mechanism
in chemical vapor
deposition
The interaction of all
components in CVD is very
complex. The development of
appropriate growth models is
therefore difficult. Several models
have been developed to describe the
CVD growth of nanostructures. One
accepted concept for carbon
Figure 8: Carbon nanotubes grown on
carbon fibers by chemical vapor deposition
using palladium catalyst (Lai et al.).
Figure 9: Principle of dissociation,
diffusion and precipitation for the chemical
vapor growth of carbon nanostructures.
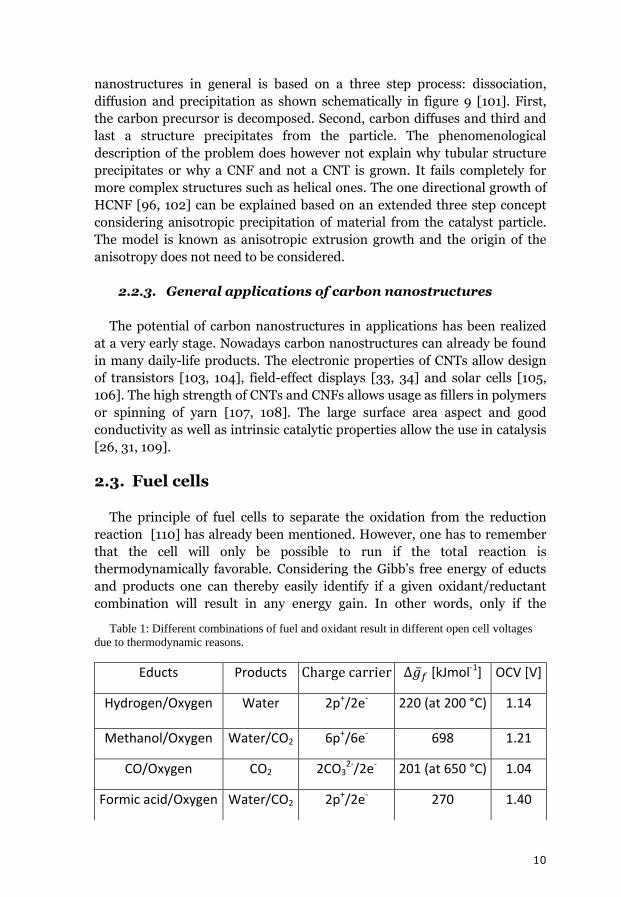
10
nanostructures in general is based on a three step process: dissociation,
diffusion and precipitation as shown schematically in figure 9 [101]. First,
the carbon precursor is decomposed. Second, carbon diffuses and third and
last a structure precipitates from the particle. The phenomenological
description of the problem does however not explain why tubular structure
precipitates or why a CNF and not a CNT is grown. It fails completely for
more complex structures such as helical ones. The one directional growth of
HCNF [96, 102] can be explained based on an extended three step concept
considering anisotropic precipitation of material from the catalyst particle.
The model is known as anisotropic extrusion growth and the origin of the
anisotropy does not need to be considered.
2.2.3. General applications of carbon nanostructures
The potential of carbon nanostructures in applications has been realized
at a very early stage. Nowadays carbon nanostructures can already be found
in many daily-life products. The electronic properties of CNTs allow design
of transistors [103, 104], field-effect displays [33, 34] and solar cells [105,
106]. The high strength of CNTs and CNFs allows usage as fillers in polymers
or spinning of yarn [107, 108]. The large surface area aspect and good
conductivity as well as intrinsic catalytic properties allow the use in catalysis
[26, 31, 109].
2.3. Fuel cells
The principle of fuel cells to separate the oxidation from the reduction
reaction [110] has already been mentioned. However, one has to remember
that the cell will only be possible to run if the total reaction is
thermodynamically favorable. Considering the Gibb’s free energy of educts
and products one can thereby easily identify if a given oxidant/reductant
combination will result in any energy gain. In other words, only if the
Table 1: Different combinations of fuel and oxidant result in different open cell voltages
due to thermodynamic reasons.
Educts Products Charge carrier [kJmol-1] OCV [V]
Hydrogen/Oxygen Water 2p+/2e- 220 (at 200 °C) 1.14
Methanol/Oxygen Water/CO2 6p+/6e- 698 1.21
CO/Oxygen CO2 2CO32-/2e- 201 (at 650 °C) 1.04
Formic acid/Oxygen Water/CO2 2p+/2e- 270 1.40
11
reaction releases energy a potential can build up over the cell. The potential
for a given reaction can then be calculated by:
With E the electromotive force (EMF) or the theoretical open cell voltage (OCV), the difference in Gibbs free energy and number n of involved
electrons times Faraday’s constant F [110]. The OCV therefore depends on
the used fuel. The difference in Gibbs free energy can be measured and
calculated against a reference system like the standard hydrogen electrode
(see also section 4.3.1.) The values for this standard potential E0 for different
half reactions are then given in V and not in for example kJ mol-1. The OCV
can then easily be calculated by the difference between the cells half-
reactions meaning anodic and cathodic reactions [110]. When using tabled
values it needs to be taken into account that half reaction potentials are
usually measured at standard conditions. The values for OCV under different
conditions can therefore differ slightly [110-112]. A summary of different
fuel/oxidant combinations and the resulting OCV is given in table 1.
Many different types of fuel cell have been developed over the years. One
differentiation is the used electrolyte and charge carriers, respectively.
Proton exchange membrane fuel cells (PEMFC), in which the electrolyte is in
solid form, are probably one of the most promising candidates for efficient
energy conversion. In PEMFC protons are conducted through the membrane
and electrons through the load. Alkaline fuel cells (AFC) use OH- ions as
charger conductor through the membrane and the electrolyte is often
delivered with the fuel [110, 113, 114]. Molten carbonate fuel cells (MCFC)
use CO3- as charge exchanging ions [115-117].
The other differentiation is based on the used fuel. The most prominent
fuel is of course hydrogen [118-120], but also other fuels such as methanol
[121-123], ethanol [109, 124, 125] or formic acid (FA) [18, 19, 126-132] are
commonly used. Less frequently used fuels are carbon monoxide and
hydrazine, that finds use in more exotic applications such as space industry
[120, 133]. Abbreviations such as DMFC for direct methanol fuel cell or
DFAFC for direct formic acid fuel cell are very common.
The output power of a fuel cell is defined by many parameters. One of the
most important parameters for the fuel cell efficiency is the over potential
which is the difference between the theoretical potential and the
experimental potential and thereby related to the energy needed to drive the
chemical reactions[110]. Large overpotentials will lead to a reduced OCV and
12
thereby reduced power output. Further decrease in potential are caused by
fuel crossover through the electrolyte, ohmic losses due to resistivity of the
membrane electrode assembly (MEA) and fuel transport related losses [110].
There are different ways to reduce the overpotential and thereby raise the
efficiency of a fuel cell for example by changing pressure or temperature of
the reactants [8, 110]. The performance of a fuel cell system at optimized
conditions can only be improved by improving the choice of catalyst. The
choice of catalyst of course depends on the fuel and only if both half
reactions; oxidation and reduction; run with similar speed and efficiency, a
fuel cell can run efficiently. For hydrogen fuel cells, the cathodic catalyst
platinum nowadays is the limiting factor due to the slow kinetics of the
oxygen reduction reaction (ORR). In the case of liquid fuels as for example
formic acid, the situation is different. The overpotentials of both anodic and
cathodic side of the cell are significant and improved anodic catalysts are
crucial for the development of the technology. Many different catalyst
materials are used, ranging from noble metals [4, 14, 134], metal oxides [115,
135] to purely organic materials [26, 27] or even enzymes and bacteria [136-
139]. The need for reduced overpotentials explains the huge research interest
in new catalyst materials to achieve a better power to cost ratio.
At the early stage of modern fuel cells the catalyst contributed enormously
to the costs. Even though the cost for a fuel cell system has been significantly
reduced in the last decade, the catalyst component in 2007 still contributed
with about 1/3 to the total cost of 94 $/kW for a fuel cell system [2]. One of
the main reasons for the reduced cost of the catalysts is the increase of the
active area by the use of nanocatalysts. It is worth to note that a reduced cost
based on only scientific progress is not the only limiting factor, but also
governed by for example the present patent for Nafion™, used as membrane
material in PEMFCs [2, 3].
For hydrogen driven PEMFC, the developed catalysts are relatively stable,
but some hydrogen fuel cell technologies which utilize hydrogen gas derived
from natural gas suffer from the impurity carbon monoxide (CO), which can
adsorb on Pt-catalyst and thereby act as a severe poison for Pt based
catalysts [140-142]. This poison sensitivity also makes Pt non-feasible for
anodic electrodes in for example DMFC or DFAFC [7, 8, 111]. The fuel and
intermediates strongly deactivate Pt nanoparticles within a very short time.
It has been shown that Pd is a better choice for such reactions [8], but the
stability of those catalysts is still a problem and therefore DFAFC cannot
really compete with hydrogen driven fuel cells in respect to lifetime [7, 19,
25, 127, 143-145]. An increased stability of the catalyst is therefore besides
13
raised activity and lowered cost another very important aspect towards
which research needs to be directed [2].
In the last decade many studies covering different aspects of fuel cells
have been conducted. Some of these, related in broader sense to this thesis,
are the following examples. Ham et al. studied the possibility of replacing Pt
based catalysts for PEM fuel cells and successfully developed a PdNi catalyst
on WC [146]. Rao et al. investigated the influence of particle size on the
activity of carbon supported Pt catalyst for hydrogen oxidation (HOR) and
oxygen reduction reaction (ORR). The study shows that reaction rates are
particle size dependent and that there is an optimum size of 1.8 nm and 3.2
nm for HOR, ORR respectively [147]. Wang et al. managed to deposit Pd
nanoparticles on vertically aligned MWCNTs directly grown on carbon paper
and utilize the composite as electrode in a DFAFC [148]. Interesting is also a
study by Balgis et al. to shorten the total preparation time of fuel cell
electrodes significantly [11]. Kitahara et al presented a potential solution to
the problem of humidification of the PEM by applying hydrophobic and
hydrophilic double layers. [149]. A large amount of work has also been
directed toward fuel cells based on glucose or urea, often described as biofuel
cells. In such a study, Tao et al studied the oxidation of glucose in a fuel cell
by a Si nanowire supported PtNi catalyst [13], while Lan et al. [150]
developed a direct urea fuel cell also capable of running on urine based on a
Ni catalyst.
2.3.1. Direct formic acid fuel cells
The use of formic acid (FA) as fuel has several advantages compared to for
example hydrogen or methanol. The storage of liquid FA is rather simple and
no high-pressure tanks for gases or sophisticated systems such as metal-
hydride storage are needed. As seen in table 1 is the EMF of FA with 1.4 V
higher than for hydrogen or methanol [132]. DFAFC can operate at room
temperature and atmospheric pressure [7, 8, 128, 144]. This makes them
ideal for portable applications such as mobile phones or laptops.
The mechanism of FA oxidation in a fuel cell is split into anodic and
cathodic reaction [8, 132, 151].
Anode: HCOOH CO2 + 2 H+ + 2 e-
Cathode: ½ O2 + 2 H+ + 2 e- H2O
Overall: HCOOH + ½ O2 CO2 + H2O
14
Standard potentials E0 are -0.25 V for the anodic and 1.23 V for the
cathodic reaction versus the standard hydrogen electrode (SHE) summing
up to a OCV of 1.48 V at standard conditions.
It has been shown that the oxidation of FA can proceed in two ways, a
two-step process over carbon monoxide and a direct one to carbon dioxide
by dehydrogenation [8].
Direct: HCOOH CO2 + 2 H+ + 2 e-
Indirect: HCOOH COads + H2O CO2 + 2 H+ + 2 e-
As known from hydrogen fuel cells, CO can be a big problem especially for
Pt based catalysts. Alloying of Pt with for example Pd, Au or Ru can increase
the stability of the catalyst [8, 152-154]. A very good choice as catalyst is Pd
due to its lower cost compared to Pt and its ability to mostly quench the
indirect pathway [5, 6, 8, 132, 144].
As for fuel cells in general also a large number of articles on formic acid
fuel cells have been published in the last years. The approaches mainly focus
on finding new catalysts by improving the support, combining or alloying Pd
nanoparticles with other metals to improve both activity and stability and
finding cheaper and more environmentally friendly synthesis routes.
Graphene-MWCNTs hybrids decorated with Pd nano particles were
synthesized and successful applied for FA oxidation by Yang et. al. [155]. The
ratio of graphene to MWCNTs was here influencing the catalyst activity. As
mentioned is Pt not a very good catalyst for FA oxidation, but nevertheless
Kim et al. [154] managed to significantly improve the stability by changing
the shape into for example Pt nanotubes also doped with Au. Doping and
shaping of the PdAu catalyst particles into flower-like appearance and
supported on graphene resulted in a significant improvement of the catalytic
activity towards FA oxidation in a study by Chai et al. [156]. Ji et al. [129]
instead utilized ordered mesoporous carbon as support. When decorated
with Pt and Pt alloys the mesoporous carbon support showed very high
potential as anodic catalyst in DFAFCs. Electrospun carbon fibers decorated
with PtAu showed good properties for FA oxidation in a study by Huang et
al. [152].
2.3.2. Electrochemical sensing
Any sensor depends on a scalable response of the system on a certain
input. In that sense a fuel cell can also be considered as a potential sensor.
Sensing systems for ethanol used for example in traffic controls have already
15
been commercialized. Generally speaking if a material catalyzes a certain
reaction, it is usually possible to design an electrochemical sensor [137, 157-
160]. Problematic are of course interferences with other substance. A good
example is the ability of Pd to catalyze methanol, ethanol or FA oxidation
resulting in difficulties differing between the sensed substances.
A possibility to increase both selectivity and detection limits are bio-
composites utilizing enzymes catalyzing selectively one substance. A good
example is glucose oxidase which selectively oxidizes glucose [161].
2.4. Decoration of carbon nanostructures
The section will mostly concentrate on aspects of decoration of carbon
nanostructures relevant for this thesis but most is valid also for other
applications connecting carbon nanostructures with catalysis applications.
The need to raise the active surface area of the catalytically active material
is often achieved by decorating different carbon supports with nanoparticles.
The combinations of support-decorating particles are of course immense just
like the number of synthesis methods. However, widely used are wet-
chemistry methods capable of achieving a good decoration both with
homogenous distribution on the support and appropriate nanoparticle size.
Other methods are impregnation followed by reduction in for example
hydrogen or electro deposition.
The usual wet-chemistry approach is to contact a metal precursor or
nanoparticles in solution with the support followed by some further steps
such as reduction or purification. For catalysis application supports such as
ordered mesoporous carbon [88, 129], CNTs [15, 18, 24, 143, 162-164] CNFs
[23, 152, 165-167] and graphene [153, 155, 160, 168-170] have rendered most
attention. The used decorating material depends on the focus of the
application.
For a long time structural stability it is very important to strongly anchor
the nanoparticles on the support. Weakly anchored NPs can be detached
from the support. This can lead to agglomeration of NPs, significantly
lowering the active area. In worst case it can lead to leakage of precious
metal NPs resulting in loss of precious metal. The leakage of noble metal is
not only an issue due to lowered activity of the catalyst but also in respect to
potential recycling of the electrode material to recover the expensive metal
[163].
16
In order to enhance the possibilities for the NPs to adhere strongly on the
support, a functionalization of the support prior to decoration is often
performed. This can however be avoided if the chosen decoration method by
itself results in strong bonding between NPs and support. The necessity for
functionalization also depends on the support. As an example, carbon
nanotubes usually require a functionalization step, since their almost ideal
surface is relatively inert and particles will easily detach and agglomerate at
other sites. Introducing defects into the perfect honeycomb lattice, attaching
functional groups to the support, or a combination of both can in this case
result in appropriate anchoring sites for nanoparticles [31, 153, 156, 162]. It
is also clear that the chemical reactivity of different supports means that the
methods for functionalization will depend on the support. For highly pure
CNTs with well aligned walls it is generally harder to create suitable
anchoring sites than for more disordered structures such as commercial
Vulcan or CNFs. A common method of functionalization of support is to use
oxidizing agents, such as nitric acid or hydrogen peroxides which essentially
create defects and carboxylic groups [97, 171]. Another class of methods
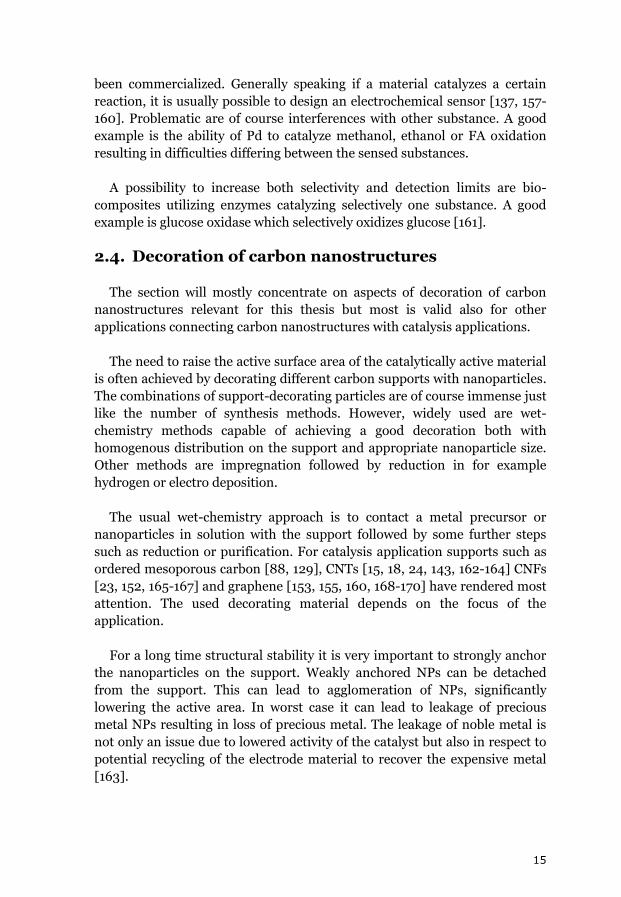
Figure 10: Electron microscopy images of different nanostructures decorated with
nanoparticle. The structures differ in support, metal and particle shape; (a), (c) and (d) multi-
walled carbon nanotubes, and (b) graphene; (a) Pd (Sun et al.), (b) hollow flower-like AuPd
(Chai et al.), (c) PtAu (Huang et al.), and (d) PtRu (Jin et al.).
17
makes use of functional groups such as polymers or small molecules
attached to either support or NPs [31, 172, 173].
The required nanoparticles can be synthesized prior to the actual
decoration and simply attached by a strong interaction between the
nanoparticle, the functional groups and the support. However, it is also
possible and sometimes more efficient to create the nanoparticles directly in
solution with the support. In this approach a metal precursor is mixed in
solution with the support so it can react with the other components to the
final product and attach to the support. In the case of fuel cells the use of
metal salts in combination with different reducing agents is very common.
Compounds such as metal chlorides and acetates are widely used. However,
depending on the used precursor a reduction step is not always necessary.
Organo-metal complexes for example are already in the metal(0) state and
only need to decompose to potentially form nanoparticles.
The wide spectrum of methods for decorating carbon nanostructures and
their applications can be seen by means of the following examples. An
interesting application of a polyol-like method has been done by Wang et al.
[174] to decorate CdS and ZnS quantum dots on graphene. In this case the
application was not aimed for catalysis but for solar cells. An enzyme free
sensing system using a modified polyol method in which water was mixed
with ethylene glycol was developed by Singh et al. [23], where hollow CNFs
were preferentially decorated on the inside of the fibers and not as usually on
the outside. Hussain et al. aimed instead to develop a platform for magnetic
applications by decorating magnetic NiCoFe2O4 NP on CNTs by a micro
emulsion technique [22]. A precursor reduction approach taking advantage
of ultra-sonication for a variety of metals has been developed and reported
by Sun et al. [175] which could both lead to a control of size and loading and
even the synthesis of bi-metallic NPs.
18
3. Synthesis
3.1. Chemical vapor deposition catalyst preparation
The Pd2C60 catalyst was prepared in a wet chemistry process by boiling
tris(dibenzylideneacetone)dipalladium(0) (Pd2dba3) and C60 in toluene[176].
In a common synthesis 98 mg (Pd2dba3) and 77 mg C60 were dissolved
individually in 200 ml toluene each. The solutions were added into a boiling
vessel connected to a condenser. The solution was boiled and stirred for 3
days. The product was washed with toluene and dried. With advancing
experience in the mechanism of the helical carbon nanofiber synthesis and
Pd-fullerides formation [54] the synthesis route was changed. The Pd2C60
catalyst prepared by the wet chemistry method was then replaced. The Pd-
fulleride catalyst was prepared by drop-casting a dispersion/ink of Pd2dba3
and C60 in the ratio 44:56 in toluene followed by annealing at 200°C which
will result in a catalyst with the stoichiometry Pd2C60 (after complete
removal of the ligands) on the CVD substrate.
3.2. Chemical vapor deposition
Carbon nanostructures on Pd-based catalysts were synthesized in a
laboratory CVD setup. The system contained the common components of a
CVD system, i.e a horizontal furnace (ETF 30/12 H-V Entech), a quartz tube
(26 mm inner, 28 mm outer diameter, 800-1000 mm length), adapters, gas
connections and gas flow meter. In addition it was possible to inject liquids
by a syringe pump into the hot zone. In previous studies we have tested the
system with a variety of parameter sets and catalysts [39]. Following gases
were available: ammonia, Ar, Varigon (95% Ar + 5% H2) and acetylene.
3.2.1. Synthesis of different carbon nanostructures
Pd2C60 was dispersed in ethanol (99.8 %) assisted by ultra-sonication until
a thick slurry was achieved. Si wafers (525 µm thickness with 200 nm oxide
layer, Siegert Consulting) were coated with the catalyst ink and dried. The
substrates were transferred into the CVD setup. The procedure was started
by heating the furnace in Ar flow (100 ml/min) to the desired temperature
(550-800 ºC). Three different procedures were studied.
i) After reaching the growth temperature Varigon (75 ml/min) and
acetylene (10 ml/min) were added to the Ar flow (100 ml/min).
ii) When the desired temperature was reached, the substrates were
pretreated with Varigon (75 ml/min), Ar (75 ml/min) and ammonia
(25 ml/min). After 30 min acetylene was added 10 ml/min.
19
iii) Similar to ii) but the growth temperature was always 550 ºC. Growth
time, acetylene flow and water injection were varied.
For (i-ii) 5 mg of Pd2C60 were dispersed in 0.5 ml ethanol, drop casted on
Si wafers (2 x 0.5 cm) and air dried. For half the experiments the substrates
where calcined at 400 ºC on a hot plate in air. The growth time was set to 30
min and the temperature was varied between 550-800 ºC. For both cases
water was added manually into the Varigon flow by evaporation of 0.1 ml
every 5 min injected into a heated glass flask (100º C). Procedure (iii) was
designed to optimize the efficiency of the growth. The amount of catalyst was
varied by drop casting 0.5-1.5 ml of catalyst ink in ethanol (20 mg/ml) onto
heated (50 ºC) Si wafers. Prior to CVD the substrates were calcined at 550 ºC
in air for 2.5 h. The growth time was set between 30-600 min. The injected
amount of water was easier to control by a syringe pump connected to a glass
needle reaching close to the hot zone. The high temperature at the end of the
glass needle ensured a direct evaporation of all injected water. Injection rates
of 0-30 µl/min were tested. The grown samples were cooled independently
of the procedure in Ar (75 ml/min) and Varigon (75 ml/min) for 30 min
followed by cooling in Ar flow. Samples were collected at below 150 ºC
3.2.2. Efficient synthesis of helical carbon nanofibers
The application of HCNFs as catalyst support requires larger amounts of
material than the basic study of CVD growth products. The synthesis
conditions were optimized to the following conditions: 80 min growth time,
flow of gases acetylene, ammonia, Ar and Varigon 25, 25, 75 and 75 ml/min,
respectively, H2O level 4 µl/min. The Pd-fulleride catalyst corresponding to
20 mg of Pd2C60 was prepared with the ink method described earlier.
3.3. Preparation of catalysts
Three different approaches of catalyst preparation for DFAFC are
described in the following. Additionally are two approaches for potential
candidates for fuel cell catalysts presented as well as an approach for a
biosensor. The process can be split into two sub-steps.
1. Functionalization of support or NPs
2. Attachment of Pd nanoparticles
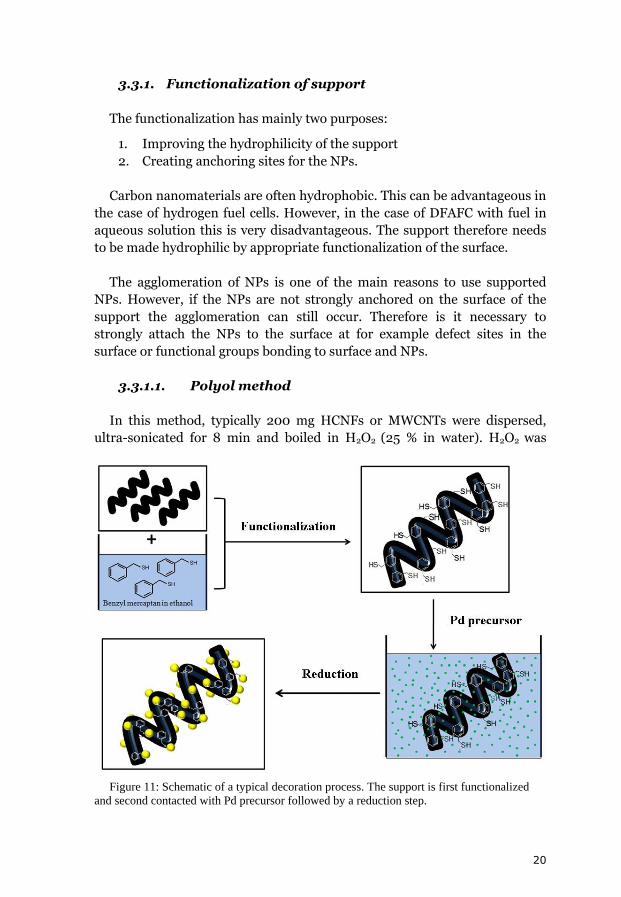
A schematic of the process with functionalization, addition of precursor
and reduction is shown in figure 11 for the case of benzyl-mercaptan.
20
Figure 11: Schematic of a typical decoration process. The support is first functionalized
and second contacted with Pd precursor followed by a reduction step.
3.3.1. Functionalization of support
The functionalization has mainly two purposes:
1. Improving the hydrophilicity of the support
2. Creating anchoring sites for the NPs.
Carbon nanomaterials are often hydrophobic. This can be advantageous in
the case of hydrogen fuel cells. However, in the case of DFAFC with fuel in
aqueous solution this is very disadvantageous. The support therefore needs
to be made hydrophilic by appropriate functionalization of the surface.
The agglomeration of NPs is one of the main reasons to use supported
NPs. However, if the NPs are not strongly anchored on the surface of the
support the agglomeration can still occur. Therefore is it necessary to
strongly attach the NPs to the surface at for example defect sites in the
surface or functional groups bonding to surface and NPs.
3.3.1.1. Polyol method
In this method, typically 200 mg HCNFs or MWCNTs were dispersed,
ultra-sonicated for 8 min and boiled in H2O2 (25 % in water). H2O2 was
21
removed by boiling. Prior to use functionalized HCNFs were dried.
3.3.1.2. Benzyl mercaptan method
HCNFs (20 mg) were functionalized by mixing 20 ml benzyl mercaptan
solution in ethanol at a concentration of 0.5µl/ml and overnight stirring. The
resulting benzyl mercaptan functionalized HCNFs (SH-HCNFs) were washed
and dried.
3.3.1.3. Combined decoration and electrode preparation
Prior to decoration, the support was functionalized in hydrogen peroxide
(H2O2) and nitric acid (HNO3). Carbon black Vulcan (Cabot Corporation)
and high quality HCNFs synthesized as described above were chosen as
support. 250 mg of support was mixed with 62.5 ml deionized water
(H2O(deio)) in a 500 ml glass beaker. Subsequently 62.5 ml HNO3 (65 %) and
125 ml H2O2 (30 %) was added and shortly hand-stirred. The mixture was
ultra-sonicated (60 W, USC300P V) for 7 min and boiled. The resulting
functionalized support was washed and dried.
3.3.2. Anchoring of palladium nanoparticle
3.3.2.1. Polyol method
94 ml of glycol (98.5 %) and 150 mg functionalized HCNFs were mixed by
ultra-sonication and contacted with Pd precursor (1.25 g of 5 wt% PdCl2 in
HCl). The pH was adjusted to 6 by 0.4 M KOH(aq). The dispersion was boiled
at ap. 170 ºC for 30 min. The product was washed with acetone and water.
3.3.2.2. Benzyl mercaptan method
The decoration was achieved by dispersing 20 mg SH-HCNFs in ethanol
by short ultra-sonication and stirring. Hydrazine solution (20 µl, 80 % in
H2O) was added followed by addition of 11.2 mg Pd acetate in ethanol
solution. The washed sample was dried overnight at 100 °C.
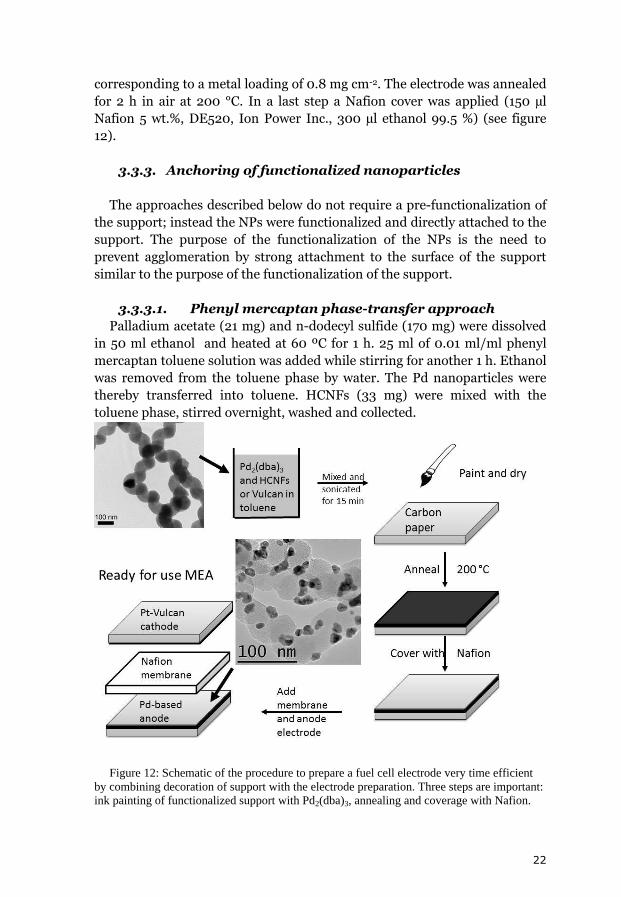
3.3.2.3. Combined decoration and electrode preparation
The combined decoration and electrode preparation is illustrated in figure
12. Functionalized support and Pd2(dba)3 were mixed in a glass bottle to
achieve a 20 wt.% metal loading on support. A paintable ink was prepared by
adding 25 µl/mg (support) of toluene. The mixture was sonicated for 15 min
and the ink was painted on a 5 cm2 torray paper (Sigratec GDL 10 AA, Ion
Power) to achieve a loading of 20 mg of corresponding dry catalyst
22
corresponding to a metal loading of 0.8 mg cm-2. The electrode was annealed
for 2 h in air at 200 °C. In a last step a Nafion cover was applied (150 µl
Nafion 5 wt.%, DE520, Ion Power Inc., 300 µl ethanol 99.5 %) (see figure
12).
3.3.3. Anchoring of functionalized nanoparticles
The approaches described below do not require a pre-functionalization of
the support; instead the NPs were functionalized and directly attached to the
support. The purpose of the functionalization of the NPs is the need to
prevent agglomeration by strong attachment to the surface of the support
similar to the purpose of the functionalization of the support.
3.3.3.1. Phenyl mercaptan phase-transfer approach
Palladium acetate (21 mg) and n-dodecyl sulfide (170 mg) were dissolved
in 50 ml ethanol and heated at 60 ºC for 1 h. 25 ml of 0.01 ml/ml phenyl
mercaptan toluene solution was added while stirring for another 1 h. Ethanol
was removed from the toluene phase by water. The Pd nanoparticles were
thereby transferred into toluene. HCNFs (33 mg) were mixed with the
toluene phase, stirred overnight, washed and collected.
Figure 12: Schematic of the procedure to prepare a fuel cell electrode very time efficient
by combining decoration of support with the electrode preparation. Three steps are important:
ink painting of functionalized support with Pd2(dba)3, annealing and coverage with Nafion.
23
3.3.3.2. Dimethyl sulfoxide approach
Pd NPs were prepared in dimethyl sulfoxide (DMSO) by reduction of 35
mg sodium tetrachlorpalladate by hydrazine. The NPs were functionalized by
addition of 0.25 ml phenyl mercaptan in toluene to the DMSO NP
dispersion. DMSO and unused phenyl mercaptan were removed by water
and ethanol while the functionalized NPs were transferred to the toluene
phase. A decorated support was achieved by mixing 50 mg HCNFs with the
NPs in toluene. The product was filtered and washed .
3.3.3.3. Catalyst for hydrogen peroxide and glucose
detection
HCNFs were mixed with Pd2(dba)3 in a ratio of 1:1 and dispersed in
dimethylformamide (DMF). The dispersion was stirred for 12 h. The product
was filtered and washed. For the sensing of H2O2 and glucose the catalyst
was applied on a glassy carbon electrode, for glucose additionally in
combination with the enzyme glucose oxidase.
24
4. Characterization
4.1. Electron microscopy
4.1.1. Low and high resolution transmission electron
microscopy
The limitation of the human eye has always intrigued researchers and led
to the development of more and more advanced tools to magnify objects.
Glass lenses represent certainly a key invention enabling the design of light
microscopes. And within the use of light lies already the major obstacle that
had to be overcome. Nanotechnology refers to a field in the size regime
below 100 nm and requires resolution far beyond the capability of light
microscopes. An estimate of the minimum distance δ which can be resolved
for a specific wavelength can be given by the Reyleigh criteria (equation 1)
[177].
(1)
With λ the wavelength, µ the refraction index and β the semi-angle of the
lens. This limits the resolution to approximately 300 nm for visible light. The
obvious solution is therefore to decrease the wavelength of the radiation
illuminating the specimen. With the de Broglie formulation of quantum
physics and the particle-wave duality this was possible:
√ ⁄ (2)
Here h is Planck’s constant, p the relativistic momentum, m the rest mass,
v the velocity of the particle and c the speed of light in vacuum. The de
Broglie wavelength (equation 2) manifests, that an electron accelerated over
100 keV corresponds to an electron with a wavelength of 3.7 pm or 0.037 Å.
Using the Rayleigh criteria gives a theoretical resolution limit of 0.02 Å.
However, the resolution of 0.02 Å is by far not possible even in the most
advanced high resolution transmission electron microscope (HRTEM). In
modern microscopes imperfect electro-magnetic lenses are the main
problem leading to a significant astigmatism. The resolution of state of the
art microscopes is limited to about 0.1 nm. The main components are
electron gun, magnetic lenses, goniometer and projection screen/CCD
25
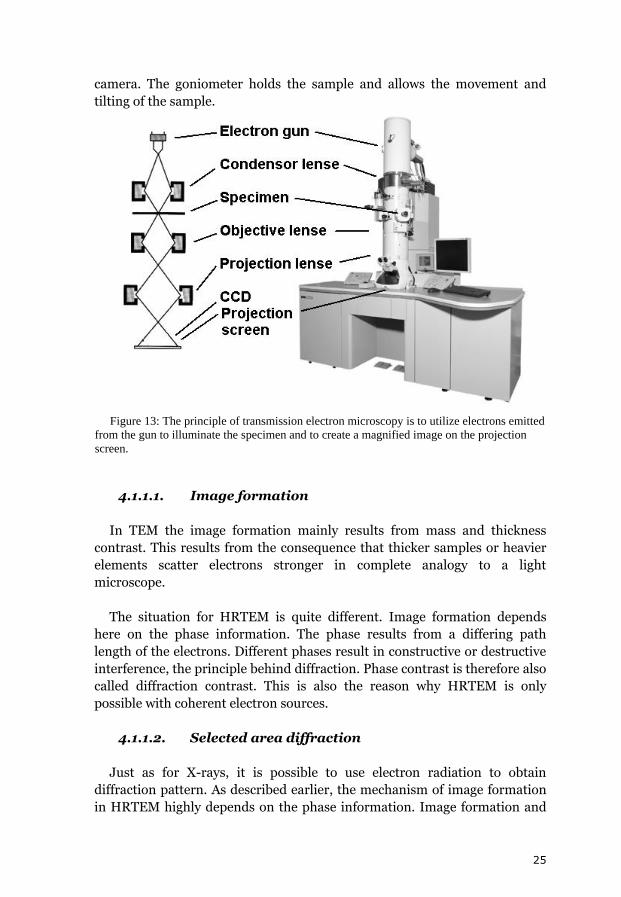
camera. The goniometer holds the sample and allows the movement and
tilting of the sample.
4.1.1.1. Image formation
In TEM the image formation mainly results from mass and thickness
contrast. This results from the consequence that thicker samples or heavier
elements scatter electrons stronger in complete analogy to a light
microscope.
The situation for HRTEM is quite different. Image formation depends
here on the phase information. The phase results from a differing path
length of the electrons. Different phases result in constructive or destructive
interference, the principle behind diffraction. Phase contrast is therefore also
called diffraction contrast. This is also the reason why HRTEM is only
possible with coherent electron sources.
4.1.1.2. Selected area diffraction
Just as for X-rays, it is possible to use electron radiation to obtain
diffraction pattern. As described earlier, the mechanism of image formation
in HRTEM highly depends on the phase information. Image formation and
Figure 13: The principle of transmission electron microscopy is to utilize electrons emitted
from the gun to illuminate the specimen and to create a magnified image on the projection
screen.
26
selected area electron diffraction (SAED) are therefore interdependent. If it
is not possible to obtain HRTEM images of a crystal resolving lattice fringes
no SAED pattern will be obtained. The principle for X-rays is explained in
section 4.2.1. The main advantages over X-ray diffraction (XRD) are that it is
possible to obtain diffraction pattern even from single particles and that no
scanning of angles is necessary.
4.1.1.3. Transmission electron tomography
The concept of tomography is to acquire images of a sample section by
section and to reconstruct 3D information from the image series. Sectioning
can be achieved by tilting or slicing the sample. In TEM tilting of the sample
is a common approach. A common approach is to use markers added to the
sample to obtain reference points in the images to facilitate the
reconstruction. A very common problem is sample drift making it necessary
to continuously adjust sample position and focus. The reconstruction is done
by appropriate software, and usually requires high power computing.
The presented tomograms are single tilt series over an angle range of
about 120° in a JEOL LaB6 2100 at 200 keV using Au marker. The
reconstruction was done by etomo using IMOD.
4.1.2. Scanning electron microscopy
The technology of scanning a sample with a highly focused electron beam
is known as scanning electron microscopy (SEM). A highly focused beam is
scanned over the sample, the scattered electrons are detected and an image
is created pixel by pixel. Usually a SEM can be operated in different scanning
modes such as back-scattered, secondary electron or transmission. The
modes differ mainly in what information the electrons contain. Back-
scattered electrons highly depend on the core number and are therefore
useful to elemental specific images. Secondary electrons are mostly created
at the surface due to ionization and make high-resolution topology
information available. In transmission mode the microscope is operated like
a scanning transmission electron microscope (STEM). Two problems have to
be considered when recording SEM images, i) the large influx of electrons
creates charged areas especially for insulating samples, ii) the long exposure
of an area to a highly focused electron beam creates significant beam
damage.
SEM images were recorded on a Hitachi S-5500 In-lens high resolution
FE-SEM.
27
4.2. Spectroscopy and crystallography
4.2.1. X-ray diffraction
Probing crystalline materials with appropriate radiation, meaning
sufficient short wave length, results in a diffraction pattern originating from
the constructive and destructive interference of the scattered beam. The
interference occurs because of the lattice spacing of crystal planes, specified
by the Miller’s indices (hkl), resulting in a phase difference of the reflected
beam from plane to plane. This idea behind XRD or in general all diffraction
experiments can be well described by Braggs law 2d sinθ = n λ. It is therefore
possible to clearly identify the crystal structure, especially easy in
combination with references and also possible to determine if the catalyst
material contains several phases.
XRD pattern were recorded on a Siemens D5000 at Cu Kα 1.5418 Ǻ.
4.2.2. Raman spectroscopy
Raman spectroscopy is a very useful tool to probe different vibrational
modes of materials. The principle is based on the inelastic scattering of light
originating from the different modes of the material resulting in a slight shift
of the wavelength of the reflected light. The modes can be observed by the
inelastic part of the reflected light which is slightly shifted from the elastic
Rayleigh scattering.
Raman spectra were recorded on a Renishaw inVia using a 514 nm laser.
4.2.3. X-ray photoelectron spectroscopy
When a high energy photon hits a substance it is capable of knocking out
electrons from the atoms. The energy difference between incident photon
and emitted electron is the binding energy of the electron in the atom. Each
atom has a characteristic set of energy levels and can thereby be identified.
However, X-ray photoelectron spectroscopy (XPS) is not only capable of
analyzing elemental distributions in a sample but can also give information
about the binding to surrounding atoms resulting in slight shifts of the
characteristic energy levels.
28
4.3. Electrochemical testing
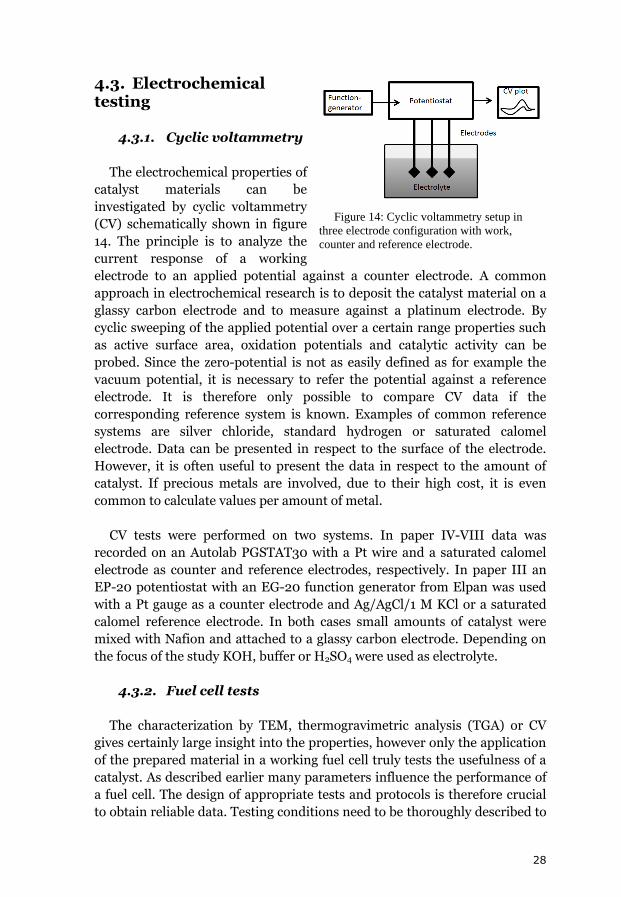
4.3.1. Cyclic voltammetry
The electrochemical properties of
catalyst materials can be
investigated by cyclic voltammetry
(CV) schematically shown in figure
14. The principle is to analyze the
current response of a working
electrode to an applied potential against a counter electrode. A common
approach in electrochemical research is to deposit the catalyst material on a
glassy carbon electrode and to measure against a platinum electrode. By
cyclic sweeping of the applied potential over a certain range properties such
as active surface area, oxidation potentials and catalytic activity can be
probed. Since the zero-potential is not as easily defined as for example the
vacuum potential, it is necessary to refer the potential against a reference
electrode. It is therefore only possible to compare CV data if the
corresponding reference system is known. Examples of common reference
systems are silver chloride, standard hydrogen or saturated calomel
electrode. Data can be presented in respect to the surface of the electrode.
However, it is often useful to present the data in respect to the amount of
catalyst. If precious metals are involved, due to their high cost, it is even
common to calculate values per amount of metal.
CV tests were performed on two systems. In paper IV-VIII data was
recorded on an Autolab PGSTAT30 with a Pt wire and a saturated calomel
electrode as counter and reference electrodes, respectively. In paper III an
EP-20 potentiostat with an EG-20 function generator from Elpan was used
with a Pt gauge as a counter electrode and Ag/AgCl/1 M KCl or a saturated
calomel reference electrode. In both cases small amounts of catalyst were
mixed with Nafion and attached to a glassy carbon electrode. Depending on
the focus of the study KOH, buffer or H2SO4 were used as electrolyte.
4.3.2. Fuel cell tests
The characterization by TEM, thermogravimetric analysis (TGA) or CV
gives certainly large insight into the properties, however only the application
of the prepared material in a working fuel cell truly tests the usefulness of a
catalyst. As described earlier many parameters influence the performance of
a fuel cell. The design of appropriate tests and protocols is therefore crucial
to obtain reliable data. Testing conditions need to be thoroughly described to
Figure 14: Cyclic voltammetry setup in
three electrode configuration with work,
counter and reference electrode.
29
be able to compare results between different studies. Common tests are to
apply a constant or a swept current and to record the response of the output
voltage.
In paper III and IV fuel cell electrodes were prepared similar to the
following: 20 mg of catalyst were mixed with 5 wt% Nafion (Du Pont)
solution. The ink was drop casted on carbon-cloth. The cathode consisted of
standard 60 wt% Pt/Vulcan catalyst at a Pt loading of 4 mg cm-2 and 33 wt%
Nafion on Teflon coated carbon cloth. The membrane electrode assembly
(MEA) was tested at 30 °C, room temperature, respectively using 3 M
aqueous formic acid with a flow of 0.5 ml min-1 and dry O2 at 1 l min-1.
Output voltage as function of applied current was measured.
In paper VII the anode was used as described in section 3.3.2.3. A
commercial 60 wt.% Pt on Vulcan XC-72 (Premetek) catalyst was used as
cathodic electrode. 60 wt.%, 42 mg Pt/Vulcan, 280 µl Nafion 5 wt.% and 700
µl ethanol were mixed by 30 min sonication. The ink was painted on torray
paper (Sigratec GDL 10 AA, Ion Power). Tests were conducted in a 5 cm2
DFAFC at 30 °C cell and fuel temperature. Output voltage as function of
applied current was measured. Based on these results deactivation tests were
conducted at constant current of 700 mA and a flow of 0.7 ml min-1 + 0.7 ml
min-1 A-1 3 M aqueous formic acid and 1 l min-1 dry O2.
4.4. Other methods
4.4.1. Thermogravimetric analysis
Thermogravimetric analysis (TGA) is widely used to identify mass changes
due to temperature. The method is used to characterize catalyst material in
respect to its metal loading. A small amount of sample, usually few mgs are
sufficient, is heated to appropriate temperature and the mass change with
temperature is recorded. Often are TGA setups also capable to record
differential scanning calorimetry (DSC) data at the same time. This data
contains information about the reactions such as oxidation or phase
transitions such as melting, occurring during the heating. In the case of
metal particle decorated carbon support the easiest approach to gain
information about the metal loading is to simply burn it in an oxygen
containing atmosphere. The data needs to be carefully interpreted to
correctly conclude the composition and to exclude artifacts.
The metal loading of the catalysts and the experiments on Pd-fulleride
synthesis were conducted on a Mettler Toledo TGA/DSC 1 LF/948. Pure
oxygen and nitrogen were available as reaction gases. The Pd loading was

30
calculated from the weight loss due to oxidation of carbon assuming a
complete combustion of PdO to Pd above 800 ºC. The calculated value can
be compared and back checked with the weight loss due to PdO
decomposition into Pd.
31
5. Results and discussion
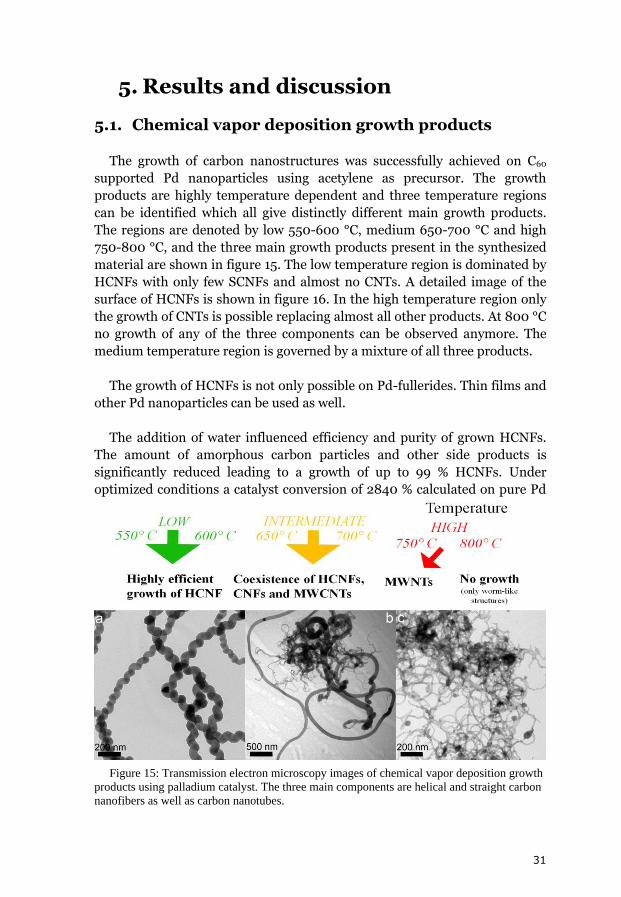
5.1. Chemical vapor deposition growth products
The growth of carbon nanostructures was successfully achieved on C60
supported Pd nanoparticles using acetylene as precursor. The growth
products are highly temperature dependent and three temperature regions
can be identified which all give distinctly different main growth products.
The regions are denoted by low 550-600 °C, medium 650-700 °C and high
750-800 °C, and the three main growth products present in the synthesized
material are shown in figure 15. The low temperature region is dominated by
HCNFs with only few SCNFs and almost no CNTs. A detailed image of the
surface of HCNFs is shown in figure 16. In the high temperature region only
the growth of CNTs is possible replacing almost all other products. At 800 °C
no growth of any of the three components can be observed anymore. The
medium temperature region is governed by a mixture of all three products.
The growth of HCNFs is not only possible on Pd-fullerides. Thin films and
other Pd nanoparticles can be used as well.
The addition of water influenced efficiency and purity of grown HCNFs.
The amount of amorphous carbon particles and other side products is
significantly reduced leading to a growth of up to 99 % HCNFs. Under
optimized conditions a catalyst conversion of 2840 % calculated on pure Pd
Figure 15: Transmission electron microscopy images of chemical vapor deposition growth
products using palladium catalyst. The three main components are helical and straight carbon
nanofibers as well as carbon nanotubes.
32
was achieved. It should be mentioned that the addition of water becomes
obsolete in respect to efficiency in a recently designed CVD system with a
much longer hot zone. The results are similar to a study by Atwater et al. [66,
67] who showed that the addition of oxygen or hydrogen to the precursor is a
prerequisite for the growth of carbon fibers at temperature as low as 550 °C.
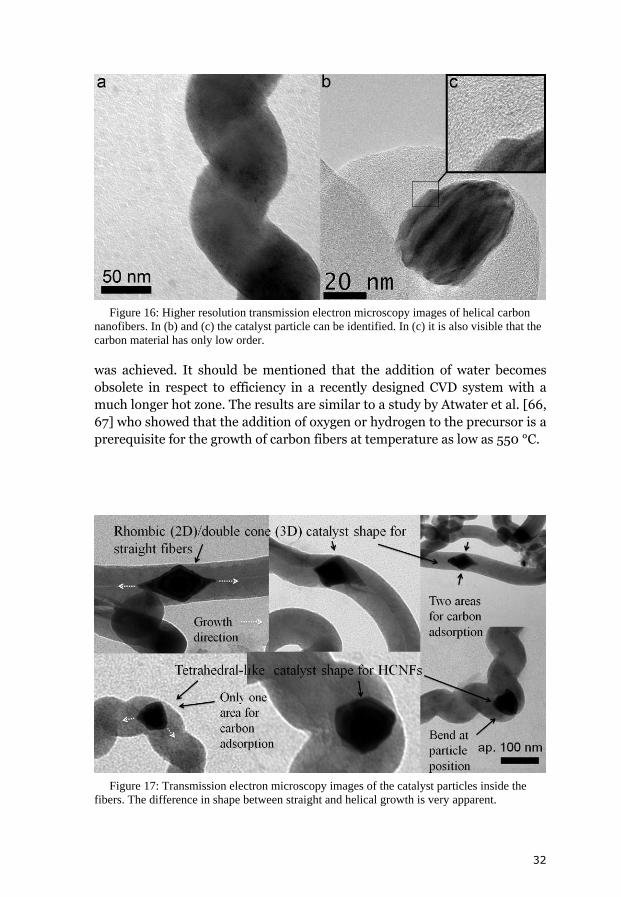
Figure 16: Higher resolution transmission electron microscopy images of helical carbon
nanofibers. In (b) and (c) the catalyst particle can be identified. In (c) it is also visible that the
carbon material has only low order.
Figure 17: Transmission electron microscopy images of the catalyst particles inside the
fibers. The difference in shape between straight and helical growth is very apparent.
33
5.1.1. Growth model of helical carbon nanofibers
In our studies we have consistently observed that the catalyst particle
always is placed symmetrically in the middle of the fiber, suggesting that the
growth occurs in both directions with a similar speed. The difference in
particle shape for HCNFs and SCNFs is very significant. Further analysis;
especially in respect to the incorporated Pd particles builds the basis of a
growth model. The model is based on the anisotropic extrusion model
introduced by Motojima [96, 102, 178, 179] but allowing growth in both two
directions. Images of HCNFs are shown in figure 16. In figure 16 c it is visible
that the carbon lattice is not perfectly aligned but partly aligned parallel to
the Pd particles surface.
From normal TEM it can be concluded that the particles in HCNFs are
more a distorted half-sphere almost tetrahedral-like whereas they are an
almost perfect symmetric double cone in SCNFs. The double cone particle
shape has been observed earlier [66, 67]. Particle shapes are shown in figure
17. The images suggest that helical growth results from an anisotropy
produced by only one carbon uptake area on the particle. The anisotropy also
results in a bend of the fiber at the particle. In the case of straight growth the
adsorption is symmetrical around the circumference of the double cone base.
However, there is a very close relation between HCNFs and SCNFs.
Transitions from helical to straight growth can be observed. The transition
occurs very fast over a few nm, with a bend of the fiber of 90° and usually
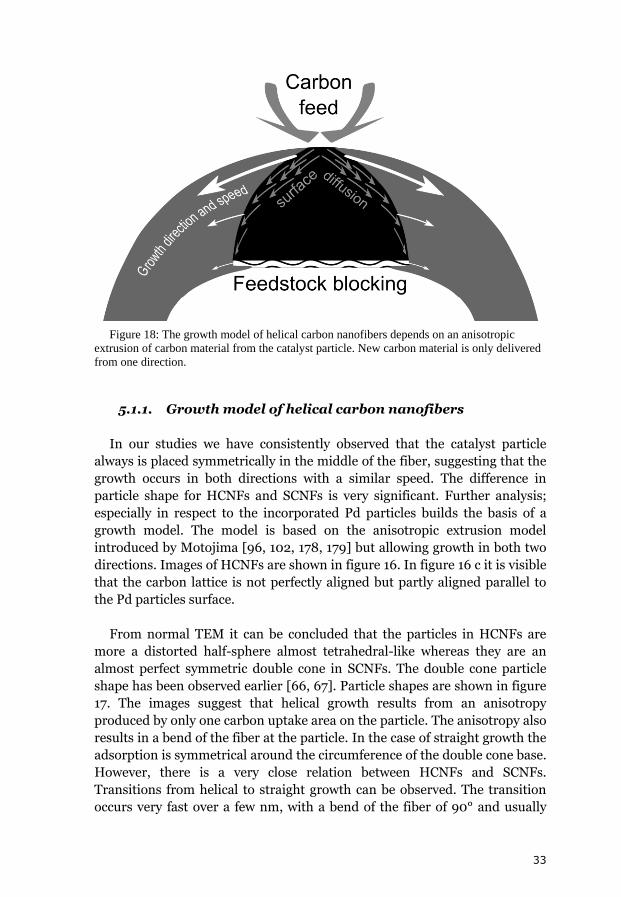
Figure 18: The growth model of helical carbon nanofibers depends on an anisotropic
extrusion of carbon material from the catalyst particle. New carbon material is only delivered
from one direction.
34
only from helical to straight growth. If such a transition occurs the particle
reshapes into a double cone and the anisotropy is removed. A schematic of
the idea is shown in figure 18. The origin of the feedstock blocking is not
clear but it is plausible to assume a partial coverage of the particle with
carbon during the initial phase of the CVD process. The model does not
depend on rotation of the particle but rather on reshaping of the particle by
the extrusion of carbon itself.
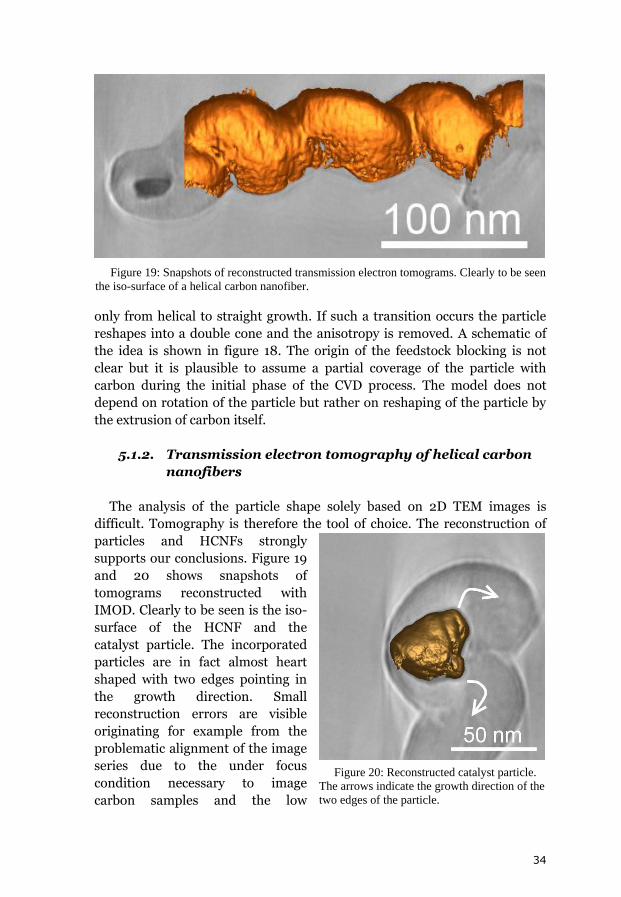
5.1.2. Transmission electron tomography of helical carbon
nanofibers
The analysis of the particle shape solely based on 2D TEM images is
difficult. Tomography is therefore the tool of choice. The reconstruction of
particles and HCNFs strongly
supports our conclusions. Figure 19
and 20 shows snapshots of
tomograms reconstructed with
IMOD. Clearly to be seen is the iso-
surface of the HCNF and the
catalyst particle. The incorporated
particles are in fact almost heart
shaped with two edges pointing in
the growth direction. Small
reconstruction errors are visible
originating for example from the
problematic alignment of the image
series due to the under focus
condition necessary to image
carbon samples and the low
Figure 19: Snapshots of reconstructed transmission electron tomograms. Clearly to be seen
the iso-surface of a helical carbon nanofiber.
Figure 20: Reconstructed catalyst particle.
The arrows indicate the growth direction of the
two edges of the particle.
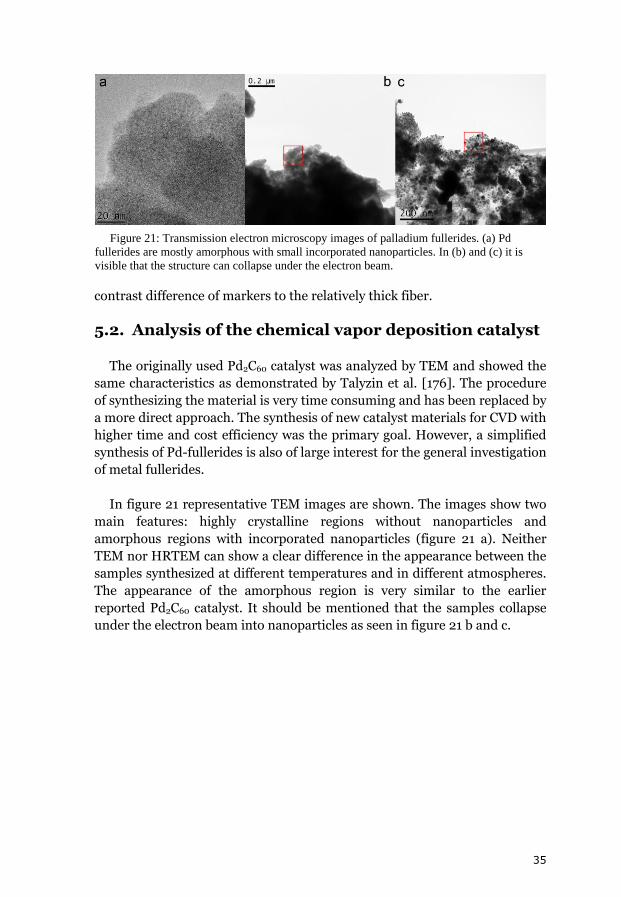
35
contrast difference of markers to the relatively thick fiber.
5.2. Analysis of the chemical vapor deposition catalyst
The originally used Pd2C60 catalyst was analyzed by TEM and showed the
same characteristics as demonstrated by Talyzin et al. [176]. The procedure
of synthesizing the material is very time consuming and has been replaced by
a more direct approach. The synthesis of new catalyst materials for CVD with
higher time and cost efficiency was the primary goal. However, a simplified
synthesis of Pd-fullerides is also of large interest for the general investigation
of metal fullerides.
In figure 21 representative TEM images are shown. The images show two
main features: highly crystalline regions without nanoparticles and
amorphous regions with incorporated nanoparticles (figure 21 a). Neither
TEM nor HRTEM can show a clear difference in the appearance between the
samples synthesized at different temperatures and in different atmospheres.
The appearance of the amorphous region is very similar to the earlier
reported Pd2C60 catalyst. It should be mentioned that the samples collapse
under the electron beam into nanoparticles as seen in figure 21 b and c.
Figure 21: Transmission electron microscopy images of palladium fullerides. (a) Pd
fullerides are mostly amorphous with small incorporated nanoparticles. In (b) and (c) it is
visible that the structure can collapse under the electron beam.
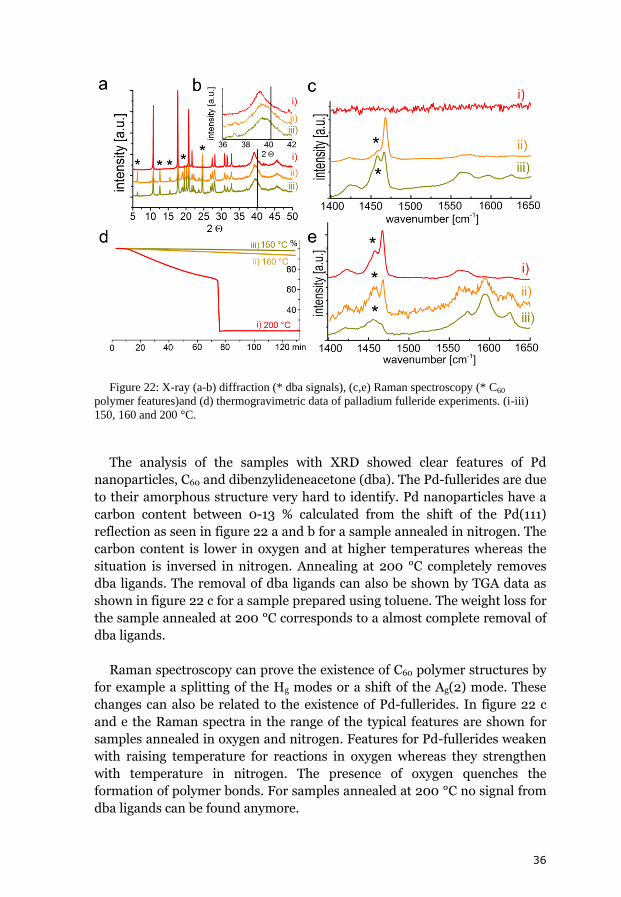
36
The analysis of the samples with XRD showed clear features of Pd
nanoparticles, C60 and dibenzylideneacetone (dba). The Pd-fullerides are due
to their amorphous structure very hard to identify. Pd nanoparticles have a
carbon content between 0-13 % calculated from the shift of the Pd(111)
reflection as seen in figure 22 a and b for a sample annealed in nitrogen. The
carbon content is lower in oxygen and at higher temperatures whereas the
situation is inversed in nitrogen. Annealing at 200 °C completely removes
dba ligands. The removal of dba ligands can also be shown by TGA data as
shown in figure 22 c for a sample prepared using toluene. The weight loss for
the sample annealed at 200 °C corresponds to a almost complete removal of
dba ligands.
Raman spectroscopy can prove the existence of C60 polymer structures by
for example a splitting of the Hg modes or a shift of the Ag(2) mode. These
changes can also be related to the existence of Pd-fullerides. In figure 22 c
and e the Raman spectra in the range of the typical features are shown for
samples annealed in oxygen and nitrogen. Features for Pd-fullerides weaken
with raising temperature for reactions in oxygen whereas they strengthen
with temperature in nitrogen. The presence of oxygen quenches the
formation of polymer bonds. For samples annealed at 200 °C no signal from
dba ligands can be found anymore.
Figure 22: X-ray (a-b) diffraction (* dba signals), (c,e) Raman spectroscopy (* C60
polymer features)and (d) thermogravimetric data of palladium fulleride experiments. (i-iii)
150, 160 and 200 °C.
37
The material synthesized using toluene was applied by drop casting on Si
wafer and annealed at 200 °C. When using these films as CVD catalyst they
showed identical results to the results for CVD growth of HCNFs at 550 °C
described earlier in section 5.1.
5.3. Decorated helical carbon nanofibers
The choice of HCNFs as support for electro-catalysts can have several
advantages over standard supports such as Vulcan. The fiber character in
combination with good conductivity and high surface area are the main
reasons. Compared to CNTs they are easier to functionalize due to an already
relative defective surface with imperfectly aligned carbon sheets. The
Figure 23: Transmission electron microscopy images of functionalized (a) and decorated
(b-c) helical carbon nanofibers prepared using the polyol approach. The particles are highly
crystalline and attach preferentially along the screw axis.
38
decoration was achieved using
several approaches and was
significantly improved during
progress of the study. A summary of
metal loading and size of decorating
NPs can be found in table 2.
5.3.1. Polyol method
The Polyol method is widely used
for the decoration of carbon
supports. It relies on the reducing
ability of glycol which is also the
reaction medium. It was
successfully applied to decorate
HCNFs. In figure 23 TEM images of
the samples are presented. The
introduction of defects on the surface of the fiber by H2O2 can clearly be seen
in figure 23 a compared to for example figure 15 a or 16 a. The original quite
hydrophobic HCNFs were now easily dispersed in H2O. The particles are
mostly attached at the screw-axis probably due to good anchoring sites. The
NPs have an average diameter of 15 nm, and the HRTEM image in figure 23
d reveals a high crystallinity. The lattice parameter is slightly increased due
to the presence of a PdC phase. A SAED pattern can be found in figure 24.
5.3.2. Structural improvement of the composites
The decoration of the HCNFs using the polyol approach is by far not
comparable in performance with other studies. The particle distribution is
not good and the size is too large. Additionally are the samples not
homogeneous. Therefore it was necessary to improve the decoration process.
Figure 24: Selected area electron diffraction
pattern of decorated helical carbon nanofibers
prepared by the polyol method.
39
5.3.2.1. Benzyl mercaptan method
A different approach for functionalization of the surface of HCNFs by
benzyl mercaptan also resulted in more hydrophilic HCNFs. The decoration
and homogeneity of the samples was significantly improved. The particle size
was reduced by a factor of 3 to an average diameter of 5 nm what is
comparable to the commercial catalyst Pd on Vulcan. Figure 25 shows the
clear difference to the polyol method. The particles were highly crystalline
and no signs of carbon in the decorating particles can be found by XRD. XPS
can find small traces of sulfur originating from benzyl mercaptan.
Figure 25: Improved decoration of helical carbon nanofibers revealed by transmission
electron microscopy. The particle size and distribution is significantly improved compared to
the polyol method.
Figure 26: Transmission electron microscopy images of amorphous palladium
nanoparticles homogenously distributed on helical carbon nanofibers synthesized using the
phenyl mercaptan phase-transfer approach.
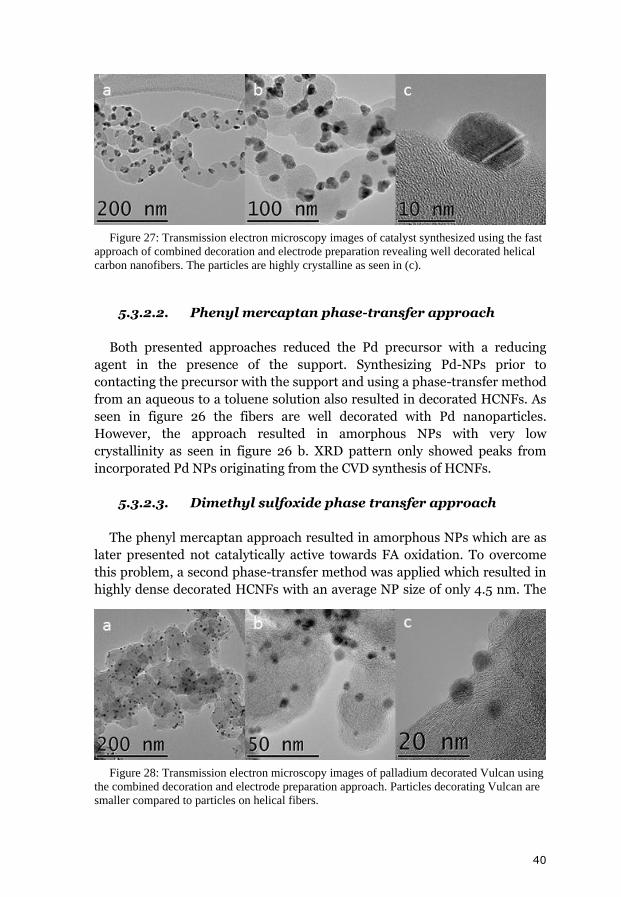
40
5.3.2.2. Phenyl mercaptan phase-transfer approach
Both presented approaches reduced the Pd precursor with a reducing
agent in the presence of the support. Synthesizing Pd-NPs prior to
contacting the precursor with the support and using a phase-transfer method
from an aqueous to a toluene solution also resulted in decorated HCNFs. As
seen in figure 26 the fibers are well decorated with Pd nanoparticles.
However, the approach resulted in amorphous NPs with very low
crystallinity as seen in figure 26 b. XRD pattern only showed peaks from
incorporated Pd NPs originating from the CVD synthesis of HCNFs.
5.3.2.3. Dimethyl sulfoxide phase transfer approach
The phenyl mercaptan approach resulted in amorphous NPs which are as
later presented not catalytically active towards FA oxidation. To overcome
this problem, a second phase-transfer method was applied which resulted in
highly dense decorated HCNFs with an average NP size of only 4.5 nm. The
Figure 27: Transmission electron microscopy images of catalyst synthesized using the fast
approach of combined decoration and electrode preparation revealing well decorated helical
carbon nanofibers. The particles are highly crystalline as seen in (c).
Figure 28: Transmission electron microscopy images of palladium decorated Vulcan using
the combined decoration and electrode preparation approach. Particles decorating Vulcan are
smaller compared to particles on helical fibers.
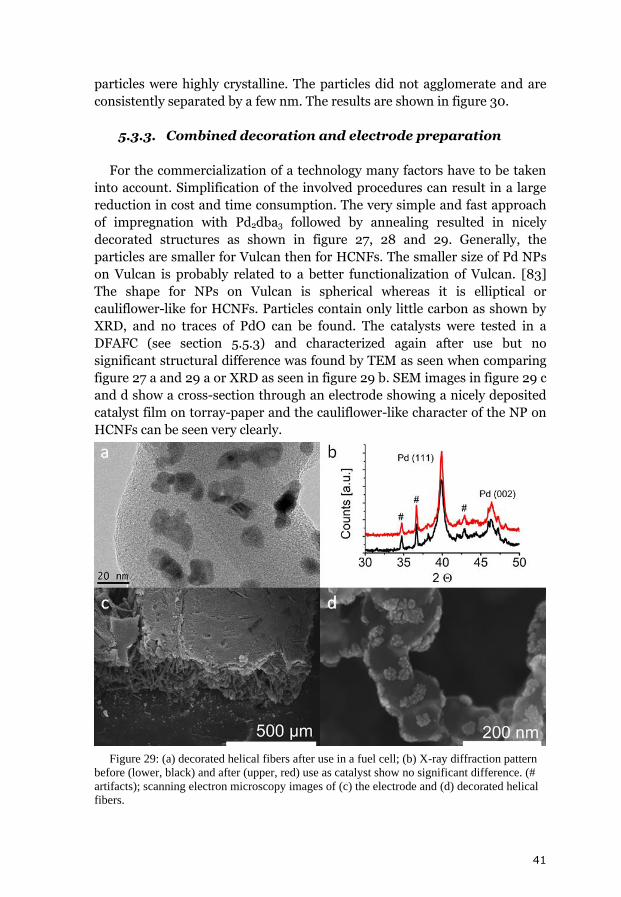
41
particles were highly crystalline. The particles did not agglomerate and are
consistently separated by a few nm. The results are shown in figure 30.
5.3.3. Combined decoration and electrode preparation
For the commercialization of a technology many factors have to be taken
into account. Simplification of the involved procedures can result in a large
reduction in cost and time consumption. The very simple and fast approach
of impregnation with Pd2dba3 followed by annealing resulted in nicely
decorated structures as shown in figure 27, 28 and 29. Generally, the
particles are smaller for Vulcan then for HCNFs. The smaller size of Pd NPs
on Vulcan is probably related to a better functionalization of Vulcan. [83]
The shape for NPs on Vulcan is spherical whereas it is elliptical or
cauliflower-like for HCNFs. Particles contain only little carbon as shown by
XRD, and no traces of PdO can be found. The catalysts were tested in a
DFAFC (see section 5.5.3) and characterized again after use but no
significant structural difference was found by TEM as seen when comparing
figure 27 a and 29 a or XRD as seen in figure 29 b. SEM images in figure 29 c
and d show a cross-section through an electrode showing a nicely deposited
catalyst film on torray-paper and the cauliflower-like character of the NP on
HCNFs can be seen very clearly.
Figure 29: (a) decorated helical fibers after use in a fuel cell; (b) X-ray diffraction pattern
before (lower, black) and after (upper, red) use as catalyst show no significant difference. (#
artifacts); scanning electron microscopy images of (c) the electrode and (d) decorated helical
fibers.
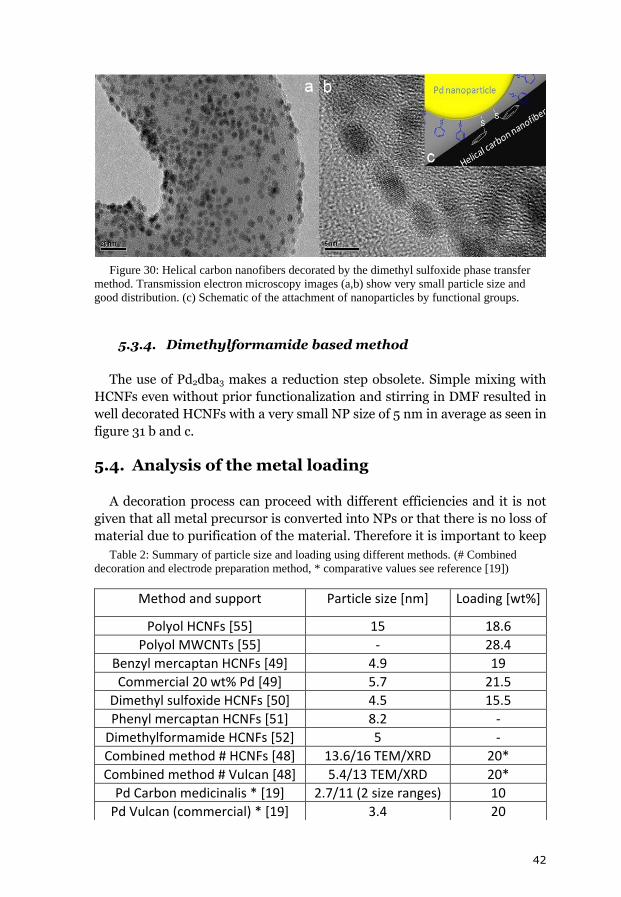
42
5.3.4. Dimethylformamide based method
The use of Pd2dba3 makes a reduction step obsolete. Simple mixing with
HCNFs even without prior functionalization and stirring in DMF resulted in
well decorated HCNFs with a very small NP size of 5 nm in average as seen in
figure 31 b and c.
5.4. Analysis of the metal loading
A decoration process can proceed with different efficiencies and it is not
given that all metal precursor is converted into NPs or that there is no loss of
material due to purification of the material. Therefore it is important to keep
Table 2: Summary of particle size and loading using different methods. (# Combined
decoration and electrode preparation method, * comparative values see reference [19])
Method and support Particle size [nm] Loading [wt%]
Polyol HCNFs [55] 15 18.6
Polyol MWCNTs [55] - 28.4
Benzyl mercaptan HCNFs [49] 4.9 19
Commercial 20 wt% Pd [49] 5.7 21.5
Dimethyl sulfoxide HCNFs [50] 4.5 15.5
Phenyl mercaptan HCNFs [51] 8.2 -
Dimethylformamide HCNFs [52] 5 -
Combined method # HCNFs [48] 13.6/16 TEM/XRD 20*
Combined method # Vulcan [48] 5.4/13 TEM/XRD 20*
Pd Carbon medicinalis * [19] 2.7/11 (2 size ranges) 10
Pd Vulcan (commercial) * [19] 3.4 20
Figure 30: Helical carbon nanofibers decorated by the dimethyl sulfoxide phase transfer
method. Transmission electron microscopy images (a,b) show very small particle size and
good distribution. (c) Schematic of the attachment of nanoparticles by functional groups.
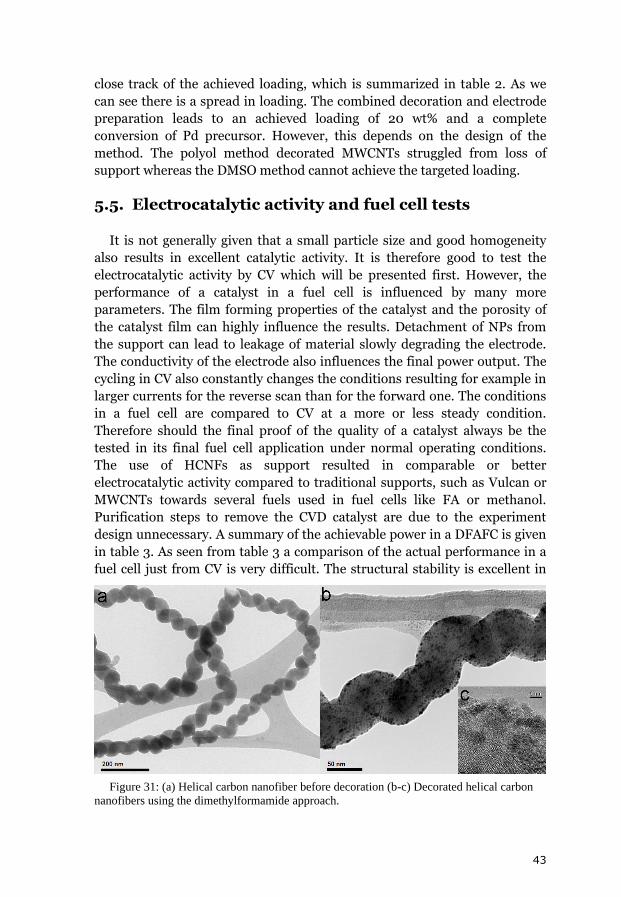
43
close track of the achieved loading, which is summarized in table 2. As we
can see there is a spread in loading. The combined decoration and electrode
preparation leads to an achieved loading of 20 wt% and a complete
conversion of Pd precursor. However, this depends on the design of the
method. The polyol method decorated MWCNTs struggled from loss of
support whereas the DMSO method cannot achieve the targeted loading.
5.5. Electrocatalytic activity and fuel cell tests
It is not generally given that a small particle size and good homogeneity
also results in excellent catalytic activity. It is therefore good to test the
electrocatalytic activity by CV which will be presented first. However, the
performance of a catalyst in a fuel cell is influenced by many more
parameters. The film forming properties of the catalyst and the porosity of
the catalyst film can highly influence the results. Detachment of NPs from
the support can lead to leakage of material slowly degrading the electrode.
The conductivity of the electrode also influences the final power output. The
cycling in CV also constantly changes the conditions resulting for example in
larger currents for the reverse scan than for the forward one. The conditions
in a fuel cell are compared to CV at a more or less steady condition.
Therefore should the final proof of the quality of a catalyst always be the
tested in its final fuel cell application under normal operating conditions.
The use of HCNFs as support resulted in comparable or better
electrocatalytic activity compared to traditional supports, such as Vulcan or
MWCNTs towards several fuels used in fuel cells like FA or methanol.
Purification steps to remove the CVD catalyst are due to the experiment
design unnecessary. A summary of the achievable power in a DFAFC is given
in table 3. As seen from table 3 a comparison of the actual performance in a
fuel cell just from CV is very difficult. The structural stability is excellent in
Figure 31: (a) Helical carbon nanofiber before decoration (b-c) Decorated helical carbon
nanofibers using the dimethylformamide approach.
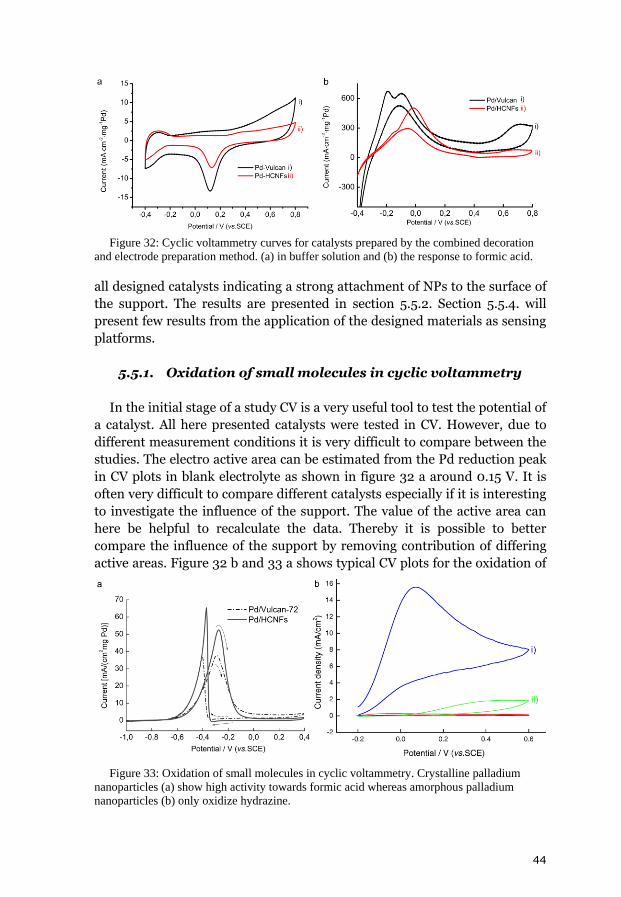
44
all designed catalysts indicating a strong attachment of NPs to the surface of
the support. The results are presented in section 5.5.2. Section 5.5.4. will
present few results from the application of the designed materials as sensing
platforms.
5.5.1. Oxidation of small molecules in cyclic voltammetry
In the initial stage of a study CV is a very useful tool to test the potential of
a catalyst. All here presented catalysts were tested in CV. However, due to
different measurement conditions it is very difficult to compare between the
studies. The electro active area can be estimated from the Pd reduction peak
in CV plots in blank electrolyte as shown in figure 32 a around 0.15 V. It is
often very difficult to compare different catalysts especially if it is interesting
to investigate the influence of the support. The value of the active area can
here be helpful to recalculate the data. Thereby it is possible to better
compare the influence of the support by removing contribution of differing
active areas. Figure 32 b and 33 a shows typical CV plots for the oxidation of
Figure 32: Cyclic voltammetry curves for catalysts prepared by the combined decoration
and electrode preparation method. (a) in buffer solution and (b) the response to formic acid.
Figure 33: Oxidation of small molecules in cyclic voltammetry. Crystalline palladium
nanoparticles (a) show high activity towards formic acid whereas amorphous palladium
nanoparticles (b) only oxidize hydrazine.
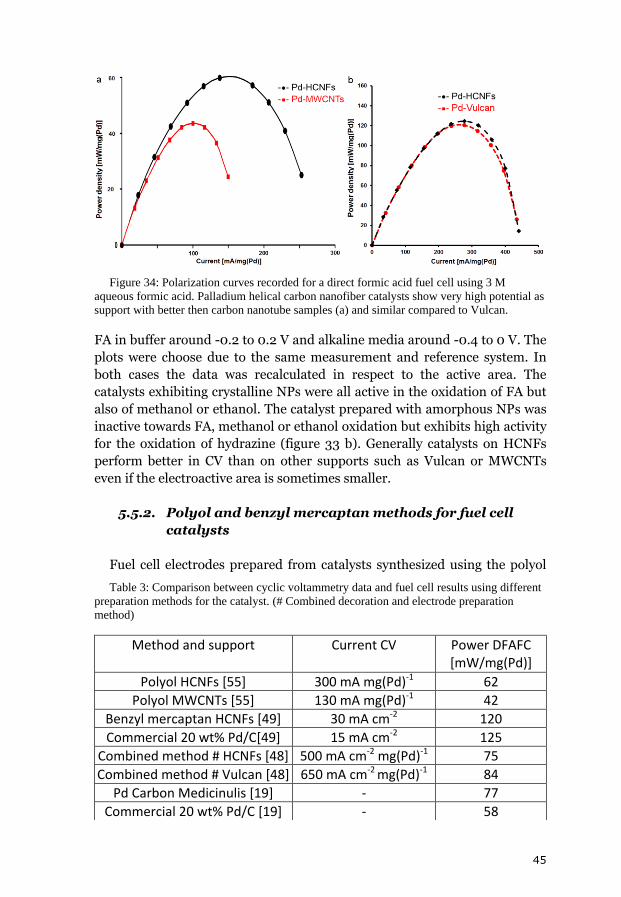
45
FA in buffer around -0.2 to 0.2 V and alkaline media around -0.4 to 0 V. The
plots were choose due to the same measurement and reference system. In
both cases the data was recalculated in respect to the active area. The
catalysts exhibiting crystalline NPs were all active in the oxidation of FA but
also of methanol or ethanol. The catalyst prepared with amorphous NPs was
inactive towards FA, methanol or ethanol oxidation but exhibits high activity
for the oxidation of hydrazine (figure 33 b). Generally catalysts on HCNFs
perform better in CV than on other supports such as Vulcan or MWCNTs
even if the electroactive area is sometimes smaller.
5.5.2. Polyol and benzyl mercaptan methods for fuel cell
catalysts
Fuel cell electrodes prepared from catalysts synthesized using the polyol
Table 3: Comparison between cyclic voltammetry data and fuel cell results using different
preparation methods for the catalyst. (# Combined decoration and electrode preparation
method)
Method and support Current CV Power DFAFC [mW/mg(Pd)]
Polyol HCNFs [55] 300 mA mg(Pd)-1 62
Polyol MWCNTs [55] 130 mA mg(Pd)-1 42
Benzyl mercaptan HCNFs [49] 30 mA cm-2 120
Commercial 20 wt% Pd/C[49] 15 mA cm-2 125
Combined method # HCNFs [48] 500 mA cm-2 mg(Pd)-1 75
Combined method # Vulcan [48] 650 mA cm-2 mg(Pd)-1 84
Pd Carbon Medicinulis [19] - 77
Commercial 20 wt% Pd/C [19] - 58
Figure 34: Polarization curves recorded for a direct formic acid fuel cell using 3 M
aqueous formic acid. Palladium helical carbon nanofiber catalysts show very high potential as
support with better then carbon nanotube samples (a) and similar compared to Vulcan.
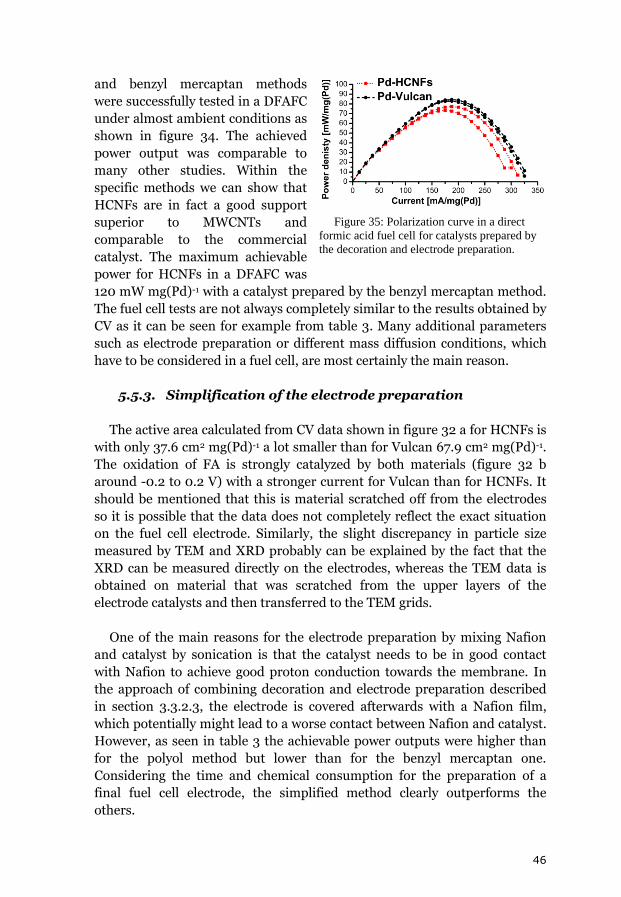
46
and benzyl mercaptan methods
were successfully tested in a DFAFC
under almost ambient conditions as
shown in figure 34. The achieved
power output was comparable to
many other studies. Within the
specific methods we can show that
HCNFs are in fact a good support
superior to MWCNTs and
comparable to the commercial
catalyst. The maximum achievable
power for HCNFs in a DFAFC was
120 mW mg(Pd)-1 with a catalyst prepared by the benzyl mercaptan method.
The fuel cell tests are not always completely similar to the results obtained by
CV as it can be seen for example from table 3. Many additional parameters
such as electrode preparation or different mass diffusion conditions, which
have to be considered in a fuel cell, are most certainly the main reason.
5.5.3. Simplification of the electrode preparation
The active area calculated from CV data shown in figure 32 a for HCNFs is
with only 37.6 cm2 mg(Pd)-1 a lot smaller than for Vulcan 67.9 cm2 mg(Pd)-1.
The oxidation of FA is strongly catalyzed by both materials (figure 32 b
around -0.2 to 0.2 V) with a stronger current for Vulcan than for HCNFs. It
should be mentioned that this is material scratched off from the electrodes
so it is possible that the data does not completely reflect the exact situation
on the fuel cell electrode. Similarly, the slight discrepancy in particle size
measured by TEM and XRD probably can be explained by the fact that the
XRD can be measured directly on the electrodes, whereas the TEM data is
obtained on material that was scratched from the upper layers of the
electrode catalysts and then transferred to the TEM grids.
One of the main reasons for the electrode preparation by mixing Nafion
and catalyst by sonication is that the catalyst needs to be in good contact
with Nafion to achieve good proton conduction towards the membrane. In
the approach of combining decoration and electrode preparation described
in section 3.3.2.3, the electrode is covered afterwards with a Nafion film,
which potentially might lead to a worse contact between Nafion and catalyst.
However, as seen in table 3 the achievable power outputs were higher than
for the polyol method but lower than for the benzyl mercaptan one.
Considering the time and chemical consumption for the preparation of a
final fuel cell electrode, the simplified method clearly outperforms the
others.
Figure 35: Polarization curve in a direct
formic acid fuel cell for catalysts prepared by
the decoration and electrode preparation.
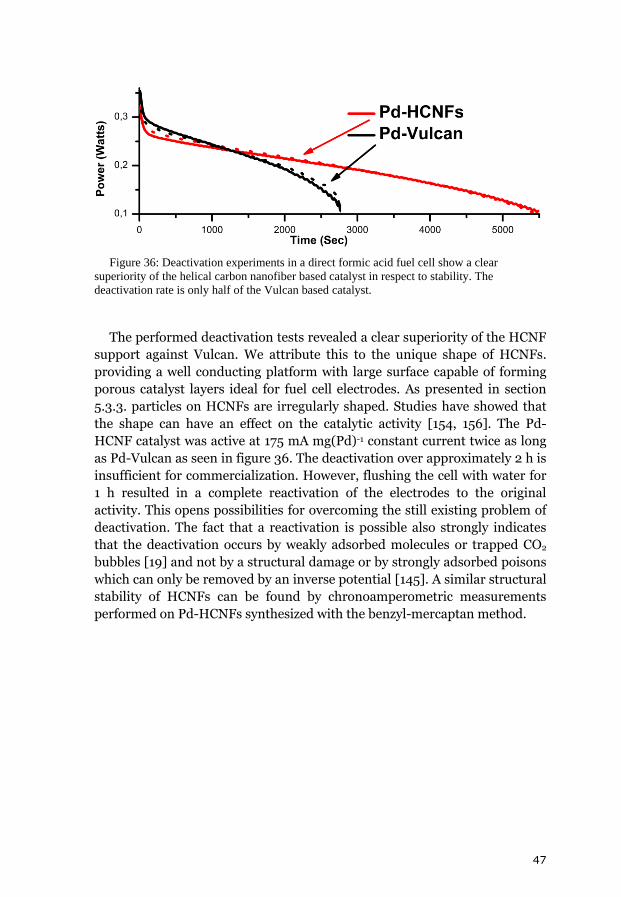
47
The performed deactivation tests revealed a clear superiority of the HCNF
support against Vulcan. We attribute this to the unique shape of HCNFs.
providing a well conducting platform with large surface capable of forming
porous catalyst layers ideal for fuel cell electrodes. As presented in section
5.3.3. particles on HCNFs are irregularly shaped. Studies have showed that
the shape can have an effect on the catalytic activity [154, 156]. The Pd-
HCNF catalyst was active at 175 mA mg(Pd)-1 constant current twice as long
as Pd-Vulcan as seen in figure 36. The deactivation over approximately 2 h is
insufficient for commercialization. However, flushing the cell with water for
1 h resulted in a complete reactivation of the electrodes to the original
activity. This opens possibilities for overcoming the still existing problem of
deactivation. The fact that a reactivation is possible also strongly indicates
that the deactivation occurs by weakly adsorbed molecules or trapped CO2
bubbles [19] and not by a structural damage or by strongly adsorbed poisons
which can only be removed by an inverse potential [145]. A similar structural
stability of HCNFs can be found by chronoamperometric measurements
performed on Pd-HCNFs synthesized with the benzyl-mercaptan method.
Figure 36: Deactivation experiments in a direct formic acid fuel cell show a clear
superiority of the helical carbon nanofiber based catalyst in respect to stability. The
deactivation rate is only half of the Vulcan based catalyst.
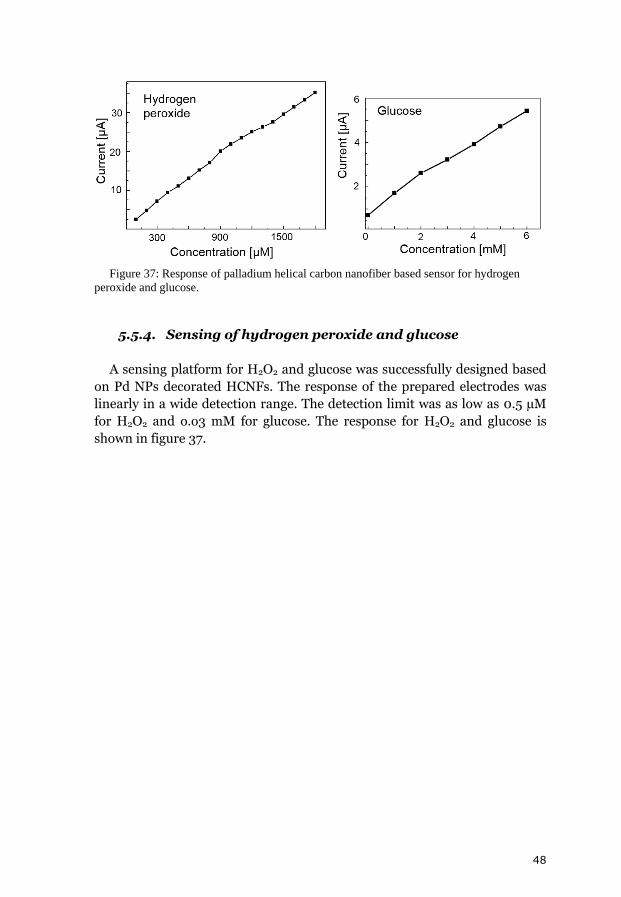
48
5.5.4. Sensing of hydrogen peroxide and glucose
A sensing platform for H2O2 and glucose was successfully designed based
on Pd NPs decorated HCNFs. The response of the prepared electrodes was
linearly in a wide detection range. The detection limit was as low as 0.5 µM
for H2O2 and o.o3 mM for glucose. The response for H2O2 and glucose is
shown in figure 37.
Figure 37: Response of palladium helical carbon nanofiber based sensor for hydrogen
peroxide and glucose.
49
6. Conclusion
The main aspects of this work are the successful application of Pd as CVD
catalyst, the development of a growth model for HCNFs and the application
of HCNFs for metal-impurity free catalysts.
The CVD growth products ranged from HCNFs, over SCNF to CNTs with
temperature being the influencing key factor. HCNFs can be synthesized at a
low temperature of only 550 °C with very high efficiencies. In an optimized
process a catalyst conversion of over 2800 wt% calculated on pure Pd to
HCNFs can be achieved. An intense TEM study made it possible to develop a
growth model based on the anisotropic extrusion model. It explains the
growth of HCNFs by the growth from a Pd nanoparticle into two directions.
The model does not depend on rotation of the particle or anisotropy
resulting from different extrusion rates. We can clearly show that the growth
of the fiber highly influences the shape of the particle.
HCNFs were decorated with Pd nanoparticles using several different
methods. The decoration was improved significantly during the progress of
the study. The structures were successfully applied to different catalysis
applications like oxidation of methanol, ethanol or glucose. Tests in a DFAFC
showed very high potential of HCNF based catalysts with better properties
than Vulcan or MWCNT based ones. A direct and cost-efficient approach for
the combined decoration of support and electrode preparation was
presented. It was possible to reactivate the electrodes to 100 % of the initial
activity by simple water flushing. The structural stability revealed by TEM
and indicated by reactivation experiments is attributed to strong attachment
of NPs to the support. This prevents agglomeration and catalyst leakage. Low
degree of agglomeration during fuel cell operation is a prerequisite for long
lifetime catalysts. No leakage makes the recycling of precious metal easy.
Pd-fullerides were synthesized at very mild conditions by the sole
contacting of a molten Pd(0) complex with C60. This opens easier access to
fullerides for further studies.
6.1. Outlook
The utilized Pd-fulleride catalyst is rather expensive and we presently
study the CVD growth of pure Pd NPs. We investigate the influence of
differently shaped NPs and can show already that the growth of CNTs is also
possible under the right conditions at much lower temperature. A key factor
is here the initial state of the catalyst.

50
We also investigate HCNFs applied as support for Au NPs to establish a
platform for surface-enhanced Raman. Preliminary results show a very
impressive improvement of the Raman signal.
Even though HCNF based systems show very promising results further
studies need to be conducted. The deactivation and reactivation behavior
need to be investigated. Other HCNF based catalysts are developed at this
moment showing high potential in CV. These catalysts need to be tested in a
DFAFC. Different response to the addition of poisons to the fuel of for
example Vulcan and HCNF support were recently discovered and need to be
carefully investigated.
The analysis of the tomography data needs to be finalized. We believe that
we can give strong support for the presented growth model.
51
7. Summary of the appended articles
The following articles (Paper I-VIII) have contributed to this thesis. The
full articles are found in the appendix (Reprinted with permission from
Elsevier and Reproduced by permission of The Royal Society of Chemistry,
links to the articles can be found in the digital version). Several other
manuscripts are submitted or under preparation. These manuscripts focus
on the characterization and application of fuel cell catalysts also for oxygen
reduction and transmission electron tomography. Already published articles
and patent applications which I have contributed to but which have not
directly contributed to this thesis are:
1. Yao et al. [180] Confined adamantane molecules assembled to one
dimension in carbon nanotubes. Carbon 2011, 49 (4), 1159-1166.
2. Abou-Hamad et al. [181] Electronic properties of Cs-intercalated
single-walled carbon nanotubes derived from nuclear magnetic
resonance. New Journal of Physics 2011, 13. art. no. 053045
3. Patents: Decorated nanostructures Application Number: 61485157
(US) and 1150431-3 (Sweden)
4. Sharifi et al. [83] Nitrogen doped multi walled carbon nanotubes
produced by CVD-correlating XPS and Raman spectroscopy for the
study of nitrogen inclusion. Carbon 2012, 50 (10), 3535-3541.
5. Barzegar et al. [182] Water Assisted Growth of C-60 Rods and Tubes
by Liquid-Liquid Interfacial Precipitation Method. Molecules 2012,
17 (6), 6840-6853.
6. Barzegar et al. [58] Simple Dip-Coating Process for the Synthesis of
Small Diameter Single-Walled Carbon Nanotubes-Effect of Catalyst
Composition and Catalyst Particle Size on Chirality and Diameter.
Journal of Physical Chemistry C 2012, 116 (22), 12232-12239.
7. Nitze et al. [39] Ammonia assisted growth of multiwalled carbon
nanotubes. Phys. Status Solidi B-Basic Solid State Phys. 2009, 246
(11-12), 2440-2443.
8. Larsen et al. [104] On the fabrication of crystalline C60 nanorod
transistors from solution. Nanotechnology, 2012, 23, 344015.
52
Paper I: Easy synthesis of Pd fullerene polymer structures from the
molten state of tris(dibenzylideneacetone)dipalladium(0)
F. Nitze*, H. R. Barzegar* and T. Wågberg, Phys. Status Solidi B-Basic
Solid State Phys., 2012, 249, 2588-2591. . (* Authors equally contributed to
the manuscript)
Contributions: Synthesis of Pd-fullerides, TEM and HRTEM analysis.
TGA, manuscript preparation.
The study presents a new and rapid approach to synthesize Pd fullerides
based on direct reaction of C60 with Pd2dba3.We show that the Pd fullerene
polymer phase forms at temperatures around the melting point of Pd2dba3
(150 °C) while further annealing releases dba. The synthesis reactions were
studied in TGA/DSC. TEM revealed that the material easily collapses under
the electron beam into nanoparticles. Raman spectroscopy confirmed the
formation of Pd fulleride polymers. The study gives both insights into the
formation of nanoparticles as well as the synthesis of C60 polymers. The
method is also compatible with direct coating processes making it useful for
a broad spectrum of CVD and catalysis applications.
Paper II: Carbon nanotubes and helical carbon nanofibers grown by
chemical vapor deposition on C60 fullerene supported Pd nanoparticles
F. Nitze, E. Abou-Hamad and T. Wågberg, Carbon, 2011, 49, 1101-1107.
Contribution: All results, measurments and manuscript preparation.
Valuable assistance in the development of the growth model from Dr.
Bernhardsson and Dr. Wiklund.
Different carbon nanostructures but specifically helical fibers with very
periodic pitch, helicity, and narrow diameter distribution were synthesized
in a standard chemical vapor deposition setup on Pd nano particles. The Pd-
fulleride catalyst was produced by a wet chemistry process. By raising the
growth temperature from 550° C to 800° C we can tune the growth products
from helical carbon fibers to straight hollow carbon fibers and finally to
carbon nanotubes at the highest temperatures. The efficiency of the process
is optimised by the amount of water during the growth. Different from most
previous studies we can detect most of the catalyst particles embedded in the
grown structures. In all fibers the catalyst particles are situated exactly in the
middle of the fibers suggesting a two-directional growth. We present a
growth model for helical carbon nanofibers.
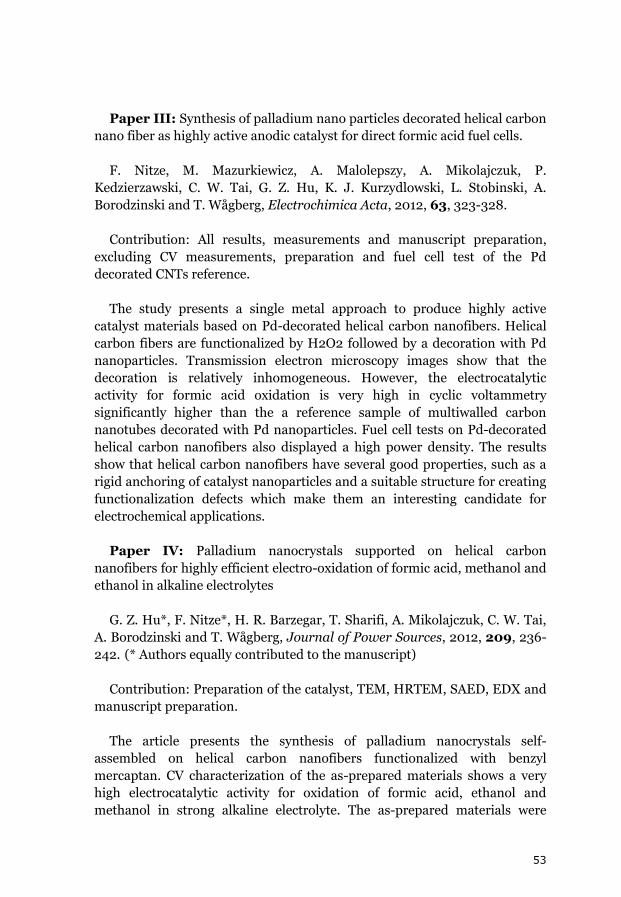
53
Paper III: Synthesis of palladium nano particles decorated helical carbon
nano fiber as highly active anodic catalyst for direct formic acid fuel cells.
F. Nitze, M. Mazurkiewicz, A. Malolepszy, A. Mikolajczuk, P.
Kedzierzawski, C. W. Tai, G. Z. Hu, K. J. Kurzydlowski, L. Stobinski, A.
Borodzinski and T. Wågberg, Electrochimica Acta, 2012, 63, 323-328.
Contribution: All results, measurements and manuscript preparation,
excluding CV measurements, preparation and fuel cell test of the Pd
decorated CNTs reference.
The study presents a single metal approach to produce highly active
catalyst materials based on Pd-decorated helical carbon nanofibers. Helical
carbon fibers are functionalized by H2O2 followed by a decoration with Pd
nanoparticles. Transmission electron microscopy images show that the
decoration is relatively inhomogeneous. However, the electrocatalytic
activity for formic acid oxidation is very high in cyclic voltammetry
significantly higher than the a reference sample of multiwalled carbon
nanotubes decorated with Pd nanoparticles. Fuel cell tests on Pd-decorated
helical carbon nanofibers also displayed a high power density. The results
show that helical carbon nanofibers have several good properties, such as a
rigid anchoring of catalyst nanoparticles and a suitable structure for creating
functionalization defects which make them an interesting candidate for
electrochemical applications.
Paper IV: Palladium nanocrystals supported on helical carbon
nanofibers for highly efficient electro-oxidation of formic acid, methanol and
ethanol in alkaline electrolytes
G. Z. Hu*, F. Nitze*, H. R. Barzegar, T. Sharifi, A. Mikolajczuk, C. W. Tai,
A. Borodzinski and T. Wågberg, Journal of Power Sources, 2012, 209, 236-
242. (* Authors equally contributed to the manuscript)
Contribution: Preparation of the catalyst, TEM, HRTEM, SAED, EDX and
manuscript preparation.
The article presents the synthesis of palladium nanocrystals self-
assembled on helical carbon nanofibers functionalized with benzyl
mercaptan. CV characterization of the as-prepared materials shows a very
high electrocatalytic activity for oxidation of formic acid, ethanol and
methanol in strong alkaline electrolyte. The as-prepared materials were
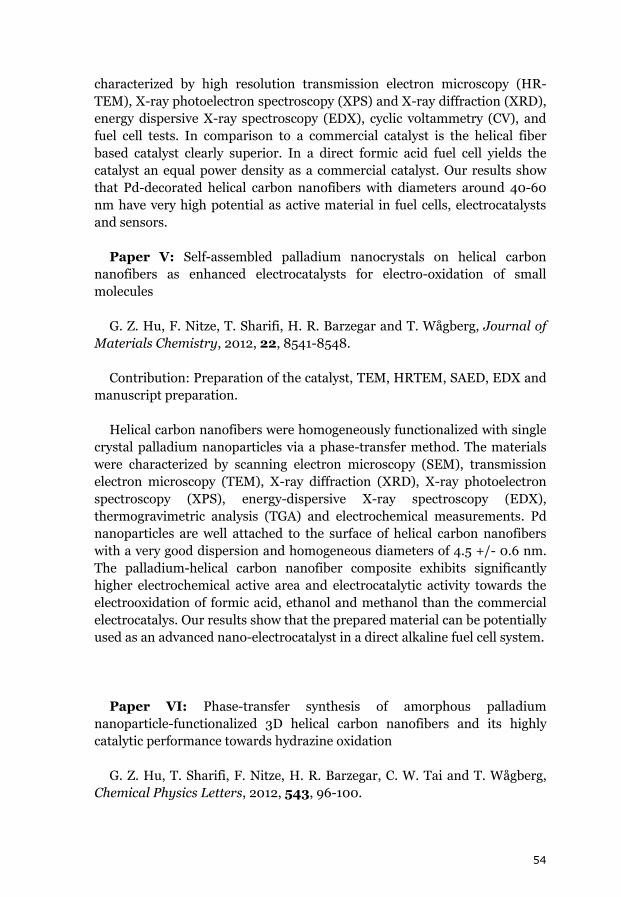
54
characterized by high resolution transmission electron microscopy (HR-
TEM), X-ray photoelectron spectroscopy (XPS) and X-ray diffraction (XRD),
energy dispersive X-ray spectroscopy (EDX), cyclic voltammetry (CV), and
fuel cell tests. In comparison to a commercial catalyst is the helical fiber
based catalyst clearly superior. In a direct formic acid fuel cell yields the
catalyst an equal power density as a commercial catalyst. Our results show
that Pd-decorated helical carbon nanofibers with diameters around 40-60
nm have very high potential as active material in fuel cells, electrocatalysts
and sensors.
Paper V: Self-assembled palladium nanocrystals on helical carbon
nanofibers as enhanced electrocatalysts for electro-oxidation of small
molecules
G. Z. Hu, F. Nitze, T. Sharifi, H. R. Barzegar and T. Wågberg, Journal of
Materials Chemistry, 2012, 22, 8541-8548.
Contribution: Preparation of the catalyst, TEM, HRTEM, SAED, EDX and
manuscript preparation.
Helical carbon nanofibers were homogeneously functionalized with single
crystal palladium nanoparticles via a phase-transfer method. The materials
were characterized by scanning electron microscopy (SEM), transmission
electron microscopy (TEM), X-ray diffraction (XRD), X-ray photoelectron
spectroscopy (XPS), energy-dispersive X-ray spectroscopy (EDX),
thermogravimetric analysis (TGA) and electrochemical measurements. Pd
nanoparticles are well attached to the surface of helical carbon nanofibers
with a very good dispersion and homogeneous diameters of 4.5 +/- 0.6 nm.
The palladium-helical carbon nanofiber composite exhibits significantly
higher electrochemical active area and electrocatalytic activity towards the
electrooxidation of formic acid, ethanol and methanol than the commercial
electrocatalys. Our results show that the prepared material can be potentially
used as an advanced nano-electrocatalyst in a direct alkaline fuel cell system.
Paper VI: Phase-transfer synthesis of amorphous palladium
nanoparticle-functionalized 3D helical carbon nanofibers and its highly
catalytic performance towards hydrazine oxidation
G. Z. Hu, T. Sharifi, F. Nitze, H. R. Barzegar, C. W. Tai and T. Wågberg,
Chemical Physics Letters, 2012, 543, 96-100.
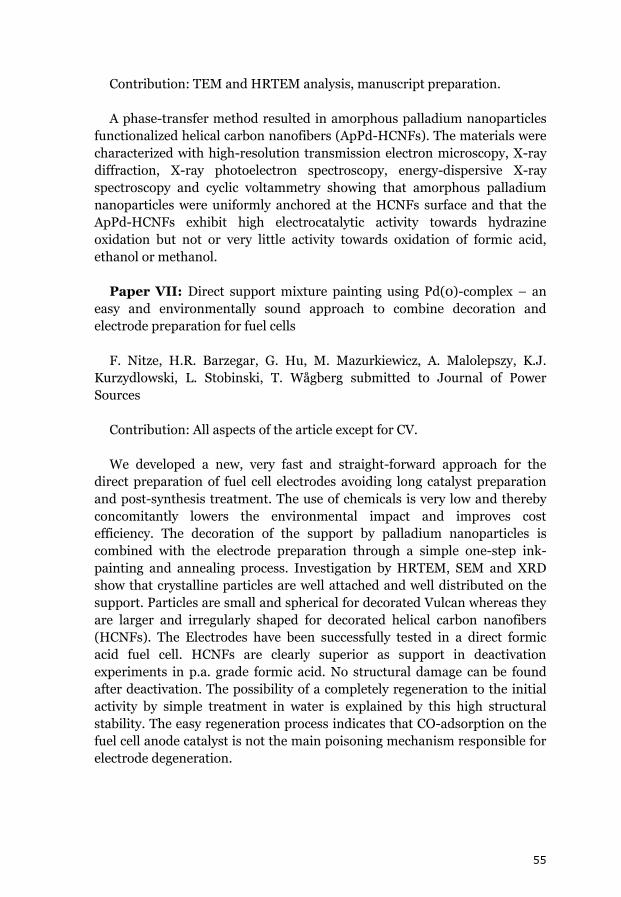
55
Contribution: TEM and HRTEM analysis, manuscript preparation.
A phase-transfer method resulted in amorphous palladium nanoparticles
functionalized helical carbon nanofibers (ApPd-HCNFs). The materials were
characterized with high-resolution transmission electron microscopy, X-ray
diffraction, X-ray photoelectron spectroscopy, energy-dispersive X-ray
spectroscopy and cyclic voltammetry showing that amorphous palladium
nanoparticles were uniformly anchored at the HCNFs surface and that the
ApPd-HCNFs exhibit high electrocatalytic activity towards hydrazine
oxidation but not or very little activity towards oxidation of formic acid,
ethanol or methanol.
Paper VII: Direct support mixture painting using Pd(0)-complex – an
easy and environmentally sound approach to combine decoration and
electrode preparation for fuel cells
F. Nitze, H.R. Barzegar, G. Hu, M. Mazurkiewicz, A. Malolepszy, K.J.
Kurzydlowski, L. Stobinski, T. Wågberg submitted to Journal of Power
Sources
Contribution: All aspects of the article except for CV.
We developed a new, very fast and straight-forward approach for the
direct preparation of fuel cell electrodes avoiding long catalyst preparation
and post-synthesis treatment. The use of chemicals is very low and thereby
concomitantly lowers the environmental impact and improves cost
efficiency. The decoration of the support by palladium nanoparticles is
combined with the electrode preparation through a simple one-step ink-
painting and annealing process. Investigation by HRTEM, SEM and XRD
show that crystalline particles are well attached and well distributed on the
support. Particles are small and spherical for decorated Vulcan whereas they
are larger and irregularly shaped for decorated helical carbon nanofibers
(HCNFs). The Electrodes have been successfully tested in a direct formic
acid fuel cell. HCNFs are clearly superior as support in deactivation
experiments in p.a. grade formic acid. No structural damage can be found
after deactivation. The possibility of a completely regeneration to the initial
activity by simple treatment in water is explained by this high structural
stability. The easy regeneration process indicates that CO-adsorption on the
fuel cell anode catalyst is not the main poisoning mechanism responsible for
electrode degeneration.
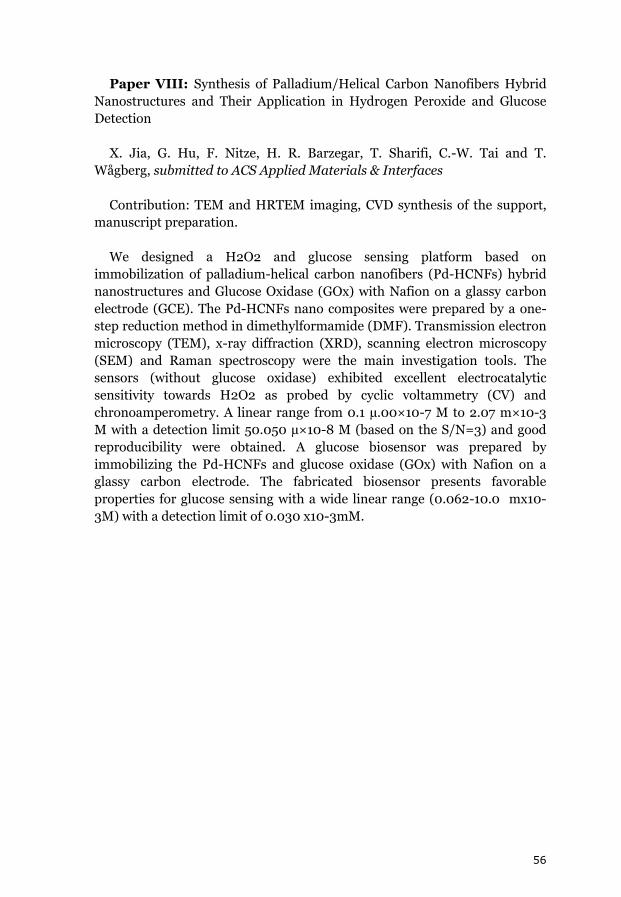
56
Paper VIII: Synthesis of Palladium/Helical Carbon Nanofibers Hybrid
Nanostructures and Their Application in Hydrogen Peroxide and Glucose
Detection
X. Jia, G. Hu, F. Nitze, H. R. Barzegar, T. Sharifi, C.-W. Tai and T.
Wågberg, submitted to ACS Applied Materials & Interfaces
Contribution: TEM and HRTEM imaging, CVD synthesis of the support,
manuscript preparation.
We designed a H2O2 and glucose sensing platform based on
immobilization of palladium-helical carbon nanofibers (Pd-HCNFs) hybrid
nanostructures and Glucose Oxidase (GOx) with Nafion on a glassy carbon
electrode (GCE). The Pd-HCNFs nano composites were prepared by a one-
step reduction method in dimethylformamide (DMF). Transmission electron
microscopy (TEM), x-ray diffraction (XRD), scanning electron microscopy
(SEM) and Raman spectroscopy were the main investigation tools. The
sensors (without glucose oxidase) exhibited excellent electrocatalytic
sensitivity towards H2O2 as probed by cyclic voltammetry (CV) and
chronoamperometry. A linear range from 0.1 µ.00×10-7 M to 2.07 m×10-3
M with a detection limit 50.050 µ×10-8 M (based on the S/N=3) and good
reproducibility were obtained. A glucose biosensor was prepared by
immobilizing the Pd-HCNFs and glucose oxidase (GOx) with Nafion on a
glassy carbon electrode. The fabricated biosensor presents favorable
properties for glucose sensing with a wide linear range (0.062-10.0 mx10-
3M) with a detection limit of 0.030 x10⁻³mM.

57
8. Acknowledgements
I would like to thank the many people who were somehow involved in this
work, either from the scientific or the personal side.
I would like to express my gratitude to my supervisor Thomas Wågberg
for all his support and guidance throughout the years of my Ph.D. studies.
Thank you for giving me the possibility to develop my own ideas that freely. I
don’t think any of this work in this thesis would have been possible without
him. I would also like to thank my co-supervisor Ludvig Edman for his
support.
I would like to thank the Department of Physics for its great work
environment in which I felt welcome from the first moment on. The
department is of course only an empty building without the people working
in it. I would like to thank all of them but express my gratitude especially to
the following. Leif Hassmyr for his great support in the student labs. Jörgen
Eriksson for all the practical issues he solved for me. Gabriella Allansson and
Hans Forsman for the help with teaching related issue. Lena Åström and
Tomas Gustafsson for all the equipment they build for me. Lena Burström,
Katarina Hassler and Lillian Andersson for their great patience and
administrative work from contracts over invoices to travel bills.
All members of Thomas Wågberg’s group, former and present: Tiva,
Hamid, Xueen, Guangzhi, Eduardo and Patrik. They have all helped me in
many different ways from measurements, discussions to just being great
colleagues. All members of Ludvig Edman’s groups especially for
discussions, and borrowing equipment. Ove Andersson, Junchun Yu, Bertil
Sundqvist, Britt Andersson, Serhiy Luzan and Alexandr Talyzin for their help
and collaboration.
I would also like to thank my Polish collaborators Andrzej Borodzinski,
Leszek Stobinski and Piotr Kedzierzawski from Warsaw. Thank you for the
warm welcome in your groups and everything I learned from you. I also want
to thank their Ph.D. students Marta, Anna and Artur for their support and
warm welcome.
I would like to thank Lenore Johansson for her patience during my TEM
sessions. I especially want to acknowledge Cheuk-Wai Tai from the
Stockholm University. Thank you for your great patience and everything I
learned from you about HRTEM.

58
I would like to thank J.C. Kempes Minnes Foundation and J. Gust.
Richerts Foundation for financial support.
I want to acknowledge all my great friends from Umeå and elsewhere,
especially Melanie, Markus, Ulrik, Nils and Thomas.
I want to thank my family, especially my parents and my sister for their
support and for getting me through school all the way to university.
Finally, I want to thank the person I dedicated this thesis to: my fiancée
Justyna Żółtowska. Thank you for believing in me and all the love and
support I get from you every day.
59
9. References [1] C. Houchins, G.J. Kleen, J.S. Spendelow, J. Kopasz, D. Peterson, N.L. Garland, D.L. Ho, J. Marcinkoski, K.E. Martin, R. Tyler, D.C. Papageorgopoulos, Membranes, 2 (2012) 855-878. [2] Y. Wang, K.S. Chen, J. Mishler, S.C. Cho, X.C. Adroher, Appl. Energy, 88 (2011) 981-1007. [3] I. Bar-On, R. Kirchain, R. Roth, Journal of Power Sources, 109 (2002) 71-75. [4] A. Brouzgou, A. Podias, P. Tsiakaras, Journal of Applied Electrochemistry, 43 (2013) 119-136. [5] http://www.kitco.com/charts/historicalplatinum.html, in, 2013. [6] http://www.kitco.com/charts/historicalpalladium.html, in, 2013. [7] C. Rice, S. Ha, R.I. Masel, A. Wieckowski, Journal of Power Sources, 115 (2003) 229-235. [8] X. Yu, P.G. Pickup, Journal of Power Sources, 182 (2008) 124-132. [9] O. Winjobi, Z. Zhang, C. Liang, W. Li, Electrochimica Acta, 55 (2010) 4217-4221. [10] S. Ha, R. Larsen, Y. Zhu, R.I. Masel, Fuel Cells, 4 (2004) 337-343. [11] R. Balgis, G.M. Anilkumar, S. Sago, T. Ogi, K. Okuyama, Journal of Power Sources, 203 (2012) 26-33. [12] Y.H. Pai, C.W. Tseng, Journal of Power Sources, 202 (2012) 28-34. [13] B.R. Tao, F.J. Miao, P.K. Chu, Electrochimica Acta, 65 (2012) 149-152. [14] C. Termpornvithit, N. Chewasatn, M. Hunsom, Journal of Applied Electrochemistry, 42 (2012) 169-178. [15] X.L. Jin, B. He, J.G. Miao, J.H. Yuan, Q.X. Zhang, L. Niu, Carbon, 50 (2012) 3083-3091. [16] P.C. Sherrell, W. Zhang, J. Zhao, G.G. Wallace, J. Chen, A.I. Minett, Chemsuschem, 5 (2012) 1233-1240. [17] J. Hosseini, A. Bodaghi, Journal of Solid State Electrochemistry, 15 (2011) 795-800. [18] A. Malolepszy, M. Mazurkiewicz, A. Mikolajczuk, L. Stobinski, A. Borodzinski, B. Mierzwa, B. Lesiak, J. Zemek, P. Jiricek, in: M.T. ClavagueraMora, J. RodriguezViejo (Eds.) Physica Status Solidi C: Current Topics in Solid State Physics, Vol 8, No 11-12, Wiley-V C H Verlag Gmbh, Weinheim, 2011. [19] A. Mikołajczuk, A. Borodzinski, P. Kedzierzawski, L. Stobinski, B. Mierzwa, R. Dziura, Applied Surface Science, 257 (2011) 8211-8214. [20] C. Venkateswara Rao, C.R. Cabrera, Y. Ishikawa, The Journal of Physical Chemistry C, 115 (2011) 21963-21970. [21] S. An, J.-H. Park, C.-H. Shin, J. Joo, E. Ramasamy, J. Hwang, J. Lee, Carbon, 49 (2011) 1108-1117. [22] S.T. Hussain, S.R. Gilani, S.D. Ali, H. Safdar Bhatti, Journal of Alloys & Compounds, 544 (2012) 99-104. [23] B. Singh, E. Dempsey, C. Dickinson, F. Laffir, The Analyst, 137 (2012) 1639-1648.
60
[24] X. Sun, R. Li, D. Villers, J.P. Dodelet, S. Desilets, Chemical Physics Letters, 379 (2003) 99-104. [25] Y.N. Wu, S.J. Liao, Y.L. Su, J.F. Zeng, D. Dang, Journal of Power Sources, 195 (2010) 6459-6462. [26] T. Sharifi, G. Hu, X.E. Jia, T. Wagberg, ACS Nano, 6 (2012) 8904-8912. [27] K. Gong, F. Du, Z. Xia, M. Durstock, L. Dai, Science, 323 (2009) 760-764. [28] H.W. Kroto, J.R. Heath, S.C. O'Brien, R.F. Curl, R.E. Smalley, Nature, 318 (1985) 162-163. [29] S. Iijima, Nature, 354 (1991) 56-58. [30] K.S. Novoselov, D. Jiang, F. Schedin, T.J. Booth, V.V. Khotkevich, S.V. Morozov, A.K. Geim, Proceedings of the National Academy of Sciences of the United States of America, 102 (2005) 10451-40453. [31] X.-m. Chen, Z.-j. Lin, T.-t. Jia, Z.-m. Cai, X.-l. Huang, Y.-q. Jiang, X. Chen, G.-n. Chen, Analytica Chimica Acta, 650 (2009) 54-58. [32] C.D. Taboada, J. Batista, A. Pintar, J. Levec, Applied Catalysis B: Environmental, 89 (2009) 375-382. [33] G.S. Choi, K.H. Son, D.J. Kim, Microelectronic Engineering, 66 (2003) 206-212. [34] W.B. Choi, D.S. Chung, J.H. Kang, H.Y. Kim, Y.W. Jin, I.T. Han, Y.H. Lee, J.E. Jung, N.S. Lee, G.S. Park, J.M. Kim, Applied Physics Letters, 75 (1999) 3129. [35] A. Minett, J. Fràysse, G. Gang, G.-T. Kim, S. Roth, Current Applied Physics, 2 (2002) 61-64. [36] S. Bhaviripudi, E. Mile, S.A. Steiner, A.T. Zare, M.S. Dresselhaus, A.M. Belcher, J. Kong, Journal of the American Chemical Society, 129 (2007) 1516-1517. [37] C. Valles, M. Perez-Mendoza, P. Castell, M.T. Martinez, W.K. Maser, A.M. Benito, Nanotechnology, 17 (2006) 4292-4299. [38] C.P. Deck, K. Vecchio, Carbon, 43 (2005) 2608-2617. [39] F. Nitze, B.M. Andersson, T. Wagberg, Phys. Status Solidi B-Basic Solid State Phys., 246 (2009) 2440-2443. [40] R. Taylor, G.J. Langley, A.G. Avent, T.J.S. Dennis, H.W. Kroto, D.R.M. Walton, Journal of the Chemical Society-Perkin Transactions 2, (1993) 1029-1036. [41] M.G. Yao, B.B. Liu, Y.G. Zou, L. Wang, D.M. Li, T. Cui, G.T. Zou, B. Sundqvist, Carbon, 43 (2005) 2894-2901. [42] R. Yuge, K. Toyama, T. Ichihashi, T. Ohkawa, Y. Aoki, T. Manako, Applied Surface Science, 258 (2012) 6958-6962. [43] R.R. Nair, M. Sepioni, I.L. Tsai, O. Lehtinen, J. Keinonen, A.V. Krasheninnikov, T. Thomson, A.K. Geim, I.V. Grigorieva, Nat. Phys., 8 (2012) 199-202. [44] A.V. Talyzin, A. Dzwilewski, Journal of Nanoscience and Nanotechnology, 7 (2007) 1151-1161. [45] P. Esquinazi, R. Hohne, K.H. Han, A. Setzer, D. Spemann, T. Butz, Carbon, 42 (2004) 1213-1218.
61
[46] Y.H. Kim, O.N. Torrens, J.M. Kikkawa, E. Abou-Hamad, C. Goze-Bac, D.E. Luzzi, Chemistry of Materials, 19 (2007) 2982-2986. [47] F. Nitze, in, Umeå University, Umeå, 2011. [48] F. Nitze, H.R. Barzegar, G. Hu, M. Mazurkiewicz, A. Malolepszy, K.J. Kurzydlowski, L. Stobinski, T. Wågberg, Journal of Power Sources, submitted (2013). [49] G.Z. Hu, F. Nitze, H.R. Barzegar, T. Sharifi, A. Mikolajczuk, C.W. Tai, A. Borodzinski, T. Wagberg, Journal of Power Sources, 209 (2012) 236-242. [50] G.Z. Hu, F. Nitze, T. Sharifi, H.R. Barzegar, T. Wagberg, Journal of Materials Chemistry, 22 (2012) 8541-8548. [51] G.Z. Hu, T. Sharifi, F. Nitze, H.R. Barzegar, C.W. Tai, T. Wagberg, Chemical Physics Letters, 543 (2012) 96-100. [52] X.E. Jia, G. Hu, F. Nitze, H.R. Barzegar, T. Sharifi, C.W. Tai, T. Wågberg, ACS Applied Materials & Interfaces, submitted (2013). [53] F. Nitze, E. Abou-Hamad, T. Wagberg, Carbon, 49 (2011) 1101-1107. [54] F. Nitze, H.R. Barzegar, T. Wagberg, Phys. Status Solidi B-Basic Solid State Phys., 249 (2012) 2588-2591. [55] F. Nitze, M. Mazurkiewicz, A. Malolepszy, A. Mikolajczuk, P. Kedzierzawski, C.W. Tai, G.Z. Hu, K.J. Kurzydlowski, L. Stobinski, A. Borodzinski, T. Wagberg, Electrochimica Acta, 63 (2012) 323-328. [56] R. Bacon, Journal of Applied Physics, 31 (1960) 283-290. [57] W.S. Williams, D.A. Steffens, R. Bacon, Journal of Applied Physics, 41 (1970) 4893-4901. [58] H.R. Barzegar, F. Nitze, T. Sharifi, M. Ramstedt, C.W. Tai, A. Malolepszy, L. Stobinski, T. Wagberg, Journal of Physical Chemistry C, 116 (2012) 12232-12239. [59] C.R. Lin, C.H. Su, C.H. Hung, C.Y. Chang, L. Stobinski, Diamond and Related Materials, 14 (2005) 794-797. [60] V. Bajpai, L. Dai, T. Ohashi, Journal of the American Chemical Society, 126 (2004) 5070-5071. [61] M.J. Hanus, A.T. Harris, Journal of Nanoscience and Nanotechnology, 10 (2010) 2261-2283. [62] H. Hou, Z. Jun, F. Weller, A. Greiner, Chemistry of Materials, 15 (2003) 3170-3175. [63] N. Tang, J. Wen, Y. Zhang, F. Liu, K. Lin, Y. Du, ACS Nano, 4 (2010) 241-250. [64] M.S. Arnold, A.A. Green, J.F. Hulvat, S.I. Stupp, M.C. Hersam, Nature Nanotechnology, 1 (2006) 60-65. [65] N.S. Jacobsen, P. Pantano, Carbon, 49 (2011) 1998-2006. [66] M.A. Atwater, (2010). [67] M.A. Atwater, J. Phillips, Z.C. Leseman, Carbon, 48 (2010) 1932-1938. [68] G. Che, B.B. Lakshmi, C.R. Martin, E.R. Fisher, R.S. Ruoff, Chemistry of Materials, 10 (1998) 260-267. [69] Y.C. Liu, B.M. Sun, Advanced Materials Research, 194 (2011) 402-406. [70] R. Segura, A. Tello, G. Cardenas, P. Häberle, physica status solidi (a), 204 (2007) 513-517.
62
[71] S.-S. Tzeng, K.-H. Hung, T.-H. Ko, Carbon, 44 (2006) 859-865. [72] M.K. van der Lee, A.J. van Dillen, J.W. Geus, K.P. de Jong, J.H. Bitter, Carbon, 44 (2006) 629-637. [73] M. Zhang, J.H. Zhao, Z. Wu, B.Q. Wei, J. Liang, D.H. Wu, L.M. Cao, Y.F. Xu, W.K. Wang, Journal of Materials Science Letters, 17 (1998) 2109-2111. [74] D.Y. Zhong, S. Liu, E.G. Wang, Applied Physics Letters, 83 (2003) 4423-4425. [75] M. Lu, W.-M. Liu, X.-Y. Guo, H.-L. Li, Carbon, 42 (2004) 805-811. [76] X. Qi, W. Zhong, Y. Deng, C. Au, Y. Du, Carbon, 48 (2010) 365-376. [77] C. Lai, Q. Guo, X.-F. Wu, D.H. Reneker, H. Hou, Nanotechnology, 19 (2008) 195303. [78] L.P. Biró, R. Ehlich, Z. Osváth, A. Koós, Z.E. Horváth, J. Gyulai, J.B. Nagy, Materials Science and Engineering: C, 19 (2002) 3-7. [79] K. Hernadi, L. Thien-Nga, L. Forro, The Journal of Physical Chemistry B, 105 (2001) 12464-12468. [80] A. Volodin, D. Buntinx, M. Ahlskog, A. Fonseca, J.B. Nagy, C. Van Haesendonck, Nano Letters, 4 (2004) 1775-1779. [81] K. Akagi, R. Tamura, M. Tsukada, S. Itoh, S. Ihara, Physical Review Letters, 74 (1995) 2307. [82] B.B. Liu, B. Sundqvist, O. Andersson, T. Wågberg, G. Zou, in: H. Kuzmany, J. Fink, M. Mehring, S. Roth (Eds.) 14th International Winter School on Electronic Properties on Novel Materials, Kirchberg, Austria, 2000, pp. 344-348. [83] T. Sharifi, F. Nitze, H.R. Barzegar, C.W. Tai, M. Mazurkiewicz, A. Malolepszy, L. Stobinski, T. Wagberg, Carbon, 50 (2012) 3535-3541. [84] N. Yoshihara, H. Ago, M. Tsuji, Japanese Journal of Applied Physics, 47 (2008) 1944-1948. [85] L. Cheol Jin, K. Dae Woon, L. Tae Jae, C. Young Chul, P. Young Soo, K. Won Seok, L. Young Hee, C. Won Bong, L. Nae Sung, K. Jong Min, C. Yong Gak, Y. Soo Chang, Applied Physics Letters, 75 (1999) 1721. [86] C.J. Lee, J. Park, J.M. Kim, Y. Huh, J.Y. Lee, K.S. No, Chemical Physics Letters, 327 (2000) 277-283. [87] J.C. Bauer, D. Mullins, M. Li, Z. Wu, E.A. Payzant, S.H. Overbury, S. Dai, Physical Chemistry Chemical Physics (PCCP), 13 (2011) 2571-2581. [88] A.-H. Lu, J.-J. Nitz, M. Comotti, C. Weidenthaler, K. Schlichte, C.W. Lehmann, O. Terasaki, F. Schüth, Journal of the American Chemical Society, 132 (2010) 14152-14162. [89] B. Lee, Z. Ma, Z. Zhang, C. Park, S. Dai, Microporous and Mesoporous Materials, 122 (2009) 160-167. [90] Journal of Nanoparticle Research, 8 (2006) 445-453. [91] B.B. Wang, X. Tang, X.Z. Xu, Journal Of Physics And Chemistry Of Solids, 74 (2013) 441-445. [92] K.Y. Lee, W.M. Yeoh, S.P. Chai, S. Ichikawa, A.R. Mohamed, J. Ind. Eng. Chem., 18 (2012) 1504-1511. [93] T.Z. Liu, Y. Liu, S.W. Duo, X.G. Sun, J. Li, New Carbon Mater., 28 (2013) 33-38.
63
[94] T.F. Kuo, Z.Y. Juang, C.H. Tsai, Y.M. Tsau, H.F. Cheng, I.N. Lin, J. Vac. Sci. Technol. B, 19 (2001) 1030-1033. [95] D.N. Futaba, J. Goto, S. Yasuda, T. Yamada, M. Yumura, K. Hata, Advanced Materials, 21 (2009) 4811-4815. [96] S. Motojima, I. Hasegawa, S. Kagiya, M. Momiyama, M. Kawaguchi, H. Iwanaga, Applied Physics Letters, 62 (1993) 2322. [97] L. Stobinski, B. Lesiak, L. Kövér, J. Tóth, S. Biniak, G. Trykowski, J. Judek, Journal of Alloys and Compounds, 501 (2010) 77-84. [98] S. Hussain, S.S. Islam, T. Islam, Harsh, Asian J. Chem., 23 (2011) 5639-5642. [99] I. Kruusenberg, N. Alexeyeva, K. Tammeveski, J. Kozlova, L. Matisen, V. Sammelselg, J. Solla-Gullon, J.M. Feliu, Carbon, 49 (2011) 4031-4039. [100] M. Stancu, G. Ruxanda, D. Ciuparu, A. Dinescu, Optoelectron. Adv. Mater.-Rapid Commun., 5 (2011) 846-850. [101] M.J. Height, J.B. Howard, J.W. Tester, J.B. Vander Sande, The Journal of Physical Chemistry B, 109 (2005) 12337-12346. [102] S. Motojima, M. Kawaguchi, K. Nozaki, H. Iwanaga, Carbon, 29 (1991) 379-385. [103] A. Dzwilewski, T. Wågberg, L. Edman, Physical Review B, 75 (2007). [104] C. Larsen, H.R. Barzegar, F. Nitze, T. Wågberg, L. Edman, Nanotechnology, 23 (2012) 344015. [105] G. Dennler, C. Lungenschmied, H. Neugebauer, N.S. Sariciftci, A. Labouret, Journal Of Materials Research, 20 (2005) 3224-3233. [106] S.E. Shaheen, C.J. Brabec, N.S. Sariciftci, F. Padinger, T. Fromherz, J.C. Hummelen, Applied Physics Letters, 78 (2001) 841-843. [107] J. Yu, B. Tonpheng, G. Gröbner, O. Andersson, Macromolecules, 45 (2012) 2841-2849. [108] J. Yu, B. Tonpheng, G. Gröbner, O. Andersson, Carbon, 49 (2011) 4858-4866. [109] C. Bianchini, P.K. Shen, Chemical Reviews, 109 (2009) 4183-4206. [110] J. Larminie, A. Dicks, Fuel cell systems explained, 2003. [111] C. Lamy, A. Lima, V. LeRhun, F. Delime, C. Coutanceau, J.-M. Léger, Journal of Power Sources, 105 (2002) 283-296. [112] U.B. Demirci, Journal of Power Sources, 169 (2007) 239-246. [113] E. Gulzow, N. Wagner, M. Schulze, Fuel Cells, 3 (2003) 67-72. [114] J.H. Kim, S. Yonezawa, M. Takashima, International Journal of Hydrogen Energy, 36 (2011) 1720-1729. [115] J. Youn, B. Ryu, M. Shin, H. Kang, H. Kim, I. Chang, T. Lee, H. Kwon, International Journal of Hydrogen Energy, 37 (2012) 19289-19294. [116] S.A. Song, S.C. Jang, J. Han, S.P. Yoon, S.W. Nam, I.H. Oh, S.G. Oh, International Journal of Hydrogen Energy, 37 (2012) 19304-19311. [117] M. Cassir, S.J. McPhail, A. Moreno, International Journal of Hydrogen Energy, 37 (2012) 19345-19350. [118] W.E. Winsche, K.C. Hoffman, F.J. Salzano, Science, 180 (1973) 1325-1332.
64
[119] H. Nishikawa, H. Sasou, R. Kurihara, S. Nakamura, A. Kano, K. Tanaka, T. Aoki, Y. Ogami, International Journal of Hydrogen Energy, 33 (2008) 6262-6269. [120] Y. Lin, R. Ran, Y.M. Guo, W. Zhou, R. Cai, J. Wang, Z.P. Shao, International Journal of Hydrogen Energy, 35 (2010) 2637-2642. [121] K. Scott, W. Taama, J. Cruickshank, Journal of Applied Electrochemistry, 28 (1998) 289-297. [122] T. Schultz, S. Zhou, K. Sundmacher, Chemical Engineering & Technology, 24 (2001) 1223-1233. [123] Y. Zhu, C. Liu, J. Liang, L. Wang, Journal of Power Sources, 196 (2011) 264-269. [124] W. Zhou, Z. Zhou, S. Song, W. Li, G. Sun, P. Tsiakaras, Q. Xin, Applied Catalysis B: Environmental, 46 (2003) 273-285. [125] K. Taneda, Y. Yamazaki, Electrochimica Acta, 52 (2006) 1627-1631. [126] C.V. Rao, C.R. Cabrera, Y. Ishikawa, Journal of Physical Chemistry C, 115 (2011) 21963-21970. [127] S.M. Baik, J. Han, J. Kim, Y. Kwon, International Journal of Hydrogen Energy, 36 (2011) 14719-14724. [128] Y. Zhou, J. Liu, J. Ye, Z. Zou, J. Ye, J. Gu, T. Yu, A. Yang, Electrochimica Acta, 55 (2010) 5024-5027. [129] X.L. Ji, K.T. Lee, R. Holden, L. Zhang, J.J. Zhang, G.A. Botton, M. Couillard, L.F. Nazar, Nat. Chem., 2 (2010) 286-293. [130] Z.Y. Bai, L. Yang, L. Li, J. Lv, K. Wang, J. Zhang, Journal of Physical Chemistry C, 113 (2009) 10568-10573. [131] X.W. Yu, P.G. Pickup, Journal of Power Sources, 192 (2009) 279-284. [132] S. Uhm, H.J. Lee, J. Lee, Physical Chemistry Chemical Physics, 11 (2009) 9326-9336. [133] C.G. Lee, Fuel Cells, 12 (2012) 550-556. [134] F.J. Vidal-Iglesias, R.M. Aran-Ais, J. Solla-Gullon, E. Garnier, E. Herrero, A. Aldaz, J.M. Feliu, Physical Chemistry Chemical Physics, 14 (2012) 10258-10265. [135] R. Lan, S. Tao, J.T.S. Irvine, Energy & Environmental Science, 3 (2010) 438-441. [136] B. Virdis, K. Rabaey, Z. Yuan, J. Keller, Water Research, 42 (2008) 3013-3024. [137] B. Mecheri, A. D'Epifanio, A. Geracitano, P.T. Campana, S. Licoccia, Journal of Applied Electrochemistry, 43 (2013) 181-190. [138] T. Kuwahara, H. Yamazaki, M. Kondo, M. Shimomura, Applied Surface Science, 258 (2012) 6321-6325. [139] J.C. Biffinger, B.R. Ringeisen, Recent Patents on Biotechnology, 2 (2008) 150-155. [140] Y. Hashimasa, Y. Matsuda, M. Akai, Effects of Platinum Loading on PEFC Power Generation Performance Deterioration by Carbon Monoxide in Hydrogen Fuel, in: M.C. Williams, K. Krist, N. Garland (Eds.) Fuel Cell Seminar 2009, Electrochemical Soc Inc, Pennington, 2010, pp. 131-142.
65
[141] A. Sirijaruphan, J.G. Goodwin, R.W. Rice, Journal of Catalysis, 221 (2004) 288-293. [142] B.N. Grgur, N.M. Markovic, P.N. Ross, J. Serb. Chem. Soc., 68 (2003) 191-205. [143] C.H. Chen, W.J. Liou, H.M. Lin, S.H. Wu, A. Borodzinski, L. Stobinski, P. Kedzierzawski, Fuel Cells, 10 (2010) 227-233. [144] Y. Zhu, Z. Khan, R.I. Masel, Journal of Power Sources, 139 (2005) 15-20. [145] X.W. Yu, P.G. Pickup, Journal of Power Sources, 187 (2009) 493-499. [146] D.J. Ham, C. Pak, G.H. Bae, S. Han, K. Kwon, S.-A. Jin, H. Chang, S.H. Choi, J.S. Lee, Chemical Communications (Cambridge, England), 47 (2011) 5792-5794. [147] C.V. Rao, B. Viswanathan, Journal of Physical Chemistry C, 114 (2010) 8661-8667. [148] J. Wang, G. Yin, Y. Chen, R. Li, X. Sun, International Journal of Hydrogen Energy, 34 (2009) 8270-8275. [149] T. Kitahara, H. Nakajima, K. Mori, Journal of Power Sources, 199 (2012) 29-36. [150] R. Lan, S. Tao, Journal of Power Sources, 196 (2011) 5021-5026. [151] J.D. Lović, A.V. Tripković, S.L. Gojković, K.D. Popović, D.V. Tripković, P. Olszewski, A. Kowal, Journal of Electroanalytical Chemistry, 581 (2005) 294-302. [152] J. Huang, H. Hou, T. You, Electrochemistry Communications, 11 (2009) 1281-1284. [153] S.Y. Wang, X. Wang, S.P. Jiang, Physical Chemistry Chemical Physics, 13 (2011) 7187-7195. [154] Y. Kim, H.J. Kim, Y.S. Kim, S.M. Choi, M.H. Seo, W.B. Kim, The Journal of Physical Chemistry C, 116 (2012) 18093-18100. [155] S. Yang, C. Shen, X. Lu, H. Tong, J. Zhu, X. Zhang, H.-j. Gao, Electrochimica Acta, 62 (2012) 242-249. [156] J. Chai, F. Li, Y. Hu, Q. Zhang, D. Han, L. Niu, Journal of Materials Chemistry, 21 (2011) 17922-17929. [157] X. Niu, M. Lan, C. Chen, H. Zhao, Talanta, 99 (2012) 1062-1067. [158] G. Wang, X. He, L. Wang, A. Gu, Y. Huang, B. Fang, B. Geng, X. Zhang, Microchimica Acta, 180 (2013) 161-186. [159] C. Li, Y. Su, X. Lv, Y. Zuo, X. Yang, Y. Wang, Sensors & Actuators B: Chemical, 171-172 (2012) 1192-1198. [160] L.-P. Jia, H.-S. Wang, Sensors & Actuators B: Chemical, 177 (2013) 1035-1042. [161] T.T. Baby, S. Ramaprabhu, Talanta, 80 2016-2022. [162] A. Mikolajczuk, A. Borodzinski, L. Stobinski, P. Kedzierzawski, B. Lesiak, K. Laszlo, T. Jozsef, H.M. Lin, Phys. Status Solidi B-Basic Solid State Phys., 247 (2010) 2717-2721. [163] M. Cano, A. Benito, W.K. Maser, E.P. Urriolabeitia, Carbon, 49 (2011) 652-658.
66
[164] M.F. Ran, W.J. Sun, Y. Liu, W. Chu, C.F. Jiang, J. Solid State Chem., 197 (2013) 517-522. [165] J.H. Zhang, J.L. Wang, H.L. Wang, L. Jia, Z.K. Qu, Y.T. Qian, Chin. Sci. Bull., 56 (2011) 3199-3203. [166] F. Zaragoza-Martín, D. Sopeña-Escario, E. Morallón, C.S.-M. de Lecea, Journal of Power Sources, 171 (2007) 302-309. [167] Y.-H. Qin, H.-H. Yang, X.-S. Zhang, P. Li, C.-A. Ma, International Journal of Hydrogen Energy, 35 (2010) 7667-7674. [168] S. Sharma, A. Ganguly, P. Papakonstantinou, X. Miao, M. Li, J.L. Hutchison, M. Delichatsios, S. Ukleja, The Journal of Physical Chemistry C, 114 (2010) 19459-19466. [169] J. Yang, C. Tian, L. Wang, T. Tan, J. Yin, B. Wang, H. Fu, ChemPlusChem, 77 (2012) 301-307. [170] S. Yang, C. Shen, Y. Liang, H. Tong, W. He, X. Shi, X. Zhang, H.-j. Gao, Nanoscale, 3 (2011) 3277-3284. [171] Y. Peng, H.W. Liu, Ind. Eng. Chem. Res., 45 (2006) 6483-6488. [172] Y.Z. You, C.Y. Hong, C.Y. Pan, Macromol. Rapid Commun., 27 (2006) 2001-2006. [173] G.-W. Yang, G.-Y. Gao, G.-Y. Zhao, H.-L. Li, Carbon, 45 (2007) 3036-3041. [174] P. Wang, T. Jiang, C. Zhu, Y. Zhai, D. Wang, S. Dong, Nano Research, 3 (2010) 794-799. [175] Z. Sun, Z. Li, C. Huang, Y. Zhao, H. Zhang, R. Tao, Z. Liu, Carbon, 49 (2011) 4376-4384. [176] A.V. Talyzin, A. Dzwilewski, M. Pudelko, Carbon, 45 (2007) 2564-2569. [177] D.B. Williams, C.B. Carter, Transmission Electron Microscopy Part 1: Basics, Springer Science+Business Media, 2009. [178] X. Chen, S. Yang, K. Takeuchi, T. Hashishin, H. Iwanaga, S. Motojiima, Diamond and Related Materials, 12 (2003) 1836-1840. [179] X. Chen, S. Yang, S. Motojima, Materials Letters, 57 (2002) 48-54. [180] M.G. Yao, P. Stenmark, E. Abou-Hamad, F. Nitze, J.A. Qin, C. Goze-Bac, T. Wagberg, Carbon, 49 (2011) 1159-1166. [181] E. Abou-Hamad, C. Goze-Bac, F. Nitze, M. Schmid, R. Aznar, M. Mehring, T. Wagberg, New Journal of Physics, 13 (2011) art. no. 053045. [182] H.R. Barzegar, F. Nitze, A. Malolepszy, L. Stobinski, C.W. Tai, T. Wagberg, Molecules, 17 (2012) 6840-6853.