Embed Size (px)
Citation preview
University of Wisconsin MilwaukeeUWM Digital Commons
Theses and Dissertations
5-1-2016
Synthesis and Performance Analysis ofPolyurethane Foam Nanocomposite for ArsenicRemoval from Drinking WaterFaten Bakri HusseinUniversity of Wisconsin-Milwaukee
Follow this and additional works at: http://dc.uwm.edu/etd
Part of the Materials Science and Engineering Commons, and the Polymer Chemistry Commons
This Thesis is brought to you for free and open access by UWM Digital Commons. It has been accepted for inclusion in Theses and Dissertations by anauthorized administrator of UWM Digital Commons. For more information, please contact [email protected].
Recommended CitationHussein, Faten Bakri, "Synthesis and Performance Analysis of Polyurethane Foam Nanocomposite for Arsenic Removal from DrinkingWater" (2016). Theses and Dissertations. Paper 1154.
SYNTHESIS AND PERFORMANCE ANALYSIS OF
POLYURETHANE FOAM NANOCOMPOSITE FOR ARSENIC
REMOVAL FROM DRINKING WATER
by
Faten Bakri Hussein
A Thesis Submitted in
Partial Fulfillment of the
Requirements for the Degree of
Master of Science
in Engineering
at
The University of Wisconsin-Milwaukee
May 2016

ii
ABSTRACT
SYNTHESIS AND PERFORMANCE ANALYSIS OF
POLYURETHANE FOAM NANOCOMPOSITE FOR ARSENIC
REMOVAL FROM DRINKING WATER
by
Faten Bakri Hussein
The University of Wisconsin-Milwaukee, 2016
Under the Supervision of Professor Nidal H. Abu-Zahra
Water contamination by various heavy metal pollutants such as, Lead, Arsenic,
Cadmium, and Mercury, have severe toxic effects on living organisms and humans. High
concentrations of arsenic in drinking water cause serious damage to the central and peripheral
nervous systems, as well as, the dermal, cardiovascular, gastrointestinal, and respiratory systems.
Arsenic contamination of ground water poses a substantial concern in many countries throughout
the world, including the United States.
Considerable research work, aimed at finding and developing various separation and
treatment techniques, has been conducted over the past few decades. The conventional treatment
methods of arsenic involve coagulation with ferric chloride or aluminum sulfate coagulants,
followed by the separation of the produced insoluble products by settling, or by direct filtration
through sand beds. Other treatment techniques for arsenic removal are reverse osmosis, ion
exchange, lime softening, flotation, and adsorption on hydrated iron oxide or activated carbon.
Solid phase Nano-adsorbents are becoming the core of most recent works in removing heavy
metals due to their high capacity and affinity to heavy metal ions.
iii
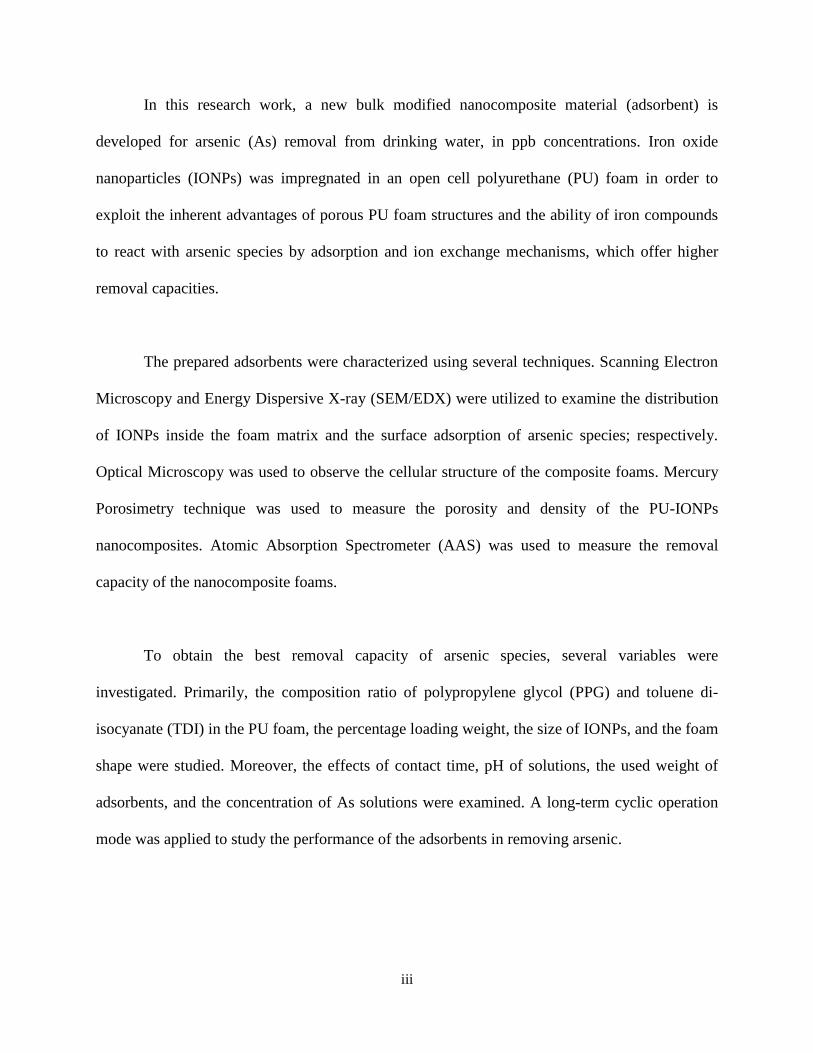
In this research work, a new bulk modified nanocomposite material (adsorbent) is
developed for arsenic (As) removal from drinking water, in ppb concentrations. Iron oxide
nanoparticles (IONPs) was impregnated in an open cell polyurethane (PU) foam in order to
exploit the inherent advantages of porous PU foam structures and the ability of iron compounds
to react with arsenic species by adsorption and ion exchange mechanisms, which offer higher
removal capacities.
The prepared adsorbents were characterized using several techniques. Scanning Electron
Microscopy and Energy Dispersive X-ray (SEM/EDX) were utilized to examine the distribution
of IONPs inside the foam matrix and the surface adsorption of arsenic species; respectively.
Optical Microscopy was used to observe the cellular structure of the composite foams. Mercury
Porosimetry technique was used to measure the porosity and density of the PU-IONPs
nanocomposites. Atomic Absorption Spectrometer (AAS) was used to measure the removal
capacity of the nanocomposite foams.
To obtain the best removal capacity of arsenic species, several variables were
investigated. Primarily, the composition ratio of polypropylene glycol (PPG) and toluene di-
isocyanate (TDI) in the PU foam, the percentage loading weight, the size of IONPs, and the foam
shape were studied. Moreover, the effects of contact time, pH of solutions, the used weight of
adsorbents, and the concentration of As solutions were examined. A long-term cyclic operation
mode was applied to study the performance of the adsorbents in removing arsenic.

iv
It was found that the composition ratio of PPG:TDI (1:2) with 12% IONPs yields the
highest affinity towards arsenic species, compared to other possible combinations, with a
removal capacity of 40% using single stage batch analysis. Experimental results revealed that
decreasing the size of IONPs from 50-100 nm to 15-20 nm yields a higher removal capacity. In
addition, granular adsorbents exhibit higher removal capacity compared to cubical shaped
adsorbents in the order of 20% - 100%. The uptake of As increased with time and the highest
removal capacity occurred at 24 hr. However, the rate of adsorption was rapid in the first 12 hr
after which the rate slowed down as the equilibrium state was approached.
The adsorption process of As is affected by the pH level of the contaminated solution.
The removed amount of As was found to be higher in acidic solutions compared to the basic
ones. The removed amount of As increased from 40 ppb to 60 ppb, when the weight of PU-
IONPs nanocomposite foam increased from 0.5 g to 2 g; respectively. As well as, the removal
capacity of arsenic decreased as the As concentration increased in the solution. In column study,
the adsorption of arsenic species was very rapid on the first few cycles with an approximately
50% arsenic removal within 2 cycles. After that, a constant increase in the removal rate occurred.
All arsenic species were removed in 22 cycles (approximately 9 days) of operating period.
Sorption isotherms models were applied to determine the adsorption mechanisms and
modeling parameters. The experimental data correlated well to Freundlich and Langmuir models
with R2 0.953 and 0.949; respectively. Kinetic models were applied to determine the mechanisms
which control the adsorption process. A pseudo-second-order model was found to be the best fit
model for the adsorption data.

v
The proposed system of polyurethane nanocomposite foam offers a potential for the
removal of arsenic with higher capacity at lower costs than conventional arsenic removal
systems. In addition, the incorporation of the adsorbent particles in a foam media allows for
easier post-treatment step. Multi-stage setup and applications can increase the removal capacity
significantly.

vi
© Copyright by Faten B. Hussein, 2016
All Rights Reserved

vii
To the greatest woman, who taught me how to be strong in the
hard times, My Lovely Mother.
To the greatest man, whom I am proud to be his daughter, My
Dear Father.
To the Kindest heart in this world, who keeps me in her
prayers all the times, My Grandmother.
viii
TABLE OF CONTENTS
ABSTRACT _________________________________________________________________ ii
LIST OF FIGURES ___________________________________________________________ x
LIST OF TABLES ___________________________________________________________ xiii
ACKNOWLEDGMENTS _____________________________________________________ xiv
CHAPTER 1 ________________________________________________________________ 1
1.1 Arsenic ____________________________________________________________________ 2
1.1.1 Arsenic Chemistry _________________________________________________________________ 2
1.1.2 Arsenic Toxicity ___________________________________________________________________ 4
1.1.3 Arsenic in Groundwater _____________________________________________________________ 6
1.2 Separation Techniques for Arsenic Removal _____________________________________ 8
1.2.1 Precipitative Processes ______________________________________________________________ 9
1.2.2 Adsorptive and Ion Exchange Processes _______________________________________________ 10
1.2.3 Membrane Processes_______________________________________________________________ 11
1.2.4 Emerging Technologies ____________________________________________________________ 13
1.3 Polyurethane Foam: An Overview ____________________________________________ 15
1.4 Literature Review: Arsenic Removal from Water ________________________________ 20
1.5 Research Objectives ________________________________________________________ 30
CHAPTER 2 _______________________________________________________________ 31
2.1 Materials _________________________________________________________________ 31
2.1.1 Polypropylene glycol ______________________________________________________________ 31
2.1.2 Toluene Di-isocyanate _____________________________________________________________ 32
2.1.3 Iron Oxide Nano Particles (IONPs) ___________________________________________________ 34
2.2 Synthesis and Characterization _______________________________________________ 35
2.2.1 Synthesis of PU Foam Nanocomposites ________________________________________________ 35
2.2.2 Characterization of PU Foam Nanocomposites __________________________________________ 37
2.3 Batch Sorption Experiments _________________________________________________ 40
2.4 Column Study _____________________________________________________________ 43
ix
CHAPTER 3 _______________________________________________________________ 44
3.1 Characterization Analysis ___________________________________________________ 44
3.1.1 Optical Microscope ________________________________________________________________ 44
3.1.2 SEM and EDX ___________________________________________________________________ 45
3.1.3 Porosity and Density _______________________________________________________________ 47
3.1.4 Open Cell Content ________________________________________________________________ 48
3.2 Performance Analysis _______________________________________________________ 49
3.2.1 Batch Sorption Studies _____________________________________________________________ 49
3.2.2 Column Study ____________________________________________________________________ 58
3.3 Sorption Isotherms Models __________________________________________________ 59
3.4 Sorption Kinetics Models ____________________________________________________ 61
CHAPTER 4 _______________________________________________________________ 65
REFERENCES ______________________________________________________________ 68
x
LIST OF FIGURES
Figure 1.1 Speciation of arsenic acid with pH [10]. ...................................................................... 4
Figure 1.2 Geological survey map of arsenic in groundwater of the US [20]. .............................. 7
Figure 1.3 Coagulation-Filtration process. .................................................................................... 9
Figure 1.4 Activated Alumina [25]. ............................................................................................. 11
Figure 1.5 Electrodialysis reversal system [27]. .......................................................................... 12
Figure 1.6 Global polyurethane market estimates and forecast, by product, 2012-2020, (Kilo
Tons). ............................................................................................................................................ 16
Figure 1.7 Concentration dependent adsorption kinetics of As(III) and As(V) ions using Fe3+ ion
incorporated PVA Fe nanofibers (10 mg, pH = 7) as a function of time [43]. ............................. 20
Figure 1.8 Prediction of equilibrium adsorption of As by different adsorption models (contact
time = 20 hours, mixing rate = 130 rpm, temperature = 22 °C) [45]. ........................................... 22
Figure 1.9 Removal of arsenic from synthetic solution by IOCSp column (Initial As
concentration = 1000 µg/L; weight of IOCSp = 25 g) [46]. ......................................................... 23
Figure 1.10 Variation of amount adsorbed with pH of nanocomposites [48]. ............................. 24
Figure 1.11 Adsorption efficiency of As (III) on polymer nanocomposites [48]. ....................... 25
Figure 1.12 Removal efficiency of arsenic using coated sand at different limestone
concentrations (LS limestone) [49]. .............................................................................................. 26
Figure 1.13 Effect of flow rate on the removal efficiency of As [49]. ........................................ 26
Figure 1.14 Adsorption of arsenate on granular ferric hydroxide as functions of pH and
concentration (concentration of granular ferric hydroxide, 10 g/L; arsenate concentration, 5-2000
ppm as As(V)) [51]. ...................................................................................................................... 28
Figure 2.1 Chemical structure of Polypropylene glycol [55]....................................................... 31
xi
Figure 2.2 Chemical structure of Toluene Di-isocyanate [59]..................................................... 33
Figure 2.3 TEM image of IONPs (15-20 nm) [64]. ..................................................................... 35
Figure 2.4 Experimental setup of PU foam.................................................................................. 36
Figure 2.5 AAS major components [69]. ..................................................................................... 40
Figure 2.6 Flow chart of batch sorption experiments. ................................................................. 42
Figure 2.7 Schematic of column experiment. .............................................................................. 43
Figure 3.1 Optical micrographs of PU-IONPs foams, (A): PPG:TDI ratio 1:2, (B): PPG:TDI
ratio 1:1.75. ................................................................................................................................... 44
Figure 3.2 SEM image of PU-IONPs nanocomposite at 500X magnification. ........................... 45
Figure 3.3 EDX mapping scan of PU nanocomposite foam. ....................................................... 46
Figure 3.4 EDX elemental analysis, (A): PU-IONPs adsorbent before exposure to As solution, ...
(B): PU-IONPs adsorbent after exposure to As solution. ............................................................. 47
Figure 3.5 Cumulative intrusion vs pore size diameter. (A): PPG:TDI 1:2, (B): PPG:TDI 1:1.7…
…….……………………………………………………………………………………………...48
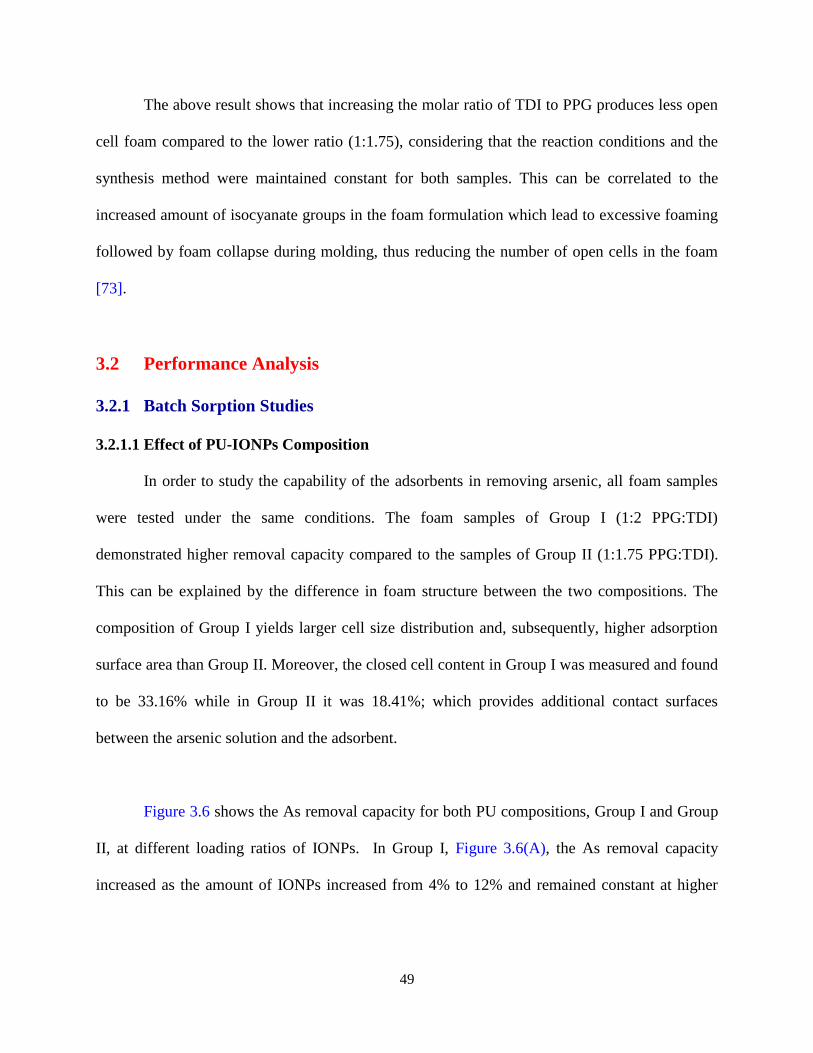
Figure 3.6 (A): Removal capacity of Group-I samples with composition ratio 1:2 (PPG:TDI),
(B): Removal capacity of Group-II samples with composition ratio 1:1.75 (PPG:TDI). ............. 50
Figure 3.7 Effect of IONPs size on the As removal capacity. (A): PPG:TDI 1:2, (B): PPG:TDI
1:1.75. ........................................................................................................................................... 51
Figure 3.8 (A): Arsenic removal capacity of composition ratio 1:2 (PPG:TDI), (B): Arsenic
removal capacity of composition ratio 1:1.75 (PPG:TDI), with granular shape and two size
ranges of IONPs; 15-20 nm and 50-100 nm. ................................................................................ 52
Figure 3.9 Effect of contact time on the removal capacity of As, using (A) PPG:TDI ratio (1:2)-
Cube, (B) PPG:TDI ratio (1:1.75)-Cube, and (C) PPG:TDI (1:1.75)-Granular. .......................... 54
xii
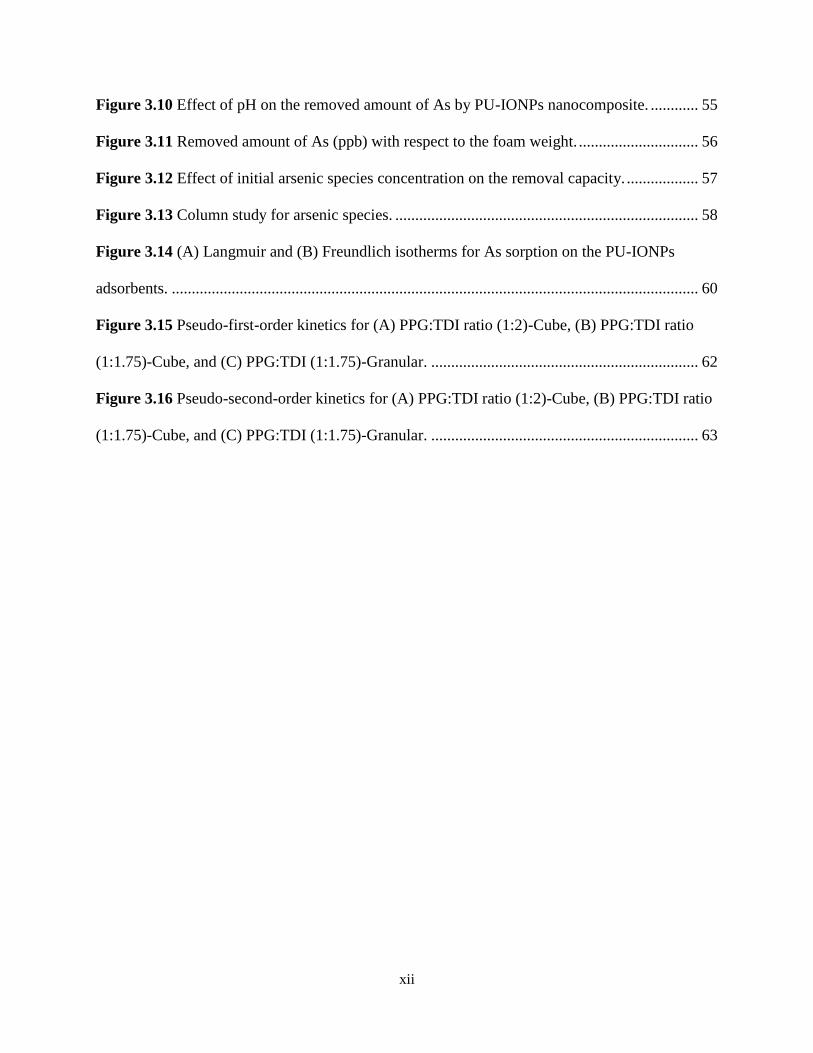
Figure 3.10 Effect of pH on the removed amount of As by PU-IONPs nanocomposite. ............ 55
Figure 3.11 Removed amount of As (ppb) with respect to the foam weight. .............................. 56
Figure 3.12 Effect of initial arsenic species concentration on the removal capacity. .................. 57
Figure 3.13 Column study for arsenic species. ............................................................................ 58
Figure 3.14 (A) Langmuir and (B) Freundlich isotherms for As sorption on the PU-IONPs
adsorbents. .................................................................................................................................... 60
Figure 3.15 Pseudo-first-order kinetics for (A) PPG:TDI ratio (1:2)-Cube, (B) PPG:TDI ratio
(1:1.75)-Cube, and (C) PPG:TDI (1:1.75)-Granular. ................................................................... 62
Figure 3.16 Pseudo-second-order kinetics for (A) PPG:TDI ratio (1:2)-Cube, (B) PPG:TDI ratio
(1:1.75)-Cube, and (C) PPG:TDI (1:1.75)-Granular. ................................................................... 63
xiii
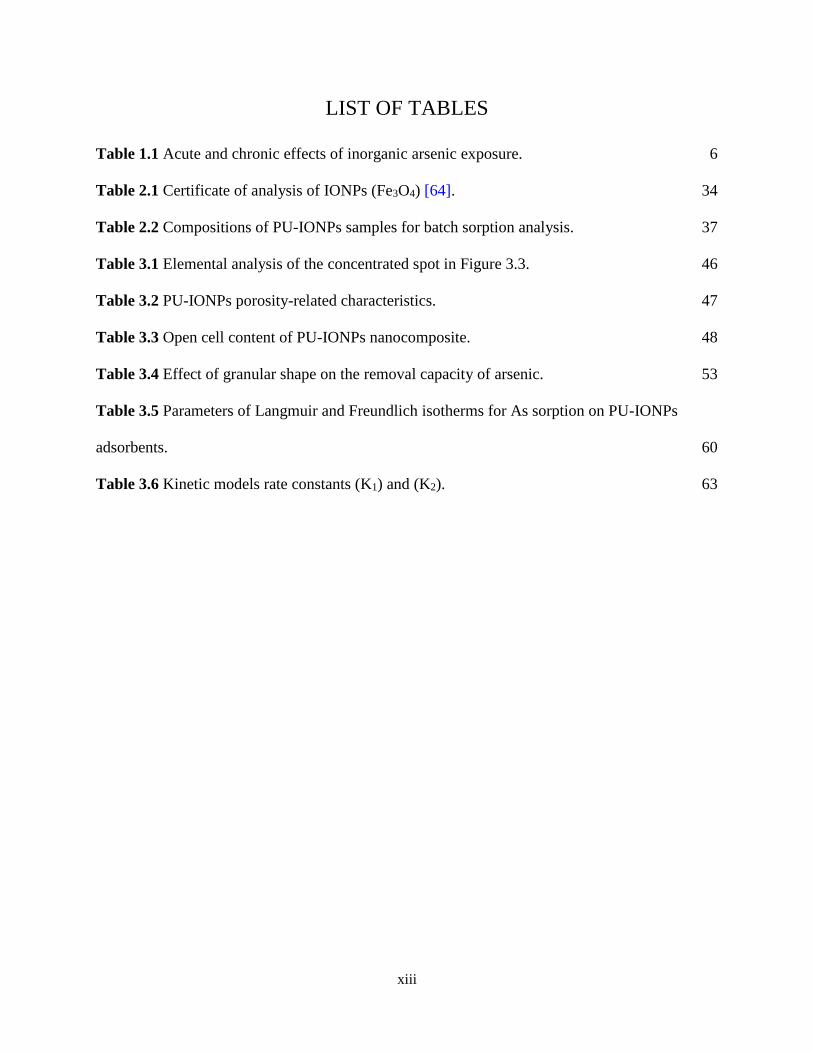
LIST OF TABLES
Table 1.1 Acute and chronic effects of inorganic arsenic exposure. 6
Table 2.1 Certificate of analysis of IONPs (Fe3O4) [64]. 34
Table 2.2 Compositions of PU-IONPs samples for batch sorption analysis. 37
Table 3.1 Elemental analysis of the concentrated spot in Figure 3.3. 46
Table 3.2 PU-IONPs porosity-related characteristics. 47
Table 3.3 Open cell content of PU-IONPs nanocomposite. 48
Table 3.4 Effect of granular shape on the removal capacity of arsenic. 53
Table 3.5 Parameters of Langmuir and Freundlich isotherms for As sorption on PU-IONPs
adsorbents. 60
Table 3.6 Kinetic models rate constants (K1) and (K2). 63
xiv
ACKNOWLEDGMENTS
In the first place, I owe my gratitude to my God (Allah) who granted and still grants me
invaluable blessings. I thank you for your will to let me do my masters and writing my thesis.
You always give me reasons to make my goals achieved, and those could be persons, situations,
and events.
From that belief, I have to seize the opportunity in this part to express my deepest gratitude and
appreciations to my advisor, Dr. Nidal Abu-Zahra. I have been amazingly privileged to have an
advisor who gave me the freedom to explore on my own, and at the same time the guidance to
recover when my steps paused. Thank you for your supporting to get this work done. What is
mostly meant to me, is that you gave the chance and opened the door for me to get here and
pursue my graduate study while others closed it. I will never forget your favor for the rest of my
life.
I am grateful for Dr. Benjamin Church and Dr. Patrick McNamara for being in my examination
committee. Thank you for your time, as well as, your advice and encouragements I earned from
you during my time here. I extend my grateful to all academic staff, colleagues, and friends I
knew in UW-Milwaukee and they were of help to me to accomplish my research work. Without
whom none of my success would be possible.

xv
At the end, no words can describe how much I am grateful to my parents (Bakri and Aysheh).
You believe in my abilities and in my ambitions. You were and are supporting me all the times
to do what is right for me. I could not be beside you during your hardship to help you, but I hope
you will be proud when I graduate.
I would like to express my heartfelt thankfulness to my sister’s and aunts’ families in the USA
(Sondos, Lubna, and Leena) who have supported me throughout this hard journey. I will not
forget to thank my sisters (Tasneem, Baraa, and Bayan), as well as, my friend Hana who took
care of me as her little sister and my friends in Jordan.
1
CHAPTER 1
INTRODUCTION
Water pollution by many heavy metal pollutants like Arsenic have serious toxic effects
on humans and living organisms. A significant research work, aimed at finding and developing
various separation and treatment techniques, has been conducted over the past few decades. In
my research work, a new bulk modified nanocomposite material (adsorbent) is developed for
arsenic (As) removal from drinking water, in ppb concentrations.
My thesis outline can be described in the following sequence: In chapter 1, five major
sections are included to provide a comprehensive introduction to the research topic. Basic
material from different aspects (chemistry, biology, and geology) is mentioned and related to
arsenic. Important separation techniques such as, precipitation, adsorption, and ion exchange
along with extensive literature review on arsenic removal are included. An overview is
introduced about polyurethane foam and its chemistry.
Chapter 2 presents the experimental work of my research work. The raw materials,
experiment setup, synthesis and characterization of PU-IONPs are included. Moreover,
schematic charts clarify the batch sorption experiments and the circulation mode of column
study. In chapter 3, the outcomes of PU-IONPs characterization analysis besides the performance
analysis, for different experimental conditions, are presented and discussed. Chapter 4 includes
the major conclusions that can be drawn from the outcomes of this research work.
2
1.1 Arsenic
1.1.1 Arsenic Chemistry
Arsenic element (As) is located in group 15 of the periodic table along with Nitrogen,
Phosphorus, and Bismuth. The atomic mass of arsenic is ~75 amu and the atomic number is 33.
Various isotopes of As were found and reported to be radioactive [1-3]; however, the only stable
(nonradioactive) and naturally occurring isotopes of arsenic is arsenic-75, where each nucleus of
the isotope contains 42 neutrons and 33 protons; i.e., a total mass number of 75. The isotope that
has the longest half-life, 80.3 days, is arsenic-73 [2].
The valence state and the coordination number (i.e., the number of surrounding atoms)
affect the size of an arsenic atom, significantly. When valence electrons are removed from an
atom, the radius of the atom decreases not only because of the removal of the electrons but also
from the protons attracting the remaining electrons closer to the nucleus [4]. In addition, an
increase in the coordination number will distort the electron cloud of an ion and change its ionic
radius [5]. The valence states of arsenic are -3, 0, +3, and +5. In natural water, arsenic commonly
occurs as +3 and +5. As(III) and As(V) bond with oxygen to form inorganic arsenite and
arsenate; respectively.
In reducing groundwater and hydrothermal water, As(III) typically occurs in many forms
such as, H3AsO3, H2AsO3−, and HAsO3
2−; whereas, in oxidizing groundwater and surface water
As(V) is more common and typically occurs in forms like H3AsO4, H2AsO4−, and HAsO4
2−. The
factor which determines the possibility of having one formula over another is pH values.
3
The redox reaction of arsenic species is a significant factor in effective water treatment
techniques. The oxidation of arsenic can be achieved by adding chemical oxidants; e.g., Fe(III),
Mn(III,VI), Nitrate (NO3−) or natural organic matter (NOM) [6-8]. The presence of poorly
crystalline solid oxidants allows for further improvement toward the oxidation of As(III) to
As(V), as a result of having high surface areas and if the reactions are catalyzed by light [9]. The
oxidation reaction of As(III) to As(V) can be expressed through the following chemical reaction:
2H3AsO3 + O2 →H2AsO4− + HAsO4
2− + 3H+ (1.1)
Oxygen in water treatment systems is slow to oxidize arsenic; therefore, chemical oxidants are
needed to convert As(III) into more reactive As(V).
The reduction of arsenic As(V) into As(III) occurs in natural subsurface where common
reductants such as, hydrogen sulfide (H2S) and organic carbon are available. In general, As(V)
converts faster into As(III) in reducing environments than As(III) transforms into As(V) under
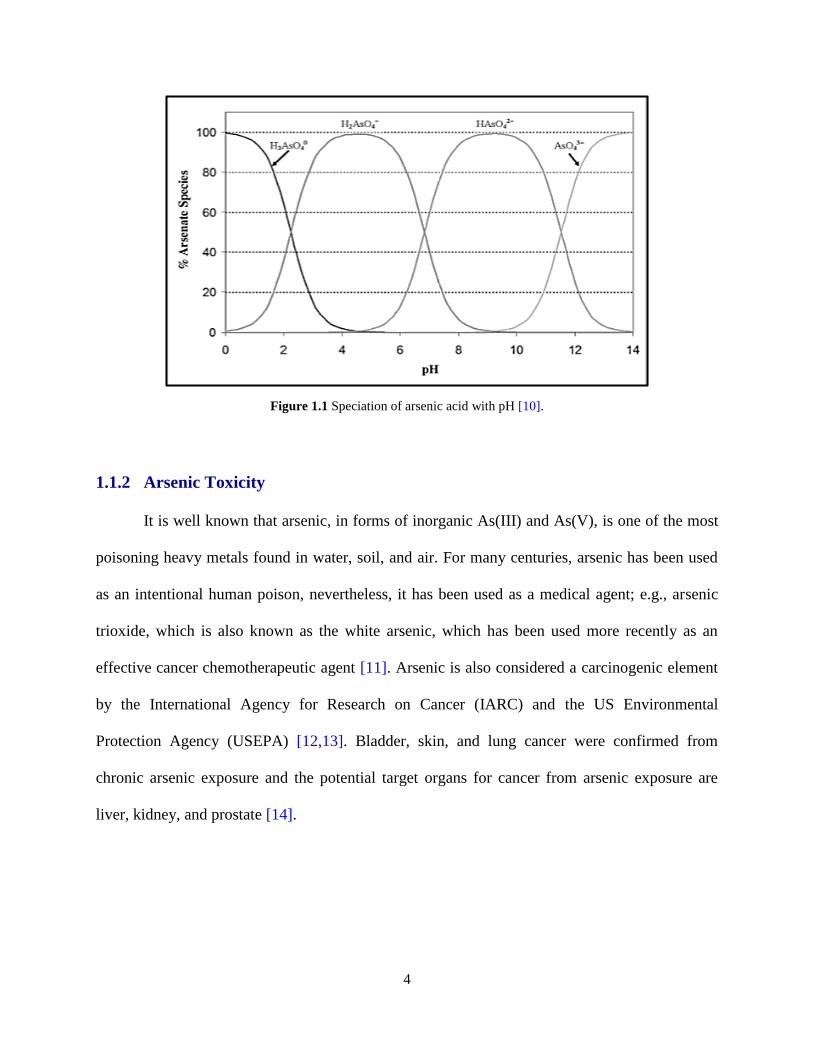
oxidizing conditions [9]. The main form of arsenic in toxic natural water is usually dissolved
arsenic acid; which consists of H3AsO4 under very acidic conditions (pH < 2) and its associated
anions (H2AsO4−, HAsO4
2−, and/or AsO43−) in less acidic, neutral, and alkaline water [10]. Figure
1.1 illustrates the distribution of arsenic acids at different pH values.
4
1.1.2 Arsenic Toxicity
It is well known that arsenic, in forms of inorganic As(III) and As(V), is one of the most
poisoning heavy metals found in water, soil, and air. For many centuries, arsenic has been used
as an intentional human poison, nevertheless, it has been used as a medical agent; e.g., arsenic
trioxide, which is also known as the white arsenic, which has been used more recently as an
effective cancer chemotherapeutic agent [11]. Arsenic is also considered a carcinogenic element
by the International Agency for Research on Cancer (IARC) and the US Environmental
Protection Agency (USEPA) [12,13]. Bladder, skin, and lung cancer were confirmed from
chronic arsenic exposure and the potential target organs for cancer from arsenic exposure are
liver, kidney, and prostate [14].
Figure 1.1 Speciation of arsenic acid with pH [10].
5
The ultimate exposure routes of arsenic can occur through inhalation, ingestion, and
dermal contact. Inhalation may involve exposure to vapor, dust particles or mists, ingestion
occurs through eating or drinking contaminated food or water by arsenic. The effective dose of
arsenic received for each exposure route is dependent on the following factors [11]:
a. The concentration of arsenic in the contaminated medium.
b. The relevant volume-mass-area of the medium.
c. The bioavailability, which is defined as a function of the chemical and/or physical
form of arsenic in the relevant medium.
d. The oxidation state of arsenic.
The clinical signs of acute oral arsenic toxicity are progressive and depend on the
valence, form, and dose of the arsenicals (e.g., arsine, arsenate, arsenite). It was found that the
fatal range of inorganic arsenic is estimated at 1-3 mg As/kg [15]. In addition, death may occur
within 24 hr to 4 days, based on the amount of consumed arsenic, due to the massive fluid loss
which leads to dehydration, decreased blood volume, and circulatory collapse. Table 1.1 lists the
symptoms of acute and chronic arsenic poisoning [16,17].
6
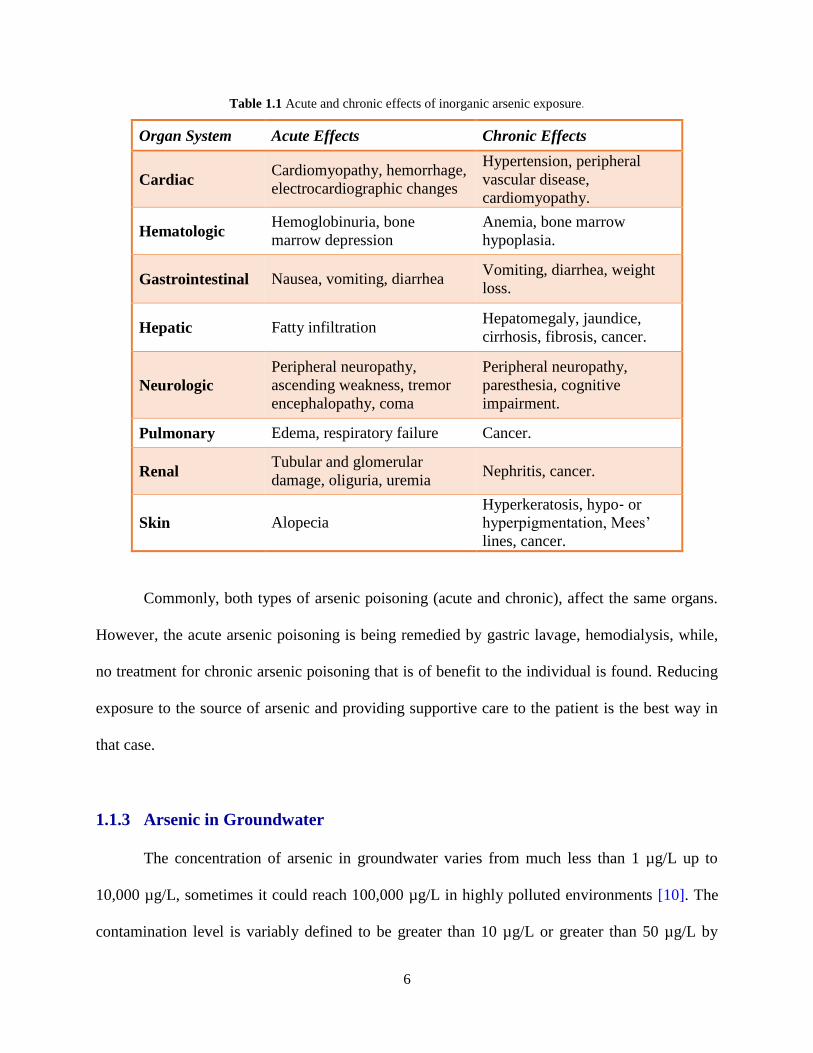
Table 1.1 Acute and chronic effects of inorganic arsenic exposure.
Organ System Acute Effects Chronic Effects
Cardiac Cardiomyopathy, hemorrhage,
electrocardiographic changes
Hypertension, peripheral
vascular disease,
cardiomyopathy.
Hematologic Hemoglobinuria, bone
marrow depression
Anemia, bone marrow
hypoplasia.
Gastrointestinal Nausea, vomiting, diarrhea Vomiting, diarrhea, weight
loss.
Hepatic Fatty infiltration Hepatomegaly, jaundice,
cirrhosis, fibrosis, cancer.
Neurologic
Peripheral neuropathy,
ascending weakness, tremor
encephalopathy, coma
Peripheral neuropathy,
paresthesia, cognitive
impairment.
Pulmonary Edema, respiratory failure Cancer.
Renal Tubular and glomerular
damage, oliguria, uremia Nephritis, cancer.
Skin Alopecia Hyperkeratosis, hypo‐ or
hyperpigmentation, Mees’
lines, cancer.
Commonly, both types of arsenic poisoning (acute and chronic), affect the same organs.
However, the acute arsenic poisoning is being remedied by gastric lavage, hemodialysis, while,
no treatment for chronic arsenic poisoning that is of benefit to the individual is found. Reducing
exposure to the source of arsenic and providing supportive care to the patient is the best way in
that case.
1.1.3 Arsenic in Groundwater
The concentration of arsenic in groundwater varies from much less than 1 µg/L up to
10,000 µg/L, sometimes it could reach 100,000 µg/L in highly polluted environments [10]. The
contamination level is variably defined to be greater than 10 µg/L or greater than 50 µg/L by
7
different agencies [18]. The foremost sources of arsenic in groundwater are geothermal fluids;
anthropogenic sources (mining, industry, and pesticides); microbial mediated reductive
dissolution of arsenic‐bearing iron host phases and of As(V) in reducing aquifers; and desorption
of mineral‐bound arsenic in oxidizing aquifers.
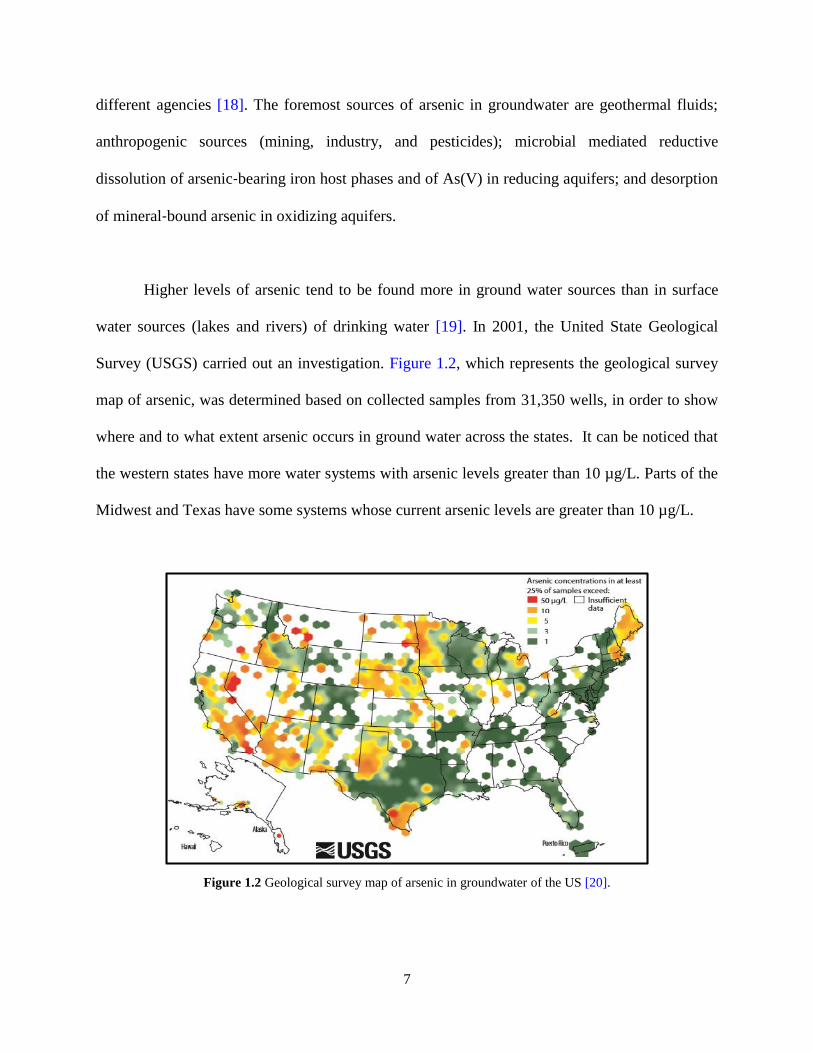
Higher levels of arsenic tend to be found more in ground water sources than in surface
water sources (lakes and rivers) of drinking water [19]. In 2001, the United State Geological
Survey (USGS) carried out an investigation. Figure 1.2, which represents the geological survey
map of arsenic, was determined based on collected samples from 31,350 wells, in order to show
where and to what extent arsenic occurs in ground water across the states. It can be noticed that
the western states have more water systems with arsenic levels greater than 10 µg/L. Parts of the
Midwest and Texas have some systems whose current arsenic levels are greater than 10 µg/L.
Figure 1.2 Geological survey map of arsenic in groundwater of the US [20].
8
Overall, knowledge of the extent of high arsenic groundwater concentration is increasing
year‐on‐year; therefore, such distribution maps are likely to change significantly in the future as
a result of changing the environmental conditions and the human activities. In the absence of
comprehensive global data coverage, geostatistics‐based predictive tools are useful indicators of
where such further hazards may exist [21,22].
1.2 Separation Techniques for Arsenic Removal
The distribution and behavior of arsenic species have a significant role in water
remediation. Current separation methods typically perform more effectively in removing
arsenate, however, pre-oxidation can be used to convert arsenite to arsenate, as well as,
adjustment of pH can improve the performance of arsenic removal systems. Arsenic removal
technologies can be classified into the following categories [11]:
a. Precipitative processes (e.g., coagulation/filtration, lime softening).
b. Adsorptive processes; such, as activated alumina.
c. Ion exchange process.
d. Membrane processes (e.g., reverse osmosis (RO), electrodialysis reversal and
filtration).
e. Emerging technologies (e.g., granular ferric hydroxide, iron oxide‐coated sand).
f. Biological treatment.
9
In addition to the above methods, blending of water is another efficient treatment option
when arsenic concentrations are somewhat above the maximum contaminant level (MCL). In
that case, raw water can be blended with water from another source with lower arsenic
concentrations, or it can be blended with water that has been treated previously. Reducing the
costs of chemical usage, extending the life of the treatment medium, and reducing the overall
operating costs summarize the advantages of this method.
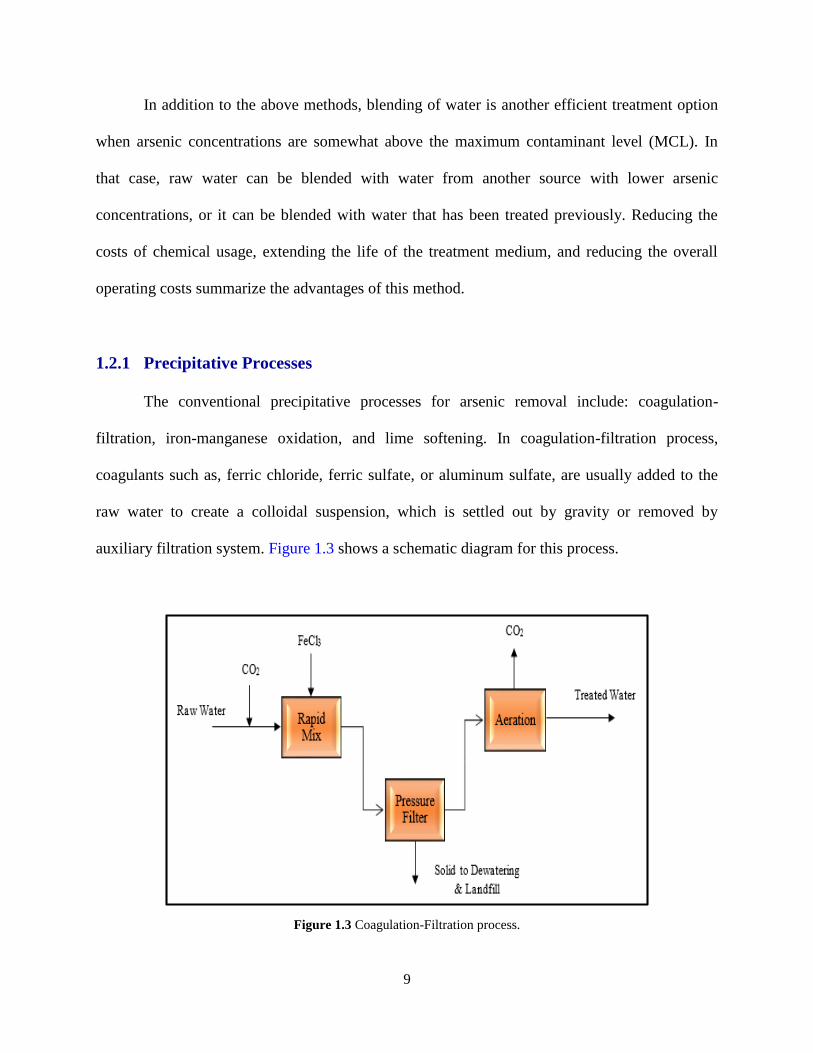
1.2.1 Precipitative Processes
The conventional precipitative processes for arsenic removal include: coagulation-
filtration, iron-manganese oxidation, and lime softening. In coagulation-filtration process,
coagulants such as, ferric chloride, ferric sulfate, or aluminum sulfate, are usually added to the
raw water to create a colloidal suspension, which is settled out by gravity or removed by
auxiliary filtration system. Figure 1.3 shows a schematic diagram for this process.
Figure 1.3 Coagulation-Filtration process.
10
Lime softening methods, where lime or sodium carbonate is added to water, can be used
as a batch treatment to precipitate carbonates or to remove arsenic in large systems. The process
efficiency is a function of pH and it can be increased by oxidation of As(III) to As(V). Large
amounts of sludge are produced during lime softening, and disposal of the sludge is expensive.
In almost all cases, construction of a lime softening plant for removing arsenic would not be
practical unless the water also required removal of excessive hardness [23]. Besides that, Iron-
manganese oxidation method is also used for removing arsenic from groundwater, but it is noted
that arsenic removal during manganese precipitation is less effective than with iron.
1.2.2 Adsorptive and Ion Exchange Processes
In this technique, arsenic removal is achieved by sorption of ions onto a chemically
modified surface of solid adsorbents like activated alumina (Figure 1.4), which is produced by
dehydration of aluminum hydroxide. Even though the removal process with activated alumina is
considered to be an adsorption mechanism, the chemical reaction also involves ions exchange
[24]. Regeneration solution such as, NaOH and acid neutralization, is required when the
adsorptive capacity of activated alumina is exhausted, The optimum pH range for arsenic
removal with activated alumina is from 5.5 to 6, and the pH should always be held below 8.2
because activated alumina then has a net positive charge, which increases its effectiveness for
removing anionic arsenic species [11].
11
The efficiency of ion exchange, where ions on a solid phase are exchanged for ions in
water, is affected by the water quality parameters; e.g., pH, alkalinity, competing ions, and
arsenic concentration, in addition to the type of resin or solid phase. Factors which influence the
suitability of ion exchange for a particular application are resin fouling, disposal of the
regeneration solution, disposal of bed resin, and other design considerations [26].
1.2.3 Membrane Processes
Arsenic removal by membrane processes had been applied as separation techniques in
many studies. These membranes act as selective barriers toward the contaminants. The driving
forces in membrane process can be pressure, concentration, electrical potential, and temperature
gradient. For arsenic removal, the membrane processes consist of reverse osmosis (RO) and
electrodialysis reversal. In RO, a pressure gradient is created across the membrane that exceeds
the osmotic pressure of the treated water. The performance of RO is hindered by iron, silica,
Figure 1.4 Activated Alumina [25].

12
manganese, and turbidity. Also, it is strongly influenced by the type of membrane and operating
conditions. RO is more effective in removing As(V) than As(III) [23].
In electrodialysis reversal (EDR), ions are transferred through selectively permeable
membranes influenced by direct current electrical force. By this process, ions can be forced to
migrate toward a solution of greater concentration. As illustrated in Figure 1.5, Membranes in
the electrodialysis reversal process are placed in an array between opposing electrodes, with
alternating cation and anion exchange membranes.
The migration of cations or anions is governed by the direction of the negative or positive
electrodes, in which periodic reversal of the electrodes is used to minimize the potential for
fouling of electrodes [23].
Figure 1.5 Electrodialysis reversal system [27].
13
1.2.4 Emerging Technologies
The term emerging technologies includes the most innovative methods of arsenic
removal. Those include, but not exclusive to, granular ferric hydroxide, iron oxide‐coated sand,
titanium dioxide, photooxidation, and limestone‐based material. Many studies were conducted to
evaluate the capability and efficiency of such materials in removing arsenic.
Adsorption of arsenic on granular ferric hydroxide is a technique that proved to be
efficient for the treatment of contaminated water. A treatment capacity of 30,000-40,000 bed
volumes was reported, with effluent concentrations less than 10 µg/L [28]. With granular ferric
hydroxide, however, adsorption of arsenic decreases as pH increases, and competition from
phosphate can impede arsenic removal. The cost of granular ferric hydroxide can be quite high,
and regeneration of the material may not be practical [23]. Iron oxide‐coated sand was also
utilized in a fixed bed reactor for the removal of heavy metals, as well as arsenic. It provided
promising results. However, after exhaustion, the reactor bed must be regenerated by rinsing
with a regeneration solution, flushing with water, and neutralization with a strong acid. Likewise,
Iron oxide minerals have been used for arsenic removal from water [29].
A relatively new technique for arsenic removal, which is also accomplished by
adsorption of dissolved arsenate, exploited titanium dioxide. The removal efficiency can be
improved by photocatalytic oxidation of As(III) to As(V) before treatment with titanium dioxide
[30]. Meanwhile, potential drawbacks in its use are the necessity for backwashing and the
disposal of backwash water. Titanium dioxide has been used for arsenic removal in municipal
supplies in Arizona [11].
14
Photooxidation process mainly involves the oxidation of As(III) to As(V). In the presence
of light and naturally occurring materials that absorb light, this process can be greatly
accelerated. After oxidation, the As(V) can be removed by co-precipitation. The photochemical
process of oxidation can be achieved with ultraviolet lamp reactors or by sunlight‐assisted
photooxidation. Testing has shown substantial reduction of arsenic levels, even in the presence
of high levels of dissolved ferrous iron content, compared to arsenic content, since dissolved
Fe(II) would require additional chemical oxidant in an oxidation system [23].
Biological treatment of water refers to the use of living organisms or biological materials.
Living organisms such as, plants, fungi, or bacteria, were used to treat water contaminants, as
well as, biological materials; e.g., bones, biomass, hair, seeds, leaves, or wood were also utilized
to sorb and treat contaminants. In many research work [31-34], crop wastes, fungal biomass,
algae, and chitosan were chosen to investigate their potential in arsenic removal from water.
Living bacteria, fungi and plants may also treat arsenic in surface water, groundwater, soils,
sediments, and wastewater [35,36].
For arsenic, bioremediation includes the use of organisms or biological materials to
change redox, pH, or other ambient conditions so that arsenic is less mobile in the environment.
Biological treatment with fungi and bacteria must be carefully managed to avoid substantially
methylating inorganic arsenic into highly toxic methylarsine gasses [10].

15
1.3 Polyurethane Foam: An Overview
Polyurethane foams were early developed in the 1930s and started to grow since they
have been used in numerous extensive, as well as intensive applications, after World War II [37].
The main characteristic of polyurethane foams revolves in its capability to deliver a wide range
of cell structures, densities, rigidity and foam morphologies. Polyurethane foams are excessively
predictable in performance and known for their strength, durability and surface feel.
The main classification of polyurethane foams is Rigid, Flexible, and Semi-rigid/Flexible
Foams. Rigid polyurethane foams have high insulation ability along with its rigidity; therefore,
they are essentially used in automotive, construction, recreation and appliance applications. On
the other hand, flexible polyurethane foams reveal excellent elastic and deformation-recovery
characteristics since they are made with a shorter polyol and less functional groups. Flexible
polyurethane foams are suitable for packaging, furniture and flexible hoses.
In term of economics, polyurethane foams market occupies a massive sector as a result of
using polyurethane foam in a wide range of industrial processes. For example, the spray
polyurethane foam (SPF) industry was projected to grow at 13% per year from about $800
million in 2013 to $1.1 billion in 2015. Growth will surpass overall construction industry
expansion based on increased penetration of SPF in key residential and commercial applications.
However, the industry does face some challenges, including concerns over improper
installations. Within residential construction, walls and foundations are projected to be the
fastest-growing application. In commercial construction, roofing will remain the largest
application but exterior walls will be the fastest growing application at 23% annually [38].
16
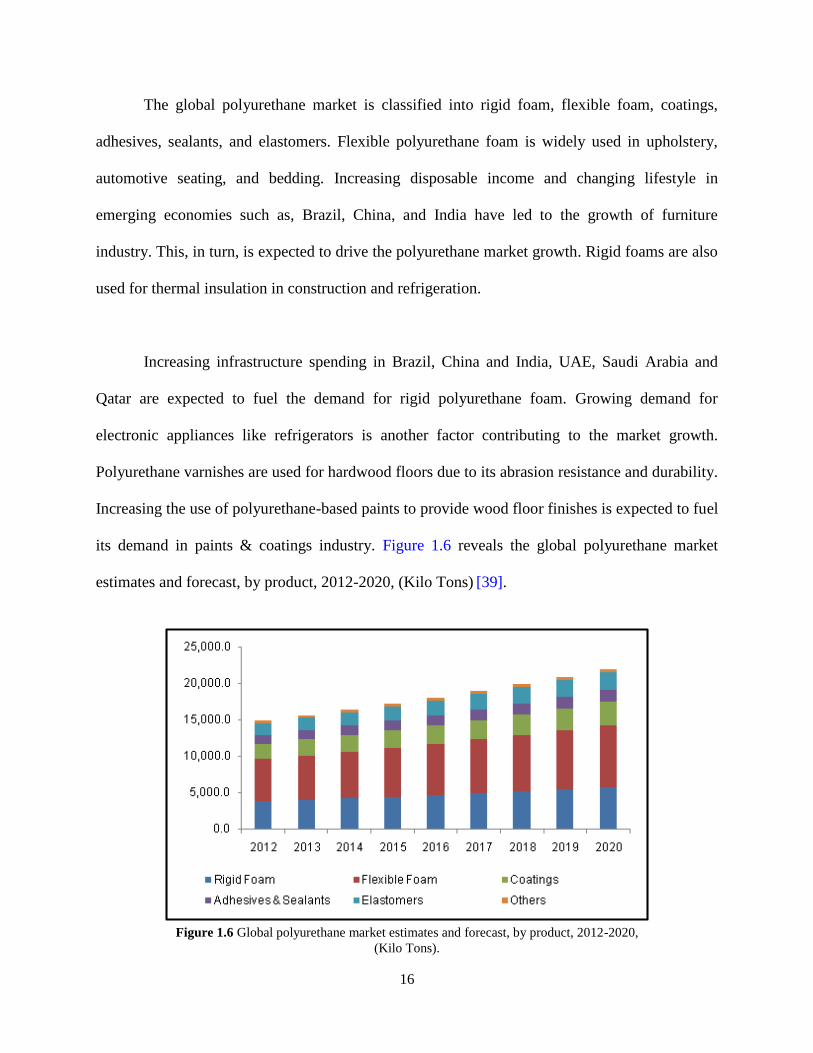
The global polyurethane market is classified into rigid foam, flexible foam, coatings,
adhesives, sealants, and elastomers. Flexible polyurethane foam is widely used in upholstery,
automotive seating, and bedding. Increasing disposable income and changing lifestyle in
emerging economies such as, Brazil, China, and India have led to the growth of furniture
industry. This, in turn, is expected to drive the polyurethane market growth. Rigid foams are also
used for thermal insulation in construction and refrigeration.
Increasing infrastructure spending in Brazil, China and India, UAE, Saudi Arabia and
Qatar are expected to fuel the demand for rigid polyurethane foam. Growing demand for
electronic appliances like refrigerators is another factor contributing to the market growth.
Polyurethane varnishes are used for hardwood floors due to its abrasion resistance and durability.
Increasing the use of polyurethane-based paints to provide wood floor finishes is expected to fuel
its demand in paints & coatings industry. Figure 1.6 reveals the global polyurethane market
estimates and forecast, by product, 2012-2020, (Kilo Tons) [39].
Figure 1.6 Global polyurethane market estimates and forecast, by product, 2012-2020,
(Kilo Tons).
17
Flexible polyurethane foams are composite structures that are characterized by a set of
physical properties such as, density, compressive modulus, and resiliency. The ultimate usage of
flexible polyurethane foam in applications, for instance, packaging, cushioning, and seating,
needs to control the elastomeric character of these foams. Flexible polyurethane foams are made
by the controlled entrapment of an expanding gas during the polymerization that forms urethane
linkages between polyfunctional alcohols and polyisocyanates. In practice, the polyfunctional
alcohol, or polyol, has a hydroxyl functionality of three or more, and the polyisocyanate is
generally a diisocyanate, or a polyisocyanate with a functionality of two to three, so the
polyurethane forms a cross-linked network (i.e., a thermoset elastomers) [37].
The cell structure, whether it is opened or closed, is another variable that must be
considered. During the generation of foams the gas is contained in cells that grow and expand the
foam and at the completion of the expansion of the foam, the gas cells may remain closed, or
they may open into a largely reticulated structure. If the cells remain closed, a closed-cell foam
will be generated and the compressive modulus of the foam will depend on the elasticity of the
polyurethane wall of the enclosed gas cell and the pneumatic properties of the assemblage of
small microcells constituting the foam. Closed-cell foams are useful in fabric insulation, as
interlayer, and in sports equipment like thin camping mattresses where the sponge effect of an
open-cell foam in contact with ground moisture would be undesirable. However, most of the
flexible foams are designed to be of an open-cell structure [37].

18
Sequences of three main chemical reactions are involved in polyurethane foam formation.
Firstly, isocyanate reacts with hydroxyl to form urethane, then the reaction of isocyanate with
water, involving a transit carbamic acid, to generate carbon dioxide and an amine. Finally, the
reaction of amine with isocyanate to form a urea linkage.
1.
Isocyanate Hydroxyl Urethane
2.
Isocyanate Water Carbamic acid Amine
3.
Isocyanate Amine Urea
The complexity arises from the close control or balance that is needed of the order in which the
specific reactions occurs during a comparatively fast series of reactions [40]. This balance is
achieved by the selection of catalysts and polyol reactivity [41].
19
The carbon dioxide, which results from the reaction, diffuses to nucleation sites at which
the gas cells start to grow by an accumulation of liberated carbon dioxide and by thermal
expansion. The nucleation sites are considered to be small air bubbles entrained in the liquid
mixture during the mixing of the components and stabilized by surfactant [42]. The number of
these sites are assumed to be constant throughout the formation process which leads to a stable
foam, as well as, it is controlled by the mixing mode and by the surfactant.
As the reaction proceeds, the liquid phase drains into struts and interstices as the walls
between the gas cells are thin. To keep the foam stable during these essential chemical and
physical processes, a carefully selected surfactant is used. The predominant reactions in the
earliest stages of the foaming process are the reactions to form ureas and polyureas by chain
extension in linear segments. At this stage, the foam formation is occurring but the polymer
molecular weight and the viscosity of foaming system stay proportionally low.
20
1.4 Literature Review: Arsenic Removal from Water
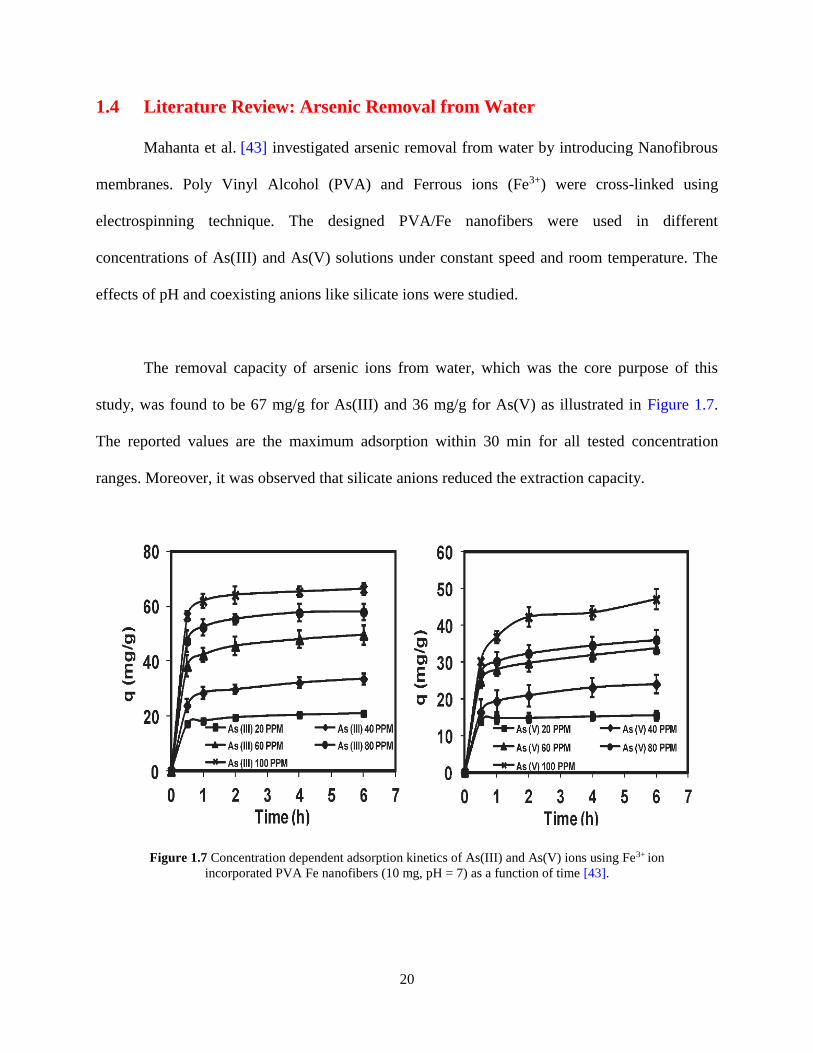
Mahanta et al. [43] investigated arsenic removal from water by introducing Nanofibrous
membranes. Poly Vinyl Alcohol (PVA) and Ferrous ions (Fe3+) were cross-linked using
electrospinning technique. The designed PVA/Fe nanofibers were used in different
concentrations of As(III) and As(V) solutions under constant speed and room temperature. The
effects of pH and coexisting anions like silicate ions were studied.
The removal capacity of arsenic ions from water, which was the core purpose of this
study, was found to be 67 mg/g for As(III) and 36 mg/g for As(V) as illustrated in Figure 1.7.
The reported values are the maximum adsorption within 30 min for all tested concentration
ranges. Moreover, it was observed that silicate anions reduced the extraction capacity.
Figure 1.7 Concentration dependent adsorption kinetics of As(III) and As(V) ions using Fe3+ ion
incorporated PVA Fe nanofibers (10 mg, pH = 7) as a function of time [43].
21
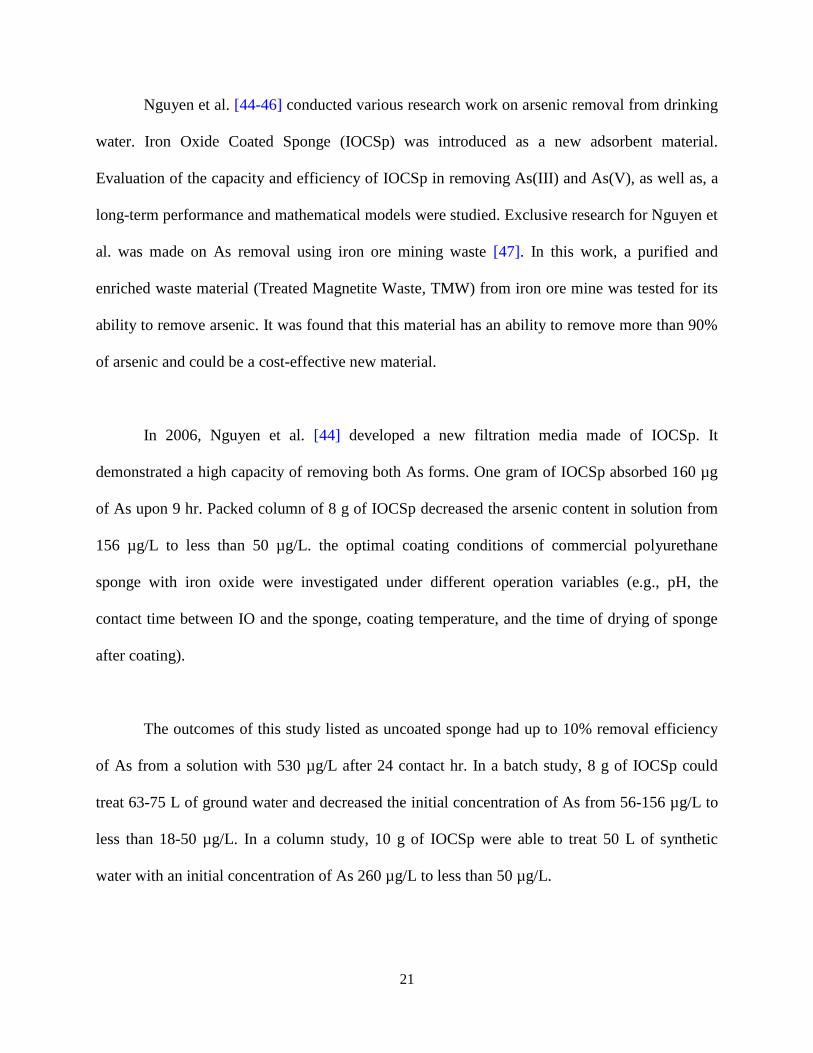
Nguyen et al. [44-46] conducted various research work on arsenic removal from drinking
water. Iron Oxide Coated Sponge (IOCSp) was introduced as a new adsorbent material.
Evaluation of the capacity and efficiency of IOCSp in removing As(III) and As(V), as well as, a
long-term performance and mathematical models were studied. Exclusive research for Nguyen et
al. was made on As removal using iron ore mining waste [47]. In this work, a purified and
enriched waste material (Treated Magnetite Waste, TMW) from iron ore mine was tested for its
ability to remove arsenic. It was found that this material has an ability to remove more than 90%
of arsenic and could be a cost-effective new material.
In 2006, Nguyen et al. [44] developed a new filtration media made of IOCSp. It
demonstrated a high capacity of removing both As forms. One gram of IOCSp absorbed 160 µg
of As upon 9 hr. Packed column of 8 g of IOCSp decreased the arsenic content in solution from
156 µg/L to less than 50 µg/L. the optimal coating conditions of commercial polyurethane
sponge with iron oxide were investigated under different operation variables (e.g., pH, the
contact time between IO and the sponge, coating temperature, and the time of drying of sponge
after coating).
The outcomes of this study listed as uncoated sponge had up to 10% removal efficiency
of As from a solution with 530 µg/L after 24 contact hr. In a batch study, 8 g of IOCSp could
treat 63-75 L of ground water and decreased the initial concentration of As from 56-156 µg/L to
less than 18-50 µg/L. In a column study, 10 g of IOCSp were able to treat 50 L of synthetic
water with an initial concentration of As 260 µg/L to less than 50 µg/L.

22
In their second research work, Nguyen et al. [45] introduced a safety process to treat the
exhausted IOCSp by Solidification/Stabilization with cement and fly Ash in the leachate. The
experiment was performed using IOCSp containing 12% of IO. A packed bucket (200 mm in
diameter and 350 mm in height) with 180 g of IOCSp was operated at normal pH = 6.5-7.3 and
filtration velocity of 50 ml/min.
The results of this pilot study showed that the As concentration was reduced from 480
µg/L in 1.5 m3 of contaminated natural water to below 40 µg/L. Meanwhile, a batch equilibrium
studies were conducted at pH = 7 and synthetic water with As concentration of 5 mg/L at room
temperature with different amounts of adsorbent (0.018 g to 1.296 g). The chosen contact time
was 20 hr and 130 rpm for shaking the samples, the results are illustrated in Figure 1.8.
Figure 1.8 Prediction of equilibrium adsorption of As by different adsorption models
(contact time = 20 hours, mixing rate = 130 rpm, temperature = 22 °C) [45].
23
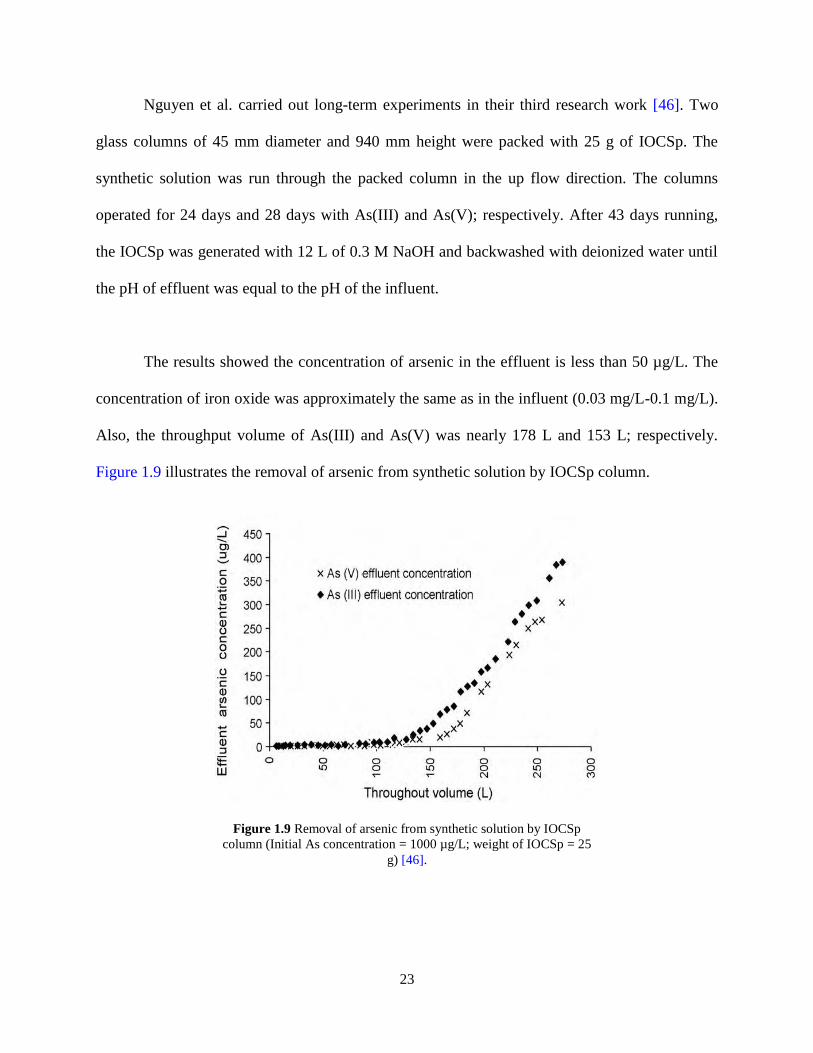
Nguyen et al. carried out long-term experiments in their third research work [46]. Two
glass columns of 45 mm diameter and 940 mm height were packed with 25 g of IOCSp. The
synthetic solution was run through the packed column in the up flow direction. The columns
operated for 24 days and 28 days with As(III) and As(V); respectively. After 43 days running,
the IOCSp was generated with 12 L of 0.3 M NaOH and backwashed with deionized water until
the pH of effluent was equal to the pH of the influent.
The results showed the concentration of arsenic in the effluent is less than 50 µg/L. The
concentration of iron oxide was approximately the same as in the influent (0.03 mg/L-0.1 mg/L).
Also, the throughput volume of As(III) and As(V) was nearly 178 L and 153 L; respectively.
Figure 1.9 illustrates the removal of arsenic from synthetic solution by IOCSp column.
Figure 1.9 Removal of arsenic from synthetic solution by IOCSp
column (Initial As concentration = 1000 µg/L; weight of IOCSp = 25
g) [46].
24
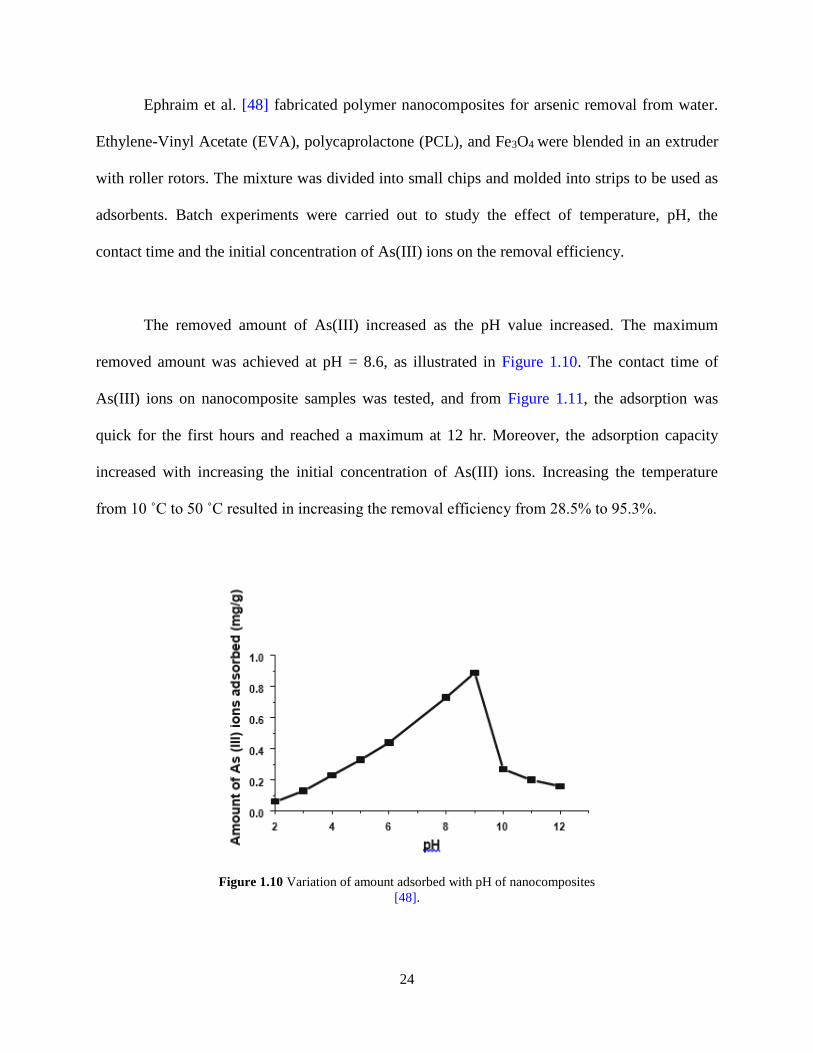
Ephraim et al. [48] fabricated polymer nanocomposites for arsenic removal from water.
Ethylene-Vinyl Acetate (EVA), polycaprolactone (PCL), and Fe3O4 were blended in an extruder
with roller rotors. The mixture was divided into small chips and molded into strips to be used as
adsorbents. Batch experiments were carried out to study the effect of temperature, pH, the
contact time and the initial concentration of As(III) ions on the removal efficiency.
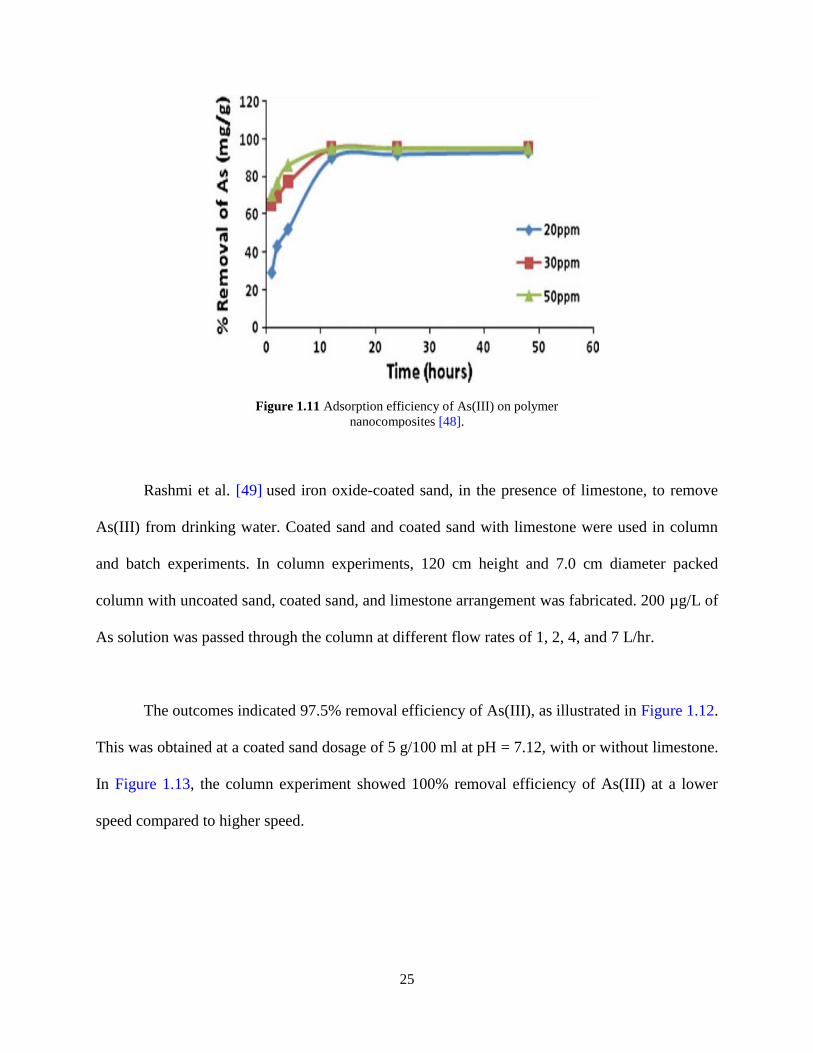
The removed amount of As(III) increased as the pH value increased. The maximum
removed amount was achieved at pH = 8.6, as illustrated in Figure 1.10. The contact time of
As(III) ions on nanocomposite samples was tested, and from Figure 1.11, the adsorption was
quick for the first hours and reached a maximum at 12 hr. Moreover, the adsorption capacity
increased with increasing the initial concentration of As(III) ions. Increasing the temperature
from 10 ˚C to 50 ˚C resulted in increasing the removal efficiency from 28.5% to 95.3%.
Figure 1.10 Variation of amount adsorbed with pH of nanocomposites
[48].
25
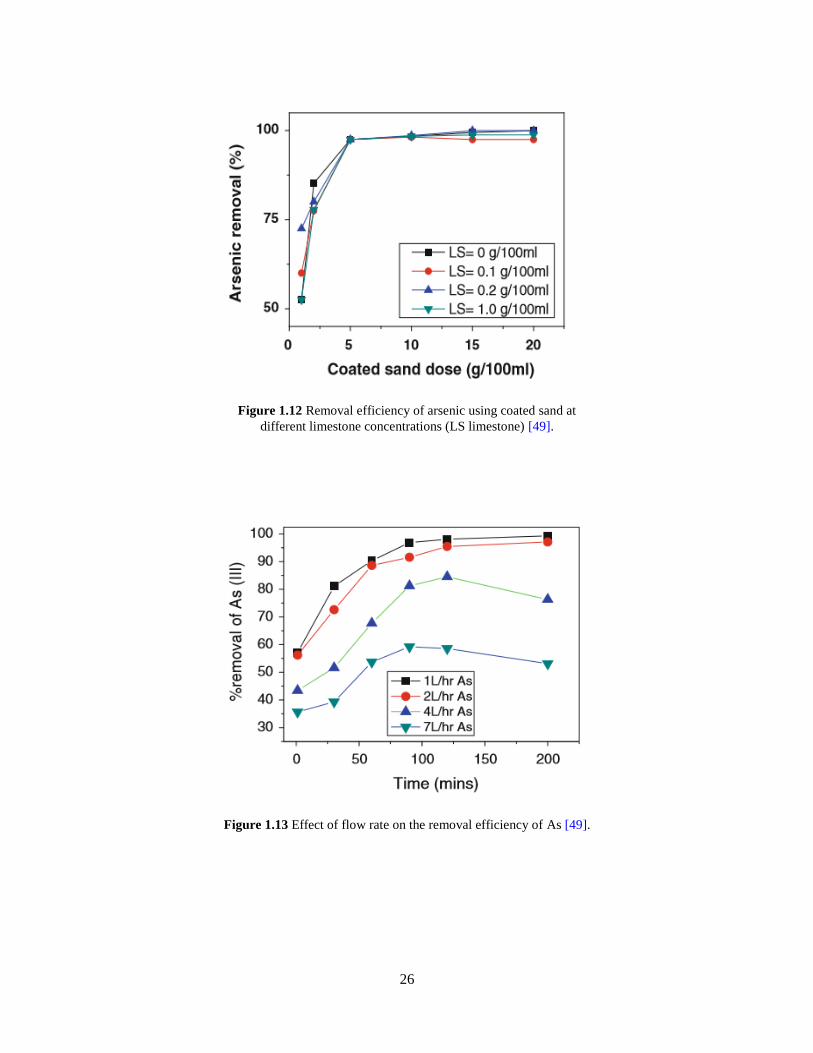
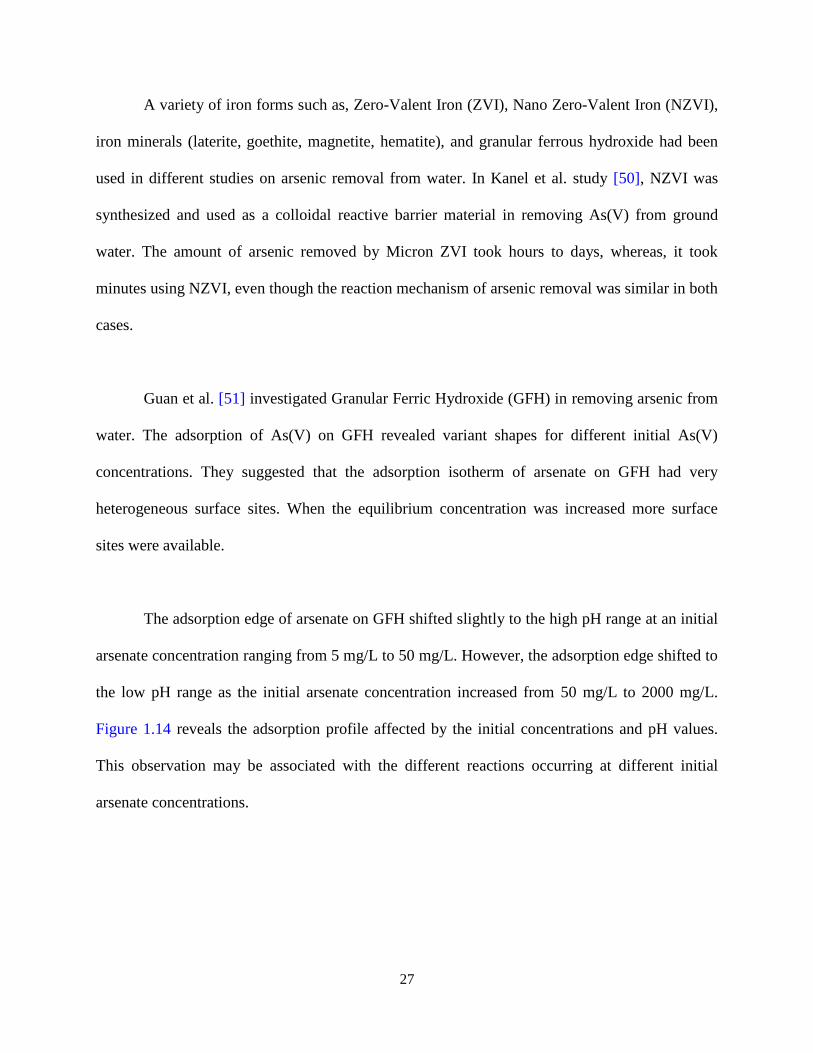
Rashmi et al. [49] used iron oxide-coated sand, in the presence of limestone, to remove
As(III) from drinking water. Coated sand and coated sand with limestone were used in column
and batch experiments. In column experiments, 120 cm height and 7.0 cm diameter packed
column with uncoated sand, coated sand, and limestone arrangement was fabricated. 200 µg/L of
As solution was passed through the column at different flow rates of 1, 2, 4, and 7 L/hr.
The outcomes indicated 97.5% removal efficiency of As(III), as illustrated in Figure 1.12.
This was obtained at a coated sand dosage of 5 g/100 ml at pH = 7.12, with or without limestone.
In Figure 1.13, the column experiment showed 100% removal efficiency of As(III) at a lower
speed compared to higher speed.
Figure 1.11 Adsorption efficiency of As(III) on polymer
nanocomposites [48].
26
Figure 1.12 Removal efficiency of arsenic using coated sand at
different limestone concentrations (LS limestone) [49].
Figure 1.13 Effect of flow rate on the removal efficiency of As [49].
27
A variety of iron forms such as, Zero-Valent Iron (ZVI), Nano Zero-Valent Iron (NZVI),
iron minerals (laterite, goethite, magnetite, hematite), and granular ferrous hydroxide had been
used in different studies on arsenic removal from water. In Kanel et al. study [50], NZVI was
synthesized and used as a colloidal reactive barrier material in removing As(V) from ground
water. The amount of arsenic removed by Micron ZVI took hours to days, whereas, it took
minutes using NZVI, even though the reaction mechanism of arsenic removal was similar in both
cases.
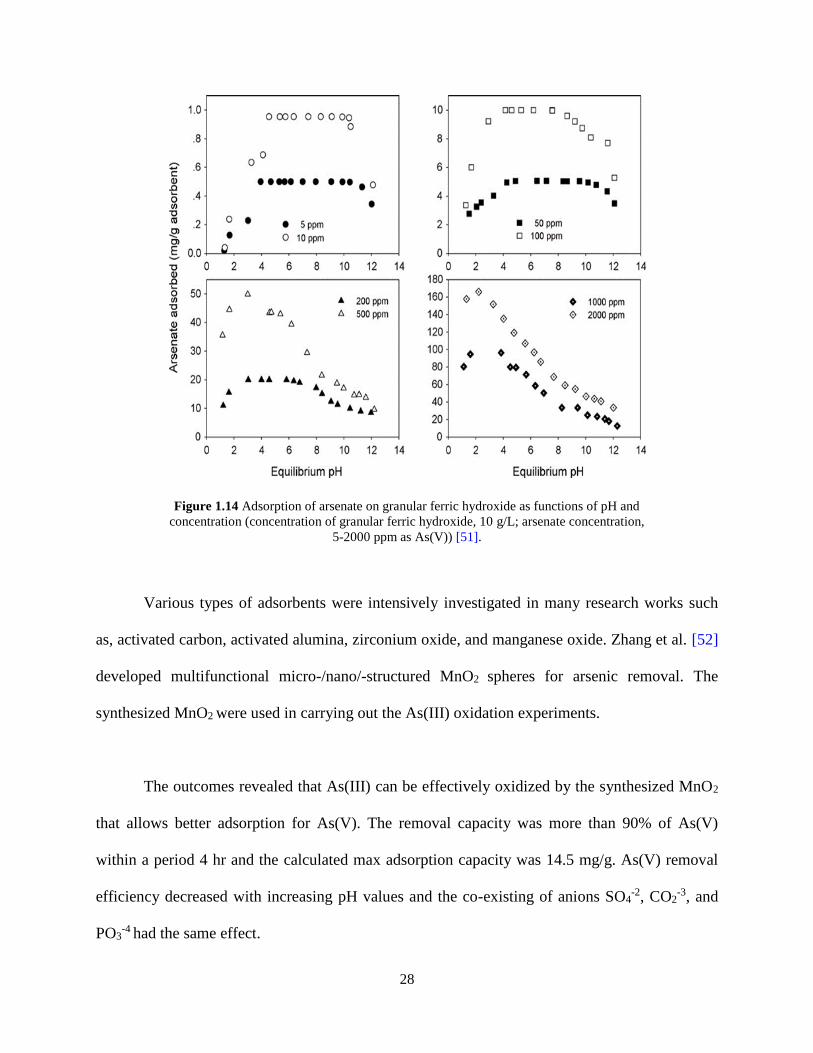
Guan et al. [51] investigated Granular Ferric Hydroxide (GFH) in removing arsenic from
water. The adsorption of As(V) on GFH revealed variant shapes for different initial As(V)
concentrations. They suggested that the adsorption isotherm of arsenate on GFH had very
heterogeneous surface sites. When the equilibrium concentration was increased more surface
sites were available.
The adsorption edge of arsenate on GFH shifted slightly to the high pH range at an initial
arsenate concentration ranging from 5 mg/L to 50 mg/L. However, the adsorption edge shifted to
the low pH range as the initial arsenate concentration increased from 50 mg/L to 2000 mg/L.
Figure 1.14 reveals the adsorption profile affected by the initial concentrations and pH values.
This observation may be associated with the different reactions occurring at different initial
arsenate concentrations.
28
Various types of adsorbents were intensively investigated in many research works such
as, activated carbon, activated alumina, zirconium oxide, and manganese oxide. Zhang et al. [52]
developed multifunctional micro-/nano/-structured MnO2 spheres for arsenic removal. The
synthesized MnO2 were used in carrying out the As(III) oxidation experiments.
The outcomes revealed that As(III) can be effectively oxidized by the synthesized MnO2
that allows better adsorption for As(V). The removal capacity was more than 90% of As(V)
within a period 4 hr and the calculated max adsorption capacity was 14.5 mg/g. As(V) removal
efficiency decreased with increasing pH values and the co-existing of anions SO4-2, CO2
-3, and
PO3-4 had the same effect.
Figure 1.14 Adsorption of arsenate on granular ferric hydroxide as functions of pH and
concentration (concentration of granular ferric hydroxide, 10 g/L; arsenate concentration,
5-2000 ppm as As(V)) [51].
29
Hirstovski et al. [53] introduced a new zirconium oxide-based media for arsenate
removal. ZrO2 spheres were fabricated and in micro (200-800 µm) and nanostructure (20-100
nm) measurements. It was found that the arsenate adsorption is highest at pH = 6.4 and lowest at
pH = 8.3. The [HAsO42-]/[H2AsO4
- ] ratio ≈ 46 at pH = 8.3, implying that almost all of the
arsenate will be present in the most negative form, which will tend to adsorb less onto a
negatively charged ZrO2 surface. Contrarily, the [HAsO42-]/[H2AsO4
-] ratio ≈ 0.65 at pH = 6.4,
implying a greater presence of H2AsO4- ions and thus better adsorption onto the negatively
charged surface of the ZrO2 spheres.
30
1.5 Research Objectives
The aim of this research is to develop a new bulk modified nanocomposite material,
which can be used as an adsorbent media in removing arsenic from drinking water. The
following points summarize the objectives of this research:
To synthesize a nanocomposite polyurethane foam impregnated with iron oxide
nanoparticles (PU-IONPs) by incorporating the adsorbent particles within the foam
media.
To determine the optimal composition of PU nanocomposite which yields the highest
removal capacity of arsenic based on the following parameters:
1. The composition ratio of major foam components; i.e., PPG:TDI.
2. The weight percentage of IONPs inside the foam matrix.
3. The size of IONPs that is being used.
To Study the effect of application parameters on the performance of the PU
nanocomposite such as:
1. The structure of the PU foam.
2. Contact time between 3 hr and 24 hr.
3. pH of the treated solution.
4. The concentration of As in the solution.
31
CHAPTER 2
EXPERIMENTAL WORK
2.1 Materials
The raw materials which were used in the synthesis of PU foam nanocomposites are
Polypropylene glycol (PPG), Toluene di-isocyanate (TDI) and Iron oxide nanoparticles (IONPs).
Those were obtained from commercial sources along with other ingredients; polysiloxane
surfactant to maintain the foam structure, nitrogen gas (Airgas, O2 free UHP) to provide an inert
atmosphere for the PPG and TDI reaction, and 18.2 MOhm-cm deionized water as a blowing
agent for foaming process, as well as, to prepare the standard solutions of arsenic.
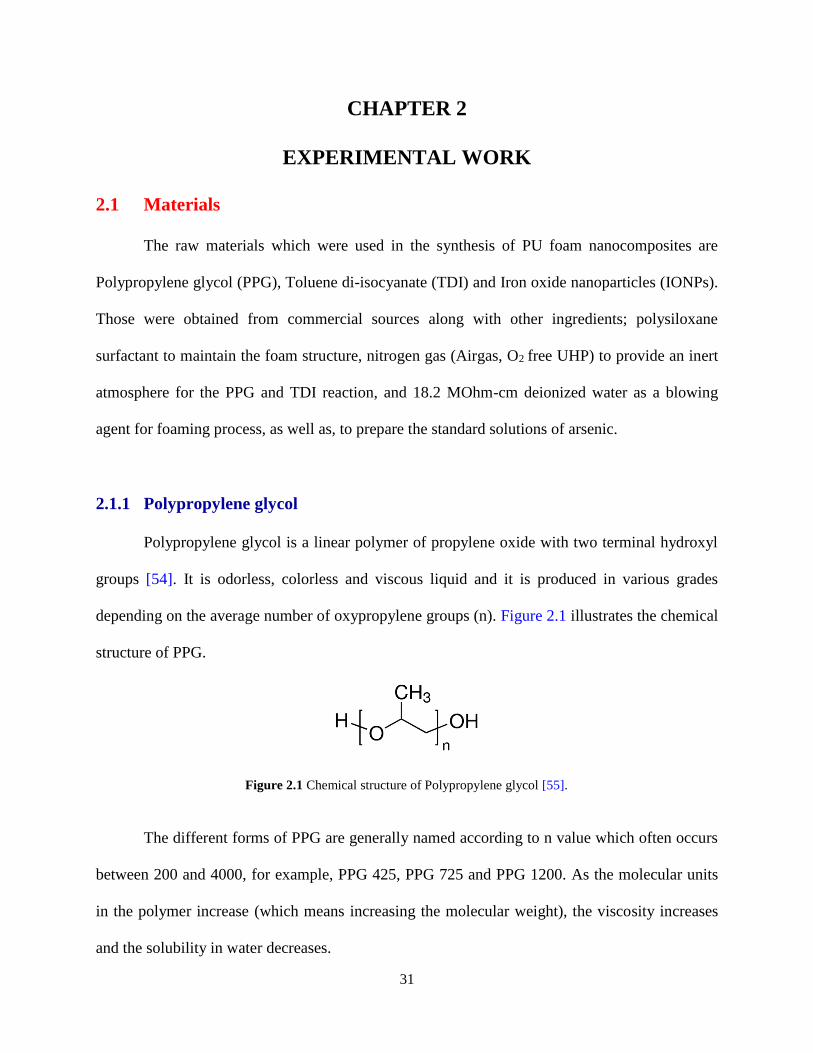
2.1.1 Polypropylene glycol
Polypropylene glycol is a linear polymer of propylene oxide with two terminal hydroxyl
groups [54]. It is odorless, colorless and viscous liquid and it is produced in various grades
depending on the average number of oxypropylene groups (n). Figure 2.1 illustrates the chemical
structure of PPG.
The different forms of PPG are generally named according to n value which often occurs
between 200 and 4000, for example, PPG 425, PPG 725 and PPG 1200. As the molecular units
in the polymer increase (which means increasing the molecular weight), the viscosity increases
and the solubility in water decreases.
Figure 2.1 Chemical structure of Polypropylene glycol [55].
32
The major method of the production of PPG requires raw materials which are derived
from the petrochemical industry. Conventionally, the propylene, which is a byproduct of
gasoline manufacture, is oxidized by hydrogen peroxide (H2O2) and converted to propylene
oxide, then this compound is polymerized by using a catalyst such as, potassium hydroxide
(KOH). Alternative methods of production are being investigated to reduce the dependence on
fossil fuels as the main source of propylene compound [56].
PPG compounds are widely used in many products as they acquire physical and chemical
properties, which make them competitive candidates. PPG has low toxicity and ability to absorb
and retain moisture, therefore, it is used in food production, cosmetic, and personal care
products. In addition, it is used in the manufacture of polyurethane foam, flexible epoxy resins,
and radiation-curable coatings [57].
In this research, PPG was purchased from Sigma Aldrich Co. LLC with grade PPG 1200.
Before using it in the chemical reaction with TDI, PPG was dehumidified in a vacuum oven at 70
˚C for 24 hr, to allow homogenous reaction between PPG and TDI in the absence of moisture
which could affect the foaming process in the later stage of synthesis.
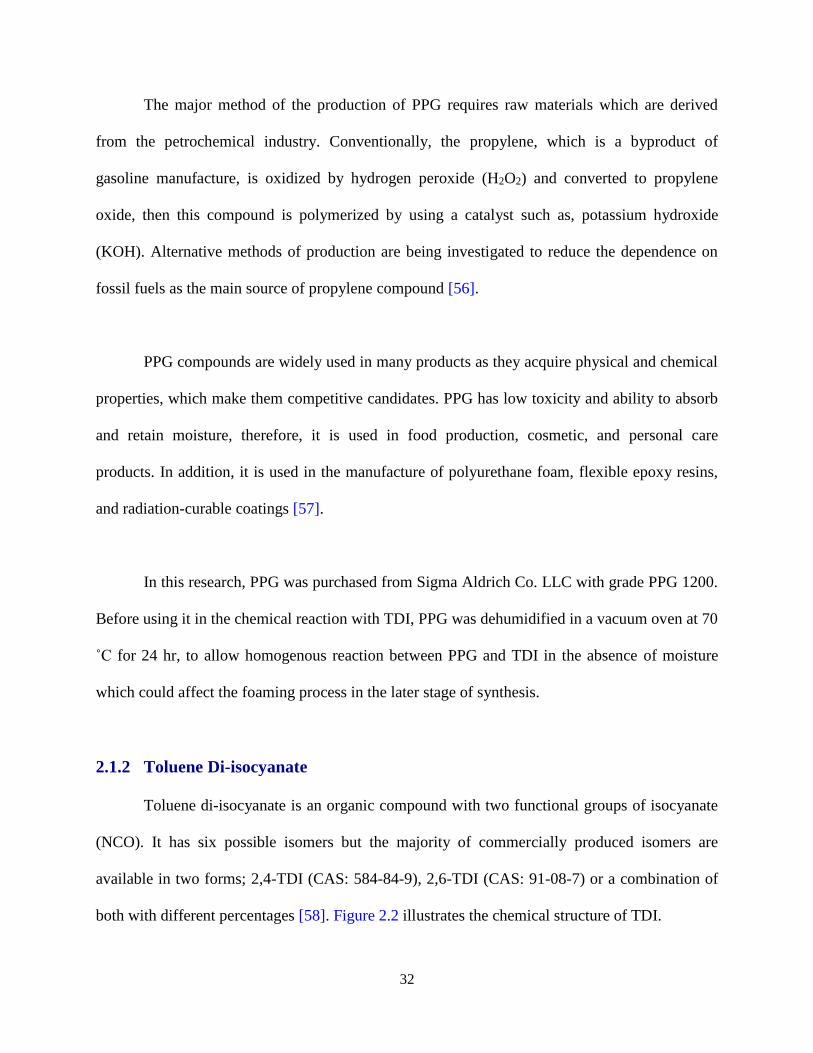
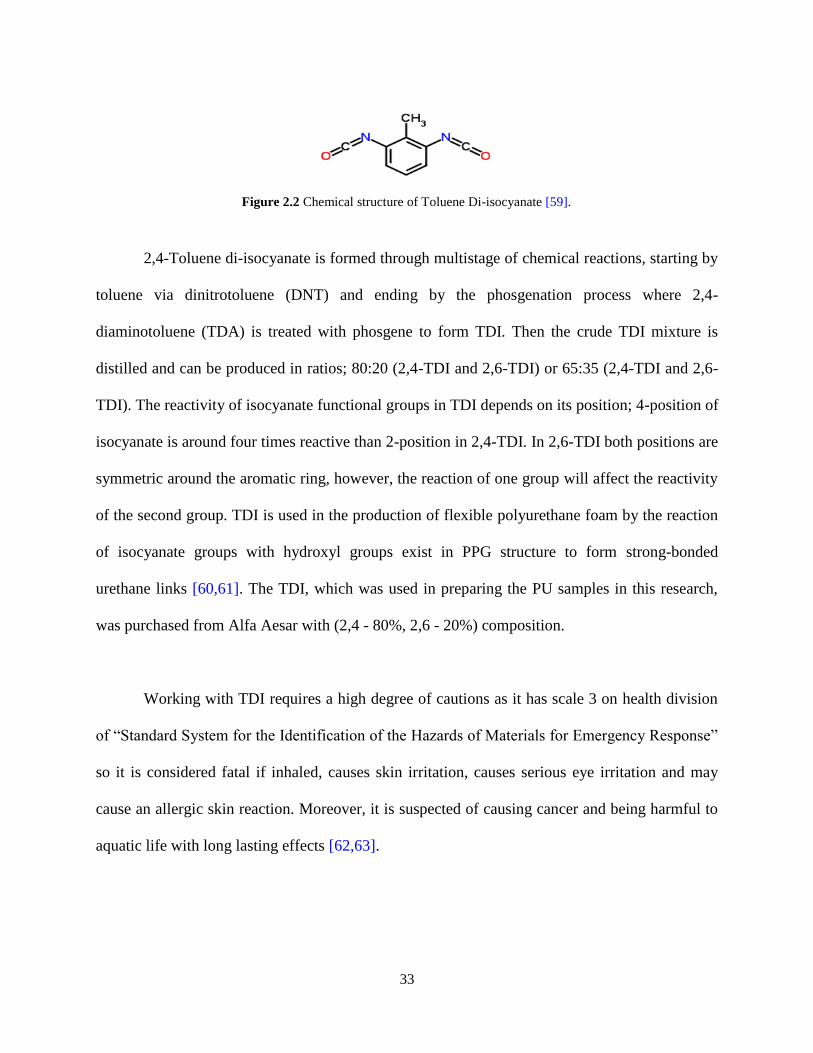
2.1.2 Toluene Di-isocyanate
Toluene di-isocyanate is an organic compound with two functional groups of isocyanate
(NCO). It has six possible isomers but the majority of commercially produced isomers are
available in two forms; 2,4-TDI (CAS: 584-84-9), 2,6-TDI (CAS: 91-08-7) or a combination of
both with different percentages [58]. Figure 2.2 illustrates the chemical structure of TDI.
33
2,4-Toluene di-isocyanate is formed through multistage of chemical reactions, starting by
toluene via dinitrotoluene (DNT) and ending by the phosgenation process where 2,4-
diaminotoluene (TDA) is treated with phosgene to form TDI. Then the crude TDI mixture is
distilled and can be produced in ratios; 80:20 (2,4-TDI and 2,6-TDI) or 65:35 (2,4-TDI and 2,6-
TDI). The reactivity of isocyanate functional groups in TDI depends on its position; 4-position of
isocyanate is around four times reactive than 2-position in 2,4-TDI. In 2,6-TDI both positions are
symmetric around the aromatic ring, however, the reaction of one group will affect the reactivity
of the second group. TDI is used in the production of flexible polyurethane foam by the reaction
of isocyanate groups with hydroxyl groups exist in PPG structure to form strong-bonded
urethane links [60,61]. The TDI, which was used in preparing the PU samples in this research,
was purchased from Alfa Aesar with (2,4 - 80%, 2,6 - 20%) composition.
Working with TDI requires a high degree of cautions as it has scale 3 on health division
of “Standard System for the Identification of the Hazards of Materials for Emergency Response”
so it is considered fatal if inhaled, causes skin irritation, causes serious eye irritation and may
cause an allergic skin reaction. Moreover, it is suspected of causing cancer and being harmful to
aquatic life with long lasting effects [62,63].
Figure 2.2 Chemical structure of Toluene Di-isocyanate [59].
34
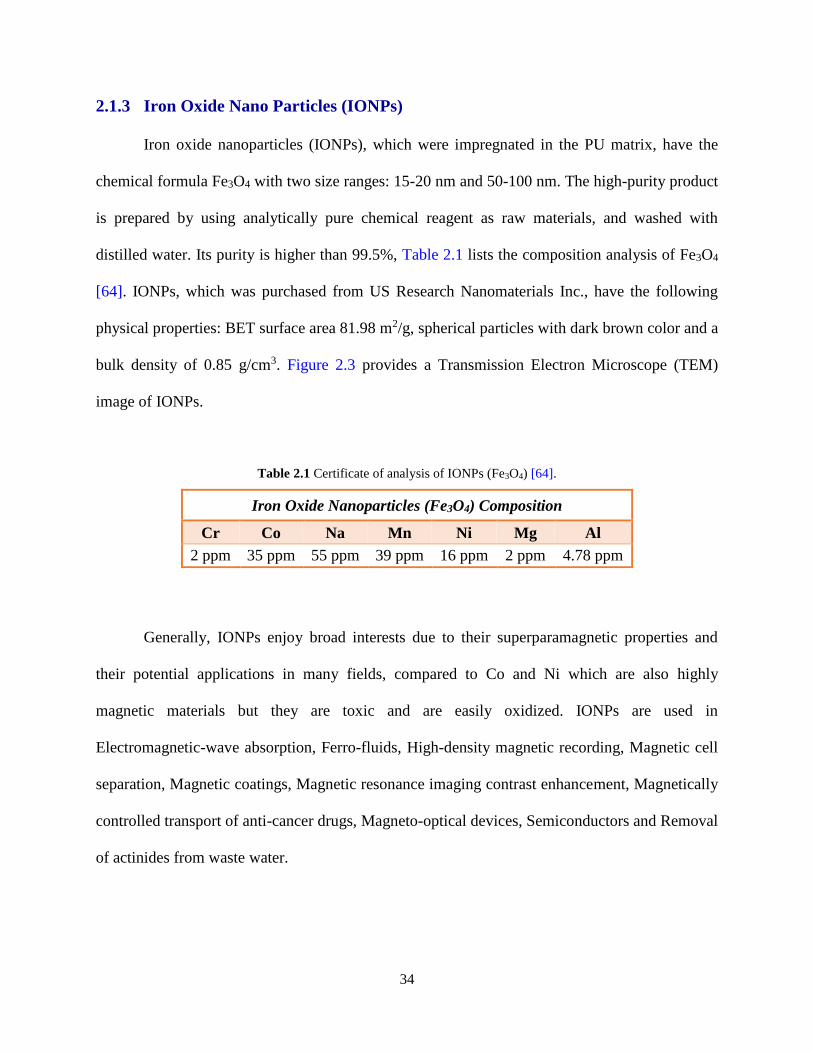
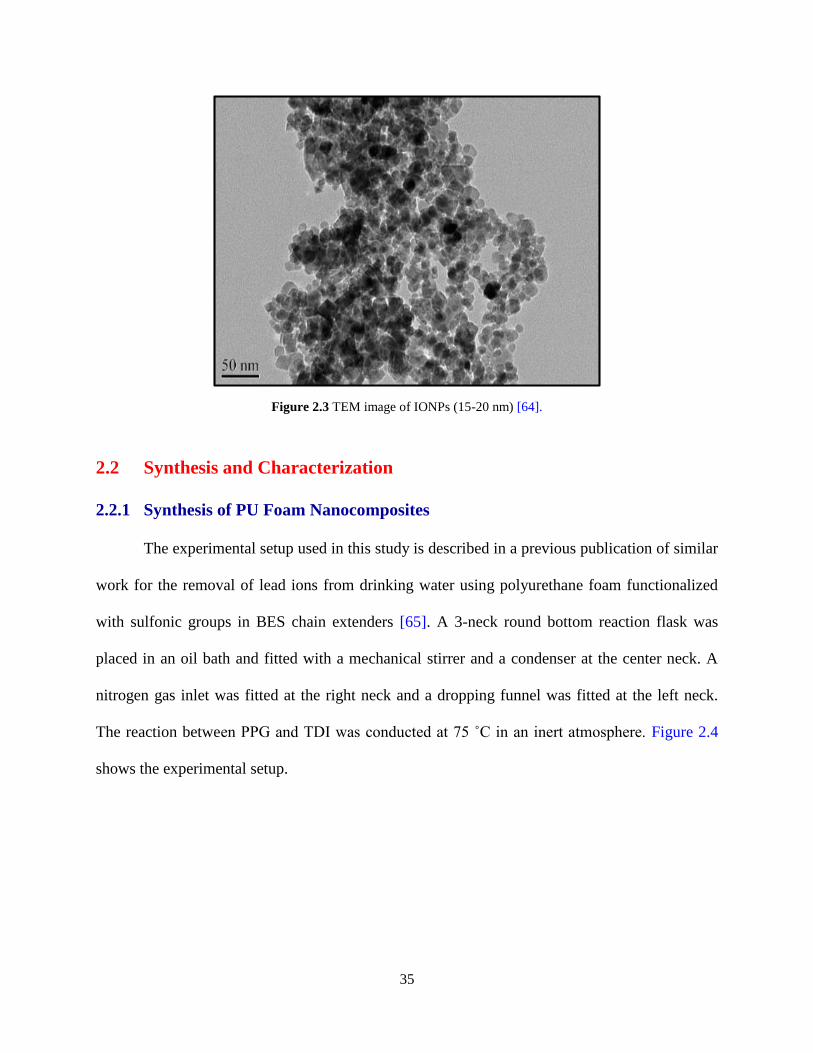
2.1.3 Iron Oxide Nano Particles (IONPs)
Iron oxide nanoparticles (IONPs), which were impregnated in the PU matrix, have the
chemical formula Fe3O4 with two size ranges: 15-20 nm and 50-100 nm. The high-purity product
is prepared by using analytically pure chemical reagent as raw materials, and washed with
distilled water. Its purity is higher than 99.5%, Table 2.1 lists the composition analysis of Fe3O4
[64]. IONPs, which was purchased from US Research Nanomaterials Inc., have the following
physical properties: BET surface area 81.98 m2/g, spherical particles with dark brown color and a
bulk density of 0.85 g/cm3. Figure 2.3 provides a Transmission Electron Microscope (TEM)
image of IONPs.
Table 2.1 Certificate of analysis of IONPs (Fe3O4) [64].
Iron Oxide Nanoparticles (Fe3O4) Composition
Cr Co Na Mn Ni Mg Al
2 ppm 35 ppm 55 ppm 39 ppm 16 ppm 2 ppm 4.78 ppm
Generally, IONPs enjoy broad interests due to their superparamagnetic properties and
their potential applications in many fields, compared to Co and Ni which are also highly
magnetic materials but they are toxic and are easily oxidized. IONPs are used in
Electromagnetic-wave absorption, Ferro-fluids, High-density magnetic recording, Magnetic cell
separation, Magnetic coatings, Magnetic resonance imaging contrast enhancement, Magnetically
controlled transport of anti-cancer drugs, Magneto-optical devices, Semiconductors and Removal
of actinides from waste water.
35
2.2 Synthesis and Characterization
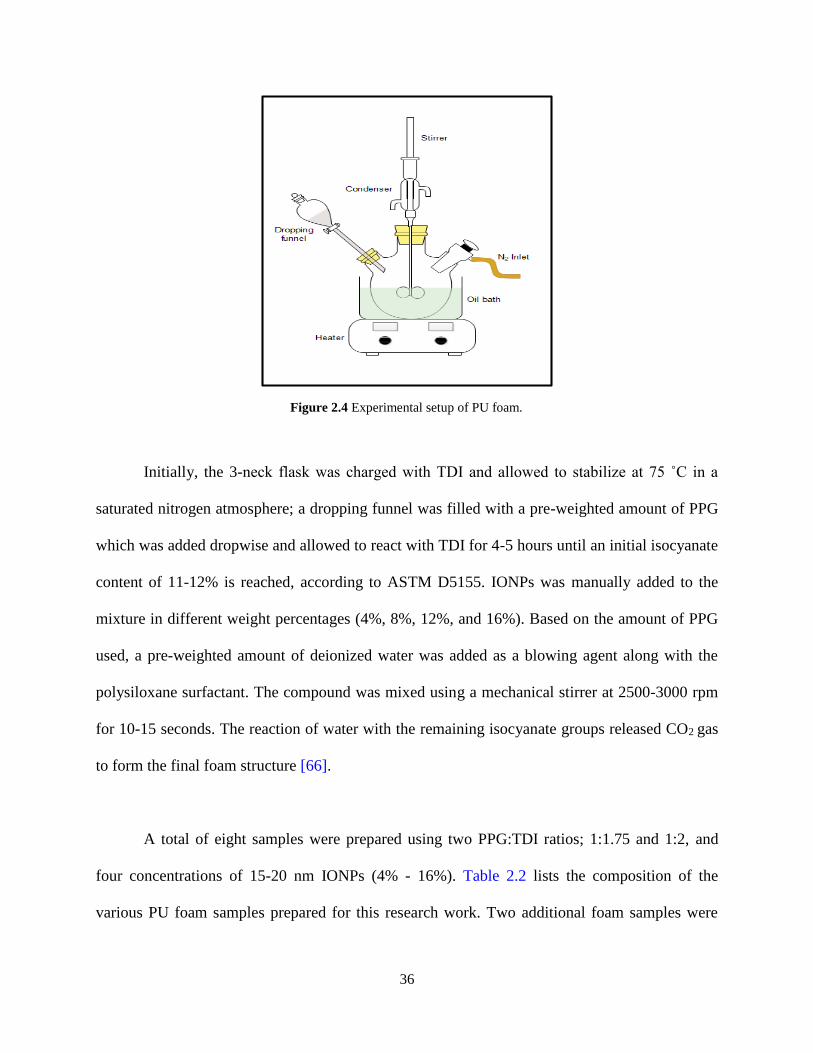
2.2.1 Synthesis of PU Foam Nanocomposites
The experimental setup used in this study is described in a previous publication of similar
work for the removal of lead ions from drinking water using polyurethane foam functionalized
with sulfonic groups in BES chain extenders [65]. A 3-neck round bottom reaction flask was
placed in an oil bath and fitted with a mechanical stirrer and a condenser at the center neck. A
nitrogen gas inlet was fitted at the right neck and a dropping funnel was fitted at the left neck.
The reaction between PPG and TDI was conducted at 75 ˚C in an inert atmosphere. Figure 2.4
shows the experimental setup.
Figure 2.3 TEM image of IONPs (15-20 nm) [64].
36
Initially, the 3-neck flask was charged with TDI and allowed to stabilize at 75 ˚C in a
saturated nitrogen atmosphere; a dropping funnel was filled with a pre-weighted amount of PPG
which was added dropwise and allowed to react with TDI for 4-5 hours until an initial isocyanate
content of 11-12% is reached, according to ASTM D5155. IONPs was manually added to the
mixture in different weight percentages (4%, 8%, 12%, and 16%). Based on the amount of PPG
used, a pre-weighted amount of deionized water was added as a blowing agent along with the
polysiloxane surfactant. The compound was mixed using a mechanical stirrer at 2500-3000 rpm
for 10-15 seconds. The reaction of water with the remaining isocyanate groups released CO2 gas
to form the final foam structure [66].
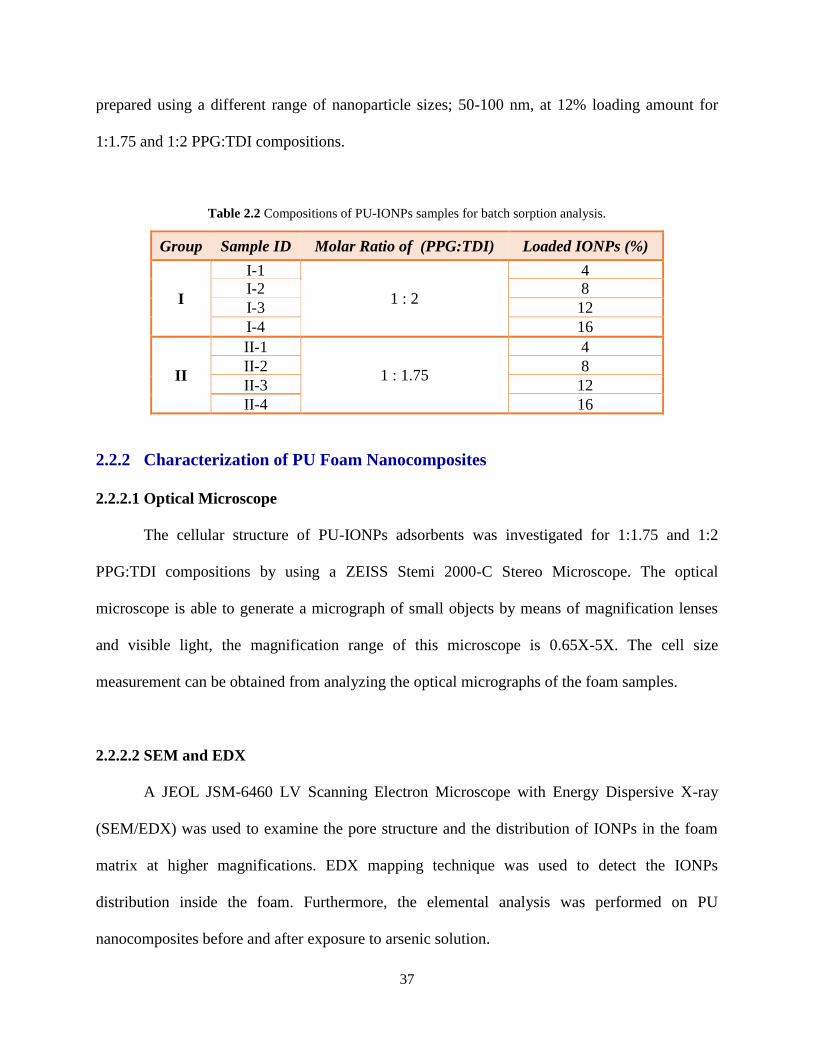
A total of eight samples were prepared using two PPG:TDI ratios; 1:1.75 and 1:2, and
four concentrations of 15-20 nm IONPs (4% - 16%). Table 2.2 lists the composition of the
various PU foam samples prepared for this research work. Two additional foam samples were
Figure 2.4 Experimental setup of PU foam.
37
prepared using a different range of nanoparticle sizes; 50-100 nm, at 12% loading amount for
1:1.75 and 1:2 PPG:TDI compositions.
Table 2.2 Compositions of PU-IONPs samples for batch sorption analysis.
2.2.2 Characterization of PU Foam Nanocomposites
2.2.2.1 Optical Microscope
The cellular structure of PU-IONPs adsorbents was investigated for 1:1.75 and 1:2
PPG:TDI compositions by using a ZEISS Stemi 2000-C Stereo Microscope. The optical
microscope is able to generate a micrograph of small objects by means of magnification lenses
and visible light, the magnification range of this microscope is 0.65X-5X. The cell size
measurement can be obtained from analyzing the optical micrographs of the foam samples.
2.2.2.2 SEM and EDX
A JEOL JSM-6460 LV Scanning Electron Microscope with Energy Dispersive X-ray
(SEM/EDX) was used to examine the pore structure and the distribution of IONPs in the foam
matrix at higher magnifications. EDX mapping technique was used to detect the IONPs
distribution inside the foam. Furthermore, the elemental analysis was performed on PU
nanocomposites before and after exposure to arsenic solution.
Group Sample ID Molar Ratio of (PPG:TDI) Loaded IONPs (%)
I
I-1
1 : 2
4
I-2 8
I-3 12
I-4 16
II
II-1
1 : 1.75
4
II-2 8
II-3 12
II-4 16
38
2.2.2.3 Porosity and Density
Measurements of porosity-related characteristics were conducted for both 1:1.75 and 1:2
PPG:TDI compositions by Micromeritics Analytical Services. MicroActive AutoPore IV 9600
was used to measure the foam porosity by applying various levels of pressure to the sample
immersed in mercury, this technique is called “mercury porosimetry”, or usually, “mercury
intrusion”. The pressure required to impose mercury into the sample’s pores is inversely
proportional to the size of the pores.
The term "porosimetry" is often used to include the measurements of pore size, volume,
distribution, and density. Porosity is a key parameter in understanding the structure and potential
use of many materials. The porosity of a material affects its physical properties and,
consequently, its behavior in certain application. The adsorption, permeability, and density are
influenced by a material’s porosity and determine the manner and fashion in which it can be
appropriately used [67].
Accupyc II 1340 was used to determine the open cell content (ASTM D6266) and
skeletal density. The instrument measures the volume of the sample, excluding interstitial voids
in bulk powders and any open porosity in the individual particles, to which the gas has access.
Internal (closed) porosity is still included in the volume [68].
39
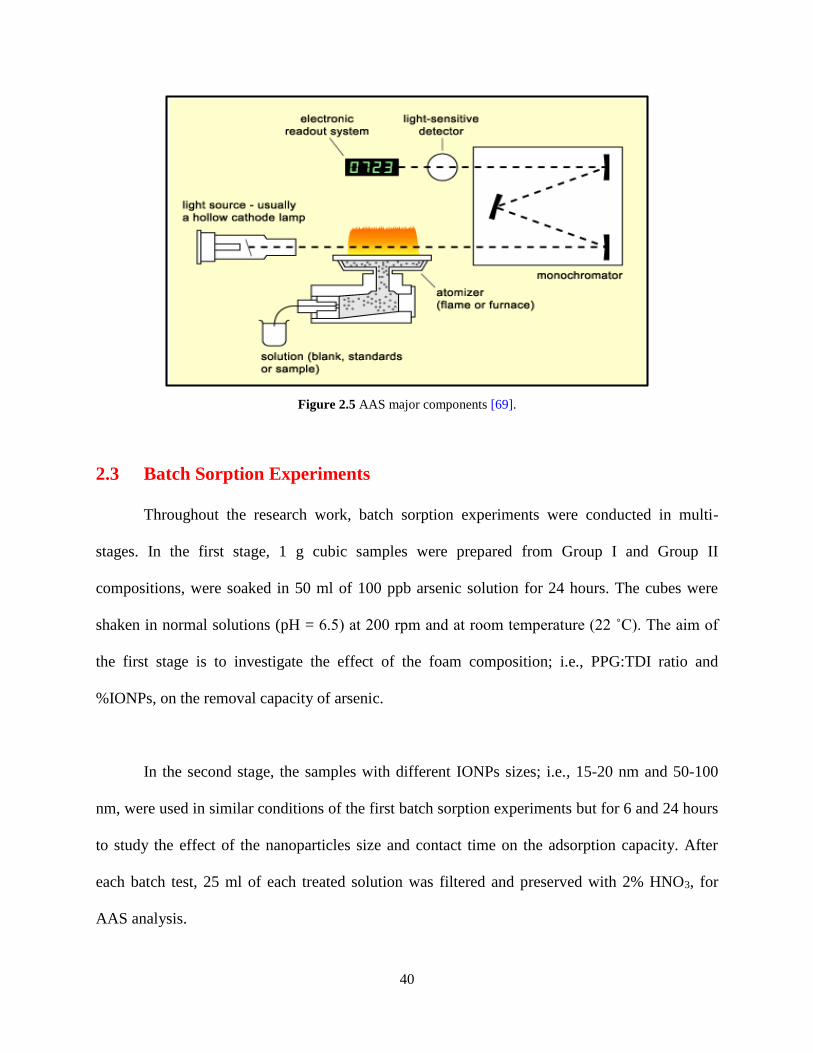
2.2.2.4 Atomic Absorption Spectrometer (AAS)
Thermo Electron Corporation S4 Atomic Absorption Spectrometer (AAS) was utilized
to measure the adsorption capacity of PU nanocomposites. Fundamentally, flame atomic
absorption spectrometer involves generating a gaseous phase of free atoms by heating a sample
in a flame, or as a product of chemical reaction process, then passing a narrow bandwidth light at
a certain wavelength through the atoms in the flame. Those conditions cause absorption of
radiation that is selective for a particular element [69].
Spectrometer concerns the interaction of light with particles. When light is absorbed by
an element it results in increasing the energy of the molecules or atoms which comprise the
sample. Especially, absorption of radiation by the atoms of an element exhibits as a spectrum
that is characteristic of the element. Atomic absorption spectrophotometers can vary in cost, size,
complexity and performance. The key elements of a conventional atomic absorption
spectrometer are:
1. Line source of radiation.
2. Atomizer, of which there are two types: flame and furnace.
3. Monochromator.
4. Detector for the measurement of intensity of the radiation passing from the sample.
Figure 2.5 illustrates the typical arrangement of an atomic absorption spectrometer.
40
2.3 Batch Sorption Experiments
Throughout the research work, batch sorption experiments were conducted in multi-
stages. In the first stage, 1 g cubic samples were prepared from Group I and Group II
compositions, were soaked in 50 ml of 100 ppb arsenic solution for 24 hours. The cubes were
shaken in normal solutions (pH = 6.5) at 200 rpm and at room temperature (22 ˚C). The aim of
the first stage is to investigate the effect of the foam composition; i.e., PPG:TDI ratio and
%IONPs, on the removal capacity of arsenic.
In the second stage, the samples with different IONPs sizes; i.e., 15-20 nm and 50-100
nm, were used in similar conditions of the first batch sorption experiments but for 6 and 24 hours
to study the effect of the nanoparticles size and contact time on the adsorption capacity. After
each batch test, 25 ml of each treated solution was filtered and preserved with 2% HNO3, for
AAS analysis.
Figure 2.5 AAS major components [69].
41
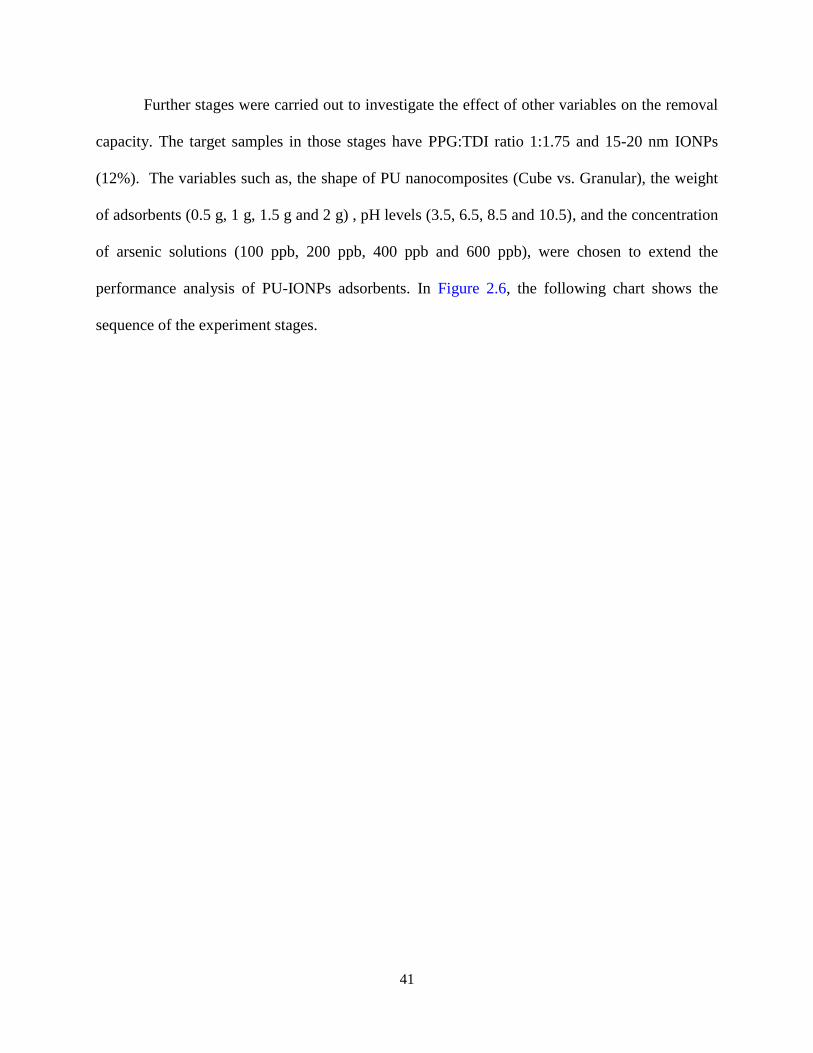
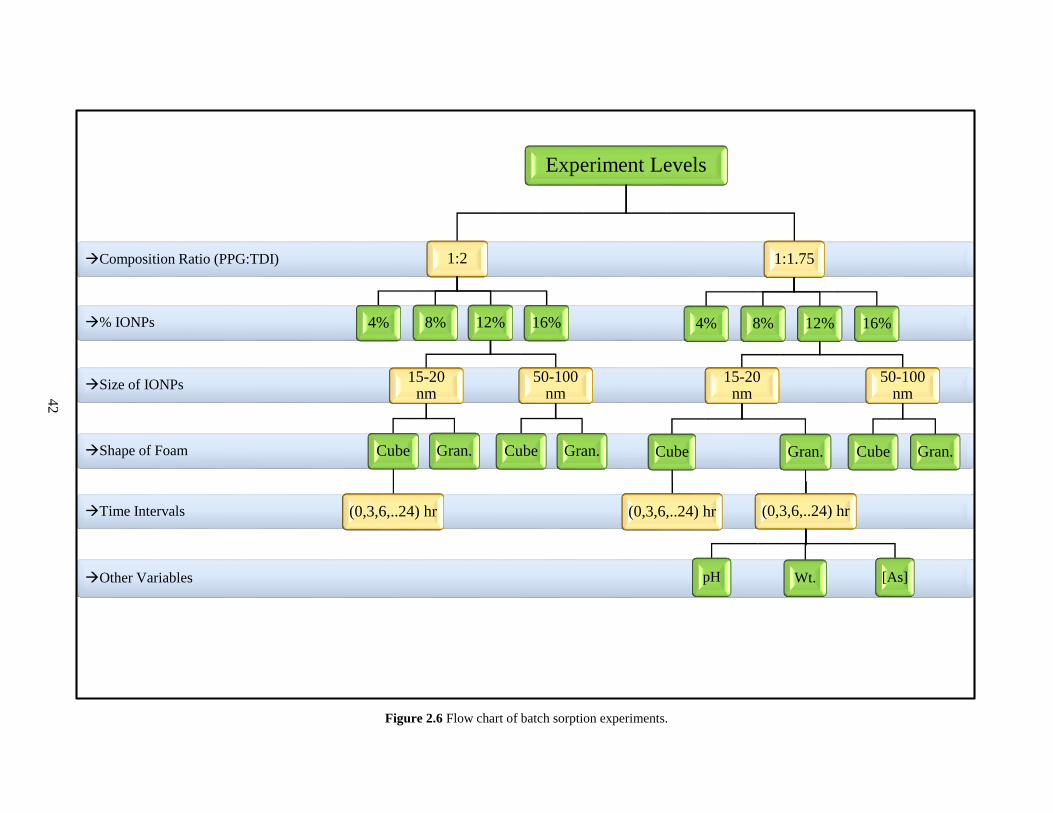
Further stages were carried out to investigate the effect of other variables on the removal
capacity. The target samples in those stages have PPG:TDI ratio 1:1.75 and 15-20 nm IONPs
(12%). The variables such as, the shape of PU nanocomposites (Cube vs. Granular), the weight
of adsorbents (0.5 g, 1 g, 1.5 g and 2 g) , pH levels (3.5, 6.5, 8.5 and 10.5), and the concentration
of arsenic solutions (100 ppb, 200 ppb, 400 ppb and 600 ppb), were chosen to extend the
performance analysis of PU-IONPs adsorbents. In Figure 2.6, the following chart shows the
sequence of the experiment stages.
42
Figure 2.6 Flow chart of batch sorption experiments.
Other Variables
Time Intervals
Shape of Foam
Size of IONPs
% IONPs
Composition Ratio (PPG:TDI)
Experiment Levels
1:2
4% 8% 12%
15-20 nm
Cube
(0,3,6,..24) hr
Gran.
50-100 nm
Cube Gran.
16%
1:1.75
4% 8% 12%
15-20 nm
Cube
(0,3,6,..24) hr
Gran.
(0,3,6,..24) hr
pH Wt. [As]
50-100 nm
Cube Gran.
16%
43
2.4 Column Study
Laboratory column study is considered the second step in separation processes
development, it enables to scale them up for commercial operations. The column set up requires
some knowledge to help eliminate wasted lab time spent in “trial and error”, general guidelines
are available online for such experiment [70].
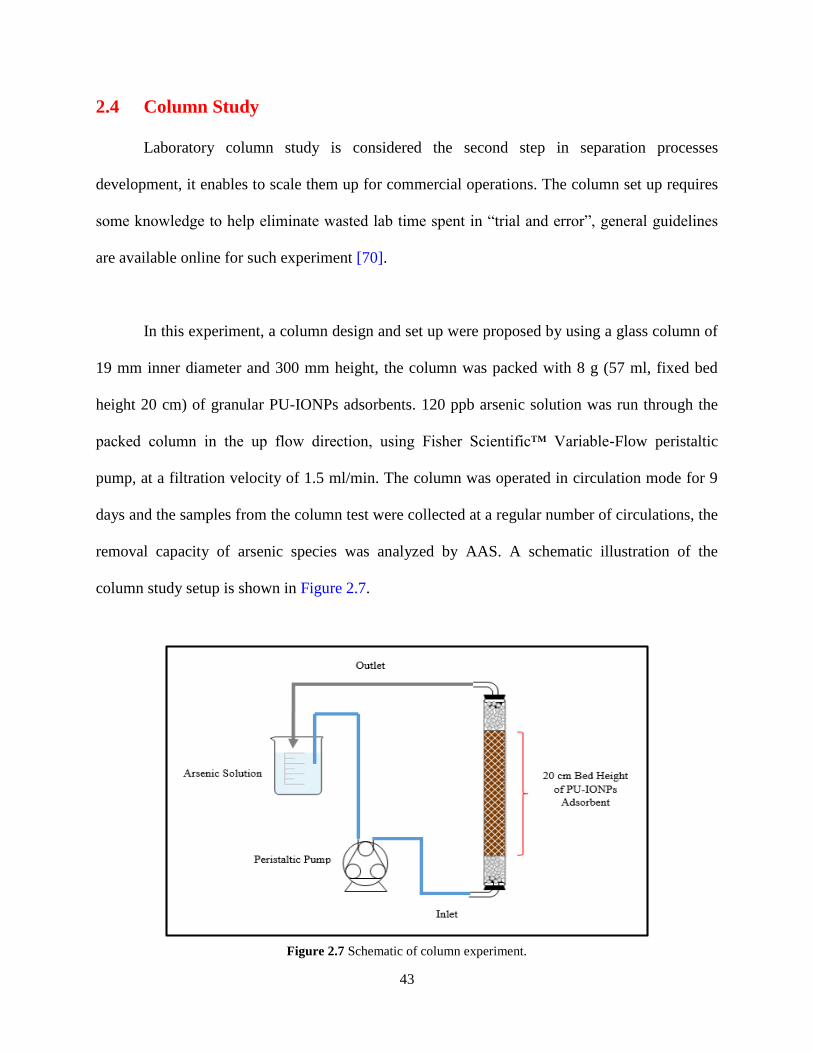
In this experiment, a column design and set up were proposed by using a glass column of
19 mm inner diameter and 300 mm height, the column was packed with 8 g (57 ml, fixed bed
height 20 cm) of granular PU-IONPs adsorbents. 120 ppb arsenic solution was run through the
packed column in the up flow direction, using Fisher Scientific™ Variable-Flow peristaltic
pump, at a filtration velocity of 1.5 ml/min. The column was operated in circulation mode for 9
days and the samples from the column test were collected at a regular number of circulations, the
removal capacity of arsenic species was analyzed by AAS. A schematic illustration of the
column study setup is shown in Figure 2.7.
Figure 2.7 Schematic of column experiment.
44
CHAPTER 3
RESULTS AND DISCUSSION
3.1 Characterization Analysis
3.1.1 Optical Microscope
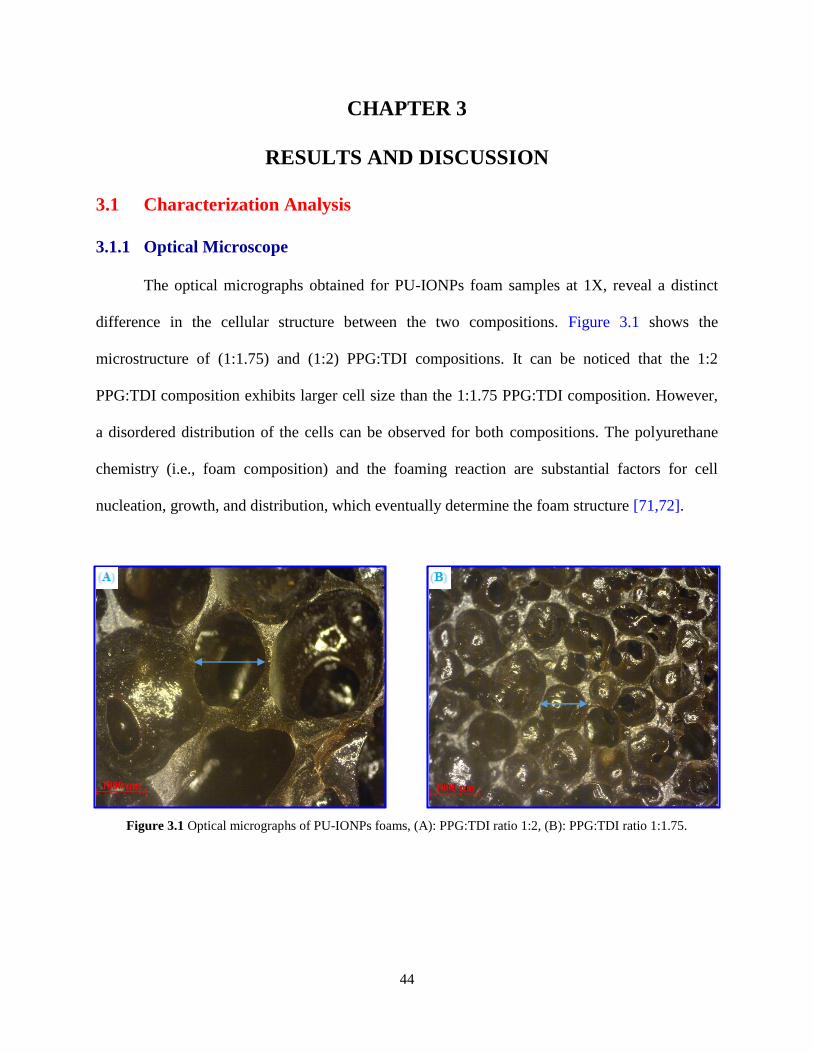
The optical micrographs obtained for PU-IONPs foam samples at 1X, reveal a distinct
difference in the cellular structure between the two compositions. Figure 3.1 shows the
microstructure of (1:1.75) and (1:2) PPG:TDI compositions. It can be noticed that the 1:2
PPG:TDI composition exhibits larger cell size than the 1:1.75 PPG:TDI composition. However,
a disordered distribution of the cells can be observed for both compositions. The polyurethane
chemistry (i.e., foam composition) and the foaming reaction are substantial factors for cell
nucleation, growth, and distribution, which eventually determine the foam structure [71,72].
Figure 3.1 Optical micrographs of PU-IONPs foams, (A): PPG:TDI ratio 1:2, (B): PPG:TDI ratio 1:1.75.

45
3.1.2 SEM and EDX
In order to obtain a high-resolution SEM imaging for non-conductive foam samples, low
vacuum operation mode and a backscatter detector were used. Figure 3.2 depicts the porous
structure of PU-IONPs foam samples with a combination of open and closed cells. The observed
structure provides more surface area with IONPs instead of depositing them on the surface of
foam only [44]. The adsorption process of arsenic species will be enhanced as long as more
exposed surface areas of IONPs are available.
The EDX mapping technique was used to detect the IONPs distribution inside the foam.
Furthermore, a quantitative analysis (EDX spectrum) was conducted on individual points, as
illustrated in Figure 3.3. The atomic and weight percentages for all the detected elements are
listed in Table 3.1.
Figure 3.2 SEM image of PU-IONPs nanocomposite at 500X
magnification.

46
Table 3.1 Elemental analysis of the concentrated spot in Figure 3.3.
Element Weight % Atomic %
C 14.93 28.3
O 34.69 49.35
Fe 46.05 18.77
Si 4.03 3.26
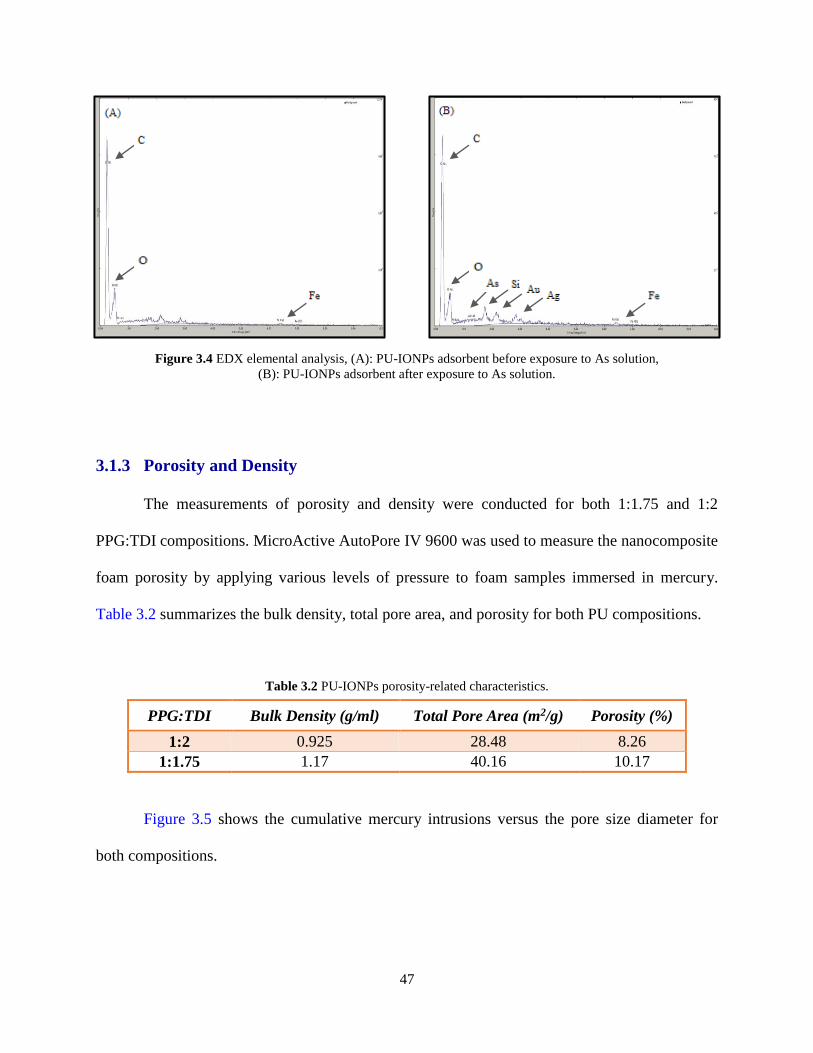
The EDX elemental analysis, which was performed on the adsorbent foam before and
after soaking in a 100 ppb standard As solution, shows the presence of arsenic in the bulk of the
foam samples, along with the original elements of PU-IONPs foam composition (i.e., Carbon,
Oxygen, and Iron), as illustrated in Figure 3.4.
IONPs
concentrated
spot
Figure 3.3 EDX mapping scan of PU nanocomposite foam.
47
3.1.3 Porosity and Density
The measurements of porosity and density were conducted for both 1:1.75 and 1:2
PPG:TDI compositions. MicroActive AutoPore IV 9600 was used to measure the nanocomposite
foam porosity by applying various levels of pressure to foam samples immersed in mercury.
Table 3.2 summarizes the bulk density, total pore area, and porosity for both PU compositions.
Table 3.2 PU-IONPs porosity-related characteristics.
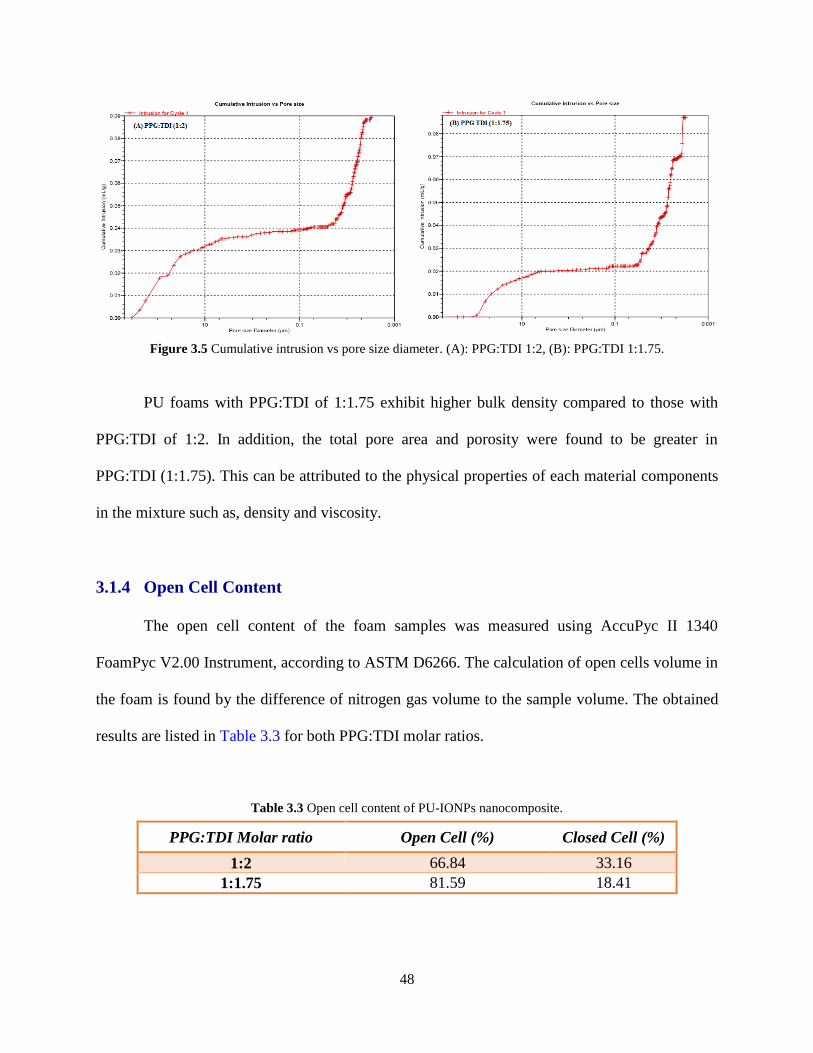
Figure 3.5 shows the cumulative mercury intrusions versus the pore size diameter for
both compositions.
PPG:TDI Bulk Density (g/ml) Total Pore Area (m2/g) Porosity (%)
1:2 0.925 28.48 8.26
1:1.75 1.17 40.16 10.17
Figure 3.4 EDX elemental analysis, (A): PU-IONPs adsorbent before exposure to As solution,
(B): PU-IONPs adsorbent after exposure to As solution.
48
PU foams with PPG:TDI of 1:1.75 exhibit higher bulk density compared to those with
PPG:TDI of 1:2. In addition, the total pore area and porosity were found to be greater in
PPG:TDI (1:1.75). This can be attributed to the physical properties of each material components
in the mixture such as, density and viscosity.
3.1.4 Open Cell Content
The open cell content of the foam samples was measured using AccuPyc II 1340
FoamPyc V2.00 Instrument, according to ASTM D6266. The calculation of open cells volume in
the foam is found by the difference of nitrogen gas volume to the sample volume. The obtained
results are listed in Table 3.3 for both PPG:TDI molar ratios.
Table 3.3 Open cell content of PU-IONPs nanocomposite.
PPG:TDI Molar ratio Open Cell (%) Closed Cell (%)
1:2 66.84 33.16
1:1.75 81.59 18.41
Figure 3.5 Cumulative intrusion vs pore size diameter. (A): PPG:TDI 1:2, (B): PPG:TDI 1:1.75.
49
The above result shows that increasing the molar ratio of TDI to PPG produces less open
cell foam compared to the lower ratio (1:1.75), considering that the reaction conditions and the
synthesis method were maintained constant for both samples. This can be correlated to the
increased amount of isocyanate groups in the foam formulation which lead to excessive foaming
followed by foam collapse during molding, thus reducing the number of open cells in the foam
[73].
3.2 Performance Analysis
3.2.1 Batch Sorption Studies
3.2.1.1 Effect of PU-IONPs Composition
In order to study the capability of the adsorbents in removing arsenic, all foam samples
were tested under the same conditions. The foam samples of Group I (1:2 PPG:TDI)
demonstrated higher removal capacity compared to the samples of Group II (1:1.75 PPG:TDI).
This can be explained by the difference in foam structure between the two compositions. The
composition of Group I yields larger cell size distribution and, subsequently, higher adsorption
surface area than Group II. Moreover, the closed cell content in Group I was measured and found
to be 33.16% while in Group II it was 18.41%; which provides additional contact surfaces
between the arsenic solution and the adsorbent.
Figure 3.6 shows the As removal capacity for both PU compositions, Group I and Group
II, at different loading ratios of IONPs. In Group I, Figure 3.6(A), the As removal capacity
increased as the amount of IONPs increased from 4% to 12% and remained constant at higher
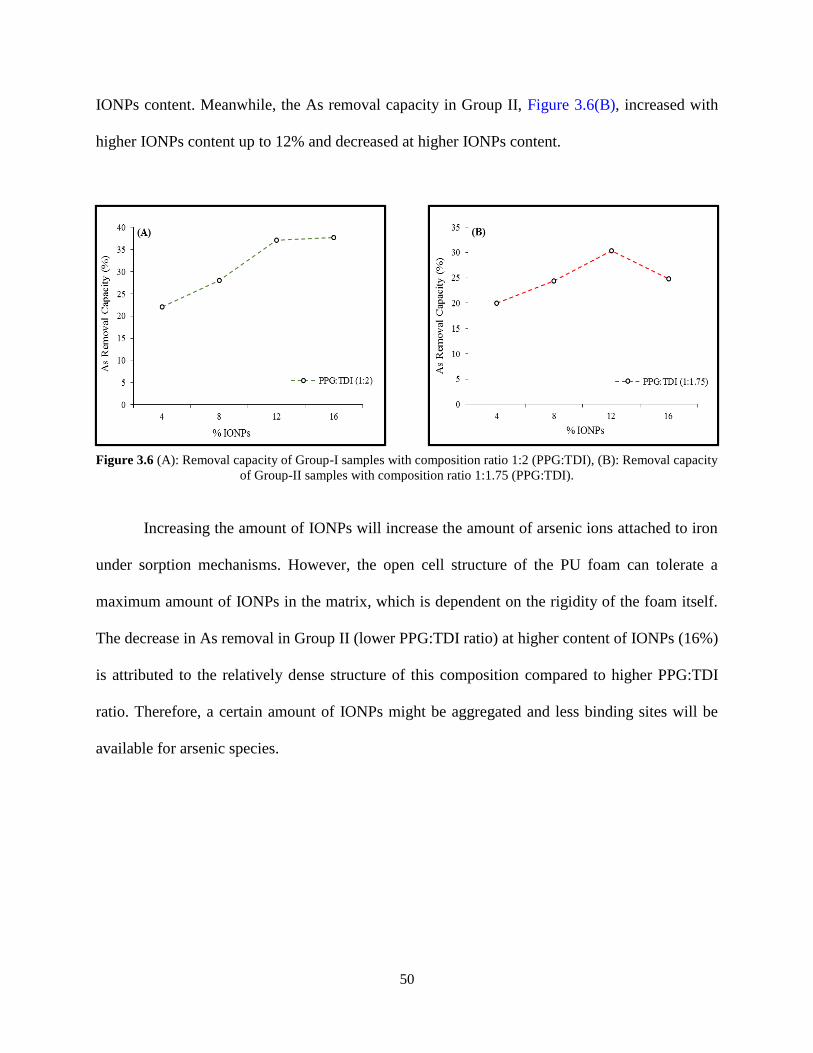
50
IONPs content. Meanwhile, the As removal capacity in Group II, Figure 3.6(B), increased with
higher IONPs content up to 12% and decreased at higher IONPs content.
Increasing the amount of IONPs will increase the amount of arsenic ions attached to iron
under sorption mechanisms. However, the open cell structure of the PU foam can tolerate a
maximum amount of IONPs in the matrix, which is dependent on the rigidity of the foam itself.
The decrease in As removal in Group II (lower PPG:TDI ratio) at higher content of IONPs (16%)
is attributed to the relatively dense structure of this composition compared to higher PPG:TDI
ratio. Therefore, a certain amount of IONPs might be aggregated and less binding sites will be
available for arsenic species.
Figure 3.6 (A): Removal capacity of Group-I samples with composition ratio 1:2 (PPG:TDI), (B): Removal capacity
of Group-II samples with composition ratio 1:1.75 (PPG:TDI).
51
3.2.1.2 Effect of IONPs size
The second stage of batch adsorption analysis was performed to investigate the effect of
IONPs size on the As removal capacity of the PU nanocomposite foams. The foam samples were
prepared with the optimum percentage of loaded IONPs (12%) using both PPG:TDI composition
ratios; 1:2 and 1:1.75, and two size ranges of the IONPs; 15-20 nm and 50-100 nm. The sorption
batch experiments were carried out under two exposure time intervals; 6 hr and 24 hr. Figure 3.7
reveals the As removal capacity for the various compositions and exposure times.
The results shown in Figure 3.7 points toward an enhancement in the performance of the
adsorbents when the size of IONPs is decreased from 50-100 nm to 15-20 nm under the same
exposure conditions for both compositions (PPG:TDI 1:2 and 1:1.75). This behavior can be
attributed to the higher surface area provided with smaller size particles and the weaker effect of
self-aggregation of the nanoparticles [74,75]. Additionally, by allowing more contact time
between the arsenic species and the adsorbent surface, higher removal capacity can be attained
due to the filling of the available binding sites on the surface.
Figure 3.7 Effect of IONPs size on the As removal capacity. (A): PPG:TDI 1:2, (B): PPG:TDI 1:1.75.

52
3.2.1.3 Effect of PU-IONPs Shape
To study the effect of shape on the adsorption capacity, foam samples with a granular
shape were prepared with 12 wt.% loaded IONPs using both PPG:TDI composition ratios and
IONP sizes; under similar exposure conditions of the second stage. Figure 3.8 illustrates the
removal capacity of granular PU-IONPs adsorbents.
The outcomes of third batch experiments reveal an increase in the adsorption capacity of
both compositions (PPG:TDI 1:2 and 1:1.75) and IONP sizes (15-20 nm and 50-100 nm)
compared to the second stage at both exposure times. Foam samples with the granular form
provide more contact sites on the surface of adsorbent than the cubic one; therefore, more arsenic
species can be trapped by an adsorption mechanism. The increase in the As removal capacity, for
all samples, is calculated and listed in Table 3.4.
Figure 3.8 (A): Arsenic removal capacity of composition ratio 1:2 (PPG:TDI), (B): Arsenic removal capacity of
composition ratio 1:1.75 (PPG:TDI), with granular shape and two size ranges of IONPs; 15-20 nm and 50-100 nm.

53
Table 3.4 Effect of granular shape on the removal capacity of arsenic.
Molar Ratio of
(PPG:TDI)
IONPs Size
(nm)
Contact Time
(hr)
Increase Percentage
(%)
1:2
15-20 6 17.35
24 30.1
50-100 6 44.32
24 40.46
1:1.75
15-20 6 71.68
24 66.75
50-100 6 88.89
24 100
Varying the shape of foam from a cubic to a granular form affects the removal capacity
of the adsorbent. It can be noticed that the increase ranges, approximately, between 20% in the
case of PPG:TDI (1:2), 15-20 nm IONPs, and 6 hr contact time, and 100% in the case of
PPG:TDI (1:1.75), 50-100 nm IONPs, and 24 hr contact time. Also, the difference in removal
capacity for both PPG:TDI compositions, when they were used as cubic shape compared to
granular, is eliminated. In other words, the effect of the difference in the foam cellular structure
for both compositions is degraded by altering the adsorbent shape from cubic to granular.
3.2.1.4 Effect of Contact Time
The effect of contact time on the removal capacity of arsenic was studied in the range of
3 hr to 24 hr exposure time. One gram foam samples of three different types of adsorbents; (A)
PPG:TDI ratio (1:2)-Cube, (B) PPG:TDI ratio (1:1.75)-Cube, and (C) PPG:TDI (1:1.75)-
Granular were used. Figure 3.9 shows the time profile of arsenic adsorption on PU-IONPs
nanocomposite with an initial concentration of 100 ppb.
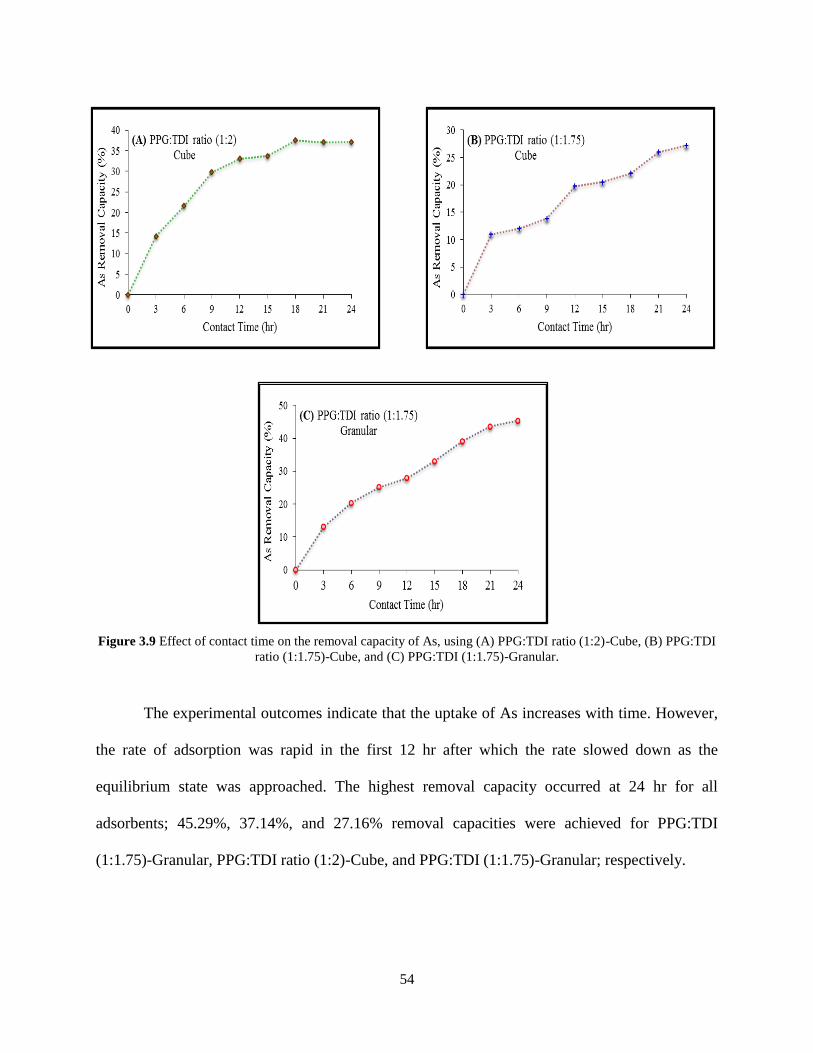
54
The experimental outcomes indicate that the uptake of As increases with time. However,
the rate of adsorption was rapid in the first 12 hr after which the rate slowed down as the
equilibrium state was approached. The highest removal capacity occurred at 24 hr for all
adsorbents; 45.29%, 37.14%, and 27.16% removal capacities were achieved for PPG:TDI
(1:1.75)-Granular, PPG:TDI ratio (1:2)-Cube, and PPG:TDI (1:1.75)-Granular; respectively.
Figure 3.9 Effect of contact time on the removal capacity of As, using (A) PPG:TDI ratio (1:2)-Cube, (B) PPG:TDI
ratio (1:1.75)-Cube, and (C) PPG:TDI (1:1.75)-Granular.
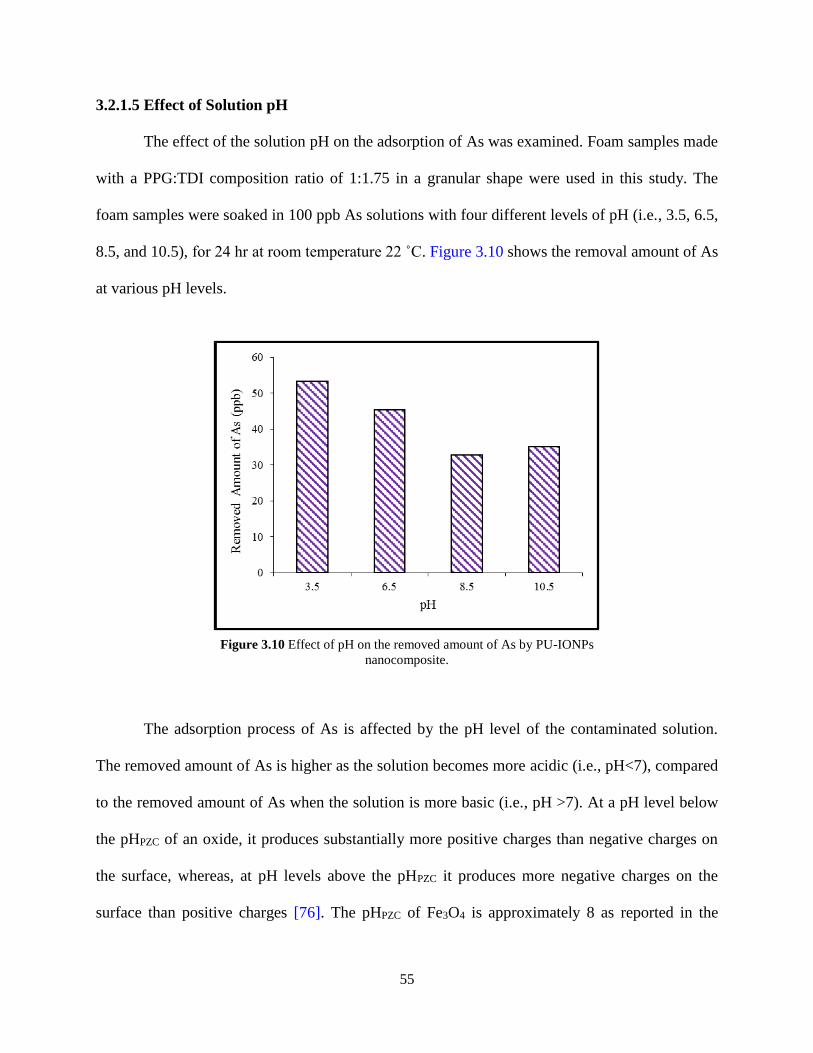
55
3.2.1.5 Effect of Solution pH
The effect of the solution pH on the adsorption of As was examined. Foam samples made
with a PPG:TDI composition ratio of 1:1.75 in a granular shape were used in this study. The
foam samples were soaked in 100 ppb As solutions with four different levels of pH (i.e., 3.5, 6.5,
8.5, and 10.5), for 24 hr at room temperature 22 ˚C. Figure 3.10 shows the removal amount of As
at various pH levels.
The adsorption process of As is affected by the pH level of the contaminated solution.
The removed amount of As is higher as the solution becomes more acidic (i.e., pH<7), compared
to the removed amount of As when the solution is more basic (i.e., pH >7). At a pH level below
the pHPZC of an oxide, it produces substantially more positive charges than negative charges on
the surface, whereas, at pH levels above the pHPZC it produces more negative charges on the
surface than positive charges [76]. The pHPZC of Fe3O4 is approximately 8 as reported in the
Figure 3.10 Effect of pH on the removed amount of As by PU-IONPs
nanocomposite.
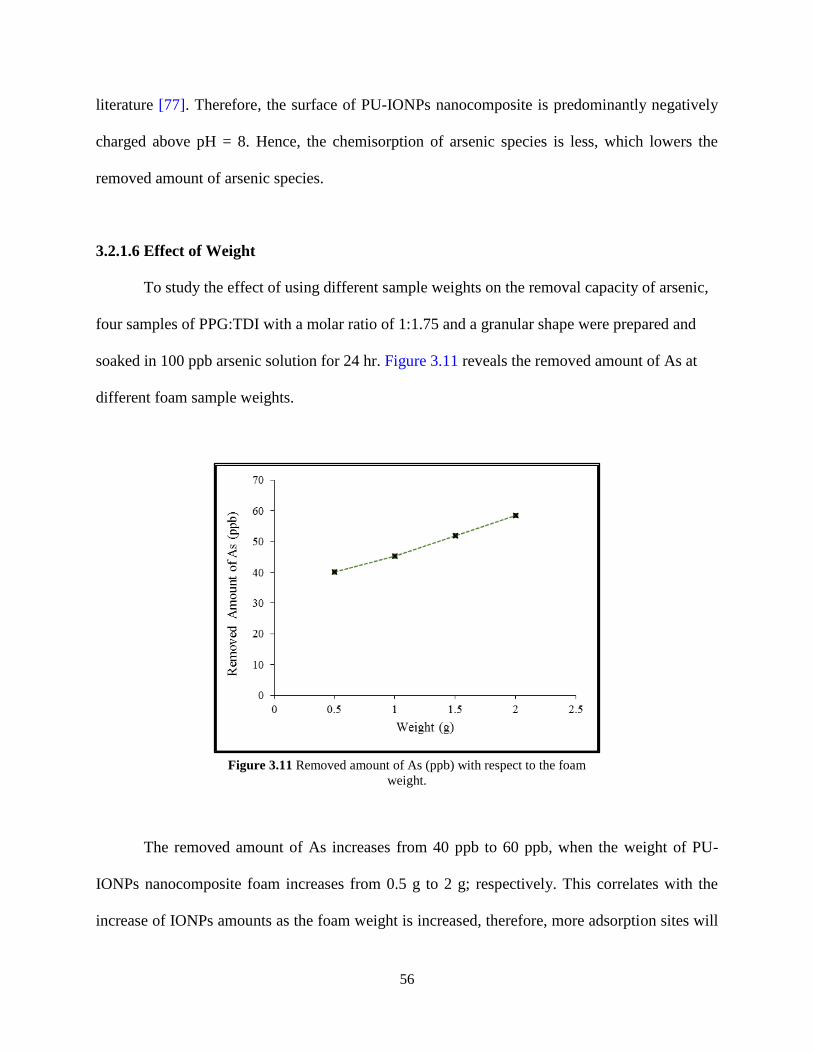
56
literature [77]. Therefore, the surface of PU-IONPs nanocomposite is predominantly negatively
charged above pH = 8. Hence, the chemisorption of arsenic species is less, which lowers the
removed amount of arsenic species.
3.2.1.6 Effect of Weight
To study the effect of using different sample weights on the removal capacity of arsenic,
four samples of PPG:TDI with a molar ratio of 1:1.75 and a granular shape were prepared and
soaked in 100 ppb arsenic solution for 24 hr. Figure 3.11 reveals the removed amount of As at
different foam sample weights.
The removed amount of As increases from 40 ppb to 60 ppb, when the weight of PU-
IONPs nanocomposite foam increases from 0.5 g to 2 g; respectively. This correlates with the
increase of IONPs amounts as the foam weight is increased, therefore, more adsorption sites will
Figure 3.11 Removed amount of As (ppb) with respect to the foam
weight.
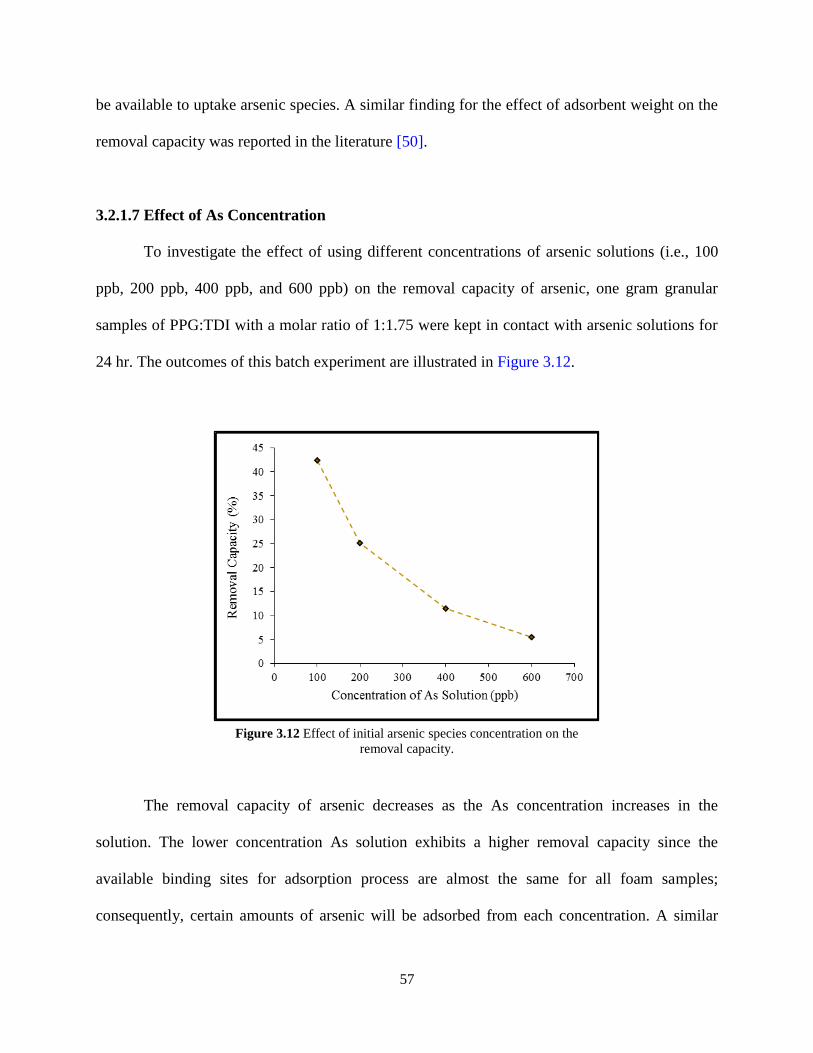
57
be available to uptake arsenic species. A similar finding for the effect of adsorbent weight on the
removal capacity was reported in the literature [50].
3.2.1.7 Effect of As Concentration
To investigate the effect of using different concentrations of arsenic solutions (i.e., 100
ppb, 200 ppb, 400 ppb, and 600 ppb) on the removal capacity of arsenic, one gram granular
samples of PPG:TDI with a molar ratio of 1:1.75 were kept in contact with arsenic solutions for
24 hr. The outcomes of this batch experiment are illustrated in Figure 3.12.
The removal capacity of arsenic decreases as the As concentration increases in the
solution. The lower concentration As solution exhibits a higher removal capacity since the
available binding sites for adsorption process are almost the same for all foam samples;
consequently, certain amounts of arsenic will be adsorbed from each concentration. A similar
Figure 3.12 Effect of initial arsenic species concentration on the
removal capacity.
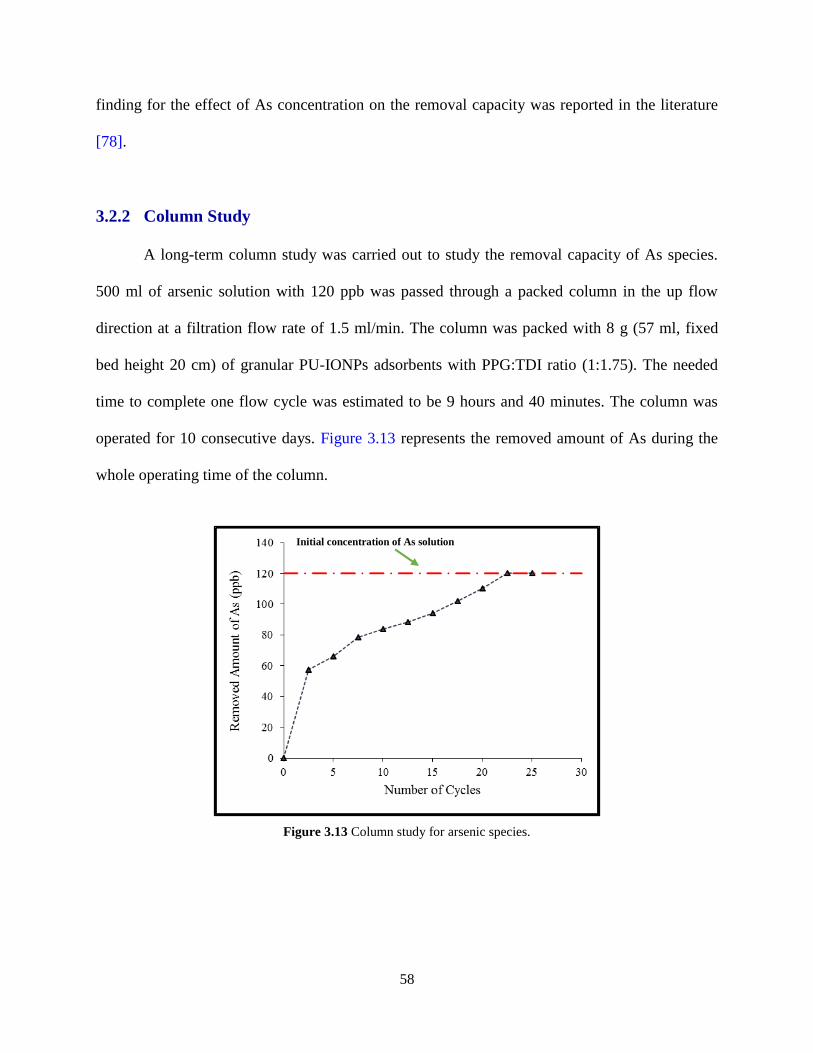
58
finding for the effect of As concentration on the removal capacity was reported in the literature
[78].
3.2.2 Column Study
A long-term column study was carried out to study the removal capacity of As species.
500 ml of arsenic solution with 120 ppb was passed through a packed column in the up flow
direction at a filtration flow rate of 1.5 ml/min. The column was packed with 8 g (57 ml, fixed
bed height 20 cm) of granular PU-IONPs adsorbents with PPG:TDI ratio (1:1.75). The needed
time to complete one flow cycle was estimated to be 9 hours and 40 minutes. The column was
operated for 10 consecutive days. Figure 3.13 represents the removed amount of As during the
whole operating time of the column.
Figure 3.13 Column study for arsenic species.
Initial concentration of As solution
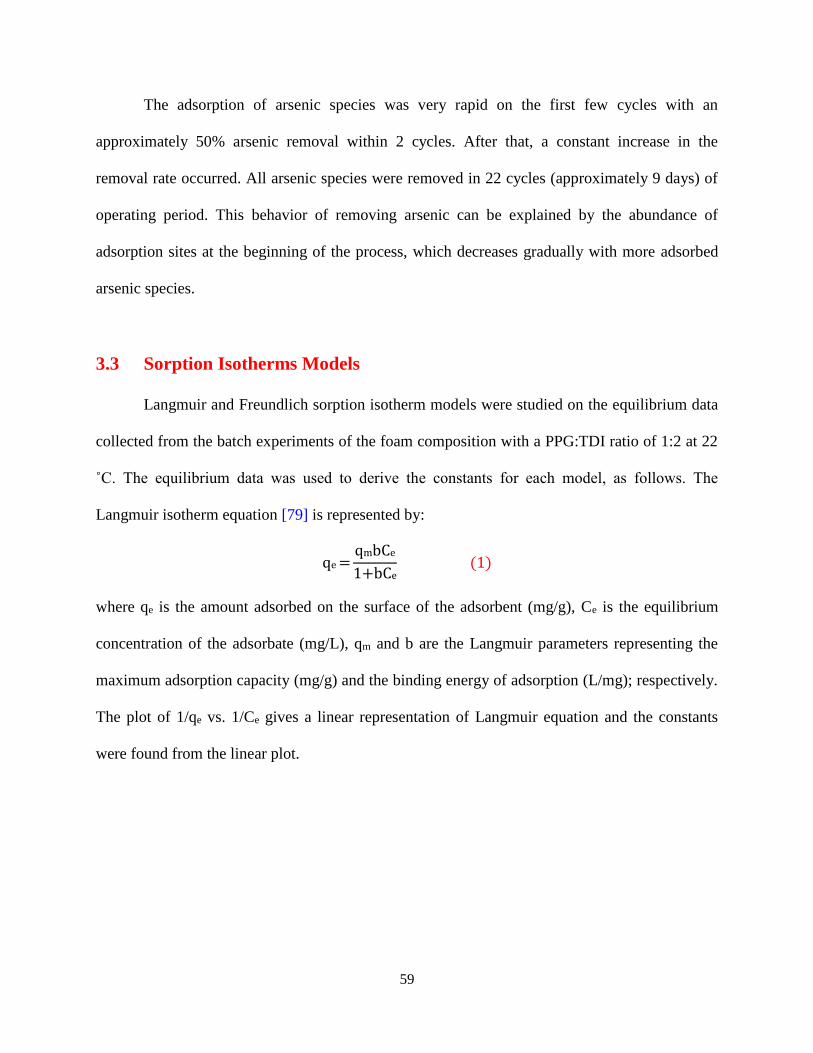
59
The adsorption of arsenic species was very rapid on the first few cycles with an
approximately 50% arsenic removal within 2 cycles. After that, a constant increase in the
removal rate occurred. All arsenic species were removed in 22 cycles (approximately 9 days) of
operating period. This behavior of removing arsenic can be explained by the abundance of
adsorption sites at the beginning of the process, which decreases gradually with more adsorbed
arsenic species.
3.3 Sorption Isotherms Models
Langmuir and Freundlich sorption isotherm models were studied on the equilibrium data
collected from the batch experiments of the foam composition with a PPG:TDI ratio of 1:2 at 22
˚C. The equilibrium data was used to derive the constants for each model, as follows. The
Langmuir isotherm equation [79] is represented by:
qe =qmbCe
1+bCe (1)
where qe is the amount adsorbed on the surface of the adsorbent (mg/g), Ce is the equilibrium
concentration of the adsorbate (mg/L), qm and b are the Langmuir parameters representing the
maximum adsorption capacity (mg/g) and the binding energy of adsorption (L/mg); respectively.
The plot of 1/qe vs. 1/Ce gives a linear representation of Langmuir equation and the constants
were found from the linear plot.
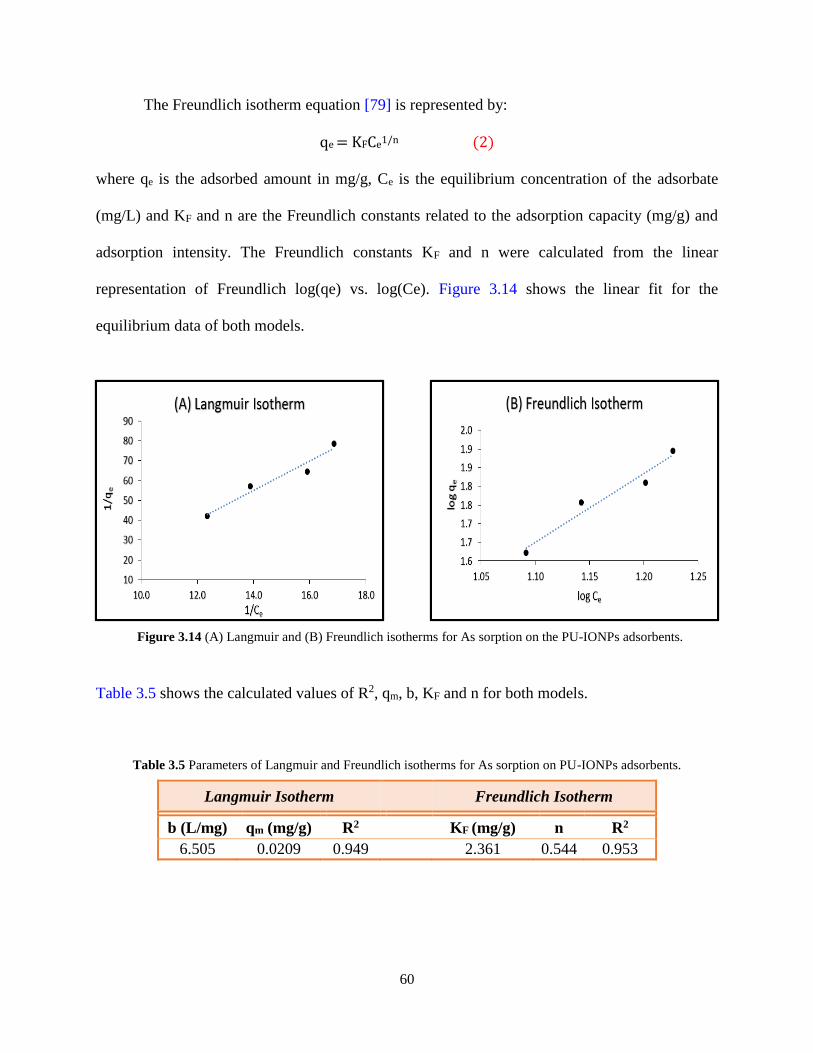
60
The Freundlich isotherm equation [79] is represented by:
qe = KFCe1/n (2)
where qe is the adsorbed amount in mg/g, Ce is the equilibrium concentration of the adsorbate
(mg/L) and KF and n are the Freundlich constants related to the adsorption capacity (mg/g) and
adsorption intensity. The Freundlich constants KF and n were calculated from the linear
representation of Freundlich log(qe) vs. log(Ce). Figure 3.14 shows the linear fit for the
equilibrium data of both models.
Table 3.5 shows the calculated values of R2, qm, b, KF and n for both models.
Table 3.5 Parameters of Langmuir and Freundlich isotherms for As sorption on PU-IONPs adsorbents.
Langmuir Isotherm Freundlich Isotherm
b (L/mg) qm (mg/g) R2 KF (mg/g) n R2
6.505 0.0209 0.949 2.361 0.544 0.953
Figure 3.14 (A) Langmuir and (B) Freundlich isotherms for As sorption on the PU-IONPs adsorbents.
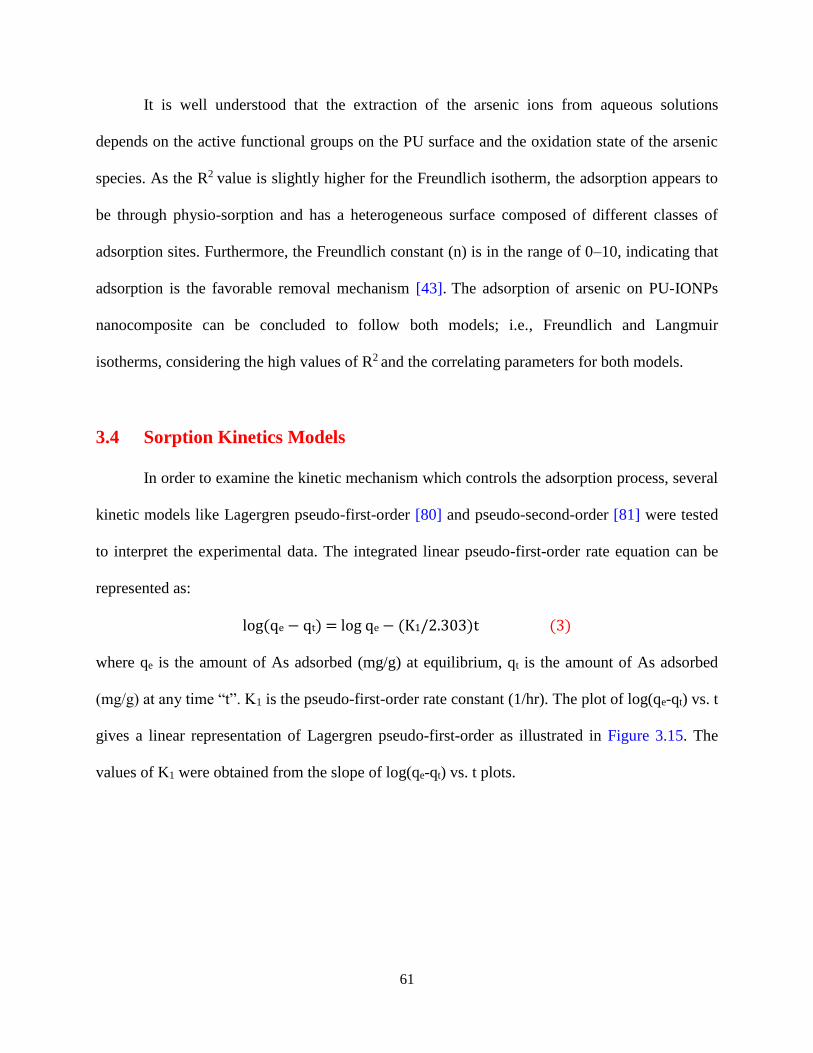
61
It is well understood that the extraction of the arsenic ions from aqueous solutions
depends on the active functional groups on the PU surface and the oxidation state of the arsenic
species. As the R2 value is slightly higher for the Freundlich isotherm, the adsorption appears to
be through physio-sorption and has a heterogeneous surface composed of different classes of
adsorption sites. Furthermore, the Freundlich constant (n) is in the range of 0–10, indicating that
adsorption is the favorable removal mechanism [43]. The adsorption of arsenic on PU-IONPs
nanocomposite can be concluded to follow both models; i.e., Freundlich and Langmuir
isotherms, considering the high values of R2 and the correlating parameters for both models.
3.4 Sorption Kinetics Models
In order to examine the kinetic mechanism which controls the adsorption process, several
kinetic models like Lagergren pseudo-first-order [80] and pseudo-second-order [81] were tested
to interpret the experimental data. The integrated linear pseudo-first-order rate equation can be
represented as:
log(qe − qt) = log qe − (K1/2.303)t (3)
where qe is the amount of As adsorbed (mg/g) at equilibrium, qt is the amount of As adsorbed
(mg/g) at any time “t”. K1 is the pseudo-first-order rate constant (1/hr). The plot of log(qe-qt) vs. t
gives a linear representation of Lagergren pseudo-first-order as illustrated in Figure 3.15. The
values of K1 were obtained from the slope of log(qe-qt) vs. t plots.
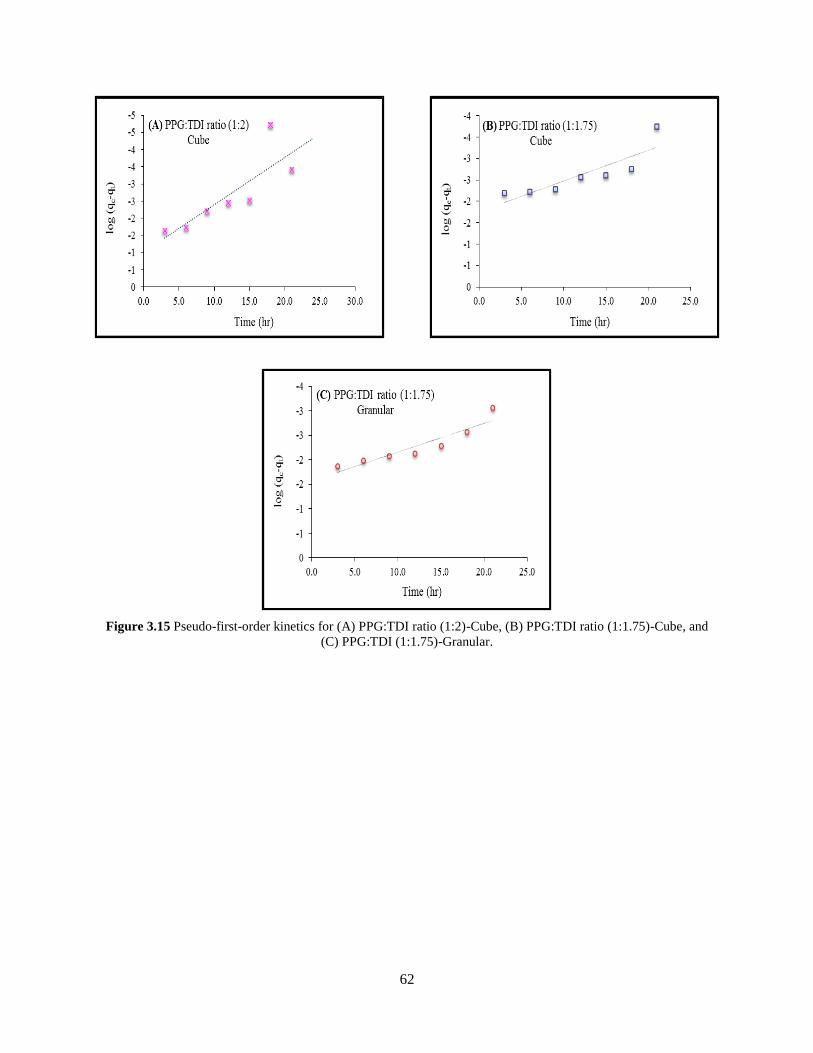
62
Figure 3.15 Pseudo-first-order kinetics for (A) PPG:TDI ratio (1:2)-Cube, (B) PPG:TDI ratio (1:1.75)-Cube, and
(C) PPG:TDI (1:1.75)-Granular.
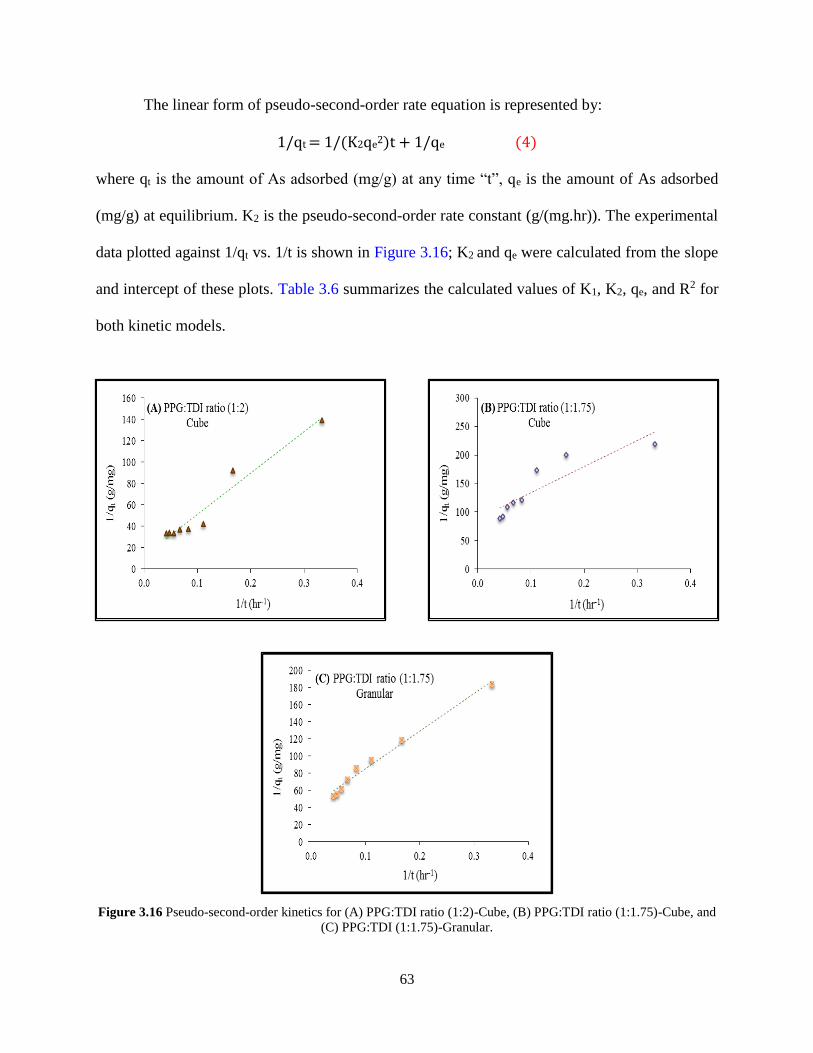
63
The linear form of pseudo-second-order rate equation is represented by:
1/qt = 1/(K2qe2)t + 1/qe (4)
where qt is the amount of As adsorbed (mg/g) at any time “t”, qe is the amount of As adsorbed
(mg/g) at equilibrium. K2 is the pseudo-second-order rate constant (g/(mg.hr)). The experimental
data plotted against 1/qt vs. 1/t is shown in Figure 3.16; K2 and qe were calculated from the slope
and intercept of these plots. Table 3.6 summarizes the calculated values of K1, K2, qe, and R2 for
both kinetic models.
Figure 3.16 Pseudo-second-order kinetics for (A) PPG:TDI ratio (1:2)-Cube, (B) PPG:TDI ratio (1:1.75)-Cube, and
(C) PPG:TDI (1:1.75)-Granular.
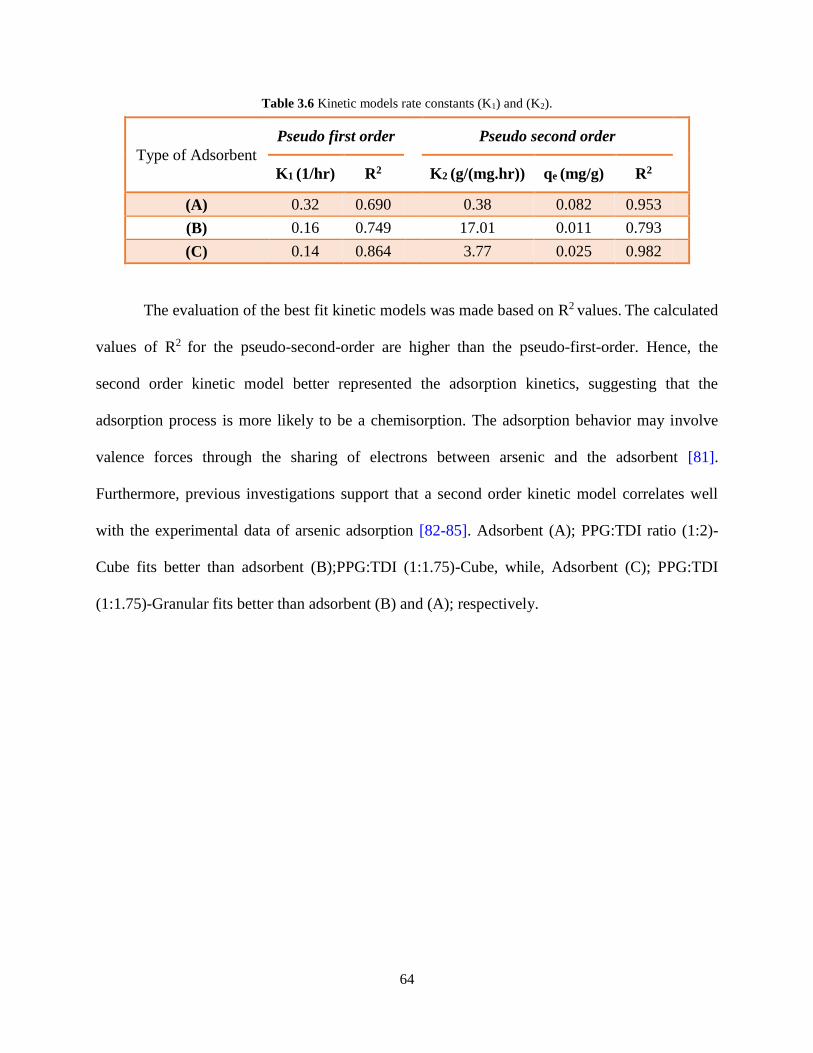
64
Table 3.6 Kinetic models rate constants (K1) and (K2).
The evaluation of the best fit kinetic models was made based on R2 values. The calculated
values of R2 for the pseudo-second-order are higher than the pseudo-first-order. Hence, the
second order kinetic model better represented the adsorption kinetics, suggesting that the
adsorption process is more likely to be a chemisorption. The adsorption behavior may involve
valence forces through the sharing of electrons between arsenic and the adsorbent [81].
Furthermore, previous investigations support that a second order kinetic model correlates well
with the experimental data of arsenic adsorption [82-85]. Adsorbent (A); PPG:TDI ratio (1:2)-
Cube fits better than adsorbent (B);PPG:TDI (1:1.75)-Cube, while, Adsorbent (C); PPG:TDI
(1:1.75)-Granular fits better than adsorbent (B) and (A); respectively.
Type of Adsorbent
Pseudo first order Pseudo second order
K1 (1/hr) R2 K2 (g/(mg.hr)) qe (mg/g) R2
(A) 0.32 0.690 0.38 0.082 0.953
(B) 0.16 0.749 17.01 0.011 0.793
(C) 0.14 0.864 3.77 0.025 0.982
65
CHAPTER 4
CONCLUSIONS
Polyurethane nanocomposite foams were synthesized using PPG, TDI, and IONPs to
remove arsenic species from drinking water. The performance analysis (i.e., removal capacity) of
PU-IONPs was examined in two aspects; studying the effect of synthesis parameters (such as,
PPG:TDI ratio, loading amount of IONPs, and IONPs size) and studying the effect of
experimental parameters (such as, foam shape, contact time, pH, foam weight, and As
concentration). In addition, related-characterization analysis was investigated (e.g., SEM/EDX,
Porosity, and open cell content) to correlate the structure-property-performance relationship.
The major conclusions, which can be made from this research work, are listed in the
following points:
1. The molar composition of PPG:TDI (1:2) demonstrated higher removal capacity compared to
the molar composition of PPG:TDI (1:1.75). The optimal loading percentage of IONPs inside
the foam matrix was found to be 12% for both molar compositions. Decreasing the size of
IONPs from 50-100 nm to 15-20 nm showed higher removal capacity of arsenic species.
2. Using the granular shape of PU-IONPs foam provided higher removal capacity compared to
the cubic shape for both compositions. The effect of the difference in the foam cellular
structure for both compositions is degraded by altering the adsorbent shape from cubic to
granular. Increasing the weight of used adsorbents led to increasing the removal capacity
under the same conditions.
66
3. The adsorption capacity of PU-IONPs increases as more contact time is allowed. However,
the equilibrium state was achieved in 24 hr in the batch experiment. The removal capacity of
the nanocomposite PU-foam decreased as As species concentration increased in the solution.
The experimental data was found to be the best fit for Freundlich isotherm model. The
kinetic data, for three different types of adsorbents, correlated well with Pseudo second order
kinetic model.
4. In the column study, long-term cyclic operation mode was found to be very effective in
removing arsenic. 100% removal capacity was achieved when 500 ml of As solution (120
ppb) was treated.
5. The optical micrographs, of composition PPG:TDI (1:2) and composition PPG:TDI (1:1.75),
illustrated a significant difference in the cell size. SEM/EDX analysis provided an auxiliary
technique to investigate the IONPs distribution inside the foam and identify the adsorptive
arsenic species. The porosity and density of molar composition PPG:TDI (1:2) were found to
be less than the porosity and density of molar composition PPG:TDI (1:1.75). The open cell
content of molar composition PPG:TDI (1:2) was found to be less than the open cell content
of molar composition PPG:TDI (1:1.75).

67
6. The nanocomposite of PU foam is capable of removing As species by both ion exchange and
adsorption mechanisms. The proposed system of polyurethane nanocomposite adsorbents
provide low cost solutions to water filtration applications with high versatility and potentials.
The proposed system will facilitate the post treatment process in the filtration system. The
pH adjustment will be only needed. The proposed system can be applied to a large-scale
purification system.
68
REFERENCES
[1] Audi, G., Bersillon, O., Blachot, J., Wapstra, H. (2003). The Nubase evaluation of nuclear
and decay properties. Nuclear Physics A, 729 (1), 3-128.
[2] Holden, E. (2007). Table of the isotopes, in CRC Handbook of Chemistry and Physics, 88th
ed. (ed. R. Lide), CRC Press, Boca Raton, FL, 50-203.
[3] Lindstrom, M., Blaauw, M., Fleming, F. (2003). The half-life of 76As. Journal of
Radioanalytical and Nuclear Chemistry, 257 (3), 489-491.
[4] Nebergall, H., Schmidt, C., Holtzclaw, Jr. (1976). College Chemistry with Qualitative
Analysis, 5th ed., D. C. Heath and Company, Lexington, MA, 1058.
[5] Faure, G. (1998). Principles and Applications of Geochemistry, 2nd ed., Prentice Hall, Upper
Saddle River, NJ, 600.
[6] Craig, J., Eng, G., Jenkins, O. (2003). Occurrence and pathways of organometallic
compounds in the environment-general considerations, in Organometallic Compounds in the
Environment, 2nd ed. (ed. J. Craig), John Wiley & Sons, Ltd, West Sussex, 1-55.
[7] Price, E., Pichler, T. (2005). Distribution, speciation and bioavailability of arsenic in a
shallow-water submarine hydrothermal system, Tutum Bay, Ambitle Island, PNG. Chemical
Geology, 224 (1-3), 122-135.
[8] Langner, W., Jackson, R., Mcdermott, R., Inskeep, P. (2001). Rapid oxidation of arsenite in a
hot spring ecosystem, Yellowstone National Park. Environmental Science and Technology,
35 (16), 3302-3309.
[9] Stollenwerk, G. (2003). Geochemical processes controlling transport of arsenic in
groundwater: a review of adsorption, in Arsenic in Ground Water, (eds. H. Welch and G.
Stollenwerk), Kluwer Academic Publishers, Boston, MA, 70-72.
[10] Henke, K. (2009). Arsenic: Environmental Chemistry, Health Threats and Waste Treatment,
John Wiley & Sons, 400-430.
69
[11] Christopher, J. (2015). States Arsenic: Exposure Sources, Health Risks, and Mechanisms of
Toxicity, John Wiley & Sons, 1-75.
[12] IARC. (2012). A Review of Human Carcinogens. C. Metals, Arsenic, Fibres and Dusts,
International Agency for Research on Cancer, Lyon, France.
[13] Levine, T., Rispin, A., Chen, C., Gibb, H. (1988). Special Report on Ingested Inorganic
Arsenic. Skin Cancer, Nutritional Essentiality, USEPA, Washington, DC, http://www.epa.
gov/raf/publications/pdfs/EPA_625_3‐87_013.PD, accessed on 4-9-2015.
[14] NRC. (1999). Arsenic in Drinking Water, National Academy Press, Washington, DC.
[15] Ellenhorn, J. (1997). Ellenhorn’s Medical Toxicology: Diagnosis and Treatment of Human
Poisoning, Williams & Wilkins, Baltimore, MD.
[16] Gorby, S. (1988). Arsenic poisoning. Western Journal of Medicine, 149, 308-315.
[17] Greenfield, G. (2004). Agent Blue and the business of killing rice. Ecologist, http://www.
countercurrents.org/us‐greenfield180604.htm, accessed on 6-13-2015.
[18] Smedley, L., Kinniburgh, G. (2002). A review of the source, behavior and distribution of
arsenic in natural waters. Applied Geochemistry, 17, 517-568.
[19] https://www.wqa.org/Portals/0/Technical/Technical%20Fact%20Sheets/2014_Arsenic.pdf,
accessed on 1-26-2016.
[20] http://water.usgs.gov/nawqa/trace/pubs/geo_v46n11, accessed on 1-26-2016.
[21] Lado, R., Polya, D., Winkel, L., Berg, M., Hegan, A. (2008). Modeling arsenic hazard in
Cambodia: A geostatistical approach using ancillary data. Applied Geochemistry, 23, 3010-
3018.
[22] Rodriguez‐Lado, L., Sun, F., Berg, M., Zhang, Q., Xue, B., Zheng, M., Johnson, A. (2013).
Groundwater arsenic contamination throughout China. Science, 341, 866-868.
70
[23] http://water.epa.gov/drink/info/arsenic/upload/2005_11_10_arsenic_treatments_and_costs.pd
f, accessed on 5-16-2015.
[24] Pontius, W. (1990). Water quality and treatment: a handbook of community water supplies,
AWWA, New York.
[25] http://www.agmcontainer.com/activated-alumina.html, accessed on 2-26-2016.
[26] Clifford, A., Ghurye, L. (2002). Metal‐oxide adsorption, ion exchange, and coagulation
microfiltration for arsenic removal from water. In: Frankenberger, Jr. W.T. (Ed.),
Environmental chemistry of arsenic, CRC Press, New York, 217-245.
[27] http://waterions.aceenvironment.com/edr, accessed on 2-26-2016.
[28] Driehaus, W., Jekel, M., Hildebrandt, U. (1998). Granular ferric hydroxide-a new adsorbent
for the removal of arsenic from natural water. Aqua, 47, 30-35.
[29] Gallegos‐Garcia, M., Ramírez‐Muñiz, K., Song, S. (2012). Arsenic removal from water by
adsorption using iron oxide minerals as adsorbents: a review. Mineral Processing and
Extractive Metallurgy Review, 33, 301-315.
[30] Guan, X., Du, J., Meng, X., Sun, Y., Sun, B., Hu, Q. (2012). Application of titanium dioxide
in arsenic removal from water: a review. Journal of Hazardous Materials, 215, 1-16.
[31] Anirudhan, S., Unnithan, R. (2007). Arsenic(V) removal from aqueous solutions using an
anion exchanger derived from coconut coir pith and its recovery. Chemosphere, 66 (1), 60-
66.
[32] Hansen, K., Ribeiro, A., Mateus, E. (2006). Biosorption of arsenic(V) with Lessonia
nigrescens. Minerals Engineering, 19, 486-490.
[33] Budinova, T., Petrov, N., Razvigorova, M. et al. (2006). Removal of As(III) from aqueous
solution by activated carbons prepared from solvent extracted olive pulp and olive stones.
Industrial and Engineering Chemistry Research, 45 (6), 1896-1901.
71
[34] Chen, C., Chung, C. (2006). Arsenic removal using a biopolymer chitosan sorbent. Journal
of Environmental Science and Health A, 41 (4), 645-658.
[35] Macy, M., Santini, M. (2002). Unique modes of arsenate respiration by Chrysiogenes
arsenatis and Desulfomicrobium sp. str. Ben-RB, in: Frankenberger, Jr. W.T. (Ed.),
Environmental Chemistry of Arsenic, Marcel Dekker, New York, 297-312.
[36] Leblanc, M., Casiot, C., Elbaz-Poulichet, F., Personne‘, C. (2002). Arsenic removal by
oxidizing bacteria in a heavily arsenic-contaminated acid mine drainage system (Carnoule‘s,
France). Geological Society Special Publication, 198, 267-74.
[37] Lee, S., Park, C., Ramesh, S. (2007). Polymeric Foams Science and Technology, CRC Press,
Boca Raton, FL.
[38] http://www.businesswire.com/news/home/20130822005059/en/SPF-Insulation-Demand-
Grow-13-Year-1.1#.VIz6MjHF-s0, accessed on 12-7-2015.
[39] http://www.grandviewresearch.com/industry-analysis/polyurethane-pu-market, accessed on
12-7-2015.
[40] Saunders, H., Frisch, C. (1962). Polyurethanes: Chemistry and Technology-Part 1:
Chemistry, Wiley-Interscience, New York.
[41] Macosko, W. (1989). Fundamentals of Reaction Injection Molding, Carl Hanser Verlag,
Munich.
[42] Kanner, B., Prokai, B. (1973). Advances in Urethane Science and Technology, Techonomic
Publishing Company, Westport, 2, 221.
[43] Mahanta, N., Valiyaveetti, S. (2013). Functionalized poly (vinyl alcohol) based nanofibers
for the removal of arsenic from water. RSC Advances, 3, 2776-2783.
[44] Nguyen, T., Vigneswaran, S., Ngo, H., Pokhrel, D., Viraraghavan, T. (2006). Iron-coated
sponge as effective media to remove arsenic from drinking water. Water Quality Research
Journal of Canada, 41 (2), 164-170.
72
[45] Nguyen, T., Rahman, A. et al. (2009). Arsenic removal by iron oxide coated sponge:
treatment and waste management. Water Science and Technology, 60 (6), 1489-1495.
[46] Nguyen, T., Vigneswaran, S. et al. (2010). Arsenic removal by iron oxide coated sponge:
experimental performance and mathematical models. Journal of Hazardous Materials, 182,
723-729.
[47] Nguyen, T. et al. (2009). Adsorption and removal of arsenic from water by iron ore mining
waste. Water Science and Technology, 60 (9), 2301-2308.
[48] Vunain, E., Mishra, A., Krause, R. (2013). Fabrication, Characterization and Application of
Polymer Nanocomposites for Arsenic(III) Removal from Water. Journal of Inorganic
Organometallic Polymer, 23, 293-305.
[49] Devi, R., Umlong, I. et al. (2014). Removal of iron and arsenic(III) from drinking water
using iron oxide-coated sand and limestone. Applied Water Science, 4, 175-182.
[50] Kanel, S., Greneche, J., Choi, H. (2006). Arsenic(V) Removal from Groundwater Using
Nano Scale Zero-Valent Iron as a Colloidal Reactive Barrier Material. Environmental
Science and Technology, 40, 2045-2050.
[51] Guan, X., Wang, J., Chusuei, C. (2008). Removal of arsenic from water using granular ferric
hydroxide; Macroscopic and microscopic studies. Journal of Hazardous Materials, 156, 178-
185.
[52] Zhang, T., Sun, D. (2013). Removal of arsenic from water using multifunctional micro-
/nano-structured MnO2 spheres and microfiltration. Chemical Engineering Journal, 225, 271-
279.
[53] Hristovski, K. et al. (2008). Arsenate Removal by Nanostructured ZrO2 Spheres.
Environmental Science and Technology, 42, 3786-3790.
[54] http://www.dow.com/polyglycols/ppgc/na/products/ppgs.htm, accessed on 1-27-2016.
[55] http://www.sigmaaldrich.com/catalog/product/aldrich/81350, accessed on 1-27-2016.
73
[56] https://en.wikipedia.org/wiki/Polypropylene_glycol, accessed on 1-28-2016.
[57] http://www.wisegeek.com/what-is-polypropylene-glycol.htm, accessed on 1-28-2016.
[58] https://en.wikipedia.org/wiki/Toluene_diisocyanate, accessed on 1-28-2016.
[59] http://www.chemspider.com/Chemical-Structure.6773.html, accessed on 1-28-2016.
[60] Six, C., Richter, F. (2005). "Isocyanates, Organic", Ullmann's Encyclopedia of Industrial
Chemistry, Wiley-VCH, Weinheim, DOI:10.1002/14356007.a14_611.
[61] Randall, D., Lee, S. (2003). The Polyurethanes Book, Wiley, New York.
[62] https://www.alfa.com/en/catalog/036733/, accessed on 1-28-2016.
[63] https://cameochemicals.noaa.gov/chemical/17847, accessed on 1-28-2016.
[64] http://www.us-nano.com/inc/sdetail/435, accessed on 1-29-2016.
[65] Gunashekar, S., Abu-Zahra, N. (2014). Characterization of Functionalized Polyurethane
Foam for Lead Ion Removal from Water. International Journal of Polymer Science, 1-7,
DOI:10.1155/2014/570309.
[66] Szycher, M. (1999). Szycher's Handbook of Polyurethanes, CRC Press, 1126.
[67] http://www.micromeritics.com/Product-Showcase/AutoPore-IV.aspx, accessed on 2-2-2016.
[68] http://www.particletesting.com/Services-Provided/Density.aspx, accessed on 2-21-2016.
[69] http://simulab.ltt.com.au/5/PMLTEST506/section4Intro.htm, accessed on 2-24-2016.
74
[70] http://msdssearch.dow.com/PublishedLiteratureDOWCOM/dh_015a/0901b8038015ac4e.pdf,
accessed on 11-15-2015.
[71] Mittal, V. (2013). Polymer Nanocomposite Foams, CRC Press.
[72] Boomsma, K., Poulikakos, D. (2002). The effects of compression and pore size variations on
the liquid flow characteristics in metal foams. ASME Journal of Fluids Engineering, 124,
263-272.
[73] Gunashekar, S. (2015). A study on the synthesis-structure-performance relationship of bulk
functionalized polyurethane foams for water filtration applications. Ph.D. Dissertation,
University of Wisconsin, Milwaukee, WI.
[74] Mayo, T., Yavuz, C., Yean, S., et al. (2007). The effect of nanocrystalline magnetite size on
arsenic removal. Science Technology Advanced Materials Journal, 8 (12), 71-75.
[75] Yavuz, T., Mayo, T., Yu, W. (2006). Low-field magnetic separation of monodisperse Fe3O4
nanocrystals. Science, 314 (5801), 964-967.
[76] Mondal, P., Mohanty, B., Majumder, B. (2013). Effect of pH and treatment time on the
removal of arsenic species from simulated groundwater by using Fe3+ and Ca2+ impregnated
granular activated charcoals. Chemical Engineering Science Journal, 1 (2), 27-31.
[77] Cornell, M., Schwertmann, U. (1996). The iron oxides, VCH, Weinheim.
[78] Mandal, S., Sahu, M., Patel, R. (2013). Adsorption studies on arsenic(III) removal from
water by zirconium polyacrylamide hybrid material (ZrPACM-43). Water Resources and
Industry, 4, 51-67.
[79] Sawyer, N., McCarty, L., Parkin, F. (2003). Chemistry for Environmental Engineering and
Science, 5th ed., McGraw Hill.
[80] Lagergren, S. (1889). To the theory of so-called adsorption of dissolved substances. The
Royal Swedish Academy of Sciences, 24, 1-39.
75
[81] Ramesh, A., Hasegawa, H., Maki, T., Ueda, K. (2007). Adsorption of inorganic and organic
arsenic from aqueous solutions by polymeric Al/Fe modified montmorillonite. Separation
and Purification Technology, 56, 90-100.
[82] Guo, X., Chen, F. (2005). Removal of arsenic by bead cellulose loaded with iron
oxyhydroxide from groundwater. Environmental Science and Technology, 39, 6808-6818.
[83] Thirunavukkarasu, S., Viraraghavan, T., Subramanian, S. (2003). Arsenic removal from
drinking water using granular ferric hydroxide. Water SA, 29, 161-170.
[84] Kundu, S., Gupta, K. (2005). Sorption kinetics of As(V) with iron-oxide-coated cement-a
new adsorbent and its application in the removal of arsenic from real-life groundwater
samples. Journal of Environmental Science and Health A, 40, 2227-2246.
[85] Kundu, S., Gupta, K. (2006). Adsorptive removal of As(III) from aqueous solution using iron
oxide coated cement (IOCC): Evaluation of kinetic, equilibrium and thermodynamic models.
Separation and Purification Technology, 51, 165-172.