Embed Size (px)
Citation preview
1
“Synthesis and properties of oligonucleotides carrying isoquinoline imidazo[1,2-a]azine fluorescente units” Pérez-Rentero, S., Kielland, N., Terrazas, M., Lavilla, R., Eritja, R. Bioconjugate Chem., 21(9), 1622-1628 (2010).PMID: 20687535, doi: 10.1021/bc1000966
Synthesis and properties of oligonucleotides carrying
isoquinoline imidazo[1,2-a]azine fluorescent units.
Sónia Pérez-Rentero‡, Nicola Kielland§, Montserrat Terrazas‡, Rodolfo Lavilla*,§,†, and Ramon Eritja*,‡
‡Institute for Research in Biomedicine, IQAC-CSIC, CIBER-BBN Networking Centre on
Bioenginnering, Biomaterials and Nanomedicine. Baldiri Reixac 10, 08028 Barcelona, Spain.
§Institute for Research in Biomedicine. Laboratory of Organic Chemistry, Faculty of Pharmacy.
University of Barcelona. Baldiri Reixac 10-12, 08028 Barcelona, Spain.
†Laboratory of Organic Chemistry, Faculty of Pharmacy. University of Barcelona. Avda Joan XXIII s/n,
08028 Barcelona, Spain.
TITLE RUNNING HEAD. Fluorescent labeling of oligonucleotides
*To whom correspondence should be addressed: phone 34-934039942 (email) [email protected];
2
Abstract. Oligonucleotides carrying novel fluorescent compounds with a dipolar isoquinoline
imidazo[1,2-a]azine core were prepared. Analysis of the melting curves demonstrates that DNA
duplexes carrying these fluorescent labels at their ends have a slight increase on DNA duplex stability.
The UV absorption and fluorescent properties of the oligonucleotide conjugates were analyzed. The
fluorescent label is sensitive to duplex formation as cooperative melting curves are also observed at
366nm and fluorescence has a large increase upon denaturation. Cell-uptake studies allow observation
of these fluorescently-labeled oligonucleotides internalized into HeLa cells.
KEYWORDS. Oligonucleotides, fluorescence, multicomponent reactions.
Introduction
There is a considerable interest in the development of new dyes and the introduction of these into
biomolecules such as peptides, proteins and nucleic acids (1). Furthermore, the development of new
methodologies for the selective and straightforward modification of biomolecules is having an
increasing impact on biopharmaceuticals. When fluorescent molecules are attached to biomolecules that
are not fluorescent, the resulting new entity acquires the fluorescent properties. Thus, fluorescent labels
allow sensitive and selective detection of a specific component of complex biomolecular assemblies.
Fluorescence-labeled oligonucleotides have large number of applications in several fields, such as
biotechnology (2), cell biology (3), molecular biology (4), and biophysics (5). Therefore, the
development of new fluorescent labels for oligonucleotides is of particular relevance (6, 7).
Recently, we described the synthesis of a new class of fluorescent mesoionic acid fluorides using a
multicomponent strategy. The reaction involves the participation of an azine, an isocyanide and a
fluorinated anhydride and yields dipolar derivatives with an isoquinoline imidazo[1,2-a]azine core (see
scheme 1) (8). These compounds are fluorescent, and when trifluoroacetic anhydride is used, they
contain a reactive acid fluoride group that can be used to introduce the fluorescent label, by means of
amide formation, into biomolecules that carry amino groups. The modular character of this
3
multicomponent reaction (MCR) (9) allows the convergent synthesis of a large variety of structural
analogs in a single step. Thus both the fluorescent and biological properties of the dye can be optimized
for specific applications. In this respect, the present study determines the features of the conjugation of
these stable dipolar acyl fluorides with oligonucleotides, a fruitful strategy often used in peptide
synthesis (10), which to our knowledge is unprecedented in the oligonucleotide field.
Here we report the conjugation of mesoionic acid fluorides 1a and 1b with oligonucleotides carrying
alkyl amino groups (scheme 2) and demonstrate that fluorescence-labeled oligonucleotides can be
prepared in good yields directly from the reaction of amino-oligonucleotides and mesoionic acid
fluorides in aqueous media. Dipoles 1a and 1b, bearing respectively cyclohexyl and benzyl group as
substituents at the imidazole nitrogen, were selected from a set of described analogues for the following
reasons. First, they can be synthesized in multigram scale with a simple methodology and are well
characterized (X-Ray, NMR and spectroscopy); also their substituents at the imidazole nitrogen
(cyclohexyl and benzyl) featuring relevant differences in terms of shape, volume, polarity and
conformational behavior, may confer to the corresponding bioconjugates distinct properties.
Furthermore both residues are chemically stable, unlikely to suffer degradation in physiological media
and, from an exploratory point of view, easy to replace by a wide number of analogues.
Our results indicate that the novel fluorescent oligonucleotides show potentially interesting properties
for denaturation monitoring procedures as well as for cellular uptake studies.
Experimental Procedures
The phosphoramidites and ancillary reagents used during oligonucleotide synthesis were from Applied
Biosystems (PE Biosystems Hispania S.A., Spain) and Link Technologies Ltd. (Scotland). The rest of
the chemicals were purchased from Aldrich, Sigma or Fluka (Sigma-Aldrich Química S.A., Spain). 1-
Cyclohexyl-3-(fluorocarbonyl)-2-oxo-2,3-dihydro-1H-imidazo[2,1-a]isoquinolin-4-ium-3-ide (1a), 1-
benzyl-3-(fluorocarbonyl)-2-oxo-2,3-dihydro-1H-imidazo[2,1-a]isoquinolin-4-ium-3-ide (1b) 1-
cyclohexyl-3-(4-methoxybenzylcarbamoyl)-2-oxo-2,3-dihydro-1H-imidazo[2,1-a]isoquinolin-4-ium-3-
4
ide (1c) and 1-cyclohexyl-3-(methoxycarbonyl)-2-oxo-2,3-dihydro-1H-imidazo[2,1-a]isoquinolin-4-
ium-3-ide (1d) were prepared following literature procedures (8) (scheme 1).
Synthesis of oligonucleotides. Oligonucleotide sequences A: 5’-CCAATTGG-3’, and B: 5’-
TTCCGGAA-3’ and C: 5’-CTCTCGCACCCATCTCTCTCCTTCT-3’ were prepared on an automatic
Applied Biosystems 3400 DNA synthesizer on 0.2- or 1-μmol scale using commercially available
chemicals. The sequences were prepared with and without the amino group at the 3’-end. The synthesis
was carried out using the standard phosphite triester methodology and a controlled-pore-glass support
carrying the 2-(N-{[(9H-fluoren-9-yl)methoxy]carbonyl}-4-aminobutyl)propane-1,3-diol linker (11)
(scheme 2) or in regular low-volume (LV200) polystyrene supports. The benzoyl (Bz) group was used
to protect the amino group of dC and dA, and the isobutyryl (ibu) group to protect dG. Coupling yields
were >95%. The last DMT group was removed at the end of the synthesis. The oligonucleotide was
deprotected and cleaved from the support by treatment with aqueous concentrated ammonia for 12 h at
55ºC. Under these conditions, all protecting groups, including Fmoc were removed to yield unprotected
3'-amino-oligonucleotide. The mixture was filtered and the ammonia solution was concentrated to
dryness. The residue was passed through a Dowex 50x4 (Na+ form) column to exchange ammonium
ions for Na+ ions. The solution was analyzed by HPLC and used directly in the dye conjugation.
Analytical HPLC solutions: Solvent A: 5% acetonitrile (MeCN) in 100 mM triethylammonium acetate
(pH=7) and solvent B: 70% MeCN in 100 mM triethylammonium acetate (pH=7). Column: X-Bridge
TMOST C18 (2.5 μm 4,6x50 mm). Flow rate: 1 mL/min. Conditions for the analysis of octamers: 10 min
linear gradient from 0-30% B at 60ºC; for the analysis of 25mer: 4 min linear gradient from 0-12% B,
then 6 min linear gradient from 12-50% B at 60ºC). The desired oligonucleotides eluted at 2.5-3.5 min.
Alternatively, oligonucleotides were purified by HPLC (see below).
Octamer sequence A (200 nmol scale): 33% yield (5 OD260) tR=2.6 min. Octamer sequence A 3’-NH2 (1
μmol scale): 47% yield (36 OD260), tR=2.6 min. MALDI-TOF MS m/z (negative mode, THAP-CA, [M-
5
H]-) expected for C85H106N31O50P8 2617.8, found 2618.7). Octamer sequence B (200 nmol scale): 39%
yield (6 OD260) tR=3.2 min. Octamer Sequence B 3’-NH2 (1 μmol scale): 54% yield (42 OD260), tR=3.2
min. MALDI-TOF MS m/z (negative mode, THAP-CA, [M-H]-) calculated for C85H106N31O50P8 2617.8,
found 2617.9). 25mer sequence C 3’-NH2 (1 μmol scale): 58% yield 118 OD260), tR=4.0 min. MALDI-
TOF MS m/z (negative mode, THAP-CA, [M-H]-) expected for C244H301N73O159P25 7600, found
7603.6).
General protocol for conjugation. The amino-oligonucleotides were reacted with 1-cyclohexyl-3-
(fluorocarbonyl)-2-oxo-2,3-dihydro-1H-imidazo[2,1-a]isoquinolin-4-ium-3-ide (1a) or 1-benzyl-3-
(fluorocarbonyl)-2-oxo-2,3-dihydro-1H-imidazo[2,1-a]isoquinolin-4-ium-3-ide (1b) or with fluorescein
isothiocyanate (FITC) (Isomer I, Sigma) as follows. Oligonucleotides (7 O.D.) were dissolved with 250
μL of an aqueous solution of NaHCO3 0.2M (pH=9). Then, 10 equiv of a solution of compound 1a or
1b or FITC in 0.25 ml of N,N-dimethylformamide (DMF) were added and the mixture was left to react
for 8 h at room temperature. Then 100 μL of an aqueous solution of NaHCO3 0.2M (pH=9) and an
additional 10 equiv of compound 1a or 1b in 100 μL of DMF were added and the mixture was left
overnight at room temperature. The mixtures were concentrated to dryness, and the residues were
dissolved in 1 ml of H2O. The solutions were purified by Sephadex G-25 (NAP-10 columns). The
fractions containing oligonucleotides were analyzed by HPLC as described above (Figure 1). Octamer 5
and 25mer 6 were used in the next step without further purification. Octamers 2-4 were purified by
HPLC on a Nucleosil 120C18 (10μm, 200x10 mm) column. Flow rate: 3 mL/min. Conditions: 10 min
linear gradient from 0-30% B, then a 10 min linear gradient from 30-100% B. The resulting products
were desalted with Sephadex G-25 (NAP-5 Column). The coupling efficiency was determined by HPLC
analyses (Octamer 2 91%, Octamer 3 91%, Octamer 4 94%, 25mer 6 85%, Octamer 5 (FITC) 94%).
HPLC solutions as described above. Column: X-Bridge TMOST C18 (2.5 μm 4,6x50 mm). Flow rate: 1
mL/min. Conditions: 4 min linear gradient from 0-12% B, then a 1 min linear gradient from 12-40% B,
then 5 min linear gradient from 40-45%B at 60ºC. The purified oligomers were analyzed by MS
(MALDI-TOF) and UV-vis (Table 1).
6
Octamer 2: 39% yield (2.7 OD260), tR=6.7 min., λ=260 and 347 nm, MALDI-TOF MS m/z negative
mode, THAP-CA, [M-H]- calculated for C103H122N33O52P8 2910.1, found 2911.8.
Octamer 3: 54% yield (3.8 OD260), tR=6.7 min., λ=260 and 346 nm, MALDI-TOF MS m/z negative
mode, THAP-CA, [M-H]- calculated for C103H122N33O25P8 2910.1, found 2906.8.
Octamer 4: 26% yield (1.8 OD260), tR=6.4 min., λ=260 and 345 nm, MALDI-TOF MS m/z negative
mode, THAP-CA, [M-H]- calculated for C104H118N33O52P8 2918.3, found 2914.9.
Octamer 5: 84% yield (5.9 OD260), tR=5.8 min., λ=260 and 493 nm, MALDI-TOF MS m/z negative
mode, THAP-CA, [M-H]- calculated for C106H128N32O55P8S 3008.9, found 3004.0.
25mer 6 (from 30 OD260): 71% yield (21.3 OD260 ), tR=8.3 min (4-min linear gradient from 0-12% B,
then 6-min linear gradient from 12-50% B, at 60ºC), λ=268 and 348 nm; MALDI-TOF MS m/z negative
mode, THAP-CA, [M-H]- expected 7892.3, found 7870.2.
Melting experiments. Melting experiments were performed in duplicate at concentrations ranging
from 1.5-14 μM of duplex. Solutions of each oligonucleotide were mixed in a solution containing 1M
NaCl and 100 mM sodium phosphate buffer pH=7. The DNA concentrations were determined by UV-
absorbance measurements (260 nm) at 80ºC, using the ε260 values calculated by the nearest-neighbor
method for the DNA coil state. For octamer 5 the ε260 value was calculated by the nearest-neighbor
method as well and adding the contribution of fluorescein (the extinction coefficient of fluorescein
(measured as FITC) at 260nm is around 13.7 mM-1cm-1). Samples were heated at 90ºC for 5 min,
allowed to cool slowly to room temperature to induce annealing, and then kept overnight in a
refrigerator (4ºC).
Melting curves were recorded by heating the samples with a temperature controller from 15 to 80ºC at a
constant rate of 1ºC/min and monitoring the absorbance at 260 nm. During the experiment, when the
temperature was below 25ºC, argon was flushed to prevent water condensation on cuvettes. Absorption
7
spectra and melting experiments (absorbance vs. temperature) were recorded in 1-cm-path-length cells.
Melting curves were analyzed by computer-fitting the denaturation data, using Meltwin 3.5 software.
Melting temperatures (Tm) decreased with the concentration c, as expected for a bimolecular reaction
(12). The plot of 1/Tm vs. lnc was linear, giving a slope and a y-intercept, from which ΔH, ΔS and ΔG
were obtained (Table 2).
Fluorescence analysis.
Fluorescence spectra were measured in solutions containing 1M NaCl and 100 mM sodium phosphate
buffer (pH=7) at a concentration of 2.3 μM. Excitation was set at 345 nm for octamers 2-4 and 493 nm
for octamer 5. Fluorescence spectra were measured before (FD) and after (FRC) duplex denaturation to
yield relative fluorescence intensity (FRC/FD)). Results are shown in Figure 2 and Table 4.
Flow cytometry experiments.
HT-29 cells were incubated for 8h with dipole 1c at concentrations of 2 μM, 5 μM, 10 μM, 20 μM
and 40μM in a low glucose DMEM (Biological Industries) medium in the absence of phenol red. A
blank control was also prepared. The supernatant was separated and placed in falcon tubes. The cells
were treated with trypsin and placed in the corresponding falcon tubes. Each tube was centrifuged for 4
min at 2000 RPM. The supernatant was removed and PBS (500 μL) was added to each tube. The
samples were treated with a propidium iodide solution (5 μL of a 1 μg/mL solution) and analyzed with a
Cell Lab Quanta SC cytometer (Beckman Coulter).
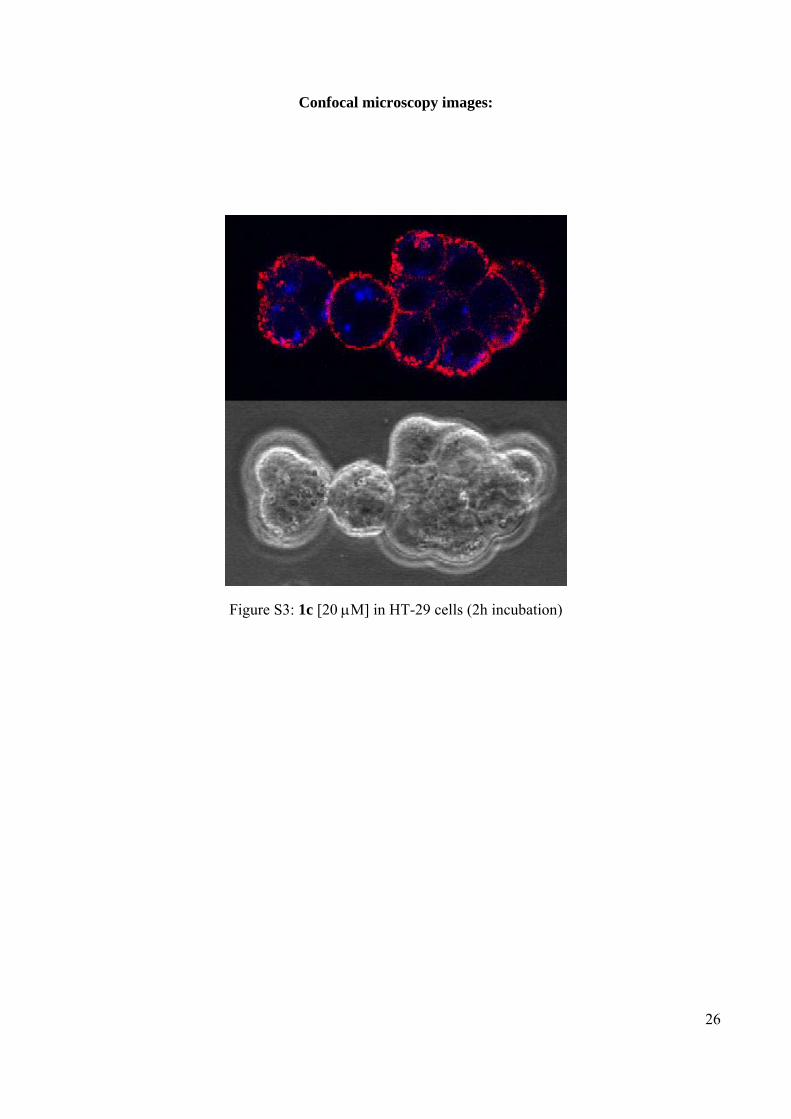
Confocal microscopy experiments
HT-29 cells were incubated with dipole 1c and 1d (20μM) for 2 h in a DMEM medium without
phenol red. The living cells were treated with the plasmatic membrane marker WGA (Texas Red-x)-D
(excitation at 595nm, emission 615nm). After 15 min the cells were analyzed in vivo with a Leica TCS
SP2 confocal microscope (excitation at 350 nm, emission between 400 and 500 nm). In these

8
experiments, a blank control with the cells in the absence of dipole 1c or its conjugate was analyzed.
The intensity of the laser was adjusted in order to prevent detection of autofluorescent processes.
Products 1c and 1d were detected in the cytoplasmatic region and they formed well defined aggregates
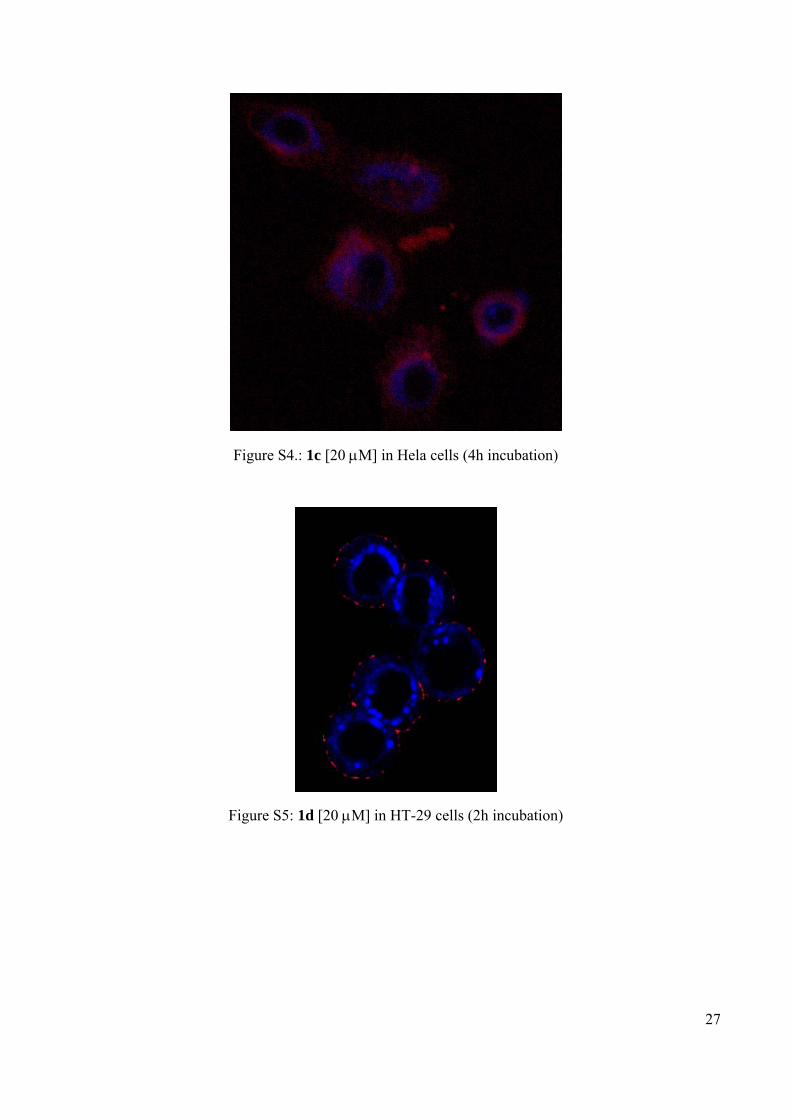
(see Supporting Information). Using the same procedure, HeLa cells were incubated with 1c and
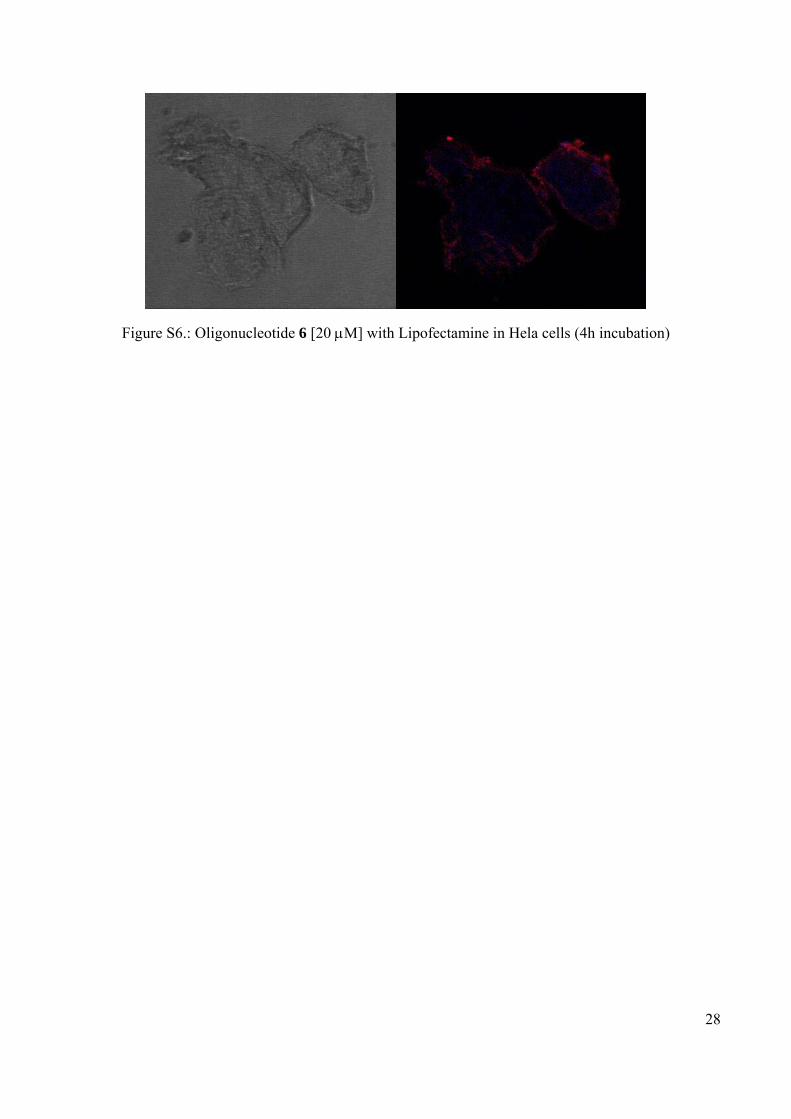
oligonucleotide 6 (20μM) for 4 h. While 1c showed the same result as in the previous experiment, no
fluorescence was detected using oligonucleotide 6. In the presence of LipofectamineTM 2000
oligonucleotide 6 penetrated the cytoplasmatic region.
Results and Discussion.
Synthesis and thermodynamic properties of fluorescence labeled oligonucleotides
Small ligands can be incorporated into synthetic oligonucleotides at specific sites by preparing
oligonucleotides carrying aliphatic amino groups and performing a conjugation reaction with the
carboxylic derivatives of the ligands (11,13,14). This strategy was used to incorporate the acyl fluorides
derivatives 1a and 1b into oligonucleotides (Scheme 2). Oligonucleotide sequences (Table 1) carrying
an amino group at the 3'-end were assembled using a controlled pore glass support carrying the 2-(N-
{[(9H-fluoren-9-yl)methoxy]carbonyl}-4-aminobutyl)propane-1,3-diol linker (11) and following
standard protocols. The resulting oligonucleotides were used in the reaction with acyl fluorides (Scheme
1).
Amino-oligonucleotides were reacted with an excess of acyl fluorides 1a and 1b in aqueous
dimethylformamide (DMF) mixtures at pH 9 and room temperature. In these mild conditions the desired
fluorescent oligonucleotides 2-4, 6 were produced in good yields as shown by the presence of new
products with higher retention time, which were characterized by mass spectrometry and UV spectra
(Figure 1 and Table 1). In addition we have prepared the fluoresceine-labelled octamer 5 by reaction of
the appropriate amino-octamer with fluoresceine isothiocyanate (FITC).

9
The hybridization properties of the oligonucleotides carrying the isoquinoline imidazo[1,2-a]azine
group were measured spectrophotometrically on the self-complementary octamer duplexes 2-4.
Unmodified octamers were included for comparison purposes (Table 2). The duplex formed by
sequence A which carried two molecules of compound 1a (octamer 2), melted at 41.1 ºC (ΔG 20.6 kcal/
mol), while the unmodified duplex melted at 33.3 ºC (ΔG 18.0 kcal/ mol). This observation implies an
increase in duplex stability of 3.8 ºC (ΔΔG 1.3 kcal/ mol) per fluorescent molecule. In contrast, the
duplex formed by sequence A, carrying two molecules of compound 1b (octamer 4), melted at 34 ºC
(ΔG 17.7 kcal/ mol), thereby indicating a small destabilization of the duplex. This effect should reflect
the previously mentioned differences between the substituents on the imidazole nitrogen of the dipoles,
presumably arising from the distinct interactions at the conformational level of the cyclohexyl and
benzyl groups with the oligonucleotide backbone. The stabilizing properties of compound 1a were
slightly increased in octamer 3 (ΔΔG 2.0 kcal/ mol), thereby indicating that the stabilizing properties of
this compound are not dependent on the DNA sequence at the end as octamer 3 has A.T base pairs
while octamer 2 has G.C base pairs.
Preliminary conformational studies of the linkers containing cyclohexyl or benzyl substituents by
means of computer-based molecular modeling (Spartan’04 and Hyperchem’08; molecular mechanics
conformational search and geometry optimization) suggest that in the lower energy conformations, the
isoquinoline imidazo[1,2-a]azine core containing a cyclohexyl substituent stacks over the terminal
guanine nucleobase, at a distance of approximately 3 to 4 Å, whereas the isoquinoline imidazo[1,2-
a]azine core containing a benzyl substituent does not interact significantly with the terminal guanine
(see Supplementary Figure S1). These studies were carried out by keeping frozen the duplex of DNA
and by allowing the linker to move freely during the calculations. In order to explore the rotational
freedom of the cyclohexyl or benzyl-fluorescent isoquinoline imidazo[1,2-a]azine in more detail and to
determine the dynamic behavior of the conjugates, Molecular Dynamics simulations and NMR studies
10
on these modified duplexes would be necessary. A comprehensive study is currently under way in our
laboratory.
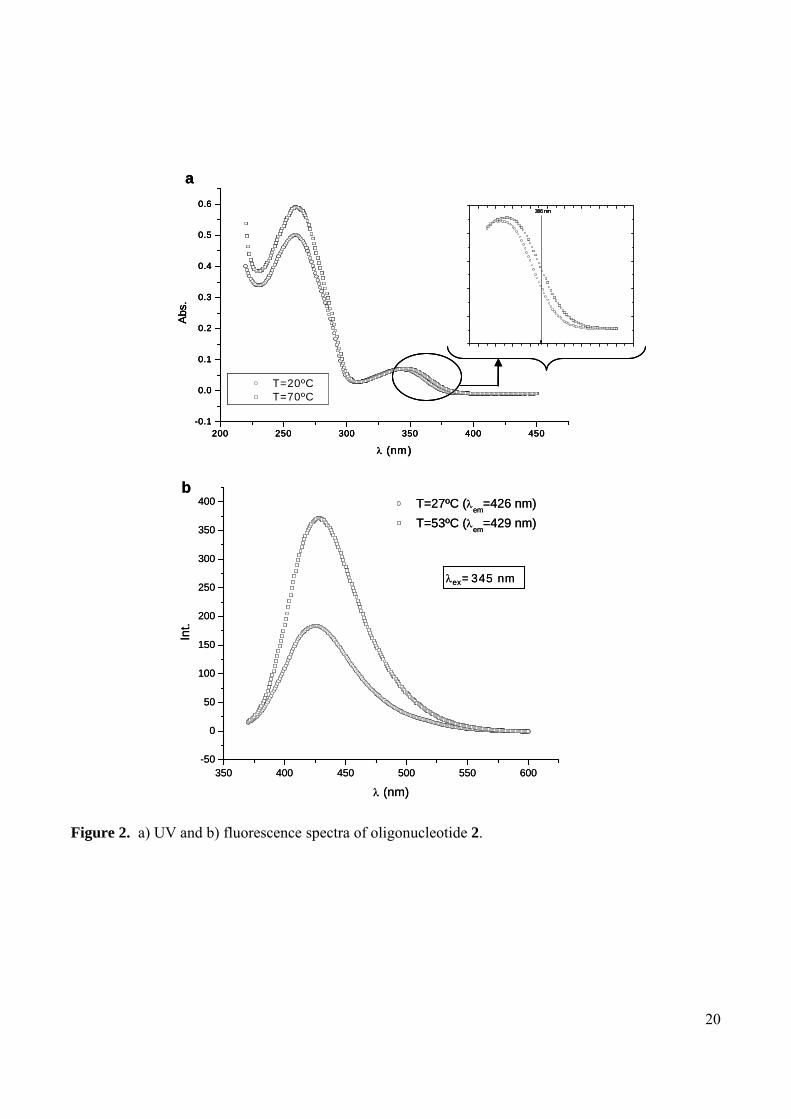
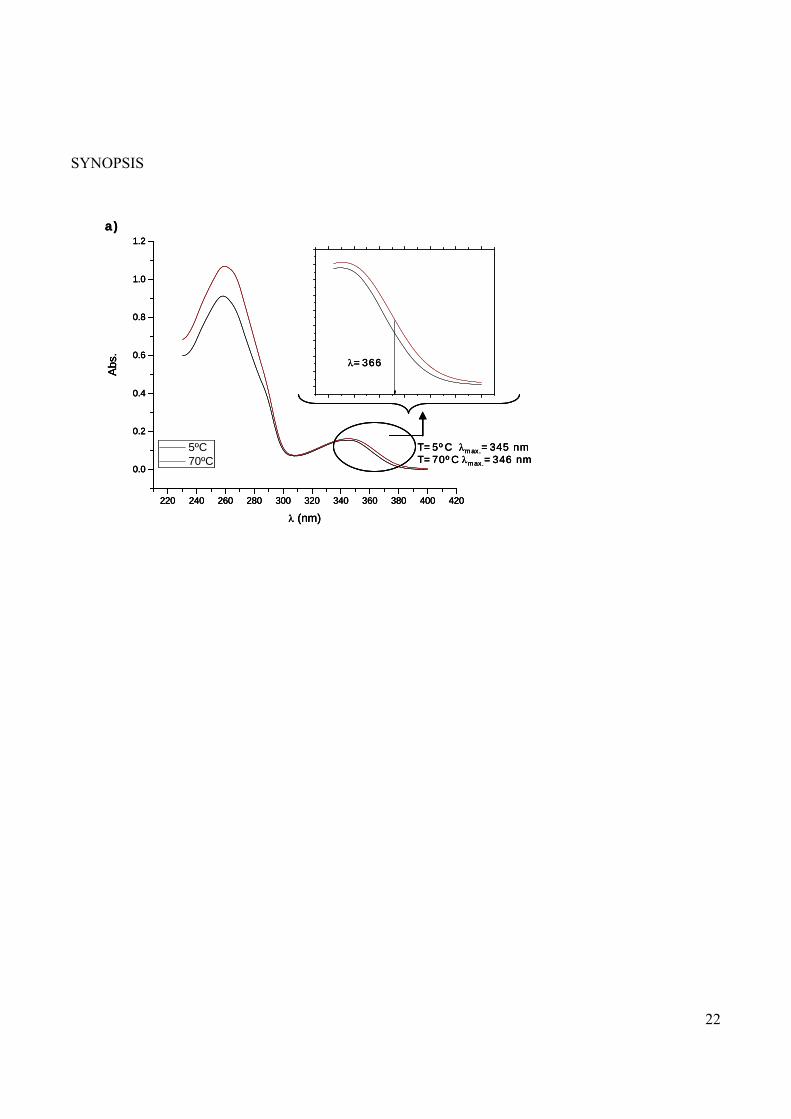
UV spectra of the modified oligonucleotides 2-4 at 20ºC (duplex) and 70ºC obtained in a solution
containing 1M NaCl and 100 mM sodium phosphate buffer of pH=7 at a concentration of 6.8 μM are
shown in Figure 2a. The maximum caused by the isoquinoline derivative shows a slight shift depending
on the temperature. The hyperchromism in the absorption spectra at 70ºC and the bathochromical shift
indicated that the molecule attached to the oligonucleotide is sensitive to the presence of a duplex or a
random coil form. The UV spectra indicated a change in hyperchromicity between 340 and 380 nm, the
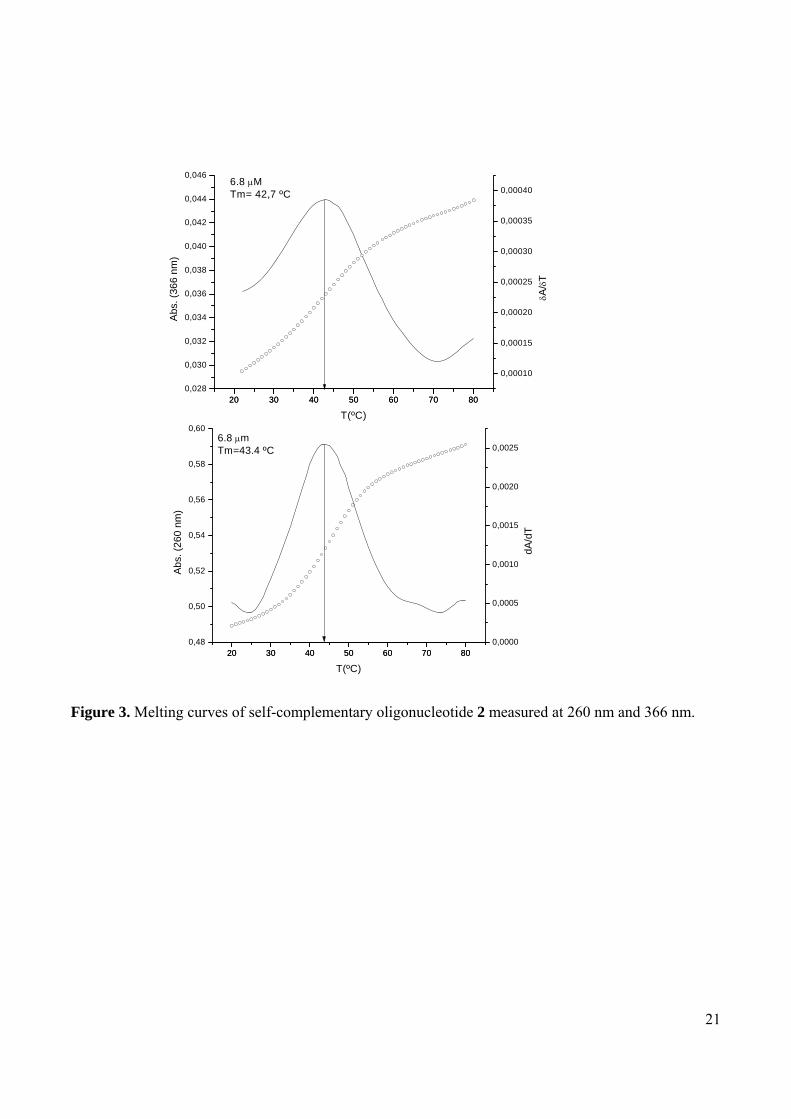
difference being maximum around 366 nm, so melting curves were recorded at 366 nm. Melting curves
were recorded simultaneously at 260 nm and 366 nm for comparison purposes (Figure 3). Melting
temperatures at these two wavelengths were similar, although at 366 nm the duplex showed a lower Tm
(see for example compound 2 Tm: 42.9ºC at 366 nm and 43.2ºC at 260 nm, Table 3). This indicates that
base pair dissociation observed at end of the oligonucleotide (measured at 366 nm where the fluorescent
tag is located) happens at a slightly lower temperature of the global melting of the duplex (measured at
260 nm). A similar behaviour has been described for fluorescent compounds attached in the middle a
DNA duplex (15, 16). The fluoresceine octamer 5 had a melting temperature of the same range than
octamers carrying the isoquinoline imidazo[1,2-a]azine core with the cyclohexyl group (1a) 2 and 3
(Table 3). Surprisingly, at 493 nm it had a slightly higher melting temperature (Tm 44.8 ºC at 493 nm,
Tm 44.2ºC at 260 nm).
Next we studied the effects of duplex denaturation in fluorescence. Fluorescent spectra of self-
complementary duplex 2 in 1M NaCl and 100 mM sodium phosphate buffer pH=7 at a concentration of
2.3 μM at different temperatures were recorded. Figure 2b shows the fluorescent spectra at 27 ºC and 53
ºC. Excitation was set at 345 nm Absorption maxima of oligonucleotides 2-4 at high and low
temperatures are summarized in Table 4. A strong increase in fluorescence was observed upon duplex
denaturation. These results and the slight increase in Tm indicates that the fluorescent label interacts
11
with the DNA duplex most probably as an end cap and the complex has a lower florescence. Upon
duplex denaturation, the fluorescent label changes the environment duplicating the fluorescence
emission. These effects were more intense in octamers carrying compound 1a (oligonucleotides 2 and 3)
than those carrying compound 1b (oligonucleotide 4). This effect may be a consequence of the
conformational preference of the isoquinoline imidazo[1,2-a]azine core containing a cyclohexyl
substituent to stack over the terminal nucleobase described above. The fluoresceine octamer 5 does not
increase the fluorescence upon heating, but, on the contrary, a clear decrease on the fluorescence
properties is observed (Table 4).
In summary, dipolar isoquinoline derivatives 1a-b readily prepared by MCR are efficient and
inexpensive reagents for introducing of fluorescent labels into synthetic oligonucleotides. Reagent 1a is
particularly useful as it produces fluorescence-labeled oligonucleotides that are sensitive to
hybridization and have duplex-stabilizing properties. Next we studied the capacity of fluorescence-
labeled oligonucleotides to monitor cellular uptake.
Cell uptake experiments.
A 25 mer oligonucleotide sequence with an amino group at the 3’-end (Table1) was also prepared.
This sequence corresponds to an antisense oligonucleotide known as GEM91 (17), which is
complementary to the initiation codon of gag gene of HIV-1 RNA. Reaction of 3’-amino GEM91 with
1a yielded the expected fluorescence-labeled oligonucleotide (6) in excellent yields (85% conversion
judged by HPLC, 71% isolated yield). The resulting product was used in the transfection assays without
further purification.
We first performed flow cytometry experiments with the model isoquinoline compound 1c in order to
assess the potential toxicity of the dye. HT-29 cells were incubated for 8 h with dipole 1c and analyzed
by flow cytometry. The percentage of living or dead cells remained almost constant at all concentrations
of 1c, and was very similar to the control value (see Supplementary Material). These results support the
notion that this compound has a low toxicity profile.
12
We then performed confocal microscopy experiments to analyze the distribution of the compound 1c
inside the cells. Compound 1c was detected in the cytoplasmatic region and formed well defined
aggregates (see Supplementary Material). The analogous methyl ester dipole 1d (8) was analyzed under
the same conditions and showed a similar distribution pattern (see Supplementary Material).
We then performed further confocal microscopy experiments to optimize the conditions in order to
evaluate the capacity of conjugate 6 to penetrate HeLa cells in the presence (or absence) of
LipofectamineTM 2000. When cells were incubated with conjugate 6 (20μM) for 4 h, no fluorescence
was detected, whereas the same product in the presence of LipofectamineTM 2000 penetrated the
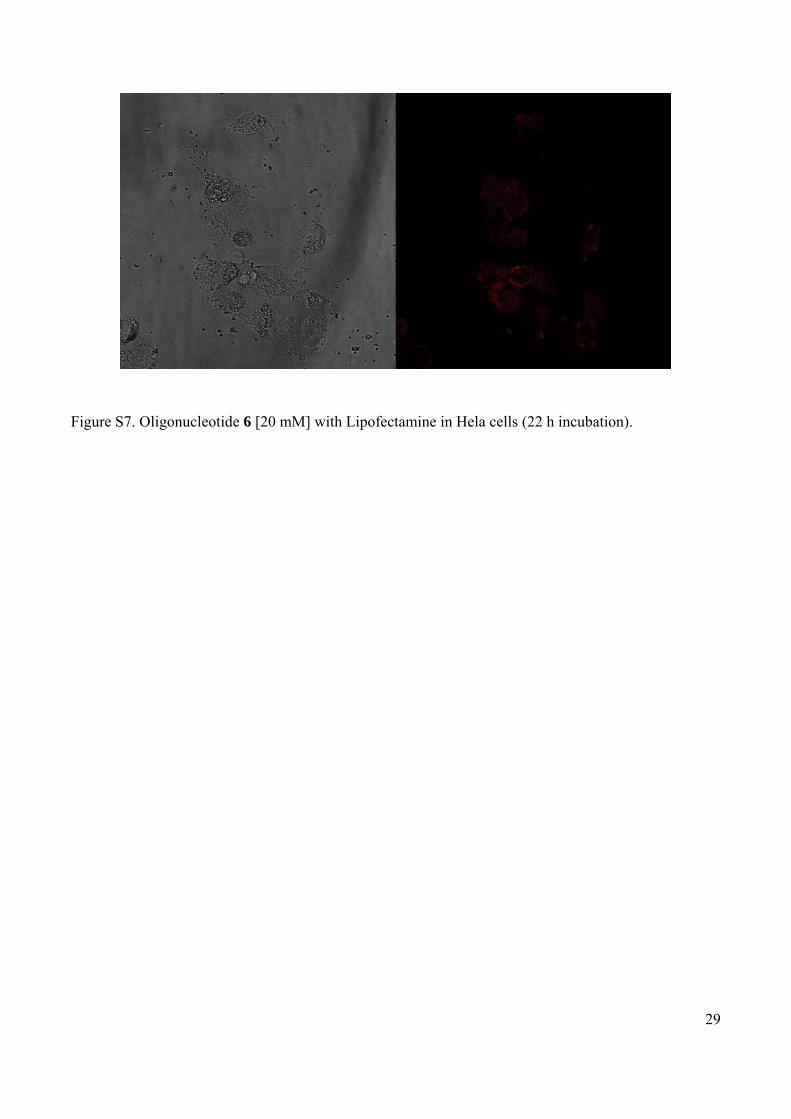
cytoplasmatic region. Longer incubation times (22 h) with conjugate 6 (20μM) in the presence of
LipofectamineTM 2000, induced strong cell toxicity and no living cells were found. This result may
reflect the toxicity of Lipofectamine under these conditions.
Conclusions
Here we describe the use of unexpensive reagents in the synthesis of oligonucleotides carrying highly
sensitive fluorophores. The acid fluoride derivative of the fluorophore required for the preparation of
the fluorescent-labeled oligonucleotides was synthesized in high yield in a one-pot reaction using an
efficient MCR which has been described previously (8). The acyl fluorides reacted efficiently in
aqueous buffers at pH 9 with amino-oligonucleotides to yield the desired conjugates. The resulting
oligonucleotides show intense fluorescent properties in presence of ions, have slightly improved
hybridization properties and are sensitive to denaturation. Flow cytometry and confocal microscopy
experiments showed a low toxicity profile and good cell membrane permeability respectively for dyes
1c and 1d. Oligonucleotide 6 had the capacity to penetrate cells in presence of LipofectamineTM 2000
transfection reagent.
13
Acknowledgments. This study was supported by the “Dirección General de Investigación Científica
y Técnica” (grant BFU2007-63287, CTQ2010-20541 and CTQ2009-07758), and the Generalitat de
Catalunya (2009/SGR/208). N. K. thanks the DGICYT for Ph. D. fellowship.
.
Supporting Information Available. Structure of the most energetically stable conformations of 1a and
1b conjugates by molecular mechanics (MM) conformational searches and geometry optimization. Flow
cytometry experiments with dipolar amide 1c. Confocal microscopy images from cell uptake
experiments. Mass spectrometry, HPLC analysis and melting curves of purified oligonucleotides. This
material is available free of charge via the internet at http://pubs.acs.org
References
(1) Mayer, A., and Neuenhofer, S. (1994) Luminescent labels – more than just an alternative to
radioisotopes? Angew. Chem. Int. Ed. 33, 1044-1072.
(2) Gait, M. J. (1991) DNA/RNA synthesis and labeling. Curr. Opin. Biotechnol. 2, 61-68.
(3) Wang, K., Tang, Z., Yang, C. J., Kim, Y., Fang, X., Li, W., Wu, Y., Medley, C.D., Cao, Z., Li, J.,
Colon, P., Lin H., and Tan, W. (2009) Molecular engineering of DNA: Molecular Beacons. Angew.
Chem. Int. Ed. 48, 856-870.
(4) Schubert, F., Cech, D., Reinhardt, R., and Wiesner, P. (1992) Fluorescent labelling of sequencing
primers for automated oligonucleotide synthesis. DNA Seq., 2, 273-279.
(5) Lilley, D. W., and Wilson, T. J. (2000) Fluorescence resonance energy transfer as a structural tool
for nucleic acids. Curr. Opin. Mol. Biol. 4, 507-517.
14
(6) Cuppoletti, A., Cho, Y., Park, J. S., Strässler, C., and Kool, E.T. (2005) Oligomeric fluorescent
labels for DNA. Bioconjugate Chem. 16, 528-534.
(7) Singh, S., and Singh R. K. (2007) Synthesis and fluorescence studies of some new fluorophores and
their effect on hybridization of oligodeoxyribonucleotides. J. Fluoresc. 17, 139-148.
(8) Arévalo, M. J., Kielland, N., Masdeu, C., Miguel, M., Isambert, N., and Lavilla, R. (2009)
Multicomponent Access to functionalized mesoionic structures based on TFAA activation of
isocyanides: Novel domino reactions. Eur. J. Org. Chem., 617-625.
(9) Zhu, J. and Bienaymé, H. (2005) in Multicomponent Reactions . Wiley-VCH, Weinheim.
(10) Carpino, L. A., Beyermann, M., Wenschuh, H., and Bienert, M. (1996) Peptide synthesis via amino
acid halides. Acc. Chem. Res., 29, 268-274.
(11) Nelson, P. S., Kent, M., and Muthini, S. (1992) Oligonucleotide labeling methods. 3. Direct
labeling of oligonucleotides employing a novel, non-nucleosidic, 2-aminobutyl-1,3-propanediol
backbone. Nucleic Acids Res., 20, 6253-6259.
(12) Mergny, J. L., and Lacroix, L. (2003) Analysis of thermal melting curves. Oligonucleotides, 13,
515-537.
(13) Connolly, B. A. (1987) The synthesis of oligonucleotides containing a primary amino group at the
5'-terminus. Nucleic Acids Res., 15, 3131-3139.
(14) Davies, M. J., Shah, A., and Bruce, I. J., (2000) Synthesis of fluorescently labelled oligonucleotides
and nucleic acids. Chem. Soc. Rev., 29, 97-107.
(15) Eritja, R., Kaplan, B.E., Mhaskar, D., Sowers, L.C., Petruska, J., and Goodman, M.F. (1986)
Synthesis and properties of defined DNA oligomers containing base mispairs involving 2-aminopurine.
Nucleic Acids Res., 14, 5869-5884.

15
(16) Ramzaeva, N., Rosemeyer, H., Leonard, P., Mühlegger, K., Bergmann, F., von der Eltz, H., and
Seela, F. (2000) Oligonucleotides functionalized by fluoresceine and rhodamine dyes: Michael addition
of methyl acrylate to 2’-deoxypseudouridine. Helv. Chim. Acta, 83, 1108-1126.
(17) Lisziewicz, J., Sun, D., Weichold, F. F., Thierry, A. R., Lusso, P., Tang, J, Gallo, R. C., and
Agrawal, S. (1994) Antisense oligodeoxynucleotide phosphorothioate complementary to gag mRNA
blocks replication of human immunodeficiency virus type 1 in human peripheral blood cells. Proc. Natl.
Acad. Sci. USA, 91, 7942-7946.
16
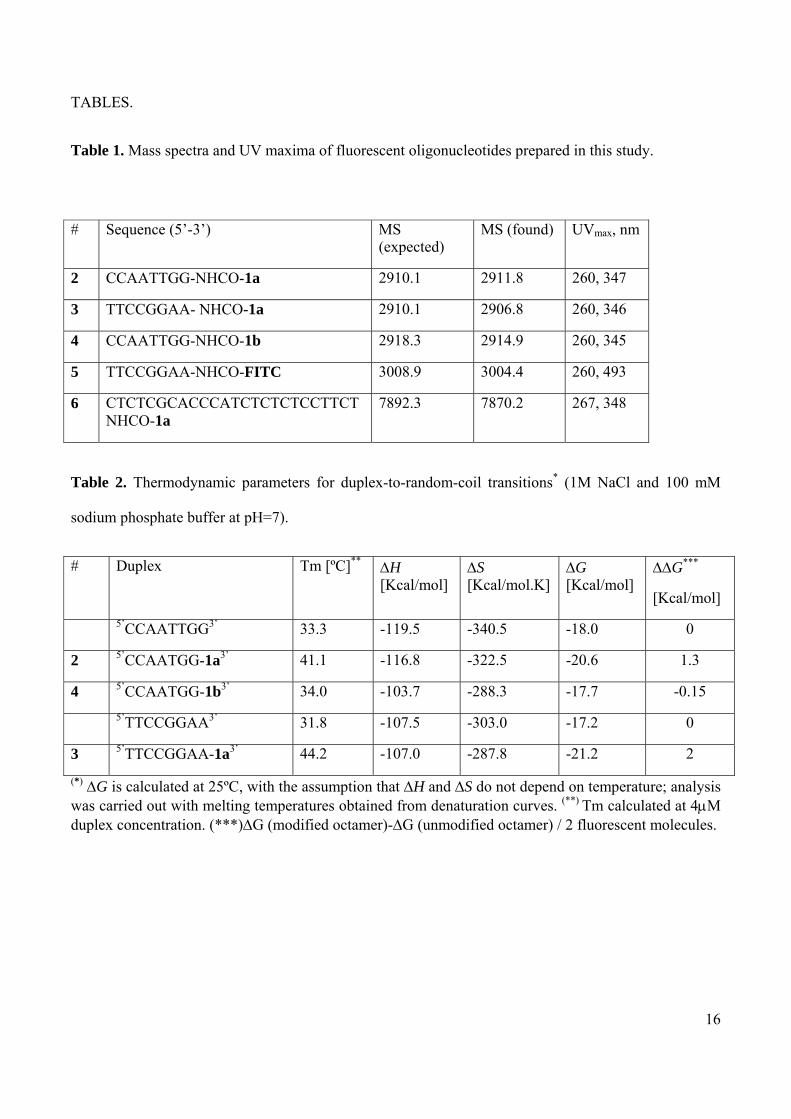
TABLES.
Table 1. Mass spectra and UV maxima of fluorescent oligonucleotides prepared in this study.
# Sequence (5’-3’) MS (expected)
MS (found) UVmax, nm
2 CCAATTGG-NHCO-1a 2910.1 2911.8 260, 347
3 TTCCGGAA- NHCO-1a 2910.1 2906.8 260, 346
4 CCAATTGG-NHCO-1b 2918.3 2914.9 260, 345
5 TTCCGGAA-NHCO-FITC 3008.9 3004.4 260, 493
6 CTCTCGCACCCATCTCTCTCCTTCT NHCO-1a
7892.3 7870.2 267, 348
Table 2. Thermodynamic parameters for duplex-to-random-coil transitions* (1M NaCl and 100 mM
sodium phosphate buffer at pH=7).
# Duplex Tm [ºC]** ΔH [Kcal/mol]
ΔS [Kcal/mol.K]
ΔG [Kcal/mol]
ΔΔG***
[Kcal/mol]
5’CCAATTGG3’ 33.3 -119.5 -340.5 -18.0 0
2 5’CCAATGG-1a3’ 41.1 -116.8 -322.5 -20.6 1.3
4 5’CCAATGG-1b3’ 34.0 -103.7 -288.3 -17.7 -0.15 5’TTCCGGAA3’ 31.8 -107.5 -303.0 -17.2 0
3 5’TTCCGGAA-1a3’ 44.2 -107.0 -287.8 -21.2 2
(*) ΔG is calculated at 25ºC, with the assumption that ΔH and ΔS do not depend on temperature; analysis was carried out with melting temperatures obtained from denaturation curves. (**) Tm calculated at 4μM duplex concentration. (***)ΔG (modified octamer)-ΔG (unmodified octamer) / 2 fluorescent molecules.
17
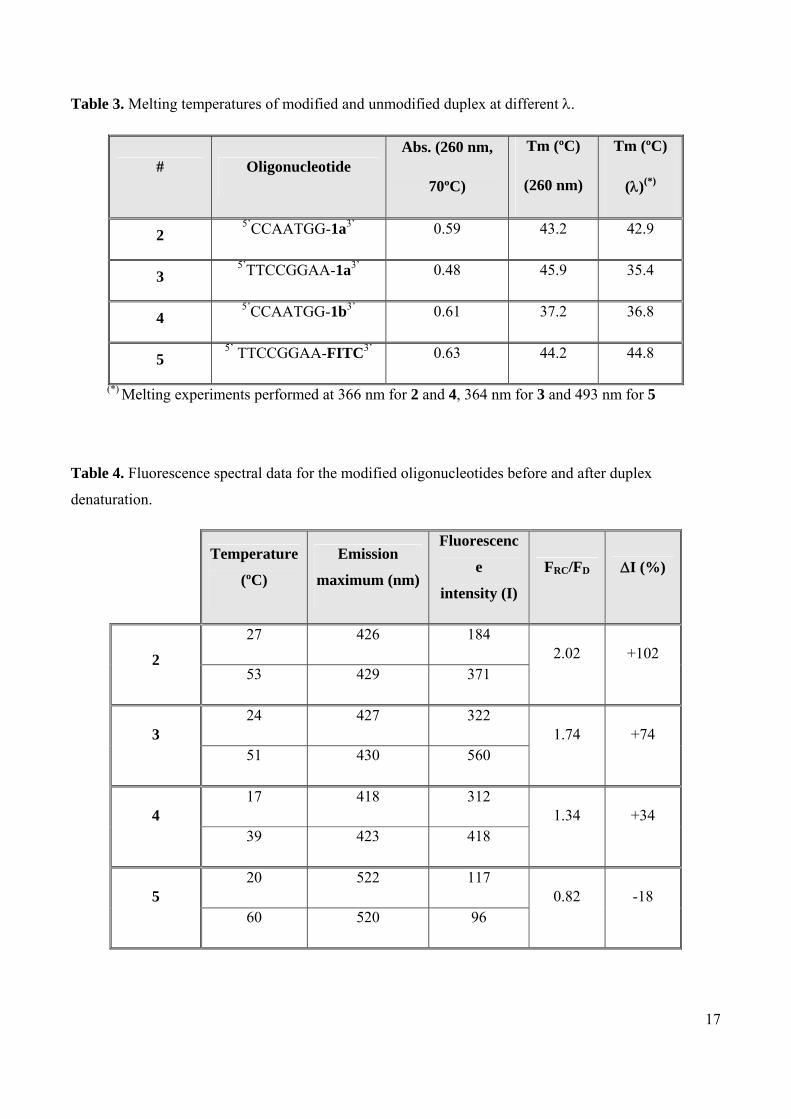
Table 3. Melting temperatures of modified and unmodified duplex at different λ.
# Oligonucleotide Abs. (260 nm,
70ºC)
Tm (ºC)
(260 nm)
Tm (ºC)
(λ)(*)
2 5’CCAATGG-1a3’ 0.59 43.2 42.9
3 5’TTCCGGAA-1a3’ 0.48 45.9 35.4
4 5’CCAATGG-1b3’ 0.61 37.2 36.8
5 5’ TTCCGGAA-FITC3’ 0.63 44.2 44.8
(*) Melting experiments performed at 366 nm for 2 and 4, 364 nm for 3 and 493 nm for 5
Table 4. Fluorescence spectral data for the modified oligonucleotides before and after duplex
denaturation.
Temperature
(ºC)
Emission
maximum (nm)
Fluorescenc
e
intensity (I)
FRC/FD ΔI (%)
27 426 184
2 53 429 371
2.02 +102
24 427 322 3
51 430 560 1.74 +74
17 418 312 4
39 423 418 1.34 +34
20 522 117 5
60 520 96 0.82 -18
18
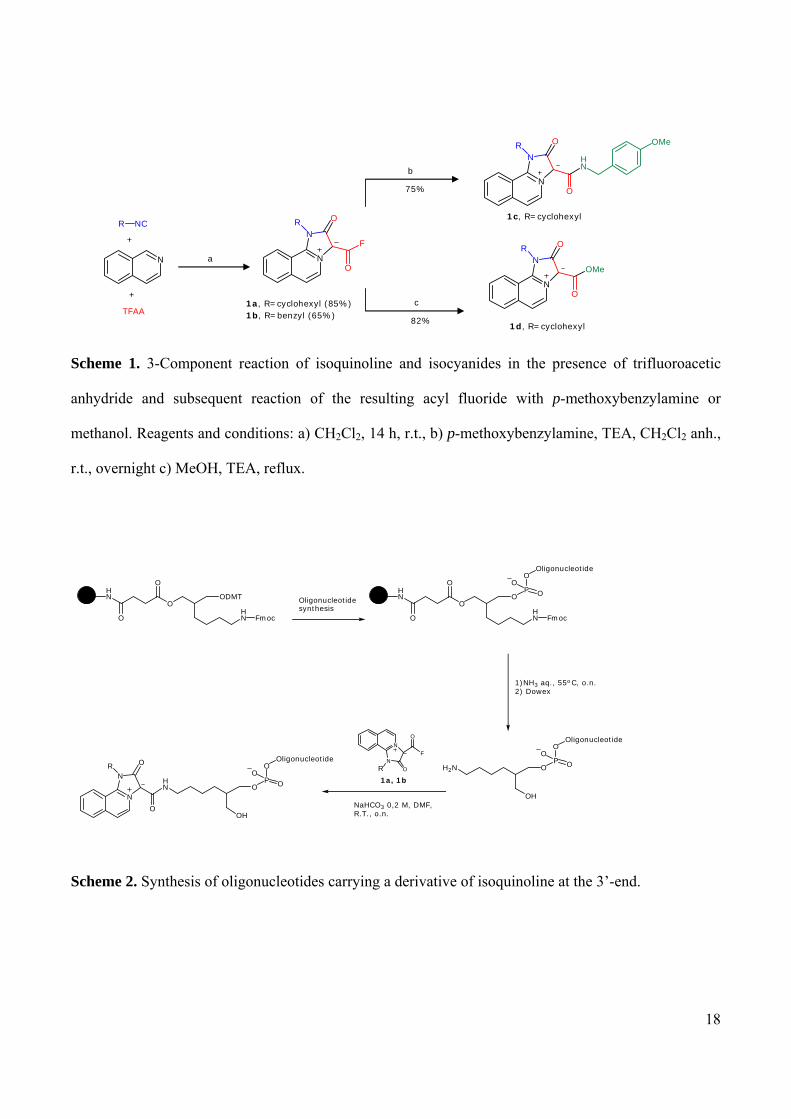
Scheme 1. 3-Component reaction of isoquinoline and isocyanides in the presence of trifluoroacetic
anhydride and subsequent reaction of the resulting acyl fluoride with p-methoxybenzylamine or
methanol. Reagents and conditions: a) CH2Cl2, 14 h, r.t., b) p-methoxybenzylamine, TEA, CH2Cl2 anh.,
r.t., overnight c) MeOH, TEA, reflux.
Scheme 2. Synthesis of oligonucleotides carrying a derivative of isoquinoline at the 3’-end.
OO
OHN
OHN
PO
O
OOligonucleotide
Fmoc
1)NH3 aq., 55ºC, o.n.2) Dowex
OP
OO
OOligonucleotide
OH
H2N
FN
NR
O
NaHCO3 0,2 M, DMF,R.T., o.n.
OP
OO
OOligonucleotide
OH
HN
N
NR
O
1a, 1b
ODMTO
OHN
OHN Fmoc
Oligonucleotidesynthesis
OO
N
R NC
TFAA
+
+
N
N
O
F
O
R
N
N
O
HN
O
R OMe
N
N
O
OMe
O
Ra
b
c 1a, R=cyclohexyl (85%)
1c, R=cyclohexyl
1d, R=cyclohexyl
75%
82% 1b, R=benzyl (65%)
19
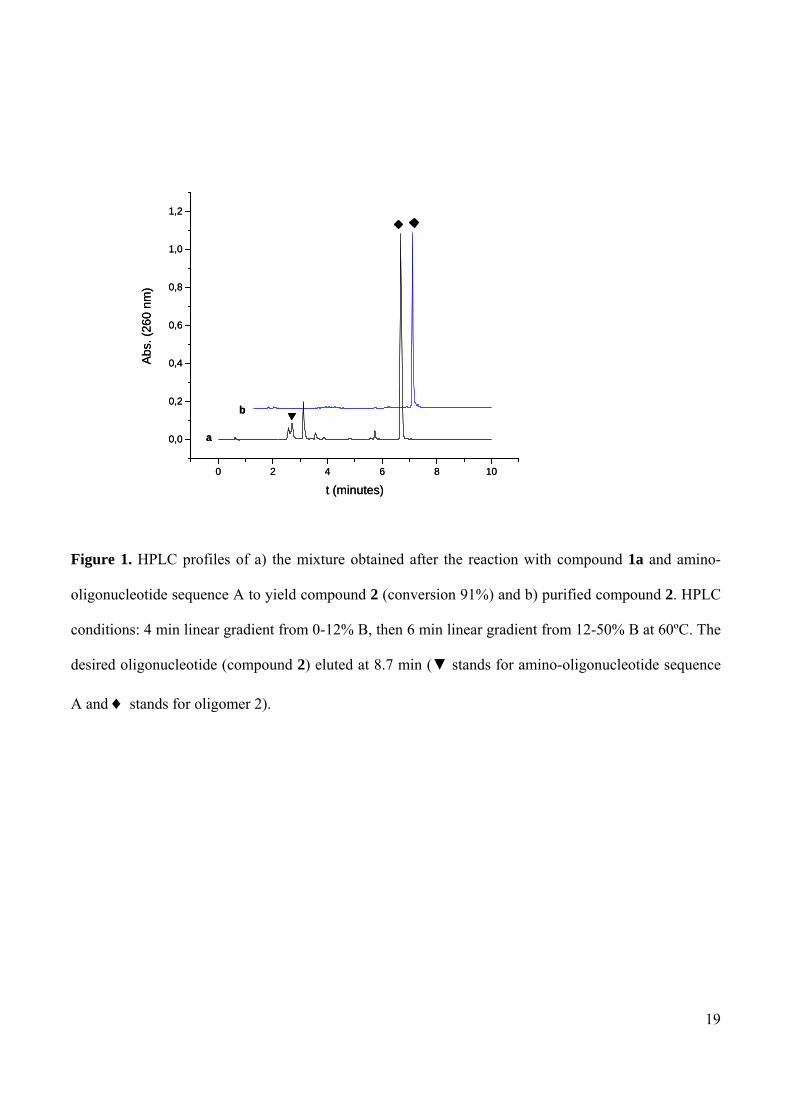
Figure 1. HPLC profiles of a) the mixture obtained after the reaction with compound 1a and amino-
oligonucleotide sequence A to yield compound 2 (conversion 91%) and b) purified compound 2. HPLC
conditions: 4 min linear gradient from 0-12% B, then 6 min linear gradient from 12-50% B at 60ºC. The
desired oligonucleotide (compound 2) eluted at 8.7 min (▼ stands for amino-oligonucleotide sequence
A and ♦ stands for oligomer 2).
0 2 4 6 8 10
0,0
0,2
0,4
0,6
0,8
1,0
1,2
Abs
. (26
0 nm
)
t (minutes)
a
b
0 2 4 6 8 10
0,0
0,2
0,4
0,6
0,8
1,0
1,2
Abs
. (26
0 nm
)
t (minutes)
a
b
20
200 250 300 350 400 450-0.1
0.0
0.1
0.2
0.3
0.4
0.5
0.6
T=20ºC T=70ºC
Abs
.
λ (nm)
366 nm
a
200 250 300 350 400 450-0.1
0.0
0.1
0.2
0.3
0.4
0.5
0.6
T=20ºC T=70ºC
Abs
.
λ (nm)
366 nm
200 250 300 350 400 450-0.1
0.0
0.1
0.2
0.3
0.4
0.5
0.6
T=20ºC T=70ºC
Abs
.
λ (nm)
366 nm
a
Figure 2. a) UV and b) fluorescence spectra of oligonucleotide 2.
350 400 450 500 550 600-50
0
50
100
150
200
250
300
350
400 T=27ºC (λem=426 nm) T=53ºC (λem=429 nm)
Int.
λ (nm)
λex=345 nm
b
350 400 450 500 550 600-50
0
50
100
150
200
250
300
350
400 T=27ºC (λem=426 nm) T=53ºC (λem=429 nm)
Int.
λ (nm)
λex=345 nm
b
21
Figure 3. Melting curves of self-complementary oligonucleotide 2 measured at 260 nm and 366 nm.
20 30 40 50 60 70 800,48
0,50
0,52
0,54
0,56
0,58
0,60
20 30 40 50 60 70 800,0000
0,0005
0,0010
0,0015
0,0020
0,0025
Abs.
(260
nm
)
T(ºC)
6.8 μmTm=43.4 ºC
dA/
dT
20 30 40 50 60 70 800,028
0,030
0,032
0,034
0,036
0,038
0,040
0,042
0,044
0,046
20 30 40 50 60 70 80
0,00010
0,00015
0,00020
0,00025
0,00030
0,00035
0,00040
δA
/δT
Abs
. (36
6 nm
)
T(ºC)
6.8 μM Tm= 42,7 ºC
22
SYNOPSIS
220 240 260 280 300 320 340 360 380 400 420
0.0
0.2
0.4
0.6
0.8
1.0
1.2
Abs
.
λ (nm)
5ºC 70ºC
T=5ºC λmax.=345 nmT=70ºC λmax.=346 nm
λ=366
a)
220 240 260 280 300 320 340 360 380 400 420
0.0
0.2
0.4
0.6
0.8
1.0
1.2
Abs
.
λ (nm)
5ºC 70ºC
T=5ºC λmax.=345 nmT=70ºC λmax.=346 nm
λ=366
220 240 260 280 300 320 340 360 380 400 420
0.0
0.2
0.4
0.6
0.8
1.0
1.2
Abs
.
λ (nm)
5ºC 70ºC
T=5ºC λmax.=345 nmT=70ºC λmax.=346 nm
λ=366
a)
23
Supporting data
Synthesis and properties of oligonucleotides carrying isoquinoline
imidazo[1,2-a]azine fluorescent units.
Sónia Pérez-Rentero‡, Nicola Kielland§, Montserrat Terrazas‡, Rodolfo Lavilla,*,§, † and Ramon Eritja*,‡
‡Institute for Research in Biomedicine, IQAC-CSIC, CIBER-BBN Networking Centre on
Bioenginnering, Biomaterials and Nanomedicine. Baldiri Reixac 10, 08028 Barcelona, Spain.
§Institute for Research in Biomedicine, Barcelona Science Park, Baldiri Reixac 10, 08028 Barcelona,
Spain.
†Laboratory of Organic Chemistry, Faculty of Pharmacy. University of Barcelona. Avda. Diagonal sn,
08028 Barcelona, Spain.
SUPPORTING INFORMATION:
Page 2. Figure S1. Structure of the most energetically stable conformations of 1a and 1b conjugates by molecular mechanics (MM) conformational searches and geometry optimization
Page 3: Figure S2. Flow cytometry experimental data.
Page 4-5: Confocal microscopy images. Figures S3-S7.

24
Figure S1. Most energetically stable conformations of 1a and 1b conjugates (panels A and B, respectively). The terminal guanine nucleobase and the triazine core are shown as thick lines. Distances between guanine and the isoquinoline imidazo[1,2-a]azine core are indicated. The figures were prepared with PyMOL (http://pymol.sourceforge.net/). Molecular mechanics (MM) conformational searches and geometry optimization of the most energetically stable conformers were carried out with the Amber force field by using the softwares Spartan’04 from Wavefunction and HyperChem’08 and by using water as a solvent. The duplex of DNA was kept frozen and the linker was allowed to move freely during the calculations.

25
Flow cytometry experimental data:
Figure S2: Evaluation of the cytotoxicity profile of 1c by flow cytometry on HT-29 cells. Incubation time 8h.
5
Cells %
0 40 1c (μMol)
Live cells % Dead cells %
0
80
20 10 2
26
Confocal microscopy images:
Figure S3: 1c [20 μM] in HT-29 cells (2h incubation)
27
Figure S4.: 1c [20 μM] in Hela cells (4h incubation)
Figure S5: 1d [20 μM] in HT-29 cells (2h incubation)
28
Figure S6.: Oligonucleotide 6 [20 μM] with Lipofectamine in Hela cells (4h incubation)
29
Figure S7. Oligonucleotide 6 [20 mM] with Lipofectamine in Hela cells (22 h incubation).


![Synthesis of oligonucleotides on a soluble support · Scheme 1: Alternative coupling methods used in the synthesis of oligonucleotides. silyloxymetyl (TOM) [21] groups being most](https://img.pdfslide.net/doc/110x75/5f553ef599cb88244b6037c7/synthesis-of-oligonucleotides-on-a-soluble-support-scheme-1-alternative-coupling.jpg)