Embed Size (px)
Citation preview

https://biointerfaceresearch.com/ 377
Article
Volume 12, Issue 1, 2022, 377 - 390
https://doi.org/10.33263/BRIAC121.377390
Synthesis and Spectroscopic Analysis of Au-Ag Alloy
Nanoparticles with Different Composition of Au and Ag
Latif-ur-Rahman 1,*, Anwar-ul-Haq Ali Shah 1, Afzal Shah 2, Syed Muhammad Salman 3, Abdul Khaliq
Jan 4
1 Institute of Chemical Sciences, University of Peshawar, Peshawar 25120, Khyber Pakhtunkhwa, Pakistan;
[email protected] (L.R.), [email protected] (A.H.A.S.); 2 Department of Chemistry, Quaid-i-Azam University, Islamabad 45320, Pakistan; [email protected] (A.S.); 3 Department of Chemistry, Islamia College Peshawar, Peshawar-25120, Pakistan; [email protected] (S.M.S.); 4 Department of Chemistry, Shaheed Benazir Bhutto University, Upper Dir 18050, Pakistan; [email protected]
(A.K.J.);
* Correspondence: [email protected];
Scopus Author ID 39462006200
Received: 1.03.2021; Revised: 2.04.2021; Accepted: 5.04.2021; Published: 20.04.2021
Abstract: Au-Ag bimetallic alloy nanoparticles, having an average size from 35 to 25 nm, were
successfully synthesized (using chemical reduction process) from AuCl3 and AgNO3. Ethylene glycol
was used as a solvent and polyaniline (PANI) as a capping agent. Au-Ag alloy nanoparticles, with
different proportions among Au and Ag, were synthesized and characterized by various spectroscopic
techniques. The steady-state fluorescence spectroscopy, X-ray diffraction (XRD), and Scanning
Electron Microscopy (SEM) data revealed the formation of alloy nanoparticles of various compositions,
which agrees with the absorption data obtained by UV-Visible spectroscopy. Ag was found to be acting
as a quencher for emission radiations, as evidenced by fluorescence spectroscopy. XRD data pointed
out the crystalline structure of alloy nanoparticles. Variation in Au and Ag's atomic composition in Au-
Ag was confirmed by energy dispersive spectroscopy (EDS). Scanning Electron Microscopy (SEM)
was applied to study the morphology of the bimetallic alloy nanoparticles. Interestingly, the size of
nanoparticles decreases with a decrease in Au's composition in Au-Ag alloy nanoparticles. Maximum
values of molar absorptivity were recorded by Au-Ag alloy nanoparticles with ratio 1:3, which indicates
that at ratio 1:3 of Au and Ag in Au-Ag alloy nanoparticles, the size of the nanoparticles is minimum
with maximum surface area.
Keywords: Au-Ag alloy; bimetallic nanoparticles; polyaniline; crystalline nanoparticles; quencher.
© 2021 by the authors. This article is an open-access article distributed under the terms and conditions of the Creative
Commons Attribution (CC BY) license (https://creativecommons.org/licenses/by/4.0/).
1. Introduction
Nanoparticles have a vast range of applications in many spheres of life. These
extraordinary properties were owing to their size, shape, and structure. The geometrical,
statistical, and quantum impacts change with the reducing size of the nanoparticles. Reducing
the size from macro to micro-level, no change is viable; however, nano range is effective [1].
Nanoparticles, either in monometallic or in bimetallic form, show valuable properties, which
help us in different research fields. They have accompanied their precedence in agriculture by
making the plants' quality better. Due to the underlying reasons, their importance is increasing
day by day [2].
https://doi.org/10.33263/BRIAC121.377390
https://biointerfaceresearch.com/ 378
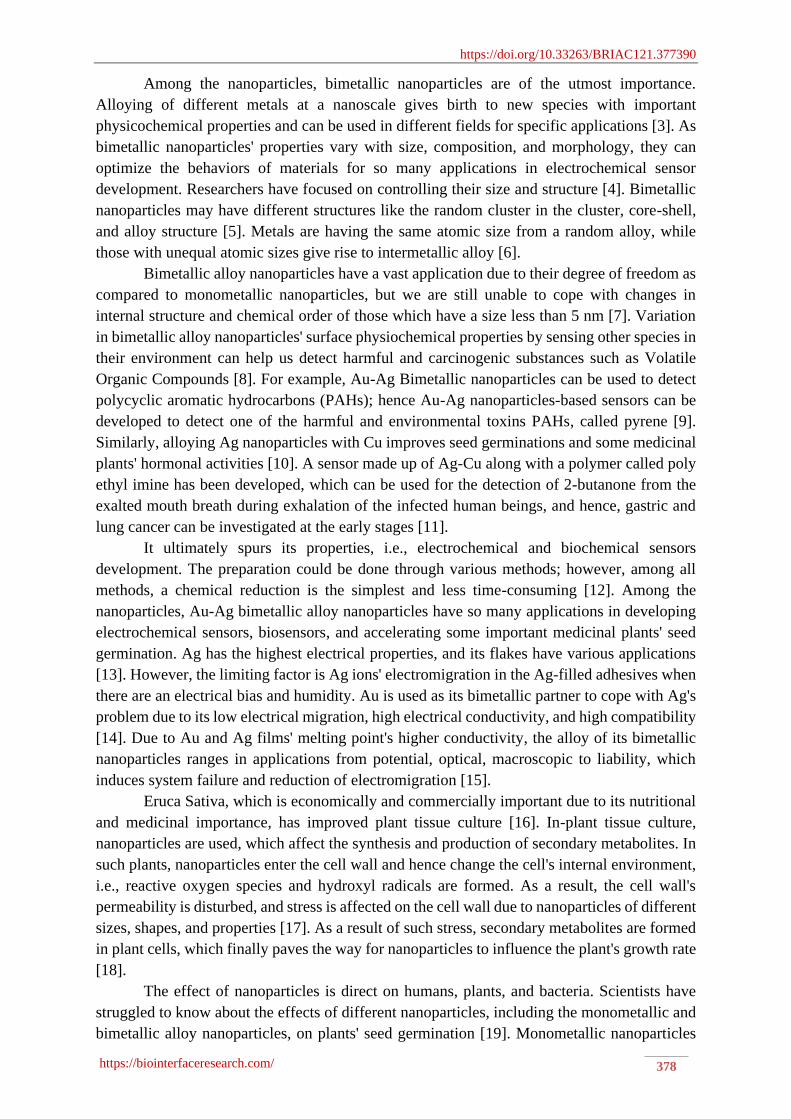
Among the nanoparticles, bimetallic nanoparticles are of the utmost importance.
Alloying of different metals at a nanoscale gives birth to new species with important
physicochemical properties and can be used in different fields for specific applications [3]. As
bimetallic nanoparticles' properties vary with size, composition, and morphology, they can
optimize the behaviors of materials for so many applications in electrochemical sensor
development. Researchers have focused on controlling their size and structure [4]. Bimetallic
nanoparticles may have different structures like the random cluster in the cluster, core-shell,
and alloy structure [5]. Metals are having the same atomic size from a random alloy, while
those with unequal atomic sizes give rise to intermetallic alloy [6].
Bimetallic alloy nanoparticles have a vast application due to their degree of freedom as
compared to monometallic nanoparticles, but we are still unable to cope with changes in
internal structure and chemical order of those which have a size less than 5 nm [7]. Variation
in bimetallic alloy nanoparticles' surface physiochemical properties by sensing other species in
their environment can help us detect harmful and carcinogenic substances such as Volatile
Organic Compounds [8]. For example, Au-Ag Bimetallic nanoparticles can be used to detect
polycyclic aromatic hydrocarbons (PAHs); hence Au-Ag nanoparticles-based sensors can be
developed to detect one of the harmful and environmental toxins PAHs, called pyrene [9].
Similarly, alloying Ag nanoparticles with Cu improves seed germinations and some medicinal
plants' hormonal activities [10]. A sensor made up of Ag-Cu along with a polymer called poly
ethyl imine has been developed, which can be used for the detection of 2-butanone from the
exalted mouth breath during exhalation of the infected human beings, and hence, gastric and
lung cancer can be investigated at the early stages [11].
It ultimately spurs its properties, i.e., electrochemical and biochemical sensors
development. The preparation could be done through various methods; however, among all
methods, a chemical reduction is the simplest and less time-consuming [12]. Among the
nanoparticles, Au-Ag bimetallic alloy nanoparticles have so many applications in developing
electrochemical sensors, biosensors, and accelerating some important medicinal plants' seed
germination. Ag has the highest electrical properties, and its flakes have various applications
[13]. However, the limiting factor is Ag ions' electromigration in the Ag-filled adhesives when
there are an electrical bias and humidity. Au is used as its bimetallic partner to cope with Ag's
problem due to its low electrical migration, high electrical conductivity, and high compatibility
[14]. Due to Au and Ag films' melting point's higher conductivity, the alloy of its bimetallic
nanoparticles ranges in applications from potential, optical, macroscopic to liability, which
induces system failure and reduction of electromigration [15].
Eruca Sativa, which is economically and commercially important due to its nutritional
and medicinal importance, has improved plant tissue culture [16]. In-plant tissue culture,
nanoparticles are used, which affect the synthesis and production of secondary metabolites. In
such plants, nanoparticles enter the cell wall and hence change the cell's internal environment,
i.e., reactive oxygen species and hydroxyl radicals are formed. As a result, the cell wall's
permeability is disturbed, and stress is affected on the cell wall due to nanoparticles of different
sizes, shapes, and properties [17]. As a result of such stress, secondary metabolites are formed
in plant cells, which finally paves the way for nanoparticles to influence the plant's growth rate
[18].
The effect of nanoparticles is direct on humans, plants, and bacteria. Scientists have
struggled to know about the effects of different nanoparticles, including the monometallic and
bimetallic alloy nanoparticles, on plants' seed germination [19]. Monometallic nanoparticles
https://doi.org/10.33263/BRIAC121.377390
https://biointerfaceresearch.com/ 379
influence seed germination due to their toxicity. This toxic effect of monometallic
nanoparticles is due to the production of reactive oxygen species and hydroxyl radicals inside
the cell when nanoparticles get into it through the cell wall [20]. In one report, it has been
described that effect of monometallic nanoparticles on seed germination can be positive or
negative because when seeds of spinach were soaked in nanoparticles suspension, it promoted
its growth at first, but later on its growth was abated, so the effects on seed germination can be
found out by knowing its toxicity which can be determined by studying the size, shape, and
properties of nanoparticles [20].
Different electrochemical sensors are developed based on bimetallic alloys, which help
us determine the most important and carcinogenic substances in very trace amounts. By
incorporating Ag to Au and making their bimetallic alloys, the sensing activity of the primer is
improved up to a high extent [21].
2. Materials and Methods
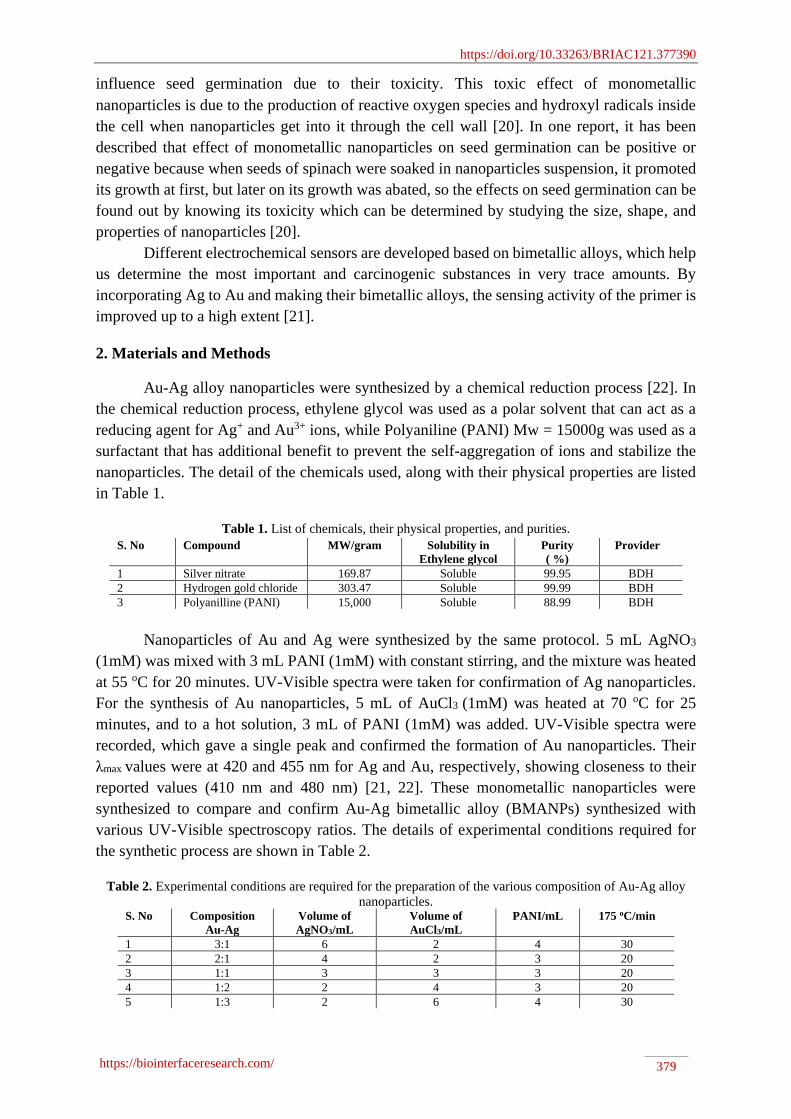
Au-Ag alloy nanoparticles were synthesized by a chemical reduction process [22]. In
the chemical reduction process, ethylene glycol was used as a polar solvent that can act as a
reducing agent for Ag+ and Au3+ ions, while Polyaniline (PANI) Mw = 15000g was used as a
surfactant that has additional benefit to prevent the self-aggregation of ions and stabilize the
nanoparticles. The detail of the chemicals used, along with their physical properties are listed
in Table 1.
Table 1. List of chemicals, their physical properties, and purities.
S. No Compound MW/gram Solubility in
Ethylene glycol
Purity
( %)
Provider
1 Silver nitrate 169.87 Soluble 99.95 BDH
2 Hydrogen gold chloride 303.47 Soluble 99.99 BDH
3 Polyanilline (PANI) 15,000 Soluble 88.99 BDH
Nanoparticles of Au and Ag were synthesized by the same protocol. 5 mL AgNO3
(1mM) was mixed with 3 mL PANI (1mM) with constant stirring, and the mixture was heated
at 55 oC for 20 minutes. UV-Visible spectra were taken for confirmation of Ag nanoparticles.
For the synthesis of Au nanoparticles, 5 mL of AuCl3 (1mM) was heated at 70 oC for 25
minutes, and to a hot solution, 3 mL of PANI (1mM) was added. UV-Visible spectra were
recorded, which gave a single peak and confirmed the formation of Au nanoparticles. Their
λmax values were at 420 and 455 nm for Ag and Au, respectively, showing closeness to their
reported values (410 nm and 480 nm) [21, 22]. These monometallic nanoparticles were
synthesized to compare and confirm Au-Ag bimetallic alloy (BMANPs) synthesized with
various UV-Visible spectroscopy ratios. The details of experimental conditions required for
the synthetic process are shown in Table 2.
Table 2. Experimental conditions are required for the preparation of the various composition of Au-Ag alloy
nanoparticles. S. No Composition
Au-Ag
Volume of
AgNO3/mL
Volume of
AuCl3/mL
PANI/mL 175 oC/min
1 3:1 6 2 4 30
2 2:1 4 2 3 20
3 1:1 3 3 3 20
4 1:2 2 4 3 20
5 1:3 2 6 4 30

https://doi.org/10.33263/BRIAC121.377390
https://biointerfaceresearch.com/ 380
Similarly, Au-Ag alloy nanoparticles were synthesized by adding 5 mL of AuCl3
solution (1mM) to the mixture of 5 mL AgNO3 solution (1mM) and 5 mL of PANI (1mM).
The colloidal mixture was heated at a constant temperature of 175 oC for half an hour. The
reaction started when the color of the solution turned black. The color was then changed to
golden brown within a half-hour, showing the formation of bimetallic nanoparticles. The UV-
Visible spectrum of the colloidal mixture was taken, which has shown a single peak at 450,
confirming Au-Ag bimetallic nanoparticles' formation composition of 1:1 [21-23].
Various samples of Au-Ag BMANPs were synthesized using the same procedure. For
such purpose, the amount of AgNO3 was changing, while the amount of AuCl3 was kept the
same. The amount of PANI added was half of the total volume of each sample. All the samples,
when dried were washed much time with acetone for complete removal of PANI. They were
further dried by keeping in the drying oven at 50oC for 72 hours before analysis by XRD, EDS,
and SEM [24].
2.1. Instruments.
For determination of λmax, molar attenuation coefficient (ε), and confirmation of the
formation of Au-Ag alloy nanoparticles, a UV-Visible Spectrophotometer (Shimadzu model
1601) was used. The emission spectra were recorded using a steady-state fluorescence
spectrometer (Perkin Elmer LS 55). XRD was applied for crystallite size calculation of
nanoparticles, and EDS was used for confirming the atomic composition of Au-Ag alloy
nanoparticles. For the examination of the surface morphology of the nanoparticles, SEM was
used [25].
3. Results and Discussion
Different compositions of bimetallic Au-Ag alloy nanoparticles were synthesized.
Monometallic nanoparticles of Au and Ag nanoparticles were also synthesized for reference.
3.1. UV-Visible spectroscopy.
3.1.1. effect of composition on λmax.
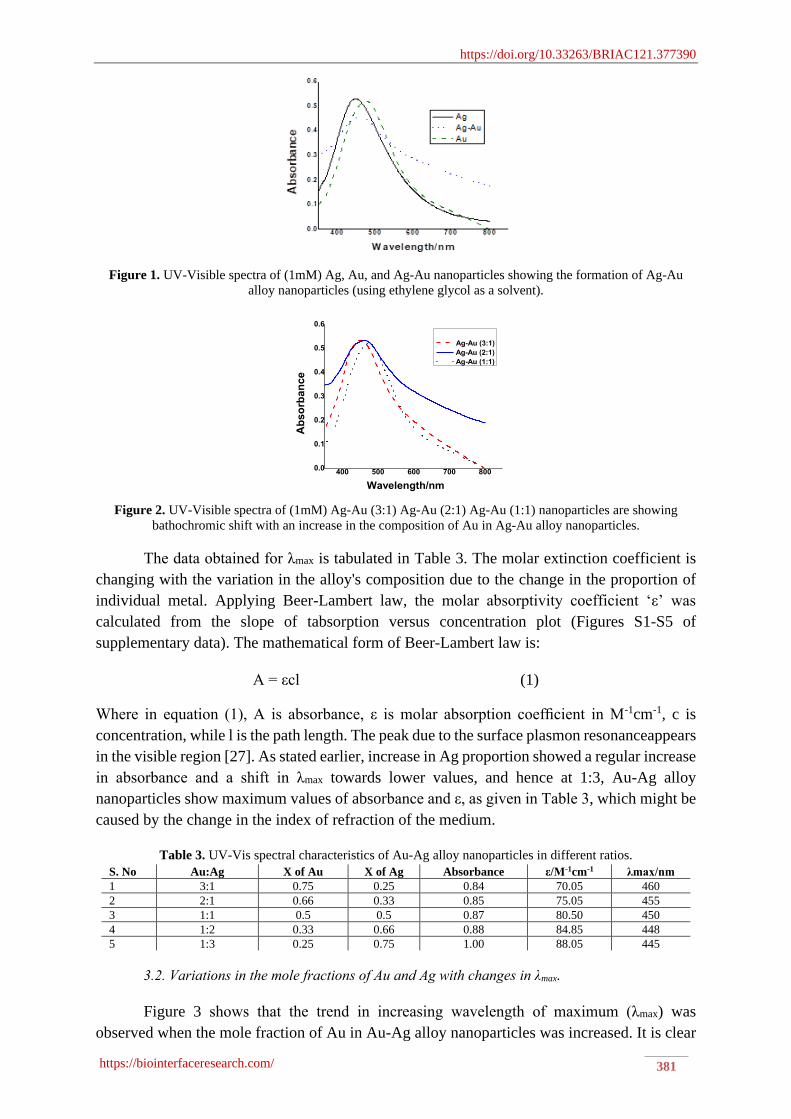
Figure 1 shows UV-Visible spectra of monometallic nanoparticles of Ag, Au, and
bimetallic Au-Ag alloy nanoparticles. Clearly, pure Ag and Au have shown different λmax
values when compared to their alloys. Ag and Au nanoparticles have shown a plasmon band
maximum at 440 nm and 495 nm, respectively, while the plasmon band maximum for Au-Ag
alloy is appearing at 450 nm accompanied by a raised base-line, indicating a possibility of
aggregation and a resulting increase in the sizes of the synthesized alloy nanoparticles.
Figure 2 shows UV-Visible spectra of Au-Ag alloy nanoparticles having various Au
and Ag compositionsnd confirmed the alloy nanoparticles' formations. Au-Ag (1:1) gives λmax.
at 450 nm, Au-Ag (1:2) gives λmax. at 455 nm, and Au-Ag (1:3) gives λmax. at 460 nm. Alloy
formation is further verified by the range of maximum wavelengths, that is, at the mid of pure
Ag and Au nanoparticles. With the increase in Ag's composition in Au-Ag alloy nanoparticles,
λmax is shifting towards a lower wavelength which is useful to find the ratio at which the
maximum absorptions can be achieved [26].
https://doi.org/10.33263/BRIAC121.377390
https://biointerfaceresearch.com/ 381
Figure 1. UV-Visible spectra of (1mM) Ag, Au, and Ag-Au nanoparticles showing the formation of Ag-Au
alloy nanoparticles (using ethylene glycol as a solvent).
400 500 600 700 8000.0
0.1
0.2
0.3
0.4
0.5
0.6
Ab
so
rban
ce
Wavelength/nm
Ag-Au (3:1)
Ag-Au (2:1)
Ag-Au (1:1)
Figure 2. UV-Visible spectra of (1mM) Ag-Au (3:1) Ag-Au (2:1) Ag-Au (1:1) nanoparticles are showing
bathochromic shift with an increase in the composition of Au in Ag-Au alloy nanoparticles.
The data obtained for λmax is tabulated in Table 3. The molar extinction coefficient is
changing with the variation in the alloy's composition due to the change in the proportion of
individual metal. Applying Beer-Lambert law, the molar absorptivity coefficient ‘ε’ was
calculated from the slope of tabsorption versus concentration plot (Figures S1-S5 of
supplementary data). The mathematical form of Beer-Lambert law is:
A = εcl (1)
Where in equation (1), A is absorbance, ε is molar absorption coefficient in M-1cm-1, c is
concentration, while l is the path length. The peak due to the surface plasmon resonanceappears
in the visible region [27]. As stated earlier, increase in Ag proportion showed a regular increase
in absorbance and a shift in λmax towards lower values, and hence at 1:3, Au-Ag alloy
nanoparticles show maximum values of absorbance and ε, as given in Table 3, which might be
caused by the change in the index of refraction of the medium.
Table 3. UV-Vis spectral characteristics of Au-Ag alloy nanoparticles in different ratios.
S. No Au:Ag X of Au X of Ag Absorbance ε/M-1cm-1 λmax/nm
1 3:1 0.75 0.25 0.84 70.05 460
2 2:1 0.66 0.33 0.85 75.05 455
3 1:1 0.5 0.5 0.87 80.50 450
4 1:2 0.33 0.66 0.88 84.85 448
5 1:3 0.25 0.75 1.00 88.05 445
3.2. Variations in the mole fractions of Au and Ag with changes in λmax.
Figure 3 shows that the trend in increasing wavelength of maximum (λmax) was
observed when the mole fraction of Au in Au-Ag alloy nanoparticles was increased. It is clear

https://doi.org/10.33263/BRIAC121.377390
https://biointerfaceresearch.com/ 382
that λmax appeared at 440 nm for pure Ag and λmax appeared at 495 nm, represent the pure form
of Au, while the λmax at the middle points showed Ag-Au of various composition [28].
3.3. Fluorescence spectroscopic studies.
In this article, Au-Ag alloy nanoparticles' light emission behavior has been studied
compared with Au and Ag nanoparticles. Au-Ag alloy nanoparticles give a single dominant
emission peak at 575 nm, as depicted in Figure 3. The fluorescence in Ag and Au nanoparticles
have origin from the excitation of electrons from lower d orbital to sp-band of the excited
electron and then coming back to the lowest band orbital by emission energy in the form of
emission spectra [29]. The excitation wavelengths for Ag, Au, and Au-Ag nanoparticles have
been decided based on the Surface Plasmon Resonance absorption peaks. The Au-Ag alloy
nanoparticles were excited at 450 nm, while the Ag and Au nanoparticles have been excited at
440 nm and 495 nm, respectively, as shown in Table 3. It has been reported that variation in
the alloy composition by changing either Au or Ag causes a shift the alloy's λmax emission,
which can be attributed to the change in the size of the alloy nanoparticles [30]. Our results
confirm that the formation of Au, Ag, and Au-Ag alloy nanoparticles by comparing the
absorption and emission peaks' position and intensities. By increasing Ag's relative
concentration, the quenching action of Ag appeared, and fluorescence intensity was reduced
and caused a shift to shorter wavelengths, as shown in Figure 3.
Figure 3. Emission spectra Ag-Au alloy in which mole fraction of Ag is 0.5 (a), 0.75(b), and 0.9 (c)
nanoparticles with varying Ag mole fraction.
The quenching action of Ag in the overall composition can be quantified using the
following set of equations:
log 𝐼0
𝐼𝑄 =
[𝑄]𝑁
[𝑥] (2)
In the equation above, I0 is the fluorescence intensity of the alloy nanoparticles
suspension initially, and IQ indicates the intensity of alloy nanoparticles while increasing the
proportion of Ag in the Au-Ag alloy nanoparticles and then making the suspension. Here [Q]
shows the relative proportion of Ag as quencher concentration, and [X] is alloy concentration
in millimolar (mM). N is the number of atoms in alloy nanoparticles.
The binding constant kb and the number of sites (n) provided for binding by one
nanoparticle to another can be calculated using the relation
log𝐼0−𝐼𝑄
𝐼𝑄 = log 𝑘𝑏 + n log [Q] (3)

https://doi.org/10.33263/BRIAC121.377390
https://biointerfaceresearch.com/ 383
It was noted that the number of binding sites n and binding constant kb steadily decrease
with the decrease in the relative proportion of Au in the overall composition of Au-Ag alloy,
as shown in Table 3. Free energy of binding (∆Gb) can be calculated using Eq. (4) below
∆𝐺𝑏 = RT ln𝑘𝑏 (4)
Where R is the universal gas constant having the value 8.3144 JK-1mol-1, T is the temperature
expressed in the Kelvin scale, and kb is the binding constant. Increasing the Ag ratio in the
composition of Au-Ag alloy shows a hypochromic effect. The similarity in the fluorescence
profiles of Au-Ag 3:1 to Au-Ag1:1 and Au-Ag 1:1 to Au-Ag 1:3 in terms of their intensities
and wavelength of emission indicates the similarities in their crystal structures.
Table 4. Various parameters were obtained from fluorescence spectroscopy of Au-Ag alloy nanoparticles with
different ratios.
S. No Sample
Au-Ag
I0 λmax/nm Binding site (n) Binding constant
(kb) ∆Gb KJ/mol
3 1:1 300 590 0.41 15.50 -15.55
4 1:2 300 580 0.32 09.85 -18.50
5 1:3 300 575 0.22 05.05 -20.25
Table 4 shows that fluorescence intensity decrease with an increase in the composition
of Ag. The highest intensity is observed for Au-Ag 1:1 due to the lower composition of Ag in
it, while the lowest intensity is observed for Au-Ag 1:3 that has a maximum composition of
Ag. There is a regular decline in λmax with an increase in the composition of Ag. The binding
sites (n), binding constant (kb), and free energy of binding (∆Gb) increase regularly with an
increase in the composition of Ag. The regular increasing trend in ∆Gb (with negative value),
indicates that the process gets more spontaneity as Ag's composition is raised.
3.4. X-Ray diffraction analysis (XRD).
X-ray diffraction analysis was carried out to confirm the phase purity of synthesized
samples, and the resulting diffraction pattern is shown in Figure 4. It is clearly shown by Fig.
4 that all samples exhibit mostly peaks comparable to that of the standard patterns, namely 00-
001-1167 and 00-004-0784. However, the sample with an Au-Ag ratio of 1:3, 2:1, and 1:3 show
less intense impurity peaks at a 2θ value of 35, representing the possibility for the formation of
Ag2O during the synthesis. The X-ray diffraction occurs mainly at lattice planes of (101), (210),
and (220) with the first peak of maximum intensity at 35, 42, and 68 positions, respectively
[31]. The crystallite sizes were calculated from the full width at half maximum of the most
intense peak (101) using the following Sharer’s formula;
𝐷 =𝑘𝜆
𝛽𝑐𝑜𝑠𝜃 (5)
Where k is the shape factor with a value of 0.9, λ is the wavelength of CuKα radiations (1.54A),
β is the full width at half the maximum of the diffraction and obtained using Gaussian fit the
corresponding peak with maximum intensity.
The calculated crystallite sizes are given in Table 5, showing that the smallest crystallite
size was found for a sample with an Ag to Au ratio of 1:3. The lattice parameters ‘a’ for the
samples are calculated using the equation,
𝑎 = √𝑑2(ℎ2 + 𝑘2 + 𝑙2 (6)

https://doi.org/10.33263/BRIAC121.377390
https://biointerfaceresearch.com/ 384
Where, d is the interspacing of planes in the crystal structure, responsible for the diffraction
lines in the XRD pattern, while h, k, and l are the Miller indices. The values for the lattice
parameters and the cell volumes for all the synthesized samples are given in Table 5.
Table 5. Sizes of Ag-Au (in various ratios with Au-Ag 1:3 having the smallest size), Ag and Au nanoparticles. S No. Bimetallic
Au-Ag
Size nm Monometallic Size nm
1 3:1 35 Au 45
2 2:1 33
3 1:1 30
4 1:2 27 Ag 38
5 1:3 25
The variations in the lattice parameters pointing that the mechanism for the formation
of Au-Ag alloys is somehow complex apart from some impurity peaks observed for Ag2O.
However, the variation in the lattice parameter and corresponding cell volume can be attributed
to the difference in the sizes for the atomic radii of Ag (1.75 A) and Au (1.79 A). In the first
sample with an Ag to Au ratio of 1:1, the value of the lattice constant is comparable to that of
a standard pattern (4.08 A). Further increase in the Ag content changes the lattice parameter
with maximum value for Au-Ag ratio of 1:3 [32]. Beyond this ratio, the lattice constant and the
cell volume decrease as the Ag content with comparably lower atomic radius increases in the
samples, confirming the size-size-dependent differences in the lattice constant and cell volume.
Figure 4. XRD patterns of of Ag-Au 3:1, Ag-Au 2:1, Ag-Au 1:1, Ag-Au 1:2, Ag, and Ag-Au 1:3.
3.5. EDS studies.
Energy dispersive spectroscopy (EDS) shows the various compositions of Ag and Au
in Ag-Au alloy NPs (Figures 5). Ag-Au at the ratio of 3 : 1 shows clearer composition (Figure
5-A). EDS shows the elemental composition of Ag and Au in Ag-Au alloy nanoparticles with
various compositions.

https://doi.org/10.33263/BRIAC121.377390
https://biointerfaceresearch.com/ 385
Figure 5. EDS for Ag-Au (3:1), Ag-Au (1:1) and Ag-Au (1:3).
3.6. SEM studies.
The morphological structures of Ag NPs, Au NPs, and Ag-Au alloy NPs, prepared with
various ratios, are shown in Figures 6 and 7. The as-prepared Au-Ag 1:3 alloy NPs have an
average diameter of 25 ±2 nm (Figure 5E), which is smaller than that of 38±2 nm and 45±2 nm
for the Ag NPs and Au NPs, respectively (Figure 6 and Figure 7).
Figure 6. SEM Images of Au-Ag 3:1 (A), Au-Ag 2:1 (B), Au-Ag 1:1 (C), Au-Ag 1:2 (D), Au-Ag 1:3 (E), Au-
Ag 1:4 (F) Showing the smallest and uniform size of Ag-Au bimetallic alloy nanoparticles at a ratio of 1:3.
Figure 7. SEM Images of Ag (A) and Au (B) NPs.

https://doi.org/10.33263/BRIAC121.377390
https://biointerfaceresearch.com/ 386
In general, the SEM micrographs a uniform surface morphology that supports the data
obtained from XRD. The lattice spacing obtained mismatch was observed since the Au and Ag
have very similar lattice parameters. SEM micrographs show the agglomeration tendency of
alloy nanoparticles among themselves. The reason could be the high surface energy of these
particles due to their nano-size regime. This supports the data obtained from UV-Visible
spectroscopy for the alloy nanoparticles in solution (Figures. 1 and 2), where we observed an
elevation in the base-line with the formation of alloy nanoparticles [33]. The average size of
Au-Ag bimetallic alloy nanoparticles ranges from 35nm to 25nm, as shown in Table 5.
Interestingly size of bimetallic alloy nanoparticles decreases as thecomposition of Ag in Au-
Ag nanoparticles increases.
4. Conclusions
BMANPs of Au and Ag of various compositions were successfully synthesized by the
chemical reduction method. The as-prepared alloys' spectroscopic datawere compared with
Pure Ag and Au NPs, which were prepared as reference materials. The synthesis of NPs was
monitored by UV/visible spectroscopy and was characterized by Fluorescence, EDS, XRD,
and SEM techniques. The effect of composition on λmax and ε was also examined, and their
trends were studied. Fluorescence spectroscopic studies reveal that Ag is acting as a quencher
for the emission radiation in Au-Ag alloy NPs. Fluorescence tabulated data shows that the
binding site (n) and binding constant (kb) decreases with increasing Ag's composition in Au-
Ag alloy NPs. Fluorescence also reflects the spontaneity of the process (∆G). XRD was used
for the calculation of average diameters of nanoparticles and study of crystal lattice
composition as well as for surface morphology. SEM also showed the morphology and size of
alloy NPs. SEM images of the synthesized NPs reveal that Ag-Au 1:3 has the smallest size 25
nm, and shows a high value of ε due to their closed compatibility. Hence it is concluded that
NPs of Au-Ag with a ratio of 1:3 is expected to optimize the sensing power of nanoparticle-
based electrochemical sensors for monitoring of the worst environmental toxins, PAHs, and
carcinogenic volatile organic compounds (VOCs).
Funding
This research received no external funding.
Acknowledgments
This work was jointly supported by the Institute of the Chemical Sciences University of
Peshawar, Chemistry Department of Quaid-i-Azam University, Islamabad, and Higher
Education Commission of Pakistan.
Conflicts of Interest
The authors declare no conflict of interest.
References
1. Rahman, L.-u.; Shah, A.; Han, C.; Khaliq, A. Monitoring of Anthracene Using Nanoscale Au−Cu Bimetallic
Alloy Nanoparticles Synthesized with Various Compositions. ACS Omega 2020, 5, 22494–22501,
https://doi.org/10.1021/acsomega.0c03104.

https://doi.org/10.33263/BRIAC121.377390
https://biointerfaceresearch.com/ 387
2. Roy, D.; Pal, T. Nanostage Alloying of Metals in Liquid Phase. Advances in Chemical Engineering and
Science 2021, 11, 105-140, https://doi.org/10.4236/aces.2021.111008.
3. Kehoe, D.K.; McCarthy, S.A.; Romeral, L.; Lyons, M.G.; Gun'ko, Y.K. Pt and RhPt dendritic nanowires
and their potential application as anodic catalysts for fuel cells. RSC Advances 2019, 9, 31169-31176,
https://doi.org/10.1039/C9RA04801D.
4. Shah, A.; Rahman, L.-u.; Qureshi, R.; Rehman, Z.-u. Synthesis, characterization and applications of
bimetallic (Au-Ag, Au-Pt, Au-Ru) alloy nanoparticles. Reviews on advanced materials science 2012, 30,
133-149.
5. Zaka, M.; Abbasi, B.H.; Rahman, L.U.; Shah, A.; Zia, M. Synthesis and characterisation of metal
nanoparticles and their effects on seed germination and seedling growth in commercially important Eruca
sativa. IET nanobiotechnology 2016, 10, 134-140, https://doi.org/10.1049/iet-nbt.2015.0039.
6. Li, X.; Gui, L.; Zou, H. Bracelet-Like Ni0.4Cu0.6O Microstructure Composed of Well-Aligned
Nanoplatelets as a Superior Catalyst to the Hydrolysis of Ammonia Borane. Front Chem 2019, 7.
7. Rahman, L.-U.; Shah, A.; Qureshi, R.; Khan, S.; Asiri, A.M.; Shah, A.-u.-H.; Ishaq, M.; Khan, M.; Lunsford,
S.; Zia, M. Spectroscopic Analysis of Au-Cu Alloy Nanoparticles of Various Compositions Synthesized by
a Chemical Reduction Method. Advances in Materials Science and Engineering 2015, 2015,
https://doi.org/10.1155/2015/638629.
8. Rahman, L.-U.; Shah, A.; Lunsford, S.K.; Han, C.; Nadagouda, M.N.; Sahle-Demessie, E.; Qureshi, R.;
Khan, M.S.; Kraatz, H.-B.; Dionysiou, D.D. Monitoring of 2-butanone using a Ag–Cu bimetallic alloy
nanoscale electrochemical sensor. RSC Advances 2015, 5, 44427-44434,
https://doi.org/10.1039/C5RA03633J.
9. Latif ur, R.; Shah, A.; Khan, S.B.; Asiri, A.M.; Hussain, H.; Han, C.; Qureshi, R.; Ashiq, M.N.; Zia, M.A.;
Ishaq, M.; Kraatz, H.-B. Synthesis, characterization, and application of Au–Ag alloy nanoparticles for the
sensing of an environmental toxin, pyrene. Journal of Applied Electrochemistry 2015, 45, 463-472,
https://doi.org/10.1007/s10800-015-0807-2.
10. Salman Khan, M.; Zaka, M.; Haider Abbasi, B.; Rahman, L.; Shah, A. Seed germination and biochemical
profile of Silybum marianum exposed to monometallic and bimetallic alloy nanoparticles. IET
nanobiotechnology 2016, 10, 359-366, https://doi.org/10.1049/iet-nbt.2015.0050.
11. Olszewski, T.K.; Adler, P.; Grison, C. Bio-based Catalysts from Biomass Issued after Decontamination of
Effluents Rich in Copper—An Innovative Approach towards Greener Copper-based Catalysis. Catalysts
2019, 9, https://doi.org/10.3390/catal9030214.
12. Hong, Y.; Peng, J.; Sun, Z.; Yu, Z.; Wang, A.; Wang, Y.; Liu, Y.-Y.; Xu, F.; Sun, L.-X. Transition Metal
Oxodiperoxo Complex Modified Metal-Organic Frameworks as Catalysts for the Selective Oxidation of
Cyclohexane. Materials 2020, 13, 820-829, https://doi.org/10.3390/ma13040829.
13. Khan, M.; Al-Hamoud, K.; Liaqat, Z.; Shaik, M.R.; Adil, S.F.; Kuniyil, M.; Alkhathlan, H.Z.; Al-Warthan,
A.; Siddiqui, M.R.H.; Mondeshki, M.; Tremel, W.; Khan, M.; Tahir, M.N. Synthesis of Au, Ag, and Au-Ag
Bimetallic Nanoparticles Using Pulicaria undulata Extract and Their Catalytic Activity for the reduction of
4-Nitrophenol. Nanomaterials (Basel) 2020, 10, 1879-1885, https://doi.org/10.3390/nano10091885.
14. Sankar, M.; He, Q.; Engel, R.V.; Sainna, M.A.; Logsdail, A.J.; Roldan, A.; Willock, D.J.; Agarwal, N.;
Kiely, C.J.; Hutchings, G.J. Role of the Support in Gold-Containing Nanoparticles as Heterogeneous
Catalysts. Chemical Reviews 2020, 120, 3890-3938, https://doi.org/10.1021/acs.chemrev.9b00662.
15. Majeed, S.A.; Sekhosana, K.E.; Tuhl, A. Progress on phthalocyanine-conjugated Ag and Au nanoparticles:
Synthesis, characterization, and photo-physicochemical properties. Arabian Journal of Chemistry 2020, 13,
8848-8887, https://doi.org/10.1016/j.arabjc.2020.10.014.
16. Munir, M.; Ahmad, M.; Saeed, M.; Waseem, A.; Rehan, M.; Nizami, A.-S.; Zafar, M.; Arshad, M.; Sultana,
S. Sustainable production of bioenergy from novel non-edible seed oil (Prunus cerasoides) using bimetallic
impregnated montmorillonite clay catalyst. Renewable and Sustainable Energy Reviews 2019, 109, 321-332,
https://doi.org/10.1016/j.rser.2019.04.029.
17. Sun, R.; Wang, J.; Peng, Y.; Wang, H.; Chen, Q. Mitigation of arsenic accumulation in arugula (Eruca sativa
Mill.) using Fe/Al/Zn impregnated biochar composites. Environmental Science and Pollution Research
2021, 28, 4136-4146, https://doi.org/10.1007/s11356-020-10476-x.
18. Hussain, M.; Raja, N.; Mashwani, Z.-u.-R.; Iqbal, M.; Ejaz, M.; Yasmeen, F.; Sohail. In Vitro Germination
and Biochemical Profiling of Citrus reticulata in Response to Green Synthesized Zinc and Copper
Nanoparticles. IET nanobiotechnology 2017, 11, 790-796, https://doi.org/10.1049/iet-nbt.2016.0256.
19. Shiraishi, Y.; Sakamoto, H.; Sugano, Y.; Ichikawa, S.; Hirai, T. Pt–Cu Bimetallic Alloy Nanoparticles
Supported on Anatase TiO2: Highly Active Catalysts for Aerobic Oxidation Driven by Visible Light. ACS
Nano 2013, 7, 9287-9297, https://doi.org/10.1021/nn403954p.
20. Vasile, O.R.; Andronescu, E.; Truşcă, R.; Vasile, E.; Holban, A.M.; Chifiriuc, M.C.; Iordache, F.; Maniu,
H.; Bleotu, C.; Neacşu, I.A.; Vasile, B. Structure-grain size-synthesis route of silver nanoparticles: a
correlation with the cytotoxic effect. Rom J Morphol Embryol, , 2019, 60, 617-628, ISSN: 1220-0522,
WOS:000493322700029.

https://doi.org/10.33263/BRIAC121.377390
https://biointerfaceresearch.com/ 388
21. Mailu, S.N.; Waryo, T.T.; Ndangili, P.M.; Ngece, F.R.; Baleg, A.A.; Baker, P.G.; Iwuoha, E.I.
Determination of anthracene on Ag-Au alloy nanoparticles/overoxidized-polypyrrole composite modified
glassy carbon electrodes. Sensors (Basel) 2010, 10, 9449-9465.
22. Malathi, S.; Ezhilarasu, T.; Abiraman, T.; Balasubramanian, S. One pot green synthesis of Ag, Au and Au–
Ag alloy nanoparticles using isonicotinic acid hydrazide and starch. Carbohydrate Polymers 2014, 111, 734-
743, https://doi.org/10.1016/j.carbpol.2014.04.105.
23. Waag, F. Laser Synthesis of Metallic and Oxidic Transition Metal, Multi-Element Nanoparticles for
Catalytic Applications. Doctoral dissertation, Universität Duisburg-Essen 2019, 10, 119-130.
24. Tunc, I.; Guvenc, H.O.; Sezen, H.; Suzer, S.; Correa-Duarte, M.A.; Liz-Marzán, L.M. Optical response of
Ag-Au bimetallic nanoparticles to electron storage in aqueous medium. J Nanosci Nanotechnol 2008, 8,
3003-3007, https://doi.org/10.1166/jnn.2008.157.
25. Chowdhury, S.; Bhethanabotla, V.R.; Sen, R. Effect of Ag−Cu Alloy Nanoparticle Composition on
Luminescence Enhancement/Quenching. The Journal of Physical Chemistry C 2009, 113, 13016-13022,
https://doi.org/10.1021/jp900294z.
26. Luo, Q.; Lai, J.; Qiu, P.; Wang, X. An ultrasensitive fluorescent sensor for organophosphorus pesticides
detection based on RB-Ag/Au bimetallic nanoparticles. Sensors and Actuators B: Chemical 2018, 263, 517-
523, https://doi.org/10.1016/j.snb.2018.02.101.
27. Robinson, I.K. Direct Determination of the Au(110) Reconstructed Surface by X-Ray Diffraction. Physical
Review Letters 1983, 50, 1145-1148, https://doi.org/10.1103/PhysRevLett.50.1145.
28. Buss, C.E.; Anderson, C.E.; Pomije, M.K.; Lutz, C.M.; Britton, D.; Mann, K.R. Structural Investigations of
Vapochromic Behavior. X-ray Single-Crystal and Powder Diffraction Studies of [Pt(CN-iso-
C3H7)4][M(CN)4] for M = Pt or Pd. Journal of the American Chemical Society 1998, 120, 7783-7790,
https://doi.org/10.1021/ja981218c.
29. Srnová-Šloufová, I.; Lednický, F.; Gemperle, A.; Gemperlová, J. Core−Shell (Ag)Au Bimetallic
Nanoparticles: Analysis of Transmission Electron Microscopy Images. Langmuir 2000, 16, 9928-9935,
https://doi.org/10.1021/la0009588.
30. Priya, A.; Saminathan, S.; Balasundaram, J. Green synthesis of NiO nanoparticles using Leucas Aspera and
its antibacterial activity. Letters in Applied NanoBioScience, 2020, 9, 1033-1036,
https://doi.org/10.33263/LIANBS92.10331036.
31. Smith, A.T.; LaChance, A.M.; Zeng, S.; Liu, B.; Sun, L. Synthesis, properties, and applications of graphene
oxide/reduced graphene oxide and their nanocomposites. Nano Materials Science 2019, 1, 31-47,
https://doi.org/10.1016/j.nanoms.2019.02.004.
32. Khosravi-Darani, K.; Gomes, A.; Cruz, M. R.; Zohreh, A.; Negin, M. Biosynthesis of metal nanoparticles
by probiotic bacteria. Letters in Applied NanoBioScience 2019, 8, 619-626,
https://doi.org/10.33263/LIANBS83.619626.
33. Xu, Z.; Zhang, H.; Liu, S.; Zhang, B.; Zhong, H.; Su, D.S. Facile synthesis of supported Pt–Cu nanoparticles
with surface enriched Pt as highly active cathode catalyst for proton exchange membrane fuel cells.
International Journal of Hydrogen Energy 2012, 37, 17978-17983,
https://doi.org/10.1016/j.ijhydene.2012.09.050.

https://doi.org/10.33263/BRIAC121.377390
https://biointerfaceresearch.com/ 389
Supplementary materials
Figure S1-S5 show UV-visible spectra of Au-Ag alloy NPs with different
composition between Au and Ag synthesized by the chemical reduction method from AuCl3,
AgNO3 in the presence of PANI as a capping agent. The figures show that with an increase in
Au's composition in Au-Ag bimetallic alloy nanoparticles, the λmax increases, and the lowest
λmax is observed for Au-Ag with a ration 1:3, which shows the maximum value for molar
attenuation value.
400 500 600 700 8000.2
0.3
0.4
0.5
0.6
Ab
so
rban
ce
Wavelength/nm
10 mM
8 mM
6 mM
4 mM
2 mM
Figure S1. UV-Visible Spectra of Au-Ag 1:3 at 298 K.
400 500 600 700 8000.00
0.05
0.10
0.15
0.20
0.25
10mM
8mM
6mM
4mM
2mM
Ab
so
rban
ce
Wavelength/nm
Figure S2. UV-Visible Spectra of Au-Ag 1:2 at 298 K.
400 500 600 700 8000.3
0.4
0.5
0.6 10mM
8mM
6mM
4mM
2mM
Ab
so
rban
ce
Wavelength/nm
Figure S3. UV-Visible Spectra of Au-Ag 1:1 at 298 K.

https://doi.org/10.33263/BRIAC121.377390
https://biointerfaceresearch.com/ 390
400 500 600 700 8000.0
0.1
0.2
0.3
0.4
0.5
0.6
0.7
0.8
0.9
10mM
8mM
6mM
4mM
2mM
1mM
Ab
so
rba
nc
e
Wavelength/nm
Figure S4. UV-Visible Spectra of Au-Ag 2:1 at 298 K.
400 500 600 700 8000.0
0.1
0.2
0.3
0.4
0.5
0.610mM
8mM
6mM
4mM
2mM
Ab
so
rba
nc
e
Wavelength/nm
Figure S5. UV-Visible Spectra of Au-Ag 3:1 at 298 K.


![Synthesis and Spectroscopic Study of Naphtholic and ...covenantuniversity.edu.ng/.../Synthesis+and+Spectroscopic+Study+of.pdfa chromogen [7]. Synthesis of most azo dyes involves diazotization](https://img.pdfslide.net/doc/110x75/5ae35ffa7f8b9a495c8d258a/synthesis-and-spectroscopic-study-of-naphtholic-and-andspectroscopicstudyofpdfa.jpg)