Embed Size (px)
Citation preview
i
SYNTHESIS, CHARACTERIZATION AND APPLICATION OF
SUPPORTED NICKEL CATALYSTS FOR THE
HYDROGENATION OF OCTANAL
By
SAMKELO MTHALANE
BSc (Hons)
Submitted in fulfilment of the academic requirements for the degree of
Master of Science in the
School of Chemistry,
University of KwaZulu-Natal
Durban,
South Africa
June 2010
As the candidate‟s supervisor I have/have not approved this thesis/dissertation for submission.
Signed: _____________ Name: _____________ Date: ____

ii
ABSTRACT
Three nickel based catalysts were prepared by the impregnation method (Ni/Al2O3 and Ni/SiO2)
and co-precipitation method (Ni/ZnO). The catalysts were characterized by XRD, ICP-OES,
BET-surface area and pore volume, SEM, TEM, TPR, NH3-TPD and in-situ XRD reduction. The
catalytic activity of the catalysts in the liquid phase hydrogenation of octanal was studied at 110
°C and 50 bar. The effect of water as a co-feed on the catalytic activity of the catalysts was also
investigated.
Generally, all the catalysts were crystalline materials. The Ni/Al2O3 and Ni/ZnO catalysts
contained NiO species that were “hard” to reduce, whereas the Ni/SiO2 catalyst was the easiest to
reduce, according to the TPR and in-situ XRD reduction studies. The total acidity (µmol
NH3/gcatal.) of the catalysts decreased in the following sequence: Ni/Al2O3 > Ni/ZnO > Ni/SiO2.
The Ni/SiO2 and Ni/ZnO catalysts had intermediate and strong acidic sites, respectively, while
the Ni/Al2O3 catalyst had weak-intermediate and strong acidic sites. The BET-surface area and
pore volume of the catalysts decreased in the following order: Ni/Al2O3 > Ni/SiO2 > Ni/ZnO.
The conversion of octanal for all the catalysts was ca. 90 %. The Ni/SiO2 and Ni/ZnO catalysts
had octanol selectivities of over 99 % and the Ni/Al2O3 catalyst had 95 % octanol selectivity. The
alumina support was observed to catalyze the formation of heavy products (C24 acetal, dioctyl
ether and 2-hexyl-1-decanol).
The water present in the feed poisoned the alumina sites that were responsible for the formation
of heavy products thereby, making the catalyst more selective (> 99 %) to octanol. For the
Ni/SiO2 catalyst the presence of water in the feed caused the octanal conversion to decrease with
time-on-stream. The deactivation of the Ni/SiO2 catalyst, when water was used as a co-feed, was
caused by the mechanical failure of the catalyst and also by the leaching of nickel metal during
the reaction.

iii
PREFACE
The experimental work described in this thesis was carried out in the School of Chemistry,
University of Natal, Durban, from February 2008 to June 2010, under the supervision of
Professor Holger B. Friedrich.
These studies represent original work by the author and have not otherwise been submitted in
any form for any degree or diploma to any tertiary institution. Where use has been made of the
work of others it is duly acknowledged in the text.

iv
PLAGIARISM
I, ………………………………………. declare that
1. The research reported in this thesis, except where otherwise indicated, is my original
research.
2. This thesis has not been submitted for any degree or examination at any other
university.
3. This thesis does not contain other persons‟ data, pictures, graphs or other information,
unless specifically acknowledged as being sourced from other persons.
4. This thesis does not contain other persons' writing, unless specifically acknowledged
as being sourced from other researchers. Where other written sources have been
quoted, then:
a. Their words have been re-written but the general information attributed to them
has been referenced
b. Where their exact words have been used, then their writing has been placed in
italics and inside quotation marks, and referenced.
5. This thesis does not contain text, graphics or tables copied and pasted from the
Internet, unless specifically acknowledged, and the source being detailed in the thesis
and in the References sections.
Signed: …………………………………………………………
v
CONFERENCE CONTRIBUTIONS
Part of the work reflected in the following dissertation has been presented at the following
conferences as poster presentations:
CATSA Conference 2008, Parys, Poster presentation, Synthesis and Characterisation of Nickel
based catalysts.
CATSA Conference 2009, Goudini Spa, Poster presentation, Deactivation and regeneration of
supported metal catalysts for hydrogenation reactions.

vi
ACKNOWLEDGEMENTS
Firstly, I would like to thank Prof. H.B. Friedrich for allowing me to further my studies under his
supervision and for guiding me throughout my studies. Without his support this research would
not have been possible. I would also like to thank Dr A.S. Mahomed for mentoring me
throughout my project.
I also like to say thank you to the following people:
Dr J. Wesley-Smith, Priscilla Maartens and Sharon Eggers for assistance with electron
microscopy.
Dr Sooboo Sigh for his words of encouragements and for helping with the reactor set-up.
Francois Human and Enrico Caricato for their help with the reactor set-up.
CRG members for helping me during the project.
Dr Nico Prinsloo for encouraging me to finish my project.
UKZN technical staff for helping me in various ways.
My family and Nonjabulo Nyalungu for their prayers and for believing in me.
My friends: Sinikiwe Brothers.
Sasol and University of KwaZulu Natal for financial support.
I would also like to give praise to God for showering me with his blessings throughout my life.
“Angikaze ngimbone oka-Jehova ehlulekile”

vii
DEDICATIONS
I would like to dedicate this thesis to my parents (Dephorse Mthalane and Nonhlanhla Mthalane)
and grandmother (Nolindelo Ngubane).

viii
ABBREVIATIONS
Å : Angstroms (10-10
metre)
atm : Atmospheres
BET : Brunauer-Emmet-Teller
des : Desorption
EDX : Energy-dispersive X-ray spectroscopy
FWHM : Full width at half maximum
G : Gram
GC : Gas chromatography
GC-MS : Gas chromatography-mass spectroscopy
GHSV : Gas hourly space velocity
H : Hour
HPLC : High performance liquid chromatography
ICP-OES : Inductively coupled plasma-optical emission spectroscopy
K : Kelvin
kPa : Kilopascal
L : Litre
LHSV : Liquid hourly space velocity
M : Molar (concentration in mole per litre)
min : minute
mL : Millilitre
nm : Nanometre
NMR : Nuclear magnetic resonance
ppm : Parts per million
SEM : Scanning electron microscopy
T : Temperature
TEM : Transmission electron microscopy
TPD : Temperature programmed desorption

ix
TPR : Temperature programmed reduction
XRD : X-ray diffraction
µL : Microlitre (10-6
litre)
µm : Micrometer (10-6
metre)

x
TABLE OF CONTENTS
LIST OF FIGURES ..................................................................................................................... xvi
LIST OF SCHEMES .................................................................................................................... xix
LIST OF TABLES ........................................................................................................................ xx
CHAPTER 1 ................................................................................................................................... 1
Introduction ................................................................................................................................. 1
1.1. Catalysis........................................................................................................................ 1
1.2. Motivation for the study ............................................................................................... 3
1.3. Factors affecting the performance of the catalysts during hydrogenation reactions .... 4
1.3.1. Particle size and surface area effect ...................................................................... 4
1.3.2. Role of a catalyst support ...................................................................................... 6
1.3.3. Catalyst porosity .................................................................................................... 9
1.4. Catalyst Deactivation .................................................................................................. 10
1.4.1. Poisoning ............................................................................................................. 13
1.4.2. Thermal degradation / Sintering .......................................................................... 16
1.4.3. Fouling (Coking or carbon deposition) ............................................................... 19
1.4.4. Mechanical failure ............................................................................................... 21
1.4.5. Leaching .............................................................................................................. 21
1.5. References .................................................................................................................. 22
CHAPTER 2 ................................................................................................................................. 24

xi
Experimental ............................................................................................................................. 24
2.1. Materials ........................................................................................................................ 24
2.2. Preparation of the nickel catalysts ................................................................................. 25
2.2.1. Preparation of the NiO/ZnO catalyst ..................................................................... 25
2.2.2. Preparation of the NiO/Al2O3 catalyst ................................................................... 25
2.2.3. Preparation of the NiO/SiO2 catalyst ..................................................................... 26
2.2.4. Calcination .............................................................................................................. 26
2.3. Catalyst characterization ................................................................................................ 27
2.3.1. Inductively coupled plasma optical emission spectrometry ICP-OES .................. 27
2.3.2. Brunauer-Emmett-Teller (BET) surface area and pore volume analysis ............... 27
2.3.3. X-ray diffraction (XRD) ......................................................................................... 28
2.3.3.1. Powder X-ray diffraction (XRD) ..................................................................... 28
2.3.3.2. In-situ XRD ...................................................................................................... 29
2.3.4. Scanning electron microscopy (SEM) and energy dispersion X-ray spectroscopy
(EDX) ................................................................................................................................ 29
2.3.5. Transmission electron microscopy (TEM).............................................................. 30
2.3.6. Temperature programmed reduction (TPR) ............................................................ 30
2.3.7. Temperature programmed desorption (TPD) .......................................................... 30
2.4. Experimental reactor set-up ........................................................................................... 31
2.5. Catalytic conditions and testing ..................................................................................... 34
2.6. References ...................................................................................................................... 36
CHAPTER 3 ................................................................................................................................. 37
Catalysts Characterisation ......................................................................................................... 37

xii
3.1. BET-surface area and ICP-OES analysis ....................................................................... 37
3.2. Characterization of the Ni/Al2O3 catalyst ...................................................................... 38
3.2.1. XRD analysis .......................................................................................................... 38
3.2.2. Scanning electron microscopy and electron dispersive analysis ............................ 40
3.2.3. Transmission electron microscopy .......................................................................... 42
3.2.4. Hydrogen - temperature programmed reduction..................................................... 43
3.2.5. In-situ XRD reduction of the Ni/Al2O3 catalyst. .................................................... 44
3.2.6. NH3-temperature programmed desorption of the Ni/Al2O3 catalyst ....................... 45
3.3. Characterization of the Ni/SiO2 catalyst ........................................................................ 47
3.3.1 XRD analysis ........................................................................................................... 47
3.3.2. Scanning electron microscopy and electron dispersive analysis ............................ 48
3.3.3. Transmission electron microscopy .......................................................................... 49
3.3.4. Hydrogen - temperature programmed reduction..................................................... 49
3.3.5. In-situ reduction of a Ni/SiO2 catalyst. ................................................................... 51
3.3.6. NH3-temperature programmed desorption .............................................................. 52
3.4. Characterization of the Ni/ZnO catalyst ........................................................................ 53
3.4.1. XRD analysis .......................................................................................................... 53
3.4.2. Scanning electron microscopy and electron dispersive analysis ............................ 54
3.4.3. Transmission electron microscopy .......................................................................... 55
3.4.4. Hydrogen - temperature programmed reduction..................................................... 56
3.4.5. In-situ reduction of the Ni/ZnO catalyst ................................................................. 57
3.4.6. NH3-temperature programmed desorption of the Ni/ZnO catalyst ......................... 57
3.5. Conclusions .................................................................................................................... 59
3.6. References ...................................................................................................................... 61
xiii
CHAPTER 4 ................................................................................................................................. 62
Results and Discussion: Catalytic Testing and Characterization of Used Catalysts ................. 62
4.1. Reaction network for the hydrogenation of octanal ....................................................... 62
4.2. The influence of octanal/hydrogen ratio and temperature on the conversion and
selectivity of the Ni/Al2O3 catalyst. ...................................................................................... 64
4.3. Catalytic hydrogenation of octanal using the model feed and the characterization of the
used catalysts. ....................................................................................................................... 66
4.3.1. Catalytic activity of the Ni/Al2O3 catalyst. ............................................................. 67
4.3.2. Characterization of the used Ni/Al2O3 catalyst. ...................................................... 70
4.3.2.1. XRD of the used Ni/Al2O3 catalyst. ................................................................. 70
4.3.2.2. SEM of the used Ni/Al2O3 catalyst. ................................................................. 70
4.3.2.3. TEM of the used Ni/Al2O3 catalyst. ................................................................. 71
4.3.2.4. BET surface area and pore volume of the used Ni/Al2O3 catalyst................... 71
4.3.2.5. ICP-OES measurements of the used Ni/Al2O3 catalyst. .................................. 72
4.3.3. Catalytic activity of the Ni/SiO2 catalyst. ............................................................... 72
4.3.4. Characterization of the used Ni/SiO2 catalyst. ........................................................ 74
4.3.4.1. XRD of the used Ni/SiO2 catalyst. ................................................................... 74
4.3.4.2. SEM of the used Ni/SiO2 catalyst. ................................................................... 74
4.3.4.3. TEM of the used Ni/SiO2 catalyst. ................................................................... 74
4.3.4.4. BET surface area and pore volume of the used Ni/SiO2 catalyst. ................... 75
4.3.4.5. ICP-OES measurements of the used Ni/SiO2 catalyst. .................................... 75
4.3.5. Catalytic activity of the Ni/ZnO catalyst ................................................................ 76
4.3.6. Characterization of the used Ni/ZnO catalyst. ........................................................ 77

xiv
4.3.6.1. XRD of the used Ni/ZnO catalyst. ................................................................... 77
4.3.6.2. SEM of the used Ni/ZnO catalyst. ................................................................... 78
4.3.6.3. TEM of the used Ni/ZnO catalyst. ................................................................... 78
4.3.6.4. BET surface area and pore volume of the used Ni/ZnO catalyst. .................... 78
4.3.6.5. ICP-OES measurements of the used Ni/ZnO catalyst. .................................... 79
4.4. Catalytic hydrogenation of octanal using the water spiked feed and the characterization
of the used catalysts. ............................................................................................................. 79
4.4.1. Catalytic activity of the Ni/Al2O3 catalyst. ............................................................. 79
4.4.2. Characterization of the used Ni/Al2O3 catalyst. ...................................................... 81
4.4.3. Catalytic activity of the Ni/SiO2 catalyst. ............................................................... 82
4.4.4. Characterization of the used Ni/SiO2 catalyst. ........................................................ 84
4.4.5. Catalytic activity of the Ni/ZnO catalyst. ............................................................... 84
4.4.6. Characterization of the used Ni/ZnO ...................................................................... 86
4.5. References ...................................................................................................................... 87
CHAPTER 5 ................................................................................................................................. 88
Summary and Conclusion ......................................................................................................... 88
5.1. Conclusion ..................................................................................................................... 88
5.2. References ...................................................................................................................... 91
APPENDIX A ............................................................................................................................... 92
REACTOR SET-UP .................................................................................................................. 92
APPENDIX B ............................................................................................................................... 94

xv
CHARACTERIZATION DATA FOR THE FRESH CATALYSTS.......................................... 94
APPENDIX C ............................................................................................................................... 99
CHARACTERIZATION DATA FOR THE USED CATALYSTS............................................ 99

xvi
LIST OF FIGURES
Figure 1.1. Crystallite growth due to sintering. A: atomic migration & B: crystallite migration . 17
Figure 3.1. Powder X-ray diffractogram of the Ni/Al2O3 catalyst................................................ 39
Figure 3.2. SEM images of the Ni/Al2O3 catalyst: (a) bright field and (b) electron mapping
images (scale: 30 µm). ............................................................................................ 41
Figure 3.3. TEM image of the Ni/Al2O3 catalyst. ......................................................................... 42
Figure 3.4. Hydrogen – temperature programmed reduction profile of the Ni/Al2O3 catalyst. .... 43
Figure 3.5. XRD patterns obtained during the in-situ reduction of the Ni/Al2O3 catalyst. .......... 45
Figure 3.6. NH3-TPD of a Ni/Al2O3 catalyst. ............................................................................... 46
Figure 3.7. Powder XRD of a Ni/SiO2 catalyst ............................................................................ 47
Figure 3.8. SEM images of the Ni/SiO2 catalyst: (a) bright field and (b) electron mapping images
(scale: 20 µm). ........................................................................................................... 48
Figure 3.9. TEM image of the Ni/SiO2 catalyst with an electron diffraction inset. ...................... 50
Figure 3.10. Hydrogen – temperature programmed reduction profile of the Ni/SiO2 catalyst. .... 50
Figure 3.11. XRD patterns obtained during the in-situ reduction of the Ni/SiO2 catalyst. ........... 51
Figure 3.12. NH3-TPD of the Ni/SiO2 catalyst. ............................................................................ 52
Figure 3.13. Powder XRD of the NiO/ZnO catalyst. .................................................................... 53
Figure 3.14. SEM images of the Ni/ZnO catalyst: (a) bright field and (b) electron mapping
images (scale: 10 µm). ............................................................................................ 55
Figure 3.15. TEM image of the Ni/ZnO catalyst with an electron diffraction image (Scale: 100
nm). ......................................................................................................................... 56
Figure 3.16. Hydrogen – temperature programmed reduction profile of the Ni/ZnO catalyst. .... 57
Figure 3.17. XRD patterns obtained during the in-situ reduction of the Ni/ZnO catalyst. ........... 58

xvii
Figure 3.18. NH3-TPD of the Ni/ZnO catalyst. ............................................................................ 58
Figure 4.1. Effect of temperature on octanal hydrogenation performance over a Ni/Al2O3
catalyst......................................................................................................................65
Figure 4.2. Effect of octanal/H2 ratio on octanal hydrogenation performance over a Ni/Al2O3
catalyst. .................................................................................................................... 66
Figure 4.3. Conversion and selectivity in octanal hydrogenation over the Ni/Al2O3 catalyst ..... 67
Figure 4.4. Conversion and selectivity to octanol in octanal hydrogenation over the Ni/SiO2
catalyst. .................................................................................................................... 73
Figure 4.5. Conversion and selectivity to octanol in octanal hydrogenation over the Ni/ZnO
catalyst. .................................................................................................................... 76
Figure 4.6. The effect of water in the feed on octanal hydrogenation over the Ni/Al2O3 catalyst 80
Figure 4.7. The effect of water in the feed on octanal hydrogenation over the Ni/SiO2 catalyst. 83
Figure 4.8. The effect of water in the feed on octanal hydrogenation over the Ni/ZnO catalyst . 85
Figure A1. Reactor tube loaded with a catalyst. ........................................................................... 93
Figure B1. SEM image of the Ni/Al2O3 catalyst. ......................................................................... 95
Figure B2. Electron mapping graph of the Ni/Al2O3 catalyst. ...................................................... 95
Figure B3. Electron diffraction of the Ni/Al2O3 catalyst. ............................................................. 96
Figure B4. NH3-TPD of the alumina support. .............................................................................. 96
Figure B5. Elemental mapping images of the Ni/SiO2 catalyst showing the distribution of (a) Ni
and (b) Si particles. .................................................................................................... 97
Figure B6. Electron mapping graph of the Ni/SiO2 catalyst. ........................................................ 97
Figure B7. Electron mapping images of the Ni/ZnO catalyst showing the distribution of (a) Ni
and (b) Zn particles. ................................................................................................... 98
Figure B8. Electron mapping graph of the Ni/ZnO catalyst. ........................................................ 98
Figure C1. Typical GC trace of a run using model feed over the Ni/Al2O3. ............................... 100

xviii
Figure C2. XRD diffractogram of the used Ni/Al2O3 catalyst (Reaction feed: model feed). ..... 102
Figure C3: SEM of the used Ni/Al2O3 catalyst: (a) bright field and (b) electron mapping images
(Reaction feed: model feed). .................................................................................... 102
Figure C4. TEM of the used Ni/Al2O3 catalyst (Reaction feed: model feed). ............................ 103
Figure C5. XRD diffractogram of the used Ni/SiO2 catalyst (Reaction feed: model feed). ....... 103
Figure C6. SEM of the used Ni/SiO2 catalyst: (a) bright field and (b) electron mapping images
(Reaction feed: model feed). .................................................................................... 104
Figure C7. TEM of the used Ni/SiO2 catalyst (Reaction feed: model feed). Scale: 200 nm. ..... 104
Figure C8. XRD diffractogram of the used Ni/ZnO catalyst (Reaction feed: model feed). ....... 105
Figure C9. SEM of the used Ni/ZnO catalyst: (a) bright field and (b) electron mapping images
(Reaction feed: model feed). .................................................................................... 105
Figure C10. TEM of the used Ni/ZnO catalyst (Reaction feed: model feed). Scale: 200 nm. ... 106

xix
LIST OF SCHEMES
Scheme 4.1. Reaction network for the hydrogenation of octanal . ............................................... 63
Scheme 4.2. The mechanism for aldol condensation of octanals over bi-functional sites of
alumina . ........................................................................................................................................ 69

xx
LIST OF TABLES
Table 1.1. Deactivation processes for various catalytic reactions . .............................................. 12
Table 1.2. Mechanisms of catalyst deactivation . ......................................................................... 13
Table 1.3. Poisons that affect some of the industrial catalysts . .................................................... 15
Table 2.1. Reagents, standards and catalyst supports material used in experimental ................... 24
Table 2.2. Temperature ramping details followed during the calcination process. ....................... 26
Table 3.1. Nickel composition and textural properties of the catalysts‟ supports and calcined
catalysts ....................................................................................................................... 37
Table 3.2. XRD Bragg‟s angles and d-spacings of detected species ............................................ 39
Table 3.3. Quantitative EDX data for the Ni/Al2O3 catalyst ......................................................... 41
Table 3.4. Acidity of the catalysts ................................................................................................. 46
Table 3.5. XRD Bragg‟s angle and d-spacing of detected NiO phases. ........................................ 48
Table 3.6. Quantitative EDX data for a Ni/SiO2 catalyst .............................................................. 49
Table 3.7. XRD Bragg‟s angles and d-spacings of detected NiO and ZnO phases. ..................... 54
Table 4.1. Product selectivity of octanal hydrogenation over Ni/Al2O3 catalyst. ......................... 68
Table 4.2. Comparisons of the nickel crystallite size between the fresh and the used Ni/Al2O3
catalysts. ...................................................................................................................... 70
Table 4.3. Textural properties of the fresh and used catalysts. ..................................................... 71
Table 4.4. Nickel content of the fresh and used Ni/Al2O3 catalyst. .............................................. 72
Table 4.5. Product selectivity of octanal hydrogenation over Ni/SiO2 catalyst. ........................... 73
Table 4.6. Comparisons of the nickel crystallite size between the fresh and the used Ni/SiO2
catalysts. ...................................................................................................................... 74
Table 4.7. Textural properties of the fresh and used Ni/SiO2 catalysts. ........................................ 75
Table 4.8. Nickel content of the fresh and used Ni/SiO2 catalysts. .............................................. 75

xxi
Table 4.9. Product selectivity of octanal hydrogenation over Ni/ZnO catalyst. ........................... 77
Table 4.10. Comparisons of the nickel crystallite size between the fresh and the used Ni/ZnO
catalysts. ................................................................................................................... 77
Table 4.11. Textural properties of the fresh and used Ni/ZnO catalysts. ...................................... 78
Table 4.12. Nickel content of the fresh and used Ni/ZnO catalysts. ............................................. 79
Table 4.13. Effect of water on octanal hydrogenation over Ni/Al2O3 catalyst. ............................ 81
Table 4.14. Nickel concentration and textural properties of the fresh and used Ni/Al2O3 catalysts.
....................................................................................................................................................... 82
Table 4.15. Effect of water on octanal hydrogenation over Ni/SiO2 catalyst. .............................. 83
Table 4.16. Nickel concentration and textural properties of the fresh and used Ni/SiO2 catalysts.
....................................................................................................................................................... 84
Table 4.17. Effect of water on octanal hydrogenation over the Ni/ZnO catalyst. ......................... 85
Table 4.18. Nickel concentration and textural properties of the fresh and used Ni/ZnO catalysts.
....................................................................................................................................................... 86
Table C1. Peak number and corresponding component as observed from the GC trace (Figure
C1)............................................................................................................................................... 101

1
CHAPTER 1
Introduction
1.1. Catalysis
A catalyst can be viewed as a substance that increases the rate of approach to equilibrium of a
chemical reaction without being substantially consumed in the reaction [1]. The concept of
catalysis was popularized by “Berzelius in 1836 when he described a number of previous
experimental observations including Thenard‟s (1813) that ammonia was decomposed by metals
and Dobereiner„s (1825) that manganese dioxide modifies the rate of decomposition of
potassium chlorate” [2] and in about the same time Mitscherlich studied similar reactions and
came out with the term contact action [3].
Up to this day there is no universal agreement on what the definition of a catalyst is; “the point
of view varies somewhat depending on the investigator, for example, between the fundamental
investigator and the practitioner, and among researchers concerned with heterogeneous catalysis,
homogenous catalysis, polymerization reactions, and enzyme” [3]. But what cannot be disputed
is that all catalytic reactions involve a cycle of reaction steps. During this cycling process the site
on the catalyst forms a complex with reactants, from which products are desorbed, thereby
restoring the original site on the catalyst and continuing the cycle [3]. What is important here is
that ideally the catalyst is never consumed in the overall process [1].
Currently, catalysts play a vital role in almost all biochemical processes and most industrial
chemical processes, and this is because catalytic reactions can take place in various phases, for
example, “in solutions, within the solution like confines of micelles and molecular-scale pockets
of large enzyme molecules, within polymer gels, within the molecular-scale cages of crystalline
solids such as molecular-sieves zeolites, and on the surfaces of solids” [1]. “In practice catalysis
is primarily a technology that draws on many fields such as organic chemistry, surface chemistry,
chemical kinetics, thermodynamics, solid-state physics, ceramics, and physical metallurgy” [3].

2
Catalysis can be broadly classified into heterogeneous or homogeneous catalysis. Homogeneous
catalysis refers to a catalytic system that has both the reactants and a catalyst in one phase, either
gas or liquid. In most homogeneous systems there is a solution of organo-metallic compound in
which a central atom is surrounded by ligands and the state of a central atom is controlled by the
nature of these ligands [3]. The state of a central atom could be negative, neutral or positive. At
equilibrium different structures may exist in solution and that is where techniques such as
nuclear magnetic resonance (NMR), ultraviolet and infrared spectroscopy play a big role with the
characterisation of possible structures [1,3]. In homogeneous systems it is generally observed
that “there are systematic correlations of the structure, the nature of the ligands, and the catalytic
activity of the catalyst complex” [3]. That is why homogeneous catalysis is one of the best
understood types of catalysis and as a result it is wise to make it a starting base for catalytic
reactions.
In heterogeneous systems the catalyst and the reactants are in different phases, usually the
reactants are in a fluid phase (gas or liquid), whereas the catalyst is in the solid phase.
Comparing the two systems, heterogeneous systems are the most widely used industrially. A
basic concept for heterogeneously catalysed reactions is that the reactants adsorb onto the surface
of the catalyst, followed by the rearrangement of the bonding and desorption of the product(s)
[3]. Adsorption of reactants onto the surface of the catalyst can happen in two ways,
chemisorption or physisorption, with the former almost always being the case. One of the oldest
(1875) industrially important heterogeneous systems was the synthesis sulphuric acid (H2SO4)
from the oxidation of sulphur dioxide (SO2) using platinum catalyst.
3
1.2. Motivation for the study
The use of heterogeneous catalysts for the addition of hydrogen to unsaturated bonds was
initially discovered by Paul Sabatier. Based on this, the application of hydrogenation reactions
has been studied in various sectors of the chemical industry [4]. Today, hydrogenation reactions
are carried out commercially using continuous processes such as those found in petroleum
refineries, as well as small-scale batch processes used in the production of pharmaceuticals and
fine chemicals [5].
One of the main problems associated with the catalysts is that they deactivate with time-on-
stream. On a commercial scale, the deactivation process is economically detrimental and
therefore the aim of this project is to investigate the possible deactivation mechanisms that are in
operation in the liquid phase hydrogenation of octanal over nickel-based catalysts.
Catalyst deactivation refers to the loss of activity and/or selectivity with time-on-stream. Chen et
al. [5] showed that the catalyst support can exert a profound influence on the catalytic properties
of the dispersed metal. Water present in the feed has been found to influence the dispersion of the
active metal and also to cause the oxidation of the metal to an inactive form which eventually
leads to deactivation [6.7]. In this study nickel catalysts will be supported on various inorganic
supports and their performance in the hydrogenation of (1) clean octanal feed and (2) water
spiked octanal feed will be investigated.

4
1.3. Factors affecting the performance of the catalysts during
hydrogenation reactions
There are many factors that govern the performance of the catalyst during catalysis and that is
why catalyst design is one the important aspect in catalysis. The performance of the catalyst
refers to catalyst activity and selectivity.
1.3.1. Particle size and surface area effect
Catalyst particle size plays a vital role in influencing the performance (selectivity and activity) of
the catalyst. Usually, the particle sizes of the catalyst are strongly dependent on the preparation
method that was used during the catalyst synthesis. Li et al. [8] prepared alumina-supported
nickel catalysts by three different methods: co-precipitation, impregnation and the sol-gel
method and they observed that catalysts prepared by co-precipitation and the sol-gel method had
smaller particle sizes compared to the one prepared by impregnation. Catalysts prepared by the
sol-gel method usually result in more defined textural properties when compared to catalysts
prepared by conventional (impregnation and co-precipitation) ways, for example, they normally
have mono-modal pore size distribution and high pore volumes [8-10]. Galvagno et al. [11] also
observed that different metal salt precursors result in catalysts with different particle sizes e.g.
ruthenium catalysts prepared from a ruthenium acetylacetonate precursor had smaller particle
sizes compared to the catalysts prepared from a ruthenium nitrate salt.
Generally small particles are always sought after when designing the catalyst, because they result
in high surface area which may lead to high activity. Another benefit of having a catalyst with
small particle sizes and well dispersed metal particles is that it is sometimes necessary to reduce
the catalyst before commencing with any hydrogenation reactions and this reducing step is
achieved quickly and with ease when the particles are small and well dispersed across the
support. Hence, the degree of reduction is usually high for the metal species that are small and
well dispersed across the support. Savva et al. [12] studied benzene hydrogenation over Ni/Al2O3

5
catalysts prepared by conventional and sol-gel techniques and they found that catalysts prepared
by the co-precipitation technique had high activity compared to those prepared by the dry
impregnation technique. These findings were attributed to the fact that the catalyst prepared by
the co-precipitation method had relatively high nickel dispersion over alumina, compared to the
catalyst prepared by dry impregnation. However, when it comes to selectivity, bigger particles
may be favoured over smaller particles to enhance selectivity. Chambers et al. [13] studied the
selective hydrogenation of cinnamaldehyde over supported copper catalysts and they found that
catalyst particle size was the major driving force in getting the desired product (cinnamyl
alcohol). Large particle sizes were found to give high selectivity to cinnamyl alcohol. “Particle
size effects were thought to arise from the phenyl group, sterically hindering the approach of the
C=C moiety to the surface of a large particle, leading to the preferential adsorption and
subsequent hydrogenation of C=O to give the unsaturated alcohol and the facile desorption of the
alcohol on larger crystallites” [13]. Other supported catalysts like ruthenium, platinum and cobalt
have also demonstrated similar metal particle size effects when they were used in selective
hydrogenation of cinnamaldehyde [11,14,15].
The usual encountered problem with large particles is that, in most cases, they promote carbon
formation which eventually leads to catalyst deactivation by coking [8]. Ueno et al. [16] studied
the effects that particle size distribution had on the hydrogenation of propanal to propanol, they
observed that the particle sizes of the nickel catalysts increased with nickel loading, but what was
interesting was that the selectivity of the reaction towards propanol decreased with nickel
loading due to coke being formed from large particles.
Another important aspect of the catalyst is it degree of crystallinity. In most cases the surface
area of the catalyst decreases with an increase in crystallinity and that is why sometimes, when it
comes to activity, the amorphous catalysts do better than their crystalline counterparts. Li et al.
[17] observed that the activity of the Ni-Pt/SiO2 amorphous catalyst during the liquid phase
benzaldehyde hydrogenation decreased as the reaction progressed due to spontaneous
crystallization of the catalyst.

6
1.3.2. Role of a catalyst support
By definition, supported catalysts consist of a support and an active metal centre. The main
reason of using a support is to achieve the highest dispersion of the catalytically active metal and
also to stabilise the metal centre against sintering [18]. Supports for metal catalysts can be
broadly classified into two types; organic polymers and inorganic supports [2]. Examples of
organic polymers that have been used as supports include; polystyrene, polypropylene,
polyacrylates and polyvinyl chloride [2]. The most encountered inorganic supports include;
alumina, silica, glasses, clays and zeolites [2]. From now onwards inorganic supports will be
discussed since the focus of this study is on them.
Generally, a support is present in higher amounts compared to an active metal centre and it
should be stable under both reaction and regeneration conditions [18]. Some of the advantages
for supporting the metal complexes are [2]: (a) separation of the catalyst, (b) thermal stability, (c)
reduced oxygen and moisture sensitivity, (d) no solvent dependence and (e) more easily observed
corrosion effects and reduced plating. One of the major reasons for the dominance of
heterogeneous catalysis in industry is because the problem of separating products from the
catalyst is not encountered, whereas when it comes to homogeneous catalysis this is a problem.
The rate of most reactions increase with an increase in temperature and supported metal catalysts
are generally stable at higher temperatures compared to homogeneous catalysts [2]. The
sensitivity of most heterogeneous catalysts to oxygen and moisture content is very low and hence
they are easier to work with compared to homogeneous catalysts. The problem associated with
choosing a suitable solvent for homogenous system is eliminated when it comes to
heterogeneous systems since they don‟t require the catalyst to be in solution. When working with
homogeneous catalysts the problems associated with corrosion are not immediately seen because
the reactions are normally carried out in glass apparatus [2], but when it comes to heterogeneous
systems the corrosion problem is usually experienced earlier before the industrial scale
operation.
By definition the support should be inert when it comes to reacting with both the reactants and
products, but studies have shown that certain supports can react with either products or reactants

7
thereby causing variation on the expected selectivity. To investigate whether a support is inert or
not, various techniques can be employed, for example, the metal sites can be selectively
poisoned thereby revealing the role of a support or the reaction can be done in the presence of the
support alone. This is exactly what Canning et al. [19] did when they were investigating the role
of alumina on the hydrogenation and isomerisation of cis-2-pentenenitrile. They found that the
olefinic hydrogenation of cis-2-pentenenitrile occurs on the reduced nickel metal particles,
whereas the isomerisation reactions of cis-2-pentenenitrile to trans-2- and trans-3-pentenitrile
occur on alumina support sites. Therefore, instead of being inert as it was initially thought, the
support in this case played a vital role in this process by determining whether or not the
isomerisation product is obtained at the end.
When hydrogenating unsaturated carbonyl compounds one needs to specifically hydrogenate the
targeted functional group. For example, copper is preferred over Pt in the hydrogenation of
unsaturated carbonyl compounds to their respective unsaturated alcohols, because copper is
known to favour the hydrogenation of carbonyl groups over unsaturated carbon atoms, whereas
Pt is know to preferentially hydrogenate the unsaturated atoms [13]. However, when it comes to
the hydrogenation of α,β-unsaturated aldehydes or ketones using copper-chromite catalysts, the
selectivity to unsaturated alcohols decreases. To account for this decrease in unsaturated alcohols
selectivity, Hubaunt et al. [20] observed that allylic alcohols are strongly adsorbed on the catalyst
surface and may undergo isomerisation back to the aldehyde under the influence of the chromia
support, which is known to catalyse isomerisation reactions [13,20]. So, once again in this
process the role of the support is critical to understand because it affects the product distribution.
Some familiar metal oxides (ZnO, Al2O3, Cr2O3, TiO2, CeO2 and ZrO2) which are normally used
as support exhibit pronounced catalytic activity even when they are used alone in the
hydrogenation of benzaldehyde [21]. Also in the hydrogenation of benzoic acid, zinc oxide alone
is capable of giving a 100 % conversion of benzoic acid [22]. Thus, these metal oxides may not
necessarily be inert when they are used as supports. But adding a metal might have advantages
e.g. it might fine tune selectivity and also it may increase the activity and the life span of the
catalyst. So the support can modify the nature of the catalyst and that is why different supports
on the same metal centre may bring about telling differences in activity and selectivity of the
catalyst. Findings by Saadi et al, [23,24] also showed that the hydrogenation of benzaldehyde

8
over nickel and copper catalysts supported on Al2O3, SiO2, TiO2, ZrO2 and CeO2 resulted in
major differences in activity and selectivity. These differences were mainly caused by both metal
and acid-base properties of the catalysts. Therefore, it is very important to understand the
properties of the support because it may not be inert as it was initially believed.
Wang et al. [25] studied the hydrogenation of propanal to propanol over NiMoS/Al2O3 catalysts
and they observed that self-condensation of aldehydes and condensation of aldehydes with
alcohols were the major sides reactions. These side reactions were observed to be catalysed by
acid-base bifunctional sites of the alumina support. The acid-base properties of catalysts usually
vary with a change in catalyst support and this might cause a significant change in the
performance of the catalyst. A study of the hydrogenation of acetonitrile over nickel based
catalysts by Molina et al. [26] showed that the selectivity of the catalysts is mainly controlled by
acid-base properties of the support.
The interaction between a metal and a support is a very important aspect of the catalyst and the
intensity of this interaction influences the degree of metal dispersion across the support.
Generally, small particles interact strongly with a support resulting in high dispersion of a metal
across the support. A series of palladium catalysts supported on activated carbon, alumina and
silica was prepared by Pinna et al. [27] and they observed that catalysts with small metal particle
sizes resulted in high dispersion compared to their large particle counterparts. The intensity of a
metal-support interaction and metal dispersion depends on the metal salts precursors that were
used during the preparation and also on the preparation method. Shibiao et al. [28] prepared
Ni/Al2O3 catalysts using both nickel acetate and nickel nitrate as metal precursors and they found
that nickel catalysts prepared from the acetate salt had higher dispersion compared to catalysts
prepared from the nitrate salt. Li et al. [8] prepared Ni/Al2O3 catalysts using three methods:
impregnation, co-precipitation and the sol-gel method, and they observed that catalysts prepared
by the sol-gel method had high dispersion compared to the other two methods. It was also shown
that catalysts prepared by the sol-gel method result in high metal dispersion compared to co-
precipitation and impregnation [9,10].

9
For hydrogenation reactions, usually, a catalyst has to be in a reduced state and this is normally
done in-situ prior to the reaction. This metal reduction step is strongly influenced by the intensity
of metal-support interactions. If the intensity of the metal-support interaction is high this will
result in a metal being relatively difficult to reduce and this may have major impact on the
activity of the catalyst later. The work by Li et al. [8] showed that alumina supported nickel
catalysts prepared by co-precipitation and sol-gel methods had nickel that was “hard to reduce”
compared to catalysts prepared by impregnation. During the preparation step of the catalysts,
metal ions may interact strongly with a support resulting in a metal being incorporated into the
support, especially if the calcination temperature is high. Teixeira et al. [7] prepared Ni/Al2O3
catalysts calcined at different temperatures and they observed that catalysts calcined at high
temperature required high temperature during the reduction step mainly because “hard to reduce”
nickel aluminate (NiAl2O4) had formed.
The characteristics of the final catalyst are controlled by the intrinsic properties of the support,
the preparation route that was followed during synthesis, metal loading and metal salt precursors.
Thus, “it has been shown that the support can exert a profound influence on the catalytic
properties of the catalyst” [5].
1.3.3. Catalyst porosity
The porosity of the catalyst during a catalytic reaction is very important, and generally a porous
catalyst is sought after because it offers more surface area. Some catalysts are more porous than
others and this may lead to significant changes in the performances of the catalysts. Pores can be
either blocked or/and undergo structural changes during the catalytic reaction and this may lead
to catalyst deactivation. Da Zhu and Hofman [29] studied the deactivation of a Ni/SiO2/Al2O3
catalyst in the hydrogenation of 3-hydroxypropanal and they found out that the mesopores of the
catalyst are blocked during the reaction and this contributed to catalyst deactivation. Chen et al.
[5] prepared three Ni/Al2O3 catalysts, two of which were porous and one nonporous, and
observed that the nonporous catalyst only showed one low temperature peak when reduced,

10
whereas the porous catalysts had an additional peak at high temperature corresponding to the
nickel particles inside the pores.
1.4. Catalyst Deactivation
Ideally a catalyst should last forever but in reality that remains a dream. From the definition of a
catalyst, “a substance that increases the rate of approach to equilibrium of a chemical reaction
without being substantially consumed in the reaction” [1], one could assume that a catalysts life
is eternal since by definition it is never used up in a reaction. So the question is what is it that
prevents the idea of having a catalyst that will last forever? Economically it is not an attractive
route to have a process whereby the catalyst is changed frequently and it must be said that the
effect that the catalyst change has on the process varies from one process to the next, and hence
some processes are affected strongly by this and others mildly. Catalyst deactivation is more
important in continuous flow processes compared to batch processes, but since the problems
associated with waste disposal are not attractive, catalyst deactivation problems are increasingly
becoming more important even in batch processes. It may be possible to recycle the catalyst at
the end of it life cycle, but this is also favourable if it is economical, otherwise catalyst disposal
is preferred.
Catalyst deactivation refers to the loss, over time, of catalytic activity and/or selectivity [3,30].
Therefore one of the aspects that should be looked at during catalyst design and development is
to synthesize a catalyst with high activity, because by doing so the use of relatively small
reactors and less harsh operating conditions can be achieved. As the definition of catalyst
deactivation stipulated that catalytic activity may not be the only aspect of interest, catalyst
selectivity toward the desired product also comes into play, and in some instances it may be more
important than the catalytic activity. Therefore a good catalyst should maintain, for some time, a
desired balance between catalytic activity and selectivity [31]. “Disappointingly as it is to
catalyst users, catalysts do not maintain their activity and selectivity permanently. All catalysts
deactivate and become less affective with time. The time frame, however, can vary dramatically
from a few seconds to many years (Table 1.1)” [19].
11
When working with catalytic reactions it is very important to understand the mechanisms of
catalyst deactivation that take place as the reaction progresses, because by doing so an analyst
may have almost complete control over the catalyst. “The mechanisms of deactivation that can
impact the catalyst as the catalytic reaction progresses are so many but they can be grouped into
six mechanisms namely: (1) Fouling, (2) Poisoning, (3) Thermal degradation, (4) Vapour
compound formation accompanied by transport, (5) Vapour-solid and/or solid-solid reactions,
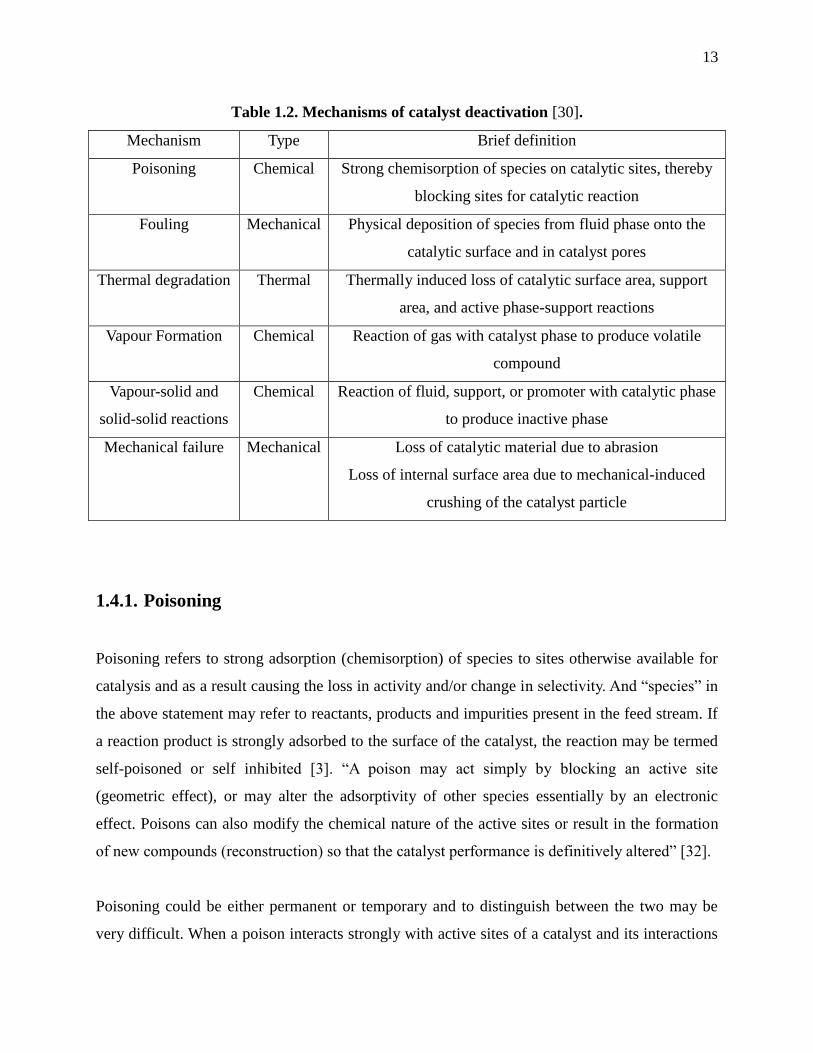
and (6) Attrition and crushing” [30]. Table 1.2. provides a brief description of these mechanisms.

12
Table 1.1. Deactivation processes for various catalytic reactions [19].
Reaction Conditions Catalyst Life (years) Process affecting
life
Catalyst property
Ammonia synthesis 450-550 oC, 200-300
atm
Fe with promoters 5-10 Sintering Activity
Methanation
CO + H2
250-350 oC, 30 atm Supported nickel 5-10 Slow poisoning Activity
Ethyne hydrogenation 30-100 oC, 50 atm Supported
palladium
5-10 Slow sintering Activity/selectivity
Desulphurisation 300-400 oC, 30 atm Supported
CoMoSulphide
2-8 Slow coking,
metal poisoning
Mass transfer, pressure
drop
Methanol to
formaldehyde
600-700 oC, 1 atm Silver granules 0.3-1 Poisoning, Fe Selectivity
Reforming 460-525 oC, 8-50 atm Supported platinum 0.01-0.5 Coking,
regeneration
Mass transfer
Catalytic cracking 500-560 oC, 2-3 atm Zeolites 0.000002 Very rapid coking Mass transfer
13
Table 1.2. Mechanisms of catalyst deactivation [30].
Mechanism Type Brief definition
Poisoning Chemical Strong chemisorption of species on catalytic sites, thereby
blocking sites for catalytic reaction
Fouling Mechanical Physical deposition of species from fluid phase onto the
catalytic surface and in catalyst pores
Thermal degradation Thermal Thermally induced loss of catalytic surface area, support
area, and active phase-support reactions
Vapour Formation Chemical Reaction of gas with catalyst phase to produce volatile
compound
Vapour-solid and
solid-solid reactions
Chemical Reaction of fluid, support, or promoter with catalytic phase
to produce inactive phase
Mechanical failure Mechanical Loss of catalytic material due to abrasion
Loss of internal surface area due to mechanical-induced
crushing of the catalyst particle
1.4.1. Poisoning
Poisoning refers to strong adsorption (chemisorption) of species to sites otherwise available for
catalysis and as a result causing the loss in activity and/or change in selectivity. And “species” in
the above statement may refer to reactants, products and impurities present in the feed stream. If
a reaction product is strongly adsorbed to the surface of the catalyst, the reaction may be termed
self-poisoned or self inhibited [3]. “A poison may act simply by blocking an active site
(geometric effect), or may alter the adsorptivity of other species essentially by an electronic
effect. Poisons can also modify the chemical nature of the active sites or result in the formation
of new compounds (reconstruction) so that the catalyst performance is definitively altered” [32].
Poisoning could be either permanent or temporary and to distinguish between the two may be
very difficult. When a poison interacts strongly with active sites of a catalyst and its interactions

14
are irreversible it is termed permanent poisoning, and when interactions are weak and reversible
it is referred to as temporary poisoning. Sometimes the latter form of poisoning is said to be
caused by inhibitors. Regeneration of the catalyst that is suffering from temporary (reversible)
poisoning can be achieved by simply removing the poisons in the feed, whereas with respect to
irreversible poisoning the same method of regeneration would yield no significant results.
Poisoning can be classified as being selective or non-selective. The former case involves
preferential adsorption of the poison on the most active sites of the catalyst at low
concentrations. This arises if there is some sort of distribution in the characteristics of the active
sites (e.g. the acid strength) of the catalyst, and as a result the strongest active sites will be
poisoned first. In the case of non-selective poisoning the activity loss is proportional to the
concentration of adsorbed poison. This is because in this case the catalyst surface sites are
uniform to the poison and accordingly the poison chemisorption occurs in a uniform manner
[30,32].
Catalyst systems are very different and as a result the way in which they respond to some
poisons may be different. That means the resistance and susceptibility of catalysts to a given
poison may differ significantly. The common poisons in hydrogenation reactions are compounds
of S, Se, Te, P, As, Zn, Hg, halides, Pb, also NH3, C2H2 and oxygen. For example, nickel catalyst
can be oxidized by oxygen to nickel oxide that has less activity in hydrogenation [29]. Some of
the poisons that affect industrial catalyst are tabulated in Table 1.3.

15
Table 1.3. Poisons that affect some of the industrial catalysts [30,32].
Process Catalyst Poisons
Hydrogenation
dehydrogenation
Ni, Pt, Pd, Co, Fe Compounds of S, P, As, Zn,
Hg, halides, Pb, NH3, C2H2
Cracking SiO2-Al2O3, zeolites Organic bases, NH3, Na,
heavy metals
Ammonia synthesis Fe, Ru CO, CO2, H2O, C2H2, S, Bi,
Se, Te, P
Oxidation V2O5 As, Fe, K, Na from fly ash
Ethylene oxidation to
ethylene oxide
Ag C2H2
Fischer-Tropsch synthesis Co, Fe H2S, As, NH3, metal
carbonyls
Steam reforming of
methane, naphtha
Ni H2S, As
Hydrotreating of residue Co, MoS Asphaltenes, N compounds,
Ni, V
Methanol synthesis, low-T
CO shift
Cu H2S, AsH3, PH3, HCl
Automotive catalytic
converters
Pt, Pd Pb, P, Zn
In hydrogenation reactions palladium systems are the well studied and that is why poisons, like
sulphur bearing compounds, are well known to modify the adsorption properties and catalytic
surface conditions of Pd catalyst [33]. Da Zhu and Hofmann [29] studied the deactivation of a
Ni/SiO2/Al2O3 catalyst in the hydrogenation of 3-hydroxypropanal and they observed that the
adsorption of by-products and impurities from the feed caused the catalyst to deactivate by
blocking the mesopores of the catalyst pellets. Therefore the purity of the feed stream with
respect to poisons has to be monitored as well.
16
Poisoning needs to be studied in depth because useful information can be obtained from
understanding the interactions between the catalyst and poison and the changes that take place on
a catalyst. In some cases selective poisons are sometimes used intentionally to adjust the
selectivity of the catalyst and this treatment is known as “tempering” a catalyst. For example, the
new Pt-Re/Al2O3 reforming catalysts are pre-treated in the presence of low concentrations of
sulphur compound to limit the very high hydrocracking activity. Apparently, some very active
sites that are responsible for hydrocracking are poisoned by sulphur compounds [32].
So poisoning can be advantageous in enhancing the selectivity of the catalyst but usually the
activity is compromised. But in this case where poisoning is helpful, terms such as selectivity
modifiers and selectivity promoters best describe the process. For example, “on palladium
catalyst the addition of small amounts cobalt can improve the selectivity of acetylene
hydrogenation relative to ethane and also in the production of amines from nitriles by
hydrogenation, addition of small amount of an alkali hydroxide to the reactant feed improves the
activity of metal catalyst and the selectivity to the desired primary amine [31].” From the above
discussion it can be seen that the term poisoning has an operational meaning.
1.4.2. Thermal degradation / Sintering
“Thermal degradation is a physical process leading to catalyst deactivation because of sintering,
chemical transformations, evaporations, etc. Sintering is the loss of catalyst active surface due to
crystallite growth of either the support material or the active phase” [31]. Generally sintering is
known as a thermally induced method.
Sintering take place in both supported metal catalysts and unsupported catalysts. There are two
models proposed which seek to explain how supported metal catalysts undergo sintering: (1)
atomic migration and (2) crystallite migration. The former model involves the detachment of
metal atoms from crystallites, transport of these atoms across the surface of the support, and
subsequent capture of the migrating atoms on collision with another metal crystallite whereas
crystallite migration involves the migration of the entire crystallite over the support surface

17
followed by collision and coalescence, refer to Fig. 1.1. [30-32]. It must be said though that at
extremely high temperatures a third model which is called vapour transport is also possible. So
sintering causes morphological changes in the catalyst.
Figure 1.1. Crystallite growth due to sintering. A: atomic migration & B: crystallite
migration [30,32].
Referring to Figure 1.1., the position of the particle contributes to sintering because valley
positions are known to be very stable, whereas on-top positions are metastable. Sintering
processes usually take place at high temperatures (e.g. >500 oC) and are generally accelerated by
the presence of water vapour [30].
The best estimate so far of when a sintering process will start rests on the melting temperature of
the atoms that make up the catalyst. Basically, sintering starts to happen when the temperature is
close to the melting point because that is when the metals start to be mobile. To provide a
prediction of when sintering will start Huttig and Tamman temperatures are used [31].
THuttig = 0.3Tmelting
TTamman = 0.5Tmelting
When the Huttig temperature is reached atoms at defect sites start to become mobile and later
when the Tamman temperature is reached, atoms from the bulk will become mobile. And at
melting temperature the mobility will be so high because liquid phase behaviour is observed
[31]. During the catalyst life cycle many processes take place that may cause a catalyst to

18
undergo sintering e.g. calcination, hot spot formation and regeneration procedures (coke burn
off).
It must be said that although temperature is the major driving force of sintering, other factors
also influence sintering and hence the Tamman temperature is not always the best estimate to
approximate the start of sintering. Other factors that influence sintering are; surrounding
atmosphere (gas composition), support material, metal-support interaction, particle shape,
particle size, texture, pore size and impurities of the support or in the metal. The mobility of
metals is not the same and in a reducing atmosphere, the metal crystallite stability generally
decreases in the following order [30]:
Ru > Ir > Rh > Pt > Pd > Ni > Cu > Ag
When studying sintering, metal atoms are not the only species to look at because also the choice
of the support is very important. For platinum, the stability against sintering decreases in the
following manner [30]:
Pt/alumina > Pt/silica > Pt/carbon
Generally, sintering rates are lower for porous supports compared to non-porous supports and
they decrease as crystallite diameter approaches those of the pores. The presence of additives
may either increase or decrease atom mobility, e.g. C, O, CaO, BaO, CeO2, GeO2 decrease atom
mobility, whereas others like Pb, Bi, Cl, F, S increase atom mobility. The additives that decrease
atom mobility and hence reduce sintering are called structural promoters [30].
Atom mobility may be important for some few reactions because it could be used as means for
catalyst regeneration e.g. the redispersion of Pt in reforming catalysts. During the reaction the
dispersion of platinum decreases and the catalyst is normally treated at temperatures up to 920 K
to regenerate it [31]. At high temperatures adsorption on active sites of the support takes place
and the dispersion is enhanced. However, by a high temperature treatment (up to 920 K) in an
oxygen-containing gas, platinum is slightly vaporised because of the formation of Pt-oxides [31].

19
The presence of water in the feed may induce sintering. Water usually causes the metal-support
interactions to be weak, thereby increasing the mobility of metal atoms which may lead to
sintering and/or leaching. Generally, the activities of hydrogenation catalysts are better when the
active metals are in a reduced state, but in the presence of water the metal-support interaction can
be weaken, followed by the oxidation of a metal. Zielinski observed that water inhibits the
reduction of Ni/Al2O3 catalyst [34].
Metal-catalyzed reactions are classified as “structure insensitive when the rate of the reaction is
independent of shape, size, or other physical characteristics of the metal crystallite and is
proportional only to the total number of metal atoms exposed to the reactant” [3]. In contrast the
reaction is classified as being structure-sensitive if the rate and/or selectivity varies significantly
with a change in detailed structure of the surface [3]. In other words not all metal-catalyzed
reactions are affected by sintering.
Although kinetically it (sintering) is a very slow process, sintering is irreversible and prevention
in this case is better than cure.
1.4.3. Fouling (Coking or carbon deposition)
Fouling refers to the accretion of significant amounts of foulant deposits onto the catalyst surface
and this foulant material ends up causing catalyst deactivation by blockage of sites and/or pores
[35]. For catalytic reactions involving hydrocarbons, coking/carbon deposition is the mostly
encountered form of foulant deposit because side reactions take place on the surface of the
catalyst, leading to the formation of carbonaceous residues which tend to physically cover the
active surface thereby leading to deactivation [32].
Sometimes the difference between carbon and coke is emphasized, the former is usually
considered to be the product of CO disproportionation, whereas coke is mainly formed by
processes such as decomposition, dehydrogenation and condensation reactions and typically
consist of heavy polymerized hydrocarbons [30]. Although coke/carbon deposition starts as a

20
physical method, it can grow to being a chemical method because carbon compounds can
subsequently chemisorb to the catalyst surface.
Catalytic reactions involving coke/carbon formation may be classified as either being coke-
sensitive or coke-insensitive. In the former case, unreactive coke is deposited on active sites
leading to activity decline, while for coke-insensitive reactions, relatively reactive coke
precursors formed on active sites are readily removed by hydrogen (or other gasifying agents)
[36]. Menon [36] then concluded by saying that the structure and location of coke is more
important than the quantity in affecting the catalytic activity.
Different mechanisms have been proposed for the formation of coke and carbon deposition. They
differ significantly based on whether the catalyst is a metal or metal oxide or metal sulphide.
Hence the chemical nature of the carbonaceous deposits depends very much on the mechanism
of formation and also on other factors such as the temperature and pressure conditions, the
chemical nature of the feed and product formed, and the age of the catalyst plays a significant
role. For example, it makes sense to suspect that coke formation will occur more rapidly when a
hydrogen acceptor such as an olefin is present [32].
Deactivation on a coked catalyst is not necessary proportional to the degree of coverage (or the
amount of coke present). For example, “a surface analytical study on the deactivation of Pd/SiO2
hydrogenation catalyst showed that the degree of deactivation was not simply correlated with the
degree of coverage of the supported palladium catalyst but with the morphology and
contamination level of the deposited carbon, additionally, the valency state of the precious
metal” [33].

21
1.4.4. Mechanical failure
Scientists who are involved in catalyst design and development are also required to produce
catalysts that will withstand mechanical failure. Mechanical failure of the catalyst can come in
many forms e.g. crushing of pellets, attrition or breakup of catalyst granules/pellets to produce
fines (powder) and erosion of catalyst particles at high velocities. So a catalyst with high
mechanical strength is required to provide resistance against the above mention problems
[30.31].
Some of the factors that need to be looked at when developing the catalyst are catalyst shape and
porosity because they are known to influence the mechanical strength of the catalyst. For
example, a spherical shape is most favourable, whereas macropores will lead to reduced strength
[31]. Wu et al. [6] observed that the deactivation of Ni-B/MgO in the hydrogenation of
acetophenone was caused by the destruction of the porous structure.
1.4.5. Leaching
Leaching of catalyst is the well encountered deactivation route in liquid phase reactions. The
reaction medium can be quite corrosive and as far as metal catalysis is concerned, leaching of
metal atoms depends upon the reaction medium (pH, oxidation potential, chelating properties of
molecules) and upon bulk and surface metal properties. Usually the loss of metal from catalysts
is primarily due to support leaching for example, alumina supports dissolve at high (greater than
12) and low pH (less than 3) [31.38].
Although these mechanisms of deactivation were discussed separately, during the catalytic
reaction two or more mechanisms can happen at the same time.

22
1.5. References
1. B.C. Gates, Catalytic Chemistry, John Wiley and Sons, New York, 1992.
2. F.R. Hartley, Supported Metal Complexes, D. Reidel Publishing Company, Dordrecht,
1985.
3. C.N. Satterfield, Heterogeneous Catalysis in Industrial Practice, McGraw-Hill, New
York, 1991.
4. G.M.R. van Druten, V. Ponec, Appl. Catal. A: Gen. 191(2000) 153.
5. S.L. Chen, H.L. Zhang, J. Hu, C. Contescu, J.A. Schwarz, Appl. Catal. 73 (1991) 289.
6. Z. Wu, M. Zhang, W. Li, S. Mu, K. Tao, J. Mol. Catal. A: Chem. 273 (2007) 277.
7. A.C.S.C. Teixeira, R. Giudici, Chem. Eng. J. 54 (1999) 3609.
8. G. Li, L. Hu, J. M. Hill, Appl. Catal. A: Gen. 301 (2006) 16.
9. M. Valenzuela, P. Bosch, G. Aguilar-Rios, A. Montoya, I. Schifter, J. Sol-Gel Sci.
Technol. 8 (1997) 107.
10. M. Montes, F. Getton, M.S.W. Vong, P.A, Sermon, J. Sol-Gel Sci. Technol. 8 (1997)
131.
11. S. Galvagno, G. Capannelli, G. Neri, A. Donato, R. Pietropada, J. Mol. Catal. 64 (1991)
237.
12. P.G. Savva, K. Goundani, J. Vakros, K. Bourikas, C. Fountzoula, D. Vattis, A.
Lycourghiotis, Ch. Kordulis, Appl. Catal B: Environ 79 (2008) 199.
13. A. Chambers, S.D. Jackson, D. Stirling, G. Webb, J. Catal. 168 (1997) 301.
14. D. Richard, P. Fouilloux, P. Gallezot, “Proc. 9th
Int. Cong. Catal., Calgary, 1988” (M.J.
Phillips and M. Ternan, Eds.), p. 1074, Chem. Inst. Canada, Ottawa, 1988.
15. Y. Nitta, K. Ueno, T. Imanaka, Appl. Catal. 56 (1989) 9.
16. A. Ueno, H. Suzuki, Y. Kotera, J. Chem. Soc., Faraday Trans. l, 79 (1983) 127.
17. H. Li, W. Wang, H. Li, J.F. Deng, J. Catal. 194 (2000) 211.
18. B.M. Reddy, G.K. Reddy, K.N. Rao, A. Khan, I. Ganesh, J. Mol. Catal. A: Chem. 265
(2007) 276.
19. A. R. Canning, S.D. Jackson, S. Mitchell, Catal. Today 114 (2006) 372.
20. R. Hubaunt, J.P. Bonnelle, M. Daage, J. Mol. Catal. 55 (1989) 170.

23
21. D. Haffad, U. Kameswari, M.M. Bettahar, A. Chambellan, J.C. Lavalley, J. Catal. 172
(1997) 85.
22. M.W. de Lange, J.G. van Ommen, L. Lefferts, Appl. Catal A: Gen 220 (2001) 41.
23. A. Saadi, Z. Rassol, M.M. Bettahar, J. Mol. Catal. A: Chem 164 (2000) 205.
24. A. Saadi, R. Merabti, Z. Rassol, M.M. Bettahar, J. Mol. Catal. A: Chem 253 (2006) 79.
25. X. Wang, R.Y. Saleh, U.S. Ozkan, J. Catal. 231 (2005) 20.
26. A.I. Molina, J.M. Robles, P.B. Garcia, E.R. Castellon, E. Finocchio, G. Busca, P.M.
Torres, A.J. Lopez, J. Catal. 225 (224) 479.
27. F. Pinna, F. Menegazzo, M. Signoretto, P. Canton, G. Fagherazzi, N. Pernicone, Appl.
Catal. A: Gen. 219 (2001) 195.
28. R. Shibiao, Q. Jinheng, W. Chunyan, X. Bolian, F. Yining, C. Yi, Chin. J. Catal. 2007,
28(7): 651-656.
29. X. Da Zhu, H. Hofmann, Appl. Catal. A: Gen. 155 (1997) 179.
30. C.H. Bartholomew, Appl. Catal. A: Gen. 212 (2001) 17.
31. J.A. Moulijn, A.E. van Diepen, F. Kaptein, Appl. Catal. A: Gen. 212 (2001) 3.
32. P. Forzatti, L. Lietti, Catal. Today 52 (1999) 165.
33. W. Juszczyk, Z. Karpi ski, I. Ratajczykowa, Z. Stanasiuk, J. Zieli ski, L. -L. Sheu, W.
M. H. Sachtler, J. Catal. 120 (1989) 68.
34. J. Zielinski, J. Mol. Catal. 83 (1993) 197.
35. R. Mann, Catal. Today, 37 (1997) 331.
36. P.G. Menon, J. Mol. Catal. 59 (1990) 207.
37. P. Albers, K. Seibold, G. Prescher, H. Muller, Appl. Catal. A: Gen 176 (1999) 135.
38. M. Besson, P. Gallezot, Catal. Today 81 (2003) 547.

24
CHAPTER 2
Experimental
2.1. Materials
Table 2.1. presents the list of the chemicals used during the study.
Table 2.1. Reagents, standards and catalyst supports material used in experimental
Chemical name Chemical formula Assay / % Supplier
Nickel nitrate hexahydrate Ni(NO3)2.6H2O 98 Saarchem
Zinc nitrate hexahydrate Zn(NO3)2.6H2O 99 Sigma-Aldrich
Silicon oxide (catalyst support) SiO2 - Alfa Aesar
Aluminium oxide (catalyst support) Al2O3 - Alfa Aesar
Sodium hydroxide NaOH 98 Rochelle chemicals
Hydrochloric acid HCl 32 Promark chemicals
Hydrofluoric acid HF 40 – 45 Riedel-de Haen
Nitric acid HNO3 55 Promark chemicals
Nickel Ni ICP
standard
Polychem
Carborandum powder (course 24 grit) - - Promark chemicals
Hydrogen H2 ≥ 99.9999 Afrox
Nitrogen N2 ≥ 99.9999 Afrox
Octanal C8H16O - Sigma-Aldrich
Octanol C8H18O - Sigma-Aldrich
25
2.2. Preparation of the nickel catalysts
For the purpose of the study, three catalysts were prepared, namely; Ni/Al2O3, Ni/SiO2 and
Ni/ZnO. The nickel supported on zinc oxide catalyst was prepared by the co-precipitation
method and the other two catalysts were prepared by the wet impregnation method. The targeted
nickel loading of all the catalysts was 30 wt.%.
2.2.1. Preparation of the NiO/ZnO catalyst [1]
A NiO/ZnO catalyst was prepared by co-precipitation at a constant pH of 8. Solutions (1 M) of
nickel nitrate hexahydrate (51.12 mL, 0.05112 mol) and zinc nitrate hexahydrate (86.02 mL,
0.08602 mol) were mixed in a separating funnel. The resulting solution was added drop-wise to a
beaker containing 150 mL of distilled water under continuous stirring. The pH in the beaker was
maintained at 8 by using sodium hydroxide (1 M). A green nickel and zinc hydroxide precipitate
was formed. The precipitate was aged in the mother liquor for 10 h at 80 °C. The precipitate was
then filtered and washed thoroughly with deionised water (1.0 L). It was then oven dried
overnight at 120 °C.
2.2.2. Preparation of the NiO/Al2O3 catalyst [2,3]
A NiO/Al2O3 catalyst was prepared by the wet impregnation method. The γ-Al2O3 (28.01 g)
catalyst support was impregnated with an aqueous solution of nickel nitrate hexahydrate (12.00
g). The nickel solution was added to the support under vigorous stirring at room temperature.
Water was then evaporated at 80 °C with continuous stirring. The resulting impregnated solid
was then oven dried overnight at 120 °C.

26
2.2.3. Preparation of the NiO/SiO2 catalyst [2,3]
A NiO/SiO2 catalyst was also prepared by the wet impregnation method. The SiO2 catalyst
support (35.19 g), was impregnated with an aqueous solution of nickel nitrate hexahydrate (74.32
g). The nickel solution was added to the support under vigorous stirring at room temperature.
Water was then evaporated at 80 °C with continuous stirring. The resulting impregnated solid
was subsequently oven dried overnight at 120 °C.
2.2.4. Calcination
The above three catalysts precursors were calcined in a stream of air at 550 °C for 3 h. Table 2.2.
shows the steps that were followed during the calcination process.
Table 2.2. Temperature ramping details followed during the calcination process.
Step No. Temperature ramp / °C Duration / h
1 30 - 200 2
2 200 - 400 2
3 400 - 550 2
4 550 - 550 3
5 550 - 250 2
6 250 - 30 2.5

27
2.3. Catalyst characterization
The following techniques were used to characterize the catalysts.
2.3.1. Inductively coupled plasma optical emission spectrometry ICP-OES [4]
The exact concentration of nickel loading in a catalyst sample was determined by Inductively
Coupled Plasma Optical Emission Spectroscopy (ICP-OES) using a Perkin-Elmer Optiva
5300DV instrument. Accurately weighed catalysts samples (~0.5 g) were dissolved in a mixture
of HF (4 mL), HCl (3 mL) and HNO3 (3 mL) at 90 °C. The samples were then homogenized in a
microwave oven (Perkin-Elmer Multiwave, Microwave Sample Preparation System). Each
catalyst sample was then analysed in triplicate for the amount of nickel. The nickel wavelength
that was used was 221.648 mm.
2.3.2. Brunauer-Emmett-Teller (BET) surface area and pore volume analysis
[5]
BET-surface area and pore volume measurements of the calcined catalysts samples (~0.05 g)
were recorded on a Micromeritics Gemini instrument. Before the analysis, samples were
degassed at 200 °C for 8 h with a constant nitrogen flow to remove all adsorbed moisture from
the catalyst precursor surface and pores. Helium gas was used as an absorbate. All the samples
were done in triplicate.

28
2.3.3. X-ray diffraction (XRD)
The X-ray diffractograms of the calcined catalyst samples and spent catalysts were collected
using a Bruker D8 Advance instrument. In-situ XRD measurements were obtained on the Bruker
D8 Advance instrument using an Anton Parr XRK 900 reaction cell.
2.3.3.1. Powder X-ray diffraction (XRD)
Powder XRD of the calcined catalysts precursors was mainly done in order to identify the
crystalline phases present and also to observe the crystallinity of the samples. The average
crystallite size was also calculated by using the Scherrer equation [6]. Instrument settings were
as follows:
Instrument : Bruker D8 Advance
High voltage : 40 kV
Tube current : 40 mA
Divergence : 1 °
Anti-scatter : 2 °
Scan from : 10 ° 2θ
Scan to : 90 ° 2θ
Soller slits : 0.05
Scanning : Continuous
Duration of scan : 32 minute
Radiation source : Copper
Wavelength : 1.5406 nm

29
2.3.3.2. In-situ XRD
In-situ XRD under hydrogen flow was mainly performed in order to observe the possible phase
changes that might take place on catalysts as the temperature is increased. The experimental
conditions for in-situ reduction of the calcined catalysts precursor samples were as follows:
Atmosphere : H2/N2 mixture (volume ratio, 5:95)
Flow rate : 30 mL/min
Heating ramp : 0.2 °C/min
Activation : Sample was heated up to 100 °C
H2/N2 (volume ratio, 5:95) was allowed to flow at 100 kPa
pressure.
The temperature was ramped in 50 °C increments and at each
ramp a scan from 10 ° 2θ to 90 ° 2θ was taken.
2.3.4. Scanning electron microscopy (SEM) and energy dispersion X-ray
spectroscopy (EDX)
Scanning electron microscopy images of the fresh and spent catalysts were recorded on a Jeol
JSM – 6100 scanning microscope and analysed with Espirit 1.8.5 software. Before the analysis,
samples were grinded into fine powders followed by coating them with carbon “to reduce
charging and improve the secondary electron signals for imaging” [5]. Energy dispersion X-ray
spectroscopy was also performed to obtain the elemental analysis of the selected area.

30
2.3.5. Transmission electron microscopy (TEM)
Transmission electron microscopy observations of the fresh and spent catalysts were performed
using a Jeol Jem-1010 transmission electron microscope equipped with a Mega View 111 Soft
Imaging System. Preparation of samples for TEM analyses included grinding of samples into
fine powders followed by suspending them onto copper grids.
2.3.6. Temperature programmed reduction (TPR)
Hydrogen temperature programmed reduction (H2-TPR) profiles were obtained on a
Micromeritics Autochem II Chemisorption Analyzer interfaced with a computer. The sample of
ca. 50 mg was placed in a U shaped tube and the H2-TPR profiles were obtained by heating a
sample to 1000 °C at 10 °C/min in the presence 5 % H2/Ar flowing at 30 mL/min.
2.3.7. Temperature programmed desorption (TPD)
Temperature programmed desorption involved two steps; firstly the catalysts samples (ca. 50
mg) were reduced at 500 °C for 1 h under a flow of 5 % H2/Ar followed by the actual TPD
analysis. The probe molecule for TPD analysis was ammonia (NH3), hence the analysis is
abbreviated NH3-TPD. NH3-TPD analysis was performed on Micromeritics Autochem II
Chemisorption Analyzer. The sample was heated in a flow (30 mL/min) of 4 % NH3/He at a
heating rate of 10 °C/min to 600 °C and kept at this temperature for 45 min. The sample was
cooled to 100 °C under the same ammonia mixture. The NH3-TPD profiles were obtained using
He (30 mL/min) as a carrier gas and heating the sample to 1000 °C at 10 °C/min.

31
2.4. Experimental reactor set-up
A continuous flow fixed bed reactor was constructed for the purpose of this project. The
experimental set-up is shown in Fig. 2.1. Stainless steel tubing (¼ th
inch) and Swagelok fittings
were used for the reactor set-up. Hydrogen and nitrogen were used as gas feeds, whereas a
mixture of octanal and octanol was used as the liquid feed. The gas output from hydrogen and
nitrogen cylinders was set and maintained at 60 bar using Afrox pressure regulators. Brook‟s
mass flow controllers were used to deliver the desired flow rate of each gas as required. The non
return valves after the mass flow controllers and HPLC pump were there to ensure that the gas
feed together with the liquid feed only flow in the direction towards the reactor tube. The liquid
feed which rest on the electronic balance was pumped towards the reactor tube using the HPLC
pump. Just before the reactor inlet fitting there is a pressure indicator which records the pressure
inside the reactor. The stainless steel reactor tube which was 26 cm long and 2 cm wide (inner
diameter) was housed inside the stainless steel reactor block which was about 4 cm thick. A
copper o-ring sealed the connections at both the inlet and outlet points of the reactor. After the
reactor outlet point the products were filtered by a 2 micron filter which only allows fluid to pass
through it. The liquid products were collected in the catch pot and the outlet gas was measured
by a Ritter drum type wet gas flow meter. The pressure inside the system was regulated by a back
pressure regulator.

32
Figure 2.1. Experimental set-up: PC – pressure controller regulator, FC – flow controller, PI – pressure indicator, TIC –
temperature indicator controller, F – filter, BPR – back pressure regulator, GM – wet gas meter, W – electronic balance.
33
A diagram of the reactor loaded with catalyst can be viewed in Figure A1 (Appendix A). The
reactor tube is sealed at both ends by copper o-rings. Inside the reactor tube there is a thermowell
with a thermocouple and it is connected to a temperature display unit which reads out the
temperature inside the reactor tube. The ceramic heating band was used to heat the reactor and
the temperature of the ceramic band was controlled by a thermocouple connected to a
temperature indicator control unit. A thermocouple was placed between reactor block and the
ceramic heating band. Carborandum was packed on either side of the catalyst. The carborandum
above the catalyst further mixed the feed reactants before they came into contact with the
catalyst. Carborandum also made sure that the feed stream was well heated before it reached the
catalytic zone in the reactor. Glass wool was packed at the ends of the reactor tube and between
the catalyst and carborandum. Glass wool and carborandum below the catalyst were there to stop
any catalyst pellets from entering the product stream.
The analysis of the products was performed on a gas chromatogram (GC) equipped with a flame
ionisation detector (FID). The details and conditions of the GC were as follows:
Instrument : Perkin Elmer Clarus 500 Gas Chromatograph
Carrier gas : Hydrogen
Column : Elite-Petro, 50 m x 0.2 mm x 0.5 µm film thickness
Injection temperature : 250 °C
Injection volume : 1 µL
Split : 100:1
Oven : [40 °C (5 min) 3 °C/min to 240 °C (20 min)]
Some species present on the product stream were identified by using gas chromatography – mass
spectrometry (GC-MS) (Clarus 500 Gas Chromatograph Clarus 560 S Mass Spectrometer) and
the scanning range was 30 to 350 amu.
.

34
2.5. Catalytic conditions and testing
Calcined catalysts were crushed, pelletized and sieved to a mesh size range 300 to 600 µm.
Catalysts pellets were then mixed with an equal amount of carborandum, 4 mL of each, and
loaded in the reactor tube. Two types of feed were analysed:
(1) 7.4 wt.% octanal in octanol
(2) 7.4 wt.% octanal in octanol spiked with water (2.3 wt.%).
From now onwards feed (1) will be referred to as the model feed and feed (2) will be referred to
as the water feed.
Air calcined catalysts have the inactive form of nickel which is Ni2+
(NiO), and that is why it is
necessary to activate the catalysts by reducing them in-situ before the actual hydrogenation
process. The steps that were taken to activate the catalysts are outlined below:
Atmosphere : Nitrogen (purity: 99 %) and hydrogen (purity: 99 %)
Flow rate : 30 mL/min
Pressure : Atmospheric pressure
Activation protocol : Under nitrogen atmosphere
Increase temperature to 200 °C
9 h at 200 °C
Cool down to 120 °C
Blend in hydrogen over time
Under hydrogen atmosphere
Increase temperature to 430 °C
9 h at 430 °C

35
After the in-situ reduction process the temperature of the reactor was decreased to the reaction
temperature, the pressure increased to 50 bar and the gas hourly space velocity (GHSV) kept at
380 h-1
. Analysis of the products was done after the reaction had assumed steady state. The
octanal conversion was calculated as shown in equation 1.
- Equation 1
The selectivities of the products were calculated from peak areas by considering the different
sensitivity factors in the flame ionization detector. The selectivity of the product i is defined as
(Eqn.2):
Equation 2

36
2.6. References
1. S. Narayanan, R. Unnikrishnan, V. Vishwanathan, Appl. Catal. A 129 (1995) 9.
2. G. Li, L. Hu, J. M. Hill, Appl. Catal. A: Gen. 301 (2006) 16.
3. A. Saadi, Z. Rassol, M.M. Bettahar, J. Mol. Catal. A: Chem 164 (2000) 205.
4. P. Castano, B. Pawelec, J.L.G. Fierro, J.M. Arandes, J. Bilbao, Fuel 86 (2007) 2262.
5. D. Ferdous, A.K. Dalai, J. Adjaye, Appl. Catal. A: Gen. 260 (2004) 137.
6. V. Uvarov, I. Popov, Materials Characterization 58 (2007) 883.

37
CHAPTER 3
Catalysts Characterisation
3.1. BET-surface area and ICP-OES analysis
The nickel composition, surface area (SBET) and adsorption total pore volume (Vpore) of calcined
supports and catalysts are summarized in Table 3.1. The surface area and pore volume of the γ-
alumina support were found to be 174 m2/g and 0.536 cm
3/g, respectively. These results were in
an acceptable range since Trueba and Trasatti concluded that the γ-alumina treated at thermal
temperatures above 450 °C usually possesses a surface area that is below 250 m2/g and a pore
volume around 0.5 cm3/g [1,2]. The silica support had a surface area and pore volume of 149
m2/g and 0.636 cm
3/g, respectively.
Table 3.1. Nickel composition and textural properties of the catalysts’ supports and
calcined catalysts
Material Nia / Wt.% SBET
b / m
2/g Vpore
c / cm
3/g dNiO
d / nm α
e / %
γ-Al2O3 - 174 0.536 - -
SiO2 - 149 0.636 - -
Ni/Al2O3 29.6 126 0.326 3.2 73.0
Ni/SiO2 28.2 79 0.322 4.1 84.5
Ni/ZnO 29.3 23 0.197 3.3 80.0
a As determined by ICP-OES chemical analysis.
b BET surface area.
c Adsorption total pore volume (Vpore) at P/Po: 0.99.
d NiO crystal size as determined from X-ray line broadening of a calcined catalyst.
e Degree of reducibility determined by H2-TPR.
From Table 3.1, it was also observed that the surface areas and pore volumes of the catalysts‟
supports decreased significantly with the impregnation of nickel. This demonstrated that the
38
impregnated nickel occupies the surface area that was previously occupied by hydroxyl groups
before the impregnation process [3]. Another reason for the decrease in both porosity and surface
area was the blockage of pores by nickel metal.
The zinc oxide supported catalyst had both the lowest surface area (23 m2/g) and pore volume
(0.197 cm3/g) when compared to the Ni/Al2O3 and Ni/SiO2 catalysts. The alumina supported
catalyst had the highest surface area (126 m2/g) and pore volume (0.326 cm
3/g). The actual
nickel concentration values are also tabulated in Table 3.1. and as it can be seen there are very
close to the targeted value of 30 wt.%.
3.2. Characterization of the Ni/Al2O3 catalyst
3.2.1. XRD analysis
X-ray analysis was done in order to detect different crystalline species that may be present in the
catalyst and also to observe the crystallinity of the catalyst as a whole. The X-ray diffractogram
of Ni/Al2O3 is presented in Fig. 3.1. The diffractogram revealed the characteristics peaks of both
NiO (bunsenite) and Al2O3 (γ-Al2O3) phases (JCPDS 4-0835 and 10-425) [4]. Although the
majority of the peaks were clearly resolved, NiO and Al2O3 peaks appearing at 2θ angles around
37 ° and 43 ° were overlapping with each other which resulted in NiO peaks having shoulder
peaks of Al2O3.

39
Figure 3.1. Powder X-ray diffractogram of the Ni/Al2O3 catalyst.
The intensity and resolution of the peaks also reveals that the catalyst is crystalline in nature.
Table 3.2. presents the actual XRD Bragg‟s angles and d-spacings of the detected crystalline
phases which were comparable to the literature data (JCPDS files: 4-0835 and 10-425) [4].
Table 3.2. XRD Bragg’s angles and d-spacings of detected species
Specie 2θ / ° d-spacing / Å
NiO
37.18 2.41
43.28 2.10
62.82 1.48
75.41 1.26
79.36 1.21
Al2O3
37.18 2.41
45.36 1.99
66.71 1.40

40
Table 3.1. presents the average NiO crystallite size of all the catalysts and for the Ni/Al2O3
catalyst it was found to be 3.2 nm. The NiO crystallite size was calculated from line broadening
XRD patterns of the most intense 2θ line of 43.28 ° using Scherrer‟s equation.
Scherrer‟s equation : L = (C x λ) / (B x cosθ)
Where : L = crystallite size (nm)
C = crystal shape factor ≡ 0.89
λ = wavelength (Å)
B = FWHM (full width half maximum) (radians)
θ = Bragg‟s angle
3.2.2. Scanning electron microscopy and electron dispersive analysis
SEM images were used to study the surface morphology of the catalysts. Fig. 3.2. presents the
SEM images of the Ni/Al2O3 catalyst. From Fig. 3.2. (a) it can be observed that the surface of the
catalyst is very rough and also had irregular shaped particles (Appendix B. Fig. B1). Fig. 3.2. (b)
is an electron mapping image of the Ni/Al2O3 catalyst and it was observed that impregnated
nickel particles (green colour) were distributed evenly across the support (red colour) and they
seemed to form a layer around alumina particles.

41
Figure 3.2. SEM images of the Ni/Al2O3 catalyst: (a) bright field and (b) electron mapping
images (scale: 30 µm).
Table 3.3. summarizes the elemental composition obtained from the EDX analysis and, as it was
expected, the elemental composition of nickel differed from that obtained using the ICP analysis.
EDX results are based on elemental analysis of a localised selected catalyst area, whereas results
from the ICP-OES are based on the bulk composition of the catalyst and that is why results from
these two techniques differ. With regards to the present study, EDX analysis was mainly used for
qualitative purposes, since it has limitations when it comes to quantitative analysis. Fig. B2
(Apendix B) is the electron mapping graph of Ni/Al2O3 catalyst and, as it was expected, it shows
the presence of nickel, aluminium and oxygen.
Table 3.3. Quantitative EDX data for the Ni/Al2O3 catalyst
Element Concentration / wt. %
Nickel 36.5
Aluminium 33.6
Oxygen 29.9

42
3.2.3. Transmission electron microscopy
Fig. 3.3. presents the TEM image of a Ni/Al2O3 catalyst. From the image it can be observed that
the interface between the nickel particles (dark spots) and alumina support is not well defined,
however, it can be seen that the dispersion of nickel across the support was uniform. The
measured nickel particle sizes had a narrow range of 3 – 6 nm. The measured nickel particle
sizes obtained from the XRD analysis (3.2 nm) were in agreement with these TEM observed
particle sizes.
Figure 3.3. TEM image of the Ni/Al2O3 catalyst.
Fig. B3 (Apendix B) shows the electron diffraction image of the Ni/Al2O3 catalyst. The bright
spots forming diffraction rings revealed that the catalyst was polycrystalline and this was in
agreement with the XRD analysis of the material (Fig. 3.1.), since phases of NiO and Al2O3 were
clearly defined.

43
3.2.4. Hydrogen - temperature programmed reduction
Hydrogen-temperature programmed reduction was done in order to determine the nature of
different oxide species present on the calcined catalysts‟ surfaces and also to study the
reducibility of the catalysts. After the catalysts precursors had been calcined, nickel oxide (NiO)
phases formed on the surfaces of the catalysts, but in most hydrogenation reactions only the
metallic nickel (Ni0) form is active. The reduction of NiO to Ni
0 is usually carried out using
hydrogen and this reaction is irreversible in the temperature range of 0 – 1000 °C (Eqn. 1) [5].
NiO + H2 → Ni0 + H2O (1)
The H2-TPR profile of Ni/Al2O3 together with Gaussian deconvolution lines is shown in Fig. 3.4.
From literature it is a well known that the reduction of bulk NiO takes place at ca. 380 °C [6]
“and that the Ni2+
species are reduced without the formation of intermediate oxides” [7].
Therefore, the peaks observed after Gaussian deconvolution of the TPR profiles of the catalysts
reveal the presence of Ni0 species in different environments [7].
Figure 3.4. Hydrogen – temperature programmed reduction profile of the Ni/Al2O3
catalyst.

44
The H2-TPR profile revealed four reduction maxima (original trace) which were deconvoluted
into four peaks (peak 1 – 4). The reduction peak at 430 °C represents the reduction of a
segregated NiO having a small interaction with the support, whereas the peak at 490 °C
represents the reduction of NiO forming a solid solution with alumina. The peak at 685 °C
represents the reduction of NiO having a strong interaction with the support and the peak at 770
°C corresponds to the reduction of nickel aluminate [6].
The reduction degree of the catalysts was determined by comparing the theoretical hydrogen
consumption to the actual hydrogen consumption. The reduction degree of the Ni/Al2O3 catalyst
was estimated to be 73.0 %.
3.2.5. In-situ XRD reduction of the Ni/Al2O3 catalyst.
In-situ XRD reduction studies were performed in order to investigate the possibility of phase
changes as the catalyst sample was heated from 100 °C to 600 °C under hydrogen atmosphere.
Fig. 3.5. shows the results of the in-situ reduction of the Ni/Al2O3 catalyst. What was observed
from these in-situ reduction studies was that at temperatures from 100 °C to 300 °C only peaks
indicating the presence of nickel oxide (NiO) and alumina (Al2O3) were seen (JCPDS 4-0835
and 10-425) [4]. The onset of metallic nickel peaks was observed at 350 °C, and from this
temperature onwards there was a steady decline in the intensity of NiO peaks and this continued
up to around 500 °C (JCPDS 4-0850) [4]. In the temperature range of 500 °C to 600 °C there
were no NiO peaks observed and only peaks attributed Ni0 and Al2O3 were observed. Cooling
down to 100 °C under H2 did not cause any phase change.

45
Figure 3.5. XRD patterns obtained during the in-situ reduction of the Ni/Al2O3 catalyst.
3.2.6. NH3-temperature programmed desorption of the Ni/Al2O3 catalyst
The acidic strength of the catalyst was investigated using temperature programmed desorption.
The Lewis base NH3 was used as a probe molecule. The strength of an acidic site is related to the
desorption temperature. Peaks appearing at low, medium and high temperature regions
correspond to weak, medium and strong acidic sites, respectively [7]. TPD profiles are often
divided into three regions: Tdes < 300 °C, 300 °C < Tdes < 450 °C, Tdes > 450 °C which represents
weak, medium and strong acidic sites, respectively [7].
Fig. 3.6. presents the NH3 – TPD profile and Gaussian deconvolution lines for the Ni/Al2O3
catalyst. Two NH3 desorption maxima were observed at 290 °C and 710 °C corresponding to
weak-intermediate and strong acidic sites, respectively. Two acidic site regions were expected
from an alumina supported catalyst since alumina is amphoteric in nature.

46
Figure 3.6. NH3-TPD of a Ni/Al2O3 catalyst.
The calculated acidity of the Ni/Al2O3 catalyst is given in Table 3.4. and it was noted that the
amount of weak-intermediate acidic sites is greater than that of strong acidic sites. When the
NH3-TPD of the Ni/Al2O3 catalyst was compared to that of the alumina support (Fig B4,
Appendix B) it was noted that the amount of weak-intermediate acidic sites increased with the
incorporation of nickel into the support. Therefore, it is appropriate to attribute the weak-
intermediate acidic regions to the Lewis acidity of nickel [7].
Table 3.4. Acidity of the catalysts
Catalyst Acidity / µmol NH3/gcat
Peak 1a Peak 2
a Total
Ni/Al2O3 37.5 (290 °C) 10.5 (710 °C) 48.0
Ni/SiO2 3.7 (405 °C) - 3.7
Ni/ZnO 7.6 (756 °C) - 7.6
a The temperature of the desorption peak is given in parentheses.

47
3.3. Characterization of the Ni/SiO2 catalyst
3.3.1. XRD analysis
Fig. 3.7. presents the diffractogram of the Ni/SiO2 catalyst and only peaks attributed to NiO
(bunsenite) phases were observed (JCPDS 4-0835) [4]. From literature, silica is known to
normally exist “in any of the three crystallographic forms namely; cristobalite, quartz and
tridymite” [8]. No crystalline silica phases were observed in the diffractogram. The very broad
peak around 2θ = 20 ° further confirm the amorphous nature of silica support [9].
Figure 3.7. Powder XRD of a Ni/SiO2 catalyst
The intensity and the sharpness of the NiO peaks further demonstrated that the NiO phases were
crystalline. Table 3.5. gives the actual XRD Bragg‟s angle and d-spacing values of the observed
NiO crystalline phases. The NiO crystallite size calculated from the 2θ line of 43.18 ° using
Scherrer‟s equation was 4.1 nm.

48
Table 3.5. XRD Bragg’s angle and d-spacing of detected NiO phases.
2θ / ° d-spacing / Å
37.16 2.40
43.18 2.10
62.82 1.48
75.41 1.26
79.37 1.21
3.3.2. Scanning electron microscopy and electron dispersive analysis
Fig. 3.8. presents the SEM images of the Ni/SiO2 catalyst and from Fig. 3.8. (a) it was observed
that the surface of the catalyst was rough. Fig. 3.8. (b) revealed that nickel (green colour) was
fairly evenly distributed over the silica (red colour) support, while Fig. B5 (Appendix B)
demonstrated further that nickel was distributed evenly across the support.
Figure 3.8. SEM images of the Ni/SiO2 catalyst: (a) bright field and (b) electron mapping
images (scale: 20 µm).

49
Fig. B6 (Appendix B) is the electron mapping graph obtained from the Ni/SiO2 catalyst and it
revealed the presence of nickel, silicon and oxygen. The amount of nickel (27.0 wt. %) estimated
from the EDX analysis was comparable to the actual value determined from the ICP-OES.
Table 3.6. Quantitative EDX data for a Ni/SiO2 catalyst
Element Concentration / wt. %
Nickel 27.0
Silicon 43.6
Oxygen 29.4
3.3.3. Transmission electron microscopy
Fig. 3.9. presents the TEM image of the Ni/SiO2 catalyst with an electron diffraction inset. The
measured nickel particle sizes were grouped into two ranges; 4 – 9 nm and 0.04 – 0.1 µm, the
former particle size range was comparable to the 4.1 nm obtained from the XRD analysis. The
thermal treatment (calcination step) during the preparation of the catalyst is a plausible
explanation of why some nickel particles agglomerated into forming larger particles. The bright
spots forming diffraction rings show that the catalyst is also crystalline and this is in accordance
with the results obtained from the XRD analysis which showed the presence of crystalline NiO
phases.
3.3.4. Hydrogen - temperature programmed reduction
The H2-TPR profile of the Ni/SiO2 catalyst, together with the Gaussian deconvolution lines, is
presented in Fig. 3.10. From the original trace of the H2-TPR two reduction maxima peaks were
observed, thus revealing the presence of NiO in different environments. The major reduction
peak at 475 °C represents the reduction of NiO that has weak interactions with the silica support,
whereas the minor peak at 610 °C corresponds to the reduction of NiO that has strong
interactions with the support [6].

50
Figure 3.9. TEM image of the Ni/SiO2 catalyst with an electron diffraction inset.
Figure 3.10. Hydrogen – temperature programmed reduction profile of the Ni/SiO2
catalyst.

51
3.3.5. In-situ reduction of a Ni/SiO2 catalyst.
Fig. 3.11. shows the XRD patterns during the in-situ reduction of the Ni/SiO2 catalyst. Only
peaks attributed to NiO were observed from a temperature range of 100 °C to 250 °C signifying
that in this temperature range no reduction of NiO to metallic nickel occurred. The onset of Ni0
peaks was observed at 300 °C and the intensity of these peaks increased with an increase in
temperature, thereby indicating that the amount of NiO species reduced to Ni0 increased with an
increase in temperature. There were no NiO peaks observed in the temperature range of 400 –
600 °C, signifying that all the NiO species had been reduced to Ni0 and cooling from 600 to 100
°C under H2 did not induce any phase changes.
Figure 3.11. XRD patterns obtained during the in-situ reduction of the Ni/SiO2 catalyst.

52
3.3.6. NH3-temperature programmed desorption
The NH3-TPD profile is presented in Fig. 3.12. and one pronounced ammonia desorption peak
was observed at 405 °C signifying the presence of intermediate strength acidic sites. “Since silica
is a neural oxide, there are no strong Brønsted or Lewis acid-base sites on the surface” [8],
therefore the intermediate acidic sites observed at 405 °C are related to the nickel metal
impregnated on the support [7]. The total acidity of the Ni/SiO2 catalyst was calculated to be 3.7
µmol NH3/gcat (Table 3.4).
Figure 3.12. NH3-TPD of the Ni/SiO2 catalyst.

53
3.4. Characterization of the Ni/ZnO catalyst
3.4.1. XRD analysis
The powder X-ray diffraction of the Ni/ZnO catalyst is presented in Fig. 3.13. and peaks
attributed to NiO (bunsenite) and ZnO (zincite) were observed (JCPDS 4-0835 and 5-0664) [4].
The high intensity and good resolution of the peaks showed further that the Ni/ZnO catalyst was
highly crystalline and this resulted in a catalyst having the low surface area (Table 3.1.). The NiO
crystallite size calculated from the 2θ line of 43.18 ° using Scherrer‟s equation was 3.3 nm. The
actual XRD Bragg‟s angles and d-spacings of the detected NiO and ZnO phases are listed in
Table 3.7.
Figure 3.13. Powder XRD of the NiO/ZnO catalyst.

54
Table 3.7. XRD Bragg’s angles and d-spacings of detected NiO and ZnO phases.
Specie 2θ / ° d-spacing / Å
NiO
37.05 2.42
43.02 2.10
75.07 1.26
79.03 1.21
ZnO
31.66 2.82
34.33 2.61
36.14 2.48
47.43 1.91
56.52 1.63
62.68 1.48
66.31 1.41
67.87 1.38
69.04 1.35
76.96 1.24
79.03 1.21
89.54 1.09
3.4.2. Scanning electron microscopy and electron dispersive analysis
Fig. 3.14. presents the SEM images of the Ni/ZnO catalyst and from Fig. 3.14. (a) it was
observed that the surface of the catalyst was rough. The grains of a catalyst were of different
sizes and they were also irregular in shape. The electron mapping images (Fig. 3.14. (b) and Fig.
B7, Appendix B) also showed that the nickel (green colour) was distributed uniformly across the
zinc oxide (red colour) support.

55
Figure 3.14. SEM images of the Ni/ZnO catalyst: (a) bright field and (b) electron mapping
images (scale: 10 µm).
The electron mapping graph (Fig. B8, Appendix B) also confirmed the presence of nickel, zinc
and oxygen in the catalyst. The amount of nickel (30.7 wt. %) estimated from the EDX analysis
was comparable to the amount (29.3 wt. %) obtained from the ICP-OES.
3.4.3. Transmission electron microscopy
The TEM image of the Ni/ZnO catalyst is presented in Fig. 3.15. and nickel particles appeared to
be either elongated and round in shape with relatively well define interfaces. The measured
nickel particle sizes were in a range of 10 – 30 nm. The TEM observed particle sizes were higher
than those obtained from the XRD analysis (3.3 nm) and this was because XRD measurements
are based on crystallite sizes whereas TEM results were for particles. A particle may be made of
several crystallites and this will often results in TEM based results being higher than the XRD
results. The electron diffraction image of the Ni/ZnO had bright spots forming diffraction rings,
thereby indicating that the catalyst is indeed crystalline and this is in agreement with the XRD
analysis, since phases of NiO and ZnO were clearly defined.

56
Figure 3.15. TEM image of the Ni/ZnO catalyst with an electron diffraction image (Scale:
100 nm).
3.4.4. Hydrogen - temperature programmed reduction
The H2-TPR profile of the Ni/ZnO, together with the Gaussian deconvolution lines, is presented
in Fig. 3.16. and three reduction peaks were noted indicating that three forms of NiO were
present. The reduction peak at 474 °C represents the reduction of NiO that has weak interactions
with the zinc oxide support, whereas the reduction peak at 530 °C corresponds to the reduction
of NiO that has strong interactions with the support. The reduction of nickel that had been
incorporated into the support was shown by the peak at 670 °C.

57
Figure 3.16. Hydrogen – temperature programmed reduction profile of the Ni/ZnO
catalyst.
3.4.5. In-situ reduction of the Ni/ZnO catalyst
The XRD patterns obtained during the in-situ reduction of the Ni/ZnO catalyst is presented in
Fig. 3.17. and only peaks attributed to NiO and ZnO were observed in the temperature range of
100 °C to 300 °C. The metallic nickel peaks (2θ = 44.39 °, 51.77 ° and 76.31 °) started appearing
at 350 °C and their intensity increased with an increase in temperature. At 450 °C there were no
peaks attributed to NiO species. Cooling down to 100 °C under H2 did not result in any phase
changes.
3.4.6. NH3-temperature programmed desorption of the Ni/ZnO catalyst
Fig. 3.18. presents the NH3-TPD of the Ni/ZnO catalyst and only one NH3 desorption peak was
observed. The peak maximum was at 756 °C thereby signifying the presence of strong acidic
sites. The total acidity of the catalyst was estimated to be 7.6 µmol NH3/gcat.

58
Figure 3.17. XRD patterns obtained during the in-situ reduction of the Ni/ZnO catalyst.
Figure 3.18. NH3-TPD of the Ni/ZnO catalyst.
59
3.5. Conclusions
Generally, the synthesized catalysts were all crystalline in nature and the zinc oxide supported
catalyst was observed to be the most crystalline of the three catalysts. The XRD analysis of the
Ni/Al2O3 and Ni/ZnO catalysts showed the crystalline phases of both NiO and support material,
whereas the analysis of the Ni/SiO2 catalyst confirmed only the presence of NiO as the
crystalline phase. The crystallite sizes (NiO) of the Ni/Al2O3 and Ni/SiO2 catalysts estimated
from the Scherrer‟s equation were comparable to the nickel particle sizes observed from the
TEM images.
The surface area of the catalysts decreased in the following trend: Ni/Al2O3 > Ni/SiO2 > Ni/ZnO.
It was also observed that the surface area of the catalysts increased with an increase in catalyst
porosity. For example, the ZnO supported catalyst had the lowest pore volume and was the most
crystalline which led to it having the lowest surface area.
The ease at which NiO was reduced differed from one catalyst to the next. This was mainly
affected by the intensity of the interactions that NiO had with the support material. The TPR
profiles of the zinc oxide and alumina supported catalysts revealed that these catalysts had nickel
species in different environments. Some nickel species were in an environment where they
experienced strong interactions with the support material and hence higher temperatures were
necessary to reduce them. The TPR profile of the Ni/SiO2 catalyst showed that the majority of
the nickel species that are present in the catalyst experience weak interactions with the support
and, as a result, milder temperature conditions are required to reduce it compared to the Ni/ZnO
and Ni/Al2O3 catalysts. Based on the TPR and in-situ reduction studies it was observed that the
intensity of the nickel-support interactions decreased in the following sequence: Ni/Al2O3 >
Ni/ZnO > Ni/SiO2.
The NH3-TPD profile of the Ni/Al2O3 catalyst showed two regions of acidic sites, namely, weak-
intermediate and strong acidic sites, whereas the NH3-TPD profiles of the Ni/SiO2 and Ni/ZnO
catalysts showed the presence of intermediate and strong acidic sites, respectively. The total

60
acidity of the catalysts measured in µmol NH3/gcatalyst decreased in the following order: Ni/Al2O3
> Ni/ZnO > Ni/SiO2. The silica supported catalyst had the lowest acidity when compared to the
other catalysts and this was because the silica support alone is a neutral material and hence the
acidity that was observed was induced by nickel species. The most acidic catalyst amongst the
three studied was the Ni/Al2O3 catalyst and this was because the alumina support alone was
acidic and hence the observed total acidity was induced by both alumina and nickel species.

61
3.6. References
1. M. Trueba, S.P. Trasatti, Eur. J. Inorg. Chem. (2005) 3393.
2. G. Li, L. Hu, J. M. Hill, Appl. Catal. A: Gen. 301 (2006) 16.
3. A. Saadi, R. Merabti, Z. Rassol, M.M. Bettahar, J. Mol. Catal. A: Chem 253 (2006) 79.
4. JCPDS: International Center for Diffraction Data, Mineral Powder Diffraction File:
Search Manual, Swarthmore, PA, U.S.A., 1980.
5. J.T. Richardson, R.M. Scates, M.T. Twigg, Appl. Catal. A: Gen. 267 (2004) 35.
6. A.C.S.C. Teixeira, R. Giudici, Chem. Eng. J. 54 (1999) 3609.
7. P. Castano, B. Pawelec, J.L.G. Fierro, J.M. Arandes, J. Bilbao, Fuel 86 (2007) 2262.
8. B.M. Reddy, G.K. Reddy, K.N. Rao, A. Khan, I. Ganesh, J. Mol. Catal. A: Chem. 265
(2007) 276.
9. X. Ying-Mei, Q. Ji, H. De-Min, W. Dong-Mei, C. Hui-Ying, G. Jun, Z. Qiu-Min, Oil
Shale 27 (2010) 37.

62
CHAPTER 4
Results and Discussion: Catalytic Testing and
Characterization of Used Catalysts
4.1. Reaction network for the hydrogenation of octanal
Scheme 4.1. presents possible side reactions that can take place during the hydrogenation of
octanal to octanol. Wang et al. [1] did work on the hydrogenation of propanal using a Ni-Mo
based catalyst and the reaction network presented in Scheme 4.1. is an adaptation of their
findings under the assumption of that linear aldehydes will result in a similar reaction network.
During the catalytic hydrogenation process, it is commonly believed that Ni supplies the active
sites for hydrogenation and that Al2O3 and SiO2 play the role of the support.
The hydrogenation of octanal (A) to octanol (B) is the main reaction and it is catalysed by
“coordinatively unsaturated sites, that is, anionic vacancies associated with Ni centres” [1]. For
this study octanol was the targeted product, but a network of secondary or side reactions were
possible as it can be seen from Scheme 4.1. Octanal (A) can react with another octanal to form a
C16 aldol compound (H, 2-hexyl-3-hydroxydecanal), which can be hydrogenated further to form
a C16 diol (I, 2-hexyl-1,3-decanediol) compound or lose water to form a C16 unsaturated
aldehyde (J, 2-hexyl-2-decenal). Because the system is saturated with hydrogen, the C16
unsaturated aldehyde will hydrogenate further to a C16 saturated aldehyde (K, 2-hexyldecanal)
which can also be hydrogenated to a C16 saturated primary alcohol (L, 2-hexyl-1-decanol). The
C16 saturated aldehyde (K) can react with octanal followed by dehydration to yield C24 esters.

63
H
O
H
OH
OH2
-H2O
H
OH
H
O
- H2O
H
O
O-H2
O
O
O
O
H
OH
-H2O -
H
O
O
O
H
O
+ H2
H
OH
H
O
-H2O
OH
-H2O
H
O
O
O
+
(A) (B)(C)
OH
(E)
(F)(G)
(J) (L)
(M)
(N)
H
OHOH
(H)
H2
(I) (K)
H
OH
-H2O
+H2
+ CO
+ H
O
Scheme 4.1. Reaction network for the hydrogenation of octanal [1].

64
The octanol that is formed from the main reaction can also undergo reaction with octanal to form
a C16 hemiacetal (E), which can react quickly with octanol followed by the elimination of water
to form the C24 acetal (F). The C24 acetal can undergo dehydration and a loss of an alcohol
molecule to yield the dioctyl ether (G). The C16 acetal can also lose a hydrogen molecule to
form octyl octanoate. Octanal (A) can also undergo decarbonylation to form heptane (D) and
carbon monoxide. Other reactions that are possible, but not included in the Scheme, are the
hydrogenation of dioctyl ether to form octane and octanol and also the hydrogenation of the C16
saturated primary alcohol to yield a C15 paraffin molecule.
Although all the above mentioned reactions are mechanistically possible, the choice of a catalyst
support is very important since other reactions are favoured by the type of support that was used.
4.2. The influence of octanal/hydrogen ratio and temperature on the
conversion and selectivity of the Ni/Al2O3 catalyst.
The effect of temperature on the catalytic hydrogenation of octanal (model feed: 7.4 wt.% of
octanal in octanol) to octanol over the alumina supported catalyst was investigated and the
results of this study are presented in Figure 4.1. It was observed that the conversion of octanal
increases with an increase in reaction temperature e.g. at 90 °C the conversion was at 81 % and
at 130 °C it was at 94 %. The selectivity showed a marginal increase when the temperature was
increased from 90 °C (selectivity = 93 %) to 130 °C (96 %).

65
Figure 4.1. Effect of temperature on octanal hydrogenation performance over a Ni/Al2O3
catalyst (Reaction conditions: 50 bar, Catalyst volume = 4 mL, GHSV = 279.8 h-1
and
LHSV = 23.6 h-1
).
The effect of different octanal/H2 molar ratios on the hydrogenation of octanal was also
investigated and the results are presented in Figure 4.2. The conversion of octanal increased from
85 % to 90 % when the octanal/H2 molar ratio was changed from 1 to 1/1.5 signifying that as the
amount of hydrogen increases in the system the octanal conversion also increases. A small
increase of 1 % was observed when the molar ratio was changed from 1/1.5 to 1/2. It was noted
that in order to achieve high octanal conversion an excess of hydrogen was required. The
selectivity was not affected by the change in octanal/H2 molar ratio.

66
Figure 4.2. Effect of octanal/H2 ratio on octanal hydrogenation performance over a
Ni/Al2O3 catalyst (Reaction conditions: 50 bar, GHSV = 279.8 h-1
, Catalyst volume = 4 mL
and T = 110 °C).
Based on the results obtained above, the reaction conditions for all the catalytic reactions to
follow were as follows; catalyst loaded: 4 mL, temperature: 110 °C, Pressure: 50 bar, GHSV:
279.8 h-1
and LHSV: 23.6 h-1
.
4.3. Catalytic hydrogenation of octanal using the model feed and the
characterization of the used catalysts.
The hydrogenation of octanal was performed over reduced catalysts. The time on stream for all
the reactions was 24 h excluding the time it took for a reaction to reach the steady-state which
was usually 5 h. After the reaction all the used catalysts were characterized by XRD, SEM, TEM,
ICP-OES, BET-surface area and pore volume.

67
4.3.1. Catalytic activity of the Ni/Al2O3 catalyst.
Figure 4.3. shows the catalytic performance of the Ni/Al2O3 catalyst in the hydrogenation of
octanal. A typical GC trace of a run using model feed can be seen in Figure C1 (Appendix C).
The steady state conversion of octanal throughout the reaction was 90 %. From Figure 4.3. and
Table 4.1. it can be observed that the primary product of the reaction which is octanol was
produced at high selectivity (95.6 %) compared to the side products and/or secondary products.
Besides the formation of octanol the reaction conditions favoured the formation of “heavies”
compared to “lights”. In other words, the condensation and dehydration reactions are favoured
over decarbonylation and C-C bond cleavage reactions (Scheme 4.1). Heavies refer to the
products heavier than octanol and lights refer to the products lighter than the octanal.
Figure 4.3. Conversion and selectivity in octanal hydrogenation over the Ni/Al2O3 catalyst
(Reaction conditions: Feed = model feed, 50 bar, GHSV = 279.8 h-1
, LHSV = 23.6 h-1
,
Catalyst volume = 4 mL and T = 110 °C).

68
Table 4.1. Product selectivity of octanal hydrogenation over Ni/Al2O3 catalyst.a
Product Selectivity / %
Lights
Heptane 0.1
Octane 0.1
1-Hexanol 0.02
Heavies
1-Undecanol 0.03
Dioctyl ether 1.2
2-hexyl-1-decanol 0.4
C24 acetal 2.5
Main product Octanol 95.6
a Reaction conditions: Feed = model feed, 50 bar, GHSV = 279.8 h
-1, LHSV = 23.6 h
-1, Catalyst volume = 4 mL and
T = 110 °C.
The major side reaction that was observed was the formation of the C24 acetal (Figure 4.3). The
selectivity of the C24 acetal was constant at 2.5 % with time on stream. The sites for the
formation of C24 acetal were the acidic sites of alumina support [1]. The C24 acetal and dioctyl
ether were the two major side products that were formed, and this demonstrated that the reaction
between octanal and octanol was highly favoured, since mechanistically both these products are
the end result of that reaction (Scheme 4.1).
Another side product that was formed in an appreciable amount was 2-hexyl-1-decanol. This
product was formed via the aldol condensation of the two octanal molecules [1-3]. Scheme 4.2.
presents the mechanism for aldol condensation of octanals over the bifunctional sites of alumina
[1]. The acidic sites on alumina activate the carbonyl group of octanal to produce the positively
charge species (A). The basic sites form the enolate ion (B), which acts as a nucleophile by
attacking the positively charge species (A) [1].

69
R
H
O
+ O
Al
H
(acidic site)
R
H
O H
O
Al
(A)
R
H
O
+ O
Al
H
(basic site)
R
H
O H
O
Al
(B)
R
H
O H
O
Al
(A)
R
H
O H
O
Al
(B)
R
OH
R
H
O
+
O
Al
H
2
-H2O
R
R
H
O
(C)
(D)
R : C6H13
Scheme 4.2. The mechanism for aldol condensation of octanals over bi-functional sites of
alumina [1].

70
4.3.2. Characterization of the used Ni/Al2O3 catalyst.
4.3.2.1. XRD of the used Ni/Al2O3 catalyst.
Figure C2 (Appendix C) presents the diffractogram of the used Ni/Al2O3 catalyst and it was
observed that the catalyst did not undergo any phase change during the hydrogenation reaction.
The calculated nickel crystallite size of the used catalyst was also very close to that of the fresh
catalyst (Table 4.2).
Table 4.2. Comparisons of the nickel crystallite size between the fresh and the used
Ni/Al2O3 catalysts.
Ni crystallite size / nm
Fresh catalyst Used catalyst
3.2 3.4
4.3.2.2. SEM of the used Ni/Al2O3 catalyst.
The SEM images of the used Ni/Al2O3 catalyst are presented in Figure C3 (Appendix C). These
images show that the distribution of nickel across the support was still uniform as it was
observed on the fresh catalyst (Figure 3.2., Chapter 3). No significant morphological changes
were observed on the used catalyst.

71
4.3.2.3. TEM of the used Ni/Al2O3 catalyst.
Figure C4 (Appendix C) shows the TEM of the used Ni/Al2O3 catalyst. The majority of the
nickel particle sizes were in a range of 4 – 8 nm and this range was comparable to the range (3 -6
nm) obtained for the fresh catalyst (Section 3.2.3., Chapter 3). Some large isolated nickel
particles were also noted on the TEM image and they range from 10 to 25 nm.
4.3.2.4. BET surface area and pore volume of the used Ni/Al2O3 catalyst.
Table 4.3. shows the BET surface area and pore volume of the fresh and used catalyst. The
measured values of the surface area and pore volume of the used catalyst were lower than those
of the fresh catalyst. During the catalytic reaction, organic molecules (products and/or reactants)
may adsorb on the surface of the catalyst thereby causing pore blockage, which will eventually
lead to the decrease in both the surface area and pore volume of the catalyst.
Table 4.3. Textural properties of the fresh and used catalysts.
Catalyst Fresh catalyst Used catalyst
SBETa / m
2/g Vpore
b / cm
3/g SBET
a / m
2/g Vpore
b / cm
3/g
Ni/Al2O3 126 0.326 104 0.268
a BET surface area.
b Adsorption total pore volume (Vpore) at P/Po: 0.99.

72
4.3.2.5. ICP-OES measurements of the used Ni/Al2O3 catalyst.
The used catalysts were washed with distilled water, ethanol and acetone three times,
respectively, and then dried at 100 °C in a stream of N2 for 4 h before being analyzed for the
nickel content using ICP-OES. As it can be seen from Table 4.4., the nickel content in both the
catalysts was almost the same and this suggested that there was no leaching of nickel during the
catalytic reaction.
Table 4.4. Nickel content of the fresh and used Ni/Al2O3 catalyst.
Ni content / wt. %
Fresh catalyst Used catalyst
29.6 28.3
4.3.3. Catalytic activity of the Ni/SiO2 catalyst.
Figure 4.4. shows the catalytic performance of the Ni/SiO2 catalyst in the hydrogenation of
octanal to octanol. The total time on stream was 24 h and the average steady state octanal
conversion was 91 %. From Table 4.5. it can be seen that the reaction selectivity towards the
targeted product, octanol, was very high at 99.5 %. Heptane, octane and 1-hexanol were the only
products detected for the lights, while the heavies were represented by 1-undecanol. Since the
hydrogenation of octanal to octanol is catalysed on the nickel centres, it can be concluded that
SiO2 only plays the role of being a support and it is not involve in the product formation.

73
Figure 4.4. Conversion and selectivity to octanol in octanal hydrogenation over the Ni/SiO2
catalyst (Reaction conditions: Feed = model feed, 50 bar, GHSV = 279.8 h-1
, LHSV = 23.6 h-
1, Catalyst volume = 4 mL and T = 110 °C).
Table 4.5. Product selectivity of octanal hydrogenation over Ni/SiO2 catalyst.a
Product Selectivity / %
Lights
Heptane 0.1
Octane 0.2
1-Hexanol 0.01
Heavies 1-Undecanol 0.09
Main product Octanol 99.5
a Reaction conditions: Feed = model feed, 50 bar, GHSV = 279.8 h
-1, LHSV = 23.6 h
-1, Catalyst volume = 4 mL and
T = 110 °C.

74
4.3.4. Characterization of the used Ni/SiO2 catalyst.
4.3.4.1. XRD of the used Ni/SiO2 catalyst.
The diffractogram of the used Ni/SiO2 catalyst is shown in Figure C5 (Appendix C) and it was
observed that the catalyst did not experience any phase change during the hydrogenation
reaction. The diffractogram showed that the catalyst still possess Ni0 and SiO2 species. Table 4.6.
shows the nickel crystallite size of the fresh and used Ni/SiO2 catalysts and it was noted that
there were comparable.
Table 4.6. Comparisons of the nickel crystallite size between the fresh and the used Ni/SiO2
catalysts.
Ni crystallite size / nm
Fresh catalyst Used catalyst
4.1 4.0
4.3.4.2. SEM of the used Ni/SiO2 catalyst.
The SEM image of the used Ni/SiO2 catalyst is shown in Figure C6 (Appendix C) and there
wasn‟t any noticeable difference when this image was compared to that of the fresh catalyst
(Figure 3.8).
4.3.4.3. TEM of the used Ni/SiO2 catalyst.
The TEM image of the used Ni/SiO2 catalyst is shown in Figure C7 (Appendix C) and it revealed
that the catalyst didn‟t experience any noticeable changes during the reaction since the TEM
image was similar to that of the fresh catalyst (Figure 3.9.). The measured particle sizes were in a
range of 5 – 20 nm.

75
4.3.4.4. BET surface area and pore volume of the used Ni/SiO2 catalyst.
The surface area and the pore volume results of the used catalyst were much higher when
compared to the results obtained for the fresh catalyst (Table 4.7). This was mainly caused by the
leaching of nickel metal which left some part of the support free and unoccupied (see 4.3.4.5.
below).
Table 4.7. Textural properties of the fresh and used Ni/SiO2 catalysts.
Catalyst Fresh catalyst Used catalyst
SBETa / m
2/g Vpore
b / cm
3/g SBET
a / m
2/g Vpore
b / cm
3/g
Ni/SiO2 78.9 0.322 87.1 0.338
a BET surface area.
b Adsorption total pore volume (Vpore) at P/Po: 0.99.
4.3.4.5. ICP-OES measurements of the used Ni/SiO2 catalyst.
The ICP-OES results of the used Ni/SiO2 catalyst (Table 4.8) showed that the catalyst lost more
than 10 % of it original nickel content. This was believed to be a cause for a sudden increase in
both the catalyst surface area and pore volume.
Table 4.8. Nickel content of the fresh and used Ni/SiO2 catalysts.
Ni content / wt. %
Fresh catalyst Used catalyst
28.2 25.0

76
4.3.5. Catalytic activity of the Ni/ZnO catalyst
The catalytic activity of the Ni/ZnO catalyst in the hydrogenation of octanal to octanol is
presented in Figure 4.5. The average conversion of octanal to octanol under steady state
conditions (24 h) was 87 %, while the octanol selectivity was 99.7 % (Table 4.9). Heptane,
octane and 1-hexanol were the only products detected for the lights, while the heavies were
represented by 1-undecanol. Because the selectivities to both the heavies and lights were very
low it was concluded that ZnO doesn‟t play any role in the product formation, since it is well
known that the sites for hydrogenation are associated with nickel centres.
Figure 4.5. Conversion and selectivity to octanol in octanal hydrogenation over the Ni/ZnO
catalyst (Reaction conditions: Feed = model feed, 50 bar, GHSV = 279.8 h-1
, LHSV = 23.6 h-
1, Catalyst volume = 4 mL and T = 110 °C).

77
Table 4.9. Product selectivity of octanal hydrogenation over Ni/ZnO catalyst.a
Product Selectivity / %
Lights
Heptane 0.1
Octane 0.1
1-Hexanol 0.04
Heavies 1-Undecanol 0.01
Main product Octanol 99.7
a Reaction conditions: Feed = model feed, 50 bar, GHSV = 279.8 h
-1, LHSV = 23.6 h
-1, Catalyst volume = 4 mL and
T = 110 °C.
4.3.6. Characterization of the used Ni/ZnO catalyst.
4.3.6.1. XRD of the used Ni/ZnO catalyst.
The XRD of the used Ni/ZnO is shown in Figure C8 (Appendix C) and the peaks due to Ni0 and
ZnO were observed. This means that under the reaction conditions the catalyst did not experience
any form of phase change since no new peaks were observed. The Ni crystallite size of the used
catalyst was comparable to that of the fresh catalyst (Table 4.10.).
Table 4.10. Comparisons of the nickel crystallite size between the fresh and the used
Ni/ZnO catalysts.
Ni crystallite size / nm
Fresh catalyst Used catalyst
3.3 3.5

78
4.3.6.2. SEM of the used Ni/ZnO catalyst.
The SEM images of the used Ni/ZnO catalyst are shown in Figure C9 (Appendix C) and it was
observed that the catalyst surface was rough and the distribution of nickel across the support was
uniform. Basically, there were no morphological changes that took place on the catalyst during
the hydrogenation reaction.
4.3.6.3. TEM of the used Ni/ZnO catalyst.
The TEM image of the used Ni/ZnO catalyst is shown in Figure C10 (Appendix C) and the
particle sizes were in a range of 4 - 22 nm. It was then concluded that nickel agglomeration
didn‟t take place during the catalytic reaction since the observed TEM particle sizes fall within
the fresh catalyst particle size range.
4.3.6.4. BET surface area and pore volume of the used Ni/ZnO catalyst.
The surface area and the pore volume results of the used catalyst were lower then the results
obtained for the fresh catalyst (Table 4.11). This was mainly caused by the adsorption of organic
molecules into the surface of the catalyst, thereby blocking the pores of the catalyst.
Table 4.11. Textural properties of the fresh and used Ni/ZnO catalysts.
Catalyst Fresh catalyst Used catalyst
SBETa / m
2/g Vpore
b / cm
3/g SBET
a / m
2/g Vpore
b / cm
3/g
Ni/ZnO 22.8 0.197 19.0 0.00312
a BET surface area.
b Adsorption total pore volume (Vpore) at P/Po: 0.99.

79
4.3.6.5. ICP-OES measurements of the used Ni/ZnO catalyst.
The ICP-OES results of the used catalyst revealed that nickel metal did not leach during the
reaction because the amount of nickel determined for the fresh and used catalysts was similar
(Table 4.12).
Table 4.12. Nickel content of the fresh and used Ni/ZnO catalysts.
Ni content / wt. %
Fresh catalyst Used catalyst
29.3 28.4
4.4. Catalytic hydrogenation of octanal using the water spiked feed
and the characterization of the used catalysts.
4.4.1. Catalytic activity of the Ni/Al2O3 catalyst.
The catalytic performance of the Ni/Al2O3 catalyst on the hydrogenation of octanal to octanol
using the water (2.3 wt.%) spiked feed was investigated. The reactor was initially fed with the
model feed for ca. 24 h in order to check the reproduability of the catalytic results and for the
catalyst to reach steady state (see section 4.3.1.). The conversion of octanal to octanol before the
water feed was added was at 90 % and immediately after the water spiked feed was introduced
the conversion increased to 93 % and it stayed there for the entire duration of the study (Figure
4.6). After the introduction of the water spiked feed the formation of by-products decreased and
this led to more hydrogen being available in the system, since it was not being used in the
formation of by-products. The conversion of octanal may then increases because there is less
competition for hydrogen in the system. Water may also expose sites on the catalyst which were
not available before the introduction of the water spiked feed and as a result increase the
conversion.

80
Figure 4.6. The effect of water in the feed on octanal hydrogenation over the Ni/Al2O3
catalyst (Reaction conditions: Feed = model feed and water spiked feed, 50 bar, GHSV =
279.8 h-1
, LHSV = 23.6 h-1
, Catalyst volume = 4 mL and T = 110 °C).
The use of the water spiked feed also led to the decrease in the selectivity to the heavies e.g. C24
acetal (Figure 4.6 and Table 4.13.). Similar results were observed by Wang et al. when they used
a Ni/Mo based catalyst for the hydrogenation of hexanal [4].
In this study, when silica and zinc oxide were used as catalysts support the selectivity of heavies
in the reaction was close to zero (see 4.3.3. and 4.3.5.) and it was concluded that the formation of
the heavies was associated with the sites found on the alumina support. What was observed from
Figure 4.6. and Table 4.13. was that the use of the water spiked feed only negatively affect the
production of the heavies. This demonstrates “that water, by acting as a base, may be neutralizing
the OH groups on the alumina surface that are mainly responsible for the heavy product
formation” [1].
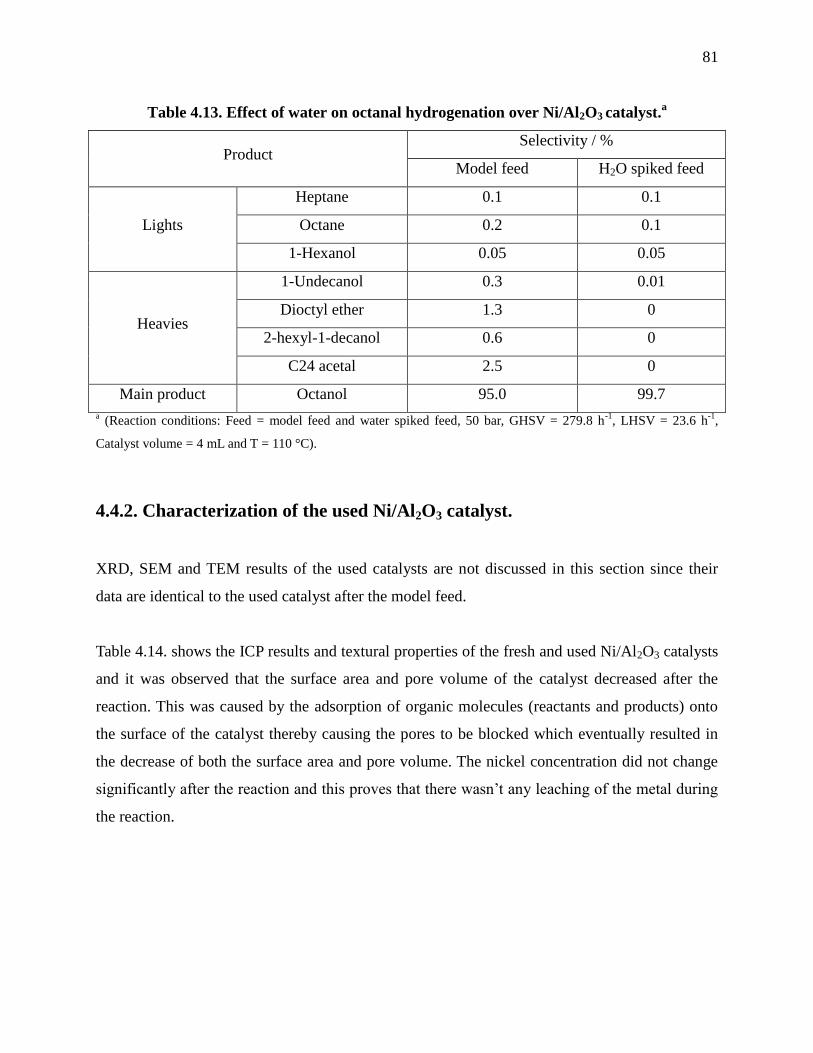
81
Table 4.13. Effect of water on octanal hydrogenation over Ni/Al2O3 catalyst.a
Product Selectivity / %
Model feed H2O spiked feed
Lights
Heptane 0.1 0.1
Octane 0.2 0.1
1-Hexanol 0.05 0.05
Heavies
1-Undecanol 0.3 0.01
Dioctyl ether 1.3 0
2-hexyl-1-decanol 0.6 0
C24 acetal 2.5 0
Main product Octanol 95.0 99.7
a (Reaction conditions: Feed = model feed and water spiked feed, 50 bar, GHSV = 279.8 h
-1, LHSV = 23.6 h
-1,
Catalyst volume = 4 mL and T = 110 °C).
4.4.2. Characterization of the used Ni/Al2O3 catalyst.
XRD, SEM and TEM results of the used catalysts are not discussed in this section since their
data are identical to the used catalyst after the model feed.
Table 4.14. shows the ICP results and textural properties of the fresh and used Ni/Al2O3 catalysts
and it was observed that the surface area and pore volume of the catalyst decreased after the
reaction. This was caused by the adsorption of organic molecules (reactants and products) onto
the surface of the catalyst thereby causing the pores to be blocked which eventually resulted in
the decrease of both the surface area and pore volume. The nickel concentration did not change
significantly after the reaction and this proves that there wasn‟t any leaching of the metal during
the reaction.

82
Table 4.14. Nickel concentration and textural properties of the fresh and used Ni/Al2O3
catalysts.
Catalyst BET surface area / m2/g Pore volume / cm
3/g Nickel / wt.%
Fresha Used
b Fresh
a Used
b Fresh
a Used
b
Ni/Al2O3 126 109 0.326 0.262 29.6 28.0
a fresh catalyst, as it was prepared.
b after the catalytic reaction: using water spiked feed.
4.4.3. Catalytic activity of the Ni/SiO2 catalyst.
The effect of water on the catalytic hydrogenation of octanal to octanol over the Ni/SiO2 catalyst
is shown in Figure 4.7. When the model feed was fed into the system the conversion of octanal
was constant at 90 % and the selectivities of the products were as listed in Table 4.15. As it can
be seen from the table the formation of octanol was highly favoured. After the introduction of the
water spiked feed the conversion of octanal started decreasing slowly and at the end of the
reaction it was at 71 %. Meanwhile the selectivity of octanol was not affected by the addition of
water in the feed, even when the conversion was decreasing the selectivity of octanol remained
unchanged at 99.7 %.

83
Figure 4.7. The effect of water in the feed on octanal hydrogenation over the Ni/SiO2
catalyst (Reaction conditions: Feed = model feed and water spiked feed, 50 bar, GHSV =
279.8 h-1
, LHSV = 23.6 h-1
, Catalyst volume = 4 mL and T = 110 °C).
Table 4.15. Effect of water on octanal hydrogenation over Ni/SiO2 catalyst.a
Product Selectivity / %
Model feed H2O spiked feed
Lights
Heptane 0.1 0.1
Octane 0.1 0.2
1-Hexanol 0.05 0.05
Heavies 1-Undecanol 0.08 0.01
Main product Octanol 99.7 99.7
a (Reaction conditions: Feed = model feed and water spiked feed, 50 bar, GHSV = 279.8 h
-1, LHSV = 23.6 h
-1,
Catalyst volume = 4 mL and T = 110 °C).

84
4.4.4. Characterization of the used Ni/SiO2 catalyst.
The used catalyst was in a powder form after the reaction and this was important to note since it
was loaded as pellets. The deactivation of the catalyst after the introduction of water spiked feed
may be linked to the mechanical failure of the catalyst. Table 4.16. presents the nickel
concentration and textural properties of the fresh and used catalysts. It was observed that the
fresh catalyst lost about 22 % of it initial nickel concentration through leaching and this might
have contributed to the observed decrease in octanal conversion. The surface area and pore
volume of the fresh catalyst increased during the reaction because the used catalyst had high
values for both the surface area and pore volume. The leaching of nickel from the catalyst may
be another reason for the sudden increase in both the surface area and pore volume.
Table 4.16. Nickel concentration and textural properties of the fresh and used Ni/SiO2
catalysts.
Catalyst BET surface area / m2/g Pore volume / cm
3/g Nickel / wt.%
Fresha Used
b Fresh
a Used
b Fresh
a Used
b
Ni/SiO2 78.9 90.6 0.322 0.362 28.2 21.9
a fresh catalyst, as it was prepared.
b after the catalytic reaction: using water spiked feed.
4.4.5. Catalytic activity of the Ni/ZnO catalyst.
The effect of water in the feed on the hydrogenation of octanal over the Ni/ZnO catalyst is shown
in Figure 4.8. The conversion of octanal before and after the introduction of the water spiked
feed was 87 %. The performance of the Ni/ZnO catalyst was not affected by the addition of
water in the feed, since both the conversion and selectivity remained unchanged after the
reaction (Table 4.17).

85
Figure 4.8. The effect of water in the feed on octanal hydrogenation over the Ni/ZnO
catalyst (Reaction conditions: Feed = model feed and water spiked feed, 50 bar, GHSV =
279.8 h-1
, LHSV = 23.6 h-1
, Catalyst volume = 4 mL and T = 110 °C).
Table 4.17. Effect of water on octanal hydrogenation over the Ni/ZnO catalyst.a
Product Selectivity / %
Model feed H2O spiked feed
Lights
Heptane 0.1 0.03
Octane 0.1 0.1
1-Hexanol 0.05 0.02
Main product Octanol 99.7 99.7
a (Reaction conditions: Feed = model feed and water spiked feed, 50 bar, GHSV = 279.8 h
-1, LHSV = 23.6 h
-1,
Catalyst volume = 4 mL and T = 110 °C).

86
4.4.6. Characterization of the used Ni/ZnO
Table 4.18. Nickel concentration and textural properties of the fresh and used Ni/ZnO
catalysts.
Catalyst BET surface area / m2/g Pore volume / cm
3/g Nickel / wt.%
Fresha Used
b Fresh
a Used
b Fresh
a Used
b
Ni/ZnO 22.8 18.8 0.197 0.00201 29.3 28.2
a fresh catalyst, as it was prepared.
b after the catalytic reaction: using water spiked feed.
Table 4.18. shows the nickel concentration and textural properties of the fresh and used Ni/ZnO
catalyst. The BET surface area of the used catalyst was lower compared to that of the fresh
catalyst but the difference was not large. The pore volume of the catalyst decreased after the
reaction, possibly due to the blockage of pores by the organic molecules. The leaching of nickel
for this catalyst was ruled out since the nickel concentration was almost the same for both fresh
and used catalyst.

87
4.5. References
1. X. Wang, R.Y. Saleh, U.S. Ozkan, J. Catal. 231 (2005) 20.
2. C.H. Hamilton, S.D. Jackson, G.J. Kelly, Appl. Catal. A: Gen. 263 (2004) 63.
3. R. Zhang, H. Yin, D. Zhang, L. Qi, H. Lu, H. Lu, Y. Shen, T. Jiang, Chem. Eng. J. 140
(2008) 488.
4. X. Wang, G. Li, U.S. Ozkan, J. Mol. Catal. A: Chem 217 (2004) 219.
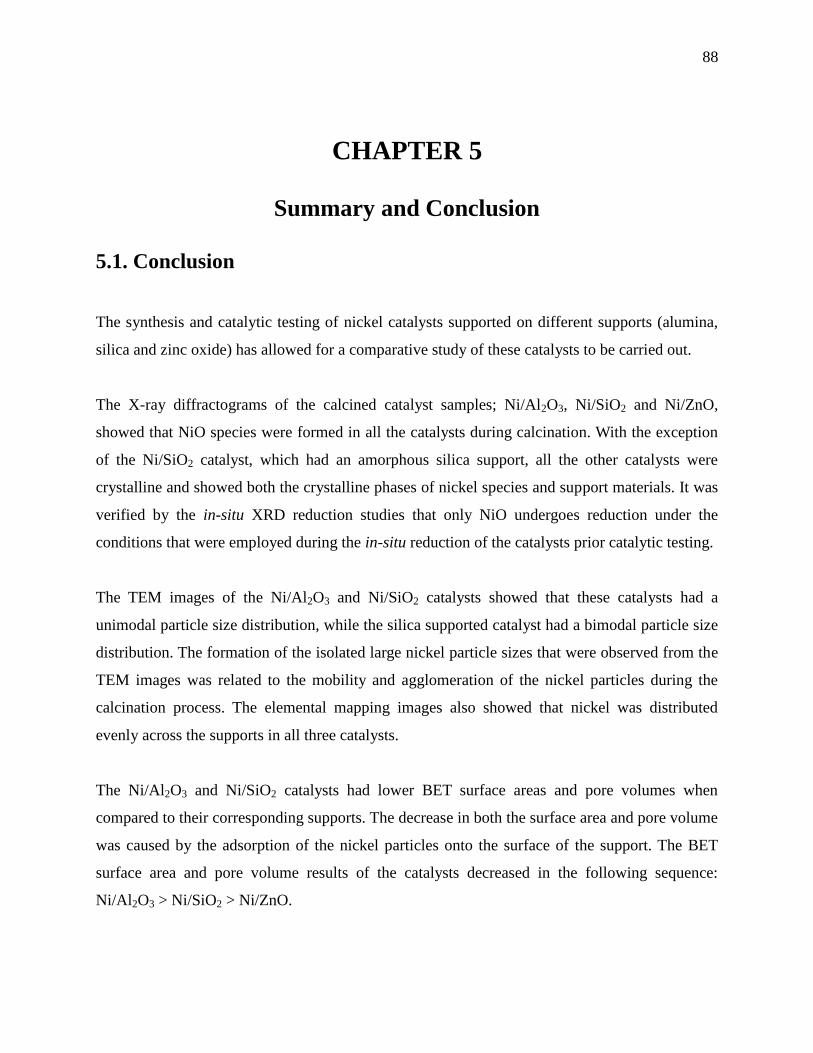
88
CHAPTER 5
Summary and Conclusion
5.1. Conclusion
The synthesis and catalytic testing of nickel catalysts supported on different supports (alumina,
silica and zinc oxide) has allowed for a comparative study of these catalysts to be carried out.
The X-ray diffractograms of the calcined catalyst samples; Ni/Al2O3, Ni/SiO2 and Ni/ZnO,
showed that NiO species were formed in all the catalysts during calcination. With the exception
of the Ni/SiO2 catalyst, which had an amorphous silica support, all the other catalysts were
crystalline and showed both the crystalline phases of nickel species and support materials. It was
verified by the in-situ XRD reduction studies that only NiO undergoes reduction under the
conditions that were employed during the in-situ reduction of the catalysts prior catalytic testing.
The TEM images of the Ni/Al2O3 and Ni/SiO2 catalysts showed that these catalysts had a
unimodal particle size distribution, while the silica supported catalyst had a bimodal particle size
distribution. The formation of the isolated large nickel particle sizes that were observed from the
TEM images was related to the mobility and agglomeration of the nickel particles during the
calcination process. The elemental mapping images also showed that nickel was distributed
evenly across the supports in all three catalysts.
The Ni/Al2O3 and Ni/SiO2 catalysts had lower BET surface areas and pore volumes when
compared to their corresponding supports. The decrease in both the surface area and pore volume
was caused by the adsorption of the nickel particles onto the surface of the support. The BET
surface area and pore volume results of the catalysts decreased in the following sequence:
Ni/Al2O3 > Ni/SiO2 > Ni/ZnO.

89
The H2-TPR experiments showed that the intensity of the interactions between the nickel and the
support decreased in the following sequence: Ni/Al2O3 > Ni/ZnO > Ni/SiO2. These results were
also substantiated by the findings from the in-situ XRD reduction studies, which showed that
NiO species present in the Ni/SiO2 catalyst were reduced at lower temperature compared to the
NiO found in the Ni/Al2O3 and Ni/SiO2 catalysts.
The total acidity of the catalysts decreased in the following sequence: Ni/Al2O3 > Ni/ZnO >
Ni/SiO2. The Ni/Al2O3 catalyst was amphoteric having peaks associated with weak-intermediate
and strong acidic site regions while the Ni/SiO2 and Ni/ZnO catalysts had intermediate and
strong acid sites, respectively.
The testing of these catalysts in the hydrogenation of octanal using the model feed showed that
the catalyst support may play a very important role in controlling the performance of the catalyst.
The octanal conversion changed slightly with a change in the catalyst support and it decreased in
the following sequence: Ni/SiO2 ≥ Ni/Al2O3 > Ni/ZnO. The choice of the support was seen to
have a great effect on the selectivity of the catalyst. The alumina support favoured the formation
of the side reactions. The major side reactions that were encountered were the condensation of
the octanal with octanol and also the self-condensation of the octanals to respectively yield C24
acetal and 2-hexyl-1-decanol. These side reactions were catalyzed by the acid-base bifunctional
site of alumina [1]. When silica and zinc oxide supports were used, the formation of the side
products stopped, signifying that SiO2 and ZnO supports were not involved in the formation of
the products. The selectivity to octanol deceased in the following sequence: Ni/ZnO ≥ Ni/SiO2 >
Ni/Al2O3.
When the water spiked feed was used, water poisoned the alumina sites that were responsible for
the formation of the side reactions in the Ni/Al2O3 catalyst and as a result the selectivity to
octanol increased. The silica supported catalyst was affected negatively by the water content
present in the feed. The octanol conversion decreased progressively with time on stream. The
deactivation of the Ni/SiO2 catalyst was linked to the mechanical failure of the catalyst and also
to the leaching of nickel during the reaction. The Ni/ZnO catalyst was not affected by the
presence of water in the feed.
90
This study has demonstrated that the catalyst support can fine tune the selectivity of the catalyst
e.g. the Ni/ZnO and Ni/SiO2 catalysts gave the highest selectivity of octanol when compared to
the Ni/Al2O3 catalyst. Catalysts supported on different supports may have different properties
e.g. the Ni/SiO2 catalyst had the weakest metal-support interactions when compared to the other
catalysts and this resulted in nickel leaching significantly during the reaction.

91
5.2. References
1. X. Wang, R.Y. Saleh, U.S. Ozkan, J. Catal. 231 (2005) 20.

92
APPENDIX A
REACTOR SET-UP

93
Figure A1. Reactor tube loaded with a catalyst.

94
APPENDIX B
CHARACTERIZATION DATA FOR THE FRESH
CATALYSTS
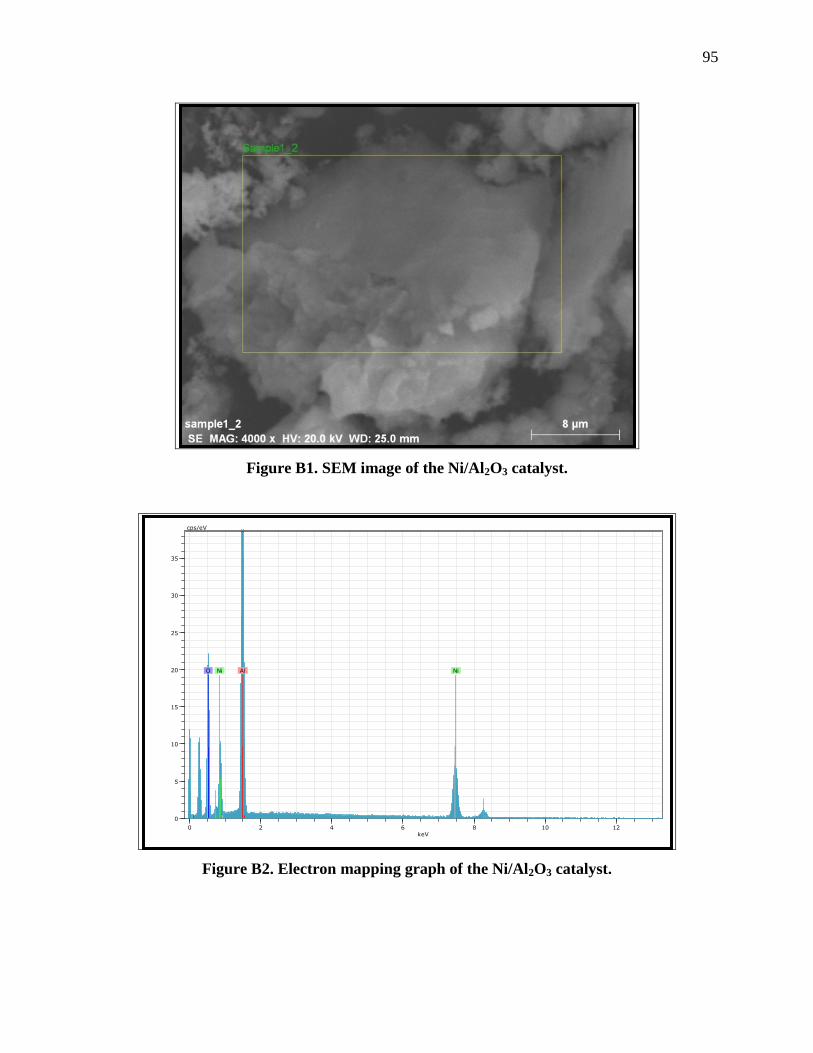
95
Figure B1. SEM image of the Ni/Al2O3 catalyst.
Figure B2. Electron mapping graph of the Ni/Al2O3 catalyst.
0 2 4 6 8 10 12keV
0
5
10
15
20
25
30
35
cps/eV
O Ni Ni Al

96
Figure B3. Electron diffraction of the Ni/Al2O3 catalyst.
Figure B4. NH3-TPD of the alumina support.

97
Figure B5. Elemental mapping images of the Ni/SiO2 catalyst showing the distribution of
(a) Ni and (b) Si particles.
Figure B6. Electron mapping graph of the Ni/SiO2 catalyst.
0 1 2 3 4 5 6 7keV
0
5
10
15
20
25
30
35
cps/eV
O Si Ni Ni

98
Figure B7. Electron mapping images of the Ni/ZnO catalyst showing the distribution of (a)
Ni and (b) Zn particles.
Figure B8. Electron mapping graph of the Ni/ZnO catalyst.
0 2 4 6 8 10 12keV
0
2
4
6
8
10
12
14
16
18
20
22
24
cps/eV
O Ni Ni Zn Zn
99
APPENDIX C
CHARACTERIZATION DATA FOR THE USED
CATALYSTS

100
Figure C1. Typical GC trace of a run using model feed over the Ni/Al2O3.

101
Table C1. Peak number and corresponding component as observed from the GC trace
(Figure C1).
Peak No. Component
1 Acetone
2 Heptane
3 Octane
4 1-hexanol
5 Octanal
6 Octanol isomers
7 1-octanol
8 Unknown
9 Octanoic acid
10 2-hexyl-tetrahydrofuran
11 Tridecane
12 Cyclic alcohol
13 Dioctyl ether
14 C24 acetal

102
Figure C2. XRD diffractogram of the used Ni/Al2O3 catalyst (Reaction feed: model feed).
Figure C3: SEM of the used Ni/Al2O3 catalyst: (a) bright field and (b) electron mapping
images (Reaction feed: model feed).

103
Figure C4. TEM of the used Ni/Al2O3 catalyst (Reaction feed: model feed).
Figure C5. XRD diffractogram of the used Ni/SiO2 catalyst (Reaction feed: model feed).

104
Figure C6. SEM of the used Ni/SiO2 catalyst: (a) bright field and (b) electron mapping
images (Reaction feed: model feed).
Figure C7. TEM of the used Ni/SiO2 catalyst (Reaction feed: model feed). Scale: 200 nm.

105
Figure C8. XRD diffractogram of the used Ni/ZnO catalyst (Reaction feed: model feed).
Figure C9. SEM of the used Ni/ZnO catalyst: (a) bright field and (b) electron mapping
images (Reaction feed: model feed).

106
Figure C10. TEM of the used Ni/ZnO catalyst (Reaction feed: model feed). Scale: 200 nm.