Embed Size (px)
Citation preview

Supporting Information
Evaluation of Structural Transformation in 2D Metal–Organic Frameworks Based on 4,4'-Sulfonyldibenzoate Linker: Microwave-Assisted Solvothermal
Synthesis, Characterization and Applications
Cheng-You Wu,a Duraisamy Senthil Raja,b Chun-Chuen Yang,*c Chun-Ting Yeh,a Yu-Ru Chen,a Chen-Yu Li,a Bao-Tsan Ko,*d and Chia-Her Lin*a
aDepartment of Chemistry, Chung Yuan Christian University, Chungli, Taoyuan 320, TaiwanbDepartment of Chemistry, National Tsing Hua University, Hsinchu 300, TaiwancDepartment of Physics, Chung Yuan Christian University, Chungli, Taoyuan 320, TaiwandDepartment of Chemistry, National Chung Hsing University, Taichung, 402, Taiwan
Corresponding Authors:Prof. Chun-Chuen Yang ([email protected]) Prof. Bao-Tsan Ko ([email protected]) Prof. Chia-Her Lin ([email protected]), Tel: +886-3-2653315, Fax: +886-3-2653399
ContentsFigure S1. The TGA curves for the compounds 1-4.Figure S2. Varied temperatures powder XRD patterns of 1.Figure S3. Varied temperatures powder XRD patterns of 2.Figure S4. Varied temperatures powder XRD patterns of 3.Figure S5. Varied temperatures powder XRD patterns of 4.Figure S6. Powder XRD patterns of the samples after gas sorption measurements.Figure S7. Rietveld profile fits to synchrotron powder X-ray data for 1 as a function of temperature.Figure S8. Rietveld profile fits to synchrotron powder X-ray data for 3 as a function of temperature.Figure S9. Rietveld profile fits to synchrotron powder X-ray data for 4 as a function of temperature.Figure S10. The high pressure CO2 and CH4 adsorption isotherms of CYCU-5 at 273 and 298 K.
Table S1. Selected bond lengths (Å).Table S2. Hydrogen Bonding Distance (Å) and Angle (deg) Data.Table S3. TGA weight loss data for the compounds 1-4.Table S4. Crystallographic details of 1 determined from synchrotron powder X-Ray data.Table S5. Crystallographic details of 4 determined from synchrotron powder X-Ray data.Table S6. Selective bond length and distance of 1 determined from synchrotron powder X-Ray data.Table S7. Selective bond length and distance of 3 and 4 determined from synchrotron powder X-
Ray data.
S-1
Electronic Supplementary Material (ESI) for CrystEngComm.This journal is © The Royal Society of Chemistry 2014

100 200 300 400 500 600 700 80010
20
30
40
50
60
70
80
90
100
Weig
ht (%
)
Temperature (oC)
1 2 3 4
Figure S1. The TGA curves for the compounds 1-4.
S-2

5 10 15 20 25 30 35 402 (o)
450 oC 400 oC 350 oC 300 oC 250 oC 200 oC 150 oC 100 oC 50 oC 30 oC Cal.
Figure S2. Varied temperatures powder XRD patterns of 1.
5 10 15 20 25 30 35 40
450 oC 400 oC 350 oC 300 oC 250 oC 200 oC 150 oC 100 oC 50 oC 30 oC Cal.
2 (o)
Figure S3. Varied temperatures powder XRD patterns of 2.
S-3
5 10 15 20 25 30 35 40
450 oC 400 oC 350 oC 300 oC 250 oC 200 oC 150 oC 100 oC 50 oC 30 oC Cal.
2 (o)
Figure S4. Varied temperatures powder XRD patterns of 3.
5 10 15 20 25 30 35 40
450 oC 400 oC 350 oC 300 oC 250 oC 200 oC 150 oC 100 oC 50 oC 30 oC Cal.
2 (o)
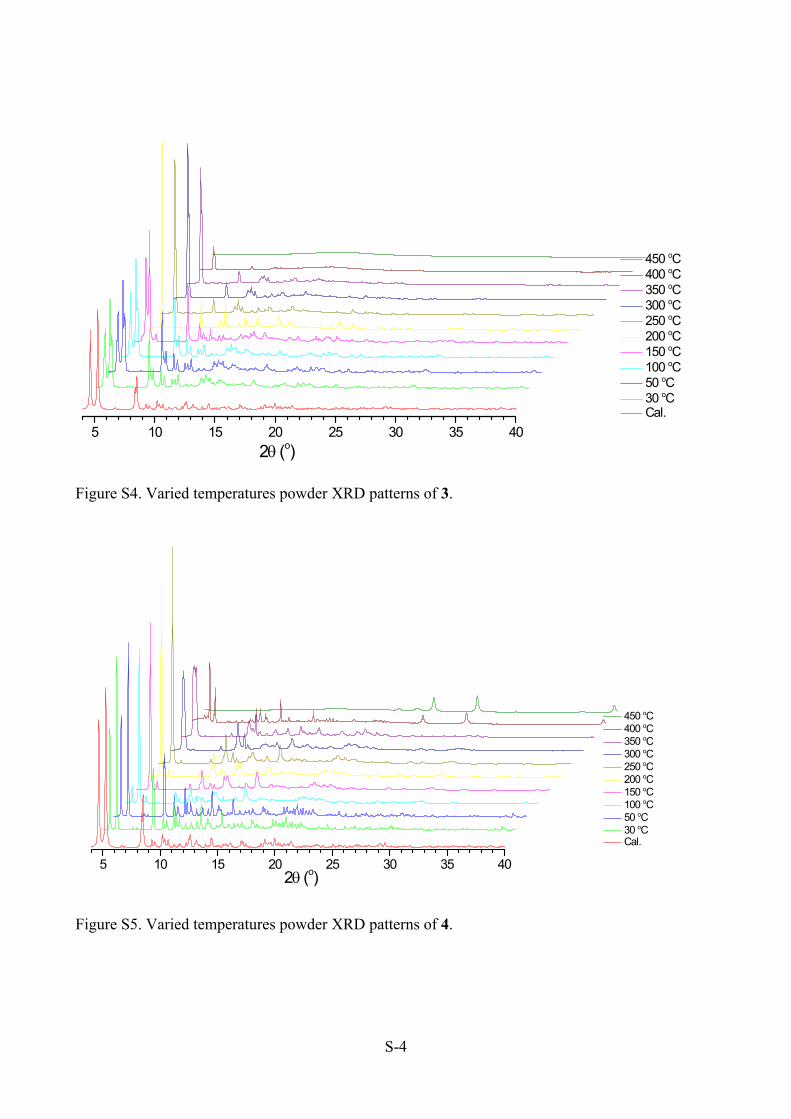
Figure S5. Varied temperatures powder XRD patterns of 4.
S-4

10 20 30 40 50
CYCU-5
2(o)10 20 30 40 50
2 (o)
2a
5 10 15 20 25 30 35 40 45 502 (o)
3a
5 10 15 20 25 30 35 40 45 502 (o)
4a
Figure S6. Powder XRD patterns of the samples after gas sorption measurements.
S-5

Figure S7-1. Rietveld profile fits to synchrotron powder X-ray data for 1 as a function of temperature. The measured values are in red, the calculated intensity is in green and the difference plot is in pink color.
S-6
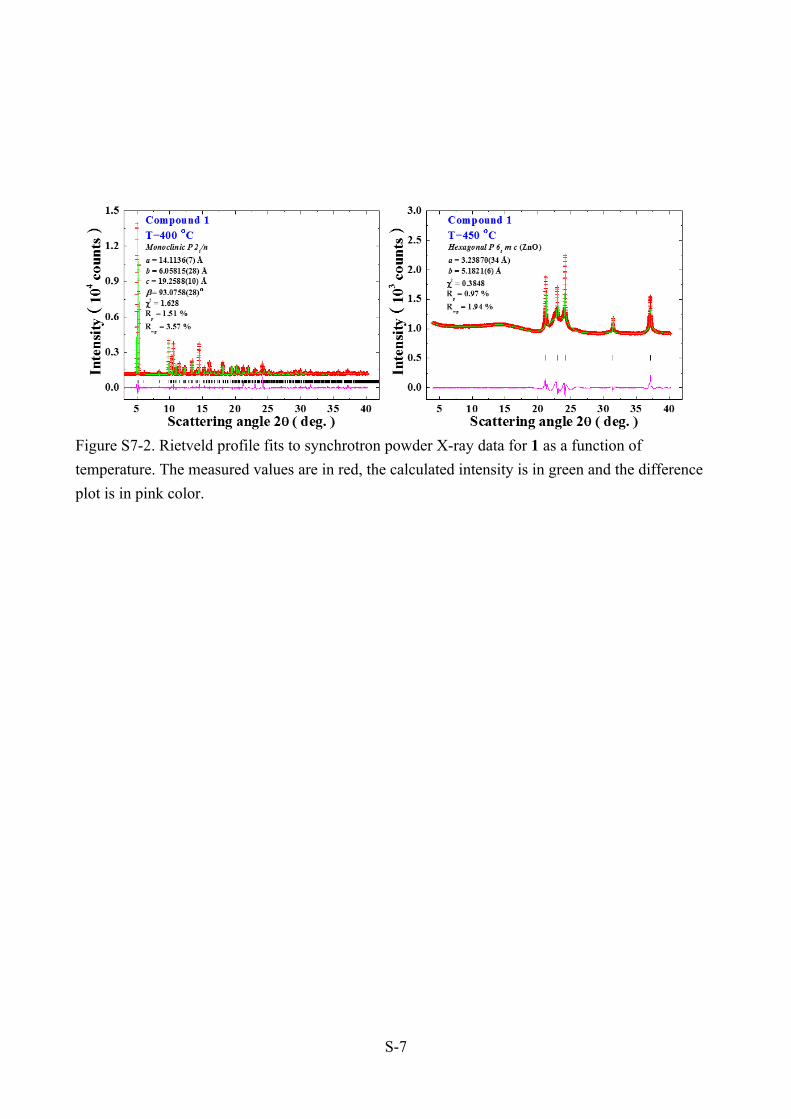
Figure S7-2. Rietveld profile fits to synchrotron powder X-ray data for 1 as a function of temperature. The measured values are in red, the calculated intensity is in green and the difference plot is in pink color.
S-7
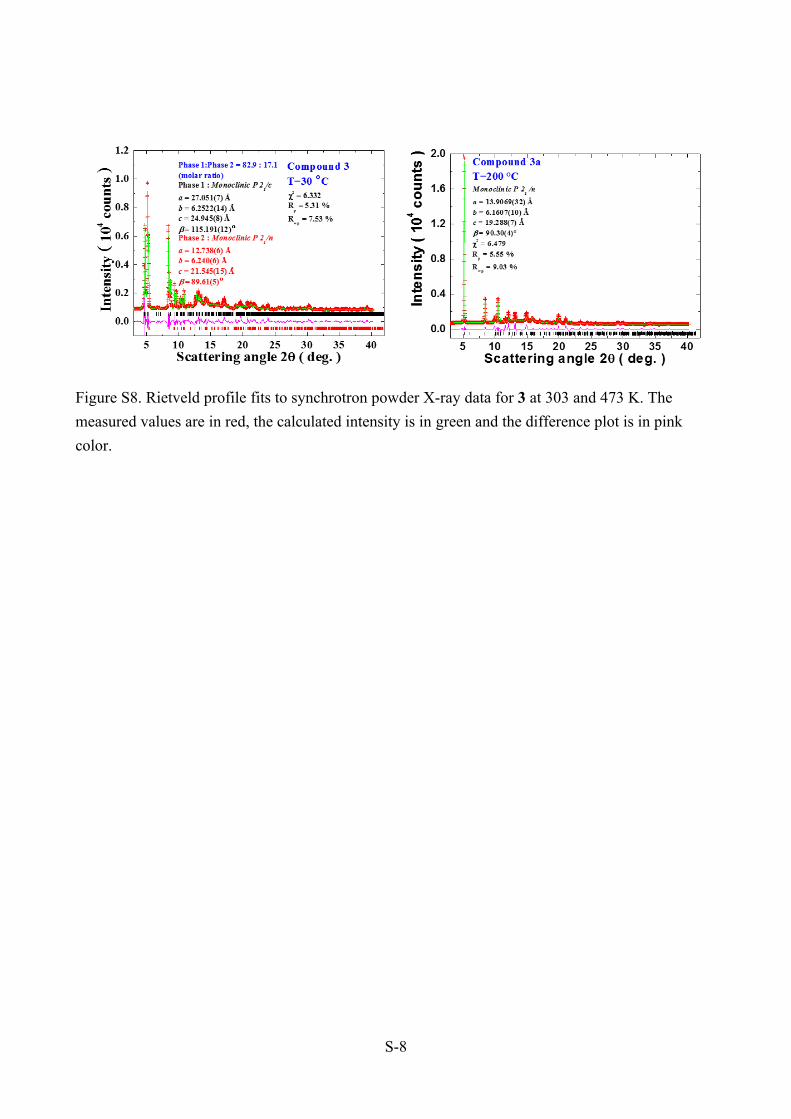
Figure S8. Rietveld profile fits to synchrotron powder X-ray data for 3 at 303 and 473 K. The measured values are in red, the calculated intensity is in green and the difference plot is in pink color.
S-8
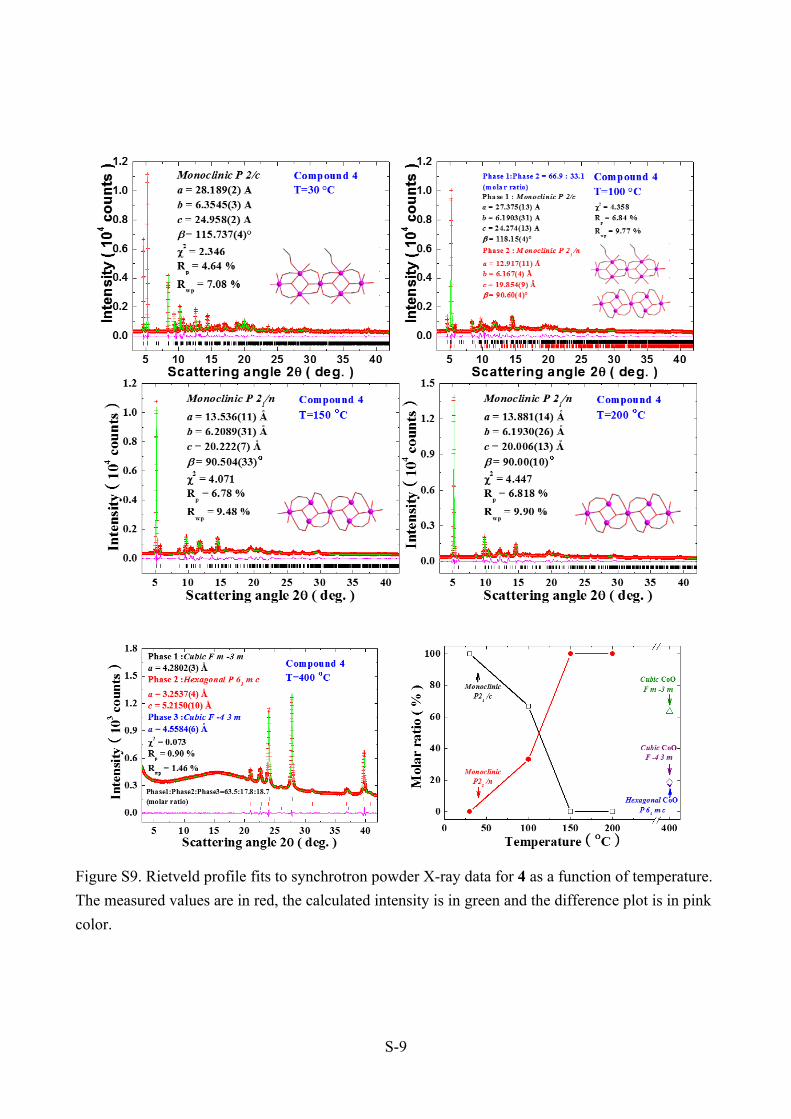
Figure S9. Rietveld profile fits to synchrotron powder X-ray data for 4 as a function of temperature. The measured values are in red, the calculated intensity is in green and the difference plot is in pink color.
S-9

0 10 20 30 40 50 60 70 80 90 100
0
10
20
30
40
50
60
70
80
90
100
110
120
CO2 273K CO2 298K CH4 273K CH4 298K
V abs
(cm
3 /g)
P(bar)
Figure S10. The high pressure CO2 and CH4 adsorption isotherms of CYCU-5 at 273 and 298 K.
S-10

Table S1. Selected bond lengths (Å).1
Zn(1)-O(7)#1 2.027(3) Zn(1)-O(7) 2.027(3)Zn(1)-O(2) 2.080(3) Zn(1)-O(2)#1 2.080(3)Zn(1)-O(3) 2.170(3) Zn(1)-O(3)#1 2.170(3)Zn(2)-O(4) 1.909(3) Zn(2)-O(1) 1.927(3)Zn(2)-O(7) 1.965(3) Zn(2)-O(7)#2 2.003(3)
CYCU-5Zn(1)-O(1) 2.032(15) Zn(1)-O(1)#1 2.032(15)Zn(1)-O(7)#2 2.080(14) Zn(1)-O(7)#3 2.080(14)Zn(1)-O(3)#4 2.180(16) Zn(1)-O(3)#5 2.180(16)Zn(2)-O(2) 1.904(16) Zn(2)-O(6)#2 1.918(15)Zn(2)-O(1) 1.971(14) Zn(2)-O(1)#4 2.002(15)
2Mg(1)-O(1) 2.054(2) Mg(1)-O(2) 2.063(2)Mg(1)-O(5) 2.079(2) Mg(1)-O(4) 2.095(2)Mg(1)-O(3) 2.115(2) Mg(1)-O(6) 2.124(2)Mg(2)-O(1) 2.049(2) Mg(2)-O(2) 2.057(2)Mg(2)-O(9) 2.083 (2) Mg(2)-O(8) 2.090(2)Mg(2)-O(10) 2.099(2) Mg(2)-O(7) 2.109(2)Mg(3)-O(2) 2.057(2) Mg(3)-O(2) 2.058(1)Mg(3)-O(12) 2.077(2) Mg(3)-O(4) 2.087(11)Mg(3)-O(13) 2.109(2) Mg(3)-O(6) 2.119(14)
5Mn(1)-O(3) 2.085(3) Mn(1)-O(4)#1 2.109(3)Mn(1)-O(1S) 2.166(3) Mn(1)-O(1)#1 2.178(2)Mn(1)-O(2) 2.239(3) Mn(1)-O(1) 2.369(3)
6Mn(1)-O(1)#1 2.126(2) Mn(1)-O(2) 2.162(2)Mn(1)-O(4)#2 2.166(2) Mn(1)-O(3)#3 2.195(2)Mn(1)-O(1S) 2.198(3) Mn(1)-O(3)#4 2.284(2)Symmetry transformations used to generate equivalent atoms: for 1 #1 -x+1,-y+1,-z+1, #2 -x+1,-y+2,-z+1; for CYCU-5, #1 -x+1,-y+1,-z+1, #2 -x,-y+2,-z+1, #3 x+1,y-1,z, #4 -x+1,-y+2,-z+1, #5 x,y-1,z; for 5, #1 -x+3/2,y-1/2,-z+1/2, #2 -x+1/2,y-1/2,-z+1/2; for 6, #1 -x+1,-y+1,-z, #2 x-1,y-1,z-1, #3 -x+2,-y+2,-z+1, #4 x,y-1,z-1;.
S-11

Table S2. Hydrogen Bonding Distance (Å) and Angle (°) Data.D — H ∙∙∙ A d(H∙∙∙A) d(D∙∙∙A) ∠DHA Symmetry Code
1O(7)-H(7)...O(6)# 1.98 2.815(4) 155.8 x+1/2,-y+3/2,z-1/2
CYCU-5O(7)-H(7)...O(6)# 2.00 2.851(2) 157.0 x+1/2,-y+3/2,z-1/2
2O(3)-H(3B)...O(18) 2.06 2.894(3) 168.1 -x+2,-y,-z+1O(3)-H(3C)...O(9) 1.92 2.760(3) 167.1 x,y-1,zO(6)-H(6B)...O(17) 2.32 3.070(3) 148.1 -x+2,-y,-z+1O(6)-H(6C)...O(8) 2.00 2.832(3) 165.5O(13)-H(13B)...O(16) 2.09 2.860(3) 150.1 -x+1,-y,-z+1O(13)-H(13C)...O(10) 1.92 2.758(3) 168.3 x,y-1,zO(14)-H(14A)...O(7) 2.09 2.722(3) 130.6O(1W)-H(1WA)...O(11) 2.20 2.758(9) 123.5O(1W)-H(1WB)...O(3W) 2.37 3.175(13) 158.8 x,y-1,zO(2W)-H(2WA)...O(12) 2.28 2.906(11) 130.5O(2W)-H(2WB)...O(4W) 2.26 3.11(2) 173.8
Table S3. TGA weight loss data for the compounds 1-4.Weight loss
CompoundObserved Calculated
1 6% at 300 ºC 5.2% for EtOH2 18.1% at150 ºC 16.8% for 6.5H2O and EtOH3 17.8% at 190 ºC 15.4% for 6.5H2O and EtOH4 12.8% at 140 ºC 15.3% for 6.5H2O and EtOH
S-12

Table S4-1. Crystallographic details of 1 as a function of temperature, as determined from synchrotron powder X-Ray data.
1-303K 1-323K 1-373K 1-423KChemical formula C28H18Zn3O14S2 C28H18Zn3O14S2 C28H18Zn3O14S2 C28H18Zn3O14S2
Formula weight 833.8 833.8 833.8 833.8Crystal system Monoclinic Monoclinic Monoclinic MonoclinicTemperature (K) 303 323 373 423Space group P21/n P21/n P21/n P21/na (Å) 13.8988(11) 13.8916(7) 13.8939(7) 13.8989(6)b (Å) 5.9994(2) 6.0047(2) 6.0187(2) 6.0322(2)c (Å) 19.3278(8) 19.3426(8) 19.3818(8) 19.4085(8)β (o) 93.4380(24) 93.4052(25) 93.3061(24) 93.2171(24)V (Å3) 1608.73(1) 1610.61(1) 1618.07(1) 1624.66(1)Z 2 2 2 2Radiation (Å) 1.0332 1.0332 1.0332 1.03322 3.903 4.076 3.453 3.075Rp (%) 3.12 3.16 2.99 2.77Rwp (%) 5.53 5.54 5.23 4.93
S-13

Table S4-2. Crystallographic details of 1 as a function of temperature, as determined from synchrotron powder X-Ray data.
1-473K 1-523K 1-573K 1-623K 1-673K
Chemical formula C28H18Zn3O14S2 C28H18Zn3O14S2 C28H18Zn3O14S2 C28H18Zn3O14S2 C28H18Zn3O14S2
Formula weight 833.8 833.8 833.8 833.8 833.8
Crystal system Monoclinic Monoclinic Monoclinic Monoclinic Monoclinic
Temperature (K) 473 523 573 623 673
Space group P21/n P21/n P21/n P21/n P21/n
a (Å) 13.9323(6) 13.9828(5) 14.0363(5) 14.0704(5) 14.1136(7)
b (Å) 6.0385(2) 6.0417(2) 6.0451(2) 6.0508(2) 6.0582(2)
c (Å) 19.3839(8) 19.3308(7) 19.2777(6) 19.2598(6) 19.2588(10)
β (o) 93.2021(22) 93.2164(20) 93.2207(19) 93.1749(18) 93.0758(28)
V (Å3) 1628.22(1) 1630.49(1) 1633.14(1) 1637.2(1) 1644.3(1)
Z 2 2 2 2 2
Radiation (Å) 1.0332 1.0332 1.0332 1.0332 1.0332
2 2.653 2.194 2.205 2.174 1.618
Rp (%) 2.49 2.19 2.11 2.05 1.51
Rwp (%) 4.54 4.16 4.19 4.14 3.57
S-14

Table S5. Crystallographic details of 4 as a function of temperature, as determined from synchrotron powder X-Ray data.
4-303K 4-373K (67 %) 4-373K (33 %) 4-423K 4-473K
Chemical formula C30H29Co3O18S2 C28H18Mg3O14S2 C28H18Mg3O14S2 C28H18Ni3O14S2 C28H18Co3O14S2
Formula weight 917.88 917.88 818.8 818.8 818.8
Crystal system Monoclinic Monoclinic Monoclinic Monoclinic Monoclinic
Temperature (K) 303 373 373 423 473
Space group P2/c P2/c P21/n P21/n P21/n
a (Å) 28.1888(19) 27.375(13) 12.917(11) 13.536(11) 13.881(14)
b (Å) 6.3545(3) 6.1903(31) 6.167(4) 6.2089(31) 6.1930(26)
c (Å) 24.9584(15) 24.274(13) 19.854(9) 20.222(7) 20.006(13)
β (o) 115.737(4) 118.15(4) 90.60(4) 90.504(33) 90.0(1)
V (Å3) 4027.2(4) 3626.9(34) 1581.5(18) 1699.5(17) 1719.82(219)
Z 4 4 2 2 2
Radiation (Å) 1.0332 1.0332 1.0332 1.0332 1.0332
2 2.346 4.358 4.358 4.071 4.447
Rp (%) 4.64 6.84 6.84 6.78 6.818
Rwp (%) 7.08 9.77 9.77 9.48 9.90
S-15

Table S6. Selective bond length and distance of 1 as a function of temperature, as determined from synchrotron powder X-Ray data.
303K 323K 423K 473K 523K 623K
Zn1—O1 2.0189 2.0205 2.0292 2.0307 2.0310 2.0328
Zn1—O1 2.0189 2.0205 2.0292 2.0307 2.0310 2.0328
Zn1—O7i 2.0571 2.0569 2.0582 2.0593 2.0605 2.0628
Zn1—O7 2.0571 2.0569 2.0582 2.0593 2.0605 2.0628
Zn1—O3ii 2.1627 2.1634 2.1710 2.1730 2.1746 2.1798
Zn1—O3 2.1627 2.1634 2.1710 2.1730 2.1746 2.1798
Zn2···Zn2 2.8577 2.8569 2.8615 2.8679 2.8770 2.8938
Zn2—O2 1.8949 1.8963 1.9045 1.9044 1.9025 1.9016
Zn2—O1 1.9474 1.9471 1.9498 1.9534 1.9583 1.9670
Zn2—O1 1.9894 1.9906 1.9984 2.0003 2.0014 2.0052
Zn2—O6 1.8963 1.8961 1.8978 1.8993 1.9012 1.9047
S1—O5 1.4212 1.4225 1.429 1.4305 1.4312 1.4333
S1—O4 1.4319 1.4331 1.439 1.4384 1.436 1.4334
S1—C5 1.7486 1.7486 1.7533 1.7563 1.7600 1.7677
S1—C8 1.7555 1.7554 1.7566 1.7576 1.7588 1.7610
O2—C1 1.2599 1.2610 1.2667 1.2680 1.2687 1.2706
O1···O4 2.8313 2.8331 2.8415 2.8387 2.8326 2.8243
Symmetry codes: (i) x+1, y−1, z; (ii) x, y−1, z.
S-16

Table S7. Selective bond length and distance of 3 and 4 as a function of temperature, as determined from synchrotron powder X-Ray data.
2-473K 3-303K 3-473K 4-373K 4-423K 4-473K
M1—O1 2.0317(15) 2.1127(16) 2.0614(3) 2.0698(12) 2.0875(9) 2.0797(8)
M1—O1 2.0317(15) 2.1127(16) 2.0614(3) 2.0698(12) 2.0875(9) 2.0797(8)
M1—O7i 1.9972(17) 2.0346(12) 2.0090(7) 1.9744(11) 2.0329(10) 2.0375(20)
M1—O7 1.9972(17) 2.0346(12) 2.0090(7) 1.9744(11) 2.0329(10) 2.0375(20)
M1—O3ii 2.2540(21) 2.2557(13) 2.2225(9) 2.1598(13) 2.2341(12) 2.2624(24)
M1—O3 2.2540(21) 2.2557(13) 2.2225(9) 2.1598(13) 2.2341(12) 2.2624(24)
M2···M2 2.985(4) 2.7151(14) 2.9003(8) 2.7136(22) 2.8377(22) 2.9076(30)
M2—O2 1.9288(13) 2.0642(11) 1.9392(6) 1.9457(8) 1.9883(7) 1.9881(15)
M2—O1 1.9729(20) 1.8541(8) 1.9487(4) 1.8621(11) 1.9235(11) 1.9501(14)
M2—O1 2.0517(14) 2.0792(10) 2.0440(5) 2.0110(9) 2.0588(8) 2.0727(15)
M2—O6 1.8586(15) 1.8618(10) 1.8642(6) 1.8220(10) 1.8748(9) 1.8840(17)
S1—O5 1.4408(12) 1.4790(13) 1.4594(2) 1.4609(9) 1.4711(7) 1.4673(6)
S1—O4 1.4242(9) 1.5700(9) 1.4501(4) 1.4770(5) 1.4998(4) 1.4890(7)
S1—C5 1.8308(21) 1.7395(9) 1.7912(6) 1.7057(12) 1.7722(11) 1.8070(19)
S1—C8 1.7074(14) 1.7354(10) 1.7169(6) 1.6866(9) 1.7359(8) 1.7401(17)
O2—C1 1.2778(10) 1.3105(12) 1.2938(2) 1.2944(8) 1.3038(6) 1.3009(5)
O1···O4 2.7425(22) 3.0913(20) 2.8111(9) 2.8798(12) 2.9311(9) 2.9013(18)
Symmetry codes: (i) x+1, y−1, z; (ii) x, y−1, z.M = Mg (2a), Ni(3a), Co(4a).
S-17