Embed Size (px)
Citation preview

Int. J. Electrochem. Sci., 7 (2012) 499 - 515
International Journal of
ELECTROCHEMICAL SCIENCE
www.electrochemsci.org
Synthesis, Characterization and Electrochemical Properties of
Single Layer Thin Film of N-Octyloxyphenyl-N’-(4-
Chlorobenzoyl)Thiourea-Chlorophyll As Potential Organic
Photovoltaic Cells
Hasyiya Karimah Adli1,3
, Wan M. Khairul
1,3,* and
Hasiah Salleh
2
1Advanced Materials Research Group, Department of Chemical Sciences, Faculty of Science and
Technology, Universiti Malaysia Terengganu, 21030 Kuala Terengganu, Malaysia. 2 Advanced Materials Research Group, Department of Physical Sciences, Faculty of Science and
Technology, Universiti Malaysia Terengganu, 21030 Kuala Terengganu, Malaysia. 3Institute of Marine Biotechnology, Universiti Malaysia Terengganu, 21030 Kuala Terengganu,
Malaysia. *E-mail: [email protected]
Received: 15 November 2011 / Accepted: 2 December 2011 / Published: 1 January 2012
The significant contributions of conjugated organic molecular wires in wide range of molecular
electronics applications have been extensively studied and proven. The characteristics of electronic
delocalization in extended -orbital system of conjugated organic molecules have brought further
investigations to exploit this system to be used as potential photovoltaic cells. Due to this matter, the
essentially linear conjugated thiourea compound of A-ArC=ONHC=SNHAr-D has been successfully
designed, prepared and characterized prior to form thin films. The compound namely, N-
octyloxyphenyl-N’-(4-chlorobenzoyl)thiourea was spectroscopically and analytical characterized by 1H
and 13
C NMR, FT-IR, CHNS Elemental Microanalysis, UV-vis, TGA, CV, SEM and Four Point Probe
for its conductivity behavior determination. From the electrical conductivity, it revealed that the layer
of ITO/N-octyloxyphenyl-N’-(4-chlorobenzoyl)thiourea/CHLO thin film exhibits higher conductivity,
0.2140 Sm-1
than the layer of N-octyloxyphenyl-N’-(4-chlorobenzoyl)thiourea/ITO without CHLO,
0.1443 Sm-1
under maximum light intensity (100 Wm-2
). Therefore, further investigation as well as
exploration on electrical conductivity and electrochemistry studies on the molecular system of alkoxy-
substituted thiourea with different numbers on CHLO and thiourea (TU) layers under different
conditions and parameters should be taken with an urgent consideration for further development in the
area of molecular electronics.
Keywords: Thin Film, ITO/Thiourea (TU)/Chlorophyll, Organic Photovoltaic Cells

Int. J. Electrochem. Sci., Vol. 7, 2012
500
1. INTRODUCTION
Due to great concern over global warming and rapidly increasing non-renewable energy
demands, serious attempts to replace fossil fuels have led to focus on solar energy sources. The
development of solar energy conversion technology is just about the right time to fulfill the green
energy demands [1, 2].
Solar cell devices are currently emerged as potentially and promising application for solar
energy. The newly invented solar cell is more efficient powerful energy-generating device on
converting sun’s energy to electrical energy [3]. Without a doubt, organic electronic materials are
becoming greater interest for future application in solar cell research due to their molecular framework
and electronic properties. In the past few years, great attention is given to the idea of using organic
molecules in numerous electronic devices [4 - 6]. Moreover, electronic devices that use single organic
molecule as active elements have become potentially promising alternatives over readily available
conventional devices [7 - 10]. In the active layer of organic solar cell (OSC), the conjugated organic
molecule plays the key role of absorbing light, creating excitons for subsequent charge separation and
transporting holes to the anode [11 - 14]. Recently, ITO coated substrates have been developed and the
coating is used as a part of the organic solar cell [15 - 17].
This study focuses on the arrangement of organic thin films by layering with material which
well known capable in generating photovoltaic energy. Chlorophyll that doped on the conjugated
thiourea (TU) compound will be coated on ITO substrate to increase the ability of light absorption. TU
based-compound on D-π-A system should give significance result in the conductivity properties and
then act as potential photovoltaic cell molecule. Moreover, TU with its resonance structure has been
widely studied with more than 700 structures and its complexes with wide range of transition metals
exhibit interesting properties in various applications [18 - 22]. Thus, this study deals with synthesis,
characterization and its potential to act as organic photovoltaic cell of the candidate compound namely,
N-octyloxyphenyl-N’-(4-chlorobenzoyl)thiourea (3) as shown in Figure 1.
Figure 1. Molecular structure of N-octyloxyphenyl-N’-(4-chlorobenzoyl)thiourea (3) as potential
organic photovoltaic cell.
2. EXPERIMENTAL
2.1. Materials and General Methodology
All reactions were carried out under an ambient atmosphere and no special precautions were
taken to exclude air or moisture during work-up. All chemicals were purchased from standard

Int. J. Electrochem. Sci., Vol. 7, 2012
501
suppliers (Merck, Fisher Scientific and Sigma Aldrich) and used as received without further
purification. 1H (400.11 MHz) and
13C (100.61 MHz) NMR spectra were recorded using Bruker
Avance III 400 Spectrometer in CDCl3 as solvent and internal standard at room temperature in the
range between H 0 – 15 ppm and C 0 – 200 ppm, respectively. Meanwhile, Infrared spectra of the
synthesized compounds were recorded from KBr pellets using FT - IR Perkin Elmer 100
Spectrophotometer in the spectral range of 4000 – 400 cm-1
and CHNS elemental analysis was carried
out by CHNS Flashea 1112 series. For UV-vis analysis, spectra of all compounds were recorded by
Shimadzu UV-vis 1601 series in 1 cm3 cuvette in methanolic solution. Thermogravimetric analysis
was performed using Perkin–Elmer TGA Analyzer from 0o to 700
oC at a heating rate of 10
oC/min
under nitrogen atmosphere. The electrochemical study was performed using Electrochemical
Impedance Spectroscopy (EIS) PGSTAT302. The surface morphology of the synthesized final
compound was scanned by JSM 6360 Joel Scanning Electron Microscopy (SEM) with accelerated
voltage 20 kV, and magnification from 2000× until 10000×. While, Four Point Probe was used to
determine the conductivity of thin films.
2.2. Synthesis of N-alkoxyphenyl-N’-(4-chlorobenzoyl)thiourea
Scheme 1. General overview of synthetic work.

Int. J. Electrochem. Sci., Vol. 7, 2012
502
N-octyloxyphenyl-N’-(4-chlorobenzoyl)thiourea was successfully synthesized from several
continuous reactions which began with formation of the precursor compound (1). Then, the synthesis
was continued with the formation of compound (2) as an intermediate compound which in turn was
reacted with 4-chlorobenzoyl thiocyanate to obtain the final compound (3). For compound 1 and 2,
they have been reported before in previous occasions [23 - 27].
However, some modifications in the synthetic work and further characterization on the
spectroscopic and analytical tasks have been carried out and discussed in this report. Scheme 1 shows
the synthetic approach applied in this study.
2.2.1. Synthesis of compound 1, N-(4-(octyloxy)phenyl) acetamide
Generally, the synthesis began with the reaction between 4-hydroxy acetanilide (5.00 g, 1.0
mole), octyl bromide (6.34 g, 1.0 mole) and potassium carbonate (4.55 g, 1.0 mole), the mixture was
put at reflux with constant stirring in ca. 100 ml acetone for ca. 48 hours.
When adjudged completion by TLC (Hexane : CH2Cl2) (2 : 3), the reaction mixture was cooled
to room temperature followed by taken to dryness to give brown solid before the it was then stirred for
ca. 1 hour in 50 ml of 2 % sodium hydroxide to give compound 1 as white solid.
2.2.2. Synthesis of compound 2, 4-octyloxy aniline
Compound 1 was put at reflux for 2 hours in the mixture of ethanol and concentrated
hydrochloric acid (50 ml : 50 ml) to give solution of 4-octyloxy aniline hydrochloride. This solution
was then cooled to room temperature before washed with water : CH2Cl2 (150 ml : 150 ml). After
separation of the organic layer and dried over CaCl2 were done, the solvent was removed in vacuo to
give the off-white crystalline solid of title compound, 2.
2.2.3. Synthesis of compound 3, N-octyloxyphenyl-N’-(4-chlorobenzoyl)thiourea
A suspension of 4-chlorobenzoyl chloride (0.79 g, 1.0 mole) in 50 ml acetone was added with
ammonium thiocyanate (0.34 g, 1.0 mole) in 50 ml of acetone to give pale yellow solution. The
solution was stirred at room temperature for ca. 4 hours before 2 (1.00 g, 1.0 mole) was added. After
stirring for another ca. 4 hours, the colour of the solution was turned from pale to bright yellow. After
adjudged completion by TLC (hexane : CH2Cl2) (2 : 3), reaction mixture was cooled to room
temperature and filtered.
The yellow filtrate was added with 3 ice cubes and then filtered to obtain yellow precipitate.
Then, the precipitate was recrystallized from hot methanol to afford the title compound, 3. Physical
properties and analytical data of the synthesized compounds are shown in Table 1.

Int. J. Electrochem. Sci., Vol. 7, 2012
503
Table 1. Physical properties and analytical data of synthesized compounds.
*In bracket: theoretical percentage of element.
2.3 Electrochemical Measurements
The electrochemical study of 3 was performed using Electrochemical Impedance Spectroscopy
(EIS) PGSTAT302. A typical electrochemical impedance experimental set-up consists of an
electrochemical cell, a potentiostat/galvanostat and a General Purpose Electrochemical System
(GPES). The working electrode used was a Pt electrode with platinum wire electrode as counter
electrode. While, Ag/AgCl electrode was used as the reference electrode and all potentials were
reported against this electrode. Acetonitrile (CH3CN) and 0.5 M sulphuric acid (H2SO4) were used as
solvent and supporting electrolyte with concentration of 3 (1×10⁻³
M).
2.4 Thin Film Preparation
Thin films were prepared by applying different techniques for each layer. The first layer
deposited on ITO substrate was compound 3’s thin film by using electrochemistry method and second
layer is chlorophyll (CHLO) thin film which was deposited on top of the thin film layer of compound
3. ITO/3 thin films were deposited by the electrochemistry method using Electrochemical Impedance
Spectroscopy (EIS) PGSTAT302. The CHLO thin film was prepared by using spin coating technique.
In this study, Spin Coater Model WS-400B-6NPP-LITE was used. Spin coating is a procedure used to
apply uniform thin films to flat substrates with 4 stages of spin, 500 rpm for 10 seconds, 1000 rpm for
15 seconds, 1500 rpm for 20 seconds and 2000 rpm for 30 seconds to complete a cycle.
2.5 Electrical Conductivity of Thin Film in Dark and under Maximum Intensity of Light
Four Point Probe was used to determine the conductivity of thin films. In this study, sheet
resistivity in produced films was measured with complete four point probing system which consists of
Jandel Universal Probe combined with a Jandel RM3 Test Unit. Four probes were aligned and lowered
onto the sample.
Molecular
formula of
compound
Products Color
and Physical
State
Yields
%
Element (%)
C
H
N
S
C14H21NO2
1
White solid 82 % 73.23 %
(73.67 %)
10.29 %
(10.65 %)
5.36 %
(4.77 %)
-
C14H23NO
2
White crystalline
solid
59 % 75.88 %
(75.97 %)
10.10 %
(10.47 %)
5.28 %
(6.33 %)
-
C22N2H27SO2Cl
3
Pale-yellow
crystalline solid
72 % 62.61 %
(63.14 %)
7.12 %
(6.46 %)
7.37 %
(6.69 %)
7.97 %
(7.64%)

Int. J. Electrochem. Sci., Vol. 7, 2012
504
Two outer probes supply voltage differences that drive current through the film while two inner
probes pick up a voltage difference. The electrical conductivity of thin films was measured in the dark
and under different intensities of light condition (100 Wm-2
) by using Four-Point Probe and LI-200
Pyranometer Sensor with LI-1400 Data Logger.
Current output, which is directly proportional to solar radiation, was calibrated against Eppley
Precision Spectral Pyranometer (PSP) under natural daylight conditions in units of watts per square
meter (Wm-2
).
Under most conditions of natural daylight, the error is < 5 %. LI-1400 is a multipurpose data
logger that functions both as a data logging device and a multichannel auto ranging meter. Besides, LI-
1400 electronics was optimized to measure the current output of LI-COR radiation sensors, as well as
voltage sensors and sensors with a pulsed output.
3. RESULTS AND DISCUSSIONS
3.1. Spectroscopic Studies
1H NMR spectra for compounds 1 – 3 show the methyl resonance in the range of δH 0.89 - 0.92
ppm. Protons for alkoxy group are observed in range of δH 1.30 - 1.85 ppm. For –O-CH2- in all
compounds, the signals are detected in range of δH 3.82 - 4.01 ppm as three singlet resonances. The
aromatic protons are observed in range of δH 6.73 - 7.88 ppm as pseudo-doublet of the AB system in
the phenyl rings in the molecules and the resonances are strongly influenced by the para substituent on
the phenyl ring [28 - 30].
Protons for N-H are observed as singlet resonances in compounds 1 and 3 which can be
observed at δH 7.66 ppm, δH 9.08 and δH 12.34 ppm respectively. Instead, compound 2 has protons for
NH2 group which can be seen at δH 10.78 ppm.
The chemical structures for all synthesised compounds (1 – 3) and complete 1H NMR data are
presented in Figure 2 and Table 2 respectively.
Figure 2. Molecular structures of the synthesized compounds (1 - 3).

Int. J. Electrochem. Sci., Vol. 7, 2012
505
Table 2. 1H NMR data for all synthesized compounds.
Compound Moieties Chemical shift δH (ppm)
1
(t, 3JHH = 7 Hz, 3H, CH3)
(m, 12H, 6 x CH2)
(s, 3H, CH3)
(s, 2H, OCH2)
(pseudo-d, 3JHH = 9 Hz, 2H, C6H4)
(pseudo-d, 3JHH = 9 Hz, 2H, C6H4)
(s, 1H, NH)
0.89
1.30 - 1.81
2.14
3.91 - 3.95
6.83 – 6.85
7.37 - 7.39
7.65
2
(t, 3JHH = 7 Hz, 3H, CH3)
(m, 12H, 6 x CH2)
(s, 2H, OCH2)
(pseudo-d, 3JHH = 9 Hz, 2H, C6H4)
(pseudo-d, 3JHH = 9 Hz, 2H, C6H4)
(s, 2H, NH2)
0.89
1.38 - 1.78
3.82 - 3.85
6.73 – 6.75
7.29 – 7.37
10.78
3
(t, 3JHH = 7 Hz, 3H, CH3)
(m, 12H, 6 x CH2)
(s, 2H, OCH2)
(pseudo-d, 3JHH = 9 Hz, 2H, C6H4)
(pseudo-d, 3JHH = 9 Hz, 2H, C6H4)
(pseudo-d, 3JHH = 9 Hz, 2H, C6H4)
(pseudo-d, 3JHH = 9 Hz, 2H, C6H4)
(s, 1H, NH)
(s, 1H, NH)
0.92
1.32 - 1.85
3.98 - 4.01
6.95 – 6.97
7.29
7.54 – 7.58
7.86 – 7.880
9.08
12.34
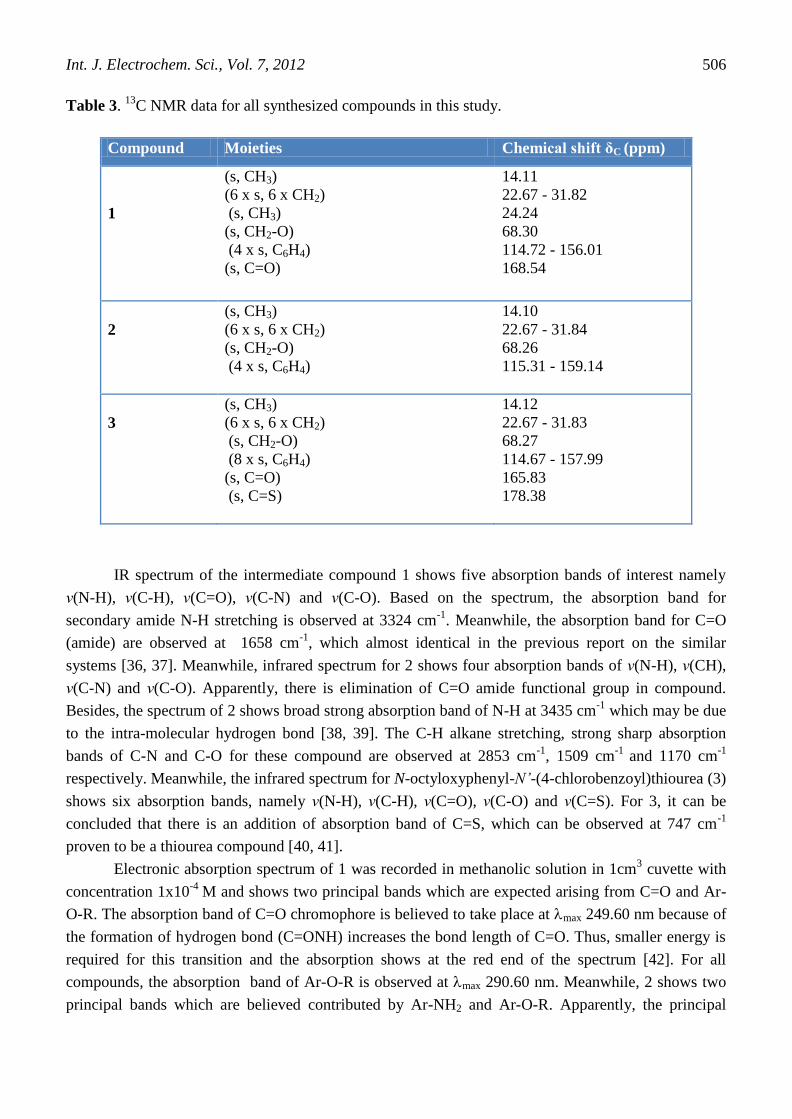
The 13
C NMR spectrum for 1 shows resonance of methyl group which is observed at δC 24.24
ppm whilst, carbon resonance for alkoxy groups in each compound (1 – 3) can be seen at δC 22.67 -
31.84 ppm. While the chemical shifts for –CH2-O- in all compounds are observed around δC 68.30
ppm due to the deshielding effect in the presence of oxygen atom that withdraws certain amount of
electrons from the alkyl chain [31].
Resonances of carbons for both aromatic rings in 3 are observed in range δC 114.67 - 159.14
ppm. Two resonances which are observed in range of δC 165.83 - 168.54 ppm and δC 178.38 ppm are
corresponded to carbons of C=O and C=S in compound 3.
Thiocarbonyl (C=S) carbon corresponds to thiourea moiety can be observed at higher chemical
shift δC 180.80 ppm [32, 33]. Resonances for C=O and C=S are slightly deshielded to higher chemical
shifts which may be due to intra-molecular hydrogen bonding of the compounds and electronegativity
attributed by oxygen and sulphur atoms [20, 34, 35]. The 13
C NMR data for all compounds are shown
in Table 3.
Int. J. Electrochem. Sci., Vol. 7, 2012
506
Table 3. 13
C NMR data for all synthesized compounds in this study.
Compound Moieties Chemical shift δC (ppm)
1
(s, CH3)
(6 x s, 6 x CH2)
(s, CH3)
(s, CH2-O)
(4 x s, C6H4)
(s, C=O)
14.11
22.67 - 31.82
24.24
68.30
114.72 - 156.01
168.54
2
(s, CH3)
(6 x s, 6 x CH2)
(s, CH2-O)
(4 x s, C6H4)
14.10
22.67 - 31.84
68.26
115.31 - 159.14
3
(s, CH3)
(6 x s, 6 x CH2)
(s, CH2-O)
(8 x s, C6H4)
(s, C=O)
(s, C=S)
14.12
22.67 - 31.83
68.27
114.67 - 157.99
165.83
178.38
IR spectrum of the intermediate compound 1 shows five absorption bands of interest namely
ν(N-H), ν(C-H), ν(C=O), ν(C-N) and ν(C-O). Based on the spectrum, the absorption band for
secondary amide N-H stretching is observed at 3324 cm-1
. Meanwhile, the absorption band for C=O
(amide) are observed at 1658 cm-1
, which almost identical in the previous report on the similar
systems [36, 37]. Meanwhile, infrared spectrum for 2 shows four absorption bands of ν(N-H), ν(CH),
ν(C-N) and ν(C-O). Apparently, there is elimination of C=O amide functional group in compound.
Besides, the spectrum of 2 shows broad strong absorption band of N-H at 3435 cm-1
which may be due
to the intra-molecular hydrogen bond [38, 39]. The C-H alkane stretching, strong sharp absorption
bands of C-N and C-O for these compound are observed at 2853 cm-1
, 1509 cm-1
and 1170 cm-1
respectively. Meanwhile, the infrared spectrum for N-octyloxyphenyl-N’-(4-chlorobenzoyl)thiourea (3)
shows six absorption bands, namely ν(N-H), ν(C-H), ν(C=O), ν(C-O) and ν(C=S). For 3, it can be
concluded that there is an addition of absorption band of C=S, which can be observed at 747 cm-1
proven to be a thiourea compound [40, 41].
Electronic absorption spectrum of 1 was recorded in methanolic solution in 1cm3 cuvette with
concentration 1x10⁻⁴
M and shows two principal bands which are expected arising from C=O and Ar-
O-R. The absorption band of C=O chromophore is believed to take place at max 249.60 nm because of
the formation of hydrogen bond (C=ONH) increases the bond length of C=O. Thus, smaller energy is
required for this transition and the absorption shows at the red end of the spectrum [42]. For all
compounds, the absorption band of Ar-O-R is observed at max 290.60 nm. Meanwhile, 2 shows two
principal bands which are believed contributed by Ar-NH2 and Ar-O-R. Apparently, the principal

Int. J. Electrochem. Sci., Vol. 7, 2012
507
absorption bands for this compound was shifted to the longer wavelength and bathochromic shift
towards the end of the spectrum. This is due to alkoxy group (-OR) and amine group (-NH2) have
forbidden n - π* (conduction band) transition and undergo electronic excitation from HOMO to
LUMO transition. It has been said that the stronger the donor and/or acceptor group should have longer
wavelength and cause small energy difference between ground and excited states [43]. For electronic
absorption spectrum of 3, the transition of Ar-Cl and the existence of C=O and C=S bands can be
observed. The absorption bands for C=O and C=S chromophores in thiourea compound can be
observed at max 245.40 nm and max 274.20 nm respectively. The electron donating group of Cl also
pronounced bathochromic shift on the n - π* transition and π - π* transition with a broad band at max
324.40 nm as an effect of conjugation. The broad absorption band observed in the region between max
245 nm to max 325 nm is due to π-conjugation of the compound with the phenyl rings (π - π*
transition) and orbital overlapping between C=O and C=S.
3.2. Thermal Stability Analysis
Thermal stability of the material fabricated onto solar cell is the major task for photovoltaic cell
application. Long term stability of photovoltaic cell should be stable under high temperature
environment over long period of time [44]. The thermal properties of the synthesized compounds (1, 2
and 3) were investigated by TGA at heating rate 10oC/min under nitrogen atmosphere. The
thermogram result is presented in Figure 3.
Figure 3. The thermogram of the synthesized compounds (1, 2 and 3).

Int. J. Electrochem. Sci., Vol. 7, 2012
508
Thermal stability of the compounds is estimated by using the temperature of onset of intense
thermal degradation, Td which determined by the point of intersection of tangents to two branches of
thermogravimetric curve. From thermograms, it shows that 1 has the highest onset temperature at
238oC while 2 stables up to 208
oC. The temperature onset of this intermediate compound, 2 is below
the precursor compound, 1 which may due to reason that 1 has higher molecular weight compared to 2.
Thus, 1 needs higher temperature to degrade itself. Meanwhile, the temperature of onset for 3 is at
211oC. In another words, 3 starts to degrade up to 200
oC. It has found that the onset temperature of 3 is
higher than 2 and it can be explained in term of the conjugated compound of thiourea (in this case, 3)
and overlapping orbitals between C=S and C=O. The thermal stability of the compound increases as
the temperature of degradation increase and it depends on the number of aliphatic carbon chains [45].
As a conclusion, the synthesized compounds show stability at high temperature in terms of thermal
stability and it gives the great potential for the fabrication of photovoltaic cells [46].
3.3. Electrochemistry Study
The interest of electrochemical study of thiourea compound, 3 is mainly due to certain
chemical characteristics, which provide different possibilities of application especially as inhibitor of
metallic corrosion [47, 48]. The initial electrochemical study of 1×10⁻³
M of 3 in acetonitrile has been
studied using cyclic voltammetry (in Figure 4). Through this method, it seems unobvious to observe
any redox peaks in this electrochemistry process and thus, it can be said that the electro-oxidation of 3
on platinum did not occur in the solvent individually. This is due to TU is a fairly large polarizable
molecule which is most likely to be solvated poorly in aqueous solutions exhibiting acid-base
properties [49].
Figure 4. Cyclic voltammogram of 3 in CH3CN on Pt electrode run at 0.05 V, 0.05 Vs-1
.
When using 0.5 M sulphuric acid as supporting electrolyte, the cyclic voltammogram of
thiourea (3) reveals a redox reaction, which the oxidation peak occurs at ∆Epa = 1.75 V with Ipa= 34.6
mA and the reduction peak occurs at ∆Epc = 0.69 V with Ipc= -9.7 mA, as shown in Figure 5.

Int. J. Electrochem. Sci., Vol. 7, 2012
509
Figure 5. Cyclic voltammogram of 3 (1 × 10⁻³
M) in CH3CN + 0.5 M sulphuric acid, 298 K at 0.05 V,
0.05 Vs-1
.
From Figure 5, it can be concluded that the pair of peaks, A and B become better defined when
the potential scan goes from 0 until 2.0 V. Peak A increases with number of scans, differ with peak B
which goes downward as increasing of scan numbers. Meanwhile, the voltammogram obtained in
Figure 6, runs on platinum in aqueous 0.5 M sulphuric acid (blank) shows a pair of peaks formed
between -1 and 0 V which refer to the regions related to hydrogen electrosorption (-0.25 V ≤ E ≤ 0.22
V), oxygen monolayer formation and electroreduction (0.2 V≤ E ≤ 1.2 V) [50, 51].
Figure 6. Cyclic voltammogram of platinum in 0.5 M sulphuric acid, 298 K at 0.05 V, 0.05 Vs-1
.
Moreover, the comparison between the stabilized cyclic voltammogram in 0.5 M sulphuric acid
+ 0.5 M of thiourea 3 (in Figure 5), with the voltammogram runs on platinum in aqueous 0.5 M
sulphuric acid, as blank (in Figure 6) have been carried out in order to show the presence of 3. From

Int. J. Electrochem. Sci., Vol. 7, 2012
510
both voltammograms, the voltammogram of blank show a pair of current peak between -0.5 V and -0.2
V whilst those in Figure 5 appears in the potential region between 0 V until 2.5 V. Thus, it could be
concluded that in the presence of 3, the characteristic current peaks of hydrogen adsorption/desorption
on Pt is not longer observed. Otherwise, this effect also can be associated to the presence of adsorbed
species on the electrode species [52]. Obviously, the electrochemistry of 3 appears in the positive
region with its electro-oxidation stage, peak B and peak A as a cathodic peak with a peak to peak
separation about 1 V.
It has been reported that formamidine disulphide (FDS) ions are formed as a product from
thiourea electro-oxidation in acid solutions on platinum, by either chemical or electrochemical
methods [53]. In addition, Jiang and co-workers claimed that FDS is one of the products of thiourea
oxidation path on platinum in the presence of chloride ions using cyclic voltamperometry and Fourier
Transform Infrared Spectroscopy (FTIRS) [54]. Moreover, García et al., (2006) have determined that
FDS could decompose to S, NH2CN and thiourea in a second step due to the catalytic effect of the
platinum surface [52]. The sulphur adsorbed on Pt surface could be further oxidized into HSO4- and
SO42-
ions at high potential. There was a report claimed that the first oxidation of thiourea is defined at
~0.7 V which represents to the formation of formamidine disulphide (TU)2+
[54], as shown in Scheme
2.
Scheme 2. The mechanism of the electrochemical oxidation of thiourea.
However, from this study, the oxidation peak of 3 is observed at ∆Epa = 1.75 V and there was
no another peak is obtained around 0.7 V in order to claim as the oxidation of TU to form FDS. Based
on [55], for E > 0.65 V, the oxidation of 3 can be described as a complex process which intermediates
compete with oxide layer formation of platinum surface. Thiourea in general is widely known to has
sulphur atom of C-S group as possible donor sites and consequently, they are readily adsorbed on
metals via a metal-sulphur bond where by the strength of this bond depending on the solution
composition and the electric field at the metal-solution interface, it is likely 3 behaves as other typical
thiourea derivatives [56, 57]. Thus, it can be concluded that non-disruptive molecular interactions of 3
with the platinum surface lead to molecular adsorbate formation [55], where by [Pt]x denotes the
number of platinum surface atoms involved in the adsorption of a single molecule of a thiourea and X
≡ H or CH3 group (in Scheme 3).
[Pt]x + (H2N)(XHN)(CS) [Pt]x(H2N)(XHN)(CS)]ad
Scheme 3. The electrochemical reaction for molecular adsorbate formation.

Int. J. Electrochem. Sci., Vol. 7, 2012
511
As for thiourea, it particularly bearing at least a hydrogen atom exists in tautomeric thiolate
forms to yield metal-thiolate-type ligand [58], as shown in Scheme 4 below.
R1NHC(=S)NHR2 R1HNC(SH)NR2
Scheme 4. Tautomeric form of thiourea in solution.
Thus, it can be concluded that the electrooxidation stage that occur at 1.75 V can be described
as a complex reaction under intermediate kinetics in the presence of adsorbed residues. Adsorbates
intermediates decompose yielding sulphate ions, carbon dioxide and cyanamide which are electro-
oxidised for E > 1.0 V [59]. Their relative yield depends on the type of thiourea considered.
Meanwhile, the electroreduction of formamidine disulphide (FDS) on Pt can also be interpreted as a
complex reaction which begins with the transport of FDS ions from the solution to the electrode
surface and followed by an electron transfer reaction yielding thiourea. A deprotonated thiourea
adsorbate and the soluble species further electroreduced to thiourea which confirm the irreversible
behavior of this reaction and the existence of cathodic peak [53].
3.4. Surface Morphology
By using SEM, the surface morphology of 3 was viewed and exhibited as smooth and solid
surface.
Figure 7. Surface morphology of 3 by 2000× (left) and 10000× (right) magnifications.
This image clearly indicates that the surface was compact and smooth, as shown in Figure 7.
With this surface, 3 it would be easier to digest and dissolve in solvent and thus it causes the
distribution of 3 have become smooth on ITO surface. The smooth surface enhances the maximum
absorption of the sun energy with high electrical conductivity and thus should give its potential to be as
photovoltaic cell.

Int. J. Electrochem. Sci., Vol. 7, 2012
512
3.5. Electrical Conductivity of ITO/TU/CHLO Thin Film (TU = Compound 3)
The organic photovoltaic thin films were prepared by different techniques for each layer. First
layer that had been deposited on the ITO substrate was compound 3’s thin film prepared by using
electrochemistry method and second layer was chlorophyll (CHLO) thin film which was deposited on
thin film of 3 (as shown in Figure 8).
The electrical conductivity of ITO/3/CHLO thin film was then determined by using Four Point
Probe in order to investigate its conductive ability in various conditions. Table 4 shows the electrical
conductivity values of TU/CHLO in the dark and various light conditions and the bar charts in Figure
9 represents these values.
Electrical conductivity of 3 without chlorophyll (CHLO) was observed under few intensities (0,
30, 50 and 100 Wm-2
) and the results show that its electrical conductivity increases with increasing
intensity. Besides, it shows that 3 conducts electricity at most under maximum light intensity, 100
Wm-2
with 6×10⁻⁴
Sm-1
differ conductivity reading with dark condition.
As expected, when chlorophyll layer combined with thin film of 3 to form ITO/3/CHLO, it
shows that the electrical conductivity increased in these conditions. In this case, it can be concluded
that the introduction of CHLO thin film affects the performance of the ITO/3/CHLO thin film; which
the ability of thin film to conduct electricity could be better with the existence of CHLO thin film.
Apparently, it shows that electrical conductivity of 3 thin film is the most highest in maximum light
condition but it performed better with the combination of CHLO thin film with 3/ITO thin films.
Figure 8. Organic Photovoltaic Cell Design.
Table 4. The electrical conductivity of ITO/3/CHLO in the dark and light condition in presence of
Chlorophyll thin film
Light Intensity
(Wm-2
)
Electrical Conductivity (Sm-1
)
Without CHLO With CHLO
Dark Condition 0.1437 0.1943
Light Condition (30 Wm-2
) 0.1437 0.2019
Light Condition (50 Wm-2
) 0.1439 0.2063
Light Condition (100 Wm-2
) 0.1443 0.2140
N-octyloxyphenyl-N’-(4-
chlorobenzoyl)thiourea (3)

Int. J. Electrochem. Sci., Vol. 7, 2012
513
Figure 9. The electrical conductivity of compounds in both conditions, with and without chlorophyll.
4. CONCLUSION
A linear conjugated organic compound of A-ArC=ONHC=SNHAr-D, namely N-
octyloxyphenyl-N’-(4-chlorobenzoyl)thiourea has been successfully designed, prepared and
characterised prior to form thin films. The compound was spectroscopically and analytically
characterized by 1H and
13C NMR, FT-IR, UV-vis, TGA, CV, SEM, CHNS Elemental Microanalysis
and Four Point Probe for its conductivity behavior determination. From the electrical conductivity
data, ITO/3 thin film under maximum light intensity (0.1443 Sm-1
) was higher in conductivity than
under dark condition (0.1437 Sm-1
), but it performes better when introducing chlorophyll thin film to
form ITO/3/CHLO layers, with increasing electrical conductivity, 0.0442 Sm-1
. With this promising
result, it shows that 3 and most possibly this type of molecular framework featuring thiourea moiety
can act as solar cell with an utmost performance.
ACKNOWLEDGEMENTS
This work was supported by Faculty of Science and Technology Postgraduate Research Fund,
MyBrain Fund for postgraduate student’s fellowship. Special acknowledgement also dedicated to
Institute of Marine Biotechnology (IMB) for NMR analysis, Institute of Oceanography (INOS) for
SEM analysis and Department of Physical Sciences Research Laboratory, Faculty of Science and
Technology, Universiti Malaysia Terengganu for physical instrumentations and characterizations.
References
1. S. O. Kang, D. Kim, M. -S. Kang, K. Song and J. Ko, Tetrahedron, 64 (2008) 10417.

Int. J. Electrochem. Sci., Vol. 7, 2012
514
2. J. K. Casper, Energy powering the past, present, and future, Chelsea House Publishers, New York,
2007.
3. T. Leia, Journal of Young Investigators, 22 (5) (2005) [Nov 2011]
4. X. Yin, Y. Li, Y. Zhang, P. Li and J. Zhao, J. Chem. Phys. Lett., 422 (2006) 111 - 116.
5. S. Roth, S. Blumentritt, M. Burghard, E. Cammi, D. Carroll, S. Curran, G. Diisberg, K. Liu, J.
Philipp, G. Muster and T. Rabenau, Synth. Met., 94 (1998) 105 – 110.
6. H. Mizuseki, N. Igarashi, C. Majumder, R. V. Belosludov, A. A. Farajian and Y. Kawazoe, Thin
Solid Films, 438 (2003) 235 – 237.
7. P. Zhao, P. J. Wang, Z. Zhang, & D.S. Liu, Physica B: Condensed Matter, 406 (4) (2009) 895 –
898.
8. K. Sanghoon, C. Hyunbong, B. Chul, S. Kihyung, O. K. Sang and K. Jaejung, Tetrahedron, 63
(2007) 11436 – 11443.
9. S.-H. Baek, H. S. Jang and J. H. Kim H. K, Curr. Appl. Phys., 11 (1) (2010) S30 – S33.
10. T. Haining , Y. Xichuan, C. Jiayan, C. Ruikui, T. Chao, L. Jing, H. Yan, W. Lei and S. Licheng,
Dyes and Pigments, 84 (2010) 62 – 68.
11. C.-Y. Yu, B. -T. Ko, C. Ting and C.-P. Chen, Sol. Energy. Mat. Sol. Cells, 93 (2009) 613 – 620.
12. B. Lim, J. Jo, D. Khim, H.-G. Jeong. B.-K. Yu, J. Kim and D.-Y. Kim, Org. Electron., 11 (2010)
1772 – 1778.
13. M.-G. Kang, H. J. Park, S. H. Ahn and L.J. Guo, Sol. Energy. Mat. Sol. Cells, 94 (2010) 1179 –
1184.
14. S. Ping, L. Yijiang, H. Xianwei, Z. Bin, X. Na, F. Junjie, L. Liming, W. Xueye, H. Hui and T.
Songting, Dyes and Pigments, 83 (2009) 187 – 197.
15. S.Ver-Bruggen, http://www.plusplasticelectronics.com/energy/transparent-electrodes-for-flexible-
electronics developed-219767. aspx. (2010) [21 Dec 2010].
16. S.-I. Na, B.-K., Yu, S.-S. Kim, D. Vak, T.-S. Kim, J.-S. Yeo and D.-Y. Kim, Sol. Energy. Mat. Sol.
Cells, 94 (8) (2010) 1333 – 1337.
17. O. Lupan, I. V. M. Guérin, I. M. Tiginyanu, V. V. Ursaki, L. Chow, H. Heinrich and T. Pauporté,
J. Photochem. Photobiol. A: Chem., 211 (2010) 65 – 73.
18. C. Marcos, J. M. Alía, V. Adovasio, M. Prieto and S. García-Granda, Acta Cryst., C54 (1998)
1225-1229.
19. D. Bülent, K. Fatma and C. Mustafa, J. Hazard. Mater., 163 (2009) 1148 – 1156.
20. R. Del Campo, J. J. Criado, G. Ruxandra, J. G. Francisco, M. R. Hermosa, S. Francisca, L. M.
Juan, M. Enrique and E. Rodrίguez-Fernάndez, J. Inorg. Biochem., 98 (2004) 1307 – 1314.
21. D. N. Upadhyay1 and V. Yegnaraman, Mat. Chem. Phys., 62 (2000) 247 - 253.
22. N. Kamoun, H. Bouzouita and B. Rezig, Thin Solid Films, 515 (2007) 5949 – 5952.
23. G. Marie-Andrée, E. L. Mark, J. C. Simon, G. Thomas, B. H. Michael and W. B. Duncan, J.
Chem. Soc., Dalton Trans., (2000) 1437 – 1445.
24. E. Westphal, I. H. Bechtold and H. Gallardo, Macromolecules, 43(3) (2010) 1319 – 1328.
25. M. Kukut, B. Kiskan and Y. Yagci, Des. Mon. Polym., 12(2) (2009) 167 - 176.
26. L. Seng Kue, N. Yu, S. Lu, T. Masatoshi, T. Hideo, W. Junji, Liq. Cryst., 34 (8) (2007) 935 – 943.
27. M. J. Hearn, M. F.Chen, M. H., Cynamon, R. W. Ondu and R. Eleanor,
J. Sulf. Chem., 27(2)
(2006) 149 – 164.
28. M. S. M, Yusof, R. H., Jusoh, W .M. Khairul and B. M. Yamin, J. Mol. Struct., 975 (2010) 280–
284.
29. L. S. Szczepura, K. K. Eilts, A. K. Hermetet, L. J. Ackerman, J. K. Swearingen and D. X. West, J.
Mol. Sci., 607 (2002) 101 – 110.
30. M. G. Babashkina, D. A. Safin, M. Bolte and A. Klein, Inorg. Chem. Commun., 12 (2009) 678 –
681.
31. A.Tadjarodi, F. Adhami, Y. Hanifehpour, M. Yazdi, Z. Moghaddamfard and G. Kickelbick,
Polyhedron, 26 (2007) 4609 – 4618.
Int. J. Electrochem. Sci., Vol. 7, 2012
515
32. Ϊ.Küçükgüzel, E. Tatar, S. G. Küçükgüzel, S. Rollas and E. De Clercq, Eur. J. Med. Chem., 43
(2008) 381 - 392.
33. L. V. Sudha and D. N. Sathyanarayan, Spectrochim. Acta, 40A (8) (1984) 751 – 755.
34. G. Kavak, S. özbey, G. Bİnzet and N. KÜlcÜ, Turk. J. Chem., 33 (2009) 857 – 868.
35. A.Saeed, A. A. Isab and H. P. Perzanowski, Transition Met Chem, 27(2002) 782 – 785.
36. Y. Akiyama, S. Fujita, H. Senboku, C. M. Rayner, S. A. Brough and M. Arai, J. Supercrit. Fluids,
46 (2008) 197 - 205.
37. M. Mureseanu, A. Reiss, N. Cioatera, I. Trandafir and V. Hulea, J. Hazard. Mater., 182 (2010)
197 – 203.
38. A.Y. Arasi, J. J. L. Jeyakumari, B. Sundaresan, V. Dhanalakshmi and R. Anbarasan,
Spectrochim. Acta Part A, 74 (2009) 1229 - 1234.
39. D. Gambino, E. Kremer and E. J. Baran, Spectrochim. Acta Part A, 58 (2002) 3085 - /3092.
40. P. Bombicz, I. Mutikainen, M. Krunks, T. Leskel, J. Madarász and L. Niinistö, Inorg. Chim. Acta,
357 (2004) 513 – 525.
41. J. T. J. Prakash and L. R. Nirmala, International Journal of Computer Applications, (0975 – 8887)
6 (2010) 7.
42. G. Madhurambal, M. Mariappan and S. C. Mojumdar, J. Therm. Anal. Calorim., 100 (2010) 853 –
856.
43. M. M. M. Raposo, A. M. F. P. Ferreira, M. Belsley and J.C.V.P. Moura, Tetrahedron, 64 (2008)
5878 - 5884.
44. H. Matsui, K. Okada, T. Kitamura and N. Tanabe, Sol. Energy. Mat. Sol. Cells, 93 (2009) 1110 -
1115.
45. B. J. Vasanthi and L. Ravikumar, Eur Polym J., 43 (2007) 4325 - 4331.
46. T. A. Li, F. W. Chen, A. Cuevas and J. E. Cotte, European Photovoltaic Solar Energy Conference,
WIP-Renewable Energies, Germany (2007) 1326 - 1331.
47. L. M. Gassa, J. Lambi, A. E. Bolzán and A. J. Arvia, J. Electroanal. Chem., 527 (2002) 71.
48. B. G. Ateya, B. E. El-Anadoul and F. M. El-Nizamyi, Corros. Sci., 24 (6) (1984) 497 – 507.
49. M. Hoffman and J. O. Edwards, J. Inorg. Chem., 16 (1977) 3333.
50. M. Łukaszewski, M. Grdeń and A. Czerwiński, Journal of New Materials for Electrochemical
System, 9 (2006) 409 – 417.
51. M. Łukaszewski, M. Grdeń, A. Czerwiński, Electrochim. Acta, 49 (2004) 3161.
52. G. García, J. L. Rodríguez, G. I. Lacconi and E. Pastor, Journal of Electroanalytical Chemistry,
588 (2006) 169 – 178.
53. A.E. Bolzán, I. B. Wakenge, R. C. Salvarezza and A. J. Arvia, J. Electroanal. Chem., 475 (1999)
181 – 189.
54. M. Yan, K. Liu and J. Z. Jiang, J. Electroanal. Chem., 408 (1996) 225 – 229.
55. A.E. Bolzán, R. C. V. Piatti, R. C. Salvarezza and A .J. Arvia, J. Appl. Electrochem., 32 (2002)
611 – 620.
56. M. Fleischman, I. R Hill and G. Sundholm, J. Electroanal. Chem., 157 (1983) 359 – 368.
57. C.A. Widrig, C. Chung and M. D. Porter, J. Electroanal Chem., 310 (1991) 335.
58. S. Bourne and K.R. Koch, J. Chem. Soc., Dalton Trans., (1993) 2071 - 2072.
59. A.E. Bolzán and A. J. Arvia, J Solid State Electrochem., 12 (2008) 529 – 543.
© 2012 by ESG (www.electrochemsci.org)


![Synthesis, Characterization And Electrochemical ...sphinxsai.com/2018/ch_vol11_no1/2/(216-227)V11N01CT.pdf · ] macrocyclic complexes General procedure for the synthesis of [16]-membered](https://img.pdfslide.net/doc/110x75/5f07e1297e708231d41f3682/synthesis-characterization-and-electrochemical-216-227v11n01ctpdf-macrocyclic.jpg)