Embed Size (px)
Citation preview
Journal of Materials Science and Chemical Engineering, 2015, 3, 39-51 Published Online July 2015 in SciRes. http://www.scirp.org/journal/msce http://dx.doi.org/10.4236/msce.2015.37005
How to cite this paper: Labhane, P.K., Huse, V.R., Patle, L.B., Chaudhari, A.L. and Sonawane, G.H. (2015) Synthesis of Cu Doped ZnO Nanoparticles: Crystallographic, Optical, FTIR, Morphological and Photocatalytic Study. Journal of Materials Science and Chemical Engineering, 3, 39-51. http://dx.doi.org/10.4236/msce.2015.37005
Synthesis of Cu Doped ZnO Nanoparticles: Crystallographic, Optical, FTIR, Morphological and Photocatalytic Study P. K. Labhane1, V. R. Huse1, L. B. Patle1, A. L. Chaudhari1, G. H. Sonawane2* 1MGSM’s Arts, Science and Commerce College, Chopda, India 2Kisan Arts, Commerce and Science College, Parola, India Email: *[email protected] Received 24 March 2015; accepted 22 June 2015; published 25 June 2015
Copyright © 2015 by authors and Scientific Research Publishing Inc. This work is licensed under the Creative Commons Attribution International License (CC BY). http://creativecommons.org/licenses/by/4.0/
Abstract Nanoparticles of Zn1−xCuxO system with nominal compositions x = 0.0, 0.01, 0.02 and 0.03 were prepared by co-precipitation method at room temperature. Structural, morphological, optical and chemical species of grown crystals were investigated by X-ray diffraction (XRD) technique, Scan-ning Electron Microscopy (SEM), UV-visible and FTIR spectroscopy, respectively. XRD analysis con- firms that all samples have hexagonal structure with no impurity phases which suggest that Cu ion successfully incorporated into the regular ZnO crystal structure. The lattice parameters, volume of unit cell, X-ray density, atomic packing fraction, c/a ratio, and grain size were calculated from XRD pattern of pure and Cu doped ZnO samples and it was found that the grain size was in the range of 23 nm to 29 nm. The strain in pure and Cu doped ZnO samples was calculated by W-H analysis. Optical properties of Zn1−xCuxO samples were studied by using UV-vis spectrophotometer. Optical absorption spectra show that the band gap decreases with increasing Cu contents. The functional group and chemical interactions of Zn1−xCuxO samples were also determined at various peaks us-ing FTIR data and observed that the functional groups corresponding to the Zn-O bands in the samples. The photocatalytic activities of the samples were investigated by oxidation of methylene blue under UV light illumination in batch reactor. The scavenger study was carried out to find out main reactive species responsible for the degradation of dyes.
Keywords ZnO, Nanostructure, Bandgap, Photocatalytic Activity, Scavenger Study
*Corresponding author.
P. K. Labhane et al.
40
1. Introduction With great ability to manipulate structure of the materials on the level of individual atoms and molecules, the nanotechnology is a promising highly interdisciplinary field. The unique optical and electrical properties of ZnO nanomaterial such as wide band gap of 3.37 eV, large exciton binding energy of 60 meV and high electron mo-bility at room temperature make it suitable for new application and devices. Nanostructures ZnO have many po-tential application in photocatalysis [1] [2], solar cell [3] [4], gas sensors [5] [6], fuel cells [7], photovoltaics [8], antibacterial action [9] and so on. Due to its inexpensiveness, nontoxic and environmentally safe, it has attracted more attention over last few years. Recently, modified ZnO was prepared by doping with transition metals such as Ag [10], Mn [11], Fe [12], Co [13], Cr [14], Al [15] and Pd [16]. The results of these transition metals doped ZnO show that the optical, magnetic and electrical properties changed with the change in concentration of tran-sition metal. Electronic conductivity of Cu is very high and it is cheap and highly available on Earth’s crust and so it is important metal for doping [17]. The doping of Cu in ZnO is expected to modify absorption, and other physical or chemical properties of ZnO [18] [19].
There has been increasing interest in environmental purification by heterogeneous photocatalysis using semi-conductor. Heterogeneous photocatalysis is an effective method to degrade a large number of organic and inor-ganic contaminants in waste water. The surface area and surface defects are important parameters in photocata-lytic activity of semiconductor metal oxide. Several metal oxides have been used as photocatalyst such as TiO2, Nb2O5, Cu2O, and ZrO2 [20]-[23]. ZnO nanoparticle is the most promising catalyst for the degradation of organ-ic pollutants because of its high surface activity, crystalline size, morphologies and textures [24]. The initial step in ZnO-mediated photocatalysis degradation is proposed to involve the generation of an electron and hole (e−/h+) pair. In aqueous solution valence band holes produce hydroxyl radicals (∙OH) and conduction band electrons produce superoxide radical anion ( 2O− ). These radicals are the oxidizing species in the photocatalytic oxidation processes, among which the hydroxyl radical is recognized to be the most powerful oxidizing species and can attack organic pollutants present at or near the surface of photocatalyst [25].
Doping of photocatalyst with metal ions creates local energy levels within the band gap of the photocatalyst, with corresponding absorption bands lying in the visible spectral range. The photoexcitation of such impurities should lead to the generation of free charge carriers to initiate surface chemical processes but the efficiency of such systems under visible light strongly depended on the preparation method used. In some cases, such doped photocatalyst showed no activity under visible light and lower activity in the UV spectral range compared with the non-doped photocatalyst because of high carrier recombination rates through the metal ion levels [26].
In this present work, we report the structural, optical, morphological, IR and photo catalytic properties of pure and Cu doped nanoparticles. A number of samples of Cu doped ZnO with different concentrations were synthe-sized by using co-precipitation method. The photo catalytic studies of prepared samples were evaluated by re-cording the spectra of methylene blue dye solution with catalyst at regular intervals.
2. Materials and Experimental 2.1. Synthesis of Doped and Undoped ZnO All chemicals used to prepare pure and Cu doped ZnO were purchased from Sigma-Aldrich and used without further purification. The Zn1−xCuxO nanopowder (x = 0.0, 0.01, 0.02 and 0.03) were prepared by co-precipitation method using zinc acetate dihydrate as the source of zinc and copper acetate were used as the source of dopants. In typical process zinc acetate dihydrate and copper acetate in their respective stoichiometry were dissolved in ethanol separately. Both the solutions were mixed thoroughly and to this mixture NaOH solution in ethanol were added by constant magnetic stirring for 2 hours at room temperature. The obtained precipitate was separated from the solution by filtration, washed several times with distilled water and ethanol then dried in air at 100˚C and calcined at 450˚C for 8 hours to obtain Cu doped ZnO nanocrystals (x = 0.01, 0.02 and 0.03). Undoped ZnO (x = 0.0) was synthesized by the similar process except with copper acetate.
2.2. Photocatalytic Activity The photocatalytic degradation of methylene blue was determined by using 25 ml aqueous solution (with initial concentration 20 ppm) and 20 mg of catalyst in a 100 ml quartz beaker. The solution was stirred in dark for 15 minute to allow the equilibrium to take place between methylene blue dye solution and the catalyst. The photo-
P. K. Labhane et al.
41
degradations were carried out using five UV tubes (6 W each of wavelength 365 nm) keeping the sample at ho-rizontal position at a distance 15 cm in a batch reactor. At different time intervals 5 ml sample was collected and centrifuged to separate the catalyst from the solution to record the spectra on Shimadzu UV-visible Spectropho-tometer (UV-1800). After recording spectra the sample was pour back to original dye solution. All the experi-ments were carried out at identical condition and at room temperature. The degradation of methylene blue dye solution was noticed by integrating area under the absorbance curve. The percentage degradation (removal) was calculated by using following equation;
0
0
% removal 100tC CC
−= ×
(1)
where 0C and tC are the concentration of the methylene blue dye solution at the initial and any other time, respectively.
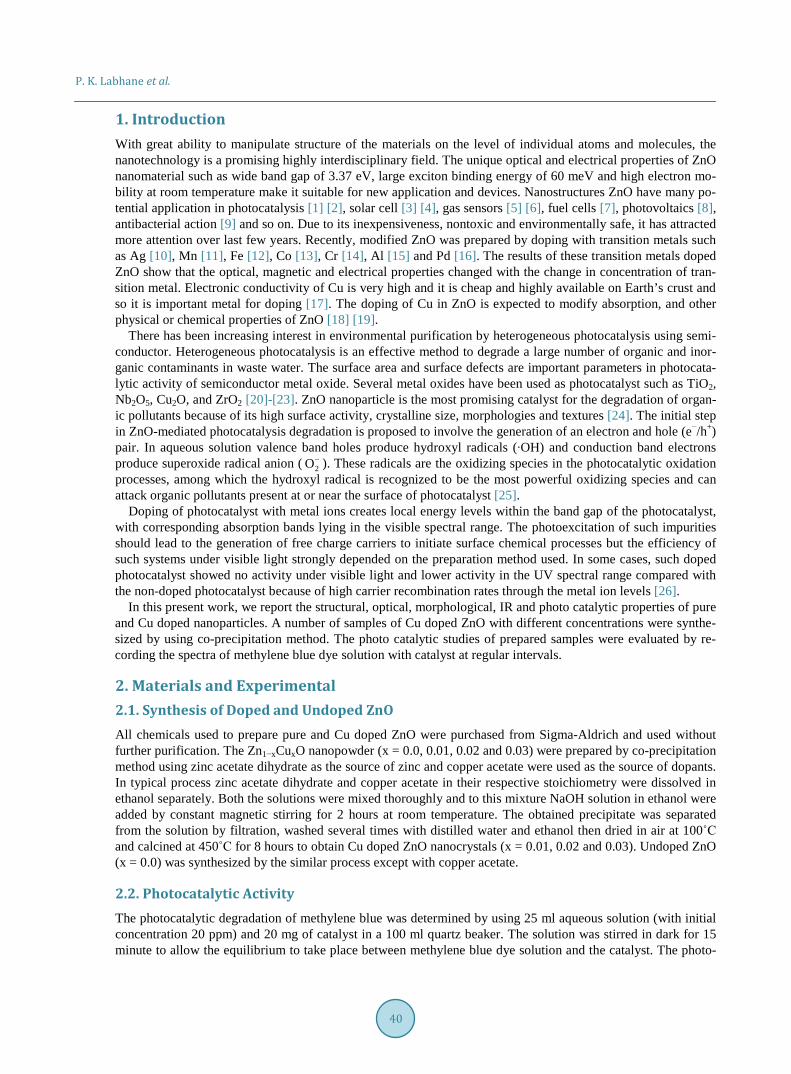
3. Result and Discussion 3.1. XRD Analysis The crystal structure of Zn1−xCuxO samples with concentration x = 0.0, 0.01, 0.02 and 0.03 shown in Figure 1 were determined by X-ray diffractometer (Bruker D8 Advance Diffractometer) with CuKα radiations (λ = 1.5416 Å) in the range of 20˚ to 80˚ at room temperature. The sharp intense peak obtained in all the samples at 2θ ≈ 30.80, 34.22, 35.38, 46.70, 54.88, 62.02, 67.12 and 68.23 corresponds to the lattice plane (100), (002), (101), (102), (110), (103), (112) and (201) respectively confirms that the prepared samples are good crystalline in nature with wurtzite hexagonal structure and are agree with the JCPDS data (01-075-1533).
20 30 40 50 60 70 80
x = 0.0
2θ
x = 0.01
Inte
nsity
(A.U
)
x = 0.02
x = 0.03(2
01)(112
)
(103
)
(110
)
(102
)
(101
)(0
02)(100
)
Figure 1. XRD pattern of Zn1−xCuxO samples with con-centration x = 0.0, 0.01, 0.02 and 0.03.
P. K. Labhane et al.
42
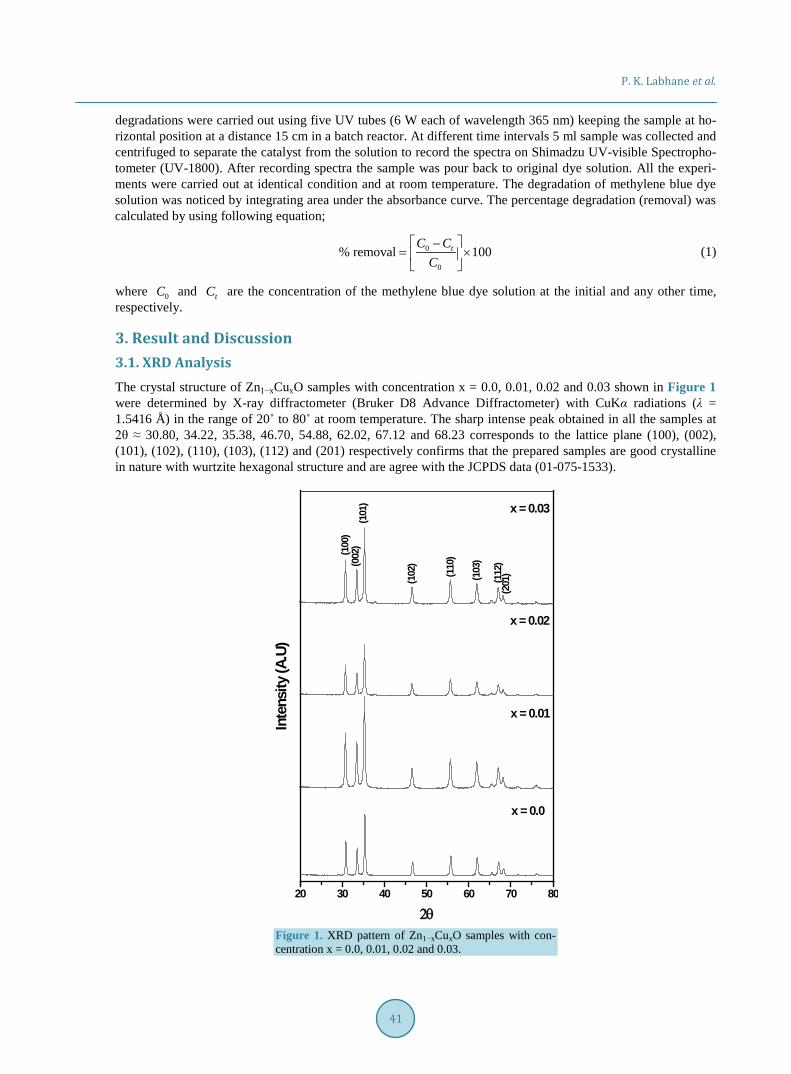
The structural data obtained from XRD pattern of pure and Cu doped ZnO nanomaterial is tabulated in the Table 1. The plot of lattice parameters “a” and “c” versus Cu concentration is shown in Figure 2. From Figure 2, it is observed that the lattice parameter “c” increase rapidly upto 1%, then slowly increase upto 2% and then decreases rapidly. At the same time the lattice parameter “a” decrease rapidly upto 1%, then slowly decrease upto 2% and then increase rapidly. This may be discussed in details as; the Cu can exist in Cu+, Cu2+ and Cu3+ ions having ionic radii 0.77 Å, 0.73 Å & 0.54 Å respectively. This shows that the lattice parameter “c” increase rapidly upto 1% due to the substitution of Cu+ ions into the Zn2+ ions since the ionic radius of Cu2+ (0.73 Å) is greater than of Zn2+ (0.74 Å). The slow increment in lattice parameter “c” from concentration 1% to 2% shows that the substitution of Cu+ (0.77 Å) and Cu2+ (0.73A Å) ions in Zn2+ (0.74 Å) site indicating that the percentage of Cu+ (0.77 Å) ions is slightly more than Cu2+ (0.73 Å) ions. This means there is a transition phase of Cu+ and Cu2+ ions from 1% to 2% of Cu dopant. The lattice parameter “c” decreases rapidly after 2% of Cu, owing to substitution of Cu2+ (0.73 Å) and Cu3+ (0.54 Å) ions in Zn site.
The number of unit cell in particle is calculated by using formula [27],
4
3π2
NDV
= (1)
It is observed that the number of unit cell per particle increases upto 2% and then decreases. This shows that the ionic radii of Cu ions leads to shrinking of unit cell per particle in such way that lattice parameter “c” in-crease as “a” decrease and vice versa. Table 1. Lattice parameter, volume of unit cell, x-ray density, atomic packing fraction, c/a ratio, grain size, W-H grain size and strain of Zn1−xCuxO samples with concentration x = 0.0, 0.01, 0.02 and 0.03.
Conc. (x)
Lattice parameter in (Å) Volume
in (Å)3
X-ray density Dx in (kg/cm3)
Atomic packing factor
c/a ratio Grain
size (D) in nm
W-H grain size (G) in nm
Strain (ε)
Energy Band
Gap (eV) a c
0.00 3.3287 5.2777 50.6421 5.3399 0.7273 1.5855 28.69 39.49 0.00102 3.46
0.01 3.3113 5.3465 50.7674 5.3267 0.7142 1.6146 23.94 33.16 0.00121 3.27
0.02 3.3109 5.3475 50.7646 5.3270 0.7140 1.6151 25.83 40.41 0.00148 3.20
0.03 3.3197 5.2864 50.4517 5.3601 0.7242 1.5924 26.67 40.17 0.00134 3.55
Figure 2. Lattice parameters “a” and “c” versus Cu concentration.
0.00 0.05 0.10 0.15 0.20 0.25 0.303.309
3.312
3.315
3.318
3.321
3.324
3.327
3.330
3.333
a c
Cu concentration
Latti
ce p
aram
eter
a (Å
)
5.27
5.28
5.29
5.30
5.31
5.32
5.33
5.34
5.35
5.36
Lattice parameter c (Å)
P. K. Labhane et al.
43
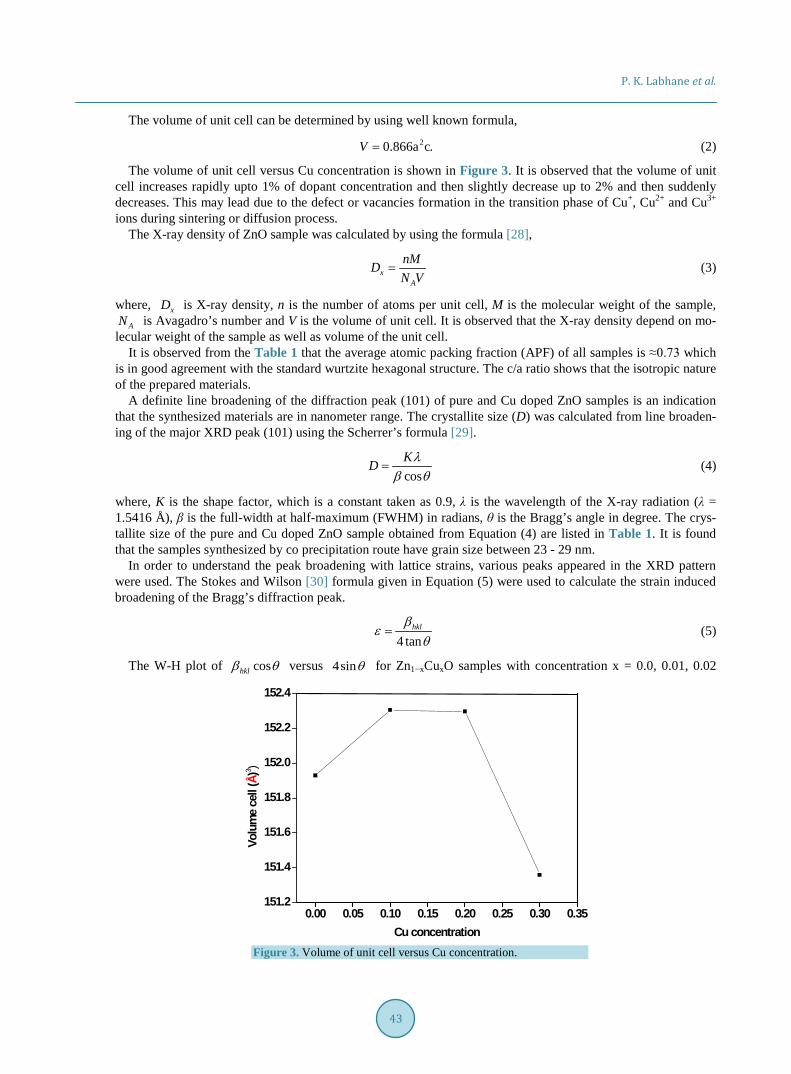
The volume of unit cell can be determined by using well known formula, 20.866a c.V = (2)
The volume of unit cell versus Cu concentration is shown in Figure 3. It is observed that the volume of unit cell increases rapidly upto 1% of dopant concentration and then slightly decrease up to 2% and then suddenly decreases. This may lead due to the defect or vacancies formation in the transition phase of Cu+, Cu2+ and Cu3+ ions during sintering or diffusion process.
The X-ray density of ZnO sample was calculated by using the formula [28],
xA
nMDN V
= (3)
where, xD is X-ray density, n is the number of atoms per unit cell, M is the molecular weight of the sample, AN is Avagadro’s number and V is the volume of unit cell. It is observed that the X-ray density depend on mo-
lecular weight of the sample as well as volume of the unit cell. It is observed from the Table 1 that the average atomic packing fraction (APF) of all samples is ≈0.73 which
is in good agreement with the standard wurtzite hexagonal structure. The c/a ratio shows that the isotropic nature of the prepared materials.
A definite line broadening of the diffraction peak (101) of pure and Cu doped ZnO samples is an indication that the synthesized materials are in nanometer range. The crystallite size (D) was calculated from line broaden-ing of the major XRD peak (101) using the Scherrer’s formula [29].
cosKD λ
β θ= (4)
where, K is the shape factor, which is a constant taken as 0.9, λ is the wavelength of the X-ray radiation (λ = 1.5416 Å), β is the full-width at half-maximum (FWHM) in radians, θ is the Bragg’s angle in degree. The crys-tallite size of the pure and Cu doped ZnO sample obtained from Equation (4) are listed in Table 1. It is found that the samples synthesized by co precipitation route have grain size between 23 - 29 nm.
In order to understand the peak broadening with lattice strains, various peaks appeared in the XRD pattern were used. The Stokes and Wilson [30] formula given in Equation (5) were used to calculate the strain induced broadening of the Bragg’s diffraction peak.
4 tanhklβ
εθ
= (5)
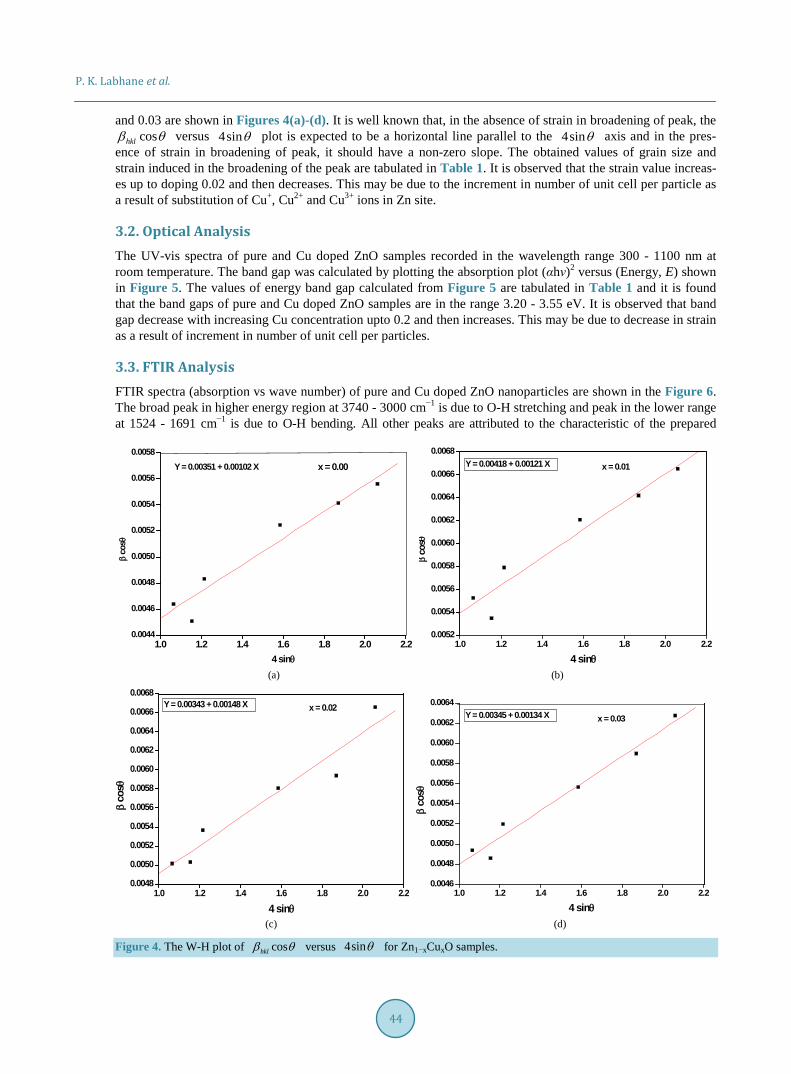
The W-H plot of coshklβ θ versus 4sinθ for Zn1−xCuxO samples with concentration x = 0.0, 0.01, 0.02
Figure 3. Volume of unit cell versus Cu concentration.
0.00 0.05 0.10 0.15 0.20 0.25 0.30 0.35151.2
151.4
151.6
151.8
152.0
152.2
152.4
Volu
me
cell
(Å)3 )
Cu concentration
P. K. Labhane et al.
44
and 0.03 are shown in Figures 4(a)-(d). It is well known that, in the absence of strain in broadening of peak, the coshklβ θ versus 4sinθ plot is expected to be a horizontal line parallel to the 4sinθ axis and in the pres-
ence of strain in broadening of peak, it should have a non-zero slope. The obtained values of grain size and strain induced in the broadening of the peak are tabulated in Table 1. It is observed that the strain value increas-es up to doping 0.02 and then decreases. This may be due to the increment in number of unit cell per particle as a result of substitution of Cu+, Cu2+ and Cu3+ ions in Zn site.
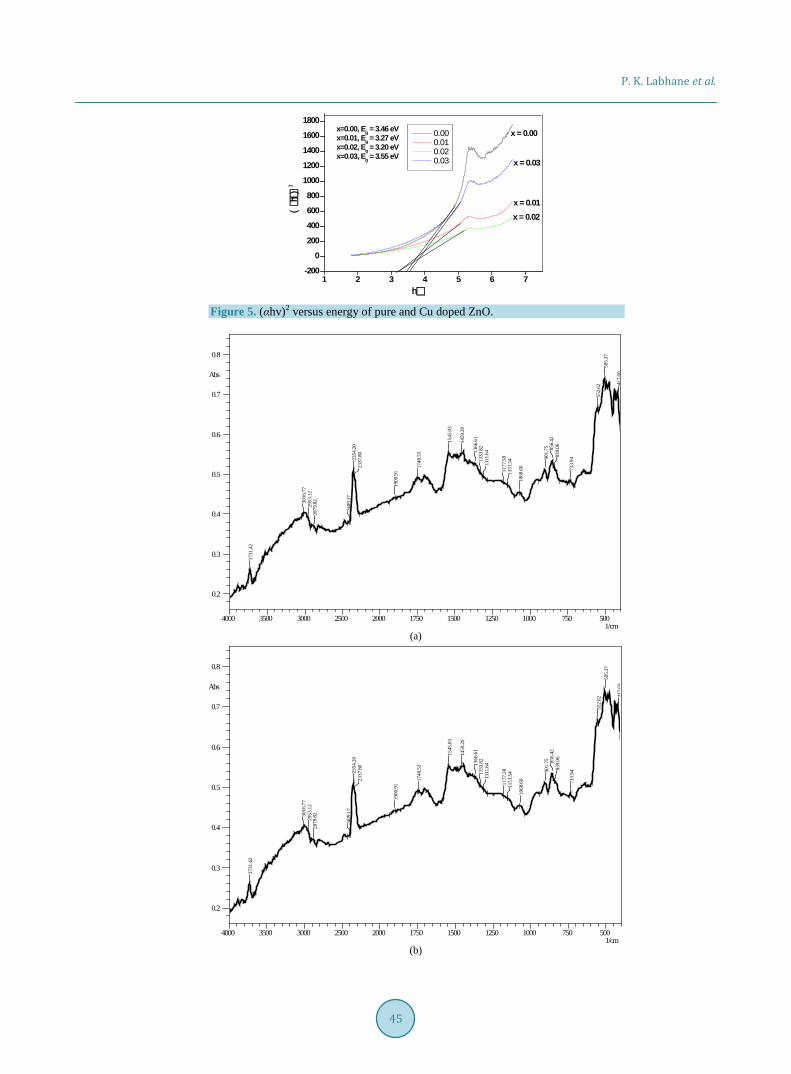
3.2. Optical Analysis The UV-vis spectra of pure and Cu doped ZnO samples recorded in the wavelength range 300 - 1100 nm at room temperature. The band gap was calculated by plotting the absorption plot (αhν)2 versus (Energy, E) shown in Figure 5. The values of energy band gap calculated from Figure 5 are tabulated in Table 1 and it is found that the band gaps of pure and Cu doped ZnO samples are in the range 3.20 - 3.55 eV. It is observed that band gap decrease with increasing Cu concentration upto 0.2 and then increases. This may be due to decrease in strain as a result of increment in number of unit cell per particles.
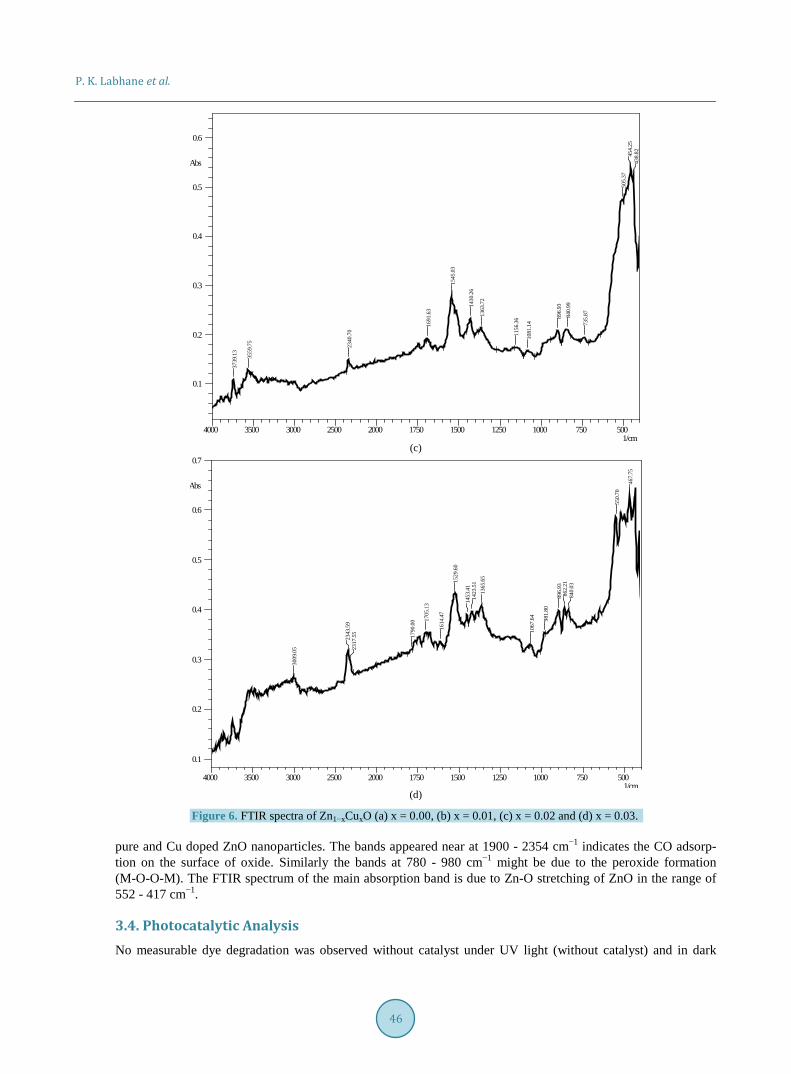
3.3. FTIR Analysis FTIR spectra (absorption vs wave number) of pure and Cu doped ZnO nanoparticles are shown in the Figure 6. The broad peak in higher energy region at 3740 - 3000 cm−1 is due to O-H stretching and peak in the lower range at 1524 - 1691 cm−1 is due to O-H bending. All other peaks are attributed to the characteristic of the prepared
1.0 1.2 1.4 1.6 1.8 2.0 2.20.0044
0.0046
0.0048
0.0050
0.0052
0.0054
0.0056
0.0058x = 0.00
β cos
θ
4 sinθ
Y = 0.00351 + 0.00102 X
1.0 1.2 1.4 1.6 1.8 2.0 2.2
0.0052
0.0054
0.0056
0.0058
0.0060
0.0062
0.0064
0.0066
0.0068
x = 0.01
β cos
θ
4 sinθ
Y = 0.00418 + 0.00121 X
(a) (b)
1.0 1.2 1.4 1.6 1.8 2.0 2.20.0048
0.0050
0.0052
0.0054
0.0056
0.0058
0.0060
0.0062
0.0064
0.0066
0.0068x = 0.02
β co
sθ
4 sinθ
Y = 0.00343 + 0.00148 X
1.0 1.2 1.4 1.6 1.8 2.0 2.2
0.0046
0.0048
0.0050
0.0052
0.0054
0.0056
0.0058
0.0060
0.0062
0.0064
x = 0.03
β co
sθ
4 sinθ
Y = 0.00345 + 0.00134 X
(c) (d)
Figure 4. The W-H plot of coshklβ θ versus 4sinθ for Zn1−xCuxO samples.
P. K. Labhane et al.
45
Figure 5. (αhv)2 versus energy of pure and Cu doped ZnO.
(a)
(b)
1 2 3 4 5 6 7-200
0
200
400
600
800
1000
1200
1400
1600
1800x=0.00, Eg = 3.46 eVx=0.01, Eg = 3.27 eVx=0.02, Eg = 3.20 eVx=0.03, Eg = 3.55 eV
x = 0.03
x = 0.02x = 0.01
x = 0.00
(h)
2h
0.00 0.01 0.02 0.03
5007501000125015001750200025003000350040001/cm
0.2
0.3
0.4
0.5
0.6
0.7
0.8
Abs
3731
.42
3016
.77
2953
.12
2879
.82
2409
.17
2354
.20
2337
.80
1900
.91
1748
.53
1545
.03
1459
.20
1366
.61
1333
.82
1311
.64
1177
.58
1151
.54
1068
.60
901.
75 856.
4283
9.06
733.
94
552.
6250
5.37
417.
60
5007501000125015001750200025003000350040001/cm
0.2
0.3
0.4
0.5
0.6
0.7
0.8
Abs
3731
.42
3016
.77
2953
.12
2879
.82
2409
.17
2354
.20
2337
.80
1900
.91
1748
.53
1545
.03
1459
.20
1366
.61
1333
.82
1311
.64
1177
.58
1151
.54
1068
.60
901.
75 856.
4283
9.06
733.
94
552.
6250
5.37
417.
60
P. K. Labhane et al.
46
(c)
(d)
Figure 6. FTIR spectra of Zn1−xCuxO (a) x = 0.00, (b) x = 0.01, (c) x = 0.02 and (d) x = 0.03. pure and Cu doped ZnO nanoparticles. The bands appeared near at 1900 - 2354 cm−1 indicates the CO adsorp-tion on the surface of oxide. Similarly the bands at 780 - 980 cm−1 might be due to the peroxide formation (M-O-O-M). The FTIR spectrum of the main absorption band is due to Zn-O stretching of ZnO in the range of 552 - 417 cm−1.
3.4. Photocatalytic Analysis No measurable dye degradation was observed without catalyst under UV light (without catalyst) and in dark
5007501000125015001750200025003000350040001/cm
0.1
0.2
0.3
0.4
0.5
0.6
Abs
3739
.13
3559
.75
2340
.70
1691
.63
1545
.03
1430
.26
1363
.72
1156
.36
1081
.14
896.
9384
0.99
735.
87
505.
3745
4.25
438.
82
5007501000125015001750200025003000350040001/cm
0.1
0.2
0.3
0.4
0.5
0.6
0.7
Abs
3009
.05
2343
.59
2317
.55 1790
.00 17
05.1
3
1614
.47
1529
.60
1453
.41
1423
.51
1365
.65
1067
.64
981.
80
896.
9386
2.21
840.
03
550.
70
467.
75
P. K. Labhane et al.
47
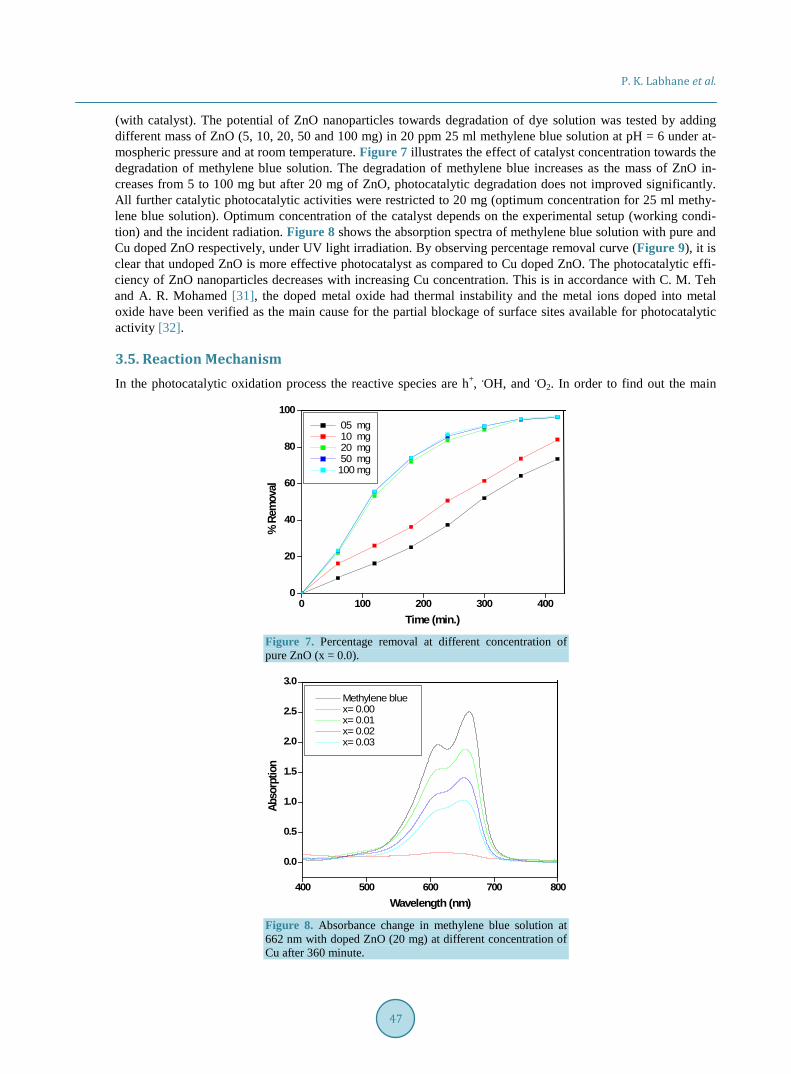
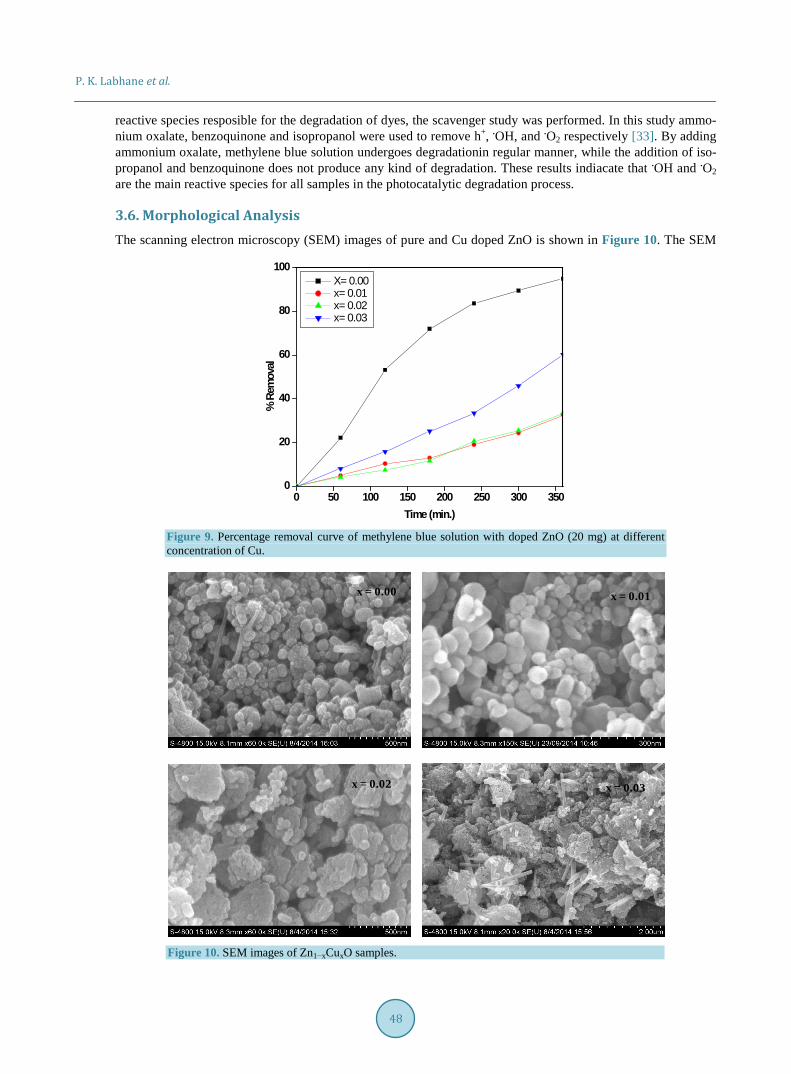
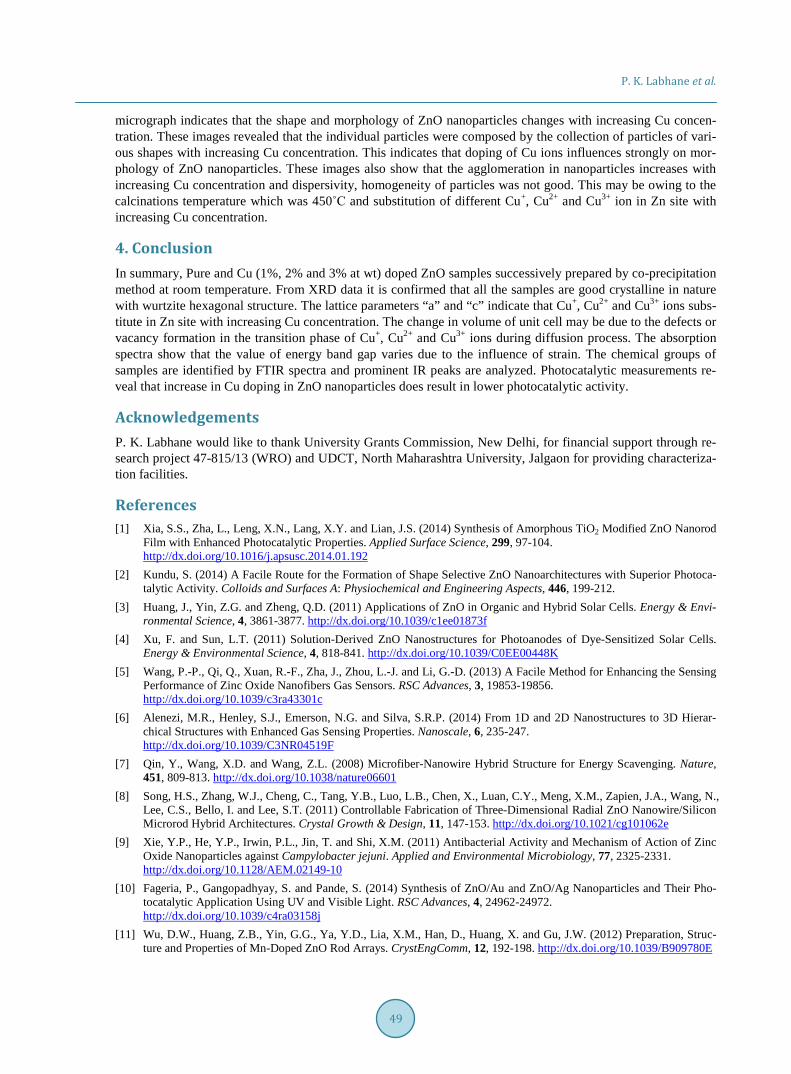
(with catalyst). The potential of ZnO nanoparticles towards degradation of dye solution was tested by adding different mass of ZnO (5, 10, 20, 50 and 100 mg) in 20 ppm 25 ml methylene blue solution at pH = 6 under at-mospheric pressure and at room temperature. Figure 7 illustrates the effect of catalyst concentration towards the degradation of methylene blue solution. The degradation of methylene blue increases as the mass of ZnO in-creases from 5 to 100 mg but after 20 mg of ZnO, photocatalytic degradation does not improved significantly. All further catalytic photocatalytic activities were restricted to 20 mg (optimum concentration for 25 ml methy-lene blue solution). Optimum concentration of the catalyst depends on the experimental setup (working condi-tion) and the incident radiation. Figure 8 shows the absorption spectra of methylene blue solution with pure and Cu doped ZnO respectively, under UV light irradiation. By observing percentage removal curve (Figure 9), it is clear that undoped ZnO is more effective photocatalyst as compared to Cu doped ZnO. The photocatalytic effi-ciency of ZnO nanoparticles decreases with increasing Cu concentration. This is in accordance with C. M. Teh and A. R. Mohamed [31], the doped metal oxide had thermal instability and the metal ions doped into metal oxide have been verified as the main cause for the partial blockage of surface sites available for photocatalytic activity [32].
3.5. Reaction Mechanism In the photocatalytic oxidation process the reactive species are h+, .OH, and .O2. In order to find out the main
0 100 200 300 4000
20
40
60
80
100
% R
emov
al
Time (min.)
05 mg 10 mg 20 mg 50 mg 100 mg
Figure 7. Percentage removal at different concentration of pure ZnO (x = 0.0).
400 500 600 700 800
0.0
0.5
1.0
1.5
2.0
2.5
3.0
Abso
rptio
n
Wavelength (nm)
Methylene blue x= 0.00 x= 0.01 x= 0.02 x= 0.03
Figure 8. Absorbance change in methylene blue solution at 662 nm with doped ZnO (20 mg) at different concentration of Cu after 360 minute.
P. K. Labhane et al.
48
reactive species resposible for the degradation of dyes, the scavenger study was performed. In this study ammo-nium oxalate, benzoquinone and isopropanol were used to remove h+, .OH, and .O2 respectively [33]. By adding ammonium oxalate, methylene blue solution undergoes degradationin regular manner, while the addition of iso-propanol and benzoquinone does not produce any kind of degradation. These results indiacate that .OH and .O2 are the main reactive species for all samples in the photocatalytic degradation process.
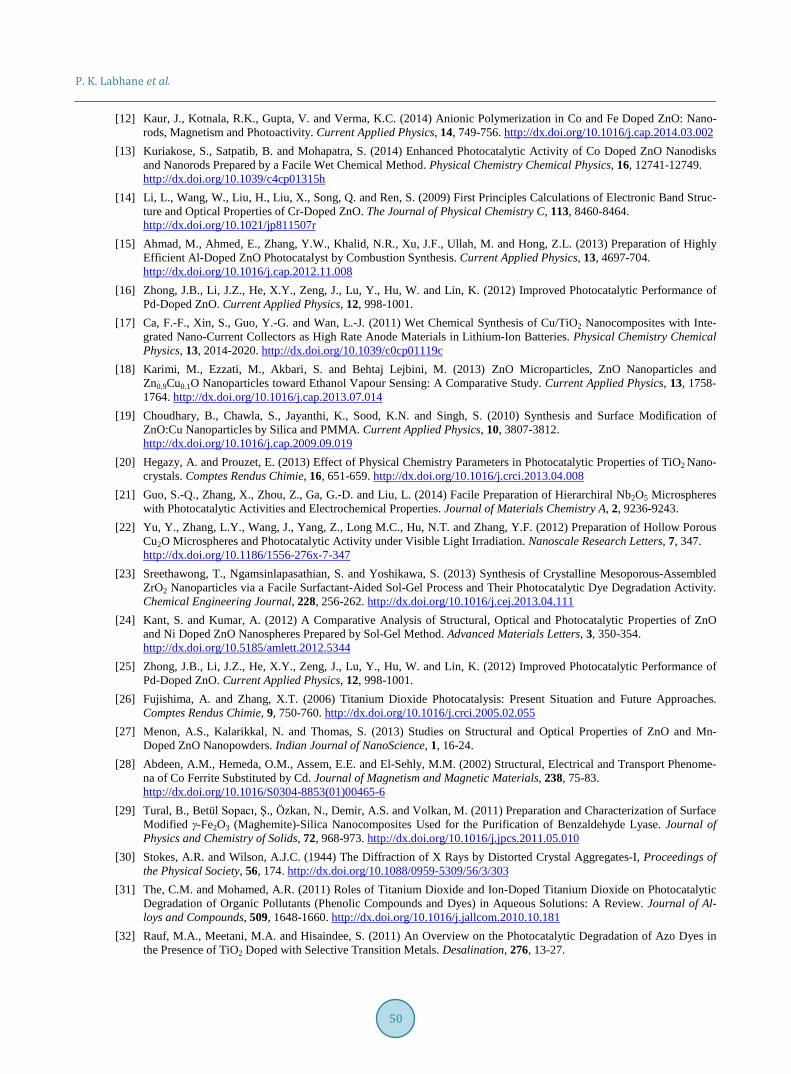
3.6. Morphological Analysis The scanning electron microscopy (SEM) images of pure and Cu doped ZnO is shown in Figure 10. The SEM
0 50 100 150 200 250 300 3500
20
40
60
80
100 X= 0.00 x= 0.01 x= 0.02 x= 0.03
% R
emov
al
Time (min.) Figure 9. Percentage removal curve of methylene blue solution with doped ZnO (20 mg) at different concentration of Cu.
Figure 10. SEM images of Zn1−xCuxO samples.
x = 0.00 x = 0.01
x = 0.02 x = 0.03
P. K. Labhane et al.
49
micrograph indicates that the shape and morphology of ZnO nanoparticles changes with increasing Cu concen-tration. These images revealed that the individual particles were composed by the collection of particles of vari-ous shapes with increasing Cu concentration. This indicates that doping of Cu ions influences strongly on mor-phology of ZnO nanoparticles. These images also show that the agglomeration in nanoparticles increases with increasing Cu concentration and dispersivity, homogeneity of particles was not good. This may be owing to the calcinations temperature which was 450˚C and substitution of different Cu+, Cu2+ and Cu3+ ion in Zn site with increasing Cu concentration.
4. Conclusion In summary, Pure and Cu (1%, 2% and 3% at wt) doped ZnO samples successively prepared by co-precipitation method at room temperature. From XRD data it is confirmed that all the samples are good crystalline in nature with wurtzite hexagonal structure. The lattice parameters “a” and “c” indicate that Cu+, Cu2+ and Cu3+ ions subs-titute in Zn site with increasing Cu concentration. The change in volume of unit cell may be due to the defects or vacancy formation in the transition phase of Cu+, Cu2+ and Cu3+ ions during diffusion process. The absorption spectra show that the value of energy band gap varies due to the influence of strain. The chemical groups of samples are identified by FTIR spectra and prominent IR peaks are analyzed. Photocatalytic measurements re-veal that increase in Cu doping in ZnO nanoparticles does result in lower photocatalytic activity.
Acknowledgements P. K. Labhane would like to thank University Grants Commission, New Delhi, for financial support through re-search project 47-815/13 (WRO) and UDCT, North Maharashtra University, Jalgaon for providing characteriza-tion facilities.
References [1] Xia, S.S., Zha, L., Leng, X.N., Lang, X.Y. and Lian, J.S. (2014) Synthesis of Amorphous TiO2 Modified ZnO Nanorod
Film with Enhanced Photocatalytic Properties. Applied Surface Science, 299, 97-104. http://dx.doi.org/10.1016/j.apsusc.2014.01.192
[2] Kundu, S. (2014) A Facile Route for the Formation of Shape Selective ZnO Nanoarchitectures with Superior Photoca-talytic Activity. Colloids and Surfaces A: Physiochemical and Engineering Aspects, 446, 199-212.
[3] Huang, J., Yin, Z.G. and Zheng, Q.D. (2011) Applications of ZnO in Organic and Hybrid Solar Cells. Energy & Envi-ronmental Science, 4, 3861-3877. http://dx.doi.org/10.1039/c1ee01873f
[4] Xu, F. and Sun, L.T. (2011) Solution-Derived ZnO Nanostructures for Photoanodes of Dye-Sensitized Solar Cells. Energy & Environmental Science, 4, 818-841. http://dx.doi.org/10.1039/C0EE00448K
[5] Wang, P.-P., Qi, Q., Xuan, R.-F., Zha, J., Zhou, L.-J. and Li, G.-D. (2013) A Facile Method for Enhancing the Sensing Performance of Zinc Oxide Nanofibers Gas Sensors. RSC Advances, 3, 19853-19856. http://dx.doi.org/10.1039/c3ra43301c
[6] Alenezi, M.R., Henley, S.J., Emerson, N.G. and Silva, S.R.P. (2014) From 1D and 2D Nanostructures to 3D Hierar-chical Structures with Enhanced Gas Sensing Properties. Nanoscale, 6, 235-247. http://dx.doi.org/10.1039/C3NR04519F
[7] Qin, Y., Wang, X.D. and Wang, Z.L. (2008) Microfiber-Nanowire Hybrid Structure for Energy Scavenging. Nature, 451, 809-813. http://dx.doi.org/10.1038/nature06601
[8] Song, H.S., Zhang, W.J., Cheng, C., Tang, Y.B., Luo, L.B., Chen, X., Luan, C.Y., Meng, X.M., Zapien, J.A., Wang, N., Lee, C.S., Bello, I. and Lee, S.T. (2011) Controllable Fabrication of Three-Dimensional Radial ZnO Nanowire/Silicon Microrod Hybrid Architectures. Crystal Growth & Design, 11, 147-153. http://dx.doi.org/10.1021/cg101062e
[9] Xie, Y.P., He, Y.P., Irwin, P.L., Jin, T. and Shi, X.M. (2011) Antibacterial Activity and Mechanism of Action of Zinc Oxide Nanoparticles against Campylobacter jejuni. Applied and Environmental Microbiology, 77, 2325-2331. http://dx.doi.org/10.1128/AEM.02149-10
[10] Fageria, P., Gangopadhyay, S. and Pande, S. (2014) Synthesis of ZnO/Au and ZnO/Ag Nanoparticles and Their Pho-tocatalytic Application Using UV and Visible Light. RSC Advances, 4, 24962-24972. http://dx.doi.org/10.1039/c4ra03158j
[11] Wu, D.W., Huang, Z.B., Yin, G.G., Ya, Y.D., Lia, X.M., Han, D., Huang, X. and Gu, J.W. (2012) Preparation, Struc-ture and Properties of Mn-Doped ZnO Rod Arrays. CrystEngComm, 12, 192-198. http://dx.doi.org/10.1039/B909780E
P. K. Labhane et al.
50
[12] Kaur, J., Kotnala, R.K., Gupta, V. and Verma, K.C. (2014) Anionic Polymerization in Co and Fe Doped ZnO: Nano-rods, Magnetism and Photoactivity. Current Applied Physics, 14, 749-756. http://dx.doi.org/10.1016/j.cap.2014.03.002
[13] Kuriakose, S., Satpatib, B. and Mohapatra, S. (2014) Enhanced Photocatalytic Activity of Co Doped ZnO Nanodisks and Nanorods Prepared by a Facile Wet Chemical Method. Physical Chemistry Chemical Physics, 16, 12741-12749. http://dx.doi.org/10.1039/c4cp01315h
[14] Li, L., Wang, W., Liu, H., Liu, X., Song, Q. and Ren, S. (2009) First Principles Calculations of Electronic Band Struc-ture and Optical Properties of Cr-Doped ZnO. The Journal of Physical Chemistry C, 113, 8460-8464. http://dx.doi.org/10.1021/jp811507r
[15] Ahmad, M., Ahmed, E., Zhang, Y.W., Khalid, N.R., Xu, J.F., Ullah, M. and Hong, Z.L. (2013) Preparation of Highly Efficient Al-Doped ZnO Photocatalyst by Combustion Synthesis. Current Applied Physics, 13, 4697-704. http://dx.doi.org/10.1016/j.cap.2012.11.008
[16] Zhong, J.B., Li, J.Z., He, X.Y., Zeng, J., Lu, Y., Hu, W. and Lin, K. (2012) Improved Photocatalytic Performance of Pd-Doped ZnO. Current Applied Physics, 12, 998-1001.
[17] Ca, F.-F., Xin, S., Guo, Y.-G. and Wan, L.-J. (2011) Wet Chemical Synthesis of Cu/TiO2 Nanocomposites with Inte-grated Nano-Current Collectors as High Rate Anode Materials in Lithium-Ion Batteries. Physical Chemistry Chemical Physics, 13, 2014-2020. http://dx.doi.org/10.1039/c0cp01119c
[18] Karimi, M., Ezzati, M., Akbari, S. and Behtaj Lejbini, M. (2013) ZnO Microparticles, ZnO Nanoparticles and Zn0.9Cu0.1O Nanoparticles toward Ethanol Vapour Sensing: A Comparative Study. Current Applied Physics, 13, 1758- 1764. http://dx.doi.org/10.1016/j.cap.2013.07.014
[19] Choudhary, B., Chawla, S., Jayanthi, K., Sood, K.N. and Singh, S. (2010) Synthesis and Surface Modification of ZnO:Cu Nanoparticles by Silica and PMMA. Current Applied Physics, 10, 3807-3812. http://dx.doi.org/10.1016/j.cap.2009.09.019
[20] Hegazy, A. and Prouzet, E. (2013) Effect of Physical Chemistry Parameters in Photocatalytic Properties of TiO2 Nano-crystals. Comptes Rendus Chimie, 16, 651-659. http://dx.doi.org/10.1016/j.crci.2013.04.008
[21] Guo, S.-Q., Zhang, X., Zhou, Z., Ga, G.-D. and Liu, L. (2014) Facile Preparation of Hierarchiral Nb2O5 Microspheres with Photocatalytic Activities and Electrochemical Properties. Journal of Materials Chemistry A, 2, 9236-9243.
[22] Yu, Y., Zhang, L.Y., Wang, J., Yang, Z., Long M.C., Hu, N.T. and Zhang, Y.F. (2012) Preparation of Hollow Porous Cu2O Microspheres and Photocatalytic Activity under Visible Light Irradiation. Nanoscale Research Letters, 7, 347. http://dx.doi.org/10.1186/1556-276x-7-347
[23] Sreethawong, T., Ngamsinlapasathian, S. and Yoshikawa, S. (2013) Synthesis of Crystalline Mesoporous-Assembled ZrO2 Nanoparticles via a Facile Surfactant-Aided Sol-Gel Process and Their Photocatalytic Dye Degradation Activity. Chemical Engineering Journal, 228, 256-262. http://dx.doi.org/10.1016/j.cej.2013.04.111
[24] Kant, S. and Kumar, A. (2012) A Comparative Analysis of Structural, Optical and Photocatalytic Properties of ZnO and Ni Doped ZnO Nanospheres Prepared by Sol-Gel Method. Advanced Materials Letters, 3, 350-354. http://dx.doi.org/10.5185/amlett.2012.5344
[25] Zhong, J.B., Li, J.Z., He, X.Y., Zeng, J., Lu, Y., Hu, W. and Lin, K. (2012) Improved Photocatalytic Performance of Pd-Doped ZnO. Current Applied Physics, 12, 998-1001.
[26] Fujishima, A. and Zhang, X.T. (2006) Titanium Dioxide Photocatalysis: Present Situation and Future Approaches. Comptes Rendus Chimie, 9, 750-760. http://dx.doi.org/10.1016/j.crci.2005.02.055
[27] Menon, A.S., Kalarikkal, N. and Thomas, S. (2013) Studies on Structural and Optical Properties of ZnO and Mn- Doped ZnO Nanopowders. Indian Journal of NanoScience, 1, 16-24.
[28] Abdeen, A.M., Hemeda, O.M., Assem, E.E. and El-Sehly, M.M. (2002) Structural, Electrical and Transport Phenome-na of Co Ferrite Substituted by Cd. Journal of Magnetism and Magnetic Materials, 238, 75-83. http://dx.doi.org/10.1016/S0304-8853(01)00465-6
[29] Tural, B., Betül Sopacı, Ş., Özkan, N., Demir, A.S. and Volkan, M. (2011) Preparation and Characterization of Surface Modified γ-Fe2O3 (Maghemite)-Silica Nanocomposites Used for the Purification of Benzaldehyde Lyase. Journal of Physics and Chemistry of Solids, 72, 968-973. http://dx.doi.org/10.1016/j.jpcs.2011.05.010
[30] Stokes, A.R. and Wilson, A.J.C. (1944) The Diffraction of X Rays by Distorted Crystal Aggregates-I, Proceedings of the Physical Society, 56, 174. http://dx.doi.org/10.1088/0959-5309/56/3/303
[31] The, C.M. and Mohamed, A.R. (2011) Roles of Titanium Dioxide and Ion-Doped Titanium Dioxide on Photocatalytic Degradation of Organic Pollutants (Phenolic Compounds and Dyes) in Aqueous Solutions: A Review. Journal of Al-loys and Compounds, 509, 1648-1660. http://dx.doi.org/10.1016/j.jallcom.2010.10.181
[32] Rauf, M.A., Meetani, M.A. and Hisaindee, S. (2011) An Overview on the Photocatalytic Degradation of Azo Dyes in the Presence of TiO2 Doped with Selective Transition Metals. Desalination, 276, 13-27.

P. K. Labhane et al.
51
http://dx.doi.org/10.1016/j.desal.2011.03.071 [33] Aboukais, A., Abi-Aad, E. and Tauk, B. (2012) Supported Manganese Oxide on TiO2 for Total Oxidation of Toluene
and Polycyclic Aromatic Hydrocarbons (PAHs): Characterization and Catalytic Activity. Materials Chemistry and Physics, 142, 564-571. http://dx.doi.org/10.1016/j.matchemphys.2013.07.053


![Crystallographic relations in the Fe[bond]Zn system · Crystallographic Relations in the Fe-Zn System The crystallographic relations between the various Fe-Zn compounds have been](https://img.pdfslide.net/doc/110x75/5f0570af7e708231d412f970/crystallographic-relations-in-the-febondzn-system-crystallographic-relations-in.jpg)