Embed Size (px)
Citation preview

Synthesis of Knowledge on Marine Biodiversity inEuropean Seas: From Census to SustainableManagementBhavani E. Narayanaswamy1*, Marta Coll2., Roberto Danovaro3., Keith Davidson1., Henn Ojaveer4.,
Paul E. Renaud5,6.
1 Scottish Association for Marine Science, Scottish Marine Institute, Oban, Argyll, United Kingdom, 2 Institut de Ciencies del Mar, Scientific Spanish Council (ICM-CSIC),
Barcelona, Spain, 3 Department of Life and Environmental Sciences, Polytechnic University of Marche, Ancona, Italy, 4 Estonian Marine Institute, University of Tartu, Parnu,
Estonia, 5 Akvaplan-NIVA, Fram Centre for Climate and the Environment, Tromsø, Norway, 6 The University Centre in Svalbard, Longyearbyen, Norway
Abstract
The recently completed European Census of Marine Life, conducted within the framework of the global Census of MarineLife programme (2000–2010), markedly enhanced our understanding of marine biodiversity in European Seas, itsimportance within ecological systems, and the implications for human use. Here we undertake a synthesis of presentknowledge of biodiversity in European Seas and identify remaining challenges that prevent sustainable management ofmarine biodiversity in one of the most exploited continents of the globe. Our analysis demonstrates that changes in faunalstanding stock with depth depends on the size of the fauna, with macrofaunal abundance only declining with increasingwater depth below 1000 m, whilst there was no obvious decrease in meiofauna with increasing depth. Species richness washighly variable for both deep water macro- and meio- fauna along latitudinal and longitudinal gradients. Nematodebiodiversity decreased from the Atlantic into the Mediterranean whilst latitudinal related biodiversity patterns were similarfor both faunal groups investigated, suggesting that the same environmental drivers were influencing the fauna. Whileclimate change and habitat degradation are the most frequently implicated stressors affecting biodiversity throughoutEuropean Seas, quantitative understanding, both at individual and cumulative/synergistic level, of their influences are oftenlacking. Full identification and quantification of species, in even a single marine habitat, remains a distant goal, as we lackintegrated data-sets to quantify these. While the importance of safeguarding marine biodiversity is recognised by policymakers, the lack of advanced understanding of species diversity and of a full survey of any single habitat raises hugechallenges in quantifying change, and facilitating/prioritising habitat/ecosystem protection. Our study highlights a pressingrequirement for more complete biodiversity surveys to be undertaken within contrasting habitats, together withinvestigations in biodiversity-ecosystem functioning links and identification of separate and synergistic/cumulative human-induced impacts on biodiversity.
Citation: Narayanaswamy BE, Coll M, Danovaro R, Davidson K, Ojaveer H, et al. (2013) Synthesis of Knowledge on Marine Biodiversity in European Seas: FromCensus to Sustainable Management. PLoS ONE 8(3): e58909. doi:10.1371/journal.pone.0058909
Editor: Konstantinos I. Stergiou, Aristotle University of Thessaloniki, Greece
Received October 25, 2012; Accepted February 7, 2013; Published March 18, 2013
Copyright: � 2013 Narayanaswamy et al. This is an open-access article distributed under the terms of the Creative Commons Attribution License, which permitsunrestricted use, distribution, and reproduction in any medium, provided the original author and source are credited.
Funding: BN was supported by the Total Foundation and a grant from the Census of Marine Life (OL100098), funding to MC was given by a EuropeanCommunity Marie-Curie Postdoctoral Fellowship through the International Outgoing Fellowships to ECOFUN, and by the Spanish National program Ramon y Cajalwhilst RD was supported by the national funding within the frame of the project RITMARE. The contribution of HO was partially financed by the Estonian Ministryof Education and Research (grant SF0180005s10) and by the European Community‘s Seventh Framework Programme (FP7/2007-2013 under Grant AgreementNo. 266445) for the project Vectors of Change in Oceans and Seas Marine Life, Impact on Economic Sectors (VECTORS). Contribution of HO was also supported bythe project ’The status of marine biodiversity and its potential futures in the Estonian coastal sea’ 3.2.0802.11-0029 of Environmental Protection and TechnologyProgramme of the European Regional Fund. The funders had no role in study design, data collection and analysis, decision to publish, or preparation of themanuscript.
Competing Interests: The authors have declared that no competing interests exist.
* E-mail: [email protected]
. These authors contributed equally to this work.
Introduction
‘‘We have a catalogue of all the celestial bodies our instruments
can detect in the universe, but we ignore how many living beings
share the Earth with us’’, so said, ecologist Robert May in 1992
(see also [1]). Biodiversity is the degree of variation that exists
among ‘‘living beings’’ and can be defined by genetic, species or
habitat factors, with consensus being that maintaining biodiversity
in all its forms is fundamental to the future health of the planet
[2,3]. In fact, biodiversity is not just an important element of
natural ecosystems, it is of overarching importance both scientif-
ically and for society [4,5], being critical to the understanding of
biogeographic patterns, evolutionary history, ecosystem function-
ing [6,7], and to ecosystem services and resources, which provide
monetary, recreational or other values [8].
Humans have long had a great curiosity about the sea, with
evidence of human study of the marine biota in European Seas
existing from the 3rd century B.C. [9]. Formal scientific studies
started in the 18th Century in the Mediterranean Sea and early
19th Century elsewhere in Europe [10,11]. These and subsequent
studies have generated an abundant archive of semi-quantitative
PLOS ONE | www.plosone.org 1 March 2013 | Volume 8 | Issue 3 | e58909

information [12–14], although systematic collections and descrip-
tions of marine biodiversity have a substantially shorter history.
In the 20 years since May’s statement, our understanding of
marine diversity and ecosystem function has increased exponen-
tially [15]. The Census of Marine Life (CoML), a decadal global
programme from 2000–2010, greatly increased our knowledge of
marine biodiversity and contributed enormously towards the
investigation of the ‘‘known, unknown and unknowable’’ biodi-
versity throughout the World’s oceans [16]. However, it is clear
that most of the marine biodiversity still remains unknown and
recent estimates vary in the time it will take to complete gain this
knowledge, with estimates ranging from ,100 years [15] to
.1000 years [17].
The knowledge of the biodiversity of European Seas, which
contain some of the historically and presently best explored marine
areas of the world, has been substantially improved in recent years
[9,18–20]. Current European marine biodiversity studies include
some of the most extensive investigations into the description,
production and maintenance of biodiversity patterns, as well as
quantification of the consequences of changes in biodiversity for
system sustainability and production of ecosystem goods and
services [21–24]. In addition, increasing efforts are being made to
map and predict species occurrence and distribution using
available (and most of the time, imperfect) data (e.g. [25,26]).
Current understanding, therefore, relies on synthetic efforts that
bridge sampling methodologies from nets to remote sensing,
perspectives from genetic analyses to habitat mapping, and
analytical techniques from novel experimental design to innovative
statistical models. However, there is a need to synthesise the
existing knowledge in order to provide an overview of current and
future challenges, identify existing gaps and provide information
that is useful for a sustainable management of marine biodiversity
in European Seas.
In this work we have considered the species sub-component of
biodiversity and used both new and existing databases in
European Seas to address the following questions: (1) what is
currently known and unknown regarding marine biodiversity, (2)
what is the role and importance of biodiversity in the functioning
of marine ecosystems, (3) which are the anthropogenic threats to
biodiversity and what implications do they have for the goods and
services that biodiversity provides, and (4) how can such a synthesis
of current regional biodiversity information contribute to satisfying
Europe-wide management directives.
We chose the European Seas (defined here as four sub regions:
the European Arctic, the Western European Margin, and the
Baltic and the Mediterranean Seas. Other seas, e.g. the Black Sea
were not included as they were originally excluded from the
CoML Mediterranean regional assessment) (Figure 1) as our area
of interest as these are globally well studied regional seas [9,18–
20]. Moreover, in this region there is an established dialogue
between biodiversity science and policy, and a growing will to
inform policy using biodiversity indicators. In fact, biological
diversity is the first of the 11 descriptors of Good Environmental
Status (GES) on the European agenda for assessment and
management of marine ecosystems, the Marine Strategy Frame-
work Directive (MSFD) [27], and it is a fundamental component
of the EU Habitats Directive (92/43/EEC) as well as for the Baltic
Sea Action Plan of the Helsinki Commission (HELCOM BSAP).
Results and Discussion
Synthesis of the known and unknownTo date, more than 26,000 unique species are known for all
European Seas excluding bacteria and viruses [28], but more than
30,000 if they were included ([29], with ,16,000 along the
Western European margin, ,17,000 in the Mediterranean,
,6,000 in the Baltic and ,2,500 in the European Arctic
(Figure 2a, b) [9,18–20,30]. However, the heterogeneity of the
marine environment as well as the variability in life habits across
the domains of life creates significant challenges in collecting and
documenting marine biodiversity [31].
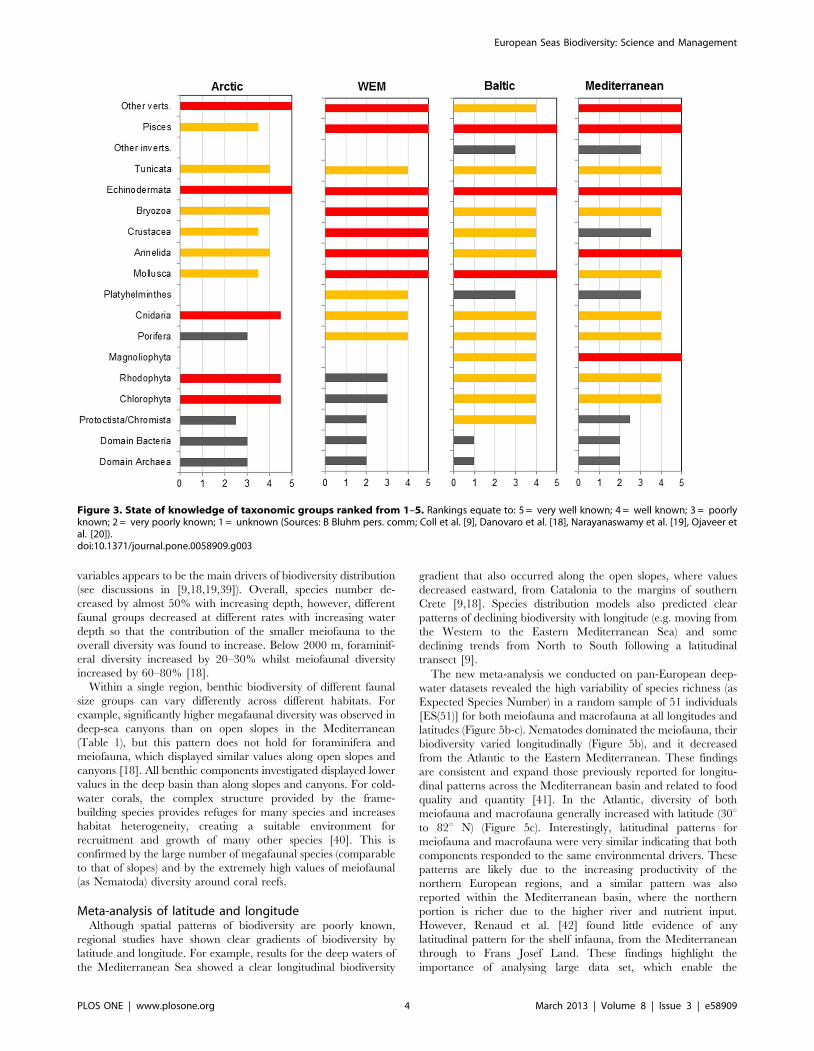
When assessing each taxonomic group for each region on a
scale from 1 – 5 in order to determine what the state of knowledge
is for each group, we observed that fish, other vertebrates and
echinoderms were the groups that were most well known in all seas
(Figure 3). Along the Western European Margin several of the
invertebrate taxonomic groups were very well known (e.g. the
crustaceans and bryozoans), whilst annelids and molluscs were well
known from all the regions (Figure 3). On the contrary, the
prokaryotic biodiversity and their biogeographic patterns (i.e.
Bacteria and Archaea) could not be properly assessed as they are
poorly known from most of the European regions.
Microbial diversityMicrobes are ubiquitous in the sea, in both the pelagic and
benthic environment. An upper limit of species abundance of
26106 globally was suggested by Curtis et al. [32], however, the
Figure 1. The major European Regional Seas.doi:10.1371/journal.pone.0058909.g001
European Seas Biodiversity: Science and Management
PLOS ONE | www.plosone.org 2 March 2013 | Volume 8 | Issue 3 | e58909

absolute diversity of prokaryotes is widely held to be unknowable,
and this also applies to European Seas (Figure 3). Similar
uncertainty exists with respect to marine photosynthetic protists.
Medlin and Kooistra [33] suggested that we have identified less
than 10% of these organisms worldwide. Differences in the
methodologies, types of studies and the continuously improving
state of our knowledge of marine microbial diversity makes it
difficult to provide full species estimates and establish comparisons.
For example, last estimates highlighted that .25% of all known
biodiversity species corresponded to prokaryotic (Bacteria and
Archaea) and eukaryotic (Protists) marine microbes in the
Mediterranean Sea, the European Arctic and along the Western
European Margin, whereas in the Baltic this figure was .45%
[9,19,20,30]. But the data available for Bacteria, Archaea, and
Protists were very limited; therefore these estimates must be
treated with caution.
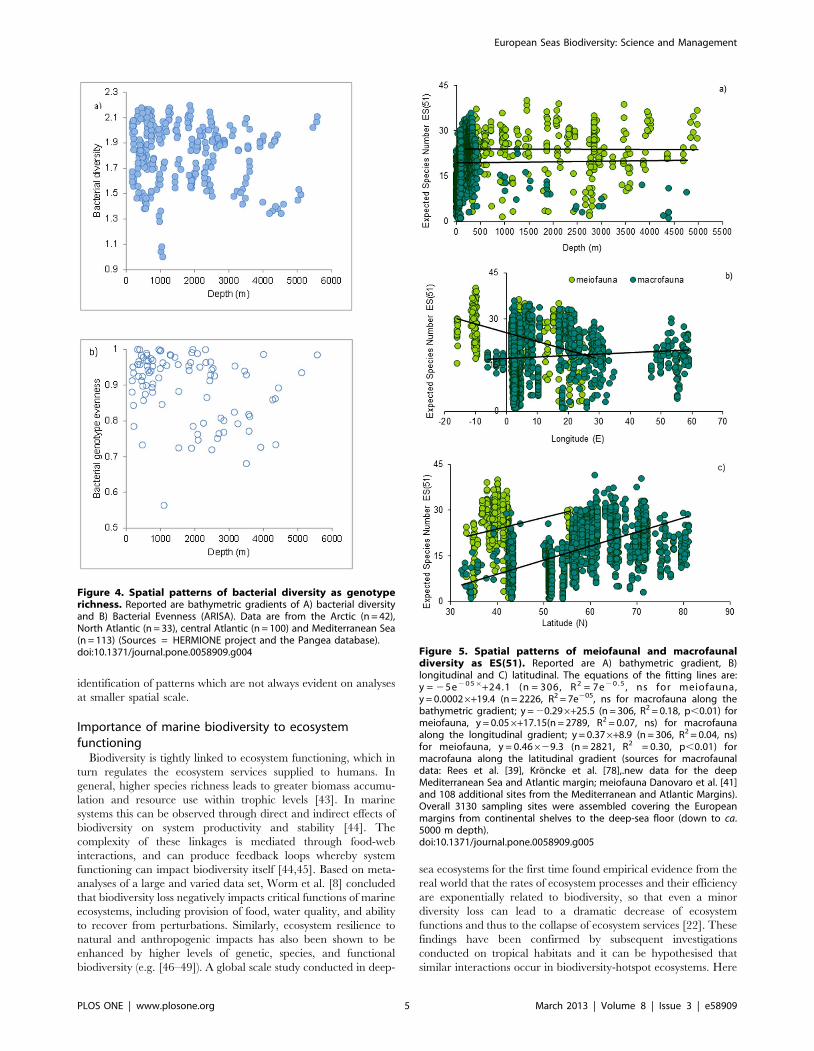
Interestingly enough, the most recent data reported in this study
from the Arctic, North and Central Atlantic and Mediterranean
Sea indicated that bacterial diversity (expressed as genotype
richness, which is expected to provide a trend for the most
represented putative taxa) does not change significantly with
increasing water depth (Figure 4). However, different taxa are
present in different systems and different regions are characterised
by a different biodiversity [34]. Considering this high uncertainty
in abundance (and distribution) it is unsurprising that the factors
controlling microbial biodiversity, their major and multiple
different roles in biogeochemical cycling, and as a biological
resource to humans still remains largely unknown. Some
preliminary results suggest that there may be a link between
bacterial biodiversity and biogeochemical processes in coastal
lagoons (e.g. Venice lagoon) but the relationship could be habitat
specific [35]. Given their environmental diversity and natural
variability, together with advanced infrastructure and human
resource, European Seas are likely to be significant in advancing
our understanding of how microbes support ecosystem structure.
Through the development of molecular taxonomic techniques,
one of the key hypotheses in microbial ecology ‘‘everything is
everywhere, but the environment selects’’ [36] is now being
challenged [37]. Another missing point relates to the interactions
between microbial and faunal diversity and their interactive
functional roles.
Animal diversityThe diversity knowledge of multi-cellular animals in European
Seas is higher in comparison to microbes (Figures 2a, 3 and 4).
However, in the pelagic environment, the number of identified
species is only well known for six groups, with ,1000 species each
of fish and opisthobranchs, ,70 species each of euphausiids and
chaetognaths, ,50 species of mammals, and even the most diverse
group, the Calanoid copepod, have less than 3,000 species
identified [38]. In contrast to the pelagic zone, greater heteroge-
neity of habitats generates higher benthic biodiversity (Figure 2a).
Within a given taxon, regional-independent patterns exist across
all four regions of European Seas (Figure. 1) with differing
numbers of multi-cellular animal species per taxonomic group
(Figure 2a, b). However, crustaceans have the greatest species
richness, with almost twice the number of species compared to
other taxonomic groups; followed by the annelids and molluscs. In
addition, in the Baltic Sea, higher numbers of Platyhelminthes
species are present, and in the European Arctic there are higher
numbers of Foraminifera species. However, it is unclear whether
there are actually more species in a given taxon e.g. Crustacea
especially along the Western European Margin, or whether this is
an artefact of sampling and/or available knowledge (Figure 3).
Bathymetric pattern of biodiversity across differenthabitats
Although numerous discussions have taken place regarding
patterns of biodiversity with depth, the patterns themselves are not
clear. In the Mediterranean, for example, there has been some
documented evidence of decreasing diversity with increasing depth
for invertebrate and fish species ([9] and references therein) and, in
general, biodiversity is concentrated in coastal areas and
continental shelves, mainly above 200 m depth. However, these
patterns did not necessarily show a monotonic decrease with depth
and clear exceptions to the pattern of decreasing diversity with
depth were also documented [9]. Along the Western European
Margin, there are varying trends with depth dependent on the
faunal group being studied as well as the location. The pattern
ranges from no change in diversity through to sometimes an
exponential or monotonic decrease with increasing depth ([19]
and references therein).
When merging together the available data with that of new data
generated (collected through the Italian RITMARE and EU
HERMIONE projects), giving.a total of..3000 biodiversity
records for European Seas,.the results.revealed no evidence of a
decline in meiofauna with increasing water depth, whilst the
macrofauna displayed a general trend of decreasing diversity
below 1000 m (Figure 5a). However, there was a clear change in
species composition across the different bathymetric zones,
indicating that biodiversity may be strongly influenced by different
forcing factors and affected by multiple mechanisms/processes
that act at different spatial scales. This is also evident from the
analysis of biodiversity patterns at regional scales where different
Figure 2. Comparison of species in different taxonomic groupsin all four regions investigated. A) The percentage accumulation ofspecies found per taxonomic group in each region (Arctic, WesternEuropean Margin, Baltic and Mediterranean Sea); B) The total number ofspecies found per taxonomic group in each region (Arctic, WesternEuropean Margin, Baltic and Mediterranean Seas). (Sources: Coll et al.[9], Danovaro et al. [18], Narayanaswamy et al. [19], Ojaveer et al. [20]).doi:10.1371/journal.pone.0058909.g002
European Seas Biodiversity: Science and Management
PLOS ONE | www.plosone.org 3 March 2013 | Volume 8 | Issue 3 | e58909
variables appears to be the main drivers of biodiversity distribution
(see discussions in [9,18,19,39]). Overall, species number de-
creased by almost 50% with increasing depth, however, different
faunal groups decreased at different rates with increasing water
depth so that the contribution of the smaller meiofauna to the
overall diversity was found to increase. Below 2000 m, foraminif-
eral diversity increased by 20–30% whilst meiofaunal diversity
increased by 60–80% [18].
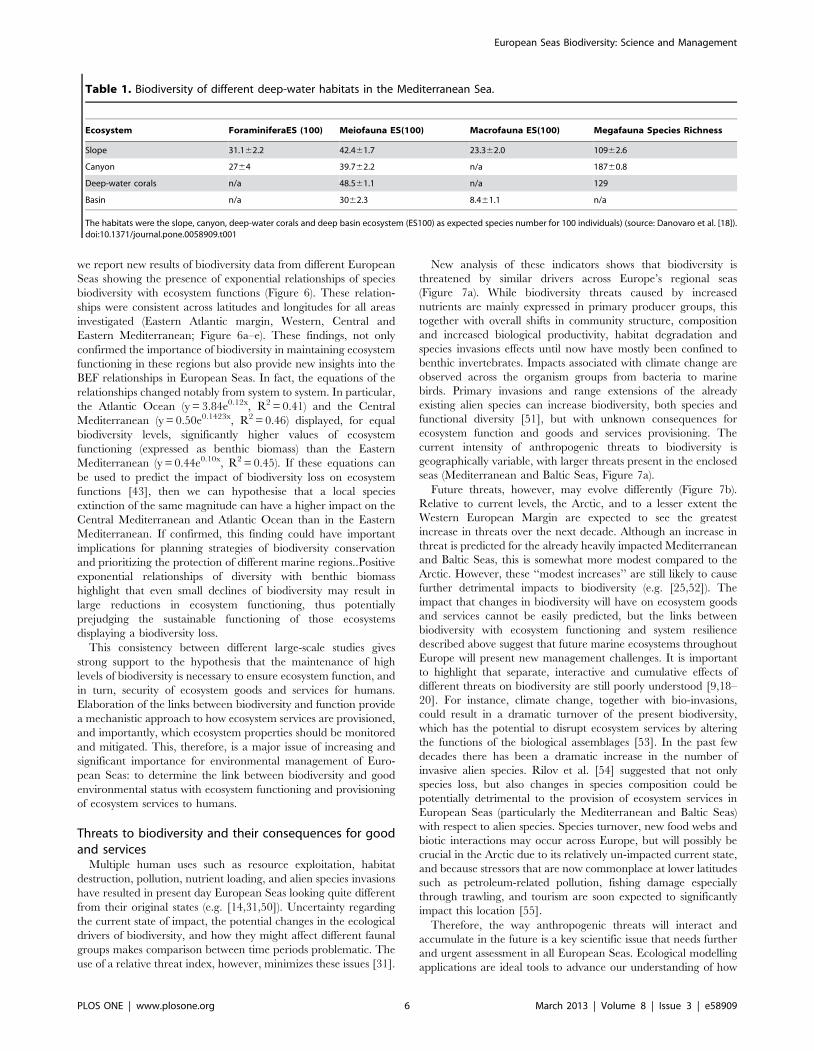
Within a single region, benthic biodiversity of different faunal
size groups can vary differently across different habitats. For
example, significantly higher megafaunal diversity was observed in
deep-sea canyons than on open slopes in the Mediterranean
(Table 1), but this pattern does not hold for foraminifera and
meiofauna, which displayed similar values along open slopes and
canyons [18]. All benthic components investigated displayed lower
values in the deep basin than along slopes and canyons. For cold-
water corals, the complex structure provided by the frame-
building species provides refuges for many species and increases
habitat heterogeneity, creating a suitable environment for
recruitment and growth of many other species [40]. This is
confirmed by the large number of megafaunal species (comparable
to that of slopes) and by the extremely high values of meiofaunal
(as Nematoda) diversity around coral reefs.
Meta-analysis of latitude and longitudeAlthough spatial patterns of biodiversity are poorly known,
regional studies have shown clear gradients of biodiversity by
latitude and longitude. For example, results for the deep waters of
the Mediterranean Sea showed a clear longitudinal biodiversity
gradient that also occurred along the open slopes, where values
decreased eastward, from Catalonia to the margins of southern
Crete [9,18]. Species distribution models also predicted clear
patterns of declining biodiversity with longitude (e.g. moving from
the Western to the Eastern Mediterranean Sea) and some
declining trends from North to South following a latitudinal
transect [9].
The new meta-analysis we conducted on pan-European deep-
water datasets revealed the high variability of species richness (as
Expected Species Number) in a random sample of 51 individuals
[ES(51)] for both meiofauna and macrofauna at all longitudes and
latitudes (Figure 5b-c). Nematodes dominated the meiofauna, their
biodiversity varied longitudinally (Figure 5b), and it decreased
from the Atlantic to the Eastern Mediterranean. These findings
are consistent and expand those previously reported for longitu-
dinal patterns across the Mediterranean basin and related to food
quality and quantity [41]. In the Atlantic, diversity of both
meiofauna and macrofauna generally increased with latitude (30uto 82u N) (Figure 5c). Interestingly, latitudinal patterns for
meiofauna and macrofauna were very similar indicating that both
components responded to the same environmental drivers. These
patterns are likely due to the increasing productivity of the
northern European regions, and a similar pattern was also
reported within the Mediterranean basin, where the northern
portion is richer due to the higher river and nutrient input.
However, Renaud et al. [42] found little evidence of any
latitudinal pattern for the shelf infauna, from the Mediterranean
through to Frans Josef Land. These findings highlight the
importance of analysing large data set, which enable the
Figure 3. State of knowledge of taxonomic groups ranked from 1–5. Rankings equate to: 5 = very well known; 4 = well known; 3 = poorlyknown; 2 = very poorly known; 1 = unknown (Sources: B Bluhm pers. comm; Coll et al. [9], Danovaro et al. [18], Narayanaswamy et al. [19], Ojaveer etal. [20]).doi:10.1371/journal.pone.0058909.g003
European Seas Biodiversity: Science and Management
PLOS ONE | www.plosone.org 4 March 2013 | Volume 8 | Issue 3 | e58909
identification of patterns which are not always evident on analyses
at smaller spatial scale.
Importance of marine biodiversity to ecosystemfunctioning
Biodiversity is tightly linked to ecosystem functioning, which in
turn regulates the ecosystem services supplied to humans. In
general, higher species richness leads to greater biomass accumu-
lation and resource use within trophic levels [43]. In marine
systems this can be observed through direct and indirect effects of
biodiversity on system productivity and stability [44]. The
complexity of these linkages is mediated through food-web
interactions, and can produce feedback loops whereby system
functioning can impact biodiversity itself [44,45]. Based on meta-
analyses of a large and varied data set, Worm et al. [8] concluded
that biodiversity loss negatively impacts critical functions of marine
ecosystems, including provision of food, water quality, and ability
to recover from perturbations. Similarly, ecosystem resilience to
natural and anthropogenic impacts has also been shown to be
enhanced by higher levels of genetic, species, and functional
biodiversity (e.g. [46–49]). A global scale study conducted in deep-
sea ecosystems for the first time found empirical evidence from the
real world that the rates of ecosystem processes and their efficiency
are exponentially related to biodiversity, so that even a minor
diversity loss can lead to a dramatic decrease of ecosystem
functions and thus to the collapse of ecosystem services [22]. These
findings have been confirmed by subsequent investigations
conducted on tropical habitats and it can be hypothesised that
similar interactions occur in biodiversity-hotspot ecosystems. Here
Figure 4. Spatial patterns of bacterial diversity as genotyperichness. Reported are bathymetric gradients of A) bacterial diversityand B) Bacterial Evenness (ARISA). Data are from the Arctic (n = 42),North Atlantic (n = 33), central Atlantic (n = 100) and Mediterranean Sea(n = 113) (Sources = HERMIONE project and the Pangea database).doi:10.1371/journal.pone.0058909.g004 Figure 5. Spatial patterns of meiofaunal and macrofaunal
diversity as ES(51). Reported are A) bathymetric gradient, B)longitudinal and C) latitudinal. The equations of the fitting lines are:y = 25e2 0 56+24.1 (n = 306, R2 = 7e2 0 . 5 , ns for meiofauna,y = 0.00026+19.4 (n = 2226, R2 = 7e205, ns for macrofauna along thebathymetric gradient; y = 20.296+25.5 (n = 306, R2 = 0.18, p,0.01) formeiofauna, y = 0.056+17.15(n = 2789, R2 = 0.07, ns) for macrofaunaalong the longitudinal gradient; y = 0.376+8.9 (n = 306, R2 = 0.04, ns)for meiofauna, y = 0.46629.3 (n = 2821, R2 = 0.30, p,0.01) formacrofauna along the latitudinal gradient (sources for macrofaunaldata: Rees et al. [39], Kroncke et al. [78],.new data for the deepMediterranean Sea and Atlantic margin; meiofauna Danovaro et al. [41]and 108 additional sites from the Mediterranean and Atlantic Margins).Overall 3130 sampling sites were assembled covering the Europeanmargins from continental shelves to the deep-sea floor (down to ca.5000 m depth).doi:10.1371/journal.pone.0058909.g005
European Seas Biodiversity: Science and Management
PLOS ONE | www.plosone.org 5 March 2013 | Volume 8 | Issue 3 | e58909
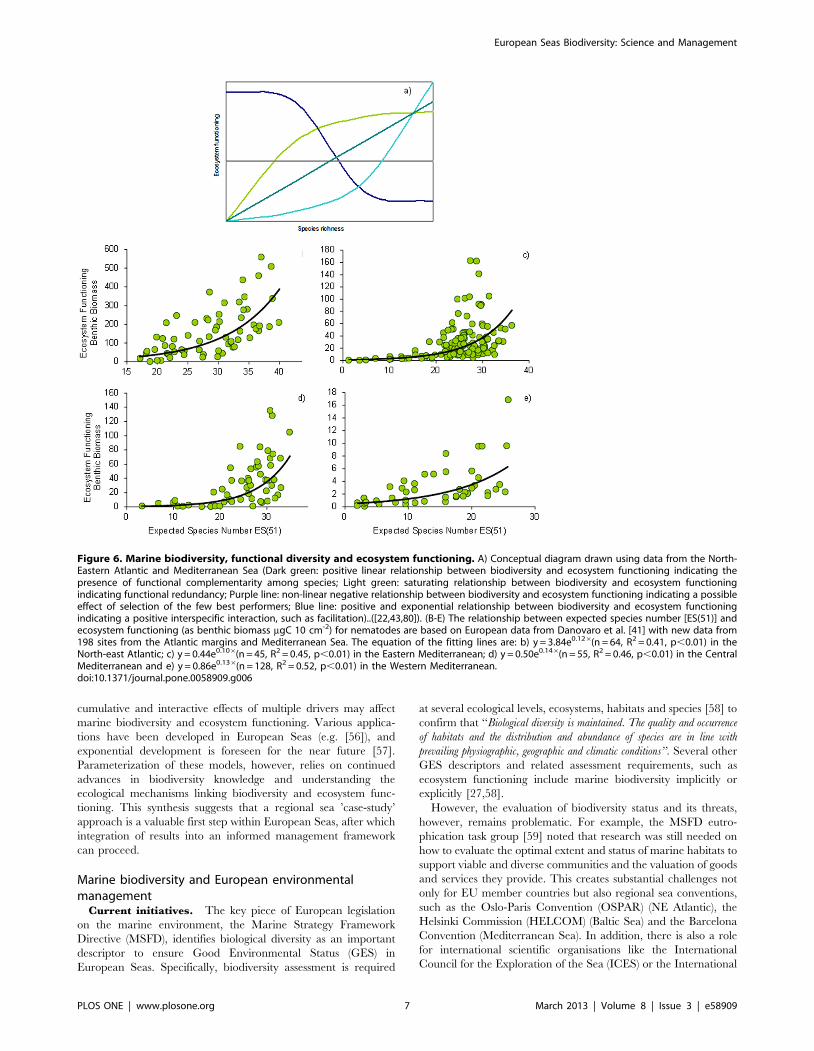
we report new results of biodiversity data from different European
Seas showing the presence of exponential relationships of species
biodiversity with ecosystem functions (Figure 6). These relation-
ships were consistent across latitudes and longitudes for all areas
investigated (Eastern Atlantic margin, Western, Central and
Eastern Mediterranean; Figure 6a–e). These findings, not only
confirmed the importance of biodiversity in maintaining ecosystem
functioning in these regions but also provide new insights into the
BEF relationships in European Seas. In fact, the equations of the
relationships changed notably from system to system. In particular,
the Atlantic Ocean (y = 3.84e0.12x, R2 = 0.41) and the Central
Mediterranean (y = 0.50e0.1423x, R2 = 0.46) displayed, for equal
biodiversity levels, significantly higher values of ecosystem
functioning (expressed as benthic biomass) than the Eastern
Mediterranean (y = 0.44e0.10x, R2 = 0.45). If these equations can
be used to predict the impact of biodiversity loss on ecosystem
functions [43], then we can hypothesise that a local species
extinction of the same magnitude can have a higher impact on the
Central Mediterranean and Atlantic Ocean than in the Eastern
Mediterranean. If confirmed, this finding could have important
implications for planning strategies of biodiversity conservation
and prioritizing the protection of different marine regions..Positive
exponential relationships of diversity with benthic biomass
highlight that even small declines of biodiversity may result in
large reductions in ecosystem functioning, thus potentially
prejudging the sustainable functioning of those ecosystems
displaying a biodiversity loss.
This consistency between different large-scale studies gives
strong support to the hypothesis that the maintenance of high
levels of biodiversity is necessary to ensure ecosystem function, and
in turn, security of ecosystem goods and services for humans.
Elaboration of the links between biodiversity and function provide
a mechanistic approach to how ecosystem services are provisioned,
and importantly, which ecosystem properties should be monitored
and mitigated. This, therefore, is a major issue of increasing and
significant importance for environmental management of Euro-
pean Seas: to determine the link between biodiversity and good
environmental status with ecosystem functioning and provisioning
of ecosystem services to humans.
Threats to biodiversity and their consequences for goodand services
Multiple human uses such as resource exploitation, habitat
destruction, pollution, nutrient loading, and alien species invasions
have resulted in present day European Seas looking quite different
from their original states (e.g. [14,31,50]). Uncertainty regarding
the current state of impact, the potential changes in the ecological
drivers of biodiversity, and how they might affect different faunal
groups makes comparison between time periods problematic. The
use of a relative threat index, however, minimizes these issues [31].
New analysis of these indicators shows that biodiversity is
threatened by similar drivers across Europe’s regional seas
(Figure 7a). While biodiversity threats caused by increased
nutrients are mainly expressed in primary producer groups, this
together with overall shifts in community structure, composition
and increased biological productivity, habitat degradation and
species invasions effects until now have mostly been confined to
benthic invertebrates. Impacts associated with climate change are
observed across the organism groups from bacteria to marine
birds. Primary invasions and range extensions of the already
existing alien species can increase biodiversity, both species and
functional diversity [51], but with unknown consequences for
ecosystem function and goods and services provisioning. The
current intensity of anthropogenic threats to biodiversity is
geographically variable, with larger threats present in the enclosed
seas (Mediterranean and Baltic Seas, Figure 7a).
Future threats, however, may evolve differently (Figure 7b).
Relative to current levels, the Arctic, and to a lesser extent the
Western European Margin are expected to see the greatest
increase in threats over the next decade. Although an increase in
threat is predicted for the already heavily impacted Mediterranean
and Baltic Seas, this is somewhat more modest compared to the
Arctic. However, these ‘‘modest increases’’ are still likely to cause
further detrimental impacts to biodiversity (e.g. [25,52]). The
impact that changes in biodiversity will have on ecosystem goods
and services cannot be easily predicted, but the links between
biodiversity with ecosystem functioning and system resilience
described above suggest that future marine ecosystems throughout
Europe will present new management challenges. It is important
to highlight that separate, interactive and cumulative effects of
different threats on biodiversity are still poorly understood [9,18–
20]. For instance, climate change, together with bio-invasions,
could result in a dramatic turnover of the present biodiversity,
which has the potential to disrupt ecosystem services by altering
the functions of the biological assemblages [53]. In the past few
decades there has been a dramatic increase in the number of
invasive alien species. Rilov et al. [54] suggested that not only
species loss, but also changes in species composition could be
potentially detrimental to the provision of ecosystem services in
European Seas (particularly the Mediterranean and Baltic Seas)
with respect to alien species. Species turnover, new food webs and
biotic interactions may occur across Europe, but will possibly be
crucial in the Arctic due to its relatively un-impacted current state,
and because stressors that are now commonplace at lower latitudes
such as petroleum-related pollution, fishing damage especially
through trawling, and tourism are soon expected to significantly
impact this location [55].
Therefore, the way anthropogenic threats will interact and
accumulate in the future is a key scientific issue that needs further
and urgent assessment in all European Seas. Ecological modelling
applications are ideal tools to advance our understanding of how
Table 1. Biodiversity of different deep-water habitats in the Mediterranean Sea.
Ecosystem ForaminiferaES (100) Meiofauna ES(100) Macrofauna ES(100) Megafauna Species Richness
Slope 31.162.2 42.461.7 23.362.0 10962.6
Canyon 2764 39.762.2 n/a 18760.8
Deep-water corals n/a 48.561.1 n/a 129
Basin n/a 3062.3 8.461.1 n/a
The habitats were the slope, canyon, deep-water corals and deep basin ecosystem (ES100) as expected species number for 100 individuals) (source: Danovaro et al. [18]).doi:10.1371/journal.pone.0058909.t001
European Seas Biodiversity: Science and Management
PLOS ONE | www.plosone.org 6 March 2013 | Volume 8 | Issue 3 | e58909
cumulative and interactive effects of multiple drivers may affect
marine biodiversity and ecosystem functioning. Various applica-
tions have been developed in European Seas (e.g. [56]), and
exponential development is foreseen for the near future [57].
Parameterization of these models, however, relies on continued
advances in biodiversity knowledge and understanding the
ecological mechanisms linking biodiversity and ecosystem func-
tioning. This synthesis suggests that a regional sea ’case-study’
approach is a valuable first step within European Seas, after which
integration of results into an informed management framework
can proceed.
Marine biodiversity and European environmentalmanagement
Current initiatives. The key piece of European legislation
on the marine environment, the Marine Strategy Framework
Directive (MSFD), identifies biological diversity as an important
descriptor to ensure Good Environmental Status (GES) in
European Seas. Specifically, biodiversity assessment is required
at several ecological levels, ecosystems, habitats and species [58] to
confirm that ‘‘Biological diversity is maintained. The quality and occurrence
of habitats and the distribution and abundance of species are in line with
prevailing physiographic, geographic and climatic conditions’’. Several other
GES descriptors and related assessment requirements, such as
ecosystem functioning include marine biodiversity implicitly or
explicitly [27,58].
However, the evaluation of biodiversity status and its threats,
however, remains problematic. For example, the MSFD eutro-
phication task group [59] noted that research was still needed on
how to evaluate the optimal extent and status of marine habitats to
support viable and diverse communities and the valuation of goods
and services they provide. This creates substantial challenges not
only for EU member countries but also regional sea conventions,
such as the Oslo-Paris Convention (OSPAR) (NE Atlantic), the
Helsinki Commission (HELCOM) (Baltic Sea) and the Barcelona
Convention (Mediterranean Sea). In addition, there is also a role
for international scientific organisations like the International
Council for the Exploration of the Sea (ICES) or the International
Figure 6. Marine biodiversity, functional diversity and ecosystem functioning. A) Conceptual diagram drawn using data from the North-Eastern Atlantic and Mediterranean Sea (Dark green: positive linear relationship between biodiversity and ecosystem functioning indicating thepresence of functional complementarity among species; Light green: saturating relationship between biodiversity and ecosystem functioningindicating functional redundancy; Purple line: non-linear negative relationship between biodiversity and ecosystem functioning indicating a possibleeffect of selection of the few best performers; Blue line: positive and exponential relationship between biodiversity and ecosystem functioningindicating a positive interspecific interaction, such as facilitation)..([22,43,80]). (B-E) The relationship between expected species number [ES(51)] andecosystem functioning (as benthic biomass mgC 10 cm-2) for nematodes are based on European data from Danovaro et al. [41] with new data from198 sites from the Atlantic margins and Mediterranean Sea. The equation of the fitting lines are: b) y = 3.84e0.126(n = 64, R2 = 0.41, p,0.01) in theNorth-east Atlantic; c) y = 0.44e0.106(n = 45, R2 = 0.45, p,0.01) in the Eastern Mediterranean; d) y = 0.50e0.146(n = 55, R2 = 0.46, p,0.01) in the CentralMediterranean and e) y = 0.86e0.136(n = 128, R2 = 0.52, p,0.01) in the Western Mediterranean.doi:10.1371/journal.pone.0058909.g006
European Seas Biodiversity: Science and Management
PLOS ONE | www.plosone.org 7 March 2013 | Volume 8 | Issue 3 | e58909

Commission for the exploration of the Mediterranean Sea
(CIESM) to further advance knowledge pool of marine biodiver-
sity science and advice, for instance, to develop, test and suggest
new indicators, and investigate links between state and pressure
indicators (e.g. [60]).
Scientific and management communities have devoted consid-
erable effort over the past decade to identify threatened and
declining species and habitats, characterize the extent of the
threat/decline, and evaluate associated ecosystem consequences
(e.g. [25,61]). Most of the studies dealing with threatened/
declining species relate to upper trophic levels, and the findings are
not encouraging. For example, threat indicators based on the
estimated population status of North Sea fishes using the
International Union for the Conservation of Nature (IUCN) Red
List decline criteria, suggested that the proportion of threatened
fishes and the degree of threat had increased steadily over time,
with all species since the late 1990s meeting the ‘‘vulnerable’’
criterion [62]. In the Baltic Sea, all four marine mammals and 34
fish (,18%) species have been identified as high priority for
conservation ([63] and references therein). Most threatened (fish)
species have low intrinsic population growth rates and suffer high
fishing mortality. Species with a lower risk of extinction have either
resilient life histories or are species subject to intense fisheries
management [64]. Many cartilaginous fish in the Mediterranean
Sea are vulnerable and several stocks have collapsed during the
last century [9,65,66]. Thus, with regards to management,
biodiversity is generally considered in terms of a relatively few
(exploited) species and/or habitats (see below), while wider
genetic/taxonomic/community aspects remain as yet an un-
achievable challenge.
An important mechanism for safeguarding the critical functions
of both pelagic and benthic biodiversity is the use of Marine
Protected Areas (MPAs) and these have now been established in all
European regional seas. One of the main criteria for selection of
MPAs is the presence of a species/habitat in need of protection
(identified as threatened and/or declining species and habitats).
Currently, the three major European regional marine environ-
ment management areas (i.e., Mediterranean Sea, Northeast
Atlantic and the Baltic) contain .800 planned or established
Special Protected Areas (SPAs) and 133 sites of Scientific
Community Importance with an overall surface area of
,124,000 km2 and ,179,000 km2, respectively, but distribution
is patchy and the proportion of spatial coverage in each area is still
limited [23,25,67,68]. Regional studies of biodiversity, ecosystem
function, and threats, therefore, can provide one of the bases for
identifying target areas for future MPAs.
There are two current major initiatives to address conservation
of marine biodiversity and sustainable use in areas beyond
national jurisdiction in European Seas. The Food and Agriculture
Organization of the United Nations (FAO) has initiated a process
to identify Vulnerable Marine Ecosystems (VMEs), and adopted
international guidelines to define management frameworks to
prevent significant adverse impacts on them. But, until now,
measures to protect VMEs have been almost exclusively closure of
areas considered to have significant concentrations of corals.
Another initiative was taken by the Convention of Biological
Diversity (CBD), which most recently started a regional-scale
initiative to identify ecologically or biologically significant marine
areas (EBSAs) through cooperation with national governments as
well as relevant management or advisory organizations. The
process of EBSA identification is a scientific and technical step and
needs to be kept separate from the processes used to decide on the
policy and management responses that are appropriate for
providing the desired level of protection to those areas [69]. In
addition to these two global initiatives working in European Seas,
OSPAR has made considerable progress in establishing MPAs in
the North Atlantic, and the Barcelona Convention has been
designating SPAs in the Mediterranean areas beyond national
jurisdiction.
New knowledge and tools for management: a regional
approach. Developing a toolbox for identifying GES across
European waters, as called for in the MSFD, is a daunting task and
is probably best begun through a regional approach. Biodiversity
itself is still unevenly described among different taxa, and regions,
and knowledge syntheses can be useful in highlighting this issue
(Figure 3). For example, our knowledge and understanding of the
smaller sized meiofauna, which exhibit the highest number of
expected species and the greatest proportion of unknown diversity,
is relatively low compared to their larger macro- and mega- faunal
counterparts. It is estimated that potentially .60% of the
Mediterranean deep sea meiofauna still remain to be discovered
[18]. The microbial diversity is completely neglected although the
key role of microbial species in biogeochemical cycles is fully
recognized, in symbiotic interactions and in sustaining all other life
forms. Moreover, compared to species and populations, our
knowledge-base on biotopes/habitats is much weaker. For
instance, a critical analysis of the most recent marine habitat
classification list produced for the Mediterranean Sea showed that
,40% of habitats (and associated species) considered were scarcely
covered by scientific knowledge, and generally scant quantitative
information on the geographical distribution of selected habitats
and associated species was available [70]. In addition, all assessed
biotopes/habitats in the Baltic Sea are considered to be
threatened, the conservation status of most is inadequate, and all
Figure 7. Qualitative ranking of potential threats to biodiver-sity from natural and human impacts. Threats were assessed forboth A) current conditions and B) expected conditions in 10 years: theaverage value for each future threat was subtracted from the currentperceived threat for comparison among regions. A negative value in theplot suggests predicted lessening of the threat (modified from Coll et al.[9] and Costello et al. [31]).doi:10.1371/journal.pone.0058909.g007
European Seas Biodiversity: Science and Management
PLOS ONE | www.plosone.org 8 March 2013 | Volume 8 | Issue 3 | e58909
are in urgent need of protective measures [63]. Therefore,
improved inventories of marine habitats are needed to support
mapping activities and spatial ecosystem-based management
[71,72].
How successful has the scientific community been in meeting
the multiple challenges regarding diversity in the oceans?
European Seas are some of the most well studied [14,31], and it
can be argued that Europe has been possibly the most active in
establishing regional management policies. However, much still
remains to be done before the ultimate target (at least 10% of all
marine ecological regions to be effectively conserved [73]) will be
achieved across Europe. Moreover, future conservation strategies
will need revision as current MPAs potentially miss hotspots of
diversity traits and anthropogenic impacts (e.g. [23,25]).
Requirements to meet future challenges. Here we have
attempted to synthesise the available knowledge on European
Marine Biodiversity using both new data and existing databases
and demonstrated significant progress in species identification and
understanding of the link between anthropogenic drivers, biodi-
versity and ecosystem function. However, many species remain
un-discovered and/or un-enumerated, with no habitat having
been fully explored and hence our quantitative understanding of
these links remains poor.
It is therefore clear that much still remains to be done, with
major challenges to be faced in deciding what we can achieve and
what information will remain unknowable. Meeting these chal-
lenges will require:
i) Investing resources in taxonomy (classical coupled with
molecular taxonomic studies) with specific training of new
specialists also able to undertake new molecular techniques
to describe cryptic biodiversity and resolve uncertainties
related to the use of classical taxonomy,
ii) investigating species interactions, life traits, cycles and
histories and populations’ connectivity, of most marine
species and populations across different habitats and
ecosystems are still completely unknown,
iii) standardising methodologies in order to ensure that
subsequent data and results can be rigorously and
statistically compared and validated,
iv) increasing sampling effort and exploration of novel habitats
and in identifying and mapping biodiversity hotspots,
v) making both historical and new data increasingly more
accessible once published,
vi) expanding studies of microbial diversity and on the
understanding of its interactions with other biological
components of the marine ecosystem,
vii) quantifying ecosystem services and the impact of loss of
biodiversity on these goods and services in different marine
habitats/ecosystems/regions, and how cumulative and
synergistic anthropogenic impacts may impact these
services,
viii) identifying and quantifying the link between the pressure on
biodiversity and state indicators,
ix) enhancing the importance of biodiversity in marine
management policy decisions.
Some of the challenges outlined above have been recently
identified as a priority activity for ICES [60]. In addition to
describing biodiversity at its many levels, new technology,
monitoring, and analytical tools are needed to define and maintain
GES in a meaningful and practical manner. Indicators of
biodiversity must be developed and compared among regions,
with biodiversity syntheses providing the crucial ground-truthing
data. Habitat, food-web, and statistical models can be applied on a
regional basis in both a descriptive manner, and in a dynamic
mode whereby effects of altered biodiversity can be experimentally
evaluated to answer questions regarding, e.g. effects of introduced
species, impacts on ecosystem functioning, and consequences for
goods and services. Preservation and maintenance of biodiversity
is a complex issue requiring consideration of geographic, political,
economic and social factors [74], often differing considerably
across a region as diverse as Europe. Resolution of these often-
conflicting pressures, however, must be reached if we are to
achieve the common aim of ecosystem-based management of the
marine environment [75]. Through integration of efforts to
develop indicators, monitoring, and impact-assessment strategies,
and identification regional and spatial threats and other human
pressures, we can move closer to resolving conflicts while
addressing Europe’s goals of managing biodiversity in its marine
waters.
Materials and Methods
No specific permits were required for the described field studies.
The field studies did not involve endangered or protected species.
Methods for Figure 2Here we used datasets collected and synthesised recently
(sources: [9,18–20]) as well as accessing new and updated results
from EurOBIS ([30]) and integrated them to provide new results
of biodiversity patterns at a European Sea scale.
Methods for Figure 3A number of taxonomic experts from each region were asked to
assess each taxonomic group and rank them from 1–5, where 5 is
the most well-known. This enabled us to determine the current
state of knowledge for each major taxonomic group. The
definitions for the rankings are as follows: 5 = very well known
(.80% described, identification guides ,20 years old, and good
taxonomic expertise); 4 = well known (.70% described, identi-
fication guides ,50 years old, good taxonomic expertise); 3 =
poorly known (,50% species described, identification guides old
or incomplete, moderate taxonomic expertise); 2 = very poorly
known (only few species recorded, no identification guides, little
taxonomic expertise); 1 = unknown (no species recorded, no
identification guides, no expertise) (sources: B Bluhm pers comm.,
[9,18–20]).
Methods for Figure 4Bacterial diversity patterns were investigated using ARISA a
highly reproducible fingerprinting technique commonly utilized
for describing bacterial diversity distribution and the main
components of the bacterial assemblages in marine environments
[76,77]. ARISA involves PCR amplification of the highly variable
intergenic spacer region (ITS1) between the 16 S and 23 S rRNA
genes, followed by separation and detection of the different-length
products. ARISA allows to discriminate the ‘‘Operational
Taxonomic Units’’ (OTUs) that differ by ca. 98% or less in 16 S
rRNA sequence similarity. ARISA was preferred to 454 tag
sequencing because it allowed an assessment of diversity patterns
at an unparalleled sample size and spatial scales [76].
Methods for Figure 5Sampling was carried out in the North and Central Atlantic
Ocean (100 sites), the Western and Eastern Mediterranean Sea (98
sites). These areas included continental shelves and margins as well
European Seas Biodiversity: Science and Management
PLOS ONE | www.plosone.org 9 March 2013 | Volume 8 | Issue 3 | e58909

as open-ocean sites. At all of the sites, macro- and meio- (namely
nematodes) faunal samples were collected, identified to the lowest
taxonomic level and species richness analyzed. Part of the
biodiversity data set of from the Atlantic Ocean and Mediterra-
nean were obtained from the literature [22,41]. In particular,
sources for macrofaunal data are Rees et.al. [39], Kroncke et al.
[78].and new data for the deep Mediterranean Sea and Atlantic
Margin are from the EU funded HERMIONE project; meiofauna
Danovaro et al. [41]; these data were implemented in the present
study with 108 additional sites from the Mediterranean and
Atlantic margins. Since most species diversity indices are sample-
size dependent, we applied the rarefaction method was so that all
samples could be reduced to the same size, with ES(51) as the
expected number of species in a hypothetical random sample of 51
individuals. All indexes of biodiversity were calculated with the
PRIMER 6 statistical package [79].
Methods for Figure 6Ecosystem functioning [22,43] was determined as total faunal
biomass, a proxy for production. For the determination of faunal
biomass, we calculated the individual biomass of all animals
belonging to different taxa [80]. Nematode biomass was calculated
from bio-volume (n = 100 per replicate) with Andrassy’s formula
(V = L6W260.06361025, in which body length, L, and width,
W, are expressed in mm). For all of the other taxa, the biovolume
was measured for all of the specimens encountered and was
derived from measurements of body length (L, in mm) and width
(W, in mm), using the formula V = L 6W2 6C, where C is the
approximate conversion factor for each meiofaunal taxon. Each
body volume was multiplied by an average density (1.13 g cm23)
to obtain the biomass ( mg DW: mg WW = 0.25) and the carbon
content was considered to be 40% of the dry weight.
Methods for Figure 7Here we standardized and modified the methodology used by
Coll et al. [9] and Costello et al. [31] to determine the current and
future threats to biodiversity from both natural and anthropogenic
impacts. Following interviews with experts from the different
geographical regions, a scale of 1 (low importance) – 5 (very
important) was assigned to 17 different taxonomic groups for each
potential threat in each region (sources: [9,18–20]).
Acknowledgments
The authors gratefully acknowledge the support given by the European
Census of Marine Life and the Census of Marine Life. The authors are also
indebted to all those who have undertaken the research through the various
Census of Marine Life projects, EU-funded MarBEF, HERMES and
HERMIONE programmes, as well as those that have been nationally
funded. We would also like to thank all the regional experts who have
provided their input into estimating biodiversity threats both for now and
the future.
This paper is dedicated to the late Professor Carlo Heip who was one of
the founding members of the European Census of Marine Life and this
paper would not have come to fruition had it not been for all the projects
that he initiated and led, including MarBEF. Carlo Heip played an
important role in investigating and promoting biodiversity research at
National, European and International levels.
Author Contributions
Analyzed the data: BN MC RD KD HO PR. Wrote the paper: BN MC
RD KD HO PR.
References
1. Pedros-Alio C (2006) Marine microbial diversity: can it be determined? Trends
Microbiol 14: 257–263.
2. Millennium Ecosystem Assessment (2005) Ecosystems and Human Well-being:
Synthesis. Island Press, Washington, DC.
3. Chapin FS, Zavaleta ES, Eviner VT, Naylor RL Vitousek PM, et al. (2000)
Consequences of changing biodiversity. Nature 405:234–242..DOI: 10.1038/
35012241.
4. McCann K (2007) Protecting biostructure. Nature 446: 29.
5. Vira B, Adams WM (2009) Ecosystem services and conservation strategy:
beware the silver bullet. Conserv Lett 2: 158–162.
6. Heip C, Hummel H, van Avesaath P, Appeltans W, Arvanitidis C, et al. (2009)
Marine biodiversity and ecosystem functioning. Dublin, Ireland ,Printbase.
91pp.
7. Duffy JE (2009) Why biodiversity is important to the functioning of real-world
ecosystems. Front Ecol Environ 7: 437–444.
8. Worm B, Barbier EB, Beaumont N, Duffy JE, Folke C, et al. (2006) Impacts of
biodiversity loss on ocean ecosystem services. Science 314: 787–790.
9. Coll M, Piroddi C, Kaschner K, Ben Rais Lasram F, Steenbeek J, et al. (2010)
The biodiversity of the Mediterranean Sea: estimates, patterns and threats. PLoS
ONE 5(8): e11842.
10. Stein U, Hukriede W, Rumohr H (1990) Historische Benthosdaten aus
Nordund.Ostsee in den Jahren 1902–1912. Mitt Zool Mus Univ Kiel Suppl 3:
1–189.
11. Fonselius S, Valderrama J (2003) One hundred years of hydrographic
measurements in the Baltic Sea. J Sea Res 49: 229–241.
12. Lotze HK, Reise K, Worm B, van Beusekom J, Busch M, et al. (2005) Human
transformations of the Wadden Sea ecosystem through time: a synthesis. Helgol
Mar Res 59: 84–95.
13. Ojaveer H, Mackenzie B (2007) Historical development of fisheries in northern
Europe - Reconstructing chronology of interactions between nature and man.
Fish Res 87: 102–105.
14. Lotze HK, Coll M, Dunne JA (2011) Historical changes in marine resources,
food-web structure and ecosystem functioning in the Adriatic Sea, Mediterra-
nean. Ecosystems 14: 198–222.
15. May R (2011) Why worry about how many species and their loss? PLoS Biol
9(8): e1001130. doi:10.1371/journal.pbio.1001130.
16. Ausubel JH (1999) Toward a census of marine life. Oceanogr 12 (3): 4–5.
17. Mora C, Tittensor DP, Adl S, Simpson AGB, Worm B (2011) How Many
Species Are There on Earth and in the Ocean? PLoS Biol 9(8): e1001127.
doi:10.1371/journal.pbio.1001127.
18. Danovaro R, Company JB, Corinaldesi C, D9Onghia G, Galil B, et al. (2010)
Deep-Sea biodiversity in the Mediterranean Sea: the known, the unknown and
the unknowable. PLoS ONE 5(8): e11832.
19. Narayanaswamy BE, Renaud PE, Duineveld GCA, Berge J, Lavaleye MSS, et
al. (2010) Biodiversity trends along the Western European Margin. PLoS ONE
5(12): e14295..DOI: 10.1371/journal.pone.0014295.
20. Ojaveer H, Jaanus A, MacKenzie BR, Martin G, Olenin S, et al. (2010) Status
of Biodiversity in the Baltic Sea. PLoS ONE 5(9): e12467. DOI: 10.1371/
journal.pone.0012467.
21. Beaumont NJ, Austen MC, Mangi S, Townsend M (2008) Economic valuation
for the conservation of marine biodiversity. Mar Poll Bull 56 (3): 386–396.
22. Danovaro R, Gambi C, Dell’Anno A, Corinaldesi C, Fraschetti S, et al. (2008)
Exponential decline of deep-sea ecosystem functioning linked to benthic
biodiversity loss. Curr Biol 18: 1–18.
23. Mouillot D, Albouy C, Guilhaumon F, Lasram FBR, Coll M, et al. (2011)
Protected and threatened components of fish biodiversity in the Mediterranean
Sea. Curr Biol 21: 1044–1050.
24. Meynard CN, Mouillot D, Mouquet N, Douzery E (2012) A Phylogenetic
Perspective on the Evolution of Mediterranean Teleost Fishes. PLoS ONE 7:
e36443. DOI: 10.1371/journal.pone.0036443.
25. Coll M, Piroddi C, Albouy C, Ben RaisLasram F, Cheung W, et al. (2012) The
Mediterranean Sea under siege: spatial overlap between marine biodiversity,
cumulative threats and marine reserves. Global Ecol Biogeog 21: 465–480.
26. Jones MC, Dye SR, Pinnegar JK, Warren R, Cheung WW (2012) Modelling
commercial fish distributions: Prediction and assessment using different
approaches. Ecol Model 225: 133–145.
27. Commission of the European Communities (CEC) (2008) Directive 2008/56/
EC of the European Parliament and the Council of 17 June 2008 establishing a
framework for community action in the field of marine environmental policy
(Marine Strategy Framework Directive). Official Journal of the European Union
164: 19–40.
28. Vandepitte L, Hernandez F, Claus S, Vanhoorne B, De Hauwere N, et al.
(2011) Analysing the content of the European Ocean Biogeographic Information
System (EurOBIS): available data, limitations, prospects and a look at the future.
Hydrobiologia 667: 1–14.
29. Costello MJ, Wilson SP (2010) Predicting the number of known and unknown
species in European seas using rates of description. Global Ecol Biogeography
20: 319–330.
European Seas Biodiversity: Science and Management
PLOS ONE | www.plosone.org 10 March 2013 | Volume 8 | Issue 3 | e58909
30. MarBEF (2004) European node of the Ocean Biogeographic Information
System. Available: http://www.marbef.org/data/eurobis.php.Accessed 22 Feb-ruary 2012.
31. Costello MJ, Coll M, Danovaro R, Halpin P, Ojaveer H, et al. (2010) A Census
of Marine Biodiversity Knowledge Resources and Future Challenges. PLoSONE 5(8): e12110.
32. Curtis TP, Sloan WT, Scannell JW (2002) Estimating prokaryotic diversity andits limits. Proc Natl Acad Sci USA 99: 10494–10499.
33. Medlin LK, Kooistra WHCF (2010) Methods to estimate the diversity in the
marine photosynthetic protist community with illustrations from case studies: areview. Diversity 2 (7): 973–1014.
34. Zinger L, Amaral-Zettler LA, Fuhrman JA, Horner-Devine MC, Huse SM, etal. (2011) Global Patterns of Bacterial Beta-Diversity in Seafloor and Seawater
Ecosystems. PLoS ONE 6(9): e24570. doi:10.1371/journal.pone.0024570.35. Danovaro R, Pusceddu A (2007) Biodiversity and ecosystem functioning in
coastal lagoons: does microbial diversity play any role? Estuar Coast Shelf Sci
75: 4–12.36. Baas Becking LGM (1934) Geobiologie of inleiding tot de milieukunde. The
Hague, the Netherlands: W.P. Van Stockum & Zoon.37. Whitfield J (2005) Is everything everywhere? Science 310: 960–961.
38. ERMS (2004) European Register of Marine Species Available: http://www.
marbef.org/data/aphia.php?p = search.Accessed 2 March 2012.39. Rees HL, Eggleton JD, Rachor E, Vanden Berghe E (2007) Structure and
dynamics of the North Sea benthos. ICES Coop Res Rep No. 288.pp 258.40. Bongiorni L, Mea M, Gambi C, Pusceddu A, Taviani M, et al. (2010) Deep-
water scleractinian corals promote higher biodiversity in deep-sea meiofaunalassemblages along continental margins. Biol Conserv 143(7): 1687–1700.
41. Danovaro R, Gambi C, Lampadriou N, Tselepides A (2008) Deep-sea nematode
biodiversity in the Mediterranean basin: testing for longitudinal, bathymetricand energetic gradients. Ecography 31(2): 231–244.
42. Renaud PE, Webb TJ, Bjorgesaeter A, Karakassis I, Kedra M et al. (2009)Continental-scale patterns in benthic invertebrate diversity: insights from the
MarcoBen database. Mar Ecol Prog Ser 382: 239–252.
43. Danovaro R (2012) Extending the approaches of biodiversity and ecosystemfunctioning to the deep ocean. In: Solan M, Aspden RJ, Paterson DM editors.
Marine biodiversity and ecosystem functioning: Frameworks, Methodologiesand Integration.Oxford:Oxford University Press.pp 113–124.
44. Worm B, Duffy JE (2003) Biodiversity, productivity and stability in real foodwebs. Trends Ecol Evol 18 (12): 628–632.
45. Duffy JE, Cardinale BJ, France KW, McIntyre PB, Thebault E, et al. (2007) The
functional role of biodiversity in ecosystems: incorporating trophic complexity.Ecol Lett 10 (6): 522–538.
46. Nystrom M, Folke C, Moberg F (2000) Coral reef disturbance and resilience in ahuman-dominated environment. Trends Ecol Evol 15 (10): 413–417.
47. Bellwood DR, Hoey AS, Choat JH (2003) Limited functional redundancy in
high diversity systems: resilience and ecosystem function on coral reefs. Ecol Lett6 (4): 281–285.
48. Folke C, Carpenter S, Walker B, Scheffer M, Elmqvist T, et al. (2004) Regimeshifts, resilience and biodiversity in ecosystem management. Annu Rev Ecol Evol
Syst 35: 557–581.49. Lotze HK, Lenihan HS, Bourque BJ, Bradbury RH, Cooke RG, et al. (2006)
Depletion, degradation, and recovery potential of estuaries and coastal seas.
Science 312: 1806–1809.50. Olenin S, Leppakoski E (1999) Non-native animals in the Baltic Sea: alteration
of benthic habitats in coastal inlets and lagoons. Hydrobiologia 393: 233–243.51. Sala E, Ballasteros E, Dendrinos P, Di Franco A, Ferretti F, et al. (2012) The
structure of Mediterranean rocky reef ecosystems across environmental and
human gradients, and conservation implications. PLoS ONE 7(2): e32742..DOI:10.1371/journal.pone.0032742...
52. Cheung WWL, Lam VWY, Sarmiento JL, Kearney K, Watson R, et al. (2009)Projecting global marine biodiversity impacts under climate change scenarios.
Fish Fisher 10: 235–251.
53. Rilov G, Mant R, Lyons DA, Bulleri F, Benedetti-Cecchi L, et al. (2012) Howstrong is the effect of invasive ecosystem engineers on the distribution patterns of
local species, the local and regional biodiversity and ecosystem functions?Environ Evid 1:10. doi:10.1186/2047-2382-1-10.
54. McCarthy JJ, Martello ML, Corell R, Selin NE, Fox S, et al. (2005) ClimateChange in the context of multiple stressors and resilience. Arctic Climate Impact
Assessment Scientific Report. Available: http://www.acia.uaf.edu/pages/
scientific.html.Accessed 20 August 2012.55. Coll M, Libralato S (2012) Contributions of food-web modelling for an
ecosystem approach of marine resource management in the Mediterranean Sea.Fish Fisher 13: 60–88.
56. Fulton EA (2010) Approaches to end-to-end ecosystem models. J Mar Syst 81:
171–183.57. Commission of the European Communities (CEC) (2010) Commission decision
of 1 September 2010 on criteria and methodological standards of good
environmental status of marine waters (2010/477/EU). Official Journal of theEuropean Union 232: 14–24.
58. Ferreira JG, Andersen JH, Borja A, Bricker SB, Camp J, et al..(2011) Overviewof eutrophication indicators to assess environmental status within the European
Marine Strategy Framework Directive. Estuar Coast Shelf Sci 93: 117–131.
59. ICES (2011) Update of cold-water coral and sponge maps and the informationunderpinning such maps on Vulnerable Marine Habitats (including Hatton and
Rockall Banks). ICES Advice 2011, Book 1. Available: http://www.ices.dk/advice/icesadvice.asp.Accessed 22 August 2012.
60. HELCOM (2007) HELCOM lists of threatened and/or declining species andbiotopes/habitats in the Baltic Sea area. Balt Sea Environ Proc 113: 1–17.
61. Dulvy NK, Jennings S, Rogers SI, Maxwell DL (2006) Threat and decline in
fishes: an indicator of marine biodiversity. Can J Fish Aquat Sci 63: 1267–1275.62. HELCOM (2009) Biodiversity in the Baltic Sea – An integrated thematic
assessment on biodiversity and nature conservation in the Baltic Sea. Balt SeaEnviron Proc 116B:1–188.
63. Dulvy NK, Baum JK, Clarke S, Compagno LJV, Cortes E (2008) You can swim
but you can’t hide: the global status and conservation of oceanic pelagic sharksand rays. Aquat Conserv: Mar Freshw Ecosyst 18: 459–482.
64. Ehlers A, Worm B, Reusch TBH (2008) Importance of genetic diversity ineelgrass Zostera marina for its resilience to global warming. Mar Ecol Prog Ser
355: 1–7.65. Abdul Malak D, Livingstone SR, Pollard D, Polidoro BA, Cuttelod A, et al.
(2011) Overview of the Conservation Status of the Marine Fishes of the
Mediterranean Sea. IUCN.Gland,Switzerland, andMalaga, Spain.vii+61 pp.66. Ferretti F, Myers RA, Serena F, Lotze HK (2008) Loss of large predatory sharks
from the Mediterranean Sea. Cons Biol 22(4): 952–964.67. Natura 2000 (2012) Nature and Biodiversity Newsletter. DG Environment,
European Commission, No. 32, 1–16pp.
68. Portman ME, Nathan D, Levin N (2012) From the Levant to Gibraltar: ARegional Perspective for Marine Conservation in the Mediterranean Sea.
Ambio: in press.69. CBD (2010) The Conference of the Parties (COP) Decision X/29 Marine and
coastal biodiversity. Available: http://www.cbd.int/decision/cop/?id = 12295.Accessed 24 November 2011.
70. Fraschetti S, Guarnieri G, Bevilacqua S, Terlizzi A, Claudet J, et al. (2011)
Conservation of Mediterranean habitats and biodiversity countdowns: whatinformation do we really need? Aquat Conserv: Mar Freshw Ecosyst 21: 299–
306.71. Katsanevakis S, Stelzenmuller V, South A, Sørensen TK, Jones PJ, et al. (2011)
Ecosystem-based marine spatial management: Review of concepts, policies,
tools, and critical issues. Ocean Coast Manage 54:807–820.72. Stelzenmuller V, Breen P, Stamford T, Thomsen F, Borja A, et al. (2012)
Monitoring and evaluation of spatially managed areas: A generic framework forimplementation of ecosystem based marine management and its application.
Mar Policy. In press.73. WSSD (2002) United Nations Report on the World Summit on Sustainable
Development. , South Africa.. 26 Aug–4 Sept 2002; Johannesburg,173 p.
74. Queffelec B, Cummins V, Bailly D (2009) Integrated management of marinebiodiversity in Europe: Perspectives from ICZM and the evolving EU Maritime
Policy framework. Mar Policy 33: 871–877.75. Palumbi SR, Snadifer PA, Allan JD, Beck MW, Fautin DG, et al. (2009)
Managing for ocean biodiversity to sustain marine ecosystem services. Front
Ecol Environ 7: 204–211.76. Danovaro R, Luna GM, Dell’Anno A, Pietrangeli B (2006) Comparison of two
fingerprinting techniques, terminal restriction fragment length polymorphismand automated ribosomal intergenic spacer analysis, for determination of
bacterial diversity in aquatic environments. Appl Environ Microbiol 72 (9):
5982–5989. DOI: 10.1128/AEM.01361-06.77. Fuhrman JA, Steele JA, Hewson I, Schwalbach MS, Brown MV, et al. (2008) A
latitudinal diversity gradient in planktonic marine bacteria. Proc Natl Acad SciUSA 105(22): 7774–7778.
78. Kroncke I, Turkay M, Fiege D (2003) Macrofauna communities in the EasternMediterranean deep sea. PSZN Mar Ecol 24(3): 193–216.
79. Clarke KR, Gorley RN (2006) PRIMER v6: User Manual/Tutorial. PRIMER-
E, Plymouth.80. Danovaro R (2010) Methods for the Study of Deep-Sea Sediments, Their
Functioning and Biodiversity. Boca Raton:CRC Press, Taylor & FrancisGroup.428 p.
European Seas Biodiversity: Science and Management
PLOS ONE | www.plosone.org 11 March 2013 | Volume 8 | Issue 3 | e58909