Embed Size (px)
Citation preview
Synthesis of Multiply Deuterated Cephalosporins
by
Karan Naresh Teckwani
A thesis
presented to the University of Waterloo
in fulfillment of the
thesis requirement for the degree of
Master of Science
in
Pharmacy
Waterloo, Ontario, Canada, 2014
© Karan Naresh Teckwani 2014

ii
Author's Declaration
“I hereby declare that I am the sole author of this thesis. This is a true copy of the thesis,
including any required final revisions, as accepted by my examiners.
I understand that my thesis may be made electronically available to the public.”
iii
Abstract
Antibiotics are one of the greatest accomplishments in the field of science. They have
been extensively used since the time of their discovery. Amongst all the antibiotics, the -
lactam class of antibiotics have been the most clinically used agents. However, the process of
bacterial resistance towards the antibiotics is becoming an alarming situation in the present
time. Due to the wide spread use of antibiotics, many Gram-positive and Gram-negative
pathogens developed resistance against them. Various pathways are known via which the
bacteria develop resistance towards the -lactam antibiotics, among which, the production of
-lactamase enzymes is the major cause of bacterial resistance. Presently, many
pharmaceutical companies and research groups are still interested in developing novel
cephalosporin derivatives, which would act as antibiotic as well as -lactamase inhibitor. The
Dmitrienko research group at the University of Waterloo has been developing novel C3ʹ
benzoylthio cephalosporin derivatives. These potential agents are proposed to possess extended
spectrum activity against pathogens that have developed multidrug resistance (also called
“Superbugs”). Preclinical pharmacokinetic studies of these novel C3ʹ benzoylthio
cephalosporin derivatives will be conducted after their synthesis. The availability of core
isotopic labelled cephalosporin will permit efficient synthesis of internal standards for any
novel cephalosporin derivative. The main goal of this thesis work was to synthesize a multiply
deuterated cephalosporin core. When this project was initiated, a survey of the literature
revealed a previous attempt to perform H/D exchange at C2 position of cephalosporin
sulfoxides but no attempts to incorporate deuterium at C3ʹ has been reported. In this study, C2
and C3ʹ of cephalosporin core were the proposed sites to incorporate deuterium. The first
objective was to perform a H/D exchange at the C2 position of a cephalosporin core. A H/D

iv
exchange reaction was performed with cephalosporin sulfoxide 3.3 using a mixture of benzene
and D2O at 80 oC to give 78% deuterium exchange at the C2 of 3.3 as determined by 1H NMR.
In order to increase the deuterium exchange another experimental condition were used in
which, compound 3.16 (benzhydryl ester of 7-ACA, phenylacetylated at C7) was heated at 50
oC in presence of DMSO and Methanol-OD. NMR studies revealed that 90.2% deuterium
incorporation had been achieved at each of the prochiral positions C2 of 3.16. After the
successful completion of objective 1, the second objective was to synthesize a C3ʹ
monodeuterated derivative. Eventually after certain attempts, C3ʹ hydroxyl cephalosporin 3.20
was oxidized to give the corresponding aldehyde 3.21, which was reduced by sodium
borodeuteride to give the monodeuterated C3ʹ hydroxyl derivative 3.27. The third objective of
this thesis work was to combine the results of H/D exchange at C2 and deuterium incorporation
at C3ʹ using functional group interconversion to synthesize a trideuterated cephalosporin
analogue. The core trideuterated C3ʹ alcohol 3.44 was synthesized from 3.11 (7-ACA) in 10
steps with an overall yield of 5.9%. In order to reduce the number of steps and to increase the
overall yield a modified route was achieved to synthesize trideuterated cephalosporin 3.44 in 8
steps starting from 3.11 (7-ACA) with an overall yield of 19% and a isotopic purity of 87.5%
(determined by NMR spectroscopy). Mass spectrometric analysis of 3.44 indicates that the
ratio of trideuterated to dideuterated molecules in material is 5 to 1.
v
Acknowledgement
From the bottom of my heart, I would like to thank my supervisors, Professor Gary
Dmitrienko and Professor Praveen Nekkar for providing me with the opportunity to pursue my
graduate studies under their supervision. My supervisors have been very supportive and helpful
throughout my graduate studies program. I am in debt to them for all the care and guidance
they have provided me with. I am sincerely thankful to be a part of their lab and indebted for
their mentorship.
I am thankful to Professors Mike Chong and Michael Beazely for being my committee
members. Dr. Chong has encouraged me to study the finer nuances of organic chemistry during
my thesis research proposal and committee meetings. Dr. Beazely has provided me the
opportunity to pursue my core pharmacy course (PHARM 610) under his guidance.
My sincere thanks to Mrs. Jan Venne, for her assistance with NMR spectroscopy study
and Dr. Richard Smith for providing detail understanding of mass spectrometry studies. I
would also like to thank Dr. Jonathan Blay for providing me with the opportunity to be a part
of Pharmacy graduate student. Sarah Rae, the department graduate co-ordinator, I am really
very grateful for all the help she has offered during the graduate program.
I special thanks goes to Dr. Ahmad Ghavami for this constant advice and suggestion for
my project. He has been almost like my guardian in Canada. I am honoured to work with him
as a colleague and I have adopted several good qualities from him which I think are very
necessary for becoming a successful scientist. Thanks to Dr. Anthony Krismanich for his
valuable suggestions while writing my thesis. I feel his suggestions will be beneficial to me
throughout my lifetime. My thanks to Dr. Nan Chen, for offering help to settle down in Canada
very quickly. His suggestions for my project and NMR studies have been very valuable. Dr.
vi
Ahmed Desoky has been a very nice lab mate as we have shared the same lab room during
graduate studies. I am honoured to work with him. Dr. Glenn Abbott, a previous member in the
Dmitrienko Lab, he was really very funny. With his quick wit he always had the office
environment very funny. We have enjoyed watching soccer world cup game during the lab
hours.
I enjoyed having the company of Mrs. Valerie Goodfellow, Dr. Geneviève Labbé and
Ms. Carol Tanner. I enjoyed one of my best times in Canada when Valerie invited the lab
members to her cottage farm on the lake side in Peterborough. Peizhi Qiu, or “Honeybee” as I
call him started the graduate program with me. He is very honest, kind and has an amazing
personality. Dr. Jarrod Johnson is a great researcher. He has motivated me to be efficient,
perfect and patient.
My special thanks to all graduate students of the Department of Chemistry and the
School of Pharmacy. I would like to thank my TA instructors, Josephine Orso Simon, Dr. Eric
Schneider, Brett Barrett, Barbara Coulston and Dr. Cynthia Richards, for their support when I
worked as a Teaching Assistant.
Very lovely thanks to my dear friend Purva Karia, who has always helped me to choose
the right thing. Her constant support during my undergraduate and graduate studies has been
tremendous. I would like to thank my friends with whom I traveled to Canada: Sandeep
Chaudhary, Shivam Dembla, Rupinder Ghotra, Shrinu Kushagara and Rakesh Guttikonda. A
special thanks to Vatsal Parikh, Sagar Patel, Dhairya Maheshwari and Niket Teckwani. Last
but not the least a special thanks to Vimir Dave and Vinay Dangar, my friends since childhood.
They have been more like my elder brothers to me. I am very happy to have such valuable
friends.

vii
Dedication
To the unseen force whom mankind refers as “almighty.”
For my father and mother who have shown their boundless love, care, support, trust and
guidance through their blessings.
For my sister and brother who have looked upon me as a role model.
For my grandfather who has always inspired me with his words.

viii
Table of Contents
Title page....……………………………………………………………………............... i
Author's Declaration……………………………………………………………….......... ii
Abstract………………………………………………………………………………...... iii
Acknowledgements…………………………………………………………………….... v
Dedication………………………………………………………………………….......... vii
Table of Contents………………………………………………………………………... viii
List of Figures………………………………………………………………………….... x
List of Tables…………………………………………………………………………..... xii
List of Schemes………………………………………………………………………...... xiii
List of Abbreviations……………………………………………………………………. xiv
Chapter 1 Introduction………………………………………………………………... 1
1.1 Antibiotics…………………………………………………………………………… 1
1.2 -Lactam Antibiotics………………………………………………………………... 3
1.2.1 Cephalosporins…………………………………………………………………. 4
1.3 Bacterial Resistance to -lactam Antibiotics………………………………………... 8
1.3.1 Resistance caused by -Lactamases………………………................................. 10
1.4 Pharmacokinetic Parameters………………………………………………………… 16
1.5 Chromatography…………………………………………………………………...... 19
1.6 Internal Standard…………………………………………………...………………... 22
1.7 Isotope Labeling…………………………………………………………………….. 23
1.8 Hypothesis and Rationale…………………………………………………………… 24
Chapter 2 Literature Review………………………………………………………….. 27
2.1 Previous work done to Synthesize Core Deuterated Cephalosporins……………….. 27
2.2 Objectives…………………………………………………………………………… 31
Chapter 3 Results and Discussion…………………………………………………...... 32
3.1 Objective 1: Hydrogen/Deuterium (H/D) Exchange at C2 of Cephalosporins……... 32
3.1.1 H/D Exchange at C2 of Cephalosporin Core using Benzene/D2O…………….. 35
3.1.2 H/D Exchange at C2 of Cephalosporin Core using iPrONa/iPrOD…………..... 38
3.1.3 H/D Exchange at C2 of Cephalosporin Core using DMSO/Methanol………… 41

ix
3.2 Objective 2: Deuteration at C3ʹ of Cephalosporin Core…………………………….. 47
3.3 Objective 3: Synthesis of Core Trideuterated Cephalosporin Analogue……………. 52
3.4 Modified Route for the Synthesis of Core Trideuterated Cephalosporin Analogue… 56
Chapter 4 Concluding Statements…………………………………………………….. 59
4.1 Summary and Conclusion…………………………………………………………… 59
4.2 Future Work…………………………………………………………………………. 60
Chapter 5 Experimental Procedure…………………………………………………... 62
5.1 General Procedures………………………………………………..………………… 62
5.2 Experimental Procedures……………………………………………………………. 63
Appendices……………………………………………………………………………..... 95
Appendix A: Permission issued by Nature Publishing Group Regarding Figure 1……... 95
Appendix B: NMR Spectrum and Mass Spectrum Images of Certain Compounds…….. 97
References……………………………………………………………………………….. 131
x
List of Figures
Figure 1.1: Examples from several classes of antibiotics used clinically………………. 1
Figure 1.2: Timeline for decade of antibiotic evolution………………..………………. 2
Figure 1.3: Representative structures from each class of -lactam antibiotics.……..…. 3
Figure 1.4: Timeline for evolution of penicillin derivatives……………………………. 4
Figure 1.5: Cephalosporin C and 7-Aminocephalosporanic acid (7-ACA) respectively. 5
Figure 1.6: Examples of first generation cephalosporins………………………………. 5
Figure 1.7: Examples of second generation cephalosporins……………………………. 6
Figure 1.8: Examples of third generation cephalosporins……………...………………. 6
Figure 1.9: Examples of fourth generation cephalosporins…………………………….. 7
Figure 1.10: Examples of fifth generation cephalosporins……………………………... 7
Figure 1.11: Cross linkage by D-Ala-D-Ala transpeptidase ……………………………. 9
Figure 1.12: Conformational similarity between penicillin and D-Ala-D-Ala………….. 9
Figure 1.13: Proposed mechanism for the hydrolysis of -lactam antibiotics…………. 11
Figure 1.14: Clinically used and under clinical trial serine-β-lactamase inhibitors.…… 12
Figure 1.15: The combination therapy of cephalosporin and avibactam ………………. 13
Figure 1.16: The combination therapy of ceftolozane and tazobactam………………… 14
Figure 1.17: Novel cephalosporin derivatives as -lactamase inhibitors...…………….. 14
Figure 1.18: Mechanism for inhibition of Metallo -lactamases (MBLs)...…………… 15
Figure 1.19: Chemical structure of meropenem…………………………..……………. 16
Figure 1.20: General cephalosporin structure.………………………………………….. 24
Figure 1.21: Commercially available deuterated cephalosporin analogues……………. 24
Figure 1.22: Proposed sites of deuteration in the core cephalosporin structure………... 26
Figure 1.22: Proposed sites for deuteration in the core cephalosporin structure……….. 32
Figure 3.1: 1H NMR spectrum of 3.4............................................................................... 97
Figure 3.2: 1H NMR spectrum of 3.8…………………………………........................... 98
Figure 3.3: 1H NMR spectrum of 3.10 (entry 1)………………………………………... 99
Figure 3.4: 1H NMR spectrum of 3.10 (entry 2)………………………………………... 100
Figure 3.5: 1H NMR spectrum of 3.10 (entry 3)…………………………….………….. 101
Figure 3.6: 1H NMR spectrum of 3.17 (entry 1)………………………………………... 102

xi
Figure 3.7: 1H NMR spectrum of 3.17 (entry 2)………………………………………... 103
Figure 3.8: 1H NMR spectrum of 3.17 (entry 3)………………………………………... 104
Figure 3.9: 1H NMR spectrum of 3.17 (entry 4)………………………………………... 105
Figure 3.10[A]: 1H NMR spectrum of 3.15 ………………………………..................... 106
Figure 3.10[B]: 13C NMR spectrum of 3.15 ……………………………….................... 107
Figure 3.10[C]: COSY spectrum of 3.15 …………………………………..................... 108
Figure 3.10[D]: HMBC spectrum of 3.15 ………………………………….................... 109
Figure 3.11[A]: 1H NMR spectrum of 3.16 ………………………………..................... 110
Figure 3.11B]: 13C NMR spectrum of 3.16 ………………………………..................... 111
Figure 3.11[C]: COSY spectrum of 3.16 …………………………………..................... 112
Figure 3.11[D]: HMBC spectrum of 3.16 ………………………………….................... 113
Figure 3.12: 1H NMR spectrum of 3.23………………………………........................... 114
Figure 3.13[A]: 1H NMR spectrum of 3.24…………………………………………….. 115
Figure 3.13[B]: 13C NMR spectrum of 3.24 ……………………………….................... 116
Figure 3.14: 1H NMR spectrum of 3.27………………………………........................... 117
Figure 3.15[A]: 1H NMR spectrum of 3.28…………………………………………….. 118
Figure 3.15[B]: 13C NMR spectrum of 3.28 ……………………………….................... 119
Figure 3.16: 1H NMR spectrum of 3.17 (Scheme 3.17)……………............................... 120
Figure 3.17[A]: 1H NMR spectrum of 3.44 in DMSO-d6 (Scheme 3.17)….................... 121
Figure 3.17[B]: 1H NMR spectrum of 3.44 in Acetone-d6 (Scheme 3.17)……………... 122
Figure 3.18[A]: 1H NMR spectrum of 3.46………………………….............................. 123
Figure 3.18[B]: 13C NMR spectrum of 3.46 …………………………………………… 124
Figure 3.19[A]: 1H NMR spectrum of 3.40 (Scheme 3.18)………….............................. 125
Figure 3.19[B]: Mass spectrum of 3.40 (Scheme 3.18)………….................................... 126
Figure 3.20[A]: 1H NMR spectrum of 3.44 in benzene-d6 and a drop of DMSO-d6
(Scheme 3.18)…………………………………………………………. 127
Figure 3.20[B]: 1H NMR spectrum of 3.44 in Acetone-d6 (Scheme 3.18)……………... 128
Figure 3.20[C]: 13C NMR spectrum of 3.44 (Scheme 3.18)............................................. 129
Figure 3.20[D]: Mass spectrum of 3.44 (Scheme 3.18)................................................... 130
xii
List of Tables
Table 1.1: IC50 values for some C3ʹ thiobenzoyl cephalosporin derivatives showing
inhibitory activity against and MBLs in vitro…………………….……………………...
15
Table 3.1: Reaction conditions for H/D exchange to obtain 3.4………………………... 36
Table 3.2: Reaction conditions for H/D exchange to obtain 3.10………………………. 40
Table 3.3: Modification in experimental conditions for the H/D exchange using
DMSO/Methanol………………………………………………………………………...
44
xiii
List of Schemes
Scheme 2.1: The mechanism proposed by Cooper and co-workers for the deuteration
of penicillin V……………………………………………………………………………
27
Scheme 2.2: Synthesis of C-2 deuterated penicillin V sulfoxide……………………….. 28
Scheme 2.3: H/D exchange on C2 of cephalosporins by Taiichirou and co-workers…... 28
Scheme 2.4: H/D exchange on C2 of cephalosporins by Richter and co-workers……… 29
Scheme 2.5: Tritium (3H/T) incorporation at C7 of cephalosporin analogue…………... 30
Scheme 3.1: Proposed mechanism for base-catalyzed H/D exchange at C2…………… 33
Scheme 3.2: Proposed mechanism for base-catalyzed H/D exchange at C3ʹ…………… 33
Scheme 3.3: Isomerization observed for cephalosporin esters in presence of base….…. 34
Scheme 3.4: A mixture of 2 and 3 cephalosporin isomers oxidized to corresponding
3 sulfoxide and its subsequent reduction back to sulfide………………………………
34
Scheme 3.5: H/D exchange using benzene and D2O……………………………………. 36
Scheme 3.6: H/D exchange on 3.7 cephalosporin derivative…………………………… 38
Scheme 3.7: H/D exchange on vitamin D3 by Iwasaki et al……………………………. 39
Scheme 3.8: Base catalyzed H/D exchange at C2 using iPrONa/iPrOD……………….. 40
Scheme 3.9: The H/D exchange on C2 of 3.16 using DMSO/methanol under various
conditions………………………………………………………………………………...
42
Scheme 3.10: Proposed mechanism for H/D exchange on C2 of compound 3.16 using
DMSO and methanol…………………………………………………………………….
43
Scheme 3.11: The functional group inter-conversion reaction on C3ʹ hydroxyl
cephalosporin…………………………………………………………………………….
47
Scheme 3.12: Reduction of C3ʹ aldehyde using sodium borohydride………………….. 48
Scheme 3.13: Reduction of benzaldehyde to 3.23 and 3.24…………………………….. 48
Scheme 3.14: Successful attempt of deuteration at C3ʹ of cephalosporin analogues…… 50
Scheme 3.15: Re-oxidation of C3ʹ deuterated hydroxyl derivative to aldehyde 3.28…... 52
Scheme 3.16: Proposed plan for synthesis of trideuterated core cephalosporin………... 53
Scheme 3.17: The synthesis of core trideuterated cephalosporin analogue…………….. 55
Scheme 3.18: Modified route of synthesis for core trideuterated cephalosporin
analogue………………………………………………………………………………….
57

xiv
List of Abbreviations
6-APA 6-aminopenicillanic acid DMSO Dimethyl sulfoxide
7-ACA 7-aminocephalosporanic acid DCM Dichloromethane
Å Ångstrom DMI Dimethyl imidazolidinone
A. baumannii Acinetobacter baumannii EtOAc Ethyl acetate
Ac Acetyl EDTA Ethylenediamine tetra
aceticacid
ACN Acetonitrile EtOH Ethanol
AcCl Acetyl chloride ESI Electrospray ionization
Ala Alanine E. coli Escherichia coli
AMU Atomic mass unit ESBL extend-spectrum β-lactamase
ADME Absorption, distribution,
metabolism and excretion
gem geminal
AUC Area under curve Glu glutamic acid
BBB Blood brain barrier Gln glutamine
BSA Bis-[trimethylsilyl]acetamide GC/MS Gas chromatography/ Mass
spectrometry
BAIB [bis(acetoxy)iodo] benzene g gram
conc. Concentrated HMBC Hetero nuclear multiple bond
correlation
calcd. Calculated H/D Hydrogen/Deuterium
COSY Correlation Spectroscopy HPLC High performance liquid
chromatography
DAP diaminopimelic acid HMQC Heteronuclear single
quantum coherence
spectroscopy
DMAP N,N-4-dimethylamino
pyridine
IC50 Concentration of inhibitor
that reduce the max rate of
enzymatic activity by 50%
DMF N,N-dimethylformamide IV Intravenous

xv
IS Internal standard NAM N-acetylmuramic acid
i-PrOD i-Propanol-D N.R. no reaction
i-PrONa Sodium i-propoxide NDM New Delhi metallo -
lactamase
KPC Klebsiella
pneumoniae carbapenemase
N.A. Not available
LMW Low molecule weight NMR nuclear magnetic resonance
LRMS Low-resolution mass
spectrum
OXA Oxacillinase -lactamase
LC/MS Liquid chromatography/
Mass spectrometry
PBP Penicillin binding protein
MIC Minimum inhibitory
concentration
P.aeruginosa Pseudomonas aeruginosa
MRSA Methicillin-resistant
Staphylococcus aureus
PMB para-methoxybenzyl
min Minute ppm parts per million (spectral)
M Molar PK Pharmacokinetics
MBL Metallo β-lactamase PD Pharmacodynamics
Me Methyl Ph Phenyl
μ Micro r.t. room temperature
m Milli S.pneumoniae Staphylococcus pneumoniae
MeOD Methanol-D S. aureus Staphylococcus aureus
m-CPBA meta-Chloroperoxybenzoic
acid
S. paratyphi Staphylococcus paratyphi
MeOH Methanol SBL serine β-lactamase
MS Mass spectrometry temp. temperature
MeONa Sodium methoxide TEMPO 2,2,6,6-
Tetramethylpiperidinyloxyl
NAG N-acetylglucosamine THF Tetrahydrofuran

xvi
TMS Tetramethylsilane VRE vancomycin-resistant
Enterococcus spp
UPLC Ultra performance liquid
chromatrography
VRSA Vancomycin-resistant S.
aureus
VIM Verona integron-encoded
metallo -lactamase
1
Chapter 1
Introduction
1.1 Antibiotics
The discovery of antibiotics is believed to be one of the most important
accomplishments in the history of drug development.1 Antibiotics have been derived from
natural products or synthesized chemically. There has been enormous development in the field
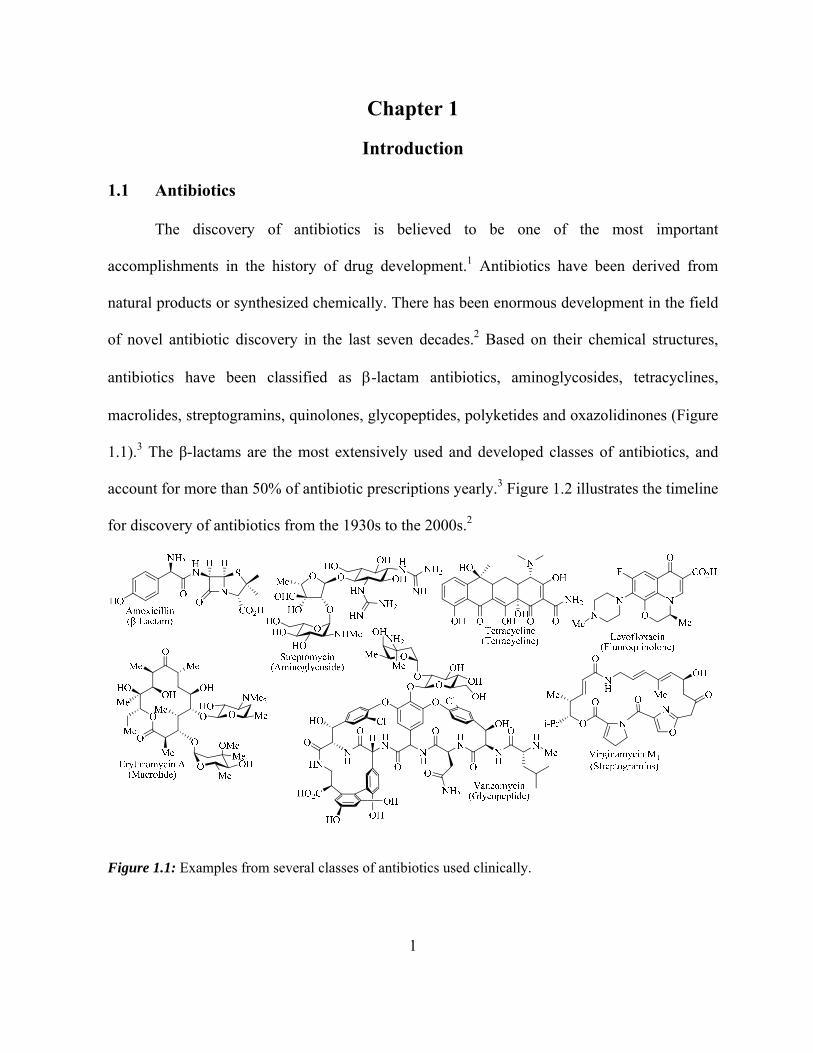
of novel antibiotic discovery in the last seven decades.2 Based on their chemical structures,
antibiotics have been classified as -lactam antibiotics, aminoglycosides, tetracyclines,
macrolides, streptogramins, quinolones, glycopeptides, polyketides and oxazolidinones (Figure
1.1).3 The β-lactams are the most extensively used and developed classes of antibiotics, and
account for more than 50% of antibiotic prescriptions yearly.3 Figure 1.2 illustrates the timeline
for discovery of antibiotics from the 1930s to the 2000s.2
Figure 1.1: Examples from several classes of antibiotics used clinically.

2
Since their discovery, antibiotics they have been used extensively to cure bacterial
infections.4 It is believed that the overuse of antibiotics is the prime cause of bacterial
resistance.5 However, it has also been documented that bacterial resistance to antibiotics has
existed from before the time of their discovery and is an ancient phenomenon.6 Gram-negative
pathogens are the most effective at developing resistance through various mechanisms which
are listed in section 1.3.7
Figure 1.2: The major clinically used antibiotics and type of resistant species are shown in the
timeline for decade of antibiotic evolution. Green represents synthetic derivatives; black are
natural product origin derivatives; major antibiotic classes are shown in bold; red represents the
technology used for their discovery; Gram-positive bacteria are shown in purple and Gram-
negative bacteria in pink.2

3
1.2 -Lactam Antibiotics
-Lactam antibiotics have been the most used antibiotics since the time of their
introduction into clinical practice.8 All -lactam antibiotics contain a four membered ring
cyclic amide (lactam) ring. Depending on their structural difference in the non-lactam part, -
lactam antibiotics have been classified into five major classes namely: penicillins,
cephalosporins, carbapenems, penems and monobactams. Figure 1.3 represents the
representative structures of each class in which the rings shown in red color represent the
lactam ring.1,9
Figure 1.3: Representative structures from each class of β-lactam antibiotics.1
The penicillins were the first β-lactam antibiotics to be discovered in 1928. Alexander
Fleming observed that a strain of Penicillium mould produced an agent which had antibacterial
activity and which was later named penicillin.10–12 Numerous attempts to discover novel
penicillin derivatives were carried out by several research groups around the globe in the late
1940s.13 Florey and Chain from the University of Oxford demonstrated the safe and effective
use of penicillins via subcutaneous injection.14 Only two natural sources of penicillins were
known from the time of their discovery, namely penicillin G and penicillin V.15 However, after
the enzymatic hydrolysis of the C6 amido side chain of penicillins was achieved, numerous
semi-synthetic derivatives were synthesized from 6-aminopenicillanic acid (6-APA) by
acylation (Figure 1.4).13 Natural penicillin G and V showed activity only against Gram-positive

4
bacteria. Later, semi-synthetic derivatives such as ampicillin and amoxicillin were found to be
effective against both Gram-positive and Gram-negative bacteria.16 Semi-synthetic penicillins
have been used widely since World War-II to treat bacterial infections.17 To this day, the semi-
synthetic penicillin amoxicillin, manufactured by GlaxoSmithKline, is still used widely to treat
bacterial infections.18 Novel penicillin agents are still being developed; however, the main
topic of interest in this study is the cephalosporin class of -lactam antibiotics, which are
discussed briefly in next section.
Figure 1.4: Timeline for evolution of penicillin derivatives.13
1.2.1 Cephalosporins
In 1945, many people suffered from an epidemic of typhoid fever caused by the Gram-
negative bacterium Salmonella enterica.16 Giuseppe Brotzu, an Italian pharmacologist, isolated
a fungus from sewage water.19 This fungus was later named Cephalosporium acremonium. The
fungal broth was found to inhibit certain Gram-negative bacteria including Salmonella typhi, S.
paratyphi B, Yersinia pestis, Brucella melitensis, Vibrio cholera and Staphylococcus
aureus.16,10 Three different compounds were isolated from Cephalosporium acremonium,
namely cephalosporin P, cephalosporin N (penicillin N) and cephalosporin C. Cephalosporin C
showed significantly higher antibacterial activity amongst them. Its structure was determined

5
(Figure 1.5) by E. P Abraham and G. C. F Newton in 1961.19,20 All cephalosporins incorporate
a β-lactam ring that is fused with a dihydrothiazine ring. Cephalosporin C on acidic treatment
gave 7-amino cephalosporonic acid (7-ACA), which is a key precursor for the synthesis of
major cephalosporins available in today’s market (Figure 1.5).20
Figure 1.5: Cephalosporin C and 7-Aminocephalosporanic acid (7-ACA) respectively.
Due to the potent antibacterial activity of cephalosporins, researchers began to study
and develop derivatives with a cephalosporin core structure. Cephalosporins have been
classified into five generations.21 The classification is based on their activity towards Gram-
positive and Gram-negative bacteria. However, the basis of their classification is often
imprecise.
The first generation cephalosporins (Figure 1.6) show activities against most of the
Gram-positive bacteria including methicillin-susceptible Staphylococci and non-enterococcal
Streptococci. After the emergence of methicillin-resistant Staphylococcus aureus (MRSA)
pathogens the first generation cephalosporins were used as first-line agents.
Figure 1.6: Examples of first generation cephalosporins.
6
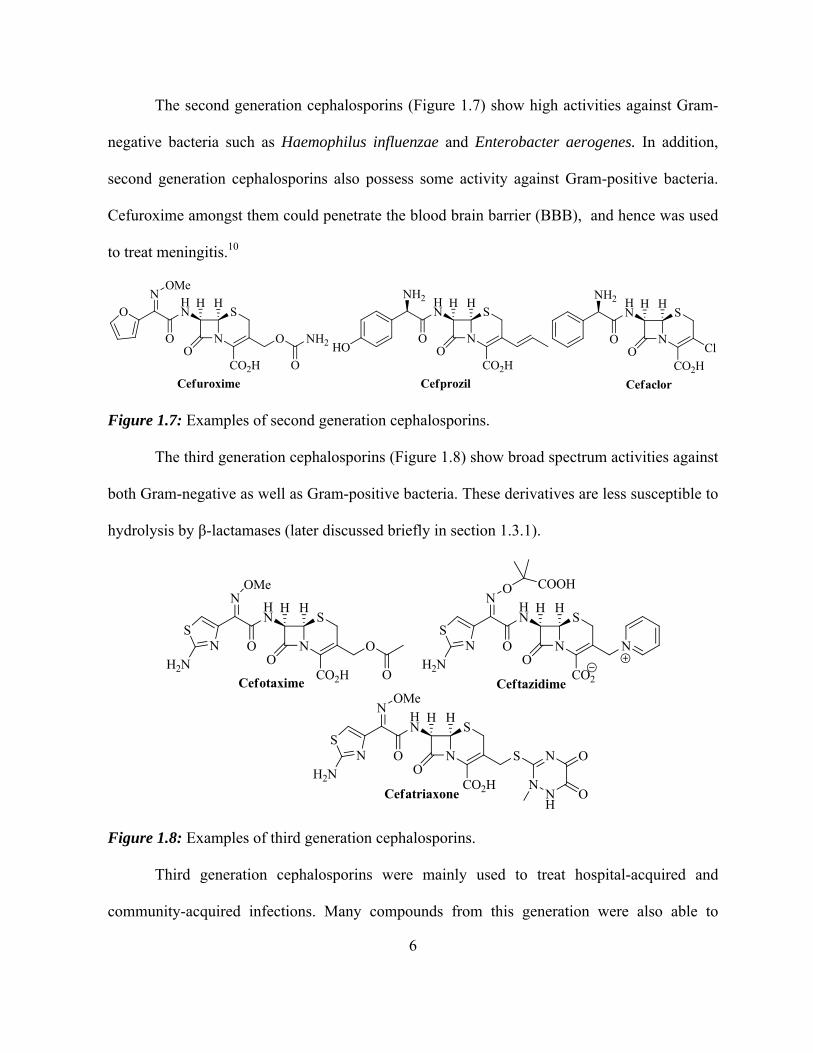
The second generation cephalosporins (Figure 1.7) show high activities against Gram-
negative bacteria such as Haemophilus influenzae and Enterobacter aerogenes. In addition,
second generation cephalosporins also possess some activity against Gram-positive bacteria.
Cefuroxime amongst them could penetrate the blood brain barrier (BBB), and hence was used
to treat meningitis.10
2
2
2
2
2
2
Figure 1.7: Examples of second generation cephalosporins.
The third generation cephalosporins (Figure 1.8) show broad spectrum activities against
both Gram-negative as well as Gram-positive bacteria. These derivatives are less susceptible to
hydrolysis by β-lactamases (later discussed briefly in section 1.3.1).
22
22
22
Figure 1.8: Examples of third generation cephalosporins.
Third generation cephalosporins were mainly used to treat hospital-acquired and
community-acquired infections. Many compounds from this generation were also able to

7
penetrate the blood brain barrier (BBB) and were used to treat meningitis caused by
Pneumococci, Meningococci, Haemophilus influenza, Klebsiella and penicillin-resistant
Neisseria gonorrhoeae.10
The fourth generation cephalosporins (Figure 1.9) demonstrated extended spectrum
activities against Enterobacter spp., Citrobacter freundii and Serratia marcescens.
Unfortunately, these drugs were not effective against Gram-positive bacteria which were
already resistant to other β-lactams.10
Figure 1.9: Examples of fourth generation cephalosporins.
The fifth generation cephalosporins (Figure 1.10) were developed in the last decade and
are still under research and clinical trials. These antibiotics show activity against multidrug-
resistant S. aureus, such as: MRSA, VISA (Vancomycin-intermediate S. aureus), Vancomycin-
resistant S. aureus and certain S. pneumoniae.22
Figure 1.10: Examples of fifth generation cephalosporins.

8
1.3 Bacterial Resistance to -lactam Antibiotics
Widespread use and abuse of antibacterial compounds has led to antibiotic-resistant
strains of Gram-positive and Gram-negative bacteria.8,23 Bacterial resistance against -lactam
antibiotics occurs via four major pathways which include: production of β-lactamase enzymes,
that cleave the key -lactam ring of the -lactam antibiotics hydrolytically, and which are the
focus of this research; modification of the antibiotic target site, in which the binding target site
of antibiotics penicillin binding protein (PBP) is altered in most resistant bacterial pathogens;
expression of efflux pumps, which decrease the efflux for the drugs through the cell surface;
and decreased expression of outer membrane proteins (OMPs), that are responsible for uptake
of the drugs into the bacterial cell.24,25 Among these resistance mechanisms, the production of
-lactamase enzymes is one of the major pathways and is discussed briefly in section 1.3.1. In
order to explore the solution to bacterial resistance process; firstly, it is important to have an
insight into the mode of action for -lactam antibiotics.
The bacterial cell wall is made up of a tightly cross-linked peptidoglycan layer that
maintains the cell rigidity, shape and protects it against environmental threats.26 The bacterial
cell comprises of a cross-linked cell wall, which is made by cell wall transpeptidase enzymes.27
They are commonly known as penicillin binding proteins (PBPs).28 These enzymes are
responsible for the formation of the basic repeating units of N-acetyl glucosamine (NAG) and
N-acetyl muramic acid (NAM) cross linked with each other by D-alanine-D-alanine amide
bonds.26 Figure 1.11 represents the cross linking process in E. coli and S. aureus cell walls.29–31
9
OOHO
NHAc
OH
OO
ONHAc
OH
L-AlaO
-D-GluL,L-DAP
D-Ala
D-Ala
CO2
OOHO
NHAc
OH
OO O
NHAc
OH
Ala-LO
-D-Glu
L,L-DAP
D-Ala
D-Ala
[NAG-NAM]n
NH2
CO2
D-Ala-D-AlaTranspeptidases
A. E.Coli PeptidoglycanCross linkage
OOHO
NHAc
OH
OO
ONHAc
OH
L-AlaO
-D-GlxM-DAP
D-Ala
D-Ala
OOHO
NHAc
OH
OO O
OH
Ala-LO
-D-Glx
M-DAP
D-Ala
D-Ala
[NAG-NAM]n
D-Ala-D-AlaTranspeptidases
B. S. aureus PeptidoglycanCross linkage
NH2
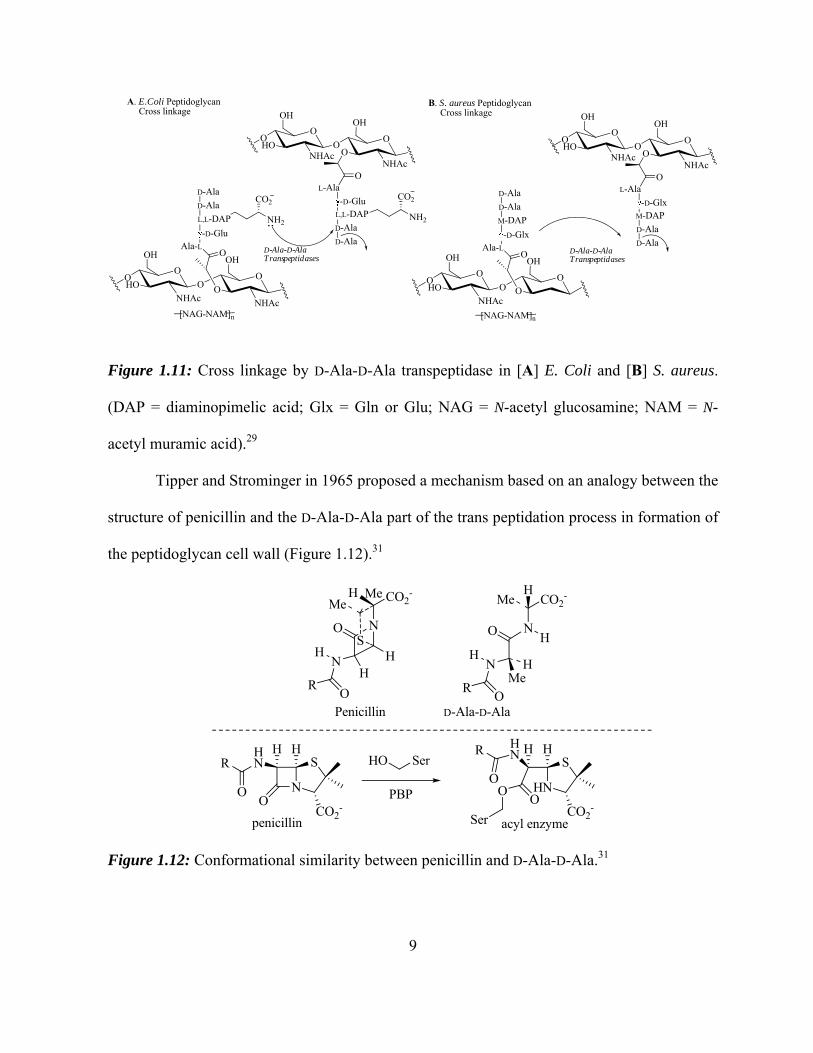
Figure 1.11: Cross linkage by D-Ala-D-Ala transpeptidase in [A] E. Coli and [B] S. aureus.
(DAP = diaminopimelic acid; Glx = Gln or Glu; NAG = N-acetyl glucosamine; NAM = N-
acetyl muramic acid).29
Tipper and Strominger in 1965 proposed a mechanism based on an analogy between the
structure of penicillin and the D-Ala-D-Ala part of the trans peptidation process in formation of
the peptidoglycan cell wall (Figure 1.12).31
2-
2-
D D
2-
2-
Figure 1.12: Conformational similarity between penicillin and D-Ala-D-Ala.31

10
As a result of the structural similarity of the β-lactam and of the D-Ala-D-Ala, the
antibiotic forms a covalent penicilloyl-enzyme complex with the transpeptidase that is
responsible for cell wall cross binding. The acyl enzyme complex hydrolyses very slowly (or
not at all) to generate the free transpeptidase enzyme (Figure 1.12). The acyl enzyme linkage
leads to the inhibition of bacterial transpeptidase enzyme which prevents completion of cell
wall synthesis. Since the rigid cell wall is incomplete, the cell contents are subjected to severe
osmotic pressure and eventually burst.26
1.3.1 Resistance caused by -lactamases
The existence of resistance to -lactam antibiotics was first observed by Abraham and
Chain in 1940, who reported that some strains of Staphylococci developed resistance against
benzylpenicillin.32 With the clinical use of synthetic cephalosporins, resistance shown by
Gram-positive organisms was decreased.21 Gram-negative organisms, on the other hand started
to develop resistance against almost all β-lactam antibiotics.33
Approximately 900 β-lactamase enzymes have been reported.34 In the early stage of β-
lactam antibiotic development, β-lactamases were divided into classes depending on their
response to antisera, their substrate profile and on the plasmid-mediated enzymes that can be
distinguished by isoelectric focusing. β-Lactamases were grouped into two classes,35 namely
Cephalosporinases (rapidly hydrolyze cephalosporins) and Penicillinases (rapidly hydrolyze
penicillins).
Presently, the classification of β-lactamase is based on amino acid residues in the active
site. The β-lactamases were classified into two major groups depending on their amino acid
residues found in the active site, namely serine -lactamase (SBLs) and metallo -lactamase
11
(MBLs). A proposed mechanism for the hydrolysis of -lactam antibiotics by serine -
lactamases (SBLs) and metallo -lactamases (MBLs) is shown in figure 1.13.
N
SH H
RHN
OCO2
-
Zn2++
Asp
HisCys
Zn1++
OHHis
His
His
AsnNH2
O
HN
SH H
RHN
CO2-
HOO
penicilloic acid
N
SH H
RHN
OCO2
-NH
NHoxyanion
hole
OH
acyl enzyme
N
SH H
RHN
CO2-NH
NH
O
O
N
SH H
RHN
CO2-
Zn2++
Asp
HisCys
Zn1++
His
His
His
NH2
OOH
AsnO
tetrahedralintermediate
tetrahedralintermediate
H2O
H2O
fast
Ser Ser HN
SH H
CO2-
RHN
OO
Ser
Serine ß-Lactamases(SBLs) Class A, C and D
Metallo-ß-Lactamases(MBLs) Class B
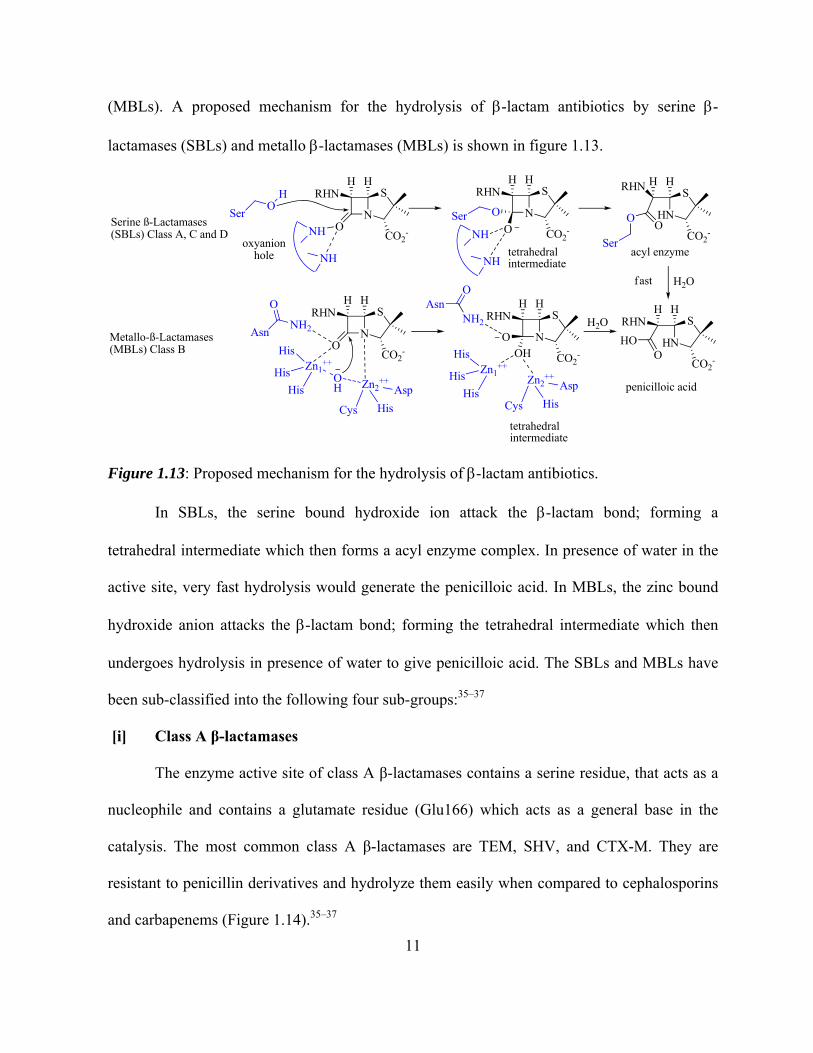
Figure 1.13: Proposed mechanism for the hydrolysis of -lactam antibiotics.
In SBLs, the serine bound hydroxide ion attack the -lactam bond; forming a
tetrahedral intermediate which then forms a acyl enzyme complex. In presence of water in the
active site, very fast hydrolysis would generate the penicilloic acid. In MBLs, the zinc bound
hydroxide anion attacks the -lactam bond; forming the tetrahedral intermediate which then
undergoes hydrolysis in presence of water to give penicilloic acid. The SBLs and MBLs have
been sub-classified into the following four sub-groups:35–37
[i] Class A β-lactamases
The enzyme active site of class A β-lactamases contains a serine residue, that acts as a
nucleophile and contains a glutamate residue (Glu166) which acts as a general base in the
catalysis. The most common class A β-lactamases are TEM, SHV, and CTX-M. They are
resistant to penicillin derivatives and hydrolyze them easily when compared to cephalosporins
and carbapenems (Figure 1.14).35–37
12
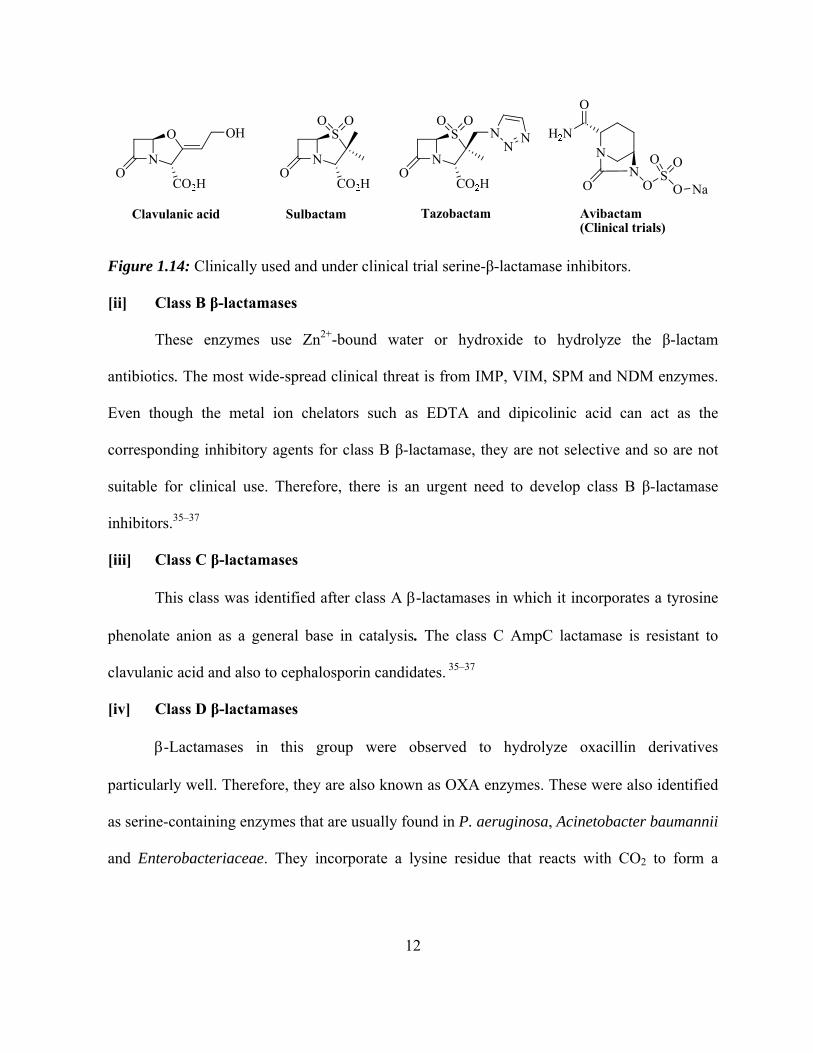
Figure 1.14: Clinically used and under clinical trial serine-β-lactamase inhibitors.
[ii] Class B β-lactamases
These enzymes use Zn2+-bound water or hydroxide to hydrolyze the β-lactam
antibiotics. The most wide-spread clinical threat is from IMP, VIM, SPM and NDM enzymes.
Even though the metal ion chelators such as EDTA and dipicolinic acid can act as the
corresponding inhibitory agents for class B β-lactamase, they are not selective and so are not
suitable for clinical use. Therefore, there is an urgent need to develop class B β-lactamase
inhibitors.35–37
[iii] Class C β-lactamases
This class was identified after class A -lactamases in which it incorporates a tyrosine
phenolate anion as a general base in catalysis. The class C AmpC lactamase is resistant to
clavulanic acid and also to cephalosporin candidates. 35–37
[iv] Class D β-lactamases
-Lactamases in this group were observed to hydrolyze oxacillin derivatives
particularly well. Therefore, they are also known as OXA enzymes. These were also identified
as serine-containing enzymes that are usually found in P. aeruginosa, Acinetobacter baumannii
and Enterobacteriaceae. They incorporate a lysine residue that reacts with CO2 to form a

13
carbamate anion that acts as a general base during hydrolysis. Class D β-lactamases are
inhibited by certain cephalosporin derivatives.35–37
As a result of the resistance of bacteria against -lactam antibiotics, combination
therapies involving the antibiotic and a β-lactamase inhibitor were developed to fight the
resistance caused by ESBLs.10 For instance, the combination therapy of ceftaroline fosamil
(prodrug) and avibactam (non β-lactam β-lactamase inhibitor) was studied for phase-II clinical
trials (Figure 1.15).22 Cefotaxime and ceftazidime from the fourth generation of cephalosporin
were studied for the combination therapy with β-lactamase inhibitors and prominent increase in
antibiotic activity was observed against the resistant strains.10
Figure 1.15: The combination therapy of cephalosporin and avibactam.22
Cephalosporin antibiotics are still being researched and novel cephalosporin derivatives
are being developed that have the potential ability to act both as -lactam antibiotics as well as
-lactamase inhibitors. For example, Cubist Pharmaceuticals is currently developing
ceftolozane – tazobactam combination under phase-III clinical trials, which has improved
activity versus P. aeruginosa and other Gram-negative bacteria (Figure 1.16).38 Other
pharmaceutical companies have also reported exploring new cephalosporin analogues
including Shionogi & Co. Ltd., that is developing a cephalosporin called S-649266.39 It has
been reported that this cephalosporin is 10-10,000 times less susceptible to carbapenemase than
14
ceftazidime, cefepime and meropenem.39 Unfortunately, the structure of S-649266 has yet to be
disclosed.
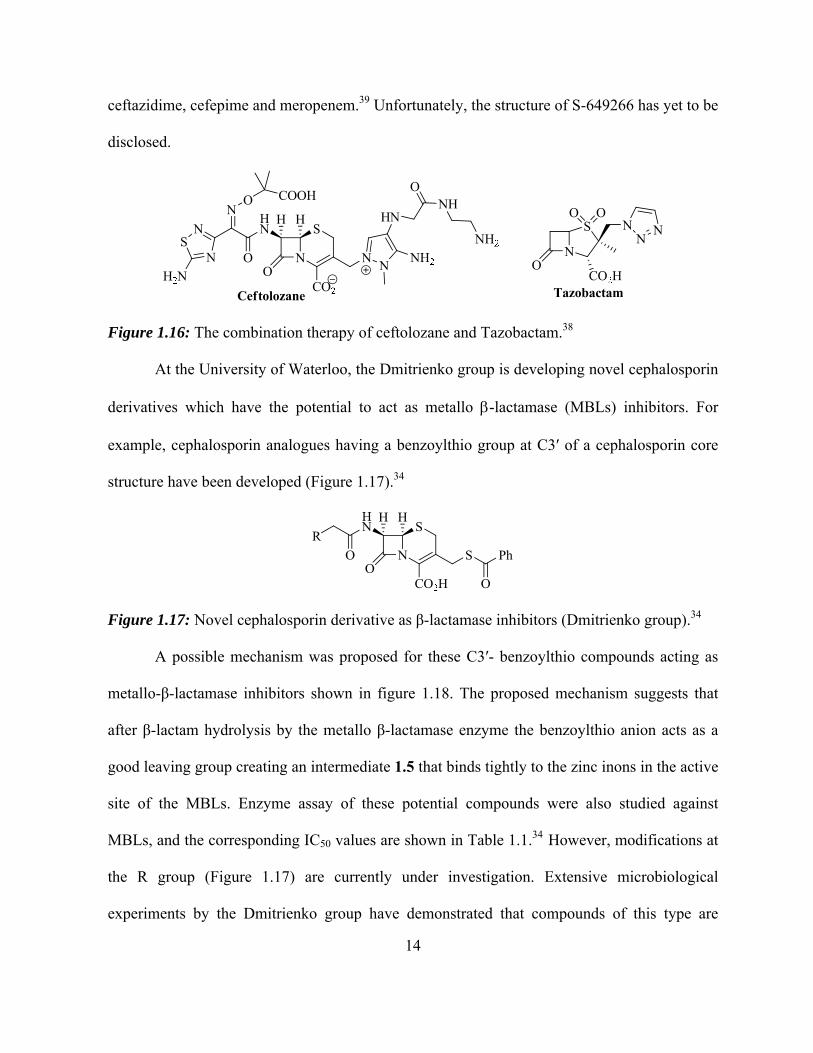
Figure 1.16: The combination therapy of ceftolozane and Tazobactam.38
At the University of Waterloo, the Dmitrienko group is developing novel cephalosporin
derivatives which have the potential to act as metallo -lactamase (MBLs) inhibitors. For
example, cephalosporin analogues having a benzoylthio group at C3ʹ of a cephalosporin core
structure have been developed (Figure 1.17).34
Figure 1.17: Novel cephalosporin derivative as β-lactamase inhibitors (Dmitrienko group).34
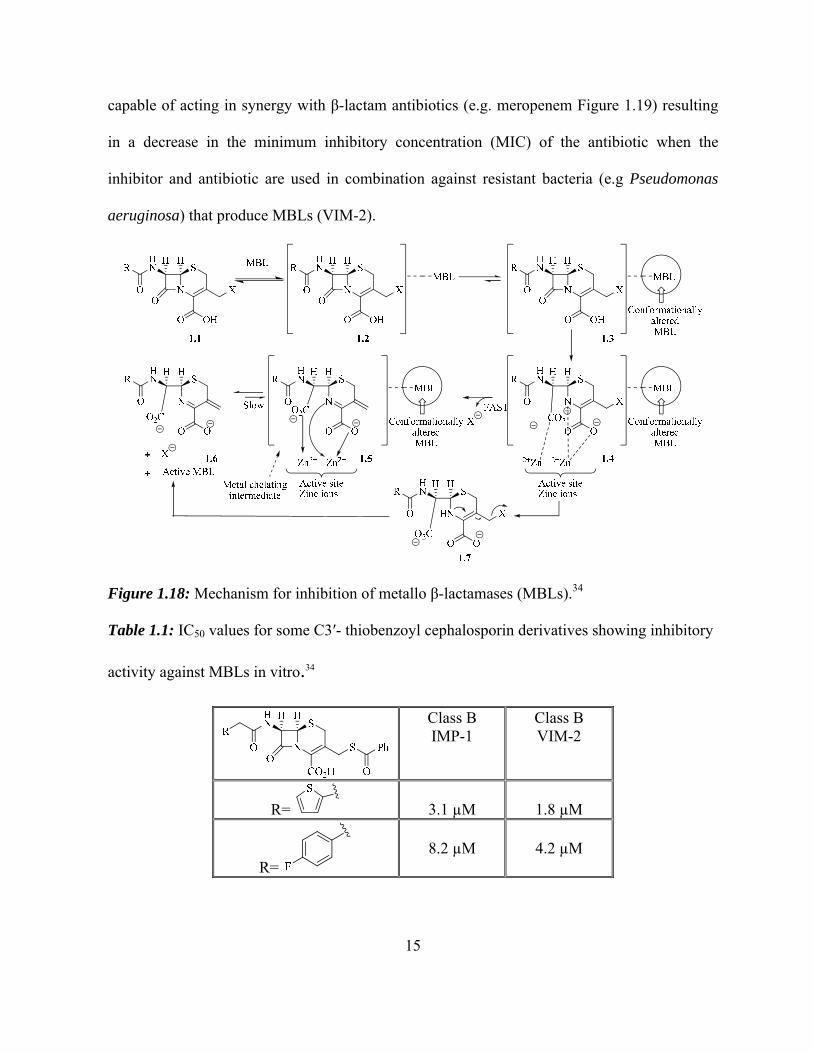
A possible mechanism was proposed for these C3ʹ- benzoylthio compounds acting as
metallo-β-lactamase inhibitors shown in figure 1.18. The proposed mechanism suggests that
after β-lactam hydrolysis by the metallo β-lactamase enzyme the benzoylthio anion acts as a
good leaving group creating an intermediate 1.5 that binds tightly to the zinc inons in the active
site of the MBLs. Enzyme assay of these potential compounds were also studied against
MBLs, and the corresponding IC50 values are shown in Table 1.1.34 However, modifications at
the R group (Figure 1.17) are currently under investigation. Extensive microbiological
experiments by the Dmitrienko group have demonstrated that compounds of this type are
15
capable of acting in synergy with β-lactam antibiotics (e.g. meropenem Figure 1.19) resulting
in a decrease in the minimum inhibitory concentration (MIC) of the antibiotic when the
inhibitor and antibiotic are used in combination against resistant bacteria (e.g Pseudomonas
aeruginosa) that produce MBLs (VIM-2).
Figure 1.18: Mechanism for inhibition of metallo β-lactamases (MBLs).34
Table 1.1: IC50 values for some C3ʹ- thiobenzoyl cephalosporin derivatives showing inhibitory
activity against MBLs in vitro.34
Class B IMP-1
Class B VIM-2
R=
3.1 µM
1.8 µM
R=
8.2 µM
4.2 µM
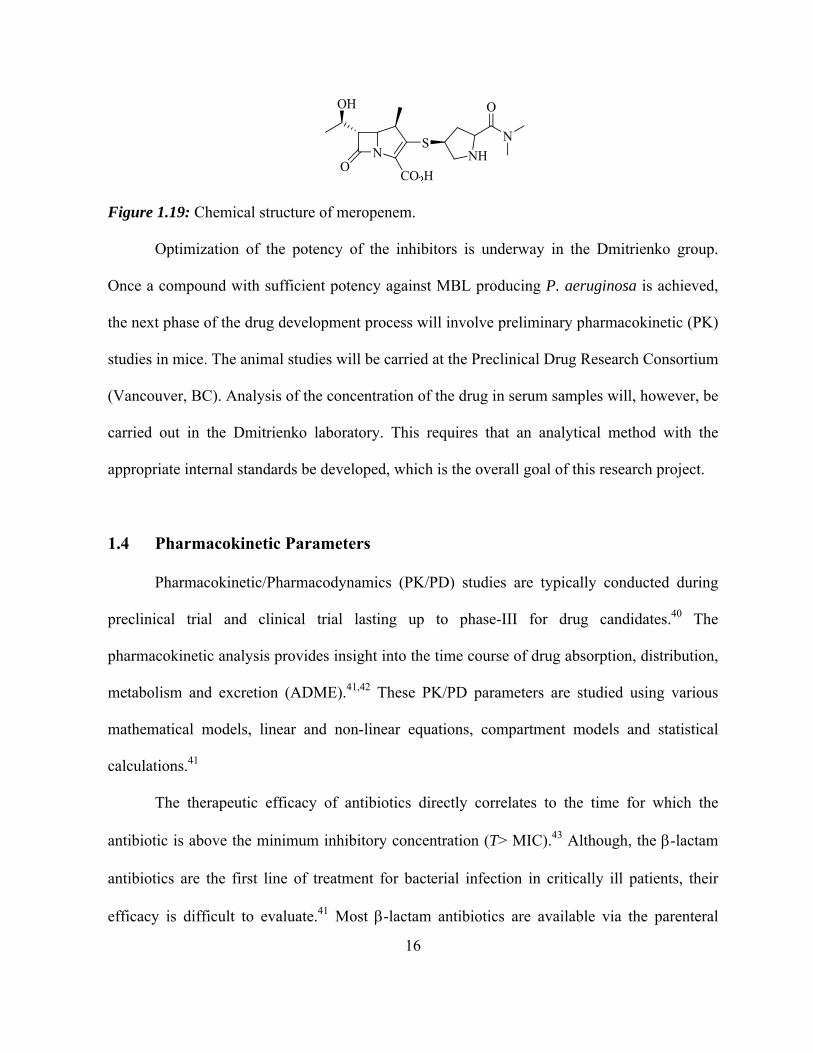
16
Figure 1.19: Chemical structure of meropenem.
Optimization of the potency of the inhibitors is underway in the Dmitrienko group.
Once a compound with sufficient potency against MBL producing P. aeruginosa is achieved,
the next phase of the drug development process will involve preliminary pharmacokinetic (PK)
studies in mice. The animal studies will be carried at the Preclinical Drug Research Consortium
(Vancouver, BC). Analysis of the concentration of the drug in serum samples will, however, be
carried out in the Dmitrienko laboratory. This requires that an analytical method with the
appropriate internal standards be developed, which is the overall goal of this research project.
1.4 Pharmacokinetic Parameters
Pharmacokinetic/Pharmacodynamics (PK/PD) studies are typically conducted during
preclinical trial and clinical trial lasting up to phase-III for drug candidates.40 The
pharmacokinetic analysis provides insight into the time course of drug absorption, distribution,
metabolism and excretion (ADME).41,42 These PK/PD parameters are studied using various
mathematical models, linear and non-linear equations, compartment models and statistical
calculations.41
The therapeutic efficacy of antibiotics directly correlates to the time for which the
antibiotic is above the minimum inhibitory concentration (T> MIC).43 Although, the -lactam
antibiotics are the first line of treatment for bacterial infection in critically ill patients, their
efficacy is difficult to evaluate.41 Most -lactam antibiotics are available via the parenteral
17
route and the oral route depending on their pharmacodynamics parameters.44 The
bioavailability of -lactam antibiotics is dependent on their half-life (t1/2) and their serum
concentration.41 The pharmacokinetic behavior of these compounds is observed to follow a
linear kinetic relation, in which the rate of reaction is directly proportional to the concentration
of the drug.43
PK parameters are dependent on the type of the compartment model being considered.
In a non-compartment modeling the whole body is considered to be one system. Non-
compartment models are constructed for intravenous infusion (I.V.) of most cephalosporins
during their preclinical studies.42 The plasma drug concentration versus time profile is one of
the most important PK parameters and is determined by measuring the drug concentration in
plasma at various time intervals after dosing. A typical PK graph is constructed based on this
data. Various PK parameters are determined from this information using mathematical
formulas and statistical calculations44 such as:
Peak plasma concentration (Cmax) in which the time corresponding to maximum drug
concentration in plasma is determined. At this point of time, the rate of drug absorption
is equivalent to the rate of drug elimination.21,40,41
Time of peak concentration (tmax) which is the time at which the concentration of the
drug in plasma achieves at its peak.21,40,41
Area under curve (AUC) - The total integrated area under the plasma level versus time
profile is known as the Area under the Curve (AUC). This value is used to determine
the total amount of drug that is present in systemic circulation after dosing.21,40,41
Apparent volume of distribution - The hypothetical volume of body fluid into which the
drug is dissolved or distributed is termed as apparent volume, and a constant relation
18
between the concentration of drug in plasma and amount of drug in blood is
proportional and represented by apparent volume of distribution.21,40,41
Clearance (Cl) and Renal Clearance (ClR) - The hypothetical volume of body fluid
containing drug from which the drug is cleared completely in a specific time period is
called the clearance rate. The volume of blood or plasma completely cleared of the
unchanged form of drug by the renal route per unit time is called renal clearance.21,40,41
Half-life (t1/2) - The time period required for the concentration of drug to decrease by
one half is called the half-life.21,40,41
Determination of all the above mentioned pharmacokinetic parameters provides
information about the behaviour of all therapeutic agents. The plasma concentration
measurements are very useful to know the absorption behaviour of the drug, as well as its
distribution in the body.45 This helps to determine the therapeutic window. PK parameters are
extremely important to decide the safe dose of new drugs. A Preclinical PK study provides an
insight about the behaviour of new drugs during their clinical trial. A large number of
compounds showing good activity in vitro are rejected in their clinical trials because their PK
studies show that they do not possess adequate bioavailability of the drug or that they exhibit
various types of toxicity. Thus, a PK study helps to optimize the lead compounds and is
essential to select a new drug whose PK behaviour is within the therapeutic window.40
Most initial PK/PD studies are carried out in mice. To construct an accurate plasma
drug concentration versus time profile, blood samples are collected at intervals before and after
the dose administration of compounds which are evaluated for its PK parameters. The plasma
is centrifuged and all the biomolecules are extracted using an organic solvent.42 The organic
phase is separated and the aqueous phase is dried and analyzed through liquid chromatography-
19
tandem mass spectrometry (LC/MS) assays. The analyte sample is mixed with an internal
standard of known concentration. The concentration of analyte is measured from the relative
concentration of internal standard from its mass spectrometry analysis. For example, in a
pharmacokinetic study of an intravenous ceftolozane-tazobactam combination (single and
multiple dose), plasma samples were collected before dosing at 30, 60, 65, 75, and 90 min and
after dosing at 2, 3, 4, 6, 8, 10, 12, 16, and 24 hours.38 These samples were analyzed using
LC/MS assays and a plasma drug concentration versus time profile was generated. All of the
rest of the PK parameters are calculated from the plot of plasma drug concentration vs time
profile by using WinNonlin software.38
Accurate determination of PK parameters is very crucial in the process of drug
development.41 Over the last decades much research has been conducted to acquire higher
accuracy in these PK studies. A brief description of LC/MS and internal standards is provided
in the next few sections. To conduct accurate PK studies it was very important to use internal
standards which very closely resemble the analyte which is being tested.46 The present thesis
focuses on the development of these internal standards to conduct PK studies of a wide range
of novel cephalosporin analogues which are in the pipeline of drug development.
1.5 Chromatography
Various forms of chromatography are used widely for purification and separation of
small organic molecules which are structurally closely related.47 Chromatographic techniques
work on similar principles, in which the compounds in a mixture are distributed between a
stationary phase and mobile phase.48 The mobile phase runs in one direction and the
compounds are separated as a result of their different rates of travel, which are determined by
20
their relative affinities for the mobile phase and the stationary phase.47 Amongst all the
chromatographic techniques high performance liquid chromatography (HPLC) is one of the
most widely used methods. A more recent variant, ultra-performance liquid chromatography
(UPLC) is now being widely used to conduct major analytical studies in the field of drug
discovery.49
Mass spectrometry is an analytical technique in which small organic molecules are
analyzed based on the mass-charge ratio.50 Over the last few decades there has been an
enormous development in this field. In the 1980s, John Fenn (Nobel laureate) discovered the
electrospray ionization method which changed the whole scenario of mass spectrometric
studies. Since then, mass spectrometers have been widely used in clinical laboratories and the
pharmaceutical industry as a reliable analytical technique for compound identification and
quantitative studies.50 In order to perform mass spectrometric studies the sample to be analyzed
is first prepared by mixing with suitable solvents. The compound is ionized using various
ionization techniques. After the ionization of the compound, the ions are separated based on
their mass to charge ratio. These ions further pass through the analyzer and are then detected
with the help of a computer device. A typical MS graph shows the plot of mass to charge ratio
(m/z) to its relative abundance.47
Hyphenated analytical techniques were discovered which showed more specificity and
robustness. Gas Chromatography Mass spectrometry (GC-MS) and Liquid Chromatography
Mass spectrometry (LC-MS) are widely used today for high throughput screening, selectivity,
specificity and quantitative analysis of small organic molecules. Apart from simple organic
molecules, MS is also used widely to analyze peptides, carbohydrates and a wide range of
natural products. Owing to the nature of these compounds, especially biological species, which

21
cannot be vaporized for ionization in the gas phase, LC-MS is much preferred method for their
analysis compared to GC-MS.50 LC-MS plays an important role in the accurate determination
of drug concentration in plasma.
In LC-MS the basic working principles of both the above mentioned analytical
techniques are combined. The mixture of closely related compounds is injected on the
chromatographic column.49 Here the analyte is run through with a compatible mixture of
mobile phase and separated. The solution is directly passed to the ionization chamber of the
MS. After ionization, the ions are detected which helps to quantitate the analyte and analyse it.
LC-MS has a wide application for the determination of PK parameters as mentioned earlier.
After the collection of plasma samples during their pre-clinical and clinical studies, the analyte
is extracted from plasma. In order to determine the drug concentration present at that particular
time, a known amount of internal standard, which very closely resembles the analyte is mixed
with it.51 Most commonly, a known amount of isotopically-labelled compound is mixed with
an unknown amount of unlabelled analyte of interest. This mixture is loaded on the
chromatographic column. Since, the internal standard and analyte only differ isotopically, they
cannot be separated. Once the peak for the analyte is observed, the mobile phase is introduced
into the ionization chamber with the help of an automatic sample injector. The ions travel in a
vacuum tube depending on their charge to mass ratio. Further, they are analyzed and reported
in the mass spectrum.47 Quantification of unlabelled compound can be carried out using the
concentration of labelled compound. In this manner the plasma drug concentration is
determined.52
22
1.6 Internal Standard
An internal standard is used during the quantification of analyte using mass
spectrometry studies. HPLC and MS/MS (LC-MS/MS) are the most common and extensively
used analytical techniques for measuring concentration of drug present in plasma, blood and
urine samples. The internal standard is used as a reference substance to quantify the
concentration of unknown analyte in these assays.53,54 The choice of an internal standard is
very important for accurate quantitative analysis of an analyte. The choice of internal standard
(IS) is based on several considerations: IS can never be found in the untreated sample, which
would result in inaccuracy; IS should always be available in pure form and should be
extremely stable throughout the reaction; ideally IS should be identical to the analyte and
differs only in isotopic composition or structurally similar to the analyte and is eluted after the
analyte.54
The best internal standard is an isotope labelled analogue of the analyte, which needs to
be quantified. The isotope-labeled internal standards have the same chemical structure as the
analyte, only differing in their atomic mass unit (amu) due to highly enriched presence of a
particular isotope. HPLC and MS/MS techniques are respectively used for purification of the
analyte and detection of its mass for quantitative analysis.55 Owing to structural identity, the
analyte and its internal standard show the same retention time on the UPLC.53 However, these
are differentiated by their mass analysis giving selective, specific and quantitative results.54 A
known concentration of the isotope labeled compound is mixed in the plasma extract and the
ratio of labeled to unlabeled analyte is determined using MS assay.56 It is very important to
check the purity of internal standard prior to its use.56 Certainly, a little contamination in the
23
internal standard would lead to error in all the following results and hence would compromise
the accuracy, reproducibility and robustness of the method.
1.7 Isotope Labeling
Synthesis of a stable isotope-labeled compound for its use as internal standard can be
time consuming and costly. Stable isotopes of hydrogen (2H/D), carbon (13C), nitrogen (15N),
and oxygen (17O, 18O) are commonly available. However, the most cheap and easy method for
synthesis of internal standard is by deuterium isotope labeling. Deuterium (D or 2H) is a stable
isotope of hydrogen having 1 atomic mass unit (amu) more compared to protium (H), which is
the most abundant isotope of hydrogen. Deuterium has been used extensively for various
studies, which includes metabolic studies for organic compounds and analytical assay using
LC-MS/MS and GC-MS/MS techniques.57 It is also useful for studies related to mechanism
elucidation involved in enzymatic or chemical reactions.58
Costand timeeffective reactions involving H/D (Hydrogen/Deuterium) exchange
have been extensively studied.59 Various approaches can be used that include pH-dependent
exchange, exchange without the addition of acidic or basic deuterium source (these reactions
might be applied for deuteration of the cephalosporin core), homogeneous metal catalysis,
heterogeneous metal catalysis (e.g. palladium/carbon, platinum/carbon, rhodium/carbon and
nickel/carbon). However, homogeneous and heterogeneous metal catalysis reactions are not
applicable to label the core cephalosporin structure due to its instability under such conditions,
since the β-lactam ring can hydrolyze at high temperature and pressure.59
24
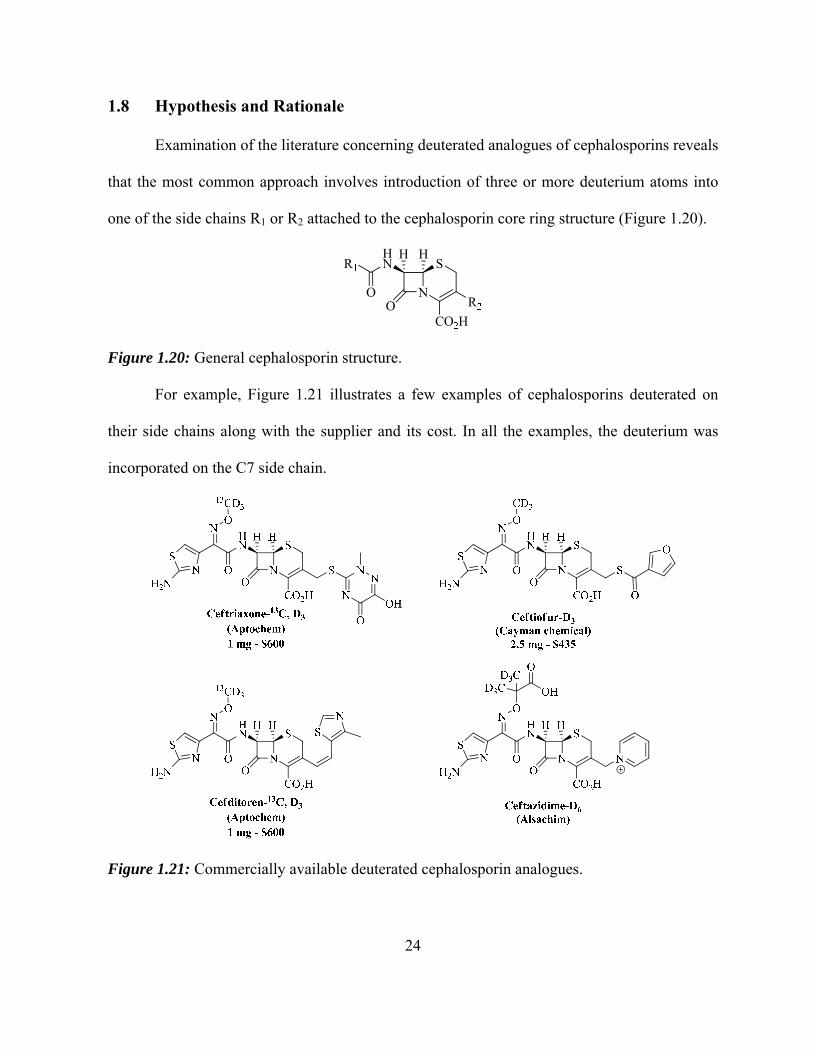
1.8 Hypothesis and Rationale
Examination of the literature concerning deuterated analogues of cephalosporins reveals
that the most common approach involves introduction of three or more deuterium atoms into
one of the side chains R1 or R2 attached to the cephalosporin core ring structure (Figure 1.20).
Figure 1.20: General cephalosporin structure.
For example, Figure 1.21 illustrates a few examples of cephalosporins deuterated on
their side chains along with the supplier and its cost. In all the examples, the deuterium was
incorporated on the C7 side chain.
Figure 1.21: Commercially available deuterated cephalosporin analogues.

25
The presence of an alkoxyimino group on the C7 side chain of cephalosporin is found
to be beneficial for binding to PBPs. One strategy to develop novel cephalosporin antibiotics
involves modification of the alkoxyimino group. According to the current pharmaceutical and
academic research, internal standards used for the assay of these cephalosporins are
compounds in which this alkoxyimino side chain is isotopically labeled. This necessitates the
task of preparing a standard for each promising candidate, labelled by a different synthetic
approach.
Since it was proposed that in the present study, it would be possible to carry out
preliminary PK/PD studies on several cephalosporin-type MBLs inhibitor, placing the
deuterium isotopes in new side chains R1 and R2 (Figure 1.20) might require the development
of several isotope labeling strategies. It occurred to this group that the PK/PD studies could be
facilitated by having access to a cephalosporin intermediate in which the deuterium isotopes
were incorporated in the core ring structure, since R1 and R2 could then be varied without the
need to design new methods for deuteration. It was also thought that such a deuterated
cephalosporin core structure could be of value to others who are involved in the discovery and
development of novel cephalosporins with improved antibacterial potency.
Thus, this thesis aims to synthesize a core cephalosporin analogue multiply deuterated
at two sites. The availability of a multiply deuterated core cephalosporin compound will
facilitate screening of cephalosporin derivatives modified on the C7 and C3 side chains. In
order to avoid peak overlap during quantitative analysis using mass spectrometry, a minimum
of three deuteriums should be present in the internal standard. The analyte may include
hydrogen, carbon, nitrogen, sulphur, oxygen, halogens etc. As a consequence of the existence
of minor isotopes at natural abundance, molecules show not only molecular ion peak [M]+ but
26
also [M+1]+ and [M+2]+ peaks. [M+1]+ peak arise from the 1.11% 13C, 0.38% 15N, 0.78% 33S,
0.016% 2H and to a lesser extent 0.04% 17O present among the sample molecules. The [M+2]+
peak arises from the 4.4% 34S, 0.2% 18O and 32.5% 37Cl (if present). In order to avoid any peak
interference between the analyte and internal standard peaks, having three or more atomic mass
units higher in internal standard compared to the analyte will be observed distinct from that of
the analyte. The peaks for internal standard can then be differentiated from the analyte and
hence an accurate concentration of the drug at that time point can be measured without
interference from the analyte MS peaks due to its isotopes at natural abundance.
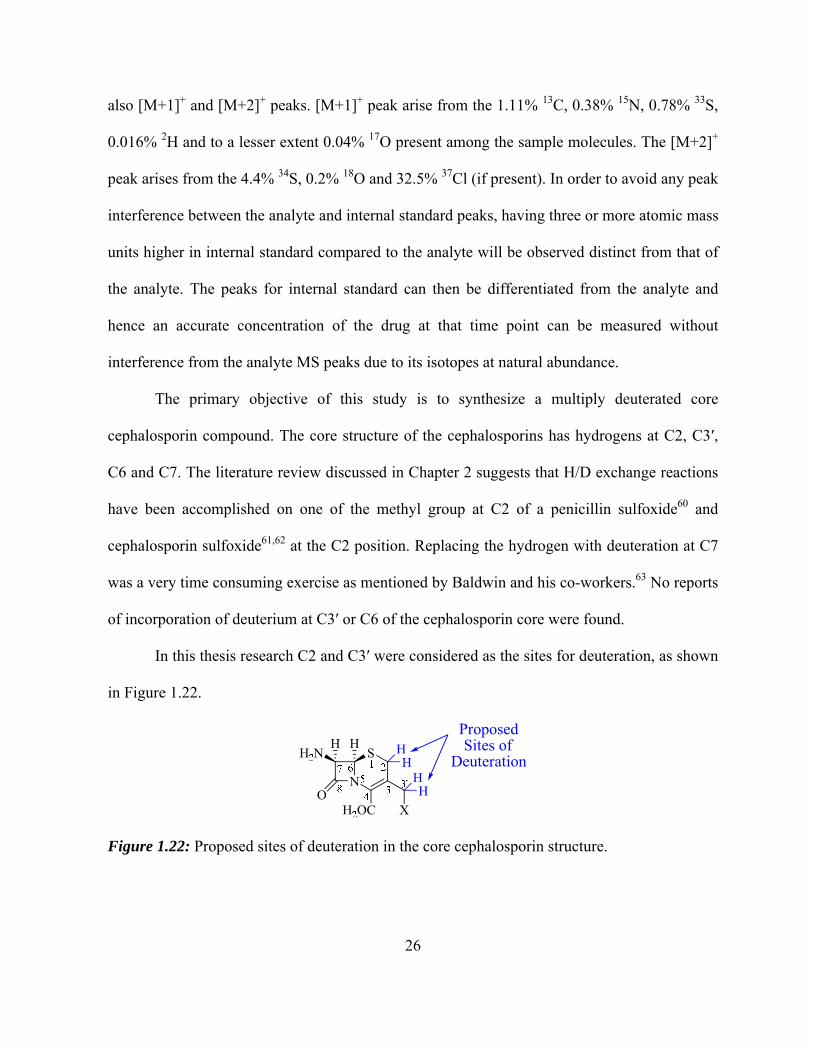
The primary objective of this study is to synthesize a multiply deuterated core
cephalosporin compound. The core structure of the cephalosporins has hydrogens at C2, C3ʹ,
C6 and C7. The literature review discussed in Chapter 2 suggests that H/D exchange reactions
have been accomplished on one of the methyl group at C2 of a penicillin sulfoxide60 and
cephalosporin sulfoxide61,62 at the C2 position. Replacing the hydrogen with deuteration at C7
was a very time consuming exercise as mentioned by Baldwin and his co-workers.63 No reports
of incorporation of deuterium at C3ʹ or C6 of the cephalosporin core were found.
In this thesis research C2 and C3ʹ were considered as the sites for deuteration, as shown
in Figure 1.22.
Figure 1.22: Proposed sites of deuteration in the core cephalosporin structure.

27
Chapter 2
Literature Review
2.1 Previous work done to Synthesize Core Deuterated Cephalosporins
Cooper and co-workers, while studying the penicillin sulfoxide-sulfenic acid
equilibrium, studies carried out deuterium incorporation at the methyl group of a penicillin
sulfoxide by refluxing the sulfoxide of penicillin V in a mixture of benzene and D2O. This
reaction involves a β-elimination reaction to produce the sulfenic acid/alkene, and then
deuterium exchange to generate the O-deuterated sulfenic acid. This then undergoes reversal of
the elimination reaction as shown in Scheme 2.1.60
Scheme 2.1: The mechanism proposed by Cooper and co-workers for the deuteration of
penicillin V sulfoxide.60
Scheme 2.2 illustrates the reaction conditions mentioned for performing H/D exchange.
Benzene acts as a solvent for this reaction and D2O is the source of deuterium incorporation at
the methyl side chain. Compound 2.1 was stirred with a solution of benzene and D2O at 80 C
for 24 hours to give compound 2.2. The experimental detail related to the reaction was not

28
mentioned. However, the authors reported the recovery of penicillin sulfoxide 2.2 after the
reaction as 100% and its 1H-NMR study showed an average of one deuterium atom located
only at its -methyl group. Mass spectrometry analysis showed a mixture of 45% d0, 43% d1,
11% d2, and 1% d3 products.
X Y %
3 0 45
2 1 43
1 2 11
0 3 1
N
S
O
HN
O
O
CO2H
H HO
N
S
O
HN
O
O CHxDy
CO2H
H HO
Benzene.D2O
Reflux24 h
2.1 2.2
Scheme 2.2: Synthesis of C-2 deuterated penicillin V sulfoxide.60
Taiichirou and his co-workers in 1981, were the first researchers to perform H/D
exchange at the C2 position of a cephalosporin core.62 However, no supporting information
was given regarding the experimental conditions and the amount/percent of deuterium present
at C2.
Scheme 2.3: H/D exchange at C2 of cephalosporins by Taiichirou and co-workers.62

29
Scheme 2.3 illustrates their reaction scheme in which compound 2.3 was oxidized to
sulfoxide 2.4 using m-CPBA. The H/D exchange was carried out by refluxing compound 2.4
with MeOD for 2 hours to give compound 2.5. This was then reduced back to the sulfide 2.6
using acetyl chloride in the presence of potassium iodide and DMF as solvent.
Later, Richter and his co-workers in 1990 performed a similar H/D exchange using
DMSO-d6 and methanol-d4.61 The experiment was performed to study the 2-3 isomerization
of a cephalosporin ester. When a cephalosporin ester (prodrug) is administered by an IV
infusion route, it undergoes 2-3 isomerization due to the presence of base in blood plasma.
The researcher aimed to study the kinetic rate constants for the isomerization process.
However, to our interest they carried out H/D exchange on C2 of a core cephalosporin
analogue. The experimental procedure was not mentioned in detail. Their NMR studies show
presence of 70% deuterium at C2 of the cephalosporin core.61
Scheme 2.4: H/D exchange on C2 of cephalosporins by Richter and co-workers.61
Scheme 2.4 illustrates their reaction scheme in which compound 2.7 was oxidized to
sulfoxide 2.8 using m-CPBA. The H/D exchange was carried out by heating compound 2.8
30
with methanol-d4 and DMSO-d6 at 50 C for 90 minutes. Then the solvent was evaporated
under reduced pressure and fresh methanol-d4 was added and the reaction was repeated for 90
minutes to give compound 2.9. The authors reported 70% of deuterium incorporation at C2
according to NMR studies. Compound 2.9 was reduced back to the sulfide 2.10 using acetyl
chloride in the presence of sodium iodide and DMF as solvent.
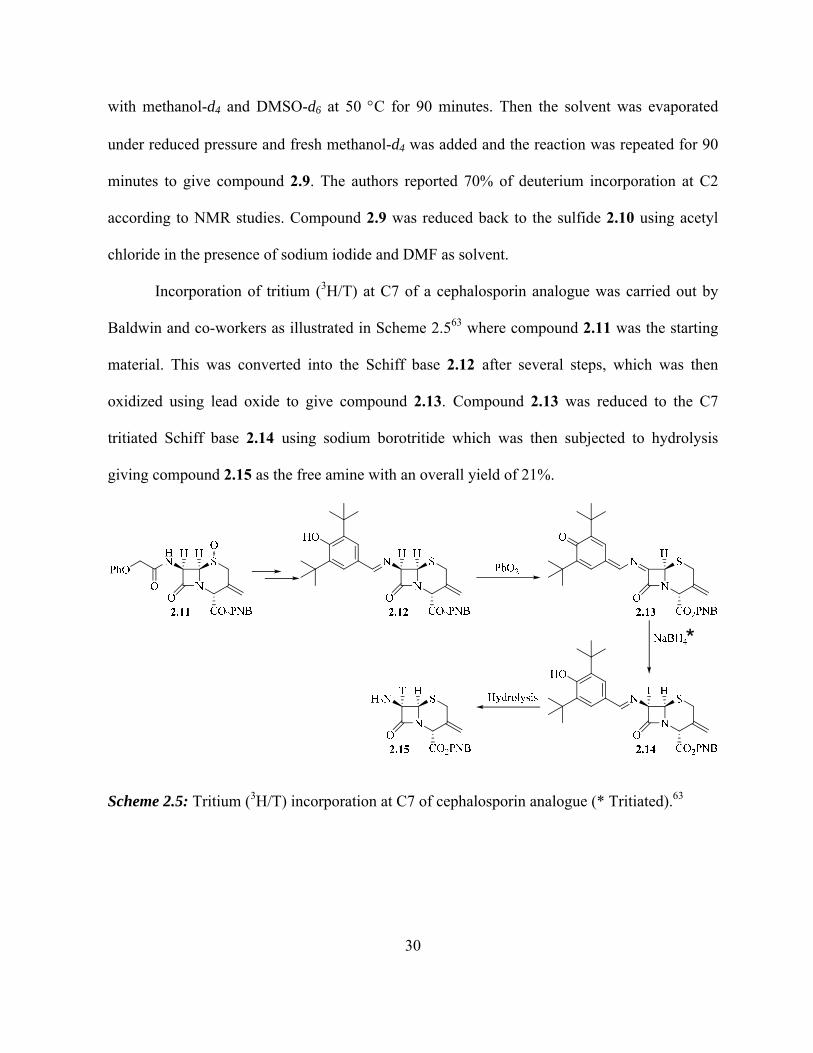
Incorporation of tritium (3H/T) at C7 of a cephalosporin analogue was carried out by
Baldwin and co-workers as illustrated in Scheme 2.563 where compound 2.11 was the starting
material. This was converted into the Schiff base 2.12 after several steps, which was then
oxidized using lead oxide to give compound 2.13. Compound 2.13 was reduced to the C7
tritiated Schiff base 2.14 using sodium borotritide which was then subjected to hydrolysis
giving compound 2.15 as the free amine with an overall yield of 21%.
Scheme 2.5: Tritium (3H/T) incorporation at C7 of cephalosporin analogue (* Tritiated).63

31
2.2 Objectives
As mentioned previously in section 1.8, deuteration at C2 and C3ʹ was proposed to be
carried out to synthesize the desired multiply deuterated analogue as shown in Figure 1.22.
Therefore the primary objectives assigned for the present thesis were as follows:
1. To perform H/D exchange at C2 of the core cephalosporin system using various
approaches.
2. To incorporate deuterium at C3ʹ of the core cephalosporin system using various
approaches.
3. After the completion of objective 1 and 2, both the strategies would be combined on
one molecule to synthesize a core trideuterated cephalosporin analogue.
The deuterated core structure could then be used to synthesize isotopically labeled
versions of cephalosporin derivatives. The synthesized internal standards might be used in
future to determine the PK parameters for cephalosporins using HPLC and MS/MS assay.

32
Chapter 3
Results and Discussion
The main goal of this project is to synthesize a core-trideuterated cephalosporin. The
core deuterated cephalosporin can be used to synthesize various internal standards for
compounds of interest with modified C3ʹ and C7 side chains (Figure 1.22)
Figure 1.22: Proposed sites of deuteration in the core cephalosporin structure.
Due to the increase in antibiotic resistance, more research is being conducted to develop
novel cephalosporins acting as -lactamase inhibitors and as antibiotics. It is challenging to
synthesize internal standards for each new modification on the side chains of cephalosporins.
Hence, this project will be useful to synthesize internal standards for a wide range of novel
cephalosporin compounds with modification on their side chains using the core trideuterated
cephalosporin compound. The objectives set for this project are to perform H/D exchange on
C2 and deuterium incorporation at C3ʹ using various approaches and then to combine the two
methods to produce a trideuterated cephalosporin core compound.
3.1 Objective 1: Hydrogen/Deuterium (H/D) Exchange at C2 of Cephalosporins
Our initial thoughts on the H/D exchange were based on the potential acidity of the
hydrogens at C2 and C3’. Since the hydrogens at C2 and C3ʹ of the cephalosporin system are
to the -unsaturated ester, they are expected to be weakly acidic and might potentially

33
undergo de-protonation to form a conjugated dienolate which upon re-protonation by a weak
deuterated protic acid would result in deuterium incorporation. A potential mechanism for
deuteration at C2 and C3ʹ is proposed. Scheme 3.1 illustrates that the H/D exchange on C2
initiated with the non-deuterated base, deprotonating at C2 followed by deuteration using
deuterated protic acid. This exchange is proposed to continue until it reaches an equilibrium
stage. Scheme 3.2 represents the similar proposed mechanism of deuteration at C3ʹ.
Scheme 3.1: Proposed mechanism for base-catalyzed H/D exchange at C2.
Scheme 3.2: Proposed mechanism for base-catalyzed H/D exchange at C3ʹ.
In cephalosporin esters, base catalyzed dienolate formation will compete with an
isomerization reaction yielding a mixture of 2 and 3 isomers as shown in Scheme 3.3.64 It

34
has been documented that the 2 isomer shows no biological activity and is the unwanted
isomer.
Scheme 3.3: Isomerization observed for cephalosporin esters in presence of base.64
To convert the 2 isomer to the 3 isomer as shown in Scheme 3.4,65 the mixture of 2
and 3 is stirred with an oxidizing agent (e.g. m-CPBA) to yield a sulfoxide for which the 2
to 3 equilibrium is strongly favored in the direction of the 3 isomer. The sulfoxide can then
be reduced back to sulfide using PCl3.66
Scheme 3.4: A mixture of 2 and 3 cephalosporin isomers oxidized to corresponding 3
sulfoxide and its subsequent reduction back to sulfide.
Thus, if deuterium incorporation were attempted at C2, the 3 to 2 isomerization
might lead to complications. The experiments described below made use of cephalosporin
sulfoxide to deal with the 2 to 3 isomerization issue.

35
3.1.1 H/D exchange at C2 of Cephalosporin Core using Benzene/D2O
One of the concerns about base-induced H/D exchange in the -lactam antibiotic series
is the sensitivity of the -lactam ring towards nucleophilic attack. Thus, we sought out
literature precedent for H/D exchange on -lactams. As indicated in Chapter 2, Cooper and co-
workers60 had effected an exchange of one of the methyl groups of a penicillin sulfoxide by
heating in a mixture of deuterium oxide (D2O) and benzene without hydrolysis of the -lactam.
This indicated that such conditions might also be compatible with the -lactam bond of
cephalosporins. This led to experiments aimed to explore the synthesis of cephalosporin
sulfoxide in order to make the hydrogens at C2 sufficiently more acidic so that they might
undergo reversible de-protonation and deuteration in D2O under prolonged heating
conditions.60 Thus, for the initial trial to verify the experimental conditions, the C3ʹ hydroxyl
cephalosporin derivative 3.1 (obtained from Dr. Ahmad Ghavami, in this laboratory) was
esterified at C3ʹ position using 4-chlorobenzoyl chloride, DMAP, and pyridine overnight at
room temperature to give 3.2. It was believed that making an ester derivative would make the
hydrogens at C3ʹ more acidic; therefore, there was a possibility of exchanging hydrogens at C2
and C3ʹ in one step. In addition the free hydroxyl derivative 3.1 in presence of base is known to
form C3ʹ lactone with the carboxylate at C4.67 The solution of 3.2 in DCM was then oxidized
to the corresponding sulfoxide at 0 C, using m-CPBA to give 3.3.65 The H/D exchange
reactions were carried out on 3.3 under various reaction conditions to give 3.4 as summarized
in Table 3.1.
36
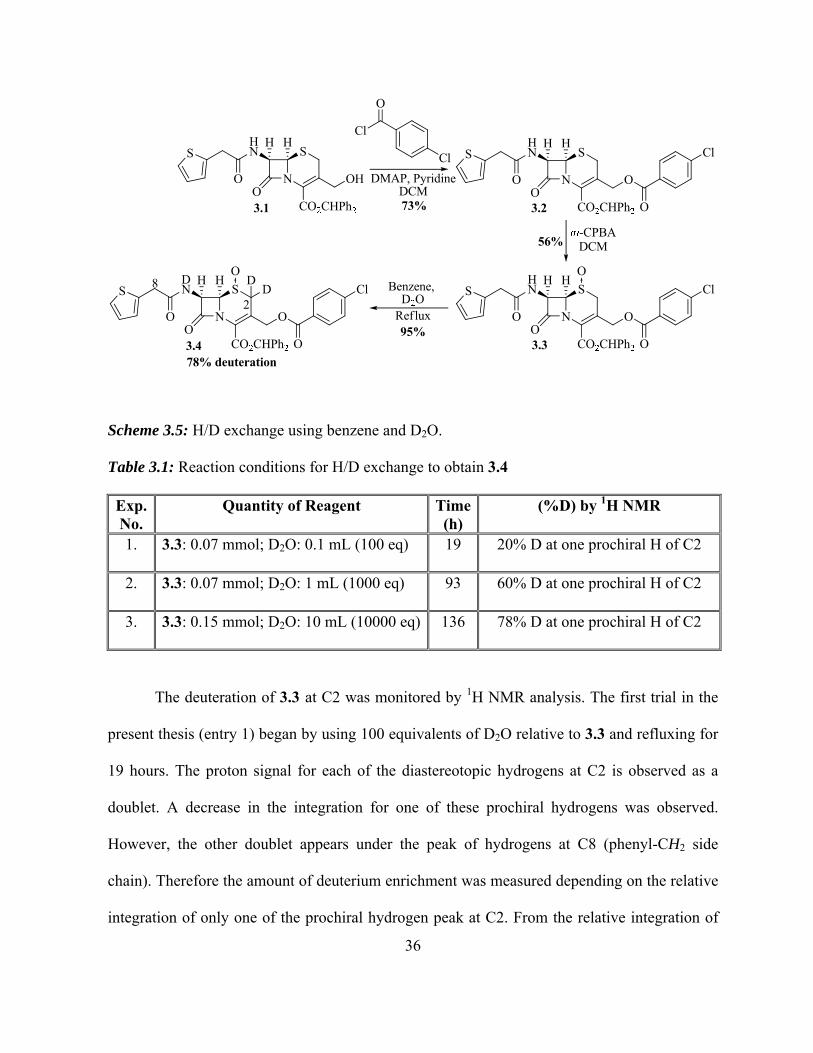
Scheme 3.5: H/D exchange using benzene and D2O.
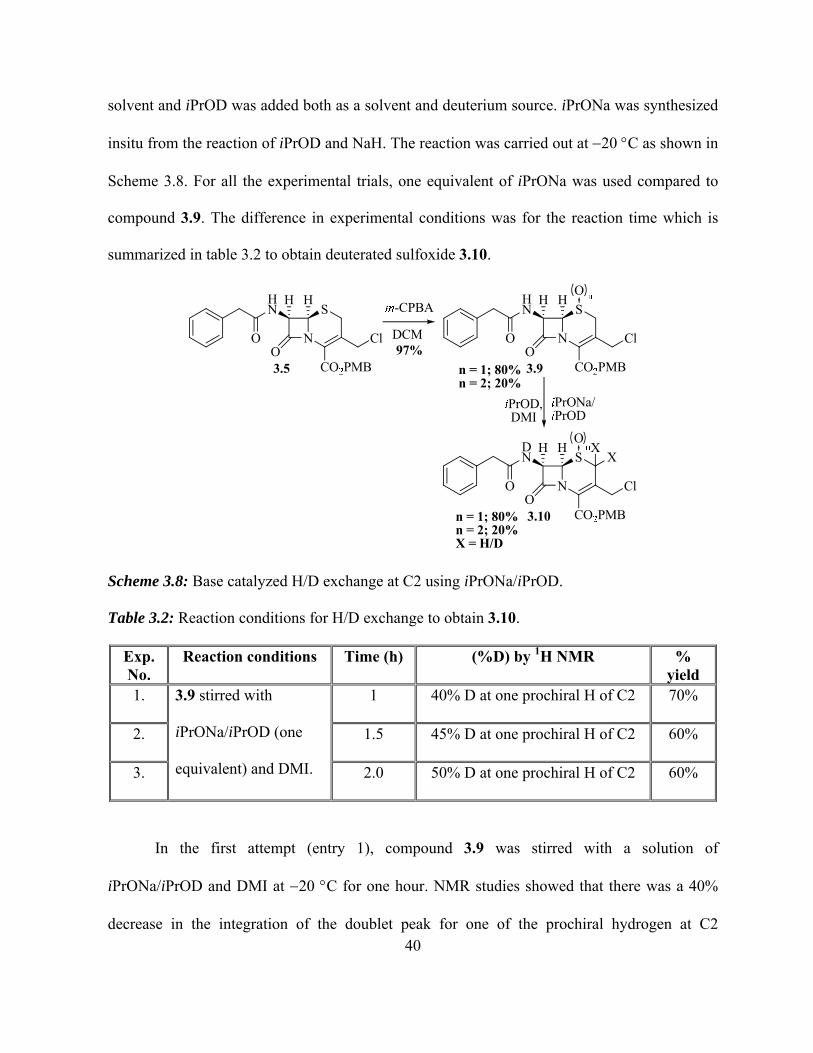
Table 3.1: Reaction conditions for H/D exchange to obtain 3.4
Exp. No.
Quantity of Reagent Time (h)
(%D) by 1H NMR
1. 3.3: 0.07 mmol; D2O: 0.1 mL (100 eq) 19 20% D at one prochiral H of C2
2. 3.3: 0.07 mmol; D2O: 1 mL (1000 eq) 93 60% D at one prochiral H of C2
3. 3.3: 0.15 mmol; D2O: 10 mL (10000 eq) 136 78% D at one prochiral H of C2
The deuteration of 3.3 at C2 was monitored by 1H NMR analysis. The first trial in the
present thesis (entry 1) began by using 100 equivalents of D2O relative to 3.3 and refluxing for
19 hours. The proton signal for each of the diastereotopic hydrogens at C2 is observed as a
doublet. A decrease in the integration for one of these prochiral hydrogens was observed.
However, the other doublet appears under the peak of hydrogens at C8 (phenyl-CH2 side
chain). Therefore the amount of deuterium enrichment was measured depending on the relative
integration of only one of the prochiral hydrogen peak at C2. From the relative integration of

37
protons in the 1H NMR spectrum, it was determined that there was 20% deuterium
incorporation on one of the hydrogens at C2. In the next experiment (entry 2) in order to
increase the deuteration on C2, the reaction mixture was allowed to stir for a longer period of
time (93 hours). Also, the amount of D2O was increased to 1000 equivalents relative to 3.3, in
order to favour greater deuterium incorporation at equilibrium. The 1H NMR suggests the
exchange of 60% deuterium with one of the hydrogen at C2. Entry 3 in table 3.1 shows that the
amount of D2O was increased from 1000 equivalents to 10,000 equivalents relative to 3.3 and
the reaction time from 93 hours to 136 hours. 1H NMR integration confirmed 78% of
deuterium was exchanged with one of the prochiral hydrogen at C2 (Appendix B; Figure 3.1).
The doublet peak for another prochiral hydrogen at C2 showed interference with the peak of
hydrogens at C8 (phenyl-CH2 side chain), therefore the deuterium enrichment cannot be
measured with certainty.
Since this was the first set of reactions using these conditions, it was essential to
conduct additional experiments for increasing the deuterium incorporation. Also, from the
NMR spectroscopy studies there was no H/D exchange observed for the hydrogens at C3ʹ.
Since C3ʹ acyl thio cephalosporin derivatives are an important focus of research in this group,
an H/D exchange was attempted with such a derivative. After the first attempt of H/D
exchange, similar reaction conditions were used to perform H/D exchange on C3ʹ thioester
derivatives. Compound 3.5 was used as the starting material, which was commercially
available. Under Finkelstein conditions, a suspension of 3.5 in acetone was stirred with sodium
iodide at 0 C to synthesize the C3ʹ iodo derivative.34 The iodine was replaced in situ with
thiobenzoate anion to yield 3.6 using sodium carbonate as base. Compound 3.6 was oxidized to
give the sulfoxide 3.7 using m-CPBA at 0 C in 86% yield.65 H/D exchange on 3.7 using
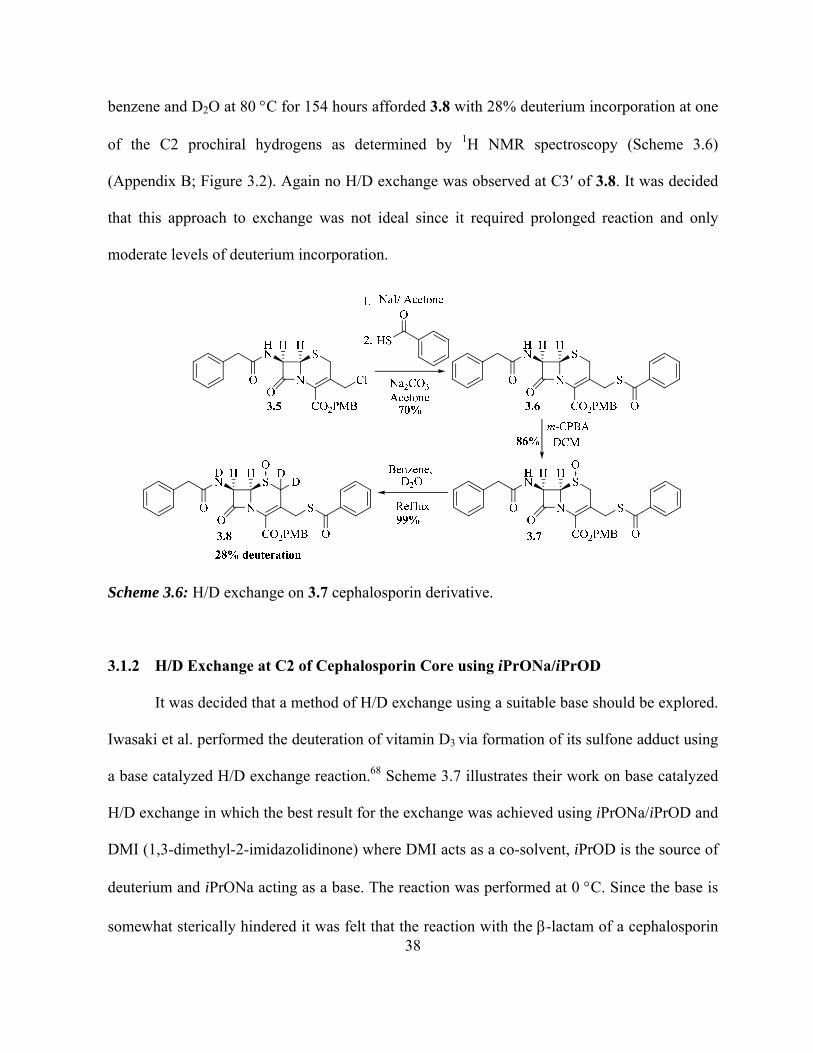
38
benzene and D2O at 80 C for 154 hours afforded 3.8 with 28% deuterium incorporation at one
of the C2 prochiral hydrogens as determined by 1H NMR spectroscopy (Scheme 3.6)
(Appendix B; Figure 3.2). Again no H/D exchange was observed at C3ʹ of 3.8. It was decided
that this approach to exchange was not ideal since it required prolonged reaction and only
moderate levels of deuterium incorporation.
Scheme 3.6: H/D exchange on 3.7 cephalosporin derivative.
3.1.2 H/D Exchange at C2 of Cephalosporin Core using iPrONa/iPrOD
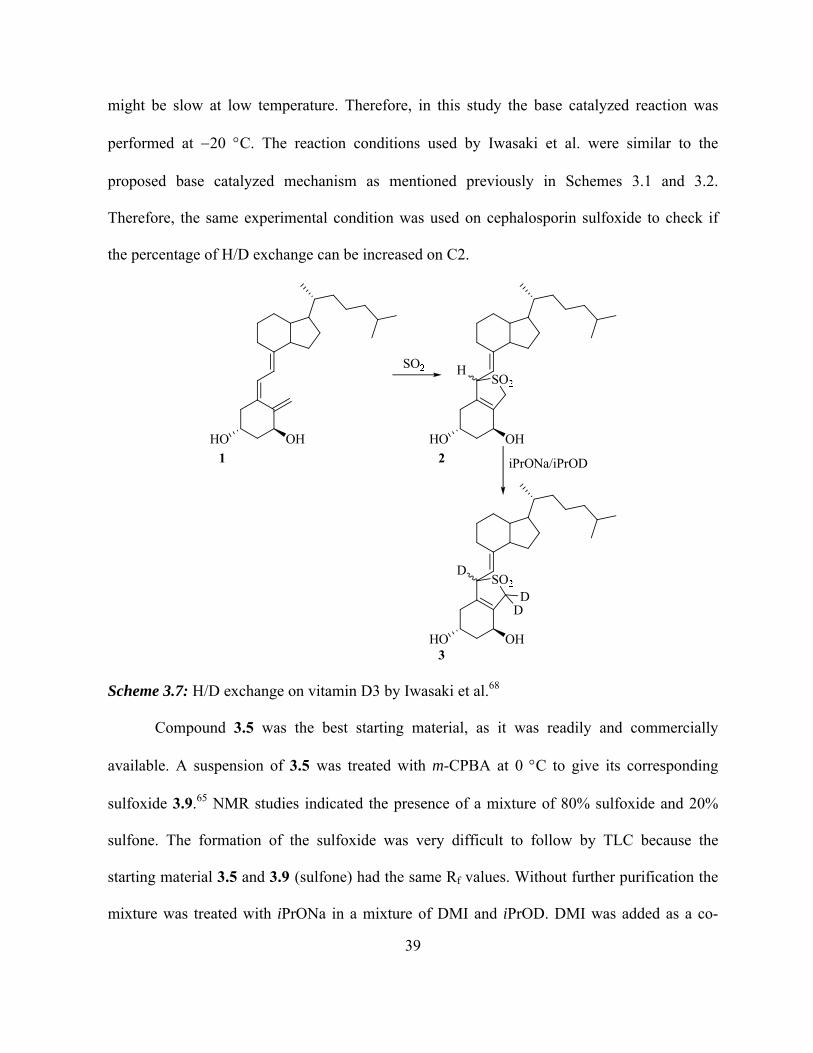
It was decided that a method of H/D exchange using a suitable base should be explored.
Iwasaki et al. performed the deuteration of vitamin D3 via formation of its sulfone adduct using
a base catalyzed H/D exchange reaction.68 Scheme 3.7 illustrates their work on base catalyzed
H/D exchange in which the best result for the exchange was achieved using iPrONa/iPrOD and
DMI (1,3-dimethyl-2-imidazolidinone) where DMI acts as a co-solvent, iPrOD is the source of
deuterium and iPrONa acting as a base. The reaction was performed at 0 C. Since the base is
somewhat sterically hindered it was felt that the reaction with the -lactam of a cephalosporin
39
might be slow at low temperature. Therefore, in this study the base catalyzed reaction was
performed at 20 C. The reaction conditions used by Iwasaki et al. were similar to the
proposed base catalyzed mechanism as mentioned previously in Schemes 3.1 and 3.2.
Therefore, the same experimental condition was used on cephalosporin sulfoxide to check if
the percentage of H/D exchange can be increased on C2.
Scheme 3.7: H/D exchange on vitamin D3 by Iwasaki et al.68
Compound 3.5 was the best starting material, as it was readily and commercially
available. A suspension of 3.5 was treated with m-CPBA at 0 C to give its corresponding
sulfoxide 3.9.65 NMR studies indicated the presence of a mixture of 80% sulfoxide and 20%
sulfone. The formation of the sulfoxide was very difficult to follow by TLC because the
starting material 3.5 and 3.9 (sulfone) had the same Rf values. Without further purification the
mixture was treated with iPrONa in a mixture of DMI and iPrOD. DMI was added as a co-
40
solvent and iPrOD was added both as a solvent and deuterium source. iPrONa was synthesized
insitu from the reaction of iPrOD and NaH. The reaction was carried out at 20 C as shown in
Scheme 3.8. For all the experimental trials, one equivalent of iPrONa was used compared to
compound 3.9. The difference in experimental conditions was for the reaction time which is
summarized in table 3.2 to obtain deuterated sulfoxide 3.10.
Scheme 3.8: Base catalyzed H/D exchange at C2 using iPrONa/iPrOD.
Table 3.2: Reaction conditions for H/D exchange to obtain 3.10.
Exp. No.
Reaction conditions Time (h) (%D) by 1H NMR % yield
1. 3.9 stirred with
iPrONa/iPrOD (one
equivalent) and DMI.
1 40% D at one prochiral H of C2 70%
2. 1.5 45% D at one prochiral H of C2 60%
3. 2.0 50% D at one prochiral H of C2 60%
In the first attempt (entry 1), compound 3.9 was stirred with a solution of
iPrONa/iPrOD and DMI at 20 C for one hour. NMR studies showed that there was a 40%
decrease in the integration of the doublet peak for one of the prochiral hydrogen at C2
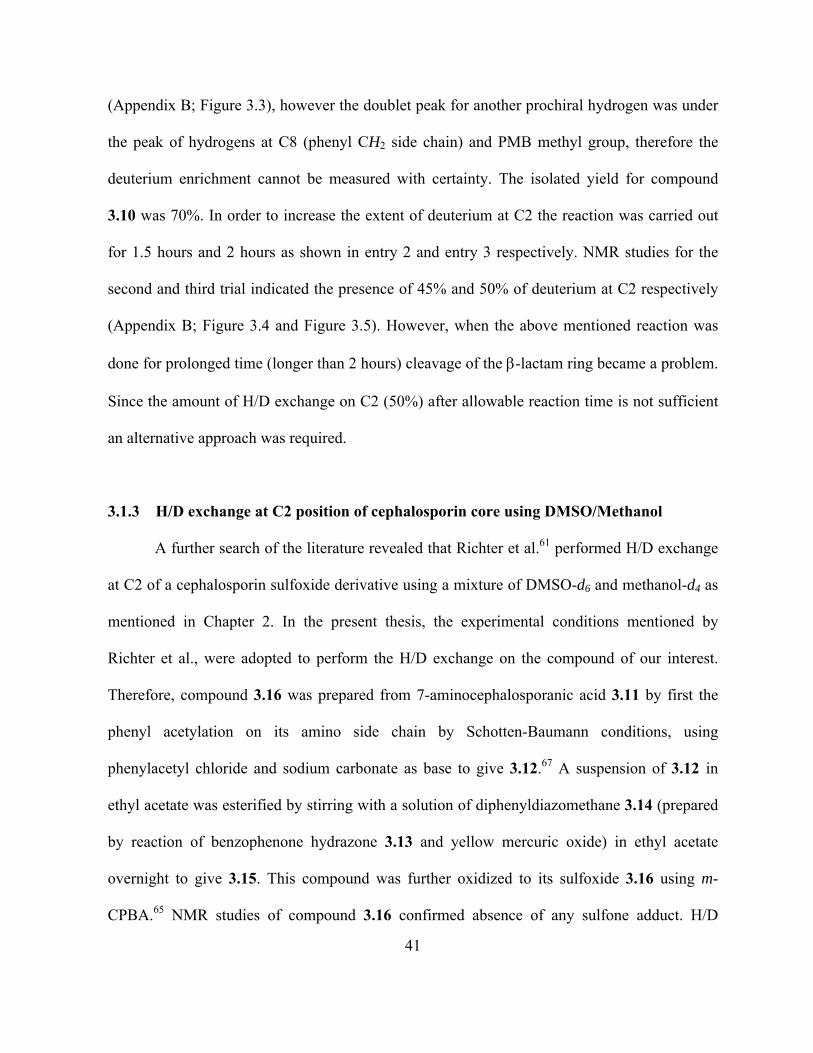
41
(Appendix B; Figure 3.3), however the doublet peak for another prochiral hydrogen was under
the peak of hydrogens at C8 (phenyl CH2 side chain) and PMB methyl group, therefore the
deuterium enrichment cannot be measured with certainty. The isolated yield for compound
3.10 was 70%. In order to increase the extent of deuterium at C2 the reaction was carried out
for 1.5 hours and 2 hours as shown in entry 2 and entry 3 respectively. NMR studies for the
second and third trial indicated the presence of 45% and 50% of deuterium at C2 respectively
(Appendix B; Figure 3.4 and Figure 3.5). However, when the above mentioned reaction was
done for prolonged time (longer than 2 hours) cleavage of the -lactam ring became a problem.
Since the amount of H/D exchange on C2 (50%) after allowable reaction time is not sufficient
an alternative approach was required.
3.1.3 H/D exchange at C2 position of cephalosporin core using DMSO/Methanol
A further search of the literature revealed that Richter et al.61 performed H/D exchange
at C2 of a cephalosporin sulfoxide derivative using a mixture of DMSO-d6 and methanol-d4 as
mentioned in Chapter 2. In the present thesis, the experimental conditions mentioned by
Richter et al., were adopted to perform the H/D exchange on the compound of our interest.
Therefore, compound 3.16 was prepared from 7-aminocephalosporanic acid 3.11 by first the
phenyl acetylation on its amino side chain by Schotten-Baumann conditions, using
phenylacetyl chloride and sodium carbonate as base to give 3.12.67 A suspension of 3.12 in
ethyl acetate was esterified by stirring with a solution of diphenyldiazomethane 3.14 (prepared
by reaction of benzophenone hydrazone 3.13 and yellow mercuric oxide) in ethyl acetate
overnight to give 3.15. This compound was further oxidized to its sulfoxide 3.16 using m-
CPBA.65 NMR studies of compound 3.16 confirmed absence of any sulfone adduct. H/D
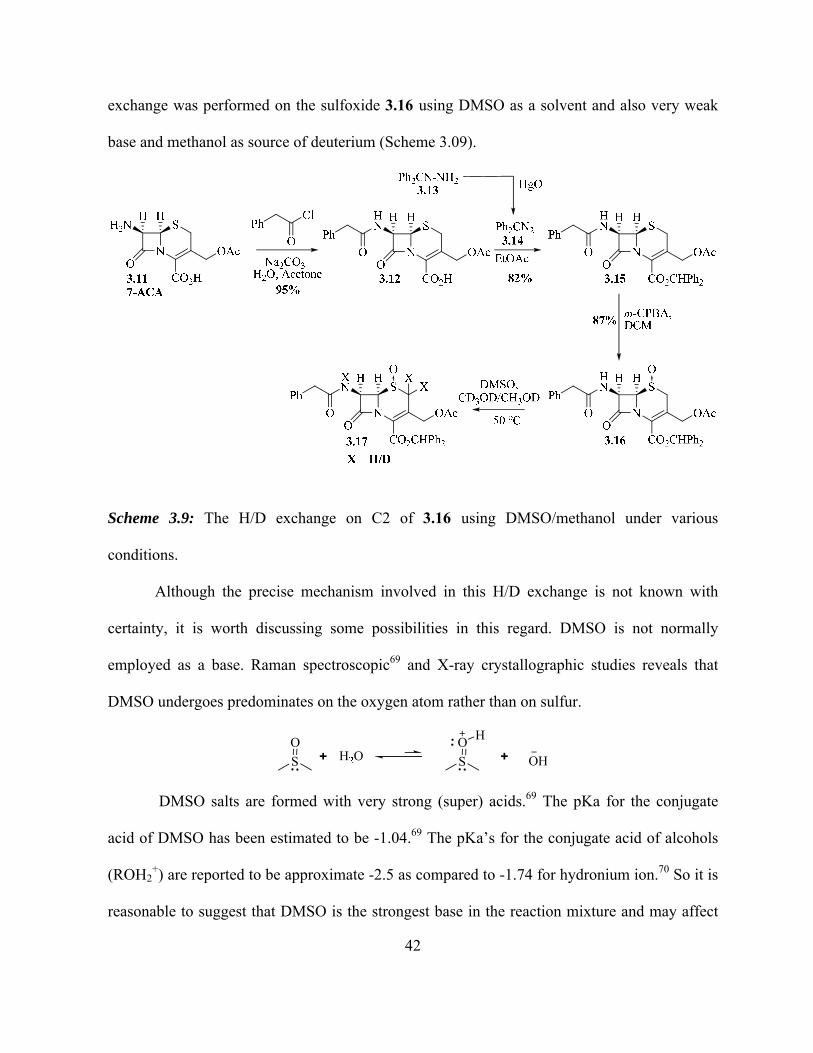
42
exchange was performed on the sulfoxide 3.16 using DMSO as a solvent and also very weak
base and methanol as source of deuterium (Scheme 3.09).
Scheme 3.9: The H/D exchange on C2 of 3.16 using DMSO/methanol under various
conditions.
Although the precise mechanism involved in this H/D exchange is not known with
certainty, it is worth discussing some possibilities in this regard. DMSO is not normally
employed as a base. Raman spectroscopic69 and X-ray crystallographic studies reveals that
DMSO undergoes predominates on the oxygen atom rather than on sulfur.
DMSO salts are formed with very strong (super) acids.69 The pKa for the conjugate
acid of DMSO has been estimated to be -1.04.69 The pKa’s for the conjugate acid of alcohols
(ROH2+) are reported to be approximate -2.5 as compared to -1.74 for hydronium ion.70 So it is
reasonable to suggest that DMSO is the strongest base in the reaction mixture and may affect
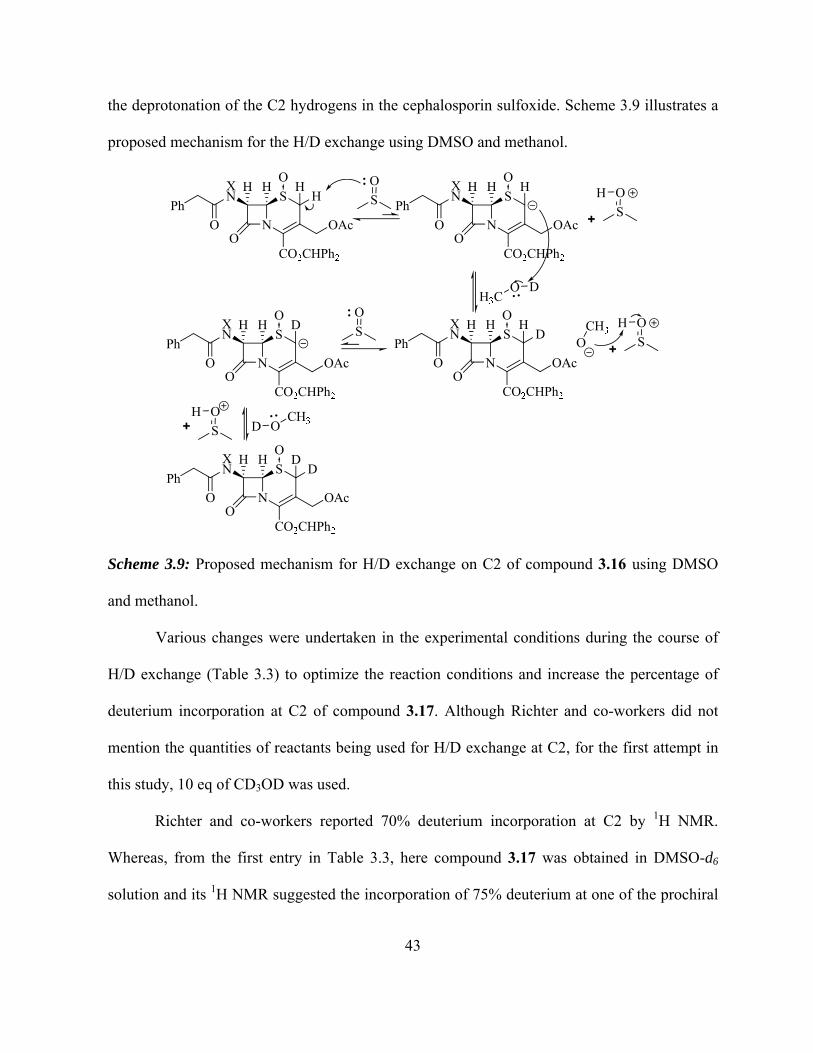
43
the deprotonation of the C2 hydrogens in the cephalosporin sulfoxide. Scheme 3.9 illustrates a
proposed mechanism for the H/D exchange using DMSO and methanol.
Scheme 3.9: Proposed mechanism for H/D exchange on C2 of compound 3.16 using DMSO
and methanol.
Various changes were undertaken in the experimental conditions during the course of
H/D exchange (Table 3.3) to optimize the reaction conditions and increase the percentage of
deuterium incorporation at C2 of compound 3.17. Although Richter and co-workers did not
mention the quantities of reactants being used for H/D exchange at C2, for the first attempt in
this study, 10 eq of CD3OD was used.
Richter and co-workers reported 70% deuterium incorporation at C2 by 1H NMR.
Whereas, from the first entry in Table 3.3, here compound 3.17 was obtained in DMSO-d6
solution and its 1H NMR suggested the incorporation of 75% deuterium at one of the prochiral

44
hydrogens C2 (Appendix B; Figure 3.6). The doublet peak for the second prochiral hydrogen at
C2 showed interference with the multiplet peak of hydrogens at C8, therefore the deuterium
enrichment cannot be measured with certainty. Since methanol-d4 acts only as a source of
deuterium in the reaction in entry 2 it was replaced by MeOD as deuterium source. After the
reaction completion, NMR studies showed no difference in the amount of deuteration at C2 of
3.17, compared to the entry 1; where the H/D exchange was done using methanol-d4 (Appendix
B; Figure 3.7).
Table 3.3: Modification in experimental conditions for the H/D exchange using
DMSO/Methanol
Exp.
No.
Reaction conditions Time (h) (%D) by 1H
NMR
%
Yield
1. 3.16: DMSO-d6; CD3OD (10 eq); changed*
CD3OD every 90 min
3 75% D at one
prochiral H of C2
-NA-
2. 3.16: DMSO-d6; MeOD (10 eq); changed
CH3OD every 90 min
3 75% D at one
prochiral H of C2
-NA-
3. 3.16: DMSO-d6; MeOD (100 eq); changed
CH3OD at 24 h and 43 h
66 87.4% D in both
prochiral Hs of C2
-NA-
4. 3.16: DMSO-d6; MeOD (100 eq); changed
CH3OD every 2 h from t = 0 h to t = 8 h
24 90.2% D in both
prochiral Hs at C2
99%
* Procedure for the change of solvent: After the reaction time of 90 minutes, methanol present in the
reaction flask was evaporated under high vacuum and then, fresh methanol was introduced to the flask
and reaction was continued for the above mentioned time duration. For details refer to Section 5.2 in
Chapter 5 (Experimental Procedure)

45
Since MeOD is cheaper, it was used in the following reactions as deuterium source
instead of methanol-d4. To increase the amount of deuteration at C2, the amount of MeOD was
increased from 10 equivalents to 100 equivalents and the reaction time was increased from 3
hours to 24 hours. It was believed that increasing the amount of MeOD or increasing the time
of reaction would facilitate the H/D exchange. After 24 hours, NMR spectroscopy studies
confirmed 92% of the hydrogen atoms were exchanged by deuterium at C2. The solvent
(MeOD) was changed and new solvent was introduced to the reaction and it was continued for
another 19 hours. After 43 hours NMR studies indicated deuterium incorporation of 94% at
C2. The MeOD was changed and reaction was continued to 66 hours. NMR studies confirmed
that 94% of one prochiral hydrogen was exchanged by deuterium at C2 of compound 3.17 and
93% of the second prochiral hydrogen was exchanged (Appendix B; Figure 3.8). Therefore, the
deuterium enrichment at C2 was found to be (0.94 x 0.93) 87.4%. From the above results, it
was evident that the amount of the solvent (MeOD) as well as the frequency of its change was
very important in increasing the incorporation of deuterium at C2. Time was the third factor of
modification in this reaction. Thus, it was confirmed that to achieve acceptable results most
efficiently, the reaction should be done for 24 hours and the solvent (MeOD) should be
changed frequently. Therefore, in entry 4 the amount of MeOD was kept at 100 equivalents but
MeOD was changed every 2 hours from t = 0 to t = 8 hours. The reaction was carried out for
24 hours and NMR spectroscopy studies showed H/D exchange of 97% was achieved on one
of the prochiral hydrogen at C2 of compound 3.17 and 93% of the second prochiral hydrogen
was exchanged (Appendix B; Figure 3.9). Therefore, the deuterium enrichment at C2 was
found to be (0.97 x 0.93) 90.2%.
46
During the NMR studies of compound 3.16, it was observed that each of the signals for
the hydrogens at C2 appears as a doublet (Appendix B; Figure 3.11 [A]). Among them, one of
the doublets for one of the hydrogens at C2 was superimposed with the peak for the methylene
hydrogens at Ph-CH2 whereas; the doublet peak for the second hydrogen at C2 was isolated at
down-field position. After the H/D exchange on C2 using DMSO/methanol, it was essential to
determine that the doublet peak which disappears from the 1H NMR of compound 3.17
(Appendix B; Figure 3.9), was in fact, for the hydrogens at C2 and not for Ph-CH2. A detail 2D
NMR for compound 3.15 (Appendix B; Figure 3.10) and 3.16 (Appendix B; Figure 3.11), was
carried out. Peaks for all the hydrogen and carbon atoms were assigned using COSY, HMQC
and HMBC experiments. NMR studies of compound 3.15 (Appendix B; Figure 3.10), shows
that the peak for hydrogen at C2 and Ph-CH2 are superimposed. Therefore it was difficult to
assign them. However, HMBC study for compound 3.16 confirmed that, the peak which
diminishes in the 1H NMR of compound 3.17 (Appendix B; Figure 3.9), is for the hydrogens at
C2. Thus, for compound 3.16 the peak at 3.96 ppm was for hydrogen at C2 (Appendix B;
Figure 3.11) and not for the hydrogens on the phenylacetyl side chain. After the H/D exchange
it was this peak at 3.96 ppm which diminishes in compound 3.17 (Appendix B; Figure 3.9).
NMR studies of compound 3.17 confirmed the presence of 90.2% deuterium enrichment at C2.
Hence, objective 1 in the present thesis was successfully accomplished with good yield and
higher percent of deuterium incorporation at the C2 of the cephalosporin compound, compared
to the previous two methods.
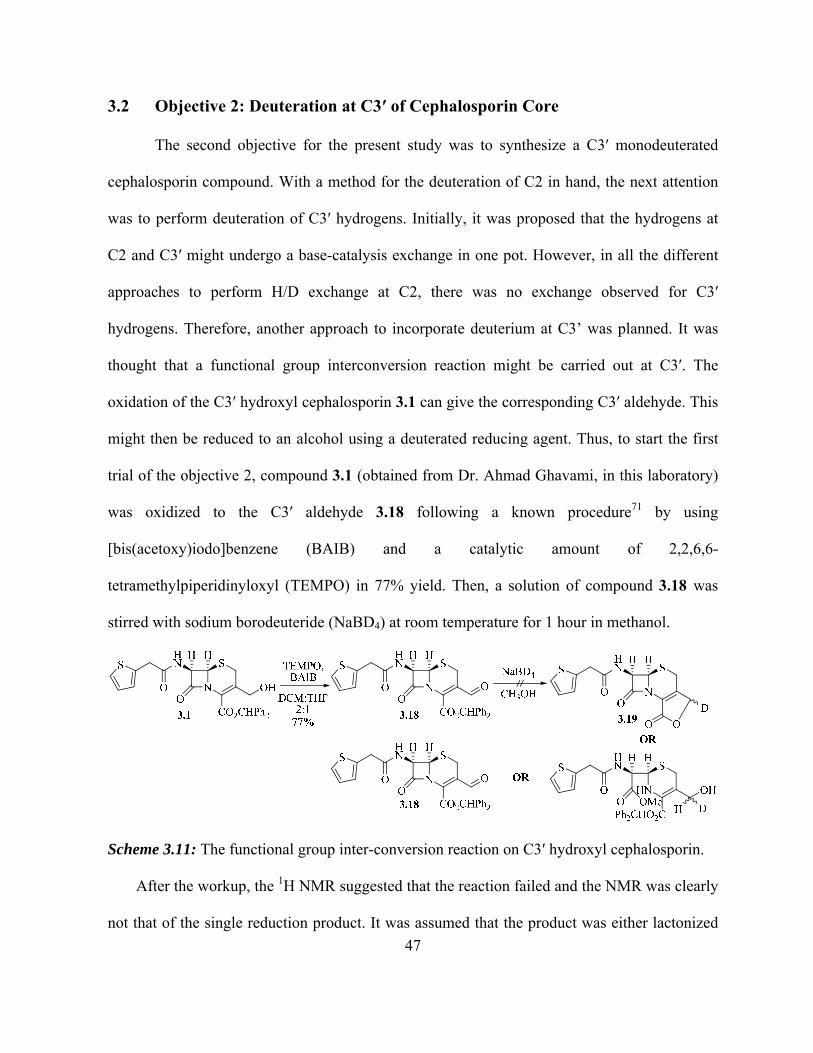
47
3.2 Objective 2: Deuteration at C3ʹ of Cephalosporin Core
The second objective for the present study was to synthesize a C3ʹ monodeuterated
cephalosporin compound. With a method for the deuteration of C2 in hand, the next attention
was to perform deuteration of C3ʹ hydrogens. Initially, it was proposed that the hydrogens at
C2 and C3ʹ might undergo a base-catalysis exchange in one pot. However, in all the different
approaches to perform H/D exchange at C2, there was no exchange observed for C3ʹ
hydrogens. Therefore, another approach to incorporate deuterium at C3’ was planned. It was
thought that a functional group interconversion reaction might be carried out at C3ʹ. The
oxidation of the C3ʹ hydroxyl cephalosporin 3.1 can give the corresponding C3ʹ aldehyde. This
might then be reduced to an alcohol using a deuterated reducing agent. Thus, to start the first
trial of the objective 2, compound 3.1 (obtained from Dr. Ahmad Ghavami, in this laboratory)
was oxidized to the C3ʹ aldehyde 3.18 following a known procedure71 by using
[bis(acetoxy)iodo]benzene (BAIB) and a catalytic amount of 2,2,6,6-
tetramethylpiperidinyloxyl (TEMPO) in 77% yield. Then, a solution of compound 3.18 was
stirred with sodium borodeuteride (NaBD4) at room temperature for 1 hour in methanol.
Scheme 3.11: The functional group inter-conversion reaction on C3ʹ hydroxyl cephalosporin.
After the workup, the 1H NMR suggested that the reaction failed and the NMR was clearly
not that of the single reduction product. It was assumed that the product was either lactonized

48
at C3ʹ to give 3.19 or the -lactam ring was hydrolyzed or both (Scheme 3.11). The reason for
the failure for the reduction of compound 3.18 to give 3.19 was unknown. However, there were
few possibilities for its failure which included: the possibility that sample of sodium
borodeuteride was decomposed or that the -lactam ring was cleaved by the methoxide ion
formed from the reaction of methanol with sodium borodeuteride at higher temperature. The
same reaction as mentioned in Scheme 3.10 was performed on compound 3.20 (obtained from
Dr. Ahmad Ghavami, in this research group) since, the amount of compound 3.1 was not
sufficient to go ahead with the next trials. Also, the experimental conditions used to cleave this
phenylacetyl side chain were previously performed in this laboratory. Compound 3.20 was
oxidized to the C3ʹ aldehyde derivative 3.21 using BAIB and a catalytic amount of TEMPO. In
the second trial, compound 3.21 was reduced using sodium borohydride (NaBH4) instead of
sodium borodeuteride (NaBD4). The idea was to verify if, the reaction can be performed on
cephalosporin compounds. The temperature was one of the assumed reasons for the failure of
first trial. Therefore, in the second trial the reaction was done at 0 C. Reduction reactions
using sodium borohydride are normally carried out in alcohol solvents; in which the rate of
reaction is directly related to the structure of the alcohol (methyl > 1 > 2 > 3).72 A solution
of compound 3.21 was stirred with NaBH4 for an hour in ethanol at 0 C to give 3.20 after
acidic workup (Scheme 3.12).
N
S
O
HN
CO2CHPh2
OO
HHTEMPO,BAIB
N
S
O
HN
CO2CHPh2
OHO
HH
3.20 3.21DCM:THF
2:1
EtOH
NaBH4
N
S
O
HN
CO2CHPh2
OHO
HH
3.2085%
50%
Scheme 3.12: Reduction of C3ʹ aldehyde using sodium borohydride.
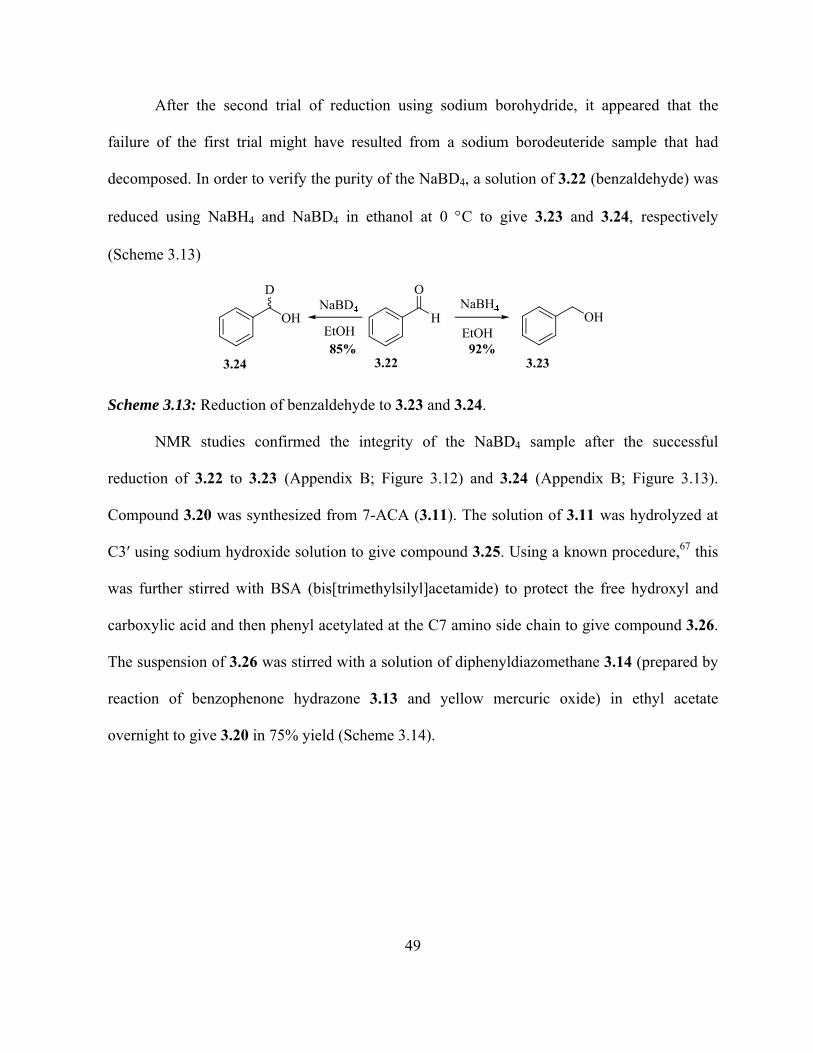
49
After the second trial of reduction using sodium borohydride, it appeared that the
failure of the first trial might have resulted from a sodium borodeuteride sample that had
decomposed. In order to verify the purity of the NaBD4, a solution of 3.22 (benzaldehyde) was
reduced using NaBH4 and NaBD4 in ethanol at 0 C to give 3.23 and 3.24, respectively
(Scheme 3.13)
Scheme 3.13: Reduction of benzaldehyde to 3.23 and 3.24.
NMR studies confirmed the integrity of the NaBD4 sample after the successful
reduction of 3.22 to 3.23 (Appendix B; Figure 3.12) and 3.24 (Appendix B; Figure 3.13).
Compound 3.20 was synthesized from 7-ACA (3.11). The solution of 3.11 was hydrolyzed at
C3ʹ using sodium hydroxide solution to give compound 3.25. Using a known procedure,67 this
was further stirred with BSA (bis[trimethylsilyl]acetamide) to protect the free hydroxyl and
carboxylic acid and then phenyl acetylated at the C7 amino side chain to give compound 3.26.
The suspension of 3.26 was stirred with a solution of diphenyldiazomethane 3.14 (prepared by
reaction of benzophenone hydrazone 3.13 and yellow mercuric oxide) in ethyl acetate
overnight to give 3.20 in 75% yield (Scheme 3.14).
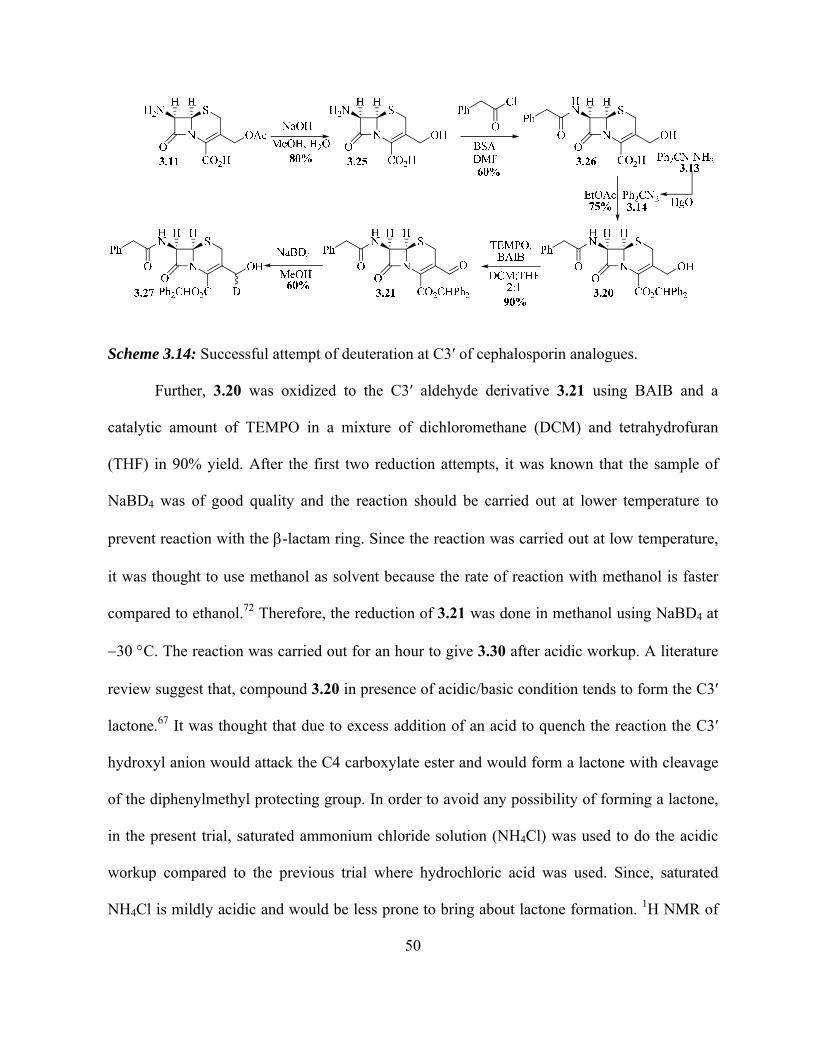
50
Scheme 3.14: Successful attempt of deuteration at C3ʹ of cephalosporin analogues.
Further, 3.20 was oxidized to the C3ʹ aldehyde derivative 3.21 using BAIB and a
catalytic amount of TEMPO in a mixture of dichloromethane (DCM) and tetrahydrofuran
(THF) in 90% yield. After the first two reduction attempts, it was known that the sample of
NaBD4 was of good quality and the reaction should be carried out at lower temperature to
prevent reaction with the -lactam ring. Since the reaction was carried out at low temperature,
it was thought to use methanol as solvent because the rate of reaction with methanol is faster
compared to ethanol.72 Therefore, the reduction of 3.21 was done in methanol using NaBD4 at
30 C. The reaction was carried out for an hour to give 3.30 after acidic workup. A literature
review suggest that, compound 3.20 in presence of acidic/basic condition tends to form the C3ʹ
lactone.67 It was thought that due to excess addition of an acid to quench the reaction the C3ʹ
hydroxyl anion would attack the C4 carboxylate ester and would form a lactone with cleavage
of the diphenylmethyl protecting group. In order to avoid any possibility of forming a lactone,
in the present trial, saturated ammonium chloride solution (NH4Cl) was used to do the acidic
workup compared to the previous trial where hydrochloric acid was used. Since, saturated
NH4Cl is mildly acidic and would be less prone to bring about lactone formation. 1H NMR of
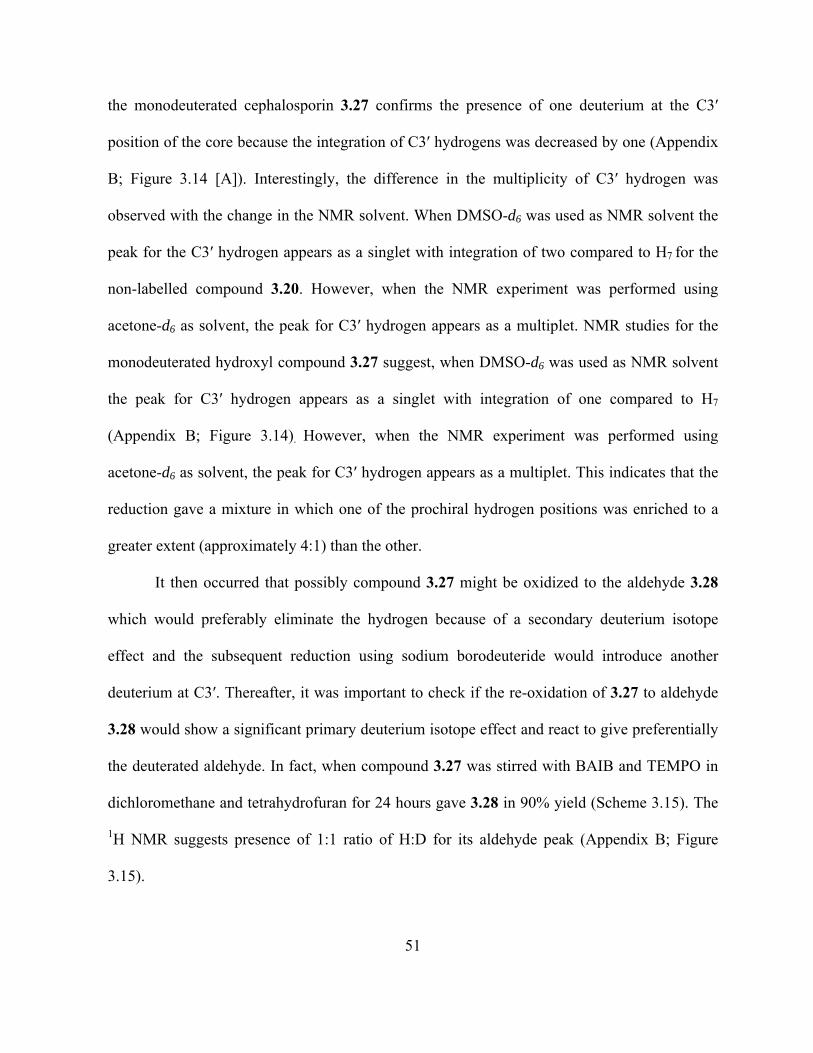
51
the monodeuterated cephalosporin 3.27 confirms the presence of one deuterium at the C3ʹ
position of the core because the integration of C3ʹ hydrogens was decreased by one (Appendix
B; Figure 3.14 [A]). Interestingly, the difference in the multiplicity of C3ʹ hydrogen was
observed with the change in the NMR solvent. When DMSO-d6 was used as NMR solvent the
peak for the C3ʹ hydrogen appears as a singlet with integration of two compared to H7 for the
non-labelled compound 3.20. However, when the NMR experiment was performed using
acetone-d6 as solvent, the peak for C3ʹ hydrogen appears as a multiplet. NMR studies for the
monodeuterated hydroxyl compound 3.27 suggest, when DMSO-d6 was used as NMR solvent
the peak for C3ʹ hydrogen appears as a singlet with integration of one compared to H7
(Appendix B; Figure 3.14). However, when the NMR experiment was performed using
acetone-d6 as solvent, the peak for C3ʹ hydrogen appears as a multiplet. This indicates that the
reduction gave a mixture in which one of the prochiral hydrogen positions was enriched to a
greater extent (approximately 4:1) than the other.
It then occurred that possibly compound 3.27 might be oxidized to the aldehyde 3.28
which would preferably eliminate the hydrogen because of a secondary deuterium isotope
effect and the subsequent reduction using sodium borodeuteride would introduce another
deuterium at C3ʹ. Thereafter, it was important to check if the re-oxidation of 3.27 to aldehyde
3.28 would show a significant primary deuterium isotope effect and react to give preferentially
the deuterated aldehyde. In fact, when compound 3.27 was stirred with BAIB and TEMPO in
dichloromethane and tetrahydrofuran for 24 hours gave 3.28 in 90% yield (Scheme 3.15). The
1H NMR suggests presence of 1:1 ratio of H:D for its aldehyde peak (Appendix B; Figure
3.15).
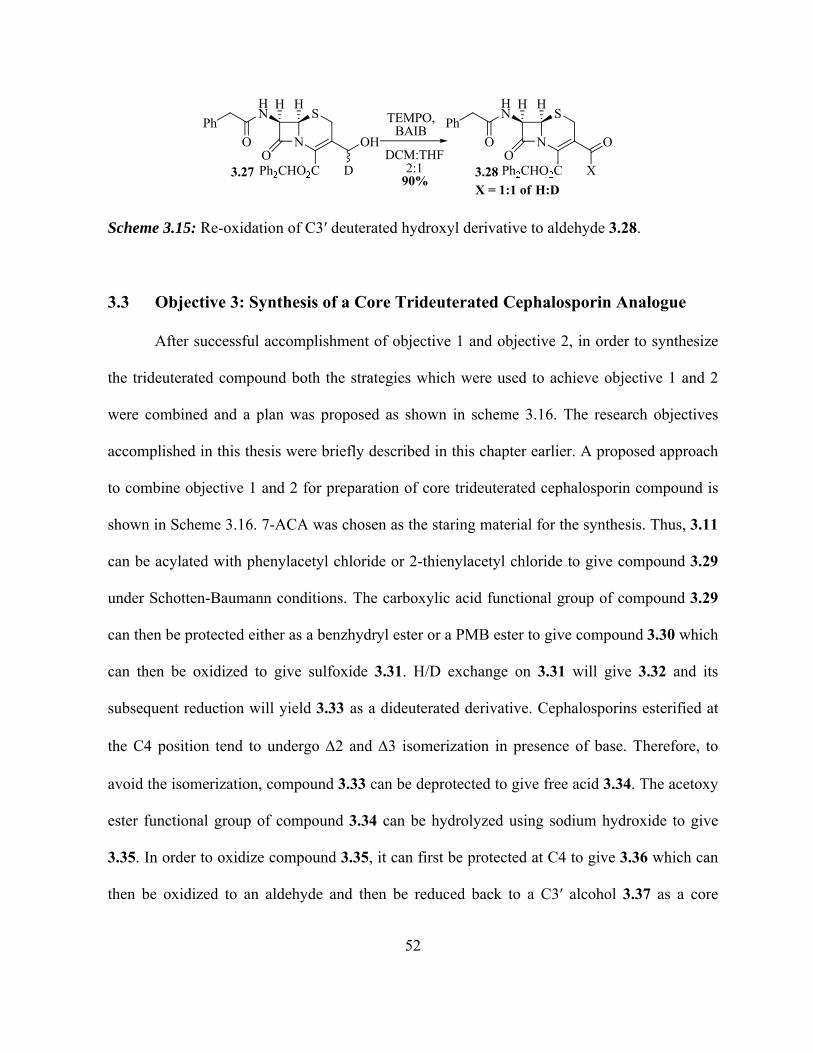
52
Scheme 3.15: Re-oxidation of C3ʹ deuterated hydroxyl derivative to aldehyde 3.28.
3.3 Objective 3: Synthesis of a Core Trideuterated Cephalosporin Analogue
After successful accomplishment of objective 1 and objective 2, in order to synthesize
the trideuterated compound both the strategies which were used to achieve objective 1 and 2
were combined and a plan was proposed as shown in scheme 3.16. The research objectives
accomplished in this thesis were briefly described in this chapter earlier. A proposed approach
to combine objective 1 and 2 for preparation of core trideuterated cephalosporin compound is
shown in Scheme 3.16. 7-ACA was chosen as the staring material for the synthesis. Thus, 3.11
can be acylated with phenylacetyl chloride or 2-thienylacetyl chloride to give compound 3.29
under Schotten-Baumann conditions. The carboxylic acid functional group of compound 3.29
can then be protected either as a benzhydryl ester or a PMB ester to give compound 3.30 which
can then be oxidized to give sulfoxide 3.31. H/D exchange on 3.31 will give 3.32 and its
subsequent reduction will yield 3.33 as a dideuterated derivative. Cephalosporins esterified at
the C4 position tend to undergo 2 and 3 isomerization in presence of base. Therefore, to
avoid the isomerization, compound 3.33 can be deprotected to give free acid 3.34. The acetoxy
ester functional group of compound 3.34 can be hydrolyzed using sodium hydroxide to give
3.35. In order to oxidize compound 3.35, it can first be protected at C4 to give 3.36 which can
then be oxidized to an aldehyde and then be reduced back to a C3ʹ alcohol 3.37 as a core
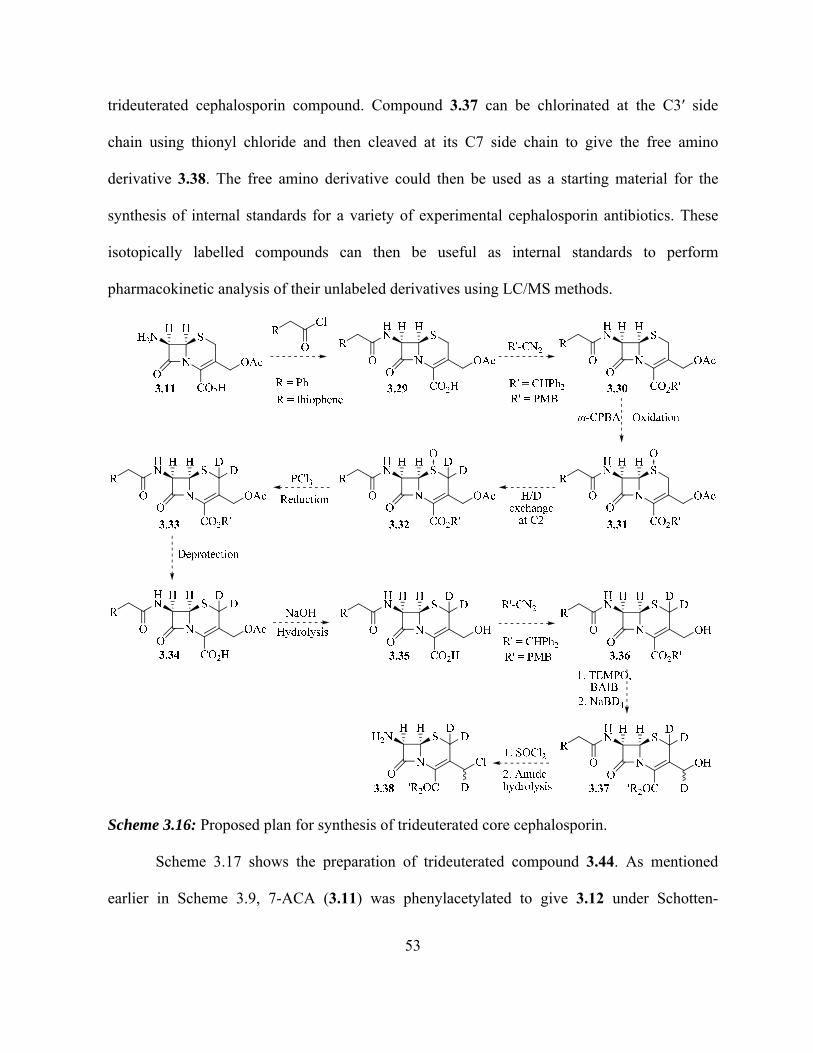
53
trideuterated cephalosporin compound. Compound 3.37 can be chlorinated at the C3ʹ side
chain using thionyl chloride and then cleaved at its C7 side chain to give the free amino
derivative 3.38. The free amino derivative could then be used as a starting material for the
synthesis of internal standards for a variety of experimental cephalosporin antibiotics. These
isotopically labelled compounds can then be useful as internal standards to perform
pharmacokinetic analysis of their unlabeled derivatives using LC/MS methods.
Scheme 3.16: Proposed plan for synthesis of trideuterated core cephalosporin.
Scheme 3.17 shows the preparation of trideuterated compound 3.44. As mentioned
earlier in Scheme 3.9, 7-ACA (3.11) was phenylacetylated to give 3.12 under Schotten-
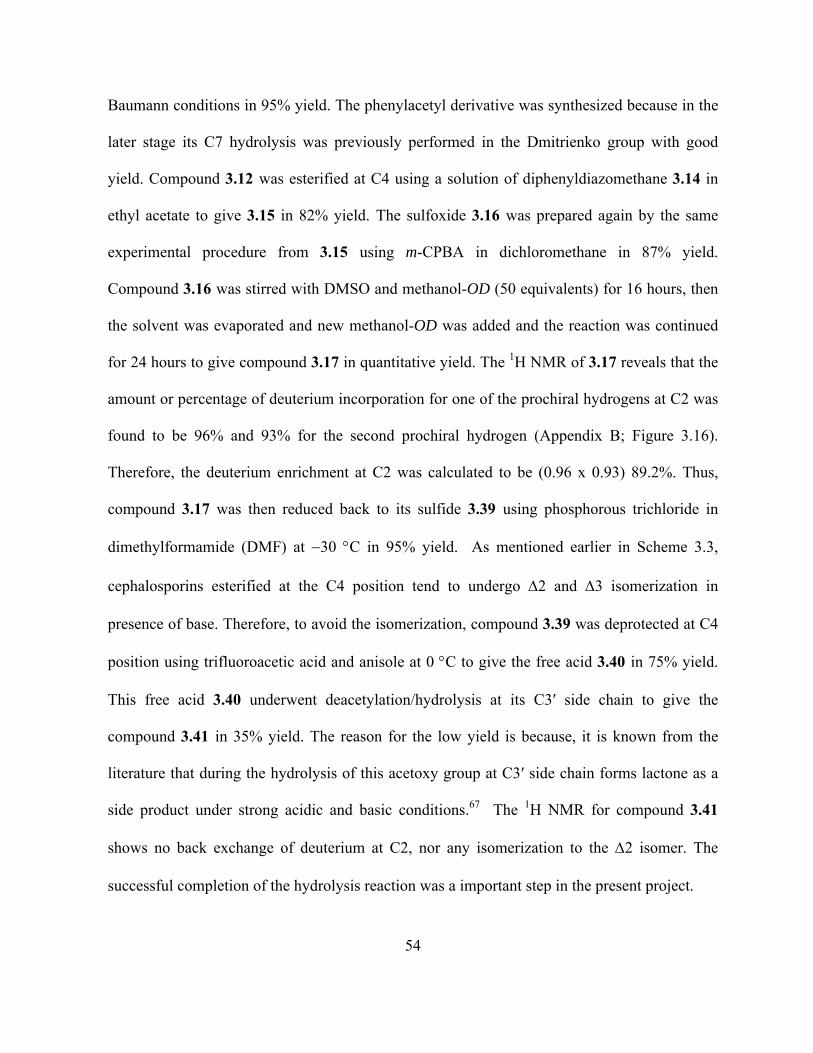
54
Baumann conditions in 95% yield. The phenylacetyl derivative was synthesized because in the
later stage its C7 hydrolysis was previously performed in the Dmitrienko group with good
yield. Compound 3.12 was esterified at C4 using a solution of diphenyldiazomethane 3.14 in
ethyl acetate to give 3.15 in 82% yield. The sulfoxide 3.16 was prepared again by the same
experimental procedure from 3.15 using m-CPBA in dichloromethane in 87% yield.
Compound 3.16 was stirred with DMSO and methanol-OD (50 equivalents) for 16 hours, then
the solvent was evaporated and new methanol-OD was added and the reaction was continued
for 24 hours to give compound 3.17 in quantitative yield. The 1H NMR of 3.17 reveals that the
amount or percentage of deuterium incorporation for one of the prochiral hydrogens at C2 was
found to be 96% and 93% for the second prochiral hydrogen (Appendix B; Figure 3.16).
Therefore, the deuterium enrichment at C2 was calculated to be (0.96 x 0.93) 89.2%. Thus,
compound 3.17 was then reduced back to its sulfide 3.39 using phosphorous trichloride in
dimethylformamide (DMF) at 30 C in 95% yield. As mentioned earlier in Scheme 3.3,
cephalosporins esterified at the C4 position tend to undergo 2 and 3 isomerization in
presence of base. Therefore, to avoid the isomerization, compound 3.39 was deprotected at C4
position using trifluoroacetic acid and anisole at 0 C to give the free acid 3.40 in 75% yield.
This free acid 3.40 underwent deacetylation/hydrolysis at its C3ʹ side chain to give the
compound 3.41 in 35% yield. The reason for the low yield is because, it is known from the
literature that during the hydrolysis of this acetoxy group at C3ʹ side chain forms lactone as a
side product under strong acidic and basic conditions.67 The 1H NMR for compound 3.41
shows no back exchange of deuterium at C2, nor any isomerization to the 2 isomer. The
successful completion of the hydrolysis reaction was a important step in the present project.

55
Further, 3.41 was esterified using the same procedure as mentioned earlier to give
compound 3.42 in 72% yields. Compound 3.42 was then oxidized using TEMPO and BAIB in
a mixture of dichloromethane and tetrahydrofuran to give dideuterated aldehyde 3.43 in 97%
yield. The aldehyde 3.43 was then reduced with NaBD4 in methanol at 30 C. Saturated
solution of NH4Cl was used to quench the reagents during the workup which afforded core
trideuterated cephalosporin compound 3.44 in 50% yield (scheme 3.17).
Scheme 3.17: The synthesis of core trideuterated cephalosporin.

56
NMR studies of compound 3.44 indicated that, there was a difference in the multiplicity
of C3ʹ hydrogen peaks with the change in the NMR solvent as mentioned earlier in Scheme
3.14. When DMSO-d6 was used as the NMR solvent, the peak for C3ʹ hydrogen appears as a
singlet with integration of one compared to H7 (Appendix B; Figure 3.17 [A]). However, when
the NMR was done using acetone-d6 as solvent, the peak for C3ʹ hydrogen appears as a
multiplet. The relative integration indicates that the reduction gave a mixture in which one of
the prochiral hydrogen positions is been enriched to a greater extent (approximately 4:1) than
the other (Appendix B; Figure 3.17 [B]). From the NMR studies the deuterium enrichment
cannot be measured with certainty for compound 3.44. Since the signal for hydrogens at C2 is
overlapped with the peak of hydrogens at C8 (phenyl-CH2 side chain). The deuterium
enrichment for C3ʹ from its NMR integration of the peak was found to be 98%. Thus, with the
synthesis of compound 3.44 the attempt to synthesize the core trideuterated derivate was
successfully achieved.
3.4 Modified Route for the Synthesis of the Core Trideuterated Cephalosporin
Analogue
Scheme 3.17 represents the synthesis of trideuterated cephalosporin 3.44 in 11 steps.
After the first successful attempt for the synthesis of trideuterated analogue, the next challenge
was to reduce the synthesis steps to make it more efficient and additionally, increase the
overall yield for the synthesis of core trideuterated compound. It was proposed that by avoiding
the C4 esterification step and deprotection of the benzhydryl group, both the above mentioned
challenges might be answered. Scheme 3.18 shows the modified route of synthesis. Herein, the
synthesis started from 3.11 (7-ACA) as mentioned earlier in other schemes. This compound

57
was phenylacetylated on the C7 amino side chain to give 3.12 in excellent yields. Further, 3.12
was directly oxidized to the sulfoxide 3.45 using m-CPBA in 97% yield.73 Compound 3.45
underwent H/D exchange at C2 of using DMSO and methanol-OD (20 equivalents). An effort
was made to reduce the duration of the H/D exchange reaction. Therefore, methanol-OD was
changed every two hours and the reaction was done for only 6 hours. Compound 3.46 was
obtained in quantitative yields and 1H NMR spectroscopy of 3.46 reveals the presence of 95%
deuterium incorporation at one of the prochiral hydrogens of C2 (Appendix B; Figure 3.18).
The dideuterated compound 3.46 was reduced back to its sulfide form 3.40 using phosphorous
trichloride at 30 C in DMF. The mass spectrum for 3.40 shows the presence of the ratio of
the dideuterated compound to the monodeuterated as 10:1 (Appendix B; Figure 3.19). Thus
this infers that after the H/D exchange on compound 3.45 approximately 91% of both the
prochiral hydrogens were exchanged by deuterium at C2 of core cephalosporin. Compound
3.40 was hydrolyzed at C3ʹ using sodium hydroxide at 20 C to give 3.41 in 50% yield.
Synthesis of 3.42 was done by esterification of 3.41 at C4 using a solution of
diphenyldiazomethane 3.14 in ethyl acetate. The functional group interconversion reactions
were performed on 3.42 in which oxidation to aldehyde afforded compound 3.43 in 98% yield
and its reduction resulted in core trideuterated hydroxyl derivative 3.44 in 62% yield.
According to the NMR studies of compound 3.44 in benzene-d6 and a drop of DMSO-d6 the
deuterium incorporation in the core cephalosporin compound was determined to be 95% for
one of the prochiral hydrogen and 94% for the second prochiral hydrogen at C2 (Appendix B;
Figure 3.20).There was a difference in the multiplicity of the C3ʹ hydrogen with the change in
the NMR solvent as mentioned earlier in Scheme 3.14. (Appendix B; Figure 3.20 [A and B]).
1H NMR spectroscopy of compound 3.44 in acetone-d6 suggests 98% of isotopic enrichment at

58
C3ʹ. Also, 13C NMR shows the peak for C3ʹ as a triplet due to the presence of deuterium
(Appendix B; Figure 3.20 [C]). The mass spectrum for compound 3.44 shows a presence of
trideuterated: dideuterated in a ratio of 5:1 (Appendix B; Figure 3.20[D]). Thus, the synthesis
of a core trideuterated compound 3.44 having deuterium enrichment of (0.94 x 0.95 x 0.98)
87.5% by NMR spectroscopic studies. After performing the calculation from the mass
spectrometric analysis it was found that the estimated ratio of the trideuterated compound to
the dideuterated compound was 5 to 1.
Scheme 3.18: Modified route of synthesis for core trideuterated cephalosporin analogue.
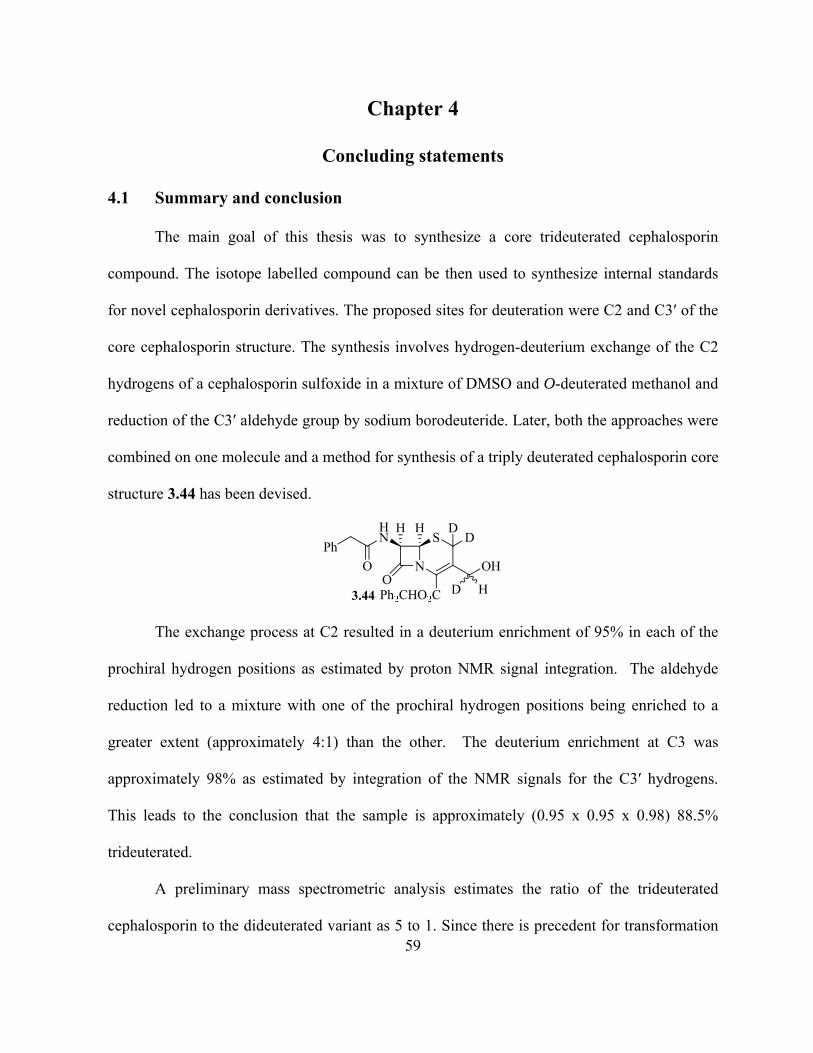
59
Chapter 4
Concluding statements
4.1 Summary and conclusion
The main goal of this thesis was to synthesize a core trideuterated cephalosporin
compound. The isotope labelled compound can be then used to synthesize internal standards
for novel cephalosporin derivatives. The proposed sites for deuteration were C2 and C3ʹ of the
core cephalosporin structure. The synthesis involves hydrogen-deuterium exchange of the C2
hydrogens of a cephalosporin sulfoxide in a mixture of DMSO and O-deuterated methanol and
reduction of the C3ʹ aldehyde group by sodium borodeuteride. Later, both the approaches were
combined on one molecule and a method for synthesis of a triply deuterated cephalosporin core
structure 3.44 has been devised.
The exchange process at C2 resulted in a deuterium enrichment of 95% in each of the
prochiral hydrogen positions as estimated by proton NMR signal integration. The aldehyde
reduction led to a mixture with one of the prochiral hydrogen positions being enriched to a
greater extent (approximately 4:1) than the other. The deuterium enrichment at C3 was
approximately 98% as estimated by integration of the NMR signals for the C3ʹ hydrogens.
This leads to the conclusion that the sample is approximately (0.95 x 0.95 x 0.98) 88.5%
trideuterated.
A preliminary mass spectrometric analysis estimates the ratio of the trideuterated
cephalosporin to the dideuterated variant as 5 to 1. Since there is precedent for transformation
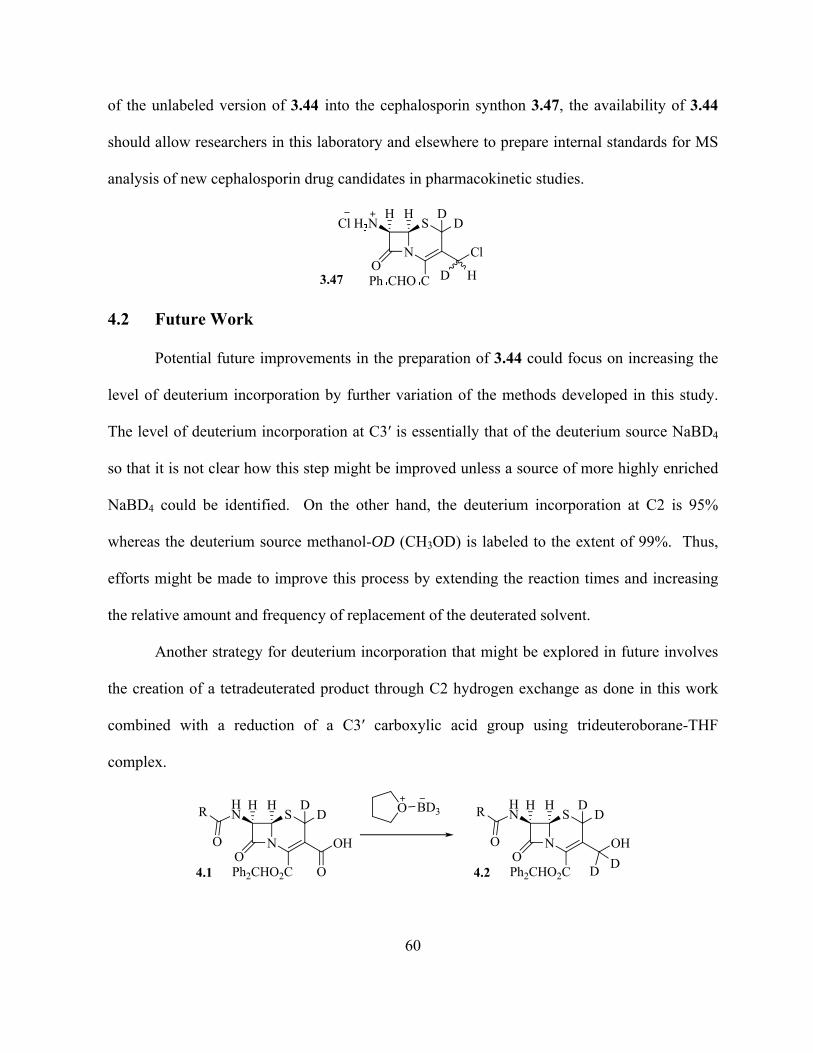
60
of the unlabeled version of 3.44 into the cephalosporin synthon 3.47, the availability of 3.44
should allow researchers in this laboratory and elsewhere to prepare internal standards for MS
analysis of new cephalosporin drug candidates in pharmacokinetic studies.
4.2 Future Work
Potential future improvements in the preparation of 3.44 could focus on increasing the
level of deuterium incorporation by further variation of the methods developed in this study.
The level of deuterium incorporation at C3ʹ is essentially that of the deuterium source NaBD4
so that it is not clear how this step might be improved unless a source of more highly enriched
NaBD4 could be identified. On the other hand, the deuterium incorporation at C2 is 95%
whereas the deuterium source methanol-OD (CH3OD) is labeled to the extent of 99%. Thus,
efforts might be made to improve this process by extending the reaction times and increasing
the relative amount and frequency of replacement of the deuterated solvent.
Another strategy for deuterium incorporation that might be explored in future involves
the creation of a tetradeuterated product through C2 hydrogen exchange as done in this work
combined with a reduction of a C3ʹ carboxylic acid group using trideuteroborane-THF
complex.
2 2
3
2 2

61
The deuterated compound 3.44 should be converted in to the labeled synthon 3.47 to
establish if any back exchange of hydrogen for deuterium occurs in any of the steps. Also, the
synthon 3.47 should be subjected to typical N-acylation, chloride displacements by typical
nucleophiles and removal of the benzhydryl protecting group to determine if any back-
exchange occurs in such transformations.
In future use of such a trideuterated species in LC/MS/MS studies it will be necessary
to establish the separation and ionization conditions that are ideal for the specific cephalosporin
derivative under study. Attention will need to be paid in such studies to any possibility that the
MS ionization conditions might result in any back exchange of the deuterium by protium from
the ionization medium that will likely include acid or base.
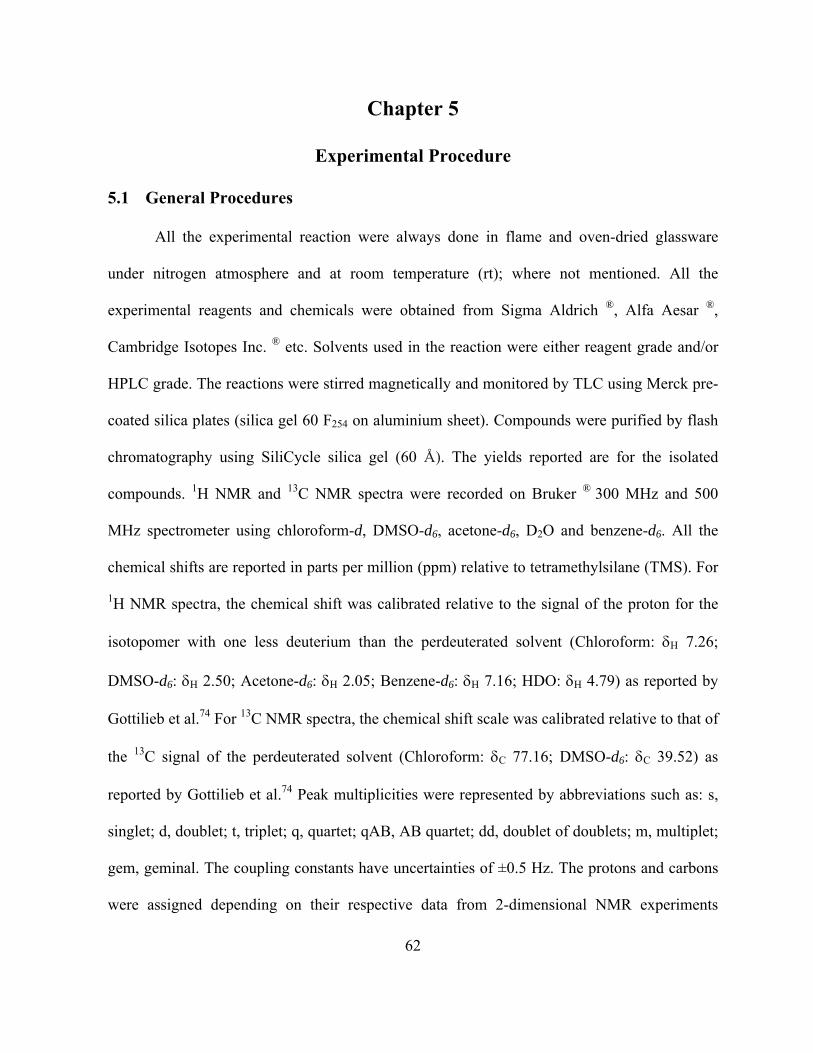
62
Chapter 5
Experimental Procedure
5.1 General Procedures
All the experimental reaction were always done in flame and oven-dried glassware
under nitrogen atmosphere and at room temperature (rt); where not mentioned. All the
experimental reagents and chemicals were obtained from Sigma Aldrich ®, Alfa Aesar ®,
Cambridge Isotopes Inc. ® etc. Solvents used in the reaction were either reagent grade and/or
HPLC grade. The reactions were stirred magnetically and monitored by TLC using Merck pre-
coated silica plates (silica gel 60 F254 on aluminium sheet). Compounds were purified by flash
chromatography using SiliCycle silica gel (60 Å). The yields reported are for the isolated
compounds. 1H NMR and 13C NMR spectra were recorded on Bruker ® 300 MHz and 500
MHz spectrometer using chloroform-d, DMSO-d6, acetone-d6, D2O and benzene-d6. All the
chemical shifts are reported in parts per million (ppm) relative to tetramethylsilane (TMS). For
1H NMR spectra, the chemical shift was calibrated relative to the signal of the proton for the
isotopomer with one less deuterium than the perdeuterated solvent (Chloroform: H 7.26;
DMSO-d6: H 2.50; Acetone-d6: H 2.05; Benzene-d6: H 7.16; HDO: H 4.79) as reported by
Gottilieb et al.74 For 13C NMR spectra, the chemical shift scale was calibrated relative to that of
the 13C signal of the perdeuterated solvent (Chloroform: C 77.16; DMSO-d6: C 39.52) as
reported by Gottilieb et al.74 Peak multiplicities were represented by abbreviations such as: s,
singlet; d, doublet; t, triplet; q, quartet; qAB, AB quartet; dd, doublet of doublets; m, multiplet;
gem, geminal. The coupling constants have uncertainties of ±0.5 Hz. The protons and carbons
were assigned depending on their respective data from 2-dimensional NMR experiments
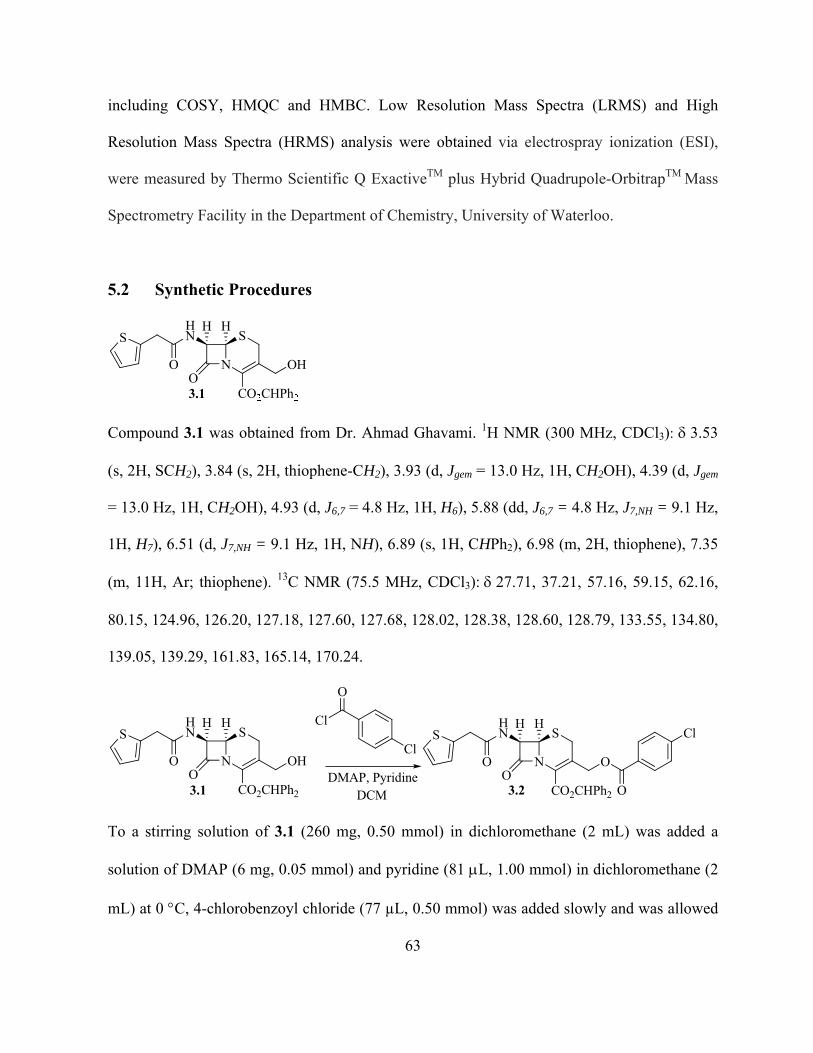
63
including COSY, HMQC and HMBC. Low Resolution Mass Spectra (LRMS) and High
Resolution Mass Spectra (HRMS) analysis were obtained via electrospray ionization (ESI),
were measured by Thermo Scientific Q ExactiveTM plus Hybrid Quadrupole-OrbitrapTM Mass
Spectrometry Facility in the Department of Chemistry, University of Waterloo.
5.2 Synthetic Procedures
Compound 3.1 was obtained from Dr. Ahmad Ghavami. 1H NMR (300 MHz, CDCl3): 3.53
(s, 2H, SCH2), 3.84 (s, 2H, thiophene-CH2), 3.93 (d, Jgem = 13.0 Hz, 1H, CH2OH), 4.39 (d, Jgem
= 13.0 Hz, 1H, CH2OH), 4.93 (d, J6,7 = 4.8 Hz, 1H, H6), 5.88 (dd, J6,7 = 4.8 Hz, J7,NH = 9.1 Hz,
1H, H7), 6.51 (d, J7,NH = 9.1 Hz, 1H, NH), 6.89 (s, 1H, CHPh2), 6.98 (m, 2H, thiophene), 7.35
(m, 11H, Ar; thiophene). 13C NMR (75.5 MHz, CDCl3):27.71, 37.21, 57.16, 59.15, 62.16,
80.15, 124.96, 126.20, 127.18, 127.60, 127.68, 128.02, 128.38, 128.60, 128.79, 133.55, 134.80,
139.05, 139.29, 161.83, 165.14, 170.24.
2 2 2 2
To a stirring solution of 3.1 (260 mg, 0.50 mmol) in dichloromethane (2 mL) was added a
solution of DMAP (6 mg, 0.05 mmol) and pyridine (81 L, 1.00 mmol) in dichloromethane (2
mL) at 0 C, 4-chlorobenzoyl chloride (77 µL, 0.50 mmol) was added slowly and was allowed
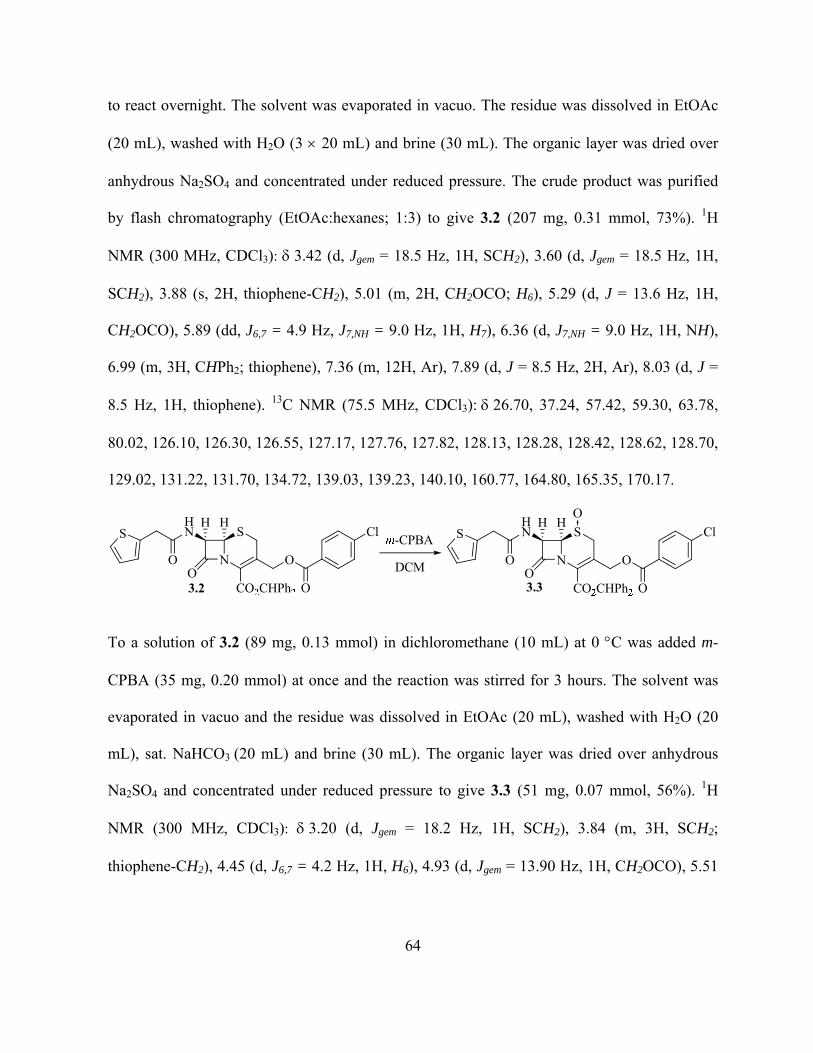
64
to react overnight. The solvent was evaporated in vacuo. The residue was dissolved in EtOAc
(20 mL), washed with H2O (3 20 mL) and brine (30 mL). The organic layer was dried over
anhydrous Na2SO4 and concentrated under reduced pressure. The crude product was purified
by flash chromatography (EtOAc:hexanes; 1:3) to give 3.2 (207 mg, 0.31 mmol, 73%). 1H
NMR (300 MHz, CDCl3): 3.42 (d, Jgem = 18.5 Hz, 1H, SCH2), 3.60 (d, Jgem = 18.5 Hz, 1H,
SCH2), 3.88 (s, 2H, thiophene-CH2), 5.01 (m, 2H, CH2OCO; H6), 5.29 (d, J = 13.6 Hz, 1H,
CH2OCO), 5.89 (dd, J6,7 = 4.9 Hz, J7,NH = 9.0 Hz, 1H, H7), 6.36 (d, J7,NH = 9.0 Hz, 1H, NH),
6.99 (m, 3H, CHPh2; thiophene), 7.36 (m, 12H, Ar), 7.89 (d, J = 8.5 Hz, 2H, Ar), 8.03 (d, J =
8.5 Hz, 1H, thiophene). 13C NMR (75.5 MHz, CDCl3):26.70, 37.24, 57.42, 59.30, 63.78,
80.02, 126.10, 126.30, 126.55, 127.17, 127.76, 127.82, 128.13, 128.28, 128.42, 128.62, 128.70,
129.02, 131.22, 131.70, 134.72, 139.03, 139.23, 140.10, 160.77, 164.80, 165.35, 170.17.
To a solution of 3.2 (89 mg, 0.13 mmol) in dichloromethane (10 mL) at 0 C was added m-
CPBA (35 mg, 0.20 mmol) at once and the reaction was stirred for 3 hours. The solvent was
evaporated in vacuo and the residue was dissolved in EtOAc (20 mL), washed with H2O (20
mL), sat. NaHCO3 (20 mL) and brine (30 mL). The organic layer was dried over anhydrous
Na2SO4 and concentrated under reduced pressure to give 3.3 (51 mg, 0.07 mmol, 56%). 1H
NMR (300 MHz, CDCl3): 3.20 (d, Jgem = 18.2 Hz, 1H, SCH2), 3.84 (m, 3H, SCH2;
thiophene-CH2), 4.45 (d, J6,7 = 4.2 Hz, 1H, H6), 4.93 (d, Jgem = 13.90 Hz, 1H, CH2OCO), 5.51
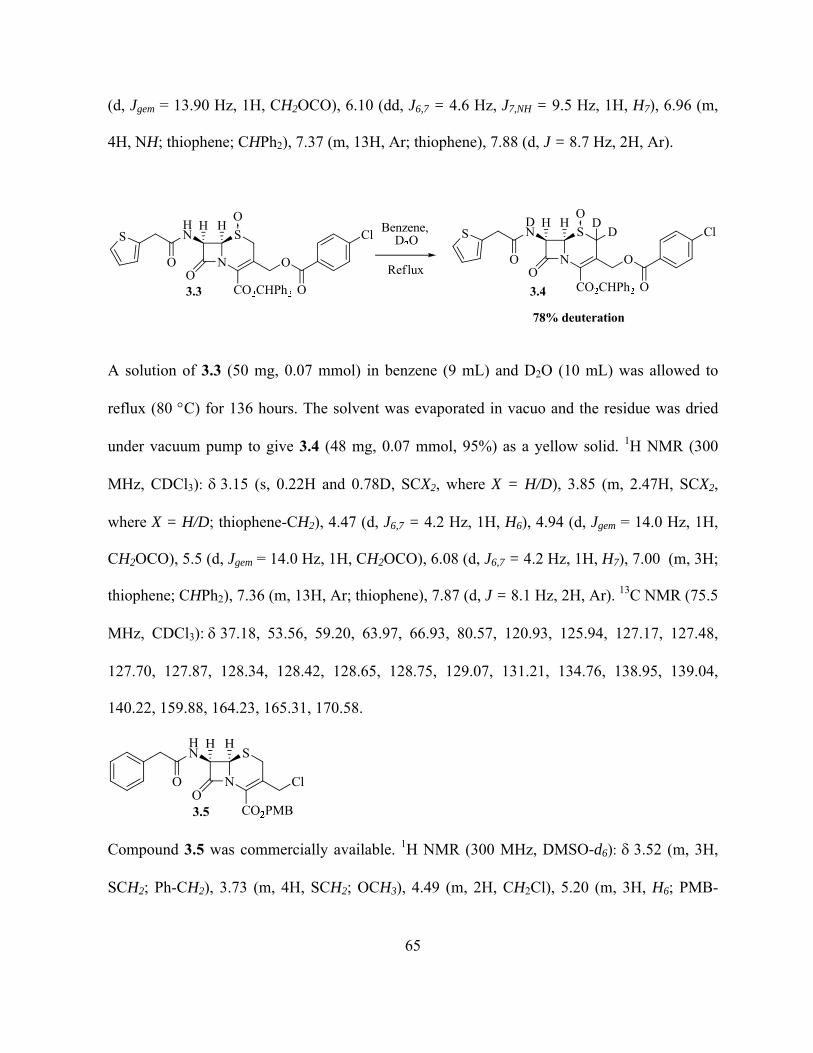
65
(d, Jgem = 13.90 Hz, 1H, CH2OCO), 6.10 (dd, J6,7 = 4.6 Hz, J7,NH = 9.5 Hz, 1H, H7), 6.96 (m,
4H, NH; thiophene; CHPh2), 7.37 (m, 13H, Ar; thiophene), 7.88 (d, J = 8.7 Hz, 2H, Ar).
A solution of 3.3 (50 mg, 0.07 mmol) in benzene (9 mL) and D2O (10 mL) was allowed to
reflux (80 C) for 136 hours. The solvent was evaporated in vacuo and the residue was dried
under vacuum pump to give 3.4 (48 mg, 0.07 mmol, 95%) as a yellow solid. 1H NMR (300
MHz, CDCl3): 3.15 (s, 0.22H and 0.78D, SCX2, where X = H/D), 3.85 (m, 2.47H, SCX2,
where X = H/D; thiophene-CH2), 4.47 (d, J6,7 = 4.2 Hz, 1H, H6), 4.94 (d, Jgem = 14.0 Hz, 1H,
CH2OCO), 5.5 (d, Jgem = 14.0 Hz, 1H, CH2OCO), 6.08 (d, J6,7 = 4.2 Hz, 1H, H7), 7.00 (m, 3H;
thiophene; CHPh2), 7.36 (m, 13H, Ar; thiophene), 7.87 (d, J = 8.1 Hz, 2H, Ar). 13C NMR (75.5
MHz, CDCl3):37.18, 53.56, 59.20, 63.97, 66.93, 80.57, 120.93, 125.94, 127.17, 127.48,
127.70, 127.87, 128.34, 128.42, 128.65, 128.75, 129.07, 131.21, 134.76, 138.95, 139.04,
140.22, 159.88, 164.23, 165.31, 170.58.
Compound 3.5 was commercially available. 1H NMR (300 MHz, DMSO-d6): 3.52 (m, 3H,
SCH2; Ph-CH2), 3.73 (m, 4H, SCH2; OCH3), 4.49 (m, 2H, CH2Cl), 5.20 (m, 3H, H6; PMB-
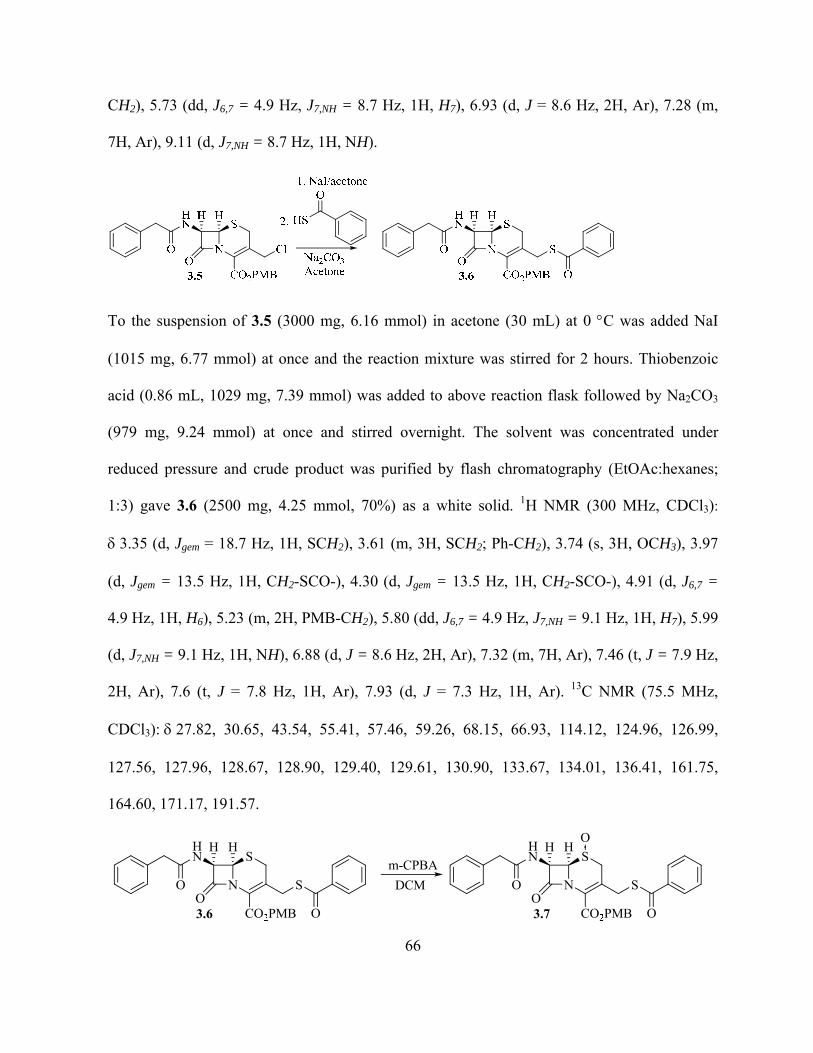
66
CH2), 5.73 (dd, J6,7 = 4.9 Hz, J7,NH = 8.7 Hz, 1H, H7), 6.93 (d, J = 8.6 Hz, 2H, Ar), 7.28 (m,
7H, Ar), 9.11 (d, J7,NH = 8.7 Hz, 1H, NH).
To the suspension of 3.5 (3000 mg, 6.16 mmol) in acetone (30 mL) at 0 C was added NaI
(1015 mg, 6.77 mmol) at once and the reaction mixture was stirred for 2 hours. Thiobenzoic
acid (0.86 mL, 1029 mg, 7.39 mmol) was added to above reaction flask followed by Na2CO3
(979 mg, 9.24 mmol) at once and stirred overnight. The solvent was concentrated under
reduced pressure and crude product was purified by flash chromatography (EtOAc:hexanes;
1:3) gave 3.6 (2500 mg, 4.25 mmol, 70%) as a white solid. 1H NMR (300 MHz, CDCl3):
3.35 (d, Jgem = 18.7 Hz, 1H, SCH2), 3.61 (m, 3H, SCH2; Ph-CH2), 3.74 (s, 3H, OCH3), 3.97
(d, Jgem = 13.5 Hz, 1H, CH2-SCO-), 4.30 (d, Jgem = 13.5 Hz, 1H, CH2-SCO-), 4.91 (d, J6,7 =
4.9 Hz, 1H, H6), 5.23 (m, 2H, PMB-CH2), 5.80 (dd, J6,7 = 4.9 Hz, J7,NH = 9.1 Hz, 1H, H7), 5.99
(d, J7,NH = 9.1 Hz, 1H, NH), 6.88 (d, J = 8.6 Hz, 2H, Ar), 7.32 (m, 7H, Ar), 7.46 (t, J = 7.9 Hz,
2H, Ar), 7.6 (t, J = 7.8 Hz, 1H, Ar), 7.93 (d, J = 7.3 Hz, 1H, Ar). 13C NMR (75.5 MHz,
CDCl3):27.82, 30.65, 43.54, 55.41, 57.46, 59.26, 68.15, 66.93, 114.12, 124.96, 126.99,
127.56, 127.96, 128.67, 128.90, 129.40, 129.61, 130.90, 133.67, 134.01, 136.41, 161.75,
164.60, 171.17, 191.57.

67
To a solution of 3.6 (588 mg, 1.00 mmol) in dichloromethane (15 mL) at 0 C was added m-
CPBA (292 mg, 1.30 mmol) at once and allowed to react for 3 hours gradually warm up to rt.
Upon completion the solvent was evaporated in vacuo and the residue was dissolved in EtOAc
(30 mL), washed with H2O (2 20 mL), sat. NaHCO3 (2 20 mL) and brine (2 30 mL). The
organic layer was dried over anhydrous Na2SO4 and concentrated under reduced pressure to
give 3.7 (519 mg, 0.86 mmol, 86%) as a white solid. 1H NMR (300 MHz, CDCl3): 3.30 (d,
Jgem = 18.5 Hz, 1H, SCH2), 3.61 (m, 2H, Ph-CH2), 3.78 (m, 4H, SCH2; OCH3), 3.94 (d, Jgem =
13.9 Hz, 1H, CH2-SCO-), 4.40 (dd†, J6,7 = 4.8 Hz, J = 1.5 Hz, 1H, H6), 4.47 (d, Jgem = 13.9 Hz,
1H, CH2-SCO-), 5.28 (m, 2H, PMB-CH2), 6.03 (dd, J6,7 = 4.8 Hz, J7,NH = 10.1 Hz, 1H, H7),
6.67 (d, J7,NH = 10.1 Hz, 1H, NH), 6.89 (d, J = 8.7 Hz, 2H, Ar), 7.32 (m, 7H, Ar), 7.46 (t, J =
7.7 Hz, 2H, Ar), 7.6 (t, J = 7.3 Hz, 1H, Ar), 7.91 (d, J = 7.4 Hz, 1H, Ar). 13C NMR (75.5 MHz,
CDCl3):30.81, 43.64, 47.40, 55.43, 59.33, 66.98, 68.45, 114.17, 122.56, 125.07, 127.60,
127.77, 128.93, 129.21, 129.49, 130.98, 133.73, 134.16, 160.13,164.08, 171.30, 203.58.
A solution of 3.7 (50 mg, 0.08 mmol) in benzene (10 mL) and D2O (5 mL) was allowed to
reflux (80 C) for 154 hours. The solvent was evaporated in vacuo and the residue was dried
under vacuum pump to give 3.8 (49 mg, 0.08 mmol, 99%). 1H NMR (300 MHz, CDCl3):
3.31 (d, J = 14.0 Hz, 0.72H and 0.28D, SCX2, where X= H/D), 3.62 (m, 2H, Ph-CH2), 3.81
† H6 may be showing a long range W-effect coupling with H2.
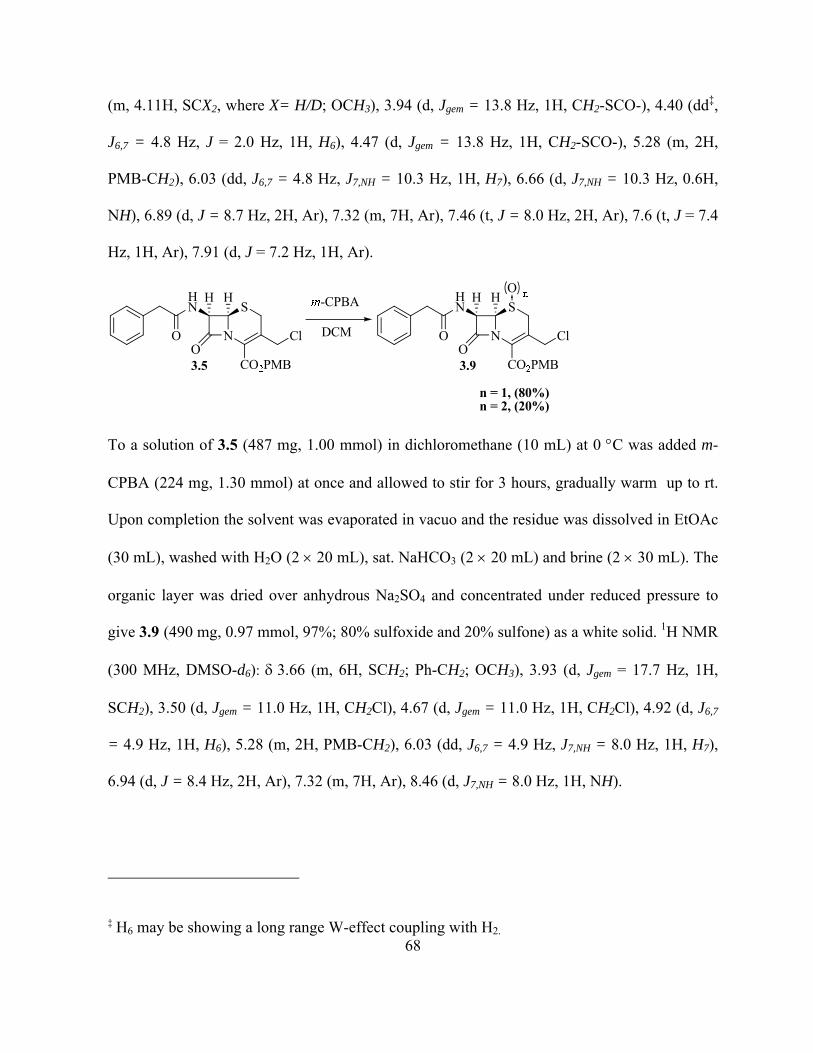
68
(m, 4.11H, SCX2, where X= H/D; OCH3), 3.94 (d, Jgem = 13.8 Hz, 1H, CH2-SCO-), 4.40 (dd‡,
J6,7 = 4.8 Hz, J = 2.0 Hz, 1H, H6), 4.47 (d, Jgem = 13.8 Hz, 1H, CH2-SCO-), 5.28 (m, 2H,
PMB-CH2), 6.03 (dd, J6,7 = 4.8 Hz, J7,NH = 10.3 Hz, 1H, H7), 6.66 (d, J7,NH = 10.3 Hz, 0.6H,
NH), 6.89 (d, J = 8.7 Hz, 2H, Ar), 7.32 (m, 7H, Ar), 7.46 (t, J = 8.0 Hz, 2H, Ar), 7.6 (t, J = 7.4
Hz, 1H, Ar), 7.91 (d, J = 7.2 Hz, 1H, Ar).
To a solution of 3.5 (487 mg, 1.00 mmol) in dichloromethane (10 mL) at 0 C was added m-
CPBA (224 mg, 1.30 mmol) at once and allowed to stir for 3 hours, gradually warm up to rt.
Upon completion the solvent was evaporated in vacuo and the residue was dissolved in EtOAc
(30 mL), washed with H2O (2 20 mL), sat. NaHCO3 (2 20 mL) and brine (2 30 mL). The
organic layer was dried over anhydrous Na2SO4 and concentrated under reduced pressure to
give 3.9 (490 mg, 0.97 mmol, 97%; 80% sulfoxide and 20% sulfone) as a white solid. 1H NMR
(300 MHz, DMSO-d6): 3.66 (m, 6H, SCH2; Ph-CH2; OCH3), 3.93 (d, Jgem = 17.7 Hz, 1H,
SCH2), 3.50 (d, Jgem = 11.0 Hz, 1H, CH2Cl), 4.67 (d, Jgem = 11.0 Hz, 1H, CH2Cl), 4.92 (d, J6,7
= 4.9 Hz, 1H, H6), 5.28 (m, 2H, PMB-CH2), 6.03 (dd, J6,7 = 4.9 Hz, J7,NH = 8.0 Hz, 1H, H7),
6.94 (d, J = 8.4 Hz, 2H, Ar), 7.32 (m, 7H, Ar), 8.46 (d, J7,NH = 8.0 Hz, 1H, NH).
‡ H6 may be showing a long range W-effect coupling with H2.
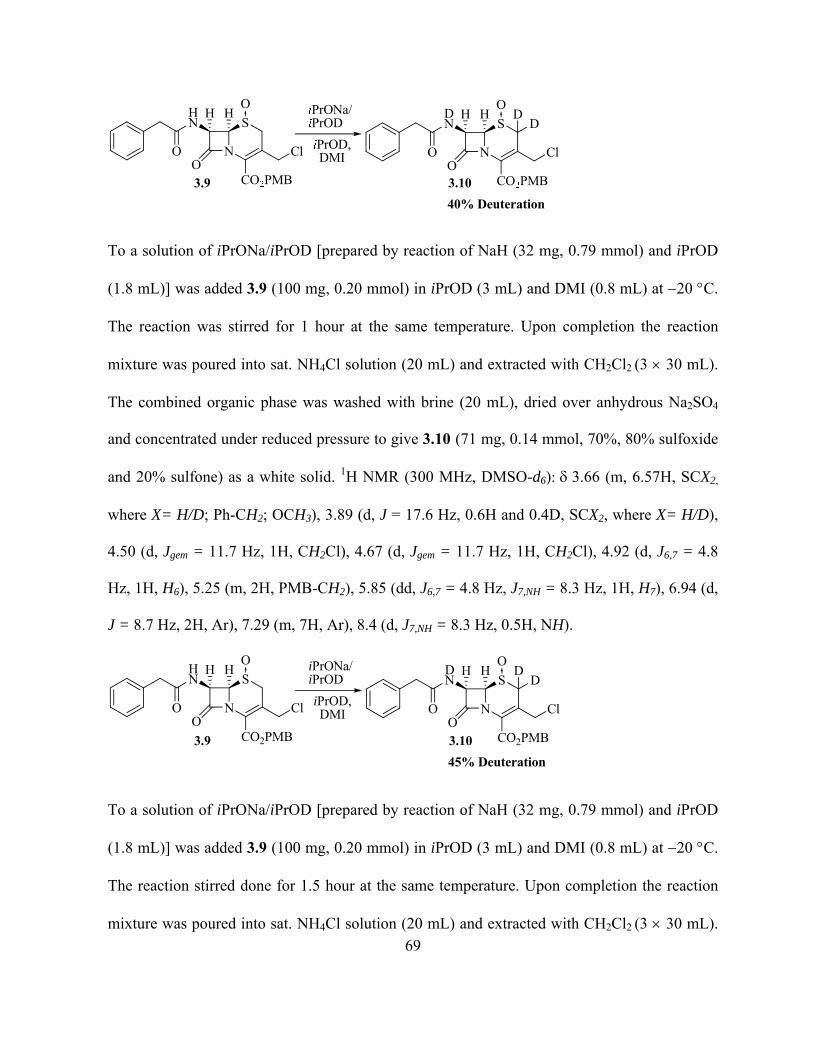
69
To a solution of iPrONa/iPrOD [prepared by reaction of NaH (32 mg, 0.79 mmol) and iPrOD
(1.8 mL)] was added 3.9 (100 mg, 0.20 mmol) in iPrOD (3 mL) and DMI (0.8 mL) at 20 C.
The reaction was stirred for 1 hour at the same temperature. Upon completion the reaction
mixture was poured into sat. NH4Cl solution (20 mL) and extracted with CH2Cl2 (3 30 mL).
The combined organic phase was washed with brine (20 mL), dried over anhydrous Na2SO4
and concentrated under reduced pressure to give 3.10 (71 mg, 0.14 mmol, 70%, 80% sulfoxide
and 20% sulfone) as a white solid. 1H NMR (300 MHz, DMSO-d6): 3.66 (m, 6.57H, SCX2,
where X= H/D; Ph-CH2; OCH3), 3.89 (d, J = 17.6 Hz, 0.6H and 0.4D, SCX2, where X= H/D),
4.50 (d, Jgem = 11.7 Hz, 1H, CH2Cl), 4.67 (d, Jgem = 11.7 Hz, 1H, CH2Cl), 4.92 (d, J6,7 = 4.8
Hz, 1H, H6), 5.25 (m, 2H, PMB-CH2), 5.85 (dd, J6,7 = 4.8 Hz, J7,NH = 8.3 Hz, 1H, H7), 6.94 (d,
J = 8.7 Hz, 2H, Ar), 7.29 (m, 7H, Ar), 8.4 (d, J7,NH = 8.3 Hz, 0.5H, NH).
2
ii
i
2
To a solution of iPrONa/iPrOD [prepared by reaction of NaH (32 mg, 0.79 mmol) and iPrOD
(1.8 mL)] was added 3.9 (100 mg, 0.20 mmol) in iPrOD (3 mL) and DMI (0.8 mL) at 20 C.
The reaction stirred done for 1.5 hour at the same temperature. Upon completion the reaction
mixture was poured into sat. NH4Cl solution (20 mL) and extracted with CH2Cl2 (3 30 mL).

70
The combined organic phase was washed with brine (20 mL), dried over anhydrous Na2SO4
and concentrated under reduced pressure to give 3.10 (60 mg, 0.11 mmol, 60%, 80% sulfoxide
and 20% sulfone) as a white solid. 1H NMR (300 MHz, DMSO-d6): 3.76 (m, 6.3H, SCX2,
where X= H/D; Ph-CH2; OCH3), 3.92 (d, J = 17.8 Hz, 0.55H and 0.45D, SCX2 where X= H/D),
4.50 (d, Jgem = 11.4 Hz, 1H, CH2Cl), 4.67 (d, Jgem = 11.4 Hz, 1H, CH2Cl), 4.92 (d, J6,7 = 4.9
Hz, 1H, H6), 5.25 (m, 2H, PMB-CH2), 5.85 (dd, J6,7 = 4.9 Hz, J7,NH = 8.3 Hz, 1H, H7), 6.94 (d,
J = 8.6 Hz, 2H, Ar), 7.34 (m, 7H, Ar), 8.4 (d, J7,NH = 8.3 Hz, 0.4H, NH).
To a solution of iPrONa/iPrOD [prepared by reaction of NaH (32 mg, 0.79 mmol) and iPrOD
(1.8 mL)] was added 3.9 (100 mg, 0.20 mmol) in iPrOD (3 mL) and DMI (0.8 mL) at 20 C.
The reaction was stirred for 2 hour at the same temperature. Upon completion the reaction
mixture was poured into sat. NH4Cl solution (20 mL) and extracted with CH2Cl2 (3 30 mL).
The combined organic phase was washed with brine (20 mL), dried over anhydrous Na2SO4
and concentrated under reduced pressure to give 3.10 (60 mg, 0.11 mmol, 60%, 80% sulfoxide
and 20% sulfone) as white solid. 1H NMR (300 MHz, DMSO-d6): 3.65 (m, 6.5H, SCX2,
where X= H/D; Ph-CH2; OCH3), 3.92 (d, J = 17.8 Hz, 0.5H and 0.5D, SCX2, where X= H/D),
4.50 (d, Jgem = 11.4 Hz, 1H, CH2Cl), 4.67 (d, Jgem = 11.4 Hz, 1H, CH2Cl), 4.93 (d, J6,7 = 4.6
Hz, 1H, H6), 5.25 (m, 2H, PMB-CH2), 5.85 (dd, J6,7 = 4.9 Hz, J7,NH = 8.2 Hz, 1H, H7), 6.94 (d,
J = 8.6 Hz, 2H, Ar), 7.29 (m, 7H, Ar), 8.4 (d, J7,NH = 8.2 Hz, 0.3H, NH).
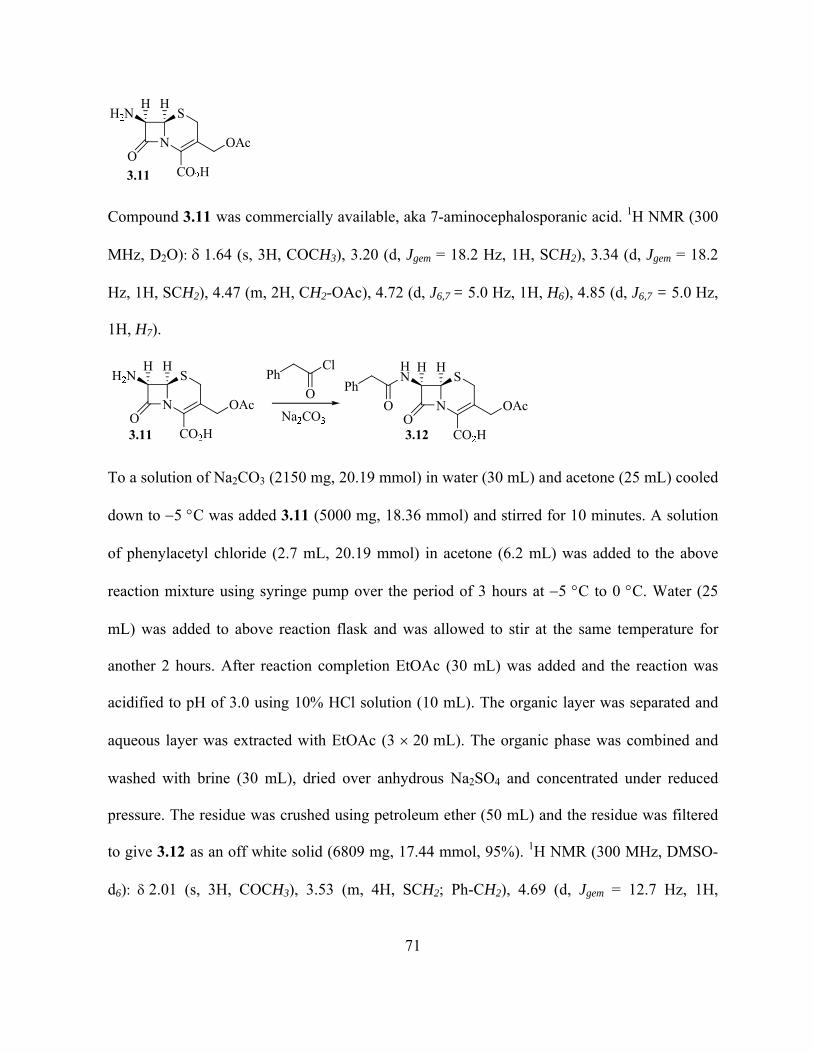
71
Compound 3.11 was commercially available, aka 7-aminocephalosporanic acid. 1H NMR (300
MHz, D2O): 1.64 (s, 3H, COCH3), 3.20 (d, Jgem = 18.2 Hz, 1H, SCH2), 3.34 (d, Jgem = 18.2
Hz, 1H, SCH2), 4.47 (m, 2H, CH2-OAc), 4.72 (d, J6,7 = 5.0 Hz, 1H, H6), 4.85 (d, J6,7 = 5.0 Hz,
1H, H7).
To a solution of Na2CO3 (2150 mg, 20.19 mmol) in water (30 mL) and acetone (25 mL) cooled
down to 5 C was added 3.11 (5000 mg, 18.36 mmol) and stirred for 10 minutes. A solution
of phenylacetyl chloride (2.7 mL, 20.19 mmol) in acetone (6.2 mL) was added to the above
reaction mixture using syringe pump over the period of 3 hours at 5 C to 0 C. Water (25
mL) was added to above reaction flask and was allowed to stir at the same temperature for
another 2 hours. After reaction completion EtOAc (30 mL) was added and the reaction was
acidified to pH of 3.0 using 10% HCl solution (10 mL). The organic layer was separated and
aqueous layer was extracted with EtOAc (3 mL). The organic phase was combined and
washed with brine (30 mL), dried over anhydrous Na2SO4 and concentrated under reduced
pressure. The residue was crushed using petroleum ether (50 mL) and the residue was filtered
to give 3.12 as an off white solid (6809 mg, 17.44 mmol, 95%). 1H NMR (300 MHz, DMSO-
d6): 2.01 (s, 3H, COCH3), 3.53 (m, 4H, SCH2; Ph-CH2), 4.69 (d, Jgem = 12.7 Hz, 1H,
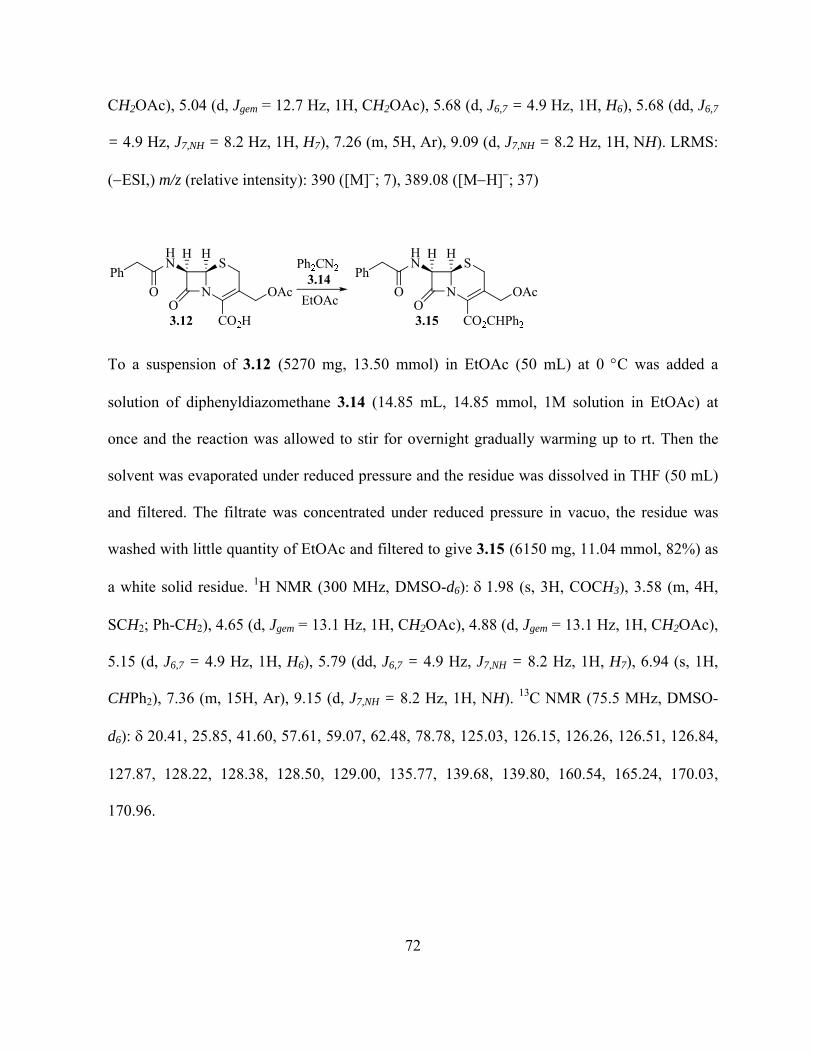
72
CH2OAc), 5.04 (d, Jgem = 12.7 Hz, 1H, CH2OAc), 5.68 (d, J6,7 = 4.9 Hz, 1H, H6), 5.68 (dd, J6,7
= 4.9 Hz, J7,NH = 8.2 Hz, 1H, H7), 7.26 (m, 5H, Ar), 9.09 (d, J7,NH = 8.2 Hz, 1H, NH). LRMS:
(ESI,) m/z (relative intensity): 390 ([M]; 7), 389.08 ([MH]; 37)
To a suspension of 3.12 (5270 mg, 13.50 mmol) in EtOAc (50 mL) at 0 C was added a
solution of diphenyldiazomethane 3.14 (14.85 mL, 14.85 mmol, 1M solution in EtOAc) at
once and the reaction was allowed to stir for overnight gradually warming up to rt. Then the
solvent was evaporated under reduced pressure and the residue was dissolved in THF (50 mL)
and filtered. The filtrate was concentrated under reduced pressure in vacuo, the residue was
washed with little quantity of EtOAc and filtered to give 3.15 (6150 mg, 11.04 mmol, 82%) as
a white solid residue. 1H NMR (300 MHz, DMSO-d6): 1.98 (s, 3H, COCH3), 3.58 (m, 4H,
SCH2; Ph-CH2), 4.65 (d, Jgem = 13.1 Hz, 1H, CH2OAc), 4.88 (d, Jgem = 13.1 Hz, 1H, CH2OAc),
5.15 (d, J6,7 = 4.9 Hz, 1H, H6), 5.79 (dd, J6,7 = 4.9 Hz, J7,NH = 8.2 Hz, 1H, H7), 6.94 (s, 1H,
CHPh2), 7.36 (m, 15H, Ar), 9.15 (d, J7,NH = 8.2 Hz, 1H, NH). 13C NMR (75.5 MHz, DMSO-
d6): 20.41, 25.85, 41.60, 57.61, 59.07, 62.48, 78.78, 125.03, 126.15, 126.26, 126.51, 126.84,
127.87, 128.22, 128.38, 128.50, 129.00, 135.77, 139.68, 139.80, 160.54, 165.24, 170.03,
170.96.

73
To a solution of 3.15 (2000 mg, 3.59 mmol) in dichloromethane (15 mL) at 0 C was added m-
CPBA (965 mg, 1.20 mmol) at once and was gradually warmed to rt in 3 hours. Upon
completion the solvent was evaporated in vacuo and the residue was dissolved in EtOAc (30
mL), washed with water (2 30 mL), sat. NaHCO3 (3 30 mL) and brine (2 30 mL). The
organic layer was dried over anhydrous Na2SO4 and concentrated under reduced pressure.
Flash chromatography (EtOAc:hexane; 1:2) to give 3.16 (1880 mg, 3.12 mmol, 87%) as a
white solid. 1H NMR (300 MHz, DMSO-d6): 1.97 (s, 3H, COCH3), 3.64 (m, 3H, SCH2; Ph-
CH2), 3.96 (d, Jgem = 18.7 Hz, 1H, SCH2), 4.61 (d, Jgem = 13.4 Hz, 1H, CH2OAc), 4.93 (d, J6,7
= 4.3 Hz, 1H, H6), 5.06 (d, Jgem = 13.4 Hz, 1H, CH2OAc), 5.93 (dd, J6,7 = 4.3 Hz, J7,NH = 8.3
Hz, 1H, H7), 6.95 (s, 1H, CHPh2), 7.33 (m, 15H, Ar) and 8.44 (d, J7,NH = 8.3 Hz, 1H, NH). 13C
NMR (75.5 MHz, DMSO-d6):20.48, 41.48, 45.47, 58.09, 62.79, 66.49, 79.08, 121.69,
124.38, 126.55, 126.81, 127.85, 127.92, 128.30, 128.38, 128.54, 129.11, 135.78, 139.78,
159.80, 164.58, 170.00, 171.12.
Compound 3.16 (50 mg, 0.09 mmol) was dissolved in a mixture of DMSO-d6 (1000 µL) and
methanol-d4 (36 µL, 0.88 mmol). The mixture was stirred for 90 minutes at 50 C. The solvent
was evaporated under high vacuum and small aliquot was used to do NMR and then returned
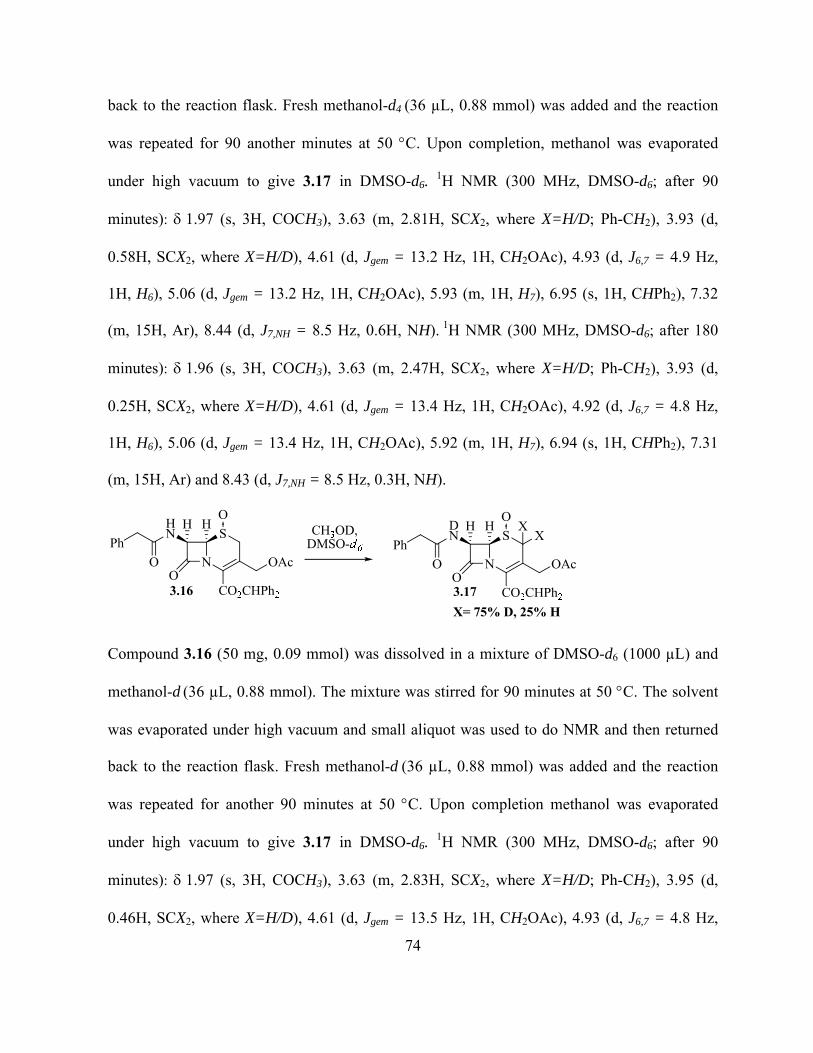
74
back to the reaction flask. Fresh methanol-d4 (36 µL, 0.88 mmol) was added and the reaction
was repeated for 90 another minutes at 50 C. Upon completion, methanol was evaporated
under high vacuum to give 3.17 in DMSO-d6. 1H NMR (300 MHz, DMSO-d6; after 90
minutes): 1.97 (s, 3H, COCH3), 3.63 (m, 2.81H, SCX2, where X=H/D; Ph-CH2), 3.93 (d,
0.58H, SCX2, where X=H/D), 4.61 (d, Jgem = 13.2 Hz, 1H, CH2OAc), 4.93 (d, J6,7 = 4.9 Hz,
1H, H6), 5.06 (d, Jgem = 13.2 Hz, 1H, CH2OAc), 5.93 (m, 1H, H7), 6.95 (s, 1H, CHPh2), 7.32
(m, 15H, Ar), 8.44 (d, J7,NH = 8.5 Hz, 0.6H, NH). 1H NMR (300 MHz, DMSO-d6; after 180
minutes): 1.96 (s, 3H, COCH3), 3.63 (m, 2.47H, SCX2, where X=H/D; Ph-CH2), 3.93 (d,
0.25H, SCX2, where X=H/D), 4.61 (d, Jgem = 13.4 Hz, 1H, CH2OAc), 4.92 (d, J6,7 = 4.8 Hz,
1H, H6), 5.06 (d, Jgem = 13.4 Hz, 1H, CH2OAc), 5.92 (m, 1H, H7), 6.94 (s, 1H, CHPh2), 7.31
(m, 15H, Ar) and 8.43 (d, J7,NH = 8.5 Hz, 0.3H, NH).
Compound 3.16 (50 mg, 0.09 mmol) was dissolved in a mixture of DMSO-d6 (1000 µL) and
methanol-d (36 µL, 0.88 mmol). The mixture was stirred for 90 minutes at 50 C. The solvent
was evaporated under high vacuum and small aliquot was used to do NMR and then returned
back to the reaction flask. Fresh methanol-d (36 µL, 0.88 mmol) was added and the reaction
was repeated for another 90 minutes at 50 C. Upon completion methanol was evaporated
under high vacuum to give 3.17 in DMSO-d6. 1H NMR (300 MHz, DMSO-d6; after 90
minutes): 1.97 (s, 3H, COCH3), 3.63 (m, 2.83H, SCX2, where X=H/D; Ph-CH2), 3.95 (d,
0.46H, SCX2, where X=H/D), 4.61 (d, Jgem = 13.5 Hz, 1H, CH2OAc), 4.93 (d, J6,7 = 4.8 Hz,
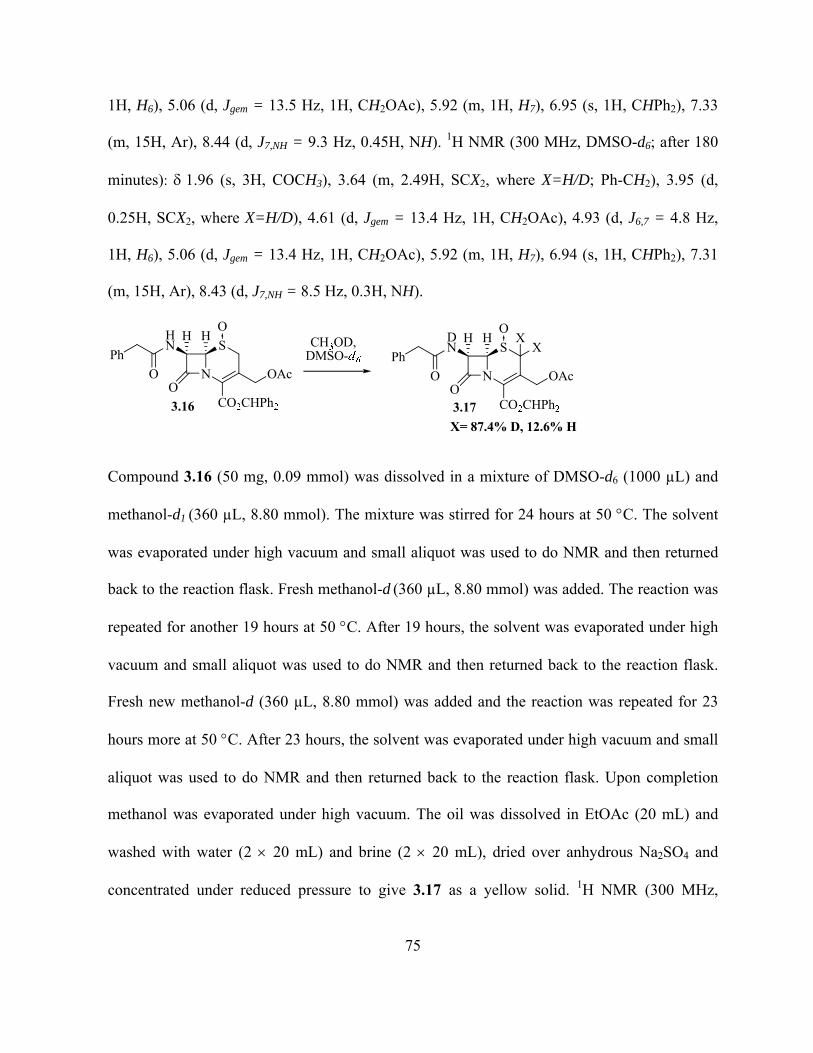
75
1H, H6), 5.06 (d, Jgem = 13.5 Hz, 1H, CH2OAc), 5.92 (m, 1H, H7), 6.95 (s, 1H, CHPh2), 7.33
(m, 15H, Ar), 8.44 (d, J7,NH = 9.3 Hz, 0.45H, NH). 1H NMR (300 MHz, DMSO-d6; after 180
minutes): 1.96 (s, 3H, COCH3), 3.64 (m, 2.49H, SCX2, where X=H/D; Ph-CH2), 3.95 (d,
0.25H, SCX2, where X=H/D), 4.61 (d, Jgem = 13.4 Hz, 1H, CH2OAc), 4.93 (d, J6,7 = 4.8 Hz,
1H, H6), 5.06 (d, Jgem = 13.4 Hz, 1H, CH2OAc), 5.92 (m, 1H, H7), 6.94 (s, 1H, CHPh2), 7.31
(m, 15H, Ar), 8.43 (d, J7,NH = 8.5 Hz, 0.3H, NH).
Compound 3.16 (50 mg, 0.09 mmol) was dissolved in a mixture of DMSO-d6 (1000 µL) and
methanol-d1 (360 µL, 8.80 mmol). The mixture was stirred for 24 hours at 50 C. The solvent
was evaporated under high vacuum and small aliquot was used to do NMR and then returned
back to the reaction flask. Fresh methanol-d (360 µL, 8.80 mmol) was added. The reaction was
repeated for another 19 hours at 50 C. After 19 hours, the solvent was evaporated under high
vacuum and small aliquot was used to do NMR and then returned back to the reaction flask.
Fresh new methanol-d (360 µL, 8.80 mmol) was added and the reaction was repeated for 23
hours more at 50 C. After 23 hours, the solvent was evaporated under high vacuum and small
aliquot was used to do NMR and then returned back to the reaction flask. Upon completion
methanol was evaporated under high vacuum. The oil was dissolved in EtOAc (20 mL) and
washed with water (2 20 mL) and brine (2 20 mL), dried over anhydrous Na2SO4 and
concentrated under reduced pressure to give 3.17 as a yellow solid. 1H NMR (300 MHz,
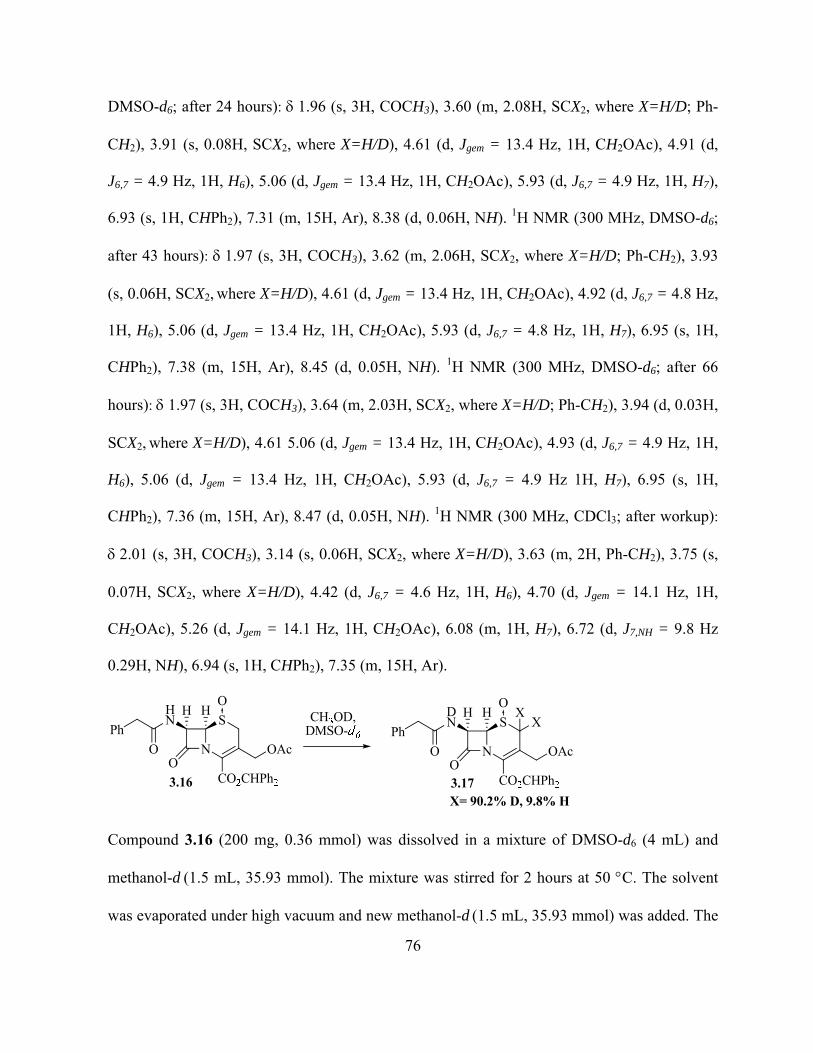
76
DMSO-d6; after 24 hours): 1.96 (s, 3H, COCH3), 3.60 (m, 2.08H, SCX2, where X=H/D; Ph-
CH2), 3.91 (s, 0.08H, SCX2, where X=H/D), 4.61 (d, Jgem = 13.4 Hz, 1H, CH2OAc), 4.91 (d,
J6,7 = 4.9 Hz, 1H, H6), 5.06 (d, Jgem = 13.4 Hz, 1H, CH2OAc), 5.93 (d, J6,7 = 4.9 Hz, 1H, H7),
6.93 (s, 1H, CHPh2), 7.31 (m, 15H, Ar), 8.38 (d, 0.06H, NH). 1H NMR (300 MHz, DMSO-d6;
after 43 hours): 1.97 (s, 3H, COCH3), 3.62 (m, 2.06H, SCX2, where X=H/D; Ph-CH2), 3.93
(s, 0.06H, SCX2, where X=H/D), 4.61 (d, Jgem = 13.4 Hz, 1H, CH2OAc), 4.92 (d, J6,7 = 4.8 Hz,
1H, H6), 5.06 (d, Jgem = 13.4 Hz, 1H, CH2OAc), 5.93 (d, J6,7 = 4.8 Hz, 1H, H7), 6.95 (s, 1H,
CHPh2), 7.38 (m, 15H, Ar), 8.45 (d, 0.05H, NH). 1H NMR (300 MHz, DMSO-d6; after 66
hours): 1.97 (s, 3H, COCH3), 3.64 (m, 2.03H, SCX2, where X=H/D; Ph-CH2), 3.94 (d, 0.03H,
SCX2, where X=H/D), 4.61 5.06 (d, Jgem = 13.4 Hz, 1H, CH2OAc), 4.93 (d, J6,7 = 4.9 Hz, 1H,
H6), 5.06 (d, Jgem = 13.4 Hz, 1H, CH2OAc), 5.93 (d, J6,7 = 4.9 Hz 1H, H7), 6.95 (s, 1H,
CHPh2), 7.36 (m, 15H, Ar), 8.47 (d, 0.05H, NH). 1H NMR (300 MHz, CDCl3; after workup):
2.01 (s, 3H, COCH3), 3.14 (s, 0.06H, SCX2, where X=H/D), 3.63 (m, 2H, Ph-CH2), 3.75 (s,
0.07H, SCX2, where X=H/D), 4.42 (d, J6,7 = 4.6 Hz, 1H, H6), 4.70 (d, Jgem = 14.1 Hz, 1H,
CH2OAc), 5.26 (d, Jgem = 14.1 Hz, 1H, CH2OAc), 6.08 (m, 1H, H7), 6.72 (d, J7,NH = 9.8 Hz
0.29H, NH), 6.94 (s, 1H, CHPh2), 7.35 (m, 15H, Ar).
Compound 3.16 (200 mg, 0.36 mmol) was dissolved in a mixture of DMSO-d6 (4 mL) and
methanol-d (1.5 mL, 35.93 mmol). The mixture was stirred for 2 hours at 50 C. The solvent
was evaporated under high vacuum and new methanol-d (1.5 mL, 35.93 mmol) was added. The
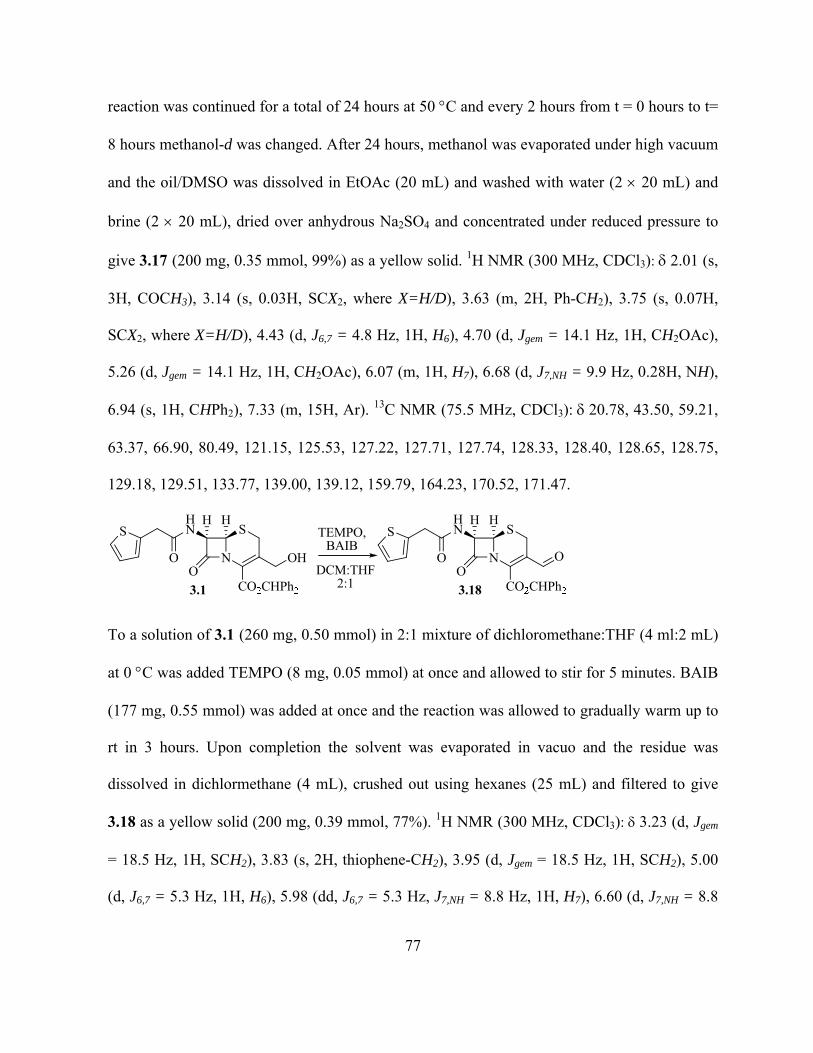
77
reaction was continued for a total of 24 hours at 50 C and every 2 hours from t = 0 hours to t=
8 hours methanol-d was changed. After 24 hours, methanol was evaporated under high vacuum
and the oil/DMSO was dissolved in EtOAc (20 mL) and washed with water (2 20 mL) and
brine (2 20 mL), dried over anhydrous Na2SO4 and concentrated under reduced pressure to
give 3.17 (200 mg, 0.35 mmol, 99%) as a yellow solid. 1H NMR (300 MHz, CDCl3): 2.01 (s,
3H, COCH3), 3.14 (s, 0.03H, SCX2, where X=H/D), 3.63 (m, 2H, Ph-CH2), 3.75 (s, 0.07H,
SCX2, where X=H/D), 4.43 (d, J6,7 = 4.8 Hz, 1H, H6), 4.70 (d, Jgem = 14.1 Hz, 1H, CH2OAc),
5.26 (d, Jgem = 14.1 Hz, 1H, CH2OAc), 6.07 (m, 1H, H7), 6.68 (d, J7,NH = 9.9 Hz, 0.28H, NH),
6.94 (s, 1H, CHPh2), 7.33 (m, 15H, Ar). 13C NMR (75.5 MHz, CDCl3):20.78, 43.50, 59.21,
63.37, 66.90, 80.49, 121.15, 125.53, 127.22, 127.71, 127.74, 128.33, 128.40, 128.65, 128.75,
129.18, 129.51, 133.77, 139.00, 139.12, 159.79, 164.23, 170.52, 171.47.
To a solution of 3.1 (260 mg, 0.50 mmol) in 2:1 mixture of dichloromethane:THF (4 ml:2 mL)
at 0 C was added TEMPO (8 mg, 0.05 mmol) at once and allowed to stir for 5 minutes. BAIB
(177 mg, 0.55 mmol) was added at once and the reaction was allowed to gradually warm up to
rt in 3 hours. Upon completion the solvent was evaporated in vacuo and the residue was
dissolved in dichlormethane (4 mL), crushed out using hexanes (25 mL) and filtered to give
3.18 as a yellow solid (200 mg, 0.39 mmol, 77%). 1H NMR (300 MHz, CDCl3): 3.23 (d, Jgem
= 18.5 Hz, 1H, SCH2), 3.83 (s, 2H, thiophene-CH2), 3.95 (d, Jgem = 18.5 Hz, 1H, SCH2), 5.00
(d, J6,7 = 5.3 Hz, 1H, H6), 5.98 (dd, J6,7 = 5.3 Hz, J7,NH = 8.8 Hz, 1H, H7), 6.60 (d, J7,NH = 8.8
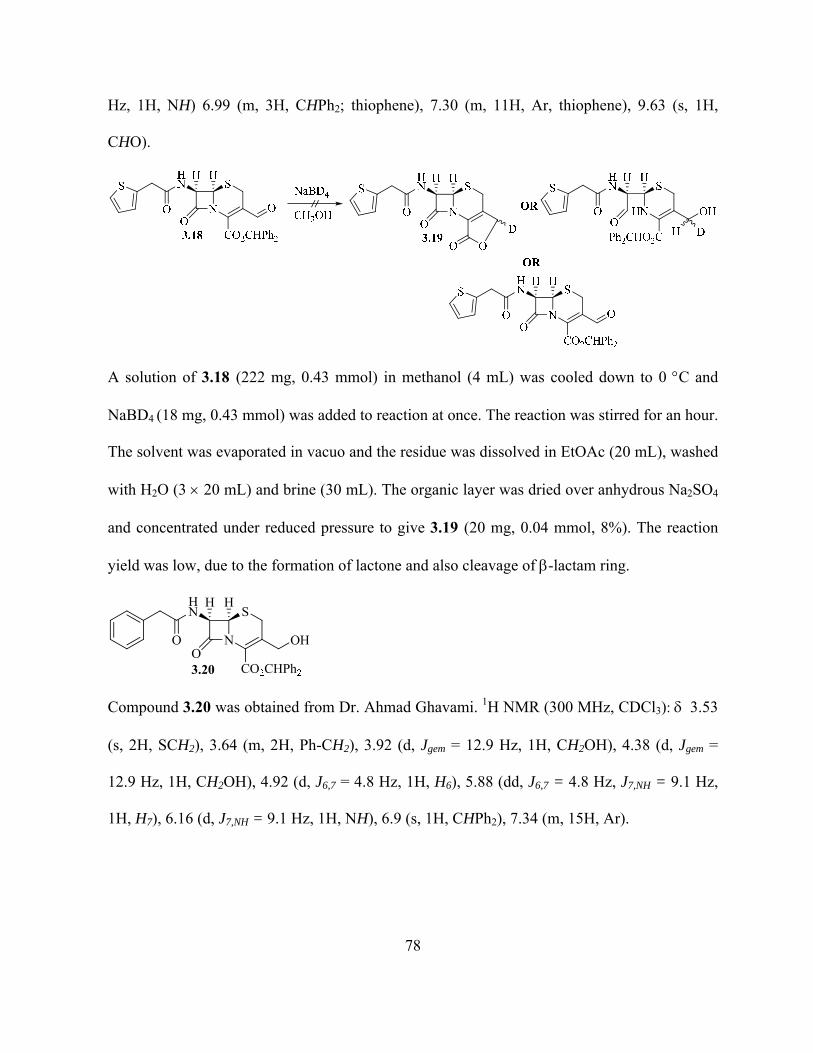
78
Hz, 1H, NH) 6.99 (m, 3H, CHPh2; thiophene), 7.30 (m, 11H, Ar, thiophene), 9.63 (s, 1H,
CHO).
A solution of 3.18 (222 mg, 0.43 mmol) in methanol (4 mL) was cooled down to 0 C and
NaBD4 (18 mg, 0.43 mmol) was added to reaction at once. The reaction was stirred for an hour.
The solvent was evaporated in vacuo and the residue was dissolved in EtOAc (20 mL), washed
with H2O (3 20 mL) and brine (30 mL). The organic layer was dried over anhydrous Na2SO4
and concentrated under reduced pressure to give 3.19 (20 mg, 0.04 mmol, 8%). The reaction
yield was low, due to the formation of lactone and also cleavage of -lactam ring.
Compound 3.20 was obtained from Dr. Ahmad Ghavami. 1H NMR (300 MHz, CDCl3): 3.53
(s, 2H, SCH2), 3.64 (m, 2H, Ph-CH2), 3.92 (d, Jgem = 12.9 Hz, 1H, CH2OH), 4.38 (d, Jgem =
12.9 Hz, 1H, CH2OH), 4.92 (d, J6,7 = 4.8 Hz, 1H, H6), 5.88 (dd, J6,7 = 4.8 Hz, J7,NH = 9.1 Hz,
1H, H7), 6.16 (d, J7,NH = 9.1 Hz, 1H, NH), 6.9 (s, 1H, CHPh2), 7.34 (m, 15H, Ar).
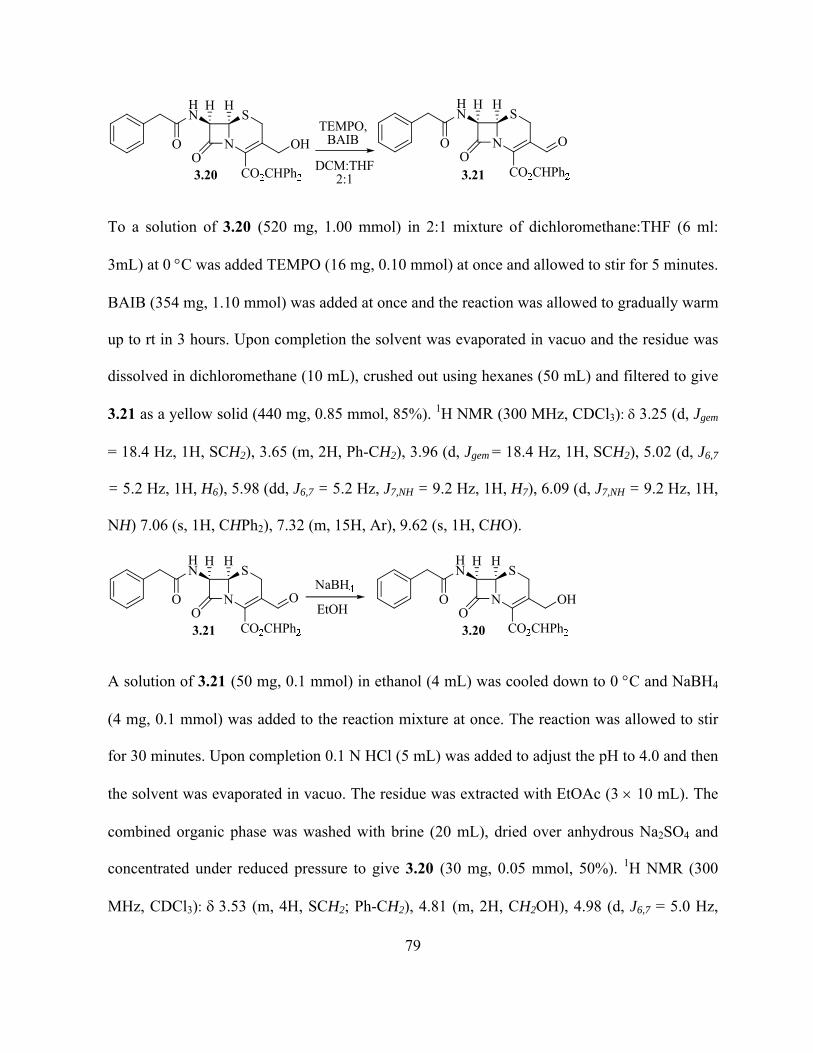
79
To a solution of 3.20 (520 mg, 1.00 mmol) in 2:1 mixture of dichloromethane:THF (6 ml:
3mL) at 0 C was added TEMPO (16 mg, 0.10 mmol) at once and allowed to stir for 5 minutes.
BAIB (354 mg, 1.10 mmol) was added at once and the reaction was allowed to gradually warm
up to rt in 3 hours. Upon completion the solvent was evaporated in vacuo and the residue was
dissolved in dichloromethane (10 mL), crushed out using hexanes (50 mL) and filtered to give
3.21 as a yellow solid (440 mg, 0.85 mmol, 85%). 1H NMR (300 MHz, CDCl3): 3.25 (d, Jgem
= 18.4 Hz, 1H, SCH2), 3.65 (m, 2H, Ph-CH2), 3.96 (d, Jgem = 18.4 Hz, 1H, SCH2), 5.02 (d, J6,7
= 5.2 Hz, 1H, H6), 5.98 (dd, J6,7 = 5.2 Hz, J7,NH = 9.2 Hz, 1H, H7), 6.09 (d, J7,NH = 9.2 Hz, 1H,
NH) 7.06 (s, 1H, CHPh2), 7.32 (m, 15H, Ar), 9.62 (s, 1H, CHO).
A solution of 3.21 (50 mg, 0.1 mmol) in ethanol (4 mL) was cooled down to 0 C and NaBH4
(4 mg, 0.1 mmol) was added to the reaction mixture at once. The reaction was allowed to stir
for 30 minutes. Upon completion 0.1 N HCl (5 mL) was added to adjust the pH to 4.0 and then
the solvent was evaporated in vacuo. The residue was extracted with EtOAc (3 10 mL). The
combined organic phase was washed with brine (20 mL), dried over anhydrous Na2SO4 and
concentrated under reduced pressure to give 3.20 (30 mg, 0.05 mmol, 50%). 1H NMR (300
MHz, CDCl3): 3.53 (m, 4H, SCH2; Ph-CH2), 4.81 (m, 2H, CH2OH), 4.98 (d, J6,7 = 5.0 Hz,

80
1H, H6), 5.91 (dd, J6,7 = 5.0 Hz, J7,NH = 8.5 Hz, 1H, H7), 6.16 (d, J7,NH = 8.5 Hz, 1H, NH), 7.28
(m, 16H, CHPh2; Ar).
To the solution of benzaldehyde 3.22 (250 mg, 2.35 mmol) in ethanol (5 mL) was added
NaBH4 (89 mg, 2.35 mmol) at once and allowed to react for 15 minutes. Upon completion the
reaction was acidified to pH of 3.0 using acetic acid (3 mL). The solvent was evaporated in
vacuo and the residue was extracted with EtOAc (3 10 mL). The combined organic phase
was washed with brine (20 mL), dried over anhydrous Na2SO4 and concentrated under reduced
pressure to give 3.23 (236 mg, 2.18 mmol, 92%) as colourless oil. 1H NMR (300 MHz,
DMSO-d6): 5.1 (s, 2H, CH2OH), 7.79 (m, 5H, Ar). 13C NMR (75.5 MHz, DMSO-d6):
65.16, 127.05, 127.65, 128.57.
To the solution of benzaldehyde 3.22 (250 mg, 2.35 mmol) in ethanol (5 mL) was added
NaBD4 (99 mg, 2.35 mmol) at once and allowed to react for 15 minutes. Upon completion the
reaction was acidified to pH of 3.0 using acetic acid (3 mL). The solvent was evaporated in
vacuo and the residue was extracted with EtOAc (3 10 mL). The combined organic phase
was washed with brine (20 mL), dried over anhydrous Na2SO4 and concentrated under reduced
pressure to give 3.24 (218 mg, 2.0 mmol, 85%) as colourless oil. 1H NMR (300 MHz, DMSO-

81
d6): 4.15 (s, 1H, CDHOH), (s, 1H, CDHOH), 7.83 (m, 5H, Ar). 13C NMR (75.5 MHz,
DMSO-d6): 64.30, 64.60, 64.88 (t, 1C, CDHOH), 127.00, 127.50, 128.45.
.
To a suspension of 3.11 (12000 mg, 44.06 mmol) in methanol (120 mL) and water (120 mL) at
30 C was added, aqueous NaOH (2650 mg, 66.09 mmol) in water (10 mL) dropwise over a
period of 30 minutes. The reaction was allowed to stir at same temperature of extra 30 minutes.
The pH was adjusted to 3.0 by adding conc. HCl (10 mL). Upon acidification the solution was
filtered and washed with methanol and acetone several times to give 3.25 (8000 mg, 34.74
mmol, 80%) as a yellow solid. 1H NMR (300 MHz, D2O): 3.53 (d, Jgem = 18.6 Hz, 1H,
SCH2), 3.67 (d, Jgem = 18.6 Hz, 1H, SCH2), 4.98 (d, J6,7 = 5.1 Hz, 1H, H6), 5.04 (d, J6,7 = 5.1
Hz, 1H, H7), Peak for CH2OH under solvent peak.
To a solution of 3.25 (7000 mg, 34.74 mmol) in DMF (80 mL) at rt was added, BSA (18.78
mL, 76 mmol) at once and was allowed to stir for 30 minutes, this was then cooled down to
40 C. Phenylacetyl chloride (6.04 mL, 52.11 mmol) was added drop wise to above reaction
mixture and it was stirred for 3 hours at 40 C. Upon completion the reaction was poured into
ice cold H2O (50 mL) and extracted with EtOAc (4 80 mL). The combined organic phase
was washed with brine (5 50 mL), dried over anhydrous Na2SO4 and concentrated under

82
reduced pressure to give 3.26 (6376 mg, 18.30 mmol, 60%) as a yellow oil. Crushed out using
diethyl ether (50 mL) and filtered to get solid residue. 1H NMR (300 MHz, DMSO-d6): 3.55
(m, 4H, SCH2; Ph-CH2), 4.25 (m, 2H, CH2OH), 5.04 (d, J6,7 = 4.7 Hz, 1H, H6), 5.62 (dd, J6,7 =
4.7 Hz, J7,NH = 8.3 Hz, 1H, H7), 7.26 (m, 5H, Ar), 9.06 (d, J7,NH =8.3 Hz, 1H, NH).
To a suspension of 3.26 (2700 mg, 7.75 mmol) in EtOAc (30 mL) at 0 C was added a solution
of diphenyldiazomethane 3.14 (9.4 mL, 9.4 mmol, 1 M solution in EtOAc) at once and it was
allowed to stir overnight and gradually warmed up to rt. Upon completion the solvent was
evaporated under reduced pressure, the residue was dissolved in THF (30 mL) and filtered. The
filtrate was concentrated under reduced pressure in vacuo. The residue was washed with little
quantity of EtOAc and filtered to give 3.20 (3000 mg, 5.82 mmol, 75%) as a white solid. 1H
NMR (300 MHz, DMSO-d6): 3.56 (m, 4H, SCH2; Ph-CH2), 4.21 (m, 2H, CH2OH), 5.13 (m,
2H, H6; CH2OH), 5.71 (dd, J6,7 = 4.8 Hz, J7,NH = 8.3 Hz, 1H, H7), 6.90 (s, 1H, CHPh2), 7.32
(m, 15H, Ar), 9.11 (d, J7,NH = 8.3Hz, 1H, NH). 1H NMR (300 MHz, benzene-d6): 3.39 (d,
Jgem = 18.1 Hz, 1H, SCH2), 3.58 (d, Jgem = 18.1 Hz, 1H, SCH2), 3.69 (m, 2H, Ph-CH2), 4.43
(dd, Jgem = 14.4 Hz, J3,OH = 6.2 Hz, 1H, CH2OH), 4.55 (m, 2H, H6; CH2OH), 4.88 (t, J = 6.0,
1H, CH2OH), 5.80 (dd, J6,7 = 4.8 Hz, J7,NH = 8.2 Hz, 1H, H7), 7.08 (m, 10H, CHPh2; Ar), 7.44
(t, J = 7.6 Hz, 4H, Ar), 7.61 (d, J = 7.6, 2H, Ar), 9.08 (d, J7,NH = 8.2 Hz, 1H, NH). 1H NMR
(500 MHz, acetone-d6): 3.68 (m, 4H, SCH2; Ph-CH2), 4.09 (t, J = 6.0, 1H, CH2OH), 4.31 (dd,
Jgem = 13.7 Hz, J3,OH = 6.2 Hz, 1H, CH2OH), 4.42 (dd, Jgem = 13.7 Hz, J3,OH = 6.2 Hz, 1H,
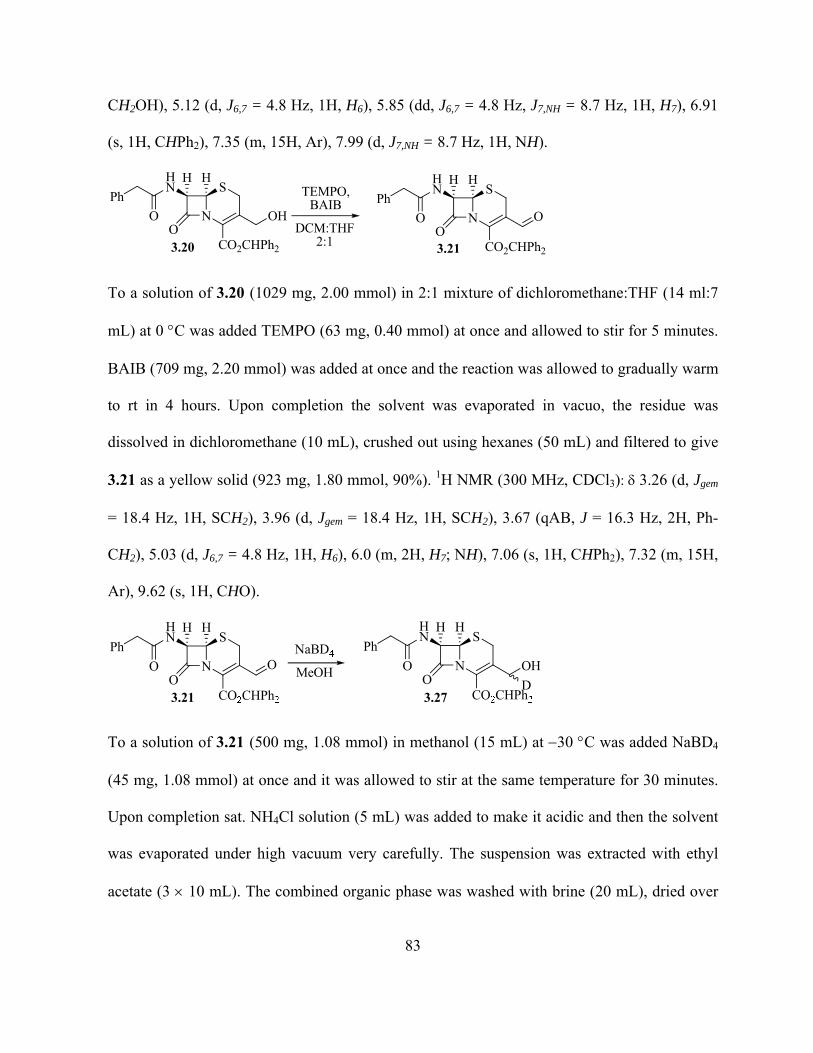
83
CH2OH), 5.12 (d, J6,7 = 4.8 Hz, 1H, H6), 5.85 (dd, J6,7 = 4.8 Hz, J7,NH = 8.7 Hz, 1H, H7), 6.91
(s, 1H, CHPh2), 7.35 (m, 15H, Ar), 7.99 (d, J7,NH = 8.7 Hz, 1H, NH).
2 2 2 2
To a solution of 3.20 (1029 mg, 2.00 mmol) in 2:1 mixture of dichloromethane:THF (14 ml:7
mL) at 0 C was added TEMPO (63 mg, 0.40 mmol) at once and allowed to stir for 5 minutes.
BAIB (709 mg, 2.20 mmol) was added at once and the reaction was allowed to gradually warm
to rt in 4 hours. Upon completion the solvent was evaporated in vacuo, the residue was
dissolved in dichloromethane (10 mL), crushed out using hexanes (50 mL) and filtered to give
3.21 as a yellow solid (923 mg, 1.80 mmol, 90%). 1H NMR (300 MHz, CDCl3): 3.26 (d, Jgem
= 18.4 Hz, 1H, SCH2), 3.96 (d, Jgem = 18.4 Hz, 1H, SCH2), 3.67 (qAB, J = 16.3 Hz, 2H, Ph-
CH2), 5.03 (d, J6,7 = 4.8 Hz, 1H, H6), 6.0 (m, 2H, H7; NH), 7.06 (s, 1H, CHPh2), 7.32 (m, 15H,
Ar), 9.62 (s, 1H, CHO).
To a solution of 3.21 (500 mg, 1.08 mmol) in methanol (15 mL) at 30 C was added NaBD4
(45 mg, 1.08 mmol) at once and it was allowed to stir at the same temperature for 30 minutes.
Upon completion sat. NH4Cl solution (5 mL) was added to make it acidic and then the solvent
was evaporated under high vacuum very carefully. The suspension was extracted with ethyl
acetate (3 10 mL). The combined organic phase was washed with brine (20 mL), dried over

84
anhydrous Na2SO4 and concentrated under reduced pressure. The residue was washed with
little quantity of EtOAc and filtered to give 3.27 (300 mg, 0.58 mmol, 60%) as a white solid.
1H NMR (300 MHz, DMSO-d6): 3.55 (m, 4H, SCH2; Ph-CH2), 4.18 (m, 1H, CHDOH), 5.13
(m, 2H, H6; CDHOH), 5.91 (dd, J6,7 = 4.7 Hz, J7,NH = 8.3 Hz, 1H, H7), 6.9 (s, 1H, CHPh2),
7.32 (m, 15H, Ar), 9.12 (d, J7,NH = 8.3 Hz, 1H, NH). 13C NMR (75.5 MHz, DMSO-d6):
25.55, 41.57, 57.70, 58.90, 78.32, 122.00, 126.47, 126.55, 126.59, 126.76, 127.76, 127.82,
128.21, 128.37, 128.50, 129.00, 134.36, 135.81, 139.96, 140.03, 160.86, 165.21, 170.95.
To a solution of 3.27 (50 mg, 0.10 mmol) in 2:1 mixture of dichloromethane:THF (4 ml:2 mL)
at 0 C was added TEMPO (3 mg, 0.01 mmol) at once and allowed to stir for 5 minutes. BAIB
(34 mg, 0.10 mmol) was added at once and the reaction was allowed to gradually warm to rt in
24 hours. Upon completion the solvent was evaporated in vacuo, the residue was dissolved in
dichloromethane (10 mL), crushed out using hexanes (50 mL) and filtered to give 3.28 (45 mg,
0.09 mmol, 90%) as a yellow solid. 1H NMR (300 MHz, CDCl3): 3.22 (d, Jgem = 18.6 Hz, 1H,
SCH2), 3.64 (m, 2H, Ph-CH2), 3.94 (d, Jgem = 18.6 Hz, 1H, SCH2), 4.99 (d, J6,7 = 5.3 Hz, 1H,
H6), 5.97 (dd, J6,7 = 5.3 Hz, J7,NH = 9.1 Hz, 1H, H7), 6.38 (d, J7,NH = 9.1 Hz, 1H, NH), 7.07 (s,
1H, CHPh2), 7.32 (m, 15H, Ar), 9.62 (s, 0.5H and 0.5D, CXO, where X = H/D). 13C NMR
(75.5 MHz, CDCl3): 22.32, 43.28, 59.09, 59.97, 80.92, 124.04, 127.16, 127.92, 127.97,
128.58, 128.69, 128.74, 128.81, 129.32, 129.52, 133.58, 138.21, 138.48, 138.53, 159.75,
165.34, 171.33, 187.84.

85
3.16 (1145.2 mg, 2.00 mmol) was dissolved in a mixture of DMSO (20 mL) and methanol-d (4
mL, 100.00 mmol). The mixture was stirred for 16 hours at 50 C. The solvent was evaporated
under high vacuum and new methanol-d (4 mL, 100.00 mmol) was added. The reaction was
repeated for 8 hours at 50 C. After 24 hours, methanol was evaporated under high vacuum.
The oil was dissolved in EtOAc (20 mL) and washed with water (2 20 mL) and brine (2 20
mL), dried over anhydrous Na2SO4 and concentrated under reduced pressure to give 3.17 (1137
mg, 1.97 mmol, 99%) as a yellow solid. 1H NMR (300 MHz, CDCl3): 2.01 (s, 3H, COCH3),
3.15 (s, 0.04H, SCX2, where X=H/D), 3.64 (m, 2H, Ph-CH2), 3.76 (s, 0.07H, SCX2, where
X=H/D), 4.43 (d, J6,7 = 4.6 Hz, 1H, H6), 4.70 (d, Jgem = 14.3 Hz, 1H, CH2OAc), 5.27 (d, Jgem =
14.3 Hz, 1H, CH2OAc), 6.10 (m, 1H, H7), 6.72 (d, J7,NH = 9.9 Hz, 0.49H, NH), 6.93 (s, 1H,
CHPh2), 7.36 (m, 15H, Ar).
To a solution of 3.17 (970 mg, 1.69 mmol) in DMF (40 mL) at 30 C was added PCl3 (310
µL, 3.55 mmol) drop wise and allowed to react for 30 minutes. The reaction mixture was
poured into ice cold H2O (30 mL) and the compound was extracted with EtOAc (3 40 mL).
The combined organic phase was washed with brine (4 30 mL), dried over anhydrous
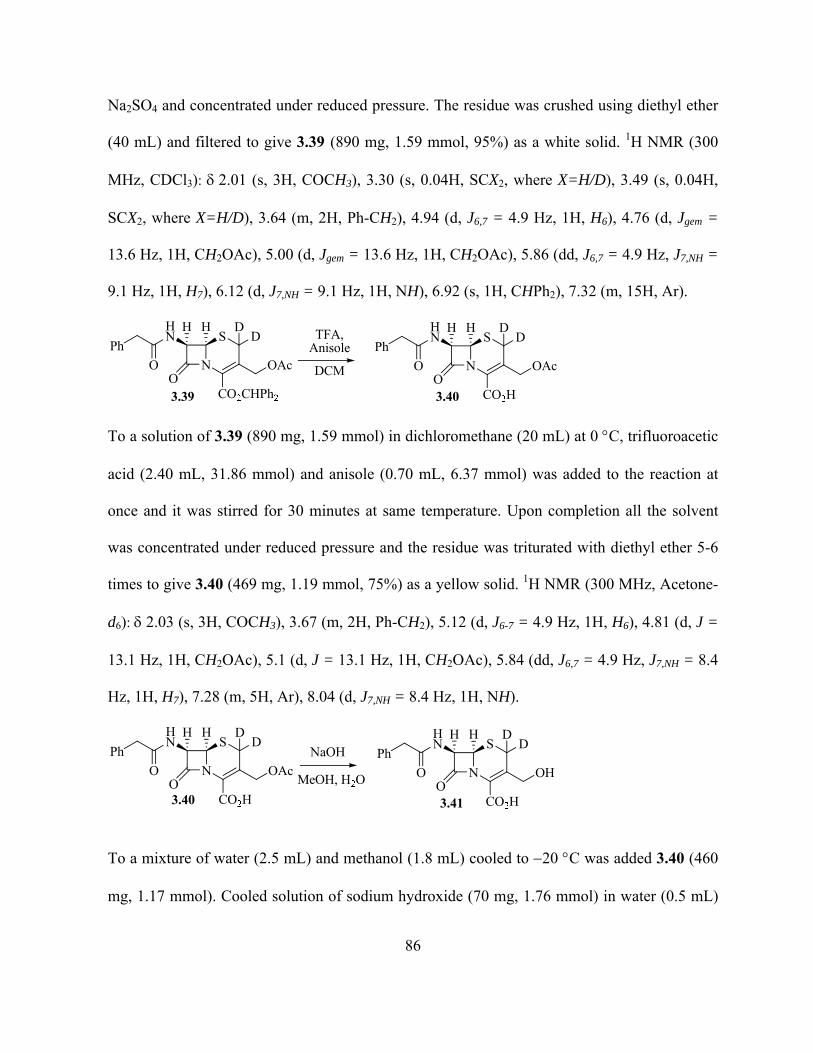
86
Na2SO4 and concentrated under reduced pressure. The residue was crushed using diethyl ether
(40 mL) and filtered to give 3.39 (890 mg, 1.59 mmol, 95%) as a white solid. 1H NMR (300
MHz, CDCl3): 2.01 (s, 3H, COCH3), 3.30 (s, 0.04H, SCX2, where X=H/D), 3.49 (s, 0.04H,
SCX2, where X=H/D), 3.64 (m, 2H, Ph-CH2), 4.94 (d, J6,7 = 4.9 Hz, 1H, H6), 4.76 (d, Jgem =
13.6 Hz, 1H, CH2OAc), 5.00 (d, Jgem = 13.6 Hz, 1H, CH2OAc), 5.86 (dd, J6,7 = 4.9 Hz, J7,NH =
9.1 Hz, 1H, H7), 6.12 (d, J7,NH = 9.1 Hz, 1H, NH), 6.92 (s, 1H, CHPh2), 7.32 (m, 15H, Ar).
To a solution of 3.39 (890 mg, 1.59 mmol) in dichloromethane (20 mL) at 0 C, trifluoroacetic
acid (2.40 mL, 31.86 mmol) and anisole (0.70 mL, 6.37 mmol) was added to the reaction at
once and it was stirred for 30 minutes at same temperature. Upon completion all the solvent
was concentrated under reduced pressure and the residue was triturated with diethyl ether 5-6
times to give 3.40 (469 mg, 1.19 mmol, 75%) as a yellow solid. 1H NMR (300 MHz, Acetone-
d6): 2.03 (s, 3H, COCH3), 3.67 (m, 2H, Ph-CH2), 5.12 (d, J6-7 = 4.9 Hz, 1H, H6), 4.81 (d, J =
13.1 Hz, 1H, CH2OAc), 5.1 (d, J = 13.1 Hz, 1H, CH2OAc), 5.84 (dd, J6,7 = 4.9 Hz, J7,NH = 8.4
Hz, 1H, H7), 7.28 (m, 5H, Ar), 8.04 (d, J7,NH = 8.4 Hz, 1H, NH).
To a mixture of water (2.5 mL) and methanol (1.8 mL) cooled to 20 C was added 3.40 (460
mg, 1.17 mmol). Cooled solution of sodium hydroxide (70 mg, 1.76 mmol) in water (0.5 mL)
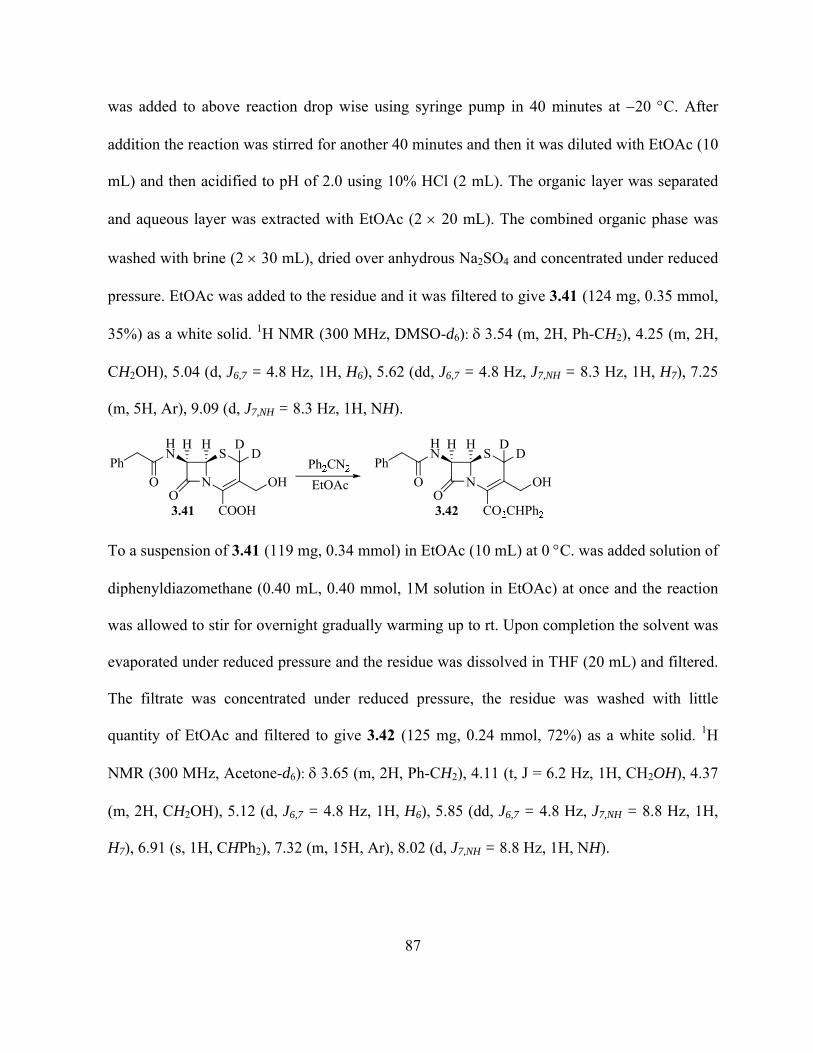
87
was added to above reaction drop wise using syringe pump in 40 minutes at 20 C. After
addition the reaction was stirred for another 40 minutes and then it was diluted with EtOAc (10
mL) and then acidified to pH of 2.0 using 10% HCl (2 mL). The organic layer was separated
and aqueous layer was extracted with EtOAc (2 20 mL). The combined organic phase was
washed with brine (2 30 mL), dried over anhydrous Na2SO4 and concentrated under reduced
pressure. EtOAc was added to the residue and it was filtered to give 3.41 (124 mg, 0.35 mmol,
35%) as a white solid. 1H NMR (300 MHz, DMSO-d6): 3.54 (m, 2H, Ph-CH2), 4.25 (m, 2H,
CH2OH), 5.04 (d, J6,7 = 4.8 Hz, 1H, H6), 5.62 (dd, J6,7 = 4.8 Hz, J7,NH = 8.3 Hz, 1H, H7), 7.25
(m, 5H, Ar), 9.09 (d, J7,NH = 8.3 Hz, 1H, NH).
To a suspension of 3.41 (119 mg, 0.34 mmol) in EtOAc (10 mL) at 0 C. was added solution of
diphenyldiazomethane (0.40 mL, 0.40 mmol, 1M solution in EtOAc) at once and the reaction
was allowed to stir for overnight gradually warming up to rt. Upon completion the solvent was
evaporated under reduced pressure and the residue was dissolved in THF (20 mL) and filtered.
The filtrate was concentrated under reduced pressure, the residue was washed with little
quantity of EtOAc and filtered to give 3.42 (125 mg, 0.24 mmol, 72%) as a white solid. 1H
NMR (300 MHz, Acetone-d6): 3.65 (m, 2H, Ph-CH2), 4.11 (t, J = 6.2 Hz, 1H, CH2OH), 4.37
(m, 2H, CH2OH), 5.12 (d, J6,7 = 4.8 Hz, 1H, H6), 5.85 (dd, J6,7 = 4.8 Hz, J7,NH = 8.8 Hz, 1H,
H7), 6.91 (s, 1H, CHPh2), 7.32 (m, 15H, Ar), 8.02 (d, J7,NH = 8.8 Hz, 1H, NH).
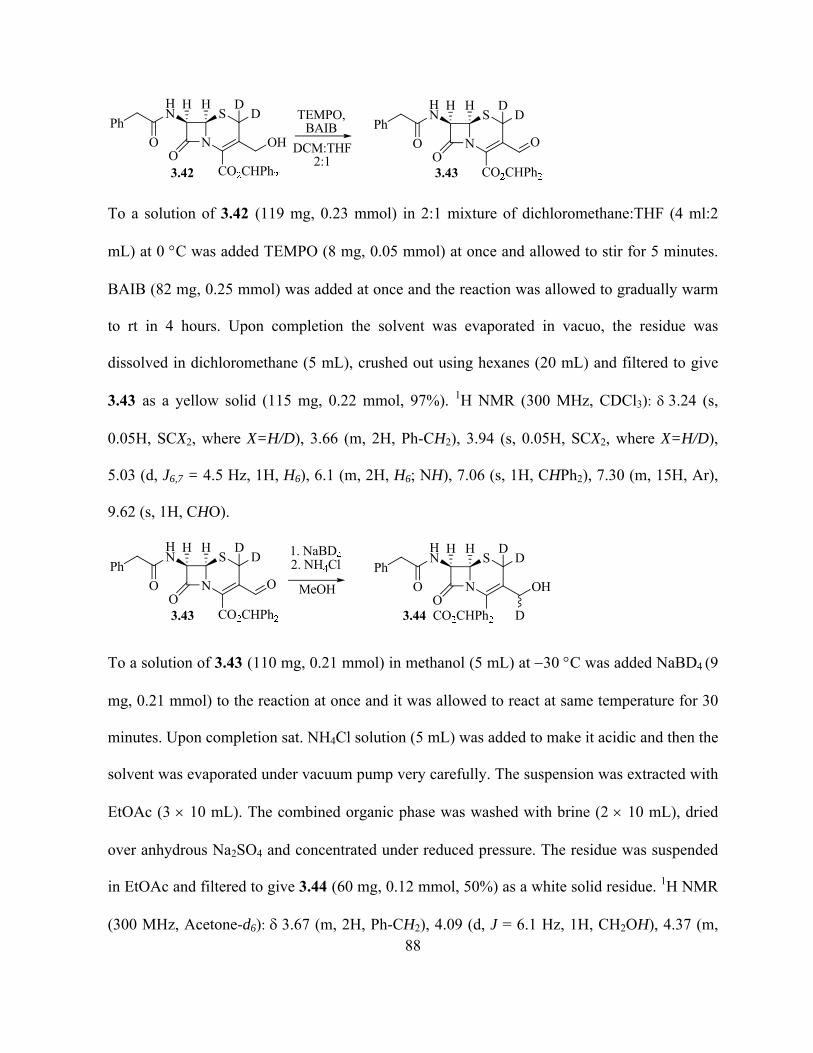
88
To a solution of 3.42 (119 mg, 0.23 mmol) in 2:1 mixture of dichloromethane:THF (4 ml:2
mL) at 0 C was added TEMPO (8 mg, 0.05 mmol) at once and allowed to stir for 5 minutes.
BAIB (82 mg, 0.25 mmol) was added at once and the reaction was allowed to gradually warm
to rt in 4 hours. Upon completion the solvent was evaporated in vacuo, the residue was
dissolved in dichloromethane (5 mL), crushed out using hexanes (20 mL) and filtered to give
3.43 as a yellow solid (115 mg, 0.22 mmol, 97%). 1H NMR (300 MHz, CDCl3): 3.24 (s,
0.05H, SCX2, where X=H/D), 3.66 (m, 2H, Ph-CH2), 3.94 (s, 0.05H, SCX2, where X=H/D),
5.03 (d, J6,7 = 4.5 Hz, 1H, H6), 6.1 (m, 2H, H6; NH), 7.06 (s, 1H, CHPh2), 7.30 (m, 15H, Ar),
9.62 (s, 1H, CHO).
To a solution of 3.43 (110 mg, 0.21 mmol) in methanol (5 mL) at 30 C was added NaBD4 (9
mg, 0.21 mmol) to the reaction at once and it was allowed to react at same temperature for 30
minutes. Upon completion sat. NH4Cl solution (5 mL) was added to make it acidic and then the
solvent was evaporated under vacuum pump very carefully. The suspension was extracted with
EtOAc (3 10 mL). The combined organic phase was washed with brine (2 10 mL), dried
over anhydrous Na2SO4 and concentrated under reduced pressure. The residue was suspended
in EtOAc and filtered to give 3.44 (60 mg, 0.12 mmol, 50%) as a white solid residue. 1H NMR
(300 MHz, Acetone-d6): 3.67 (m, 2H, Ph-CH2), 4.09 (d, J = 6.1 Hz, 1H, CH2OH), 4.37 (m,

89
1H, CDHOH), 5.12 (d, J6,7 = 4.9 Hz, 1H, H6), 5.86 (dd, J6,7 = 4.9 Hz, J7,NH = 8.7 Hz, 1H, H7),
6.91 (s, 1H, CHPh2), 7.37 (m, 15H, Ar), 8.02 (d, J7,NH = 8.7 Hz, 1H, NH).
To a suspension of 3.12 (7800 mg, 20 mmol) in dichloromethane (400 mL) at 0 C, m-CPBA
(4500 mg, 26 mmol) was added to the reaction at once and was gradually warmed to rt in 3
hours. Upon completion the reaction was filtered and residue was washed with
dichloromethane (2 100 mL), dried under vacuum pump to give 3.45 (7910 mg, 19.46 mmol,
97%) as a white solid. 1H NMR (300 MHz, DMSO-d6): 2.02 (s, 3H, COCH3), 3.54 (m, 3H,
SCH2; Ph-CH2), 3.89 (d, Jgem = 18.2 Hz, 1H, SCH2), 4.59 (d, Jgem = 13.3 Hz, 1H, CH2OAc),
5.2 (d, Jgem = 13.3 Hz, 1H, CH2OAc), 4.85 (d, J6,7 = 4.4 Hz, 1H, H6), 5.8 (dd, J6,7 = 4.4 Hz,
J7,NH = 8.2 Hz, 1H, H7), 7.27 (m, 5H, Ar), 8.43 (d, J7,NH = 8.2 Hz, 1H, NH). LRMS: (ESI) m/z
(relative intensity): 406.08 ([M], 20), 405.07 ([MH], 100).
3.45 (5000 mg, 12.30 mmol) was dissolved in a mixture of DMSO (60 mL) and methanol-d
(10.0 mL, 246.00 mmol). The mixture was stirred for 2 hours at 50 C. The solvent was
evaporated under high vacuum and new methanol-d (10.0 mL, 246.00 mmol) was added. The
reaction was repeated for 2 hours at 50 C and the same procedure was repeated for the third
set of 2 hours. After 6 hours, methanol was evaporated under high vacuum. EtOAc was added

90
to this solution and acidified to pH of 2.0 with 10% HCl (20 mL). The organic layer was
separated and the aqueous layer was extracted with EtOAc (3 50 mL). The combined organic
phase was washed with brine (2 20 mL), dried over anhydrous Na2SO4 and concentrated
under reduced pressure to give 3.46 (4974 mg, 12.17 mmol, 99%) as a yellow solid. 1H NMR
(300 MHz, DMSO-d6): 2.02 (s, 3H, COCH3), 3.17 (s, 0.03H, SCX2, where X=H/D), 3.62
(qAB, J = 14.1 Hz, 2H, Ph-CH2), 3.86 (s, 0.03H, SCX2, where X=H/D), 4.59 (d, Jgem = 13.3
Hz, 1H, CH2OAc), 5.2 (d, Jgem = 13.3 Hz, 1H, CH2OAc), 4.86 (d, J6,7 = 4.8 Hz, 1H, H6), 5.8
(dd, J6,7 = 4.8 Hz, J7,NH = 8.2 Hz, 1H, H7), 7.26 (m, 5H, Ar), 8.43 (d, J7,NH = 8.2 Hz, 0.49H,
NH). 13C NMR (75.5 MHz, DMSO-d6):20.66, 41.47, 58.19, 63.08, 66.27, 118.55, 125.99,
126.58, 128.32, 129.14, 135.86, 162.13, 164.23, 170.18, 171.10. HRMS: (ESI) m/z: 406.0799
obsd; 406.0835 calcd for C18H16N2O7S;. (Back exchange during ionization).
To a solution of 3.46 (3400 mg, 8.32 mmol) in DMF (50 mL) at 30 C, phosphorus
trichloride (1.5 mL, 17.48 mmol) was added dropwise to the above reaction and it was allowed
to react for 30 minutes. The reaction mixture was poured into ice cold H2O (40 mL) and the
compound was extracted with EtOAc (3 50 mL). The combined organic phase was washed
with brine (4 30 mL) to remove all left over DMF, dried over anhydrous Na2SO4 and
concentrated under reduced pressure. The residue was crushed using diethyl ether (50 mL) and
filtered to give 3.40 (2600 mg, 6.62 mmol, 80%) as a white solid. 1H NMR (300 MHz, DMSO-
d6): 2.03 (s, 3H, COCH3), 3.52 (d, J = 13.7 Hz, 2H, Ph-CH2), 4.68 (d, Jgem = 12.7 Hz, 1H,

91
CH2OAc), 5.01 (d, Jgem = 12.7 Hz, 1H, CH2OAc), 5.09 (d, J6,7 = 4.9 Hz, 1H, H6), 5.69 (dd, J6,7
= 4.9 Hz, J7,NH = 8.3 Hz, 1H, H7), 7.26 (m, 5H, Ar), 9.11 (d, J7,NH = 8.3 Hz, 1H, NH). 13C
NMR (75.5 MHz, DMSO-d6):20.60, 41.60, 57.43, 59.09, 62.70, 123.32, 126.40, 126.52,
128.26, 129.04, 135.83, 162.87, 164.83, 170.24, 170.98. HRMS: (ESI) m/z: 391.0916 obsd;
391.0938 calcd for C18H15D2N2O6S
To a mixture of water (11.7 mL) and methanol (8.8 mL) cooled to 20 C was added 3.40
(2300 mg, 5.86 mmol). Cooled solution of NaOH (500 mg, 12.30 mmol) in water (2.4 mL) was
added to above reaction using syringe pump in 40 minutes at 20 C. After addition the
reaction was stirred for another 40 minutes, diluted with EtOAc (30 mL) and then acidified to
pH of 2.0 using 10% HCl (10 mL). The organic layer was separated and aqueous layer was
extracted with EtOAc (2 30 mL). The combined organic phase was washed with brine (2
20 mL), dried over anhydrous Na2SO4 and concentrated under reduced pressure. EtOAc was
added to the residue and it was filtered to give 3.41 (1000 mg, 2.85 mmol, 50%) as white
solid. 1H NMR (300 MHz, DMSO-d6): 3.54 (m, 2H, Ph-CH2), 4.25 (m, 2H, CH2OH), 5.04 (d,
J6,7 = 4.5 Hz, 1H, H6), 5.62 (dd, J6,7 = 4.5 Hz, J7,NH = 8.3 Hz, 1H, H7), 7.25 (m, 5H, Ar), 9.09
(d, J7,NH = 8.25 Hz, 1H, NH). 13C NMR (75.5 MHz, DMSO-d6):41.58, 57.47, 58.93, 59.85,
123.40, 126.51, 128.25, 129.04, 131.10, 135.87, 163.28, 164.80, 170.99. HRMS: (ESI) m/z:
349.0810 obsd; 349.0833 calcd for C16H13D2N2O5S.

92
To a suspension of 3.41 (980 mg, 2.79 mmol) in EtOAc (30 mL) at 0 C was added a solution
of diphenyldiazomethane (3.4 mL, 3.40 mmol, 1M solution in EtOAc) at once and the reaction
was allowed to stir overnight, gradually warming up to rt. Upon completion the solvent was
evaporated under reduced pressure and the residue was dissolved in THF (30 mL) and filtered.
The filtrate was concentrated under reduced pressure in vacuo. The residue was washed with
little quantity of EtOAc and filtered to give 3.42 (1300 mg, 2.51 mmol, 90%) as a white solid.
1H NMR (300 MHz, DMSO-d6): 3.53 (m, 2H, Ph-CH2), 4.21 (d, Jgem = 4.5 Hz, 2H, CH2OH),
5.14 (m, 2H, H6; CH2OH)), 5.71 (dd, J6,7 = 5.1 Hz, J7,NH = 7.9 Hz, 1H, H7), 6.91 (s, 1H,
CHPh2), 7.38 (m, 15H, Ar), 9.12 (d, J7,NH = 7.9 Hz, 1H, NH).
To a solution of 3.42 (1290 mg, 2.50 mmol) in 2:1 mixture of dichloromethane:THF (20 ml:10
mL) at 0 C was added TEMPO (78 mg, 0.50 mmol) at once and allowed to stir for 5 minutes.
BAIB (965 mg, 2.99 mmol) was added at once and the reaction was allowed to gradually warm
to rt in 4 hours. Upon completion the solvent was evaporated in vacuo, the residue was
dissolved in dichloromethane (10 mL), crushed out using hexanes (50 mL) and filtered to give
3.43 as a yellow solid (1258 mg, 2.44 mmol, 98%). 1H NMR (300 MHz, CDCl3): 3.22 (s,
0.05H, SCX2, where X=H/D), 3.64 (m, 2H, Ph-CH2), 3.93 (s, 0.05H, SCX2, where X=H/D),
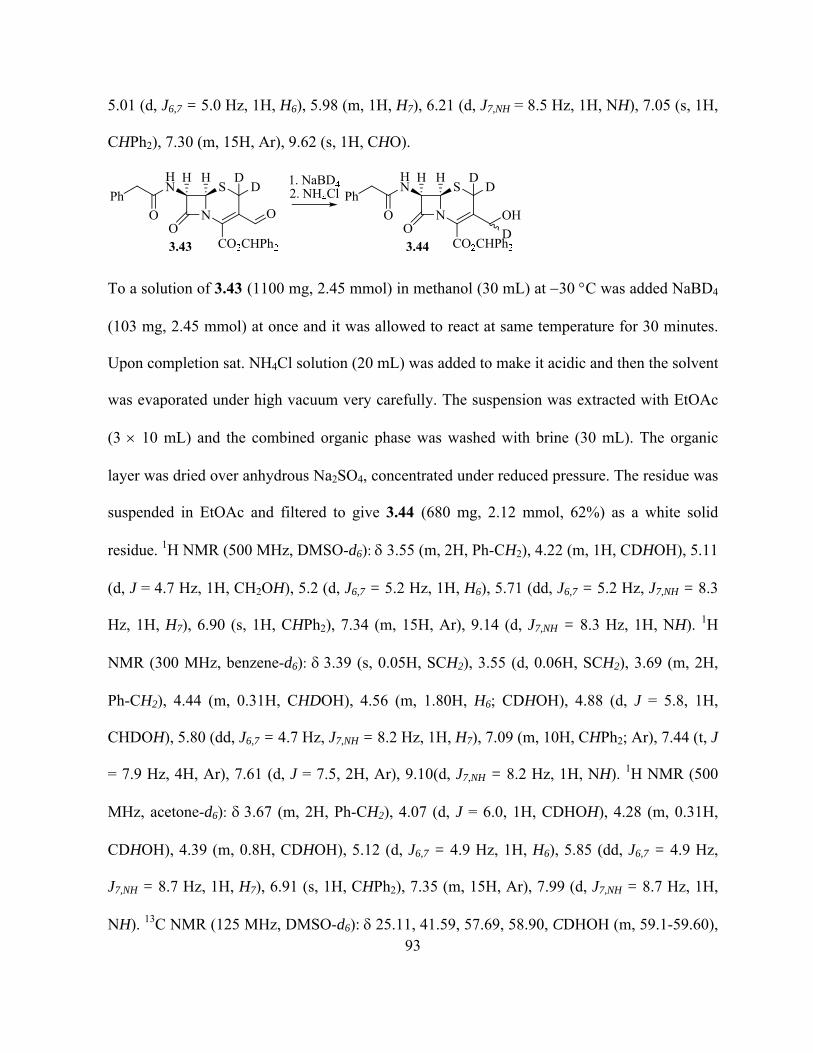
93
5.01 (d, J6,7 = 5.0 Hz, 1H, H6), 5.98 (m, 1H, H7), 6.21 (d, J7,NH = 8.5 Hz, 1H, NH), 7.05 (s, 1H,
CHPh2), 7.30 (m, 15H, Ar), 9.62 (s, 1H, CHO).
To a solution of 3.43 (1100 mg, 2.45 mmol) in methanol (30 mL) at 30 C was added NaBD4
(103 mg, 2.45 mmol) at once and it was allowed to react at same temperature for 30 minutes.
Upon completion sat. NH4Cl solution (20 mL) was added to make it acidic and then the solvent
was evaporated under high vacuum very carefully. The suspension was extracted with EtOAc
(3 10 mL) and the combined organic phase was washed with brine (30 mL). The organic
layer was dried over anhydrous Na2SO4, concentrated under reduced pressure. The residue was
suspended in EtOAc and filtered to give 3.44 (680 mg, 2.12 mmol, 62%) as a white solid
residue. 1H NMR (500 MHz, DMSO-d6): 3.55 (m, 2H, Ph-CH2), 4.22 (m, 1H, CDHOH), 5.11
(d, J = 4.7 Hz, 1H, CH2OH), 5.2 (d, J6,7 = 5.2 Hz, 1H, H6), 5.71 (dd, J6,7 = 5.2 Hz, J7,NH = 8.3
Hz, 1H, H7), 6.90 (s, 1H, CHPh2), 7.34 (m, 15H, Ar), 9.14 (d, J7,NH = 8.3 Hz, 1H, NH). 1H
NMR (300 MHz, benzene-d6): 3.39 (s, 0.05H, SCH2), 3.55 (d, 0.06H, SCH2), 3.69 (m, 2H,
Ph-CH2), 4.44 (m, 0.31H, CHDOH), 4.56 (m, 1.80H, H6; CDHOH), 4.88 (d, J = 5.8, 1H,
CHDOH), 5.80 (dd, J6,7 = 4.7 Hz, J7,NH = 8.2 Hz, 1H, H7), 7.09 (m, 10H, CHPh2; Ar), 7.44 (t, J
= 7.9 Hz, 4H, Ar), 7.61 (d, J = 7.5, 2H, Ar), 9.10(d, J7,NH = 8.2 Hz, 1H, NH). 1H NMR (500
MHz, acetone-d6): 3.67 (m, 2H, Ph-CH2), 4.07 (d, J = 6.0, 1H, CDHOH), 4.28 (m, 0.31H,
CDHOH), 4.39 (m, 0.8H, CDHOH), 5.12 (d, J6,7 = 4.9 Hz, 1H, H6), 5.85 (dd, J6,7 = 4.9 Hz,
J7,NH = 8.7 Hz, 1H, H7), 6.91 (s, 1H, CHPh2), 7.35 (m, 15H, Ar), 7.99 (d, J7,NH = 8.7 Hz, 1H,
NH). 13C NMR (125 MHz, DMSO-d6):25.11, 41.59, 57.69, 58.90, CDHOH (m, 59.1-59.60),

94
78.33, 122.02, 126.47, 128.57, 126.76, 127.77, 127.84, 128.21, 128.38, 128.51, 129.02, 134.61,
135.83, 139.98, 140.05, 160.87, 165.22, 170.98. HRMS: (+ESI) m/z: 535.2087 obsd; 535.2094
calcd for C29H27D3N3O5S [M + NH4]+

95
Appendices
Appendix A
Permission issued by Nature Publishing Group Regarding Figure 1
96
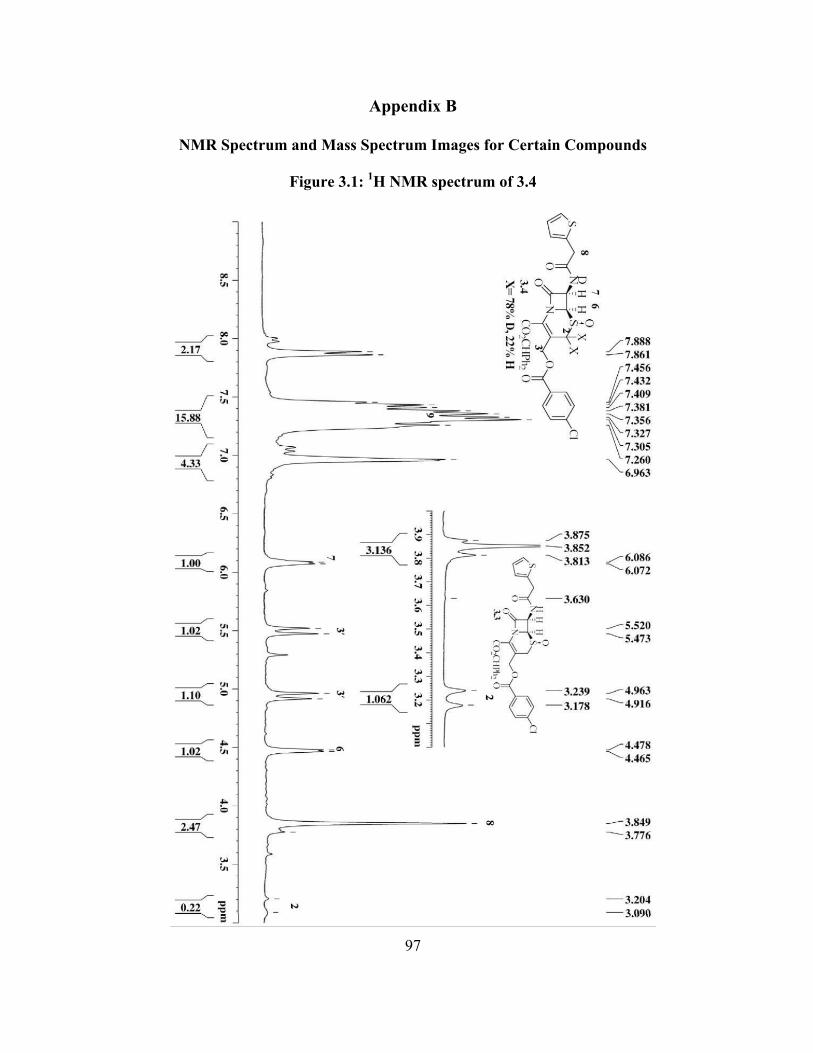
97
Appendix B
NMR Spectrum and Mass Spectrum Images for Certain Compounds
Figure 3.1: 1H NMR spectrum of 3.4

98
Figure 3.2: 1H NMR spectrum of 3.8
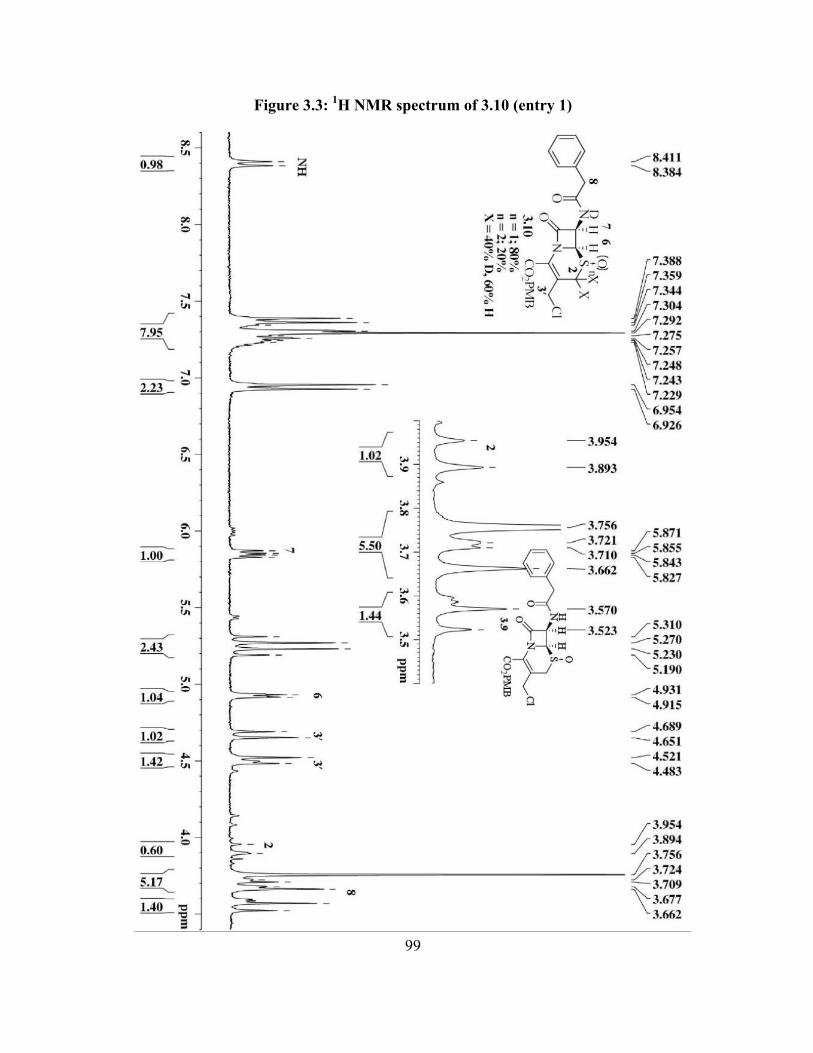
99
Figure 3.3: 1H NMR spectrum of 3.10 (entry 1)
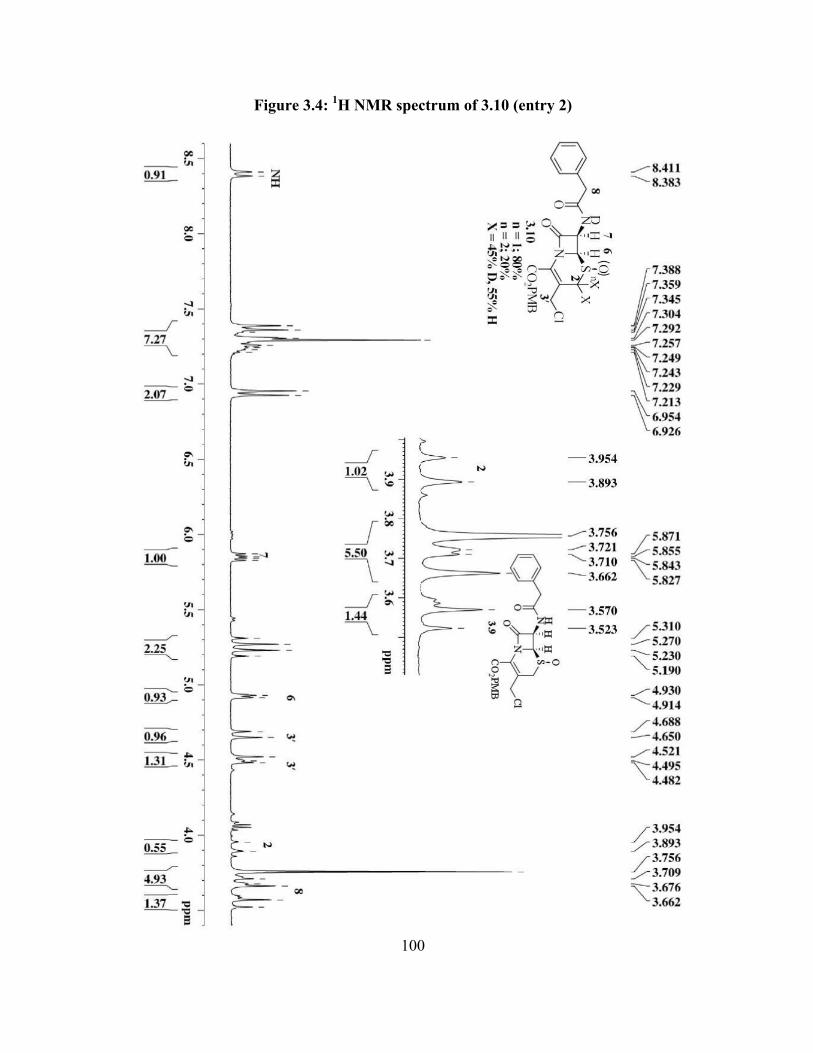
100
Figure 3.4: 1H NMR spectrum of 3.10 (entry 2)
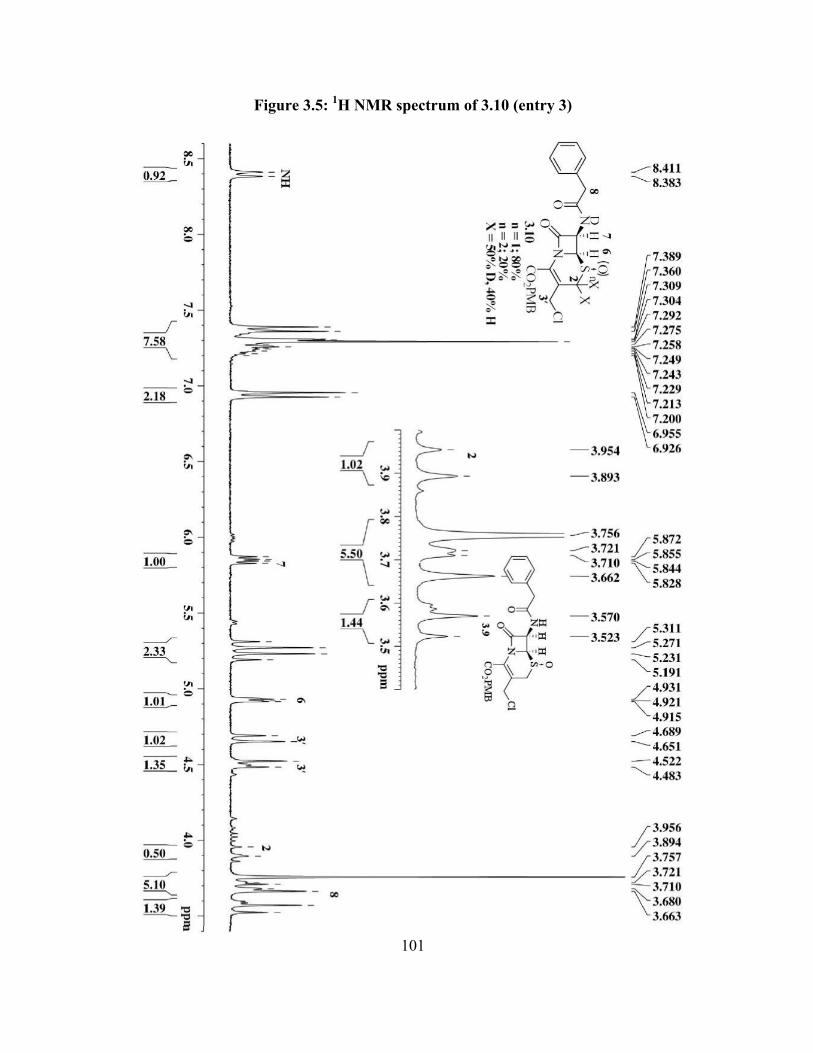
101
Figure 3.5: 1H NMR spectrum of 3.10 (entry 3)
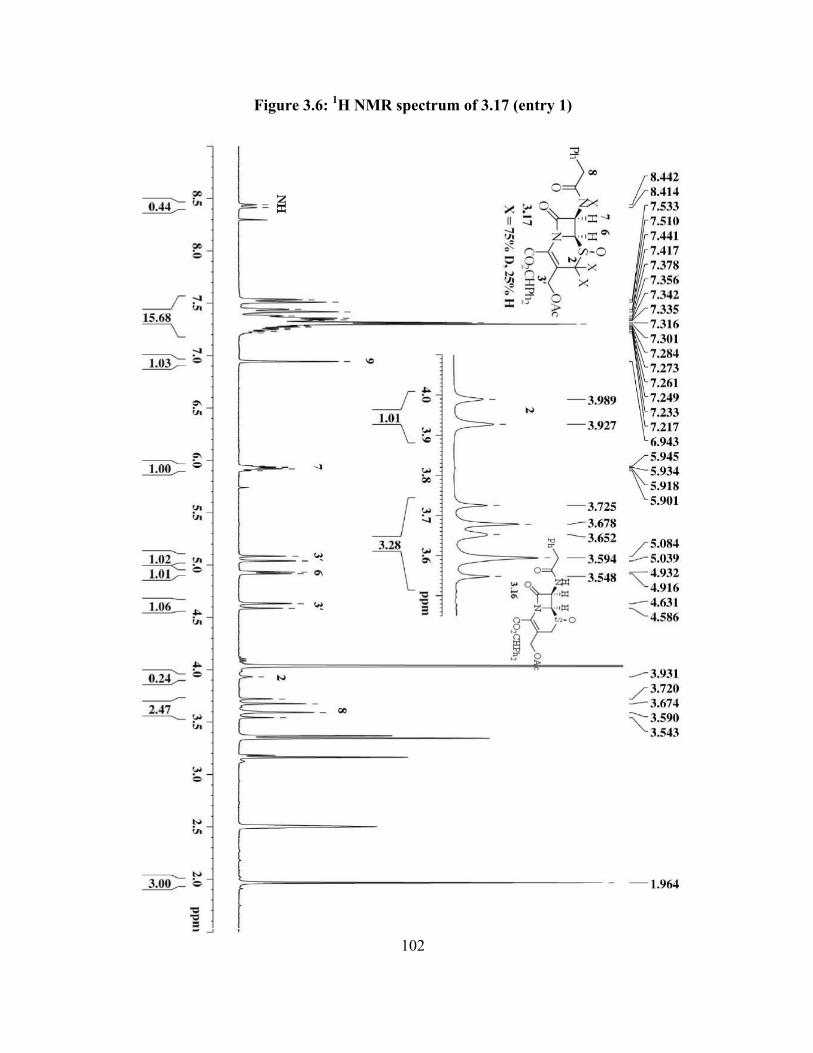
102
Figure 3.6: 1H NMR spectrum of 3.17 (entry 1)

103
Figure 3.7: 1H NMR spectrum of 3.17 (entry 2)

104
Figure 3.8: 1H NMR spectrum of 3.17 (entry 3)

105
Figure 3.9: 1H NMR spectrum of 3.17 (entry 4)
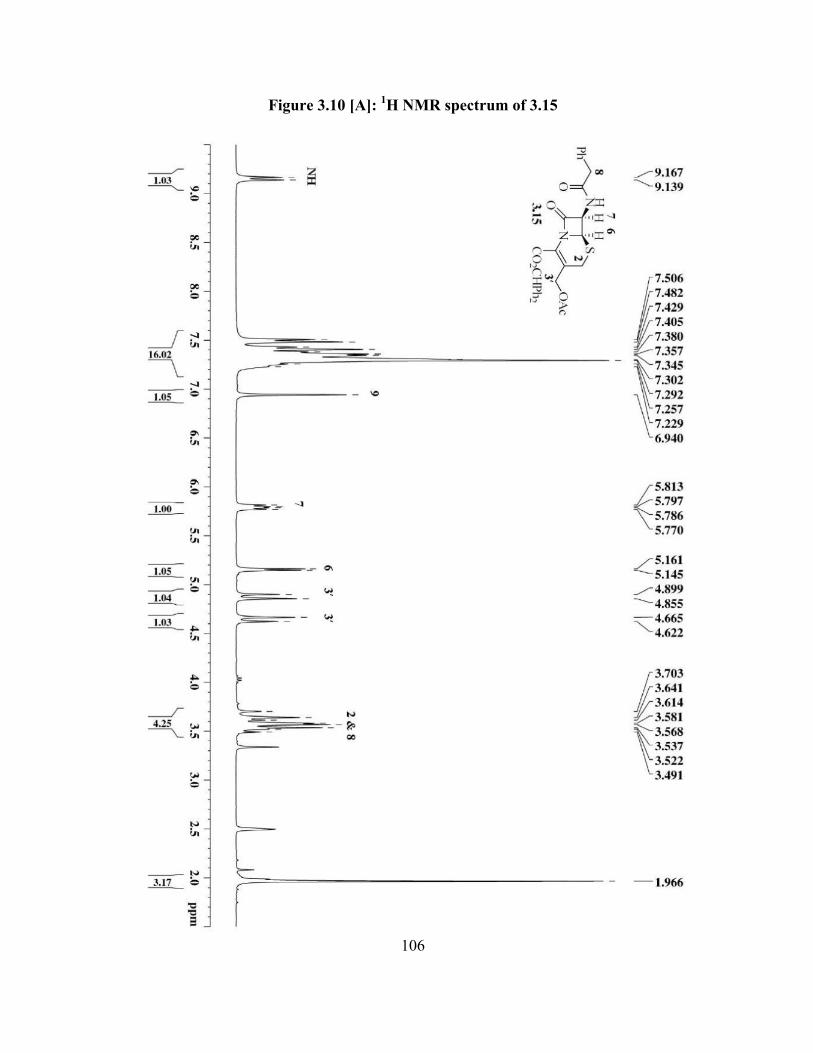
106
Figure 3.10 [A]: 1H NMR spectrum of 3.15
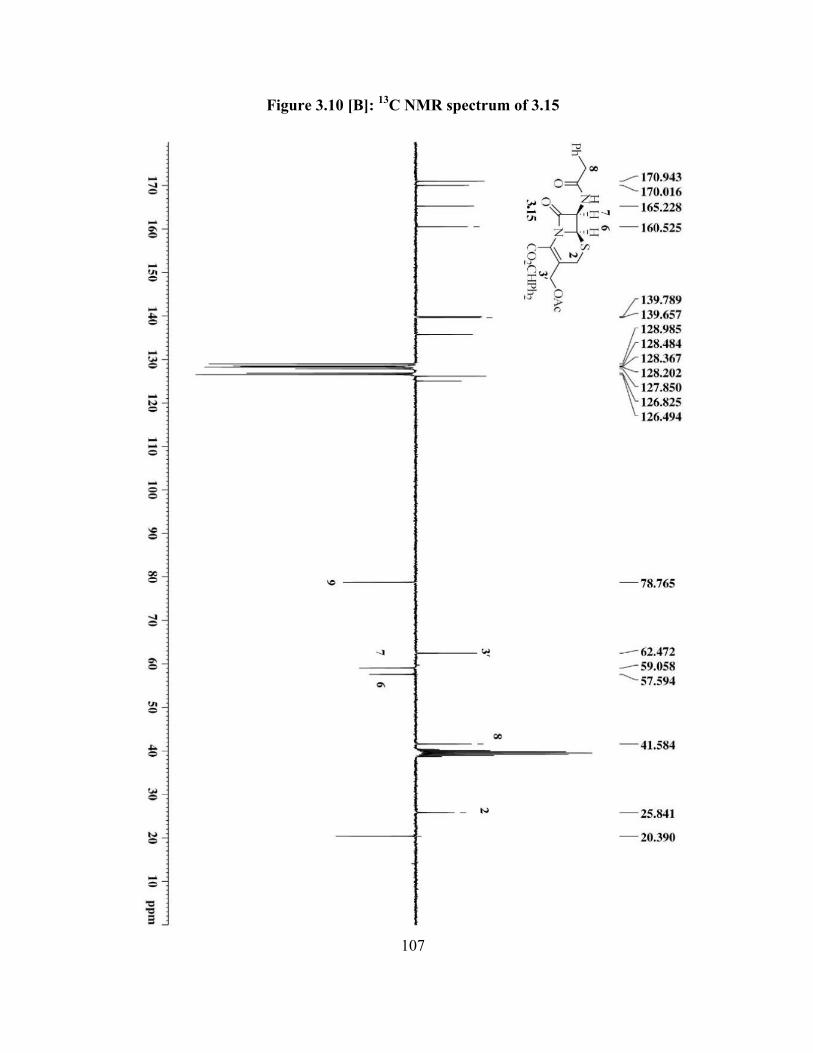
107
Figure 3.10 [B]: 13C NMR spectrum of 3.15
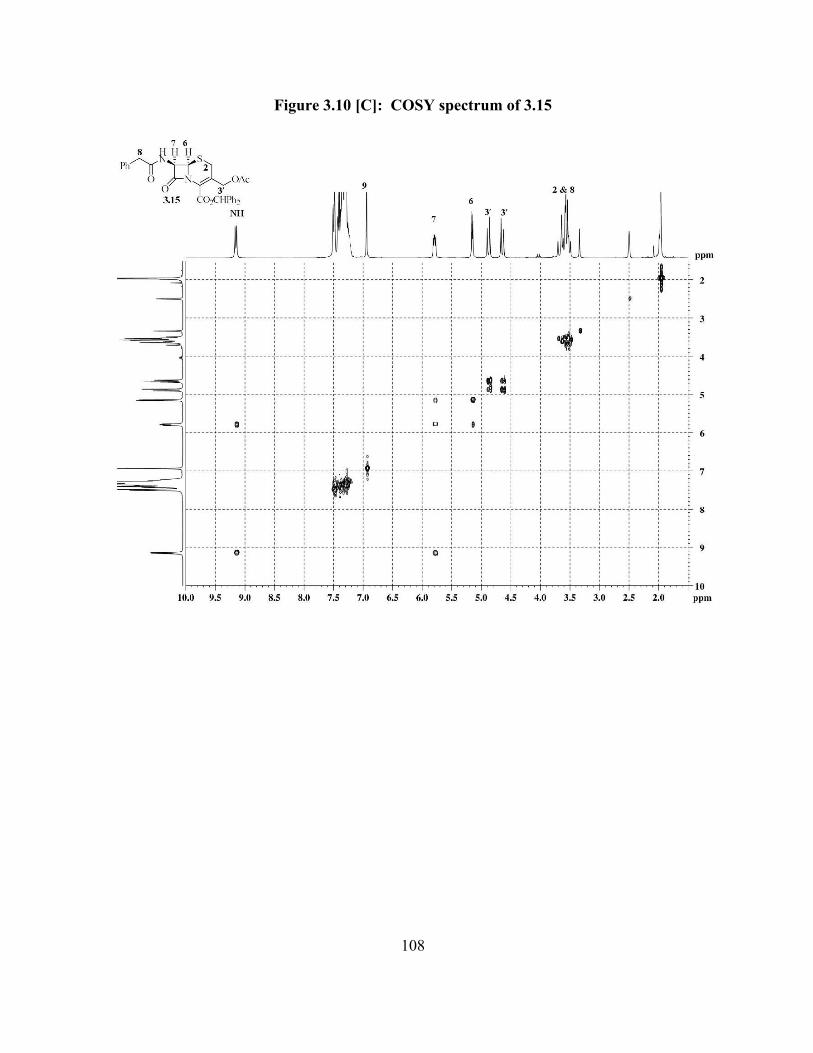
108
Figure 3.10 [C]: COSY spectrum of 3.15
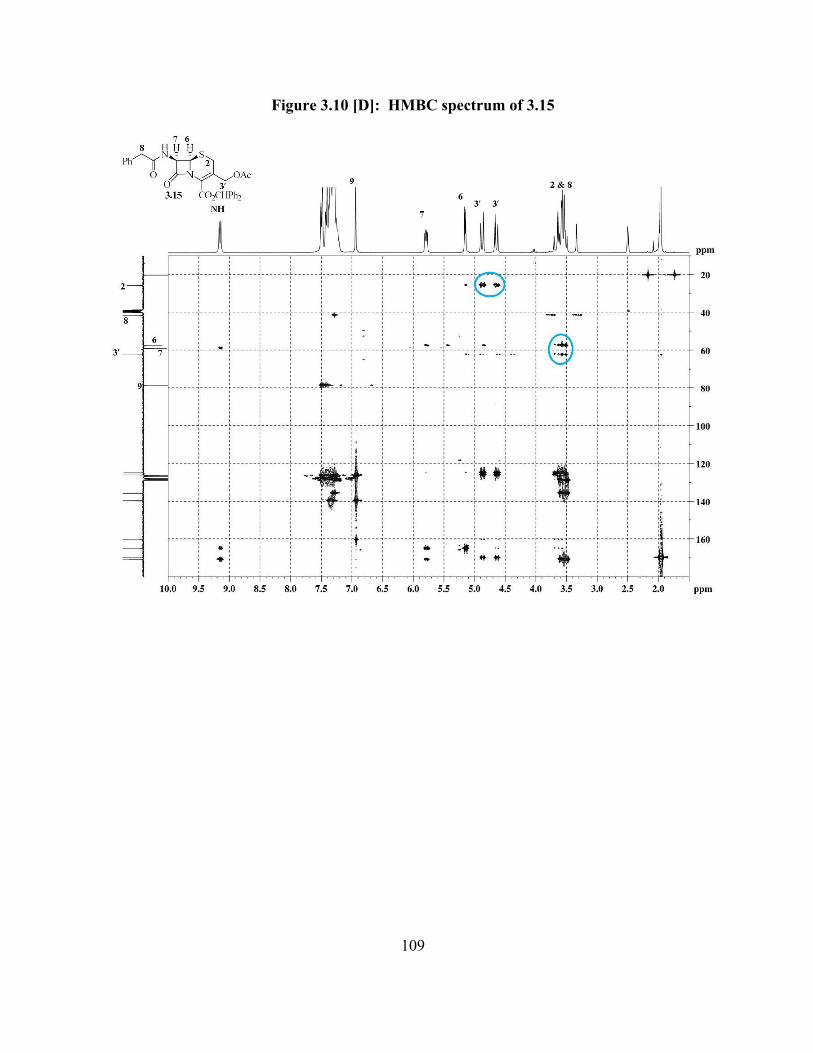
109
Figure 3.10 [D]: HMBC spectrum of 3.15
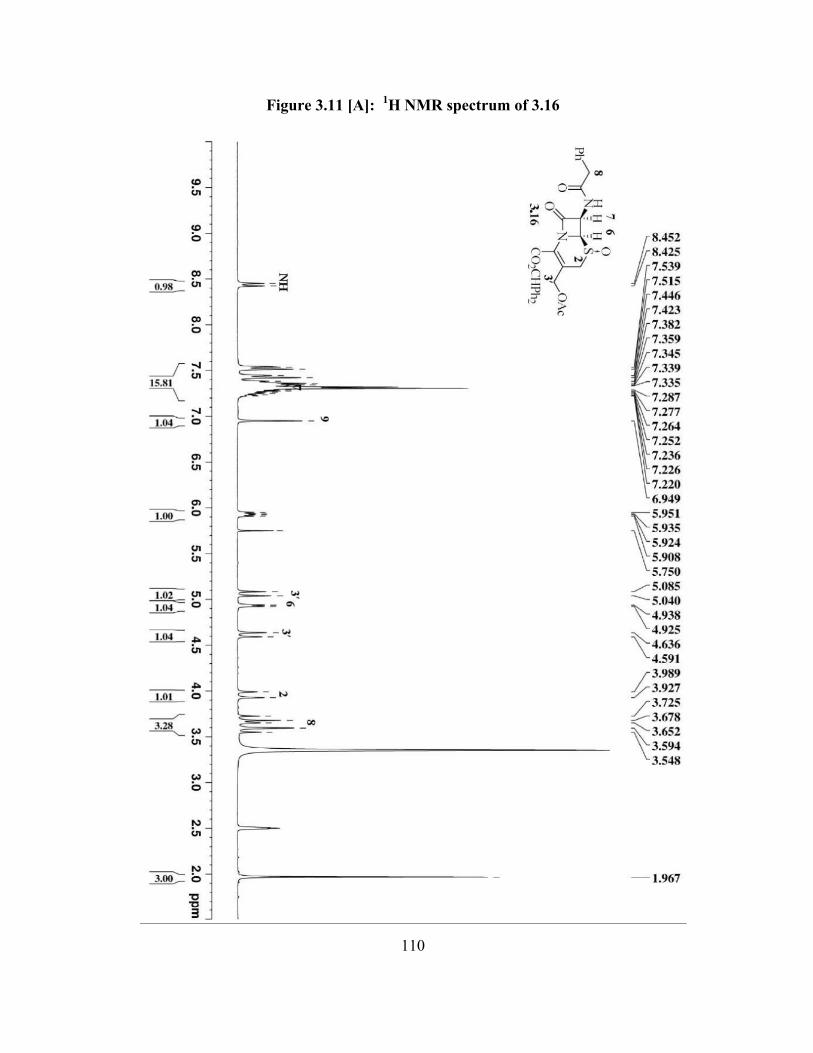
110
Figure 3.11 [A]: 1H NMR spectrum of 3.16

111
Figure 3.11 [B]: 13C NMR spectrum of 3.16
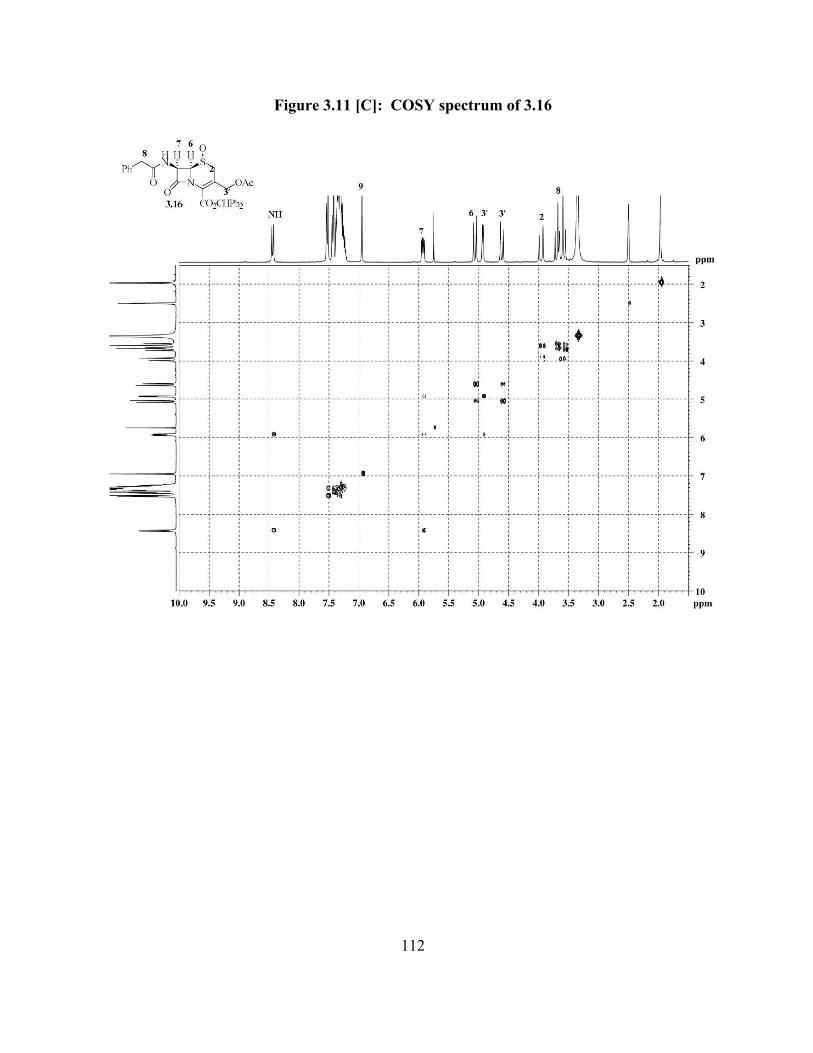
112
Figure 3.11 [C]: COSY spectrum of 3.16
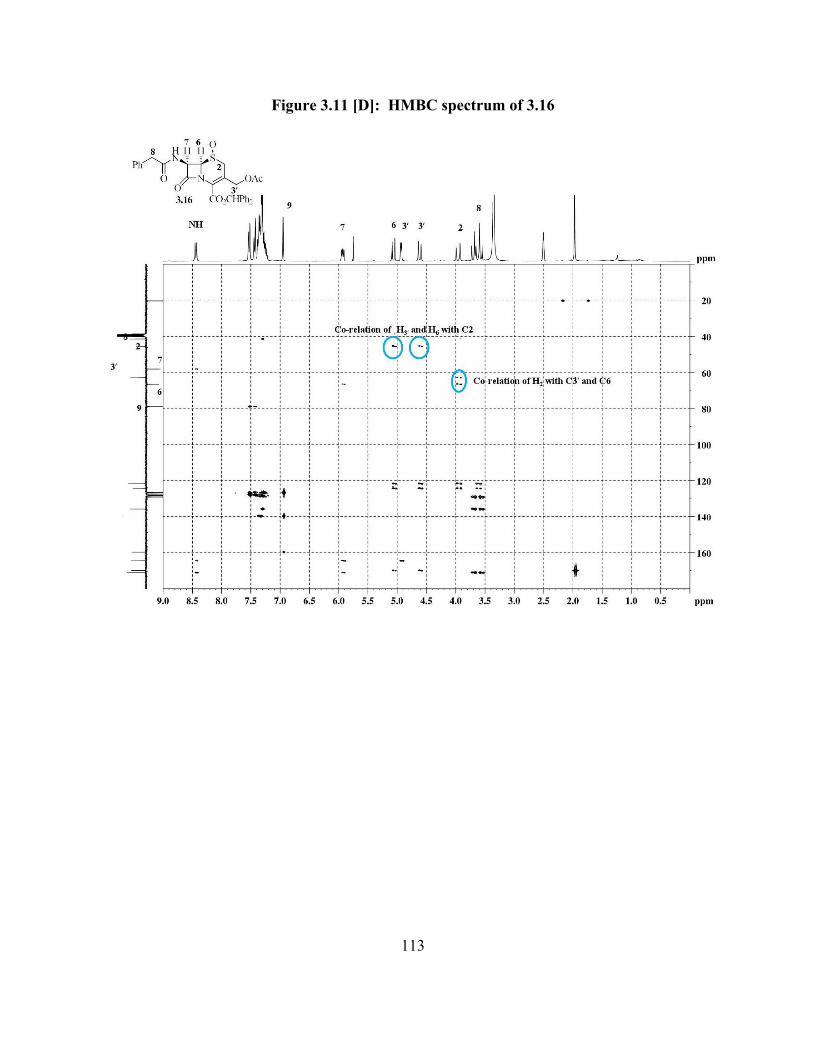
113
Figure 3.11 [D]: HMBC spectrum of 3.16
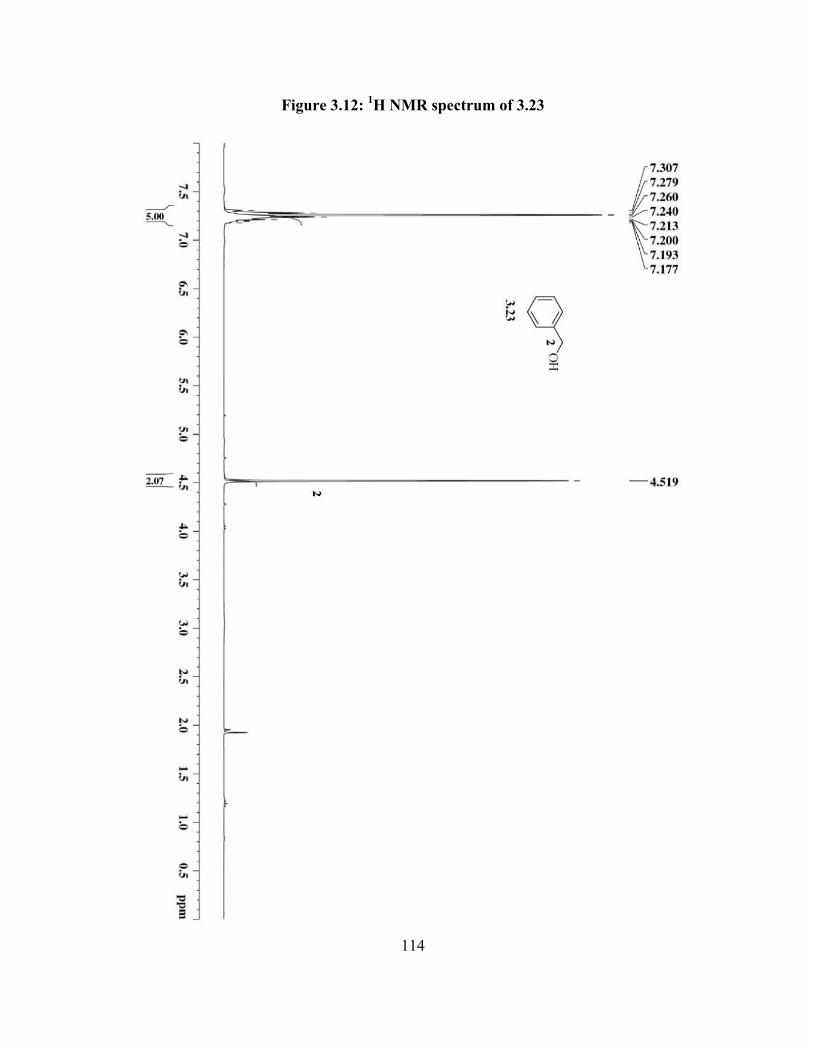
114
Figure 3.12: 1H NMR spectrum of 3.23

115
Figure 3.13 [A]: 1H NMR spectrum of 3.24
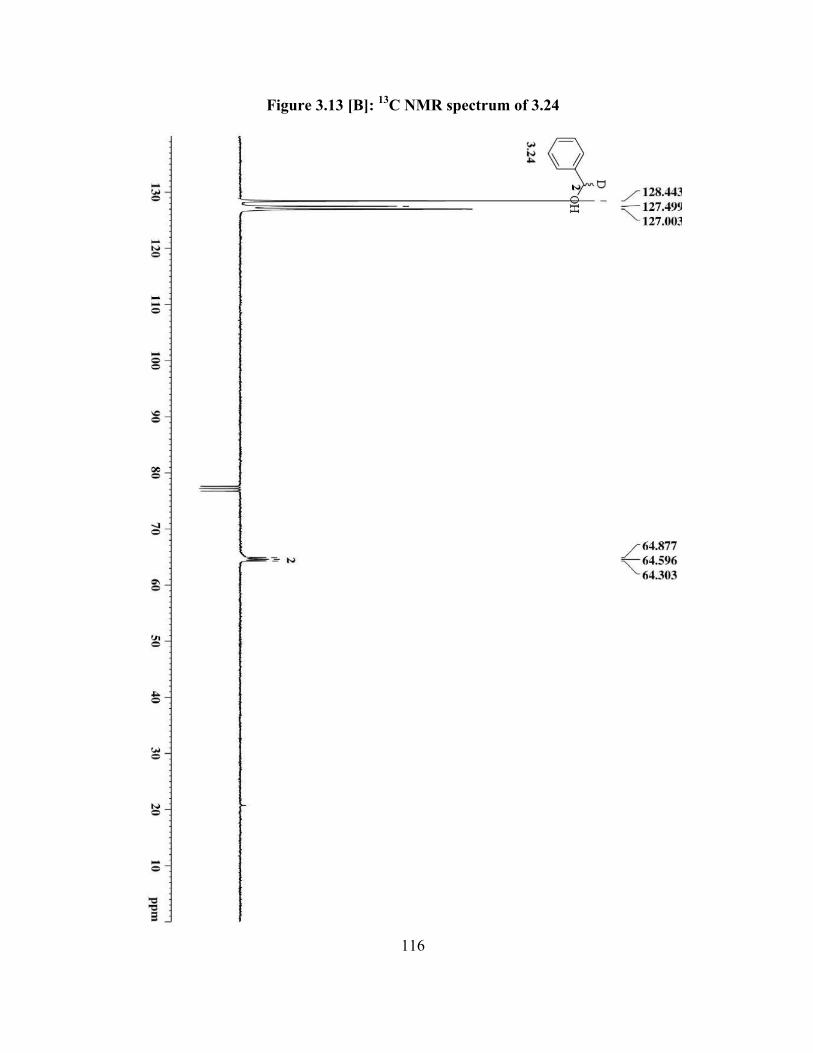
116
Figure 3.13 [B]: 13C NMR spectrum of 3.24

117
Figure 3.14: 1H NMR spectrum of 3.27

118
Figure 3.15 [A]: 1H NMR spectrum of 3.28
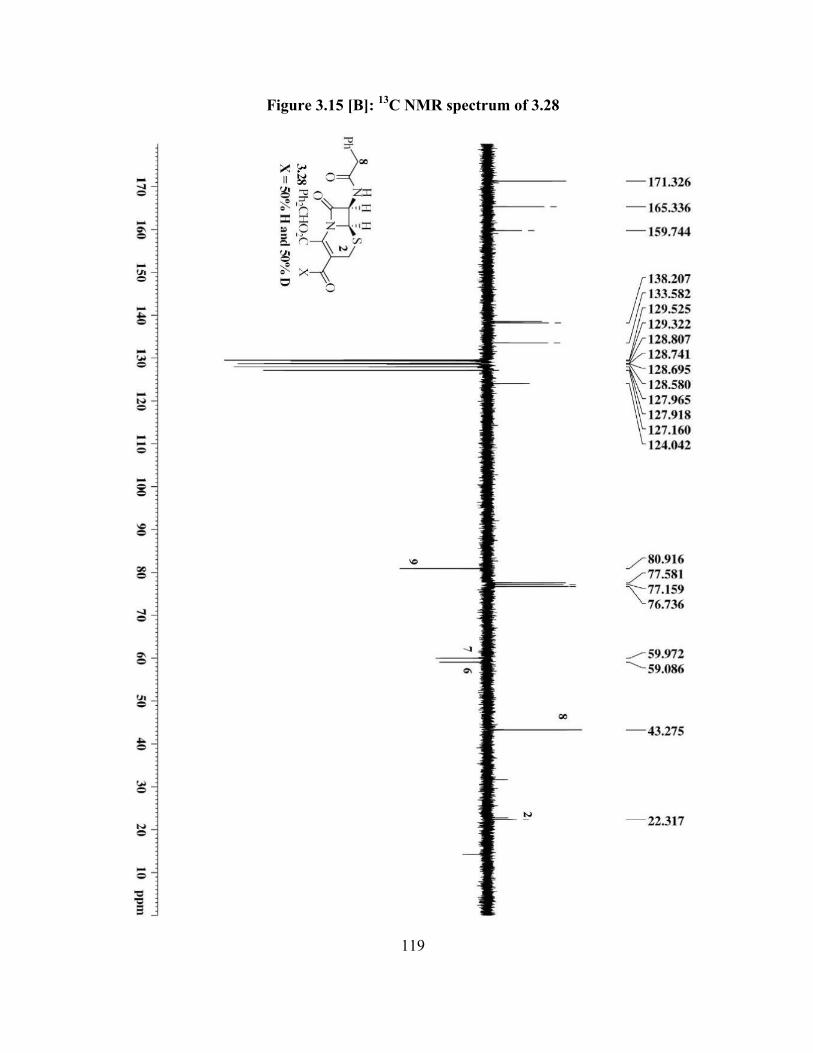
119
Figure 3.15 [B]: 13C NMR spectrum of 3.28
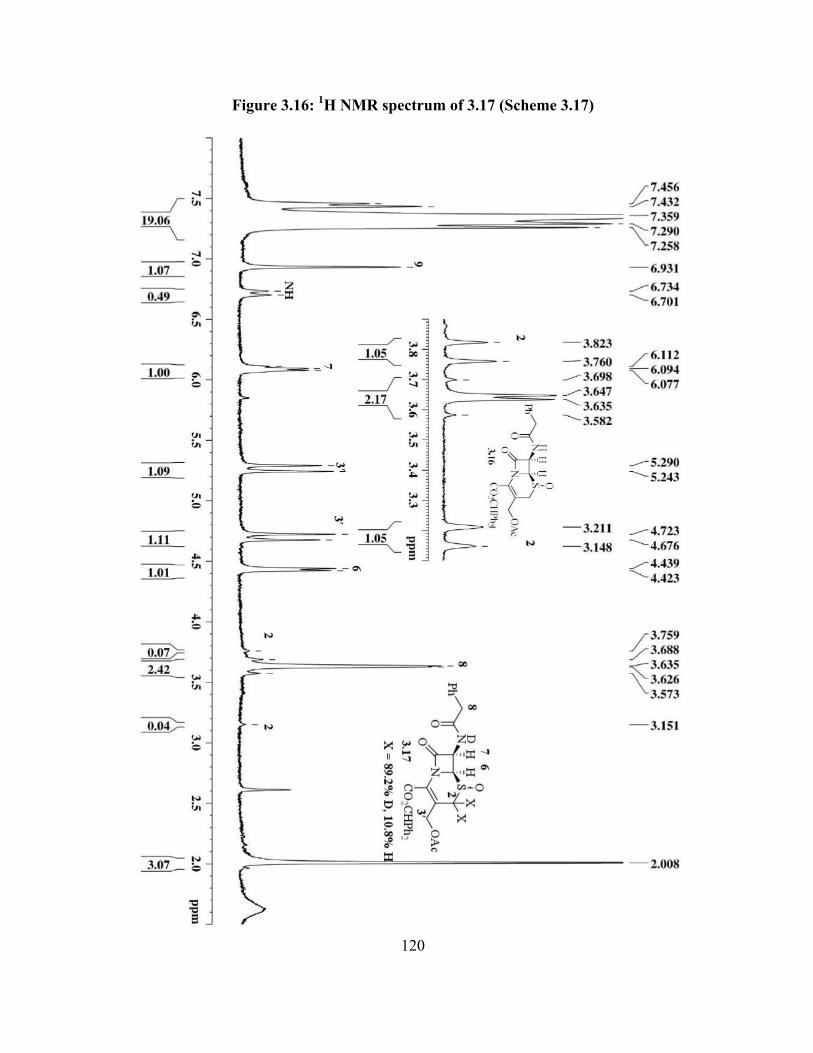
120
Figure 3.16: 1H NMR spectrum of 3.17 (Scheme 3.17)
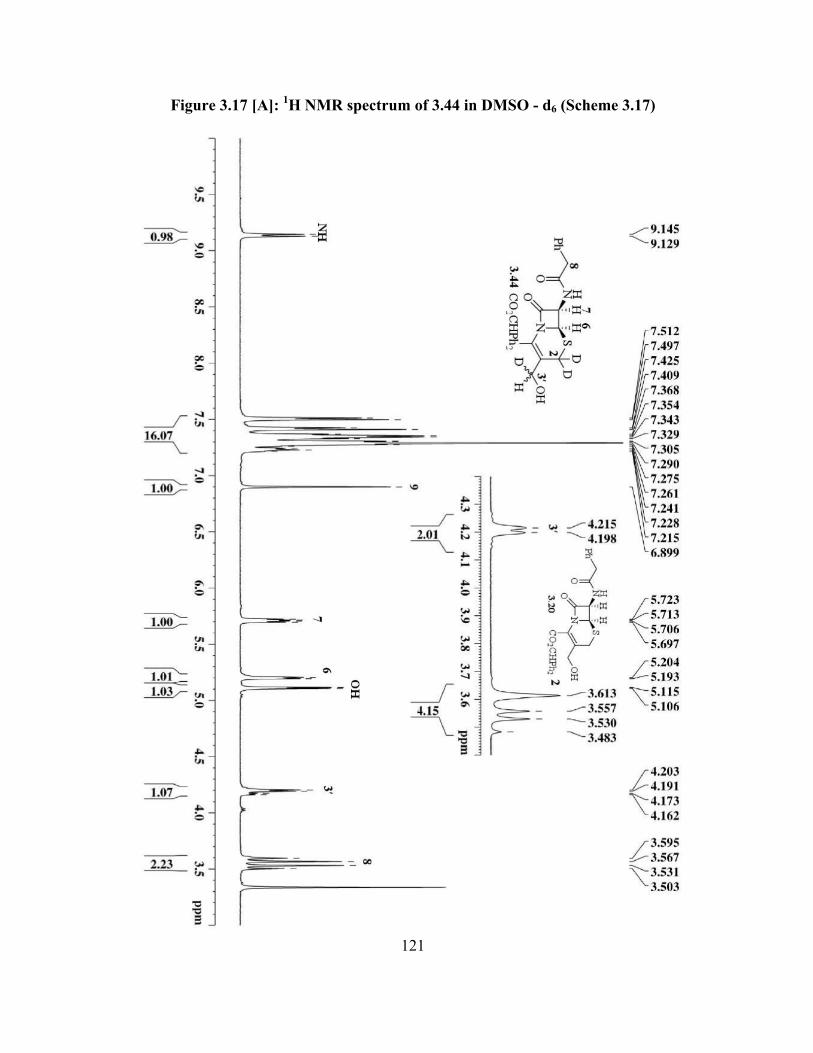
121
Figure 3.17 [A]: 1H NMR spectrum of 3.44 in DMSO - d6 (Scheme 3.17)

122
Figure 3.17 [B]: 1H NMR spectrum of 3.44 in Acetone - d6 (Scheme 3.17)

123
Figure 3.18 [A]: 1H NMR spectrum of 3.46
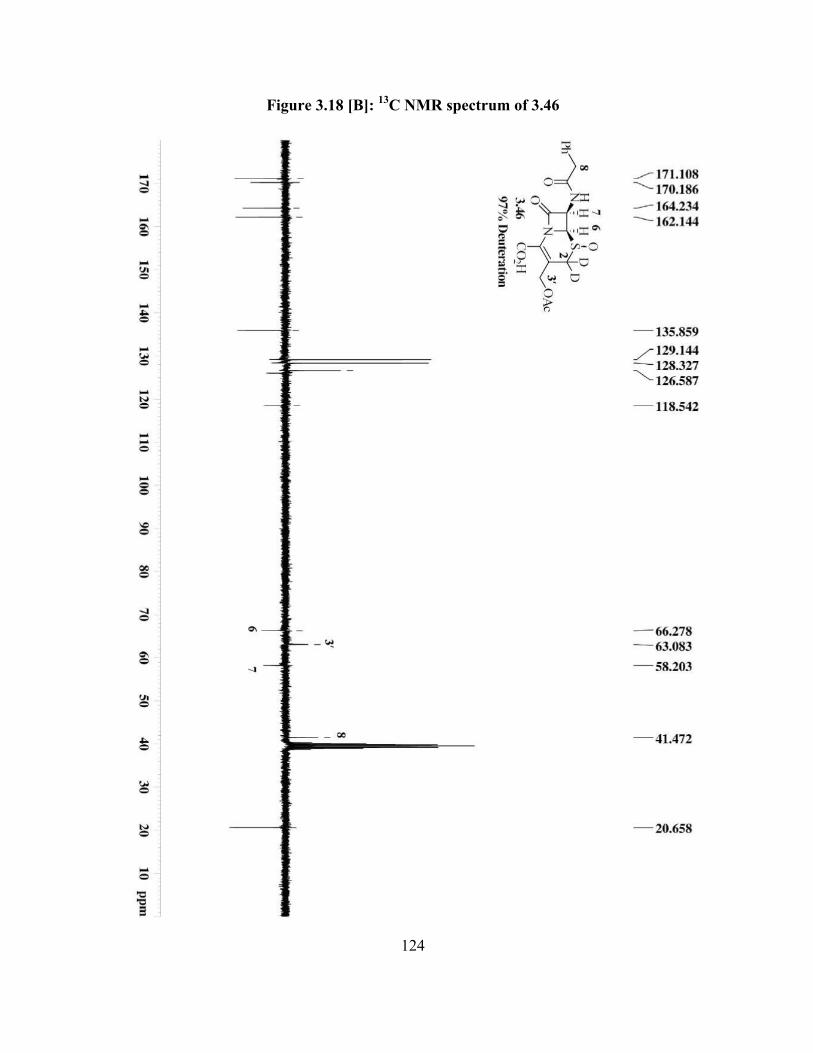
124
Figure 3.18 [B]: 13C NMR spectrum of 3.46
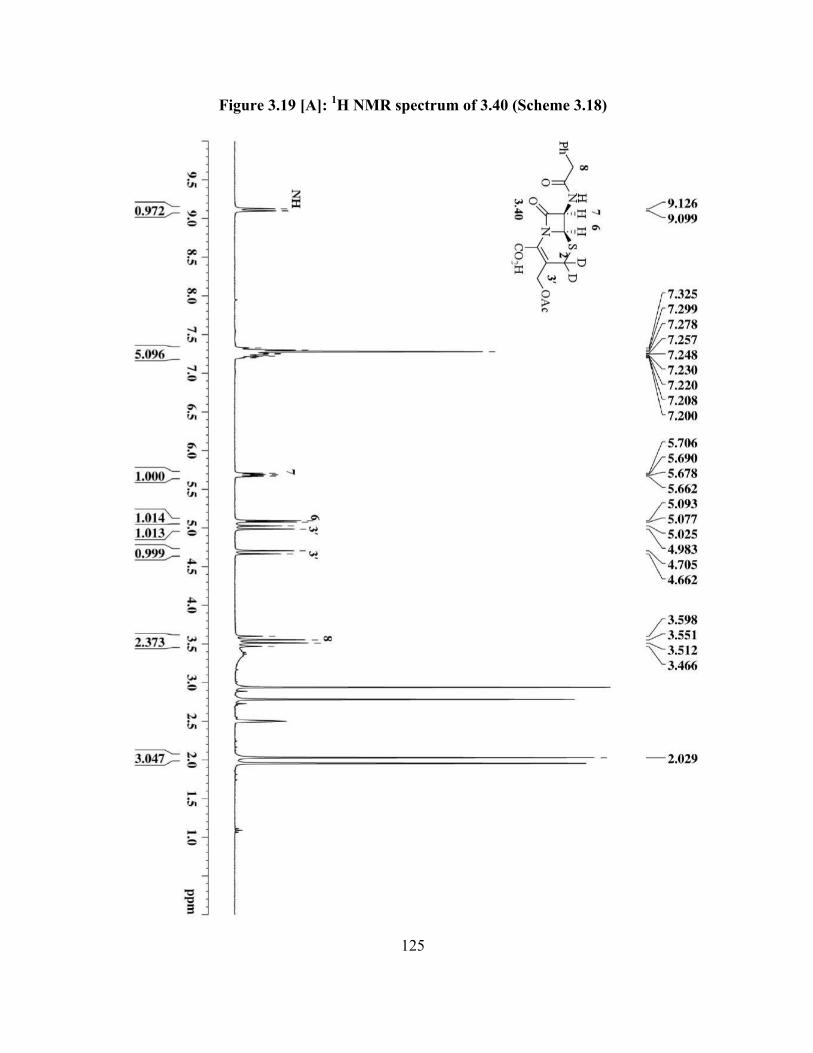
125
Figure 3.19 [A]: 1H NMR spectrum of 3.40 (Scheme 3.18)
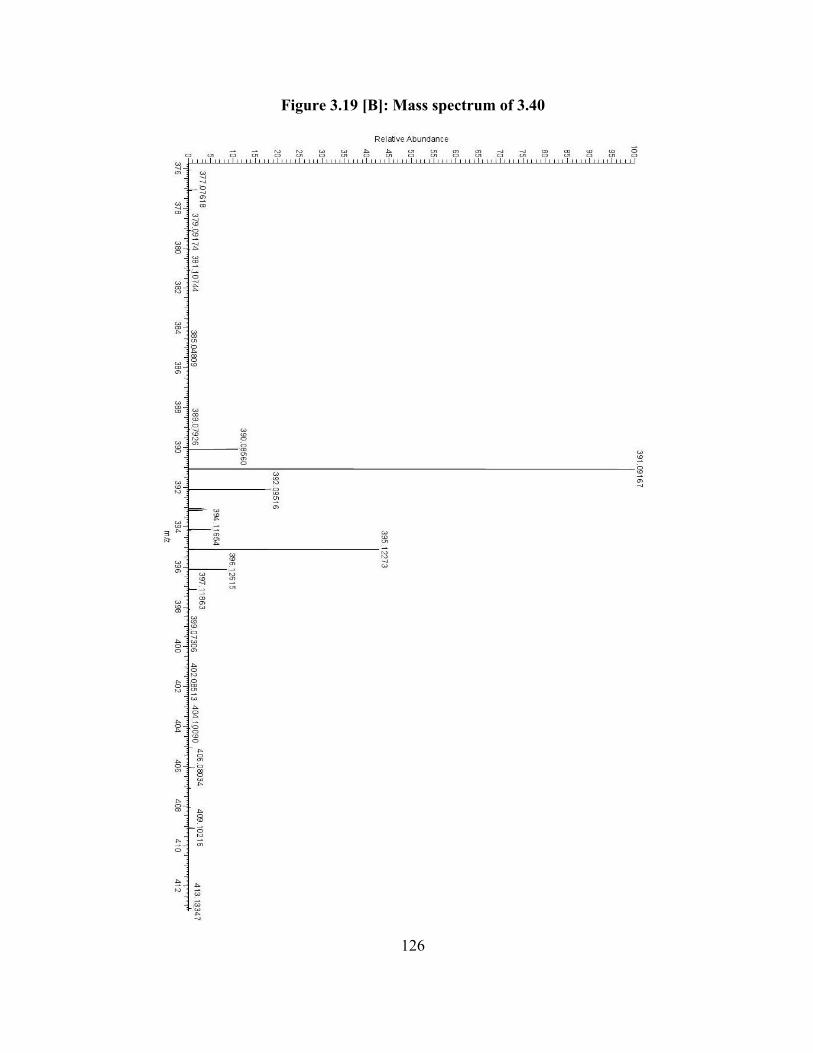
126
Figure 3.19 [B]: Mass spectrum of 3.40
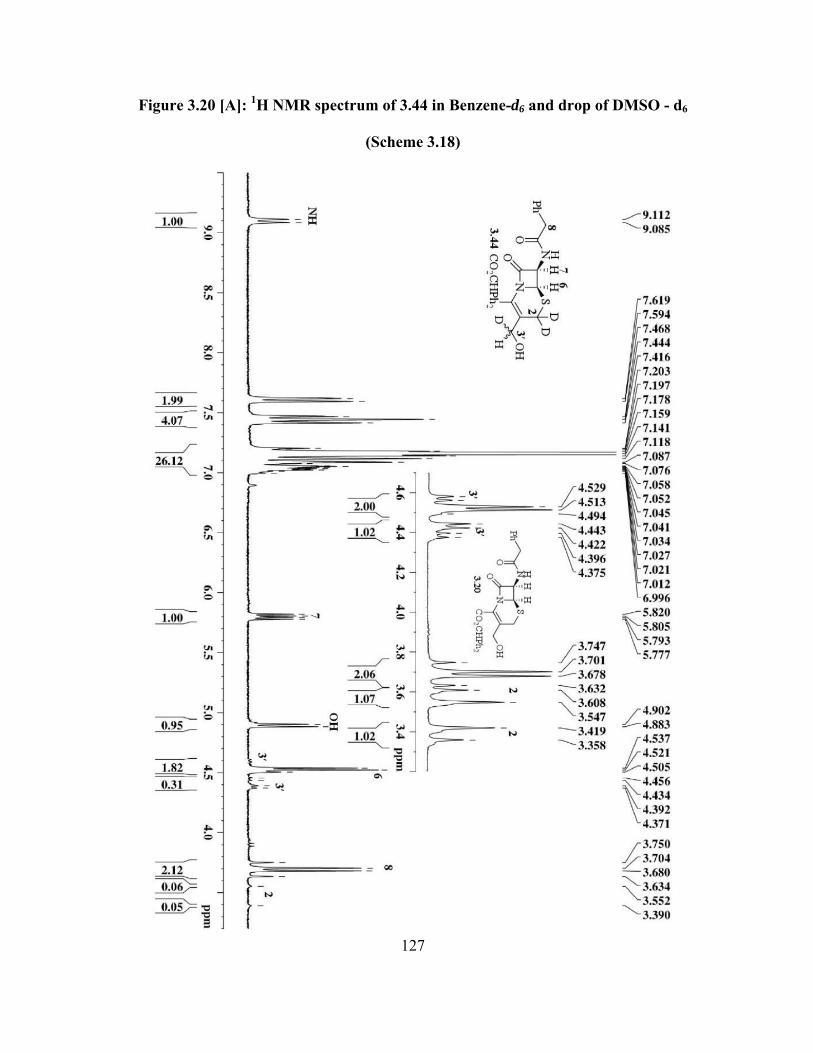
127
Figure 3.20 [A]: 1H NMR spectrum of 3.44 in Benzene-d6 and drop of DMSO - d6
(Scheme 3.18)

128
Figure 3.20 [B]: 1H NMR spectrum of 3.44 in Acetone - d6 (Scheme 3.18)
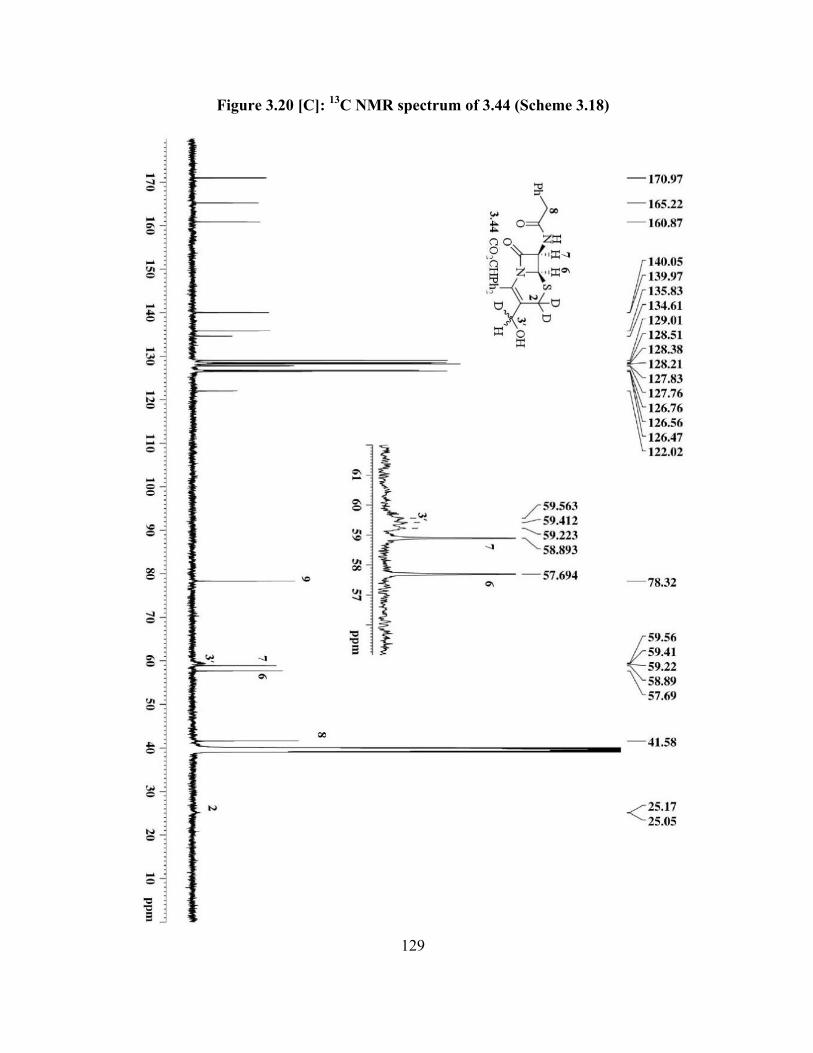
129
Figure 3.20 [C]: 13C NMR spectrum of 3.44 (Scheme 3.18)

130
Figure 3.20 [D]: Mass spectrum of 3.44 (Scheme 3.18)

131
References
(1) Demain, A. L.; Elander, R. P. The -Lactam Antibiotics: Past, Present, and Future.
Antonie Van Leeuwenhoek 1999, 75, 5–19.
(2) Fernandes, P. Antibacterial Discovery and Development - the Failure of Success? Nat.
Biotechnol. 2006, 24, 1497–1503.
(3) Poole, K. Resistance to -Lactam Antibiotics. Cell. Mol. Life Sci. 2004, 61, 2200–2223.
(4) Kong, K.-F.; Schneper, L.; Mathee, K. -Lactam Antibiotics: From Antibiosis to
Resistance and Bacteriology. APMIS 2010, 118, 1–36.
(5) Palumbi, S. R. Humans as the World’s Greatest Evolutionary Force. Science 2001, 293,
1786–1790.
(6) D’Costa, V. M.; King, C. E.; Kalan, L.; Morar, M.; Sung, W. W. L.; Schwarz, C.;
Froese, D.; Zazula, G.; Calmels, F.; Debruyne, R.; Golding, G. B.; Poinar, H. N.;
Wright, G. D. Antibiotic Resistance Is Ancient. Nature 2011, 477, 457–461.
(7) Abraham, E. P. A Glimpse of the Early History of the Cephalosporins. Rev. Infect. Dis.
1979, 1, 99–105.
(8) Fisher, J. F.; Meroueh, S. O.; Mobashery, S. Bacterial Resistance to -Lactam
Antibiotics: Compelling Opportunism, Compelling Opportunity. Chem. Rev. 2005, 105,
395–424.
(9) Llarrull, L. I.; Testero, S. a; Fisher, J. F.; Mobashery, S. The Future of the -Lactams.
Curr. Opin. Microbiol. 2010, 13, 551–557.
(10) Zaffiri, L.; Gardner, J.; Toledo-Pereyra, L. H. History of Antibiotics. From Salvarsan to
Cephalosporins. J. Invest. Surg. 2012, 25, 67–77.

132
(11) Abraham, E. P. Sir Robert Robinson and the Early History of Penicillin. Nat. Prod.
reports 1987, 4, 41–46.
(12) Abraham, E.; Chain, E.; Fletcher, C.; Gardner, A.; Heatley, N.; Jennings, M. Further
Observations on Penicillin. Lancet 1941, 177–189.
(13) Rolinson, G. N. Forty Years of -Lactam Research. J. Antimicrob. Chemother. 1998, 41,
589–603.
(14) Josephine, H. R.; Kumar, I.; Pratt, R. F. The Perfect Penicillin? Inhibition of a Bacterial
DD-Peptidase by Peptidoglycan-Mimetic -Lactam. J. Am. Chem. Soc. 2004, 126,
8122–8123.
(15) Rolinson, G. N. 6-APA and the Development of the -Lactam Antibiotics. J.
Antimicrob. Chemother. 1979, 5, 7–14.
(16) Hamilton-Miller, J. M. T. Sir Edward Abraham’s Contribution to the Development of
the Cephalosporins: A Reassessment. Int. J. Antimicrob. Agents 2000, 15, 179–184.
(17) Cohen, N. C. -Lactam Antibiotics : Geometrical Requirements for Antibacterial
Activities. J. Med. Chem. 1983, 26, 259–264.
(18) White, A. R.; Kaye, C.; Poupard, J.; Pypstra, R.; Woodnutt, G.; Wynne, B. Augmentin®
(amoxicillin/clavulanate) in the Treatment of Community-Acquired Respiratory Tract
Infection : A Review of the Continuing Development of an Innovative Antimicrobial
Agent. J. Antimicrob. Chemother. 2004, 53, i3–i20.
(19) Abraham, E.; Newton, G. The Structure of Cephalosporin C. Biochem. J. 1961, 79, 377–
393.

133
(20) Loder, B.; Newton, G.; Abraham, E. The Cephalosporin C Nucleus (7-
Aminocephalosporanic Acid) and Some of Its Derivatives. Biochem. J. 1961, 79, 408–
416.
(21) Page, M. G. P. Cephalosporins in Clinical Development. Expert Opin. Investig. Drugs
2004, 13, 973–985.
(22) Riccobene, T.; Su, S. F.; Rank, D. Single- and Multiple-Dose Study to Determine the
Safety, Tolerability, and Pharmacokinetics of Ceftaroline Fosamil in Combination with
Avibactam in Healthy Subjects. Antimicrob. Agents Chemother. 2013, 57, 1496–1504.
(23) Moellering, R. C. J. Antibiotic Resistance: Lessons for the Future. Clin. Infect. Dis.
1998, 27, S135–S140.
(24) Drawz, S. M.; Bonomo, R. A. Three Decades of -Lactamase Inhibitors. Clin.
Microbiol. Rev. 2010, 23, 160–201.
(25) Bax, R.; Griffin, D. Introduction: Antibiotic Resistance. Chem. Rev. 2005, 105, 391–
393.
(26) Wilke, M. S.; Lovering, A. L.; Strynadka, N. C. J. -Lactam Antibiotic Resistance: A
Current Structural Perspective. Curr. Opin. Microbiol. 2005, 8, 525–533.
(27) Koch, A. L. Bacterial Wall as Target for Attack: Past, Present, and Future Research.
Clin. Microbiol. Rev. 2003, 16, 673–687.
(28) Vollmer, W.; Blanot, D.; de Pedro, M. A. Peptidoglycan Structure and Architecture.
FEMS Microbiol. Rev. 2008, 32, 149–167.
(29) Wise, E.; Park, J. Penicillin: Its Basic Site of Action as an Inhibitor of a Peptide Cross-
Linking Reaction in Cell Wall Mucopeptide Synthesis. PNAS 1965, 54, 75–81.

134
(30) Salton, M. R. J. Studies of the Bacterial Cell Wall VIII. Reaction of Walls with
Hydrazine and with Fluorodinitrobenzene. Biochim. Biophys. Acta 1961, 52, 329–342.
(31) Tipper, D.; Strominger, J. Mechanism of Action of Penicillins: A Proposal Based on
Their Structural Similarity to Acyl-D-Alanyl-D-Alanine. PNAS 1965, 54, 1133–1141.
(32) Knowles, J. R. Penicillin Resistance: The Chemistry of -Lactamase Inhibition. Acc.
Chem. Res. 1985, 18, 97–104.
(33) Francisco J; Bou, G. -Lactamase Inhibitors : The Story so Far. Curr. Med. Chem. 2009,
16, 3740–3765.
(34) Dmitrienko, G. I.; Ghavami, A.; Goodfellow, V. J.; Johnson, J. W.; Krismanich, A. P.;
Marrone, L.; Viswanatha, T. Cephalosporin Derivatives Useful as -Lactamase
Inhibitors and Compositions and Methods of Use Thereof. WO 2011/103686 A1, 2011.
(35) Bush, K.; Jacoby, G. A.; Medeiros, A. A Functional Classification Scheme for -
Lactamases and Its Correlation with Molecular Structure. Antimicrob. Agents
Chemother. 1995, 39, 1211–1233.
(36) Hall, B. G.; Barlow, M. Revised Ambler Classification of -Lactamases. J. Antimicrob.
Chemother. 2005, 55, 1050–1051.
(37) Bush, K.; Jacoby, G. A. Updated Functional Classification of -Lactamases. Antimicrob.
Agents Chemother. 2010, 54, 969–976.
(38) Miller, B.; Hershberger, E.; Benziger, D.; Trinh, M.; Friedland, I. Pharmacokinetics and
Safety of Intravenous Ceftolozane-Tazobactam in Healthy Adult Subjects Following
Single and Multiple Ascending Doses. Antimicrob. Agents Chemother. 2012, 56, 3086–
3091.

135
(39) Tsuji, M.; Ito, A.; Horiyama, T.; Fukuhara, N.; Nakamura, R.; Yamano, Y.; Shimada, J.;
Ishii, Y.; Yamaguchi, K.; Tateda, K. S-649266, A Novel Siderophore Cephalosporin:
Mechanisms of Enhanced Activity and -Lactamase Stability. In
https://idsa.confex.com/idsa/2014/webprogram/Handout/id2651/POSTER40_256.pdf;
2014.
(40) Fan, J.; de Lannoy, I. Pharmacokinetics. Biochem. Pharmacol. 2014, 87, 93–120.
(41) Gonçalves-Pereira, J.; Póvoa, P. Antibiotics in Critically Ill Patients: A Systematic
Review of the Pharmacokinetics of -Lactams. Crit. Care 2011, 15:R206, 1–17.
(42) Derendorf, H.; Meibohm, B. Modeling of Pharmacokinetic/Pharmacodynamic (PK/PD)
Relationships: Concepts and Perspectives. Pharm. Res. 1999, 16, 176–185.
(43) Ohmori, T.; Suzuki, A.; Niwa, T.; Ushikoshi, H.; Shirai, K.; Yoshida, S.; Ogura, S.;
Itoh, Y. Simultaneous Determination of Eight -Lactam Antibiotics in Human Serum by
Liquid Chromatography-Tandem Mass Spectrometry. J. Chromatogr. B. Analyt.
Technol. Biomed. Life Sci. 2011, 879, 1038–1042.
(44) Mouton, J. W.; Vinks, A. Is Continuous Infusion of -Lactam Antibiotics Worthwhile? -
Efficacy and Pharmacokinetic Considerations. J. Antimicrob. Chemother. 1996, 38, 5–
15.
(45) Walsh, C. Where Will New Antibiotics Come From? Nat. Rev. Microbiol. 2003, 1, 65–
70.
(46) Scaglione, F. Can PK/PD Be Used in Everyday Clinical Practice. Int. J. Antimicrob.
Agents 2002, 19, 349–353.
(47) Chandana, N.; Harithapavani, K.; Ramani, D.; Maduri, J. A Review on Liquid
Chromatography - Tandem Mass Spectroscopy. J. Chem. Pharm. Sci. 2013, 6, 210–217.
136
(48) Lara, F. J.; Olmo-iruela, M.; Cruces-blanco, C.; Quesada-molina, C.; Garcı, A. M.
Advances in the Determination of -Lactam Antibiotics by Liquid Chromatography.
Trends Anal. Chem. 2012, 38, 52–66.
(49) Himmelsbach, M. 10 Years of MS Instrumental Developments - Impact on LC-MS/MS
in Clinical Chemistry. J. Chromatogr. B 2012, 883-884, 3–17.
(50) Grebe, S. K.; Singh, R. J. LC-MS/MS in the Clinical Laboratory - Where to From Here?
Clin. Biochem. Rev. 2011, 32, 5–31.
(51) Wolff, F.; Deprez, G.; Seyler, L.; Taccone, F.; Hites, M.; Gulbis, B.; Vincent, J.-L.;
Jacobs, F.; Cotton, F. Rapid Quantification of Six -Lactams to Optimize Dosage
Regimens in Severely Septic Patients. Talanta 2013, 103, 153–160.
(52) Xu, R. N.; Fan, L.; Rieser, M. J.; El-Shourbagy, T. Recent Advances in High-
Throughput Quantitative Bioanalysis by LC-MS/MS. J. Pharm. Biomed. Anal. 2007, 44,
342–355.
(53) Signs, S.; File, T.; Tan, J. High-Pressure Liquid Chromatographic Method for Analysis
of Cephalosporins. Antimicrob. Agents Chemother. 1984, 26, 652–655.
(54) Wieling, J. LC-MS-MS Experiences with Internal Standards. Chromatogr. Suppl. 2002,
55, S107–S113.
(55) Carlier, M.; Stove, V.; Roberts, J.; Van de Velde, E.; De Waele, J. J.; Verstraete, A. G.
Quantification of Seven -Lactam Antibiotics and Two -Lactamase Inhibitors in
Human Plasma Using a Validated UPLC-MS/MS Method. Int. J. Antimicrob. Agents
2012, 40, 416–422.

137
(56) Bergeron, A.; Furtado, M.; Garofolo, F. Importance of Using Highly Pure Internal
Standards for Successful Liquid chromatography/Tandem Mass Spectrometric
Bioanalytical Assays. Rapid Commun. Mass Spectrom. 2009, 23, 1287–1297.
(57) Katz, J. Deuterium and Tritium. Kirk-Othmer Encycl. Chem. Technol. 2000, 8, 456–485.
(58) Sawama, Y.; Monguchi, Y.; Sajiki, H. Efficient H-D Exchange Reactions Using
Heterogeneous Platinum-Group Metal on Carbon-H2-D2O System. Synlett 2012, 23,
959–972.
(59) Atzrodt, J.; Derdau, V.; Fey, T.; Zimmermann, J. The Renaissance of H/D Exchange.
Angew. Chem. Int. Ed. Engl. 2007, 46, 7744–7765.
(60) Cooper, R. D. G. Structural Studies of Penicillin Derivatives. V. Penicillin Sulfixide-
Sulfenic Acid Equilibrium. J. Am. Chem. Soc. 1970, 92, 5010–5011.
(61) Richter, W. F.; Chong, Y. H.; Stella, V. J. On the Mechanism of Isomerization of
Cephalosporin Esters. J. Pharm. Sci. 1990, 79, 185–186.
(62) Watanabe, T.; Takeru, H.; Buarenteino, J. 7-Methoxycephalosporin Compound and Its
Preparation. JPS56167690 (A) 1981, 12–23.
(63) Baldwin, J. E.; Chakravarti, B.; Jung, M.; Patel, N. J.; Singh, P. D.; Usher, J. J.; Vallejo,
C. On the Possible Role of the 3-Methylene Isomer of Deacetoxycephalosporin C in the
Biosynthesis of Cephalosporins. J.C.S. Chem. Comm. 1981, 699, 934–936.
(64) Cocker, J. D.; Eardley, S.; Gregory, G. I.; Hall, M. E.; Long, A. . Cephalosporanic
Acids. Part IV. 7-Acylamidoceph-2-Em-4-Carboxylic Acids. J. Chem. Soc. 1966, 1142–
1151.
(65) Kim, W.; Ko, K.; Kim, H.; Oh, J. Synthesis and Biological Activity of Novel 3-(2-
Propenyl)-Cephalosporins. I. J. Antibiot. (Tokyo). 1991, 44, 1073–1082.
138
(66) Muriel, S.; Bernard, M. Hybrid Molecules QA Where Q Is an Aminoquinoline and A Is
an Antibiotic Residue, the Synthesis and Uses Thereof as Antibacterial Agents.
(67) Yu, K.; Sun, N.; Fang, S.; Mo, W.; Hu, B.; Shen, Z.; Hu, X. An Improved Process for
the Preparation of Diphenylmethyl 7-Phenylacetamido-3-Hydroxylmethyl-3-Cephem-
4-Carboxylate. Org. Process Res. Dev. 2009, 13, 815–819.
(68) Iwasaki, H.; Hosotani, R.; Nakano, Y.; Konno, K.; Takayama, H. Improved and
Efficient Synthesis of 1-Hydroxy-[6-2H] and 1-Hydroxy-[6,19,19-2H] Vitamin D3
Derivatives. Steroids 1999, 64, 396–403.
(69) Goro, W. Basicity of Dimethyl Sulfoxide in an Aqueous Solution as Measured by the
Spectrophotometric Indicator Method. Bull. Chem. Soc. Jpn. 1969, 42, 890–893.
(70) Serjeant, E.; Dempsey, B. Ionization Constants of Organic Acids in Aqueous Solution;
1979.
(71) Vervest, I.; Joseph, M. Oxidation Process for Preparing 3-Formyl-Cephem Derivatives.
(72) Atkinson, J. G.; Tremaine, P. H. Preparation of Borodeuterides.
(73) Keltjens, R.; Vadivel, S. K.; Vroom, E. De; Klunder, A. J. H.; Zwanenburg, B. A New
Convenient Synthesis of 3-Carboxycephems Starting from 7-Aminocephalosporanic
Acid ( 7-ACA ). European J. Org. Chem. 2001, 2529–2534.
(74) Gottlieb, H. E.; Kotlyar, V.; Nudelman, A. NMR Chemical Shifts of Common
Laboratory Solvents as Trace Impurities. J. Org. Chem. 1997, 62, 7512–7515.