Embed Size (px)
Citation preview
SYNTHESIS OF SILVER-DIAMOND LIKE CARBON THIN FILMS
BY MAGNETRON SPUTTERING
by
VENKATESH MAJJI
Presented to the Faculty of the Graduate School of
The University of Texas at Arlington in Partial Fulfillment
of the Requirements
for the Degree of
MASTER OF SCIENCE IN MATERIALS SCINCE AND ENGINEERING
THE UNIVERSITY OF TEXAS AT ARLINGTON
May 2013
Copyright © by Venkatesh Majji 2013
All Rights Reserved
iii
ACKNOWLEDGEMENTS
I would like to express my heartful gratitude to my research advisor, Dr.Efstathios I.
Meletis for his excellent guidance and constant encouragement throughout the research work. I
am thankful to Dr. Tibbals and Dr. Liu for their participation as my defense committee members.
I am really thankful to Dr. Taktak for his help in my research work and moral support. I
would also like to thank Jessica Mooney, Cristian Cionea, Adam J. Smith, Yishu Wang, Minghui
Zhang, Elad Har-Even, Tapas Mehul Desai and Aida Mehdinezhad Roshan for their enduring
help during the research work. I am thankful to the various UTA labs that helped in my research,
Surface and Nano Engineering lab (SaNEL), Characterization Center for Materials and Biology.
I wouldn’t have achieved this without the help of my beloved friends, Pradeep
Badrachalam, Amir Salehi Gilani, Uday Kiran Gopalam, Kartik Machiraju, Anudeep Palanki and
Gowtham Pedapudi for their encouragement and help. Finally, I like to express my sincere
appreciation to my parents and family for their strong belief on me.
December 17, 2012
iv
ABSTRACT
SYNTHESIS OF SILVER-DIAMOND LIKE CARBON THIN FILMS
BY MAGNETRON SPUTTERING
Venkatesh Majji, M.S.
The University of Texas at Arlington, 2013
Supervising Professor: Efsthathios I. Meletis
Diamond-like carbon thin films are been used in wide range of applications due to their
attractive tribological properties. Metal-doped DLC films have significant properties which make
them compatible to use in larger variety of applications. The present study examines the
dispersion and their effect on various tribological properties when Ag is incorporated into the
DLC thin films. These Ag-DLC nanocomposite films were synthesized by a hybrid CVD and
magnetron sputtering process in a discharge composed of CH4, and Ar atmosphere. These
DLC and Ag-DLC films were characterized by Transmission Electron Microscopy (TEM), Fourier
Transform Infrared Spectroscopy (FTIR), X-ray Photoelectron Spectroscopy (XPS) and Raman
Spectroscopy. Tribological tests were carried out to measure the frictional and wear behavior of
the Ag-DLC films as a function of Ag content.
The TEM cross sectional studies revealed that Ag is present as Ag nanoparticles that
were distributed uniformly throughout an amorphous DLC matrix. XPS analysis confirmed that
v
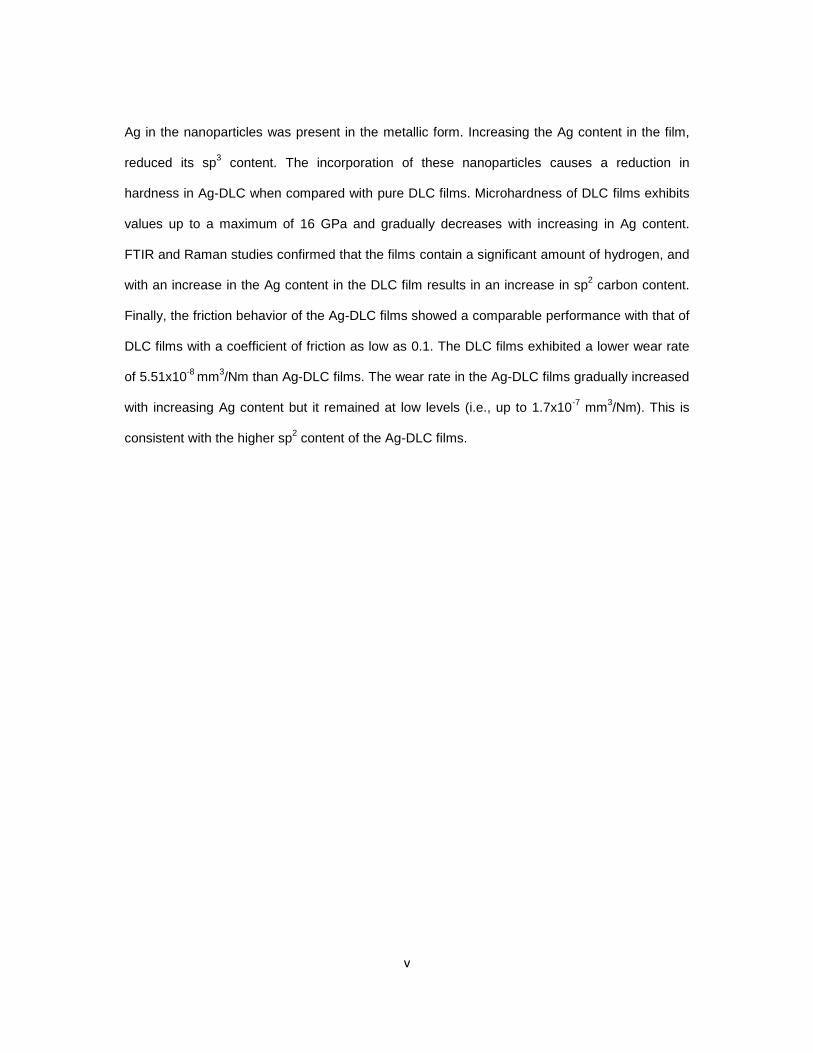
Ag in the nanoparticles was present in the metallic form. Increasing the Ag content in the film,
reduced its sp3 content. The incorporation of these nanoparticles causes a reduction in
hardness in Ag-DLC when compared with pure DLC films. Microhardness of DLC films exhibits
values up to a maximum of 16 GPa and gradually decreases with increasing in Ag content.
FTIR and Raman studies confirmed that the films contain a significant amount of hydrogen, and
with an increase in the Ag content in the DLC film results in an increase in sp2 carbon content.
Finally, the friction behavior of the Ag-DLC films showed a comparable performance with that of
DLC films with a coefficient of friction as low as 0.1. The DLC films exhibited a lower wear rate
of 5.51x10⁻⁸
mm3/Nm than Ag-DLC films. The wear rate in the Ag-DLC films gradually increased
with increasing Ag content but it remained at low levels (i.e., up to 1.7x10⁻⁷
mm3/Nm). This is
consistent with the higher sp2 content of the Ag-DLC films.
vi
TABLE OF CONTENTS
ACKNOWLEDGEMENTS ................................................................................................................iii ABSTRACT ..................................................................................................................................... iv LIST OF ILLUSTRATIONS.............................................................................................................. ix LIST OF TABLES ............................................................................................................................ xi
Chapter Page 1. INTRODUCTION………………………………..………..….. .......................................... 1 2. OBJECTIVE………………………………..………..….. .................................................... 4 3. LITERATURE REVIEW………………………………..………..….. ................................... 5
3.1 Diamond-like Carbon Thin films ....................................................................... 5 3.1.1 DLC Fabrication Techniques .......................................................... 5
3.1.1.1 Ion beam deposition ....................................................... 5 3.1.1.2 Cathodic arc deposition ................................................. 6 3.1.1.3 Magnetron Sputtering ...................................................... 6 3.1.1.4 Pulsed Laser Deposition .................................................. 7 3.1.1.5 Plasma Enhanced Chemical Vapor Deposition .............. 7
3.1.2 Structure and Classification ............................................................. 8
3.2 Metal Doped-diamond-like Carbon Thin films ............................................... 11 3.2.1 Various Metal doped DLC Thin films ............................................. 11 3.2.2 Ag doped DLC Thin films .............................................................. 13 3.2.3 Mechanical and Tribological Properties ......................................... 14 3.2.4 Applications of DLC thin films ........................................................ 18
vii
4. EXPERIMENTAL PROCEDURE………………………………..………..….. .................. 21
4.1 Processing System: PECVD/PVD.................................................................. 21
4.1.1 Plasma enhanced CVD/PVD system ............................................ 21 4.1.2 Deposition Procedure for DLC and Ag-DLC Thin films ................. 23
4.2 Characterization of DLC and Ag-DLC Thin films .......................................... 26 4.2.1 Thickness, Surface Roughness and Deposition rate .................... 26 4.2.2 Structural Characterization Techniques ........................................ 26
4.2.2.1 Scanning Electron Microscopy (SEM) ......................... 26 4.2.2.2 Fourier Transform Infrared (FTIR) Spectroscopy ......... 26 4.2.2.3 Transmission Electron Microscopy ............................... 27 4.2.2.4 Raman Spectroscopy .................................................... 27 4.2.2.5 X-Ray Photoelectron Spectroscopy ............................... 27
4.2.3 Mechanical and Tribological Properties ........................................ 28
4.2.3.1 Nanoindentation ............................................................ 28 4.2.3.2 Pin-on-disc Testing ....................................................... 28
5. RESULTS AND DISCUSSION ..................................................................................... 30
5.1 Characterization ............................................................................................. 30
5.1.1 TEM ................................................................................................ 30
5.1.2 XPS ................................................................................................ 33
5.1.3 FTIR ............................................................................................... 38
5.1.4 Raman Spectroscopy ..................................................................... 47
5.2 Mechanical and Tribological Testing ............................................................. 51
5.2.1 Nanoindentation ............................................................................. 51
5.2.2 Pin-on Disc ..................................................................................... 52
6. CONCLUSIONS………………………………..………..….. ............................................ 57

viii
REFERENCES .................................................................................................................. 58
BIOGRAPHICAL INFORMATION ..................................................................................... 65
ix
LIST OF ILLUSTRATIONS
Figure Page
3-1 (a) sp1 hybridization (b) sp
2 hybridization (c) sp
3 hybridization [19]. ....................................... 8
3-2 Ternary phase diagram of DLC [30]. ....................................................................................... 9 3-3 Wear rate of different Me-DLC’s as a function of at.% Me [34].. .......................................... 12 3-4 Friction coefficients of DLC films against bearing steel ball or
Si3N4 ball vary with the increasing in the RH of air [55].. ............................................... 16
3-5 Wear test results of pure DLC, Cu-DLC and Ti-DLC [58]. .................................................... 17
3-6 (a) Hip Joint, (b) Artificial hip joint [59]. ................................................................................. 19 4-1 Schematic representation of hybrid PVD/CVD system. ........................................................ 23 5-1 Elemental analysis of Ag content at different stages of the film for Ag-DLC. ....................... 30 5-2 Ag dispertion in DLC matrix for Ag-DLC (8.5 at.%Ag). ......................................................... 32 5-3 Ag dispertion in DLC matrix for Ag-DLC (2 at.%Ag). ............................................................ 32 5-4 Needle –like structure of agglomerated particles of Ag near the interface. .......................... 33
5-5 High resolution of film substrate interface. ............................................................................ 33
5-6 XPS survey spectrum from DLC thin film.............................................................................. 34
5-7 XPS survey spectrum from DLC thin film containing 3 at % Ag. .......................................... 35
5-8 XPS survey spectrum from DLC thin film containing 8.3 at % Ag. ....................................... 35
5-9 Deconvolution of high resolution of C 1s peak of DLC film................................................... 36
5-10 Deconvolution of high resolution of C 1s peak of DLC thin film containing 3 at % Ag. ...... 37
5-11 Deconvolution of high resolution of C 1s peak of DLC thin film containing 8.3 at % Ag. ... 37
5-12 Comparison of FTIR spectra obtained from the DLC and Ag-DLC thin films. .................... 40
5-13 Deconvolution of the C-H stretch for DLC thin film. ............................................................ 41
x
5-14 Deconvolution of the C-H stretch for Ag-DLC film containing 2 at % Ag. ........................... 42
5-15 Deconvolution of the C-H stretch for Ag-DLC film containing 3 at % Ag. ........................... 43
5-16 Deconvolution of the C-H stretch for Ag-DLC film containing 3.7 at % Ag. ........................ 44
5-17 Deconvolution of the C-H stretch for Ag-DLC film containing 5.7 at % Ag. ........................ 45
5-18 Deconvolution of the C-H stretch for Ag-DLC film containing 8.3 at % Ag. ........................ 46
5-19 Variation of sp3/(sp
2+sp
3) ratio based on C-H bonds with Ag content in DLC films. .......... 47
5-20 Raman spectra of DLC and Ag doped DLC of various Ag content. .................................... 49
5-21 Variation of G-peak and D-peak positions of Raman spectra
as a function of Ag content for DLC and Ag-DLC thin films. .......................................... 50
5-22 Variation of FWHM of G-peak and ID/IG ratio of Raman spectra
as a function of Ag content for DLC and Ag-DLC thin films. .......................................... 51
5-23 Hardness of DLC and Ag-DLC films. .................................................................................. 52
5-24 Steady state coefficient of a) DLC and b) Ag-DLC films (2.8 at.% Ag). .............................. 53
5-25 Friction coefficient of DLC and Ag-DLC films. .................................................................... 54
5-26 Wear track morphology of a) DLC film and b) Ag-DLC film (2.8 at.% Ag). ......................... 55
5-27 Wear rate of DLC and Ag-DLC films. .................................................................................. 56
xi
LIST OF TABLES
Table Page
3-1 Properties of various carbon forms [19] ................................................................................... 10
4-1 DLC and Ag-DLC Experimental conditions .............................................................................. 24
5-1 Ag content at different levels of the film ................................................................................... 31
5-2 Percentage of sp2 and sp
3 in C 1s spectra of DLC and Ag-DLC thin films .............................. 38
5-3 FTIR vibrational mode assignment in the C-H stretch region for DLC film .............................. 41
5-4 FTIR vibrational mode assignment in the C-H stretch region for Ag-DLC film containing 2 at% Ag ................................................................................ 42
5-5 FTIR vibrational mode assignment in the C-H stretch region for Ag-DLC film containing 3at% Ag ................................................................................. 43
5-6 FTIR vibrational mode assignment in the C-H stretch region for Ag-DLC film containing 3.7at%Ag ............................................................................... 44
5-7 FTIR vibrational mode assignment in the C-H stretch region for Ag-DLC film containing 5.7at% Ag.............................................................................. 45
5-8 FTIR vibrational mode assignment in the C-H stretch region for Ag-DLC film containing 8.3at% Ag.............................................................................. 46
1
CHAPTER 1
INTRODUCTION
Carbon can be available in different forms in the environment. One of its forms is diamond;
it has a structure with a network of sp3 domains and has proven to be a unique material with
remarkable properties such as high hardness, optical transparency, thermal conductivity,
chemical inertness, low wear rate with a limitation of high friction coefficient. The other is
graphite; it has a structure with a network of sp2 domains. Because of its layer like structure, it is
a soft material having exceptional properties such as low friction coefficient, good electrical
conductivity with a limitation of high wear rate. Diamond-like carbon (DLC), a new material
obtained from both of these carbon forms and it consists of both sp3 domains and sp
2 domains
[1]. DLC is also referred to as amorphous carbon (a-C) or hydrogenated amorphous carbon (a-
C:H) because of its short range property in structure. Diamond-like carbon had become one of
the most attractive research areas after Aisenberg and Chabot’s report in 1971 [2].
At low deposition temperatures, DLC thin films can be produced on different substrates
with desirable properties like high hardness, thermal conductivity and good optical and electrical
properties. It also has excellent biocompatibility, chemical inertness and tribological behavior,
such as low friction rate and wear rate [3]. The latter makes it an attractive coating material on
biomedical implants, wear resistant materials, antireflective materials and corrosion resistant
material. Under some specific conditions, lubricating properties of both a-C and a-C:H films are
well known. Due to formation of a graphite like transfer film in the sliding contact, the surface of
these films are extremely smooth and the friction coefficient can be less than 0.1 or even as low
as 0.01 depending on the nature of the coating and test conditions [4,5,6].
In this aspect, amorphous hydrogenated carbon DLC films have been extensively studied
in the last two decades and have found a large number of applications [3] However, further
2
utilization is limited due to their low thermal stability (above 350°C), low toughness and
adhesion [3,7]. It has been observed that above 400° C, graphitization of DLC film occurs by
conversion of sp3 carbon bonding to graphitic sp
2 bonding. Such temperatures can very well be
reached during wear at asperity contacts and lead to ‘wear induced graphitization’ of DLC films,
as proposed by Liu and Meletis. In other words, DLC films possess low toughness and these
films are not thermally stable beyond 350oC, as they graphitize and exhibit low wear resistance
[8].
Another drawback of DLC films is that they tend to delaminate or peel off when deposited
above certain thickness. Due to presence of large inherent residual stresses the film has low
adhesion and limited thickness [9]. In thin films, high compressive residual stresses originates
from formation of sp3 interatomic bonds and developed due to temperature changes, lattice
mismatch, high energy of deposited ions and implantation of foreign atoms in the deposited
films. Intrinsic stresses are developed during the growth of thin films. As the thickness of the
films increase, the stresses increase causing the failure of the films by cracking, buckling and
delamination even before the wear. Films with compressive stresses are more desirable than
those with tensile stresses, as the former increases the strength whereas the latter causes
cracks in the films. Stresses due to lattice mismatch can be avoided by using nitride and carbide
interlayers. The other factor influencing the quality of films is the adhesive strength at the
interface. For thin films, the stresses and the adhesion between the substrate and the film are
interrelated. Improvement in the adhesion energy paves path for the prevention of buckling and
delamination caused due to high stresses. Even the coefficient of friction of films decreases with
the decrease in the stresses.
By the addition of metal atoms into the carbon matrix cause great changes in chemical and
tribological properties of DLC coatings; such metal alloyed coatings are often denoted Me-
DLC‘s. In Me-DLC composite films containing metal such as Cu or Ag inert with respect to
carbon, interatomic forces in crystallite–carbon interfaces can be weak. These films may have
3
low internal stress, high ductility and toughness. In other words, the tribological behavior and
friction properties of these Me-DLC composite films such as Cu-C or Ag-C films can be very
distinct from those of carbide forming Me-DLC composite films [10]. There have been extensive
studies on both Me-DLC coatings and conventional DLC coatings, which could be either
hydrogenated or non-hydrogenated. Ag-DLC, has increasingly gained attention because of wide
applications in optical device applications [11], cardiovascular devices or implants due to
surface anti-bacterial properties [12], space devices because of wear resistance against oxygen
plasma etching [13], for low-threshold field emitter application [14], for electrodes in
electrochemical analysis in microelectromechanical systems [15] and tribological applications.
The present research focuses on fundamental aspects such as friction and wear tests that
are reviewed firstly in this research work. Ag-DLC thin films were produced on to a Si100 wafer
and the tribological properties of these coatings were investigated using a pin-on-disk test
geometry in dry sliding conditions. The friction coefficient is measured for different Me-DLC films
at a constant loading condition and the results compared with each other. Chemical
composition, surface morphology and microstructure of the worn wear tracks, debris and pin
contact area were examined using complementary characterization techniques including Digital
Microscopy, Optical Profilometry, Scanning Electron Microscopy (SEM), Energy Dispersive
Spectroscopy (EDS), Transmission Electron Microscopy (TEM), X-ray Photoelectron
Spectroscopy (XPS), FTIR and Raman spectroscopy.
4
CHAPTER 2
OBJECTIVE
The present research work involves diamond-like carbon to be doped by silver which is
most beneficiary in biomedical applications. Hybrid Chemical Vapor Deposition/Physical Vapor
Deposition (CVD/PVD) process is used to produce Ag-DLC thin films. Objectives of this work
were to study:
Effect of processing parameters on the characteristics of Ag-DLC films
Structural properties of Ag- DLC films
Frictional and wear behavior of Ag-DLC films
5
CHAPTER 3
LITERATURE REVIEW
3.1 Diamond–like Carbon Thin films
DLC films were fist deposited successfully by Aisenberg and Chabot by ionizing a
carbonaceous source in an inert environment to form carbon ions onto a substrate and forming
an amorphous layer of microcrystallites [2]. Deposition methods can be divided into two
categories, namely Chemical Vapor Deposition and Physical Vapor Deposition. CVD involves
decomposition of a carbon bearing gas phase on the substrate and the PVD methods use target
materials such as graphite, carbon in the plasma deposition. Formation of DLC films is the
result of bombardment of carbon or hydrocarbon radicals within a typical impact energy range of
100-1000 eV with the substrate [16]. Various methods are employed in synthesizing DLC films,
prevalent methods include:
a. Ion beam deposition
b. Cathodic arc deposition
c. Laser ablation
d. Magnetron Sputtering
e. Plasma Enhanced Chemical Vapor Deposition
3.1.1 Fabrication Techniques for DLC synthesis
3.1.1.1 Ion Beam Deposition Methods
Ion beam deposition was the first method used for the synthesis of DLC. These
methods use solid carbon targets or ionized hydrocarbon gases, ionization of hydrocarbon
gases such as CH4, C2H6, etc. yields carbon ions. In ionization, hydrogen is released by
dissociation of molecules [17, 18]. In this method, an ion beam is formed from the plasma that is
not in contact with the substrate and is directed at the substrate to bombard, thus resulting in
6
film growth. Since the ion energy can be controlled, a good process control is achieved.
After the dissociation, hydrogen is deposited as a film in a high vacuum deposition chamber.
The lower the pressure and power, the harder the films are. However, these conditions reduce
the deposition rate.
Mass selected ion beam deposition is another method, where the deposition rate is
controlled using monoenergetic ion species and low energy (<10 eV) carbon ions are produced
from the graphite target [19]. The ions are accelerated through magnetic filter which blocks
neutral ions. Electrostatic lenses are used to decelerate the ions to the required ion energies.
Ion beam used under high vacuum conditions to prevent the possible damage during deposition
[20]. The major advantage of this method is that it controls the deposition rate.
3.1.1.2. Filtered Cathodic Arc Deposition
The Filtered Cathodic Arc Deposition technique is optimal for producing hard
tetrahedral amorphous carbon thin [21]. The device contains a magnetic filtering technique to
remove effectively the macro particles and so enhances the smoothness of DLC film. Graphite
acts as a cathode and chamber acts as an anode. When large arc currents in the range of 40-
90 A are applied, carbon ions are produced between the cathode and anode. A bias voltage is
applied at the substrate in the range of 100-300 V. It is used to regulate the ion energy in the
chamber. The ta-C films produced have high sp3 content in comparison to other techniques and
exhibit greater hardness.
3.1.1.3. Magnetron Sputtering
Sputtering involves physical vapor deposition; high energy particles bombard the
surface and eject atoms from the target material. High ion energy is needed to remove atoms
from the target material resulting in good deposition. In magnetron sputtering, atoms emitted
from target move towards the substrate, guided by magnetrons as there is lower impedance to
their movement. During sputtering, high vacuum is maintained in order to keep ions at a high
energy and to reduce collisions [22]. Plasma is produced by a voltage biasing with DC or RF
7
power. At appropriate gas pressure in the chamber and sufficient voltage across the electrodes,
plasma discharge is developed. At the cathode, rapid ion acceleration along the sheath
develops high electric dark sheath. Secondary electrons are released on colliding with cathode.
Magnetrons are placed parallel to the cathode, creating a static magnetic field and based on
Fleming’s left hand rule, guides the emitted electrons in a direction perpendicular to both the
applied electric field and the magnetic field. Near cathode, dense plasma is created when the
gas atoms collide with the surrounded secondary electrons resulting in high deposition rates.
3.1.1.4. Pulsed Laser Deposition
Pulsed laser ablation is a deposition technique which produces hydrogen free diamond-
like carbon films with high sp3 content. Here, graphite or polycarbonate is used as target
material and it is vaporized by using a pulsed excimer laser [19, 23]. As a result, dense plasma
is generated and the vaporized target material gets deposited on to the substrate. The substrate
can have a negative voltage bias or can be unbiased. The laser has intense energy, which can
easily transform sp2 domains to sp
3 domains, forming thin films that have a high hardness. The
excimer laser’s short wavelength property results in smooth surface of the deposited films.
3.1.1.5 Plasma Enhanced Chemical Vapor Deposition (PECVD)
In PECVD, generally hydrocarbon gases such as CH4, C2H2, C2H6, etc. are used as
precursor gases. Thus, the technique is very prominent for depositing hydrogenated amorphous
carbon thin films. This technique produces good quality films at higher deposition rate and lower
deposition temperature with least contamination [19, 24, 25, 26]. An appropriate Ar dilution ratio
is selected and precursor gases are allowed to pass into deposition chamber. When a bias
voltage is applied at the substrate at a low chamber pressure, it ionizes the hydrocarbon
precursor producing plasma thereby attracting the ions required for growth of the film. The ion
energy depends on the voltage applied and gas pressure which controls the sp3
/sp2
ratio in
hydrogenated amorphous carbon thin films. The working pressure, bias voltage and the
hydrogen content considered as important parameters to obtaining quality films. The pressure
8
and bias voltage determine sp3
/sp2
ratio and deposition rate of the film whereas hydrogen
minimizes the surface energy by passivating the dangling bonds resulting in low friction and
helps in stabilizing the sp3 bonds [19, 24, 25, 26, 27].
3.1.2 Structure and Classification
DLC films become a fascinating research area because of their structure, which makes
DLC films a candidate material in wide applications such as automobile parts, magnetic storage
disks, micro-electromechanical devices, reflective coatings for optical windows and biomedical
applications for implantation [23, 28]. Its exceptional properties include low friction coefficient,
high hardness, wear rate, thermal conductivity, electrical resistivity, chemical inertness, optical
transparency and biocompatibility [25, 29].
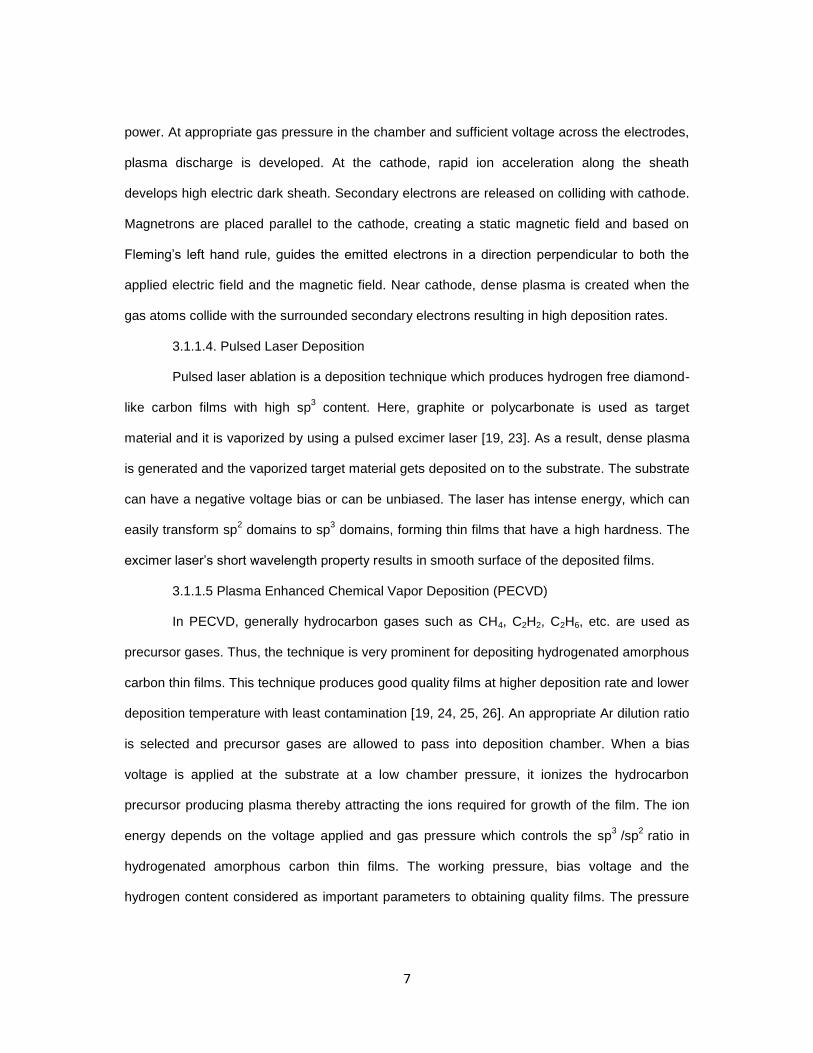
Carbon exists in several allotropic forms, namely, diamond, graphite and polymer. It can
form excessive range of crystalline and disordered structures as it can form in three stable
hybridizations, sp3, sp
2 and sp
1. Diamond has tetrahedral atomic structure with sp
3
hybridization, where strong sigma bond is formed between four valence electrons of carbon with
their adjacent atoms. Graphite has trigonal shaped structure with sp2 hybridization, where a
strong sigma bond is formed between three of the four valence electrons and one weak п bond
is formed with the remaining electron. Lastly, the sp1 hybridization structure has two σ bonds
and two п bonds. Hybridization of carbon schematic view is shown in Figure 3-1.
Figure 3-1 (a) sp1 hybridization (b) sp
2 hybridization (c) sp
3 hybridization [19].
9
DLC films formed with a combination of diamond and graphite structure with some of
the terminated hydrogen bonds. The diamond structure has 4-fold coordinated sp3 sites,
whereas the graphite structure has 3-fold coordinated sp2 sites. Because of the presence of
hybridization in short-range order, the films show amorphous. Films exhibit diamond-like
properties if the sp3 hybridization is dominant or graphite-like properties if sp
2 hybridization is
dominant. Hydrogen content and doping material are the key factors, which determine the sp3
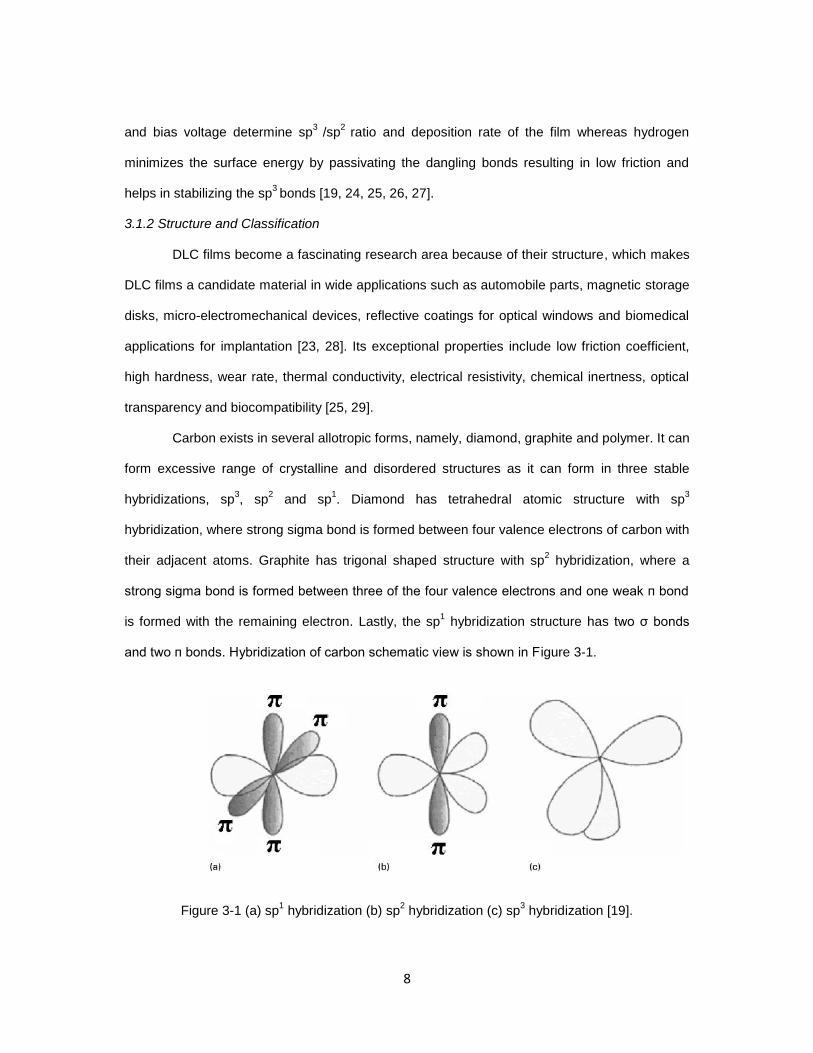
and sp2 content in the deposited film. Robertson has given a ternary phase diagram that shows
the composition of DLC films in terms of sp3 and sp
2 along with hydrogen content in Figure 3-2.
Figure 3-2 Ternary phase diagram of DLC [30].
DLC coatings are categorized into various groups with respect to change in the amount
of hydrogen and sp3/sp
2 ratio [31, 32, 33]. This phase diagram series begins with glassy
structure and ends with tetrahedral amorphous carbon (ta-C) in considering sp3 content. From
Figure 3-2, it is evident that the materials in the bottom left corner have sp2 hybridization with an
amorphous carbon (a-C) structure. This group includes all the soft materials such as glassy
carbon, soot, evaporated carbon and hars. Bottomed right corner consists of hydrocarbon
10
polymers, polyacetylene (CH)n and polyethylene (CH2)n groups. Towards the top, formation of
molecules is preferred over formation of long chains [19]. High amount of sp2 bonds and low
amount of sp3 bonds combine to form a sputtered hydrogenated amorphous carbon (a-C:H)
film. Very high amount of sp3 bonded coatings are called tetrahedral amorphous carbon (ta-C).
The central region of the phase diagram represents hydrogenated amorphous carbon (a-C:H),
which contains higher amount of hydrogen and lower amount of sp3 bonds. Near the top,
tetrahedral amorphous hydrogenated carbon (ta-C:H) is formed, with a high amount of sp3
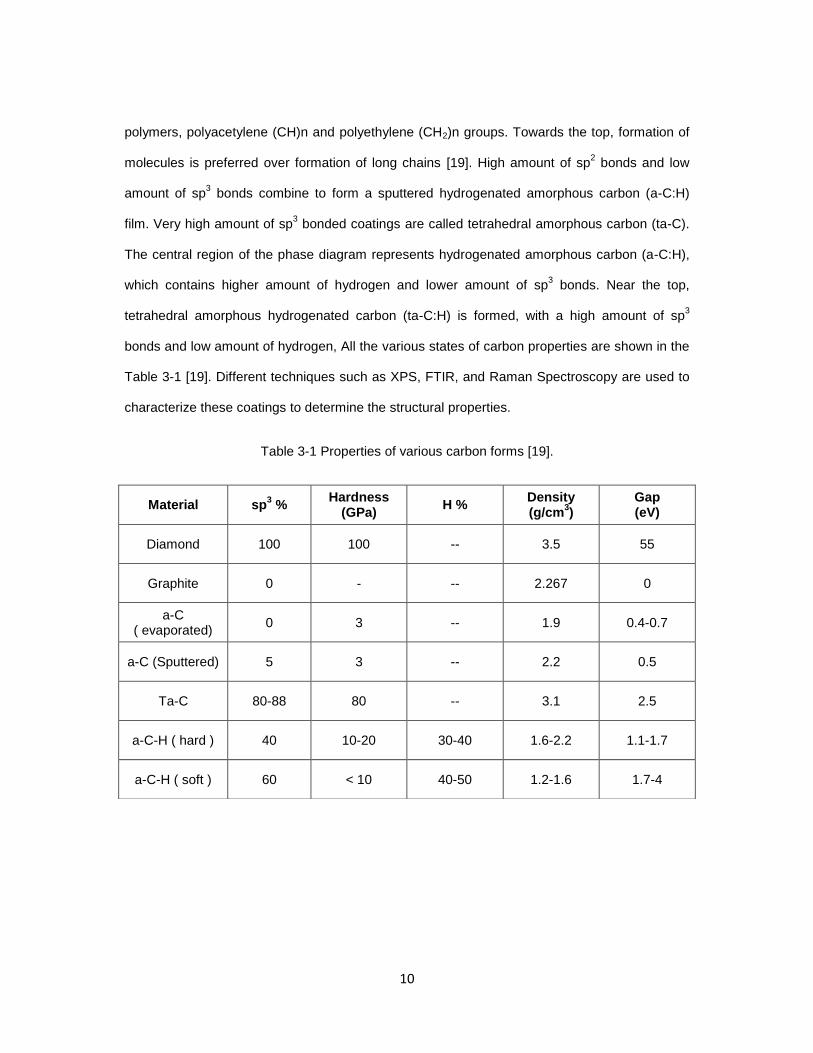
bonds and low amount of hydrogen, All the various states of carbon properties are shown in the
Table 3-1 [19]. Different techniques such as XPS, FTIR, and Raman Spectroscopy are used to
characterize these coatings to determine the structural properties.
Table 3-1 Properties of various carbon forms [19].
Material sp3 %
Hardness (GPa)
H % Density (g/cm
3)
Gap (eV)
Diamond 100 100 -- 3.5 55
Graphite 0 - -- 2.267 0
a-C ( evaporated)
0 3 -- 1.9 0.4-0.7
a-C (Sputtered) 5 3 -- 2.2 0.5
Ta-C 80-88 80 -- 3.1 2.5
a-C-H ( hard ) 40 10-20 30-40 1.6-2.2 1.1-1.7
a-C-H ( soft ) 60 < 10 40-50 1.2-1.6 1.7-4
11
3.2 Metal Doped-diamond-like Carbon Thin Films
There is huge research going on the DLC films because of their potential applications in
automobile, biomedical and optical industries. Some of the limitations of DLC films are listed
and discussed. First, the high compressive stress in the films developed during deposition, due
to the formation of sp3 bonds, resulting in poor adhesion. One of the theories is that these
stresses are developed due to the film deposition at low substrate temperatures. Second
limitation is the graphitization of DLC, Liu and Meletis [8] proposed the graphitization
mechanism, stating that C-C bonds of sp3 transform to sp
2 graphite when the temperature
exceeds above 350°C, resulting in low coefficient of friction. A good method of avoiding these
limitations is incorporating foreign atoms into DLC matrix.
3.2.1 Various metal doped DLC composite thin films
The addition of metals such as Ti, WC, Ag, Cr, Cu, Nb, etc. to the DLC, lowers the
internal stresses and these metals add a new phase thereby provide improved mechanical
properties. Common method of synthesizing the metal doped films is physical vapor deposition
which involves either sputtering of both graphite and doped material target or sputtering of the
doped metal target in hydrocarbon environment using Ar as precursor gas. Corbella et al. [24]
deposited metal doped DLC films by incorporating different metals such as Ti, Mo, W and Nb
using PECVD technique. Kalges et al [34] states that low frictional properties were observed for
metal-doped DLC films, proving the formation of carbide at lower level. The low frictional
properties are attributed to the formation of transfer layer in both DLC and metal-doped DLC
[35]. Experimental results prove that metals modify the DLC network; improving tribological
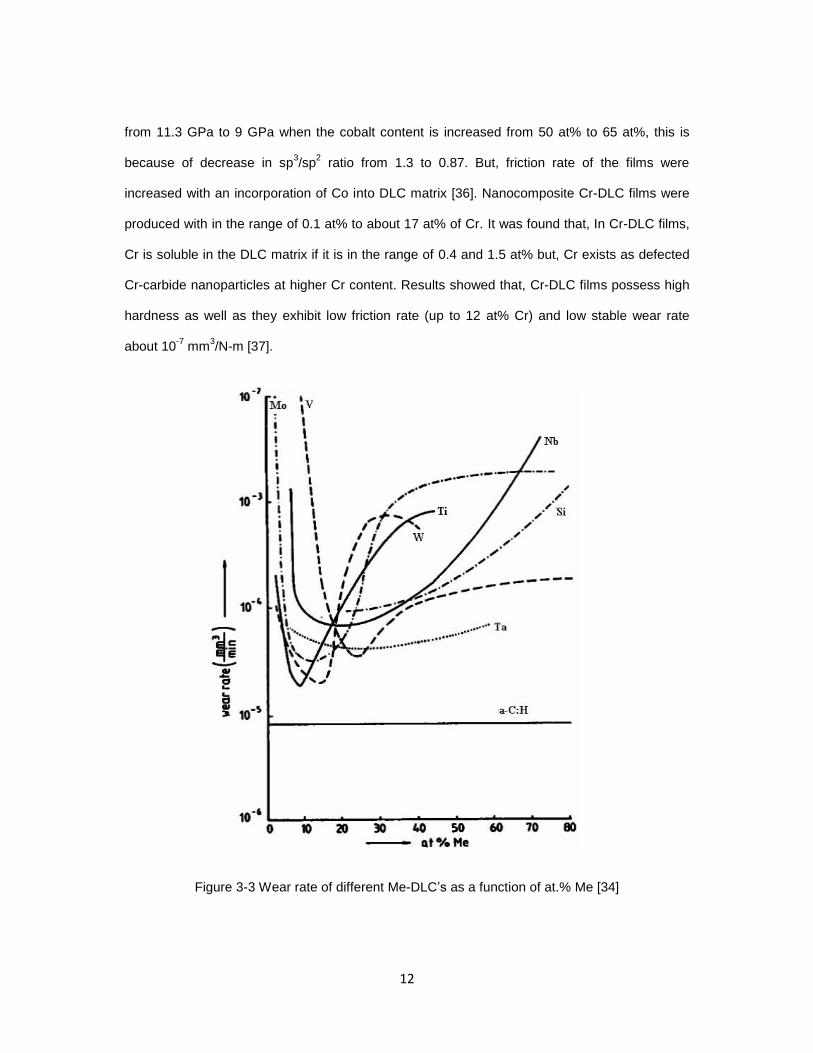
properties such as wear rate and friction rate. Figure 3-3 shows the effect of metals change with
respect to change in wear rate.
Co-DLC nanocomposite thin films were developed for the magnetic storage
applications. These Co-DLC thin films were produced using hybrid CVD/PVD technique. The
hardness tests performed on the cobalt based metal-doped film reveals a reduced hardness
12
from 11.3 GPa to 9 GPa when the cobalt content is increased from 50 at% to 65 at%, this is
because of decrease in sp3/sp
2 ratio from 1.3 to 0.87. But, friction rate of the films were
increased with an incorporation of Co into DLC matrix [36]. Nanocomposite Cr-DLC films were
produced with in the range of 0.1 at% to about 17 at% of Cr. It was found that, In Cr-DLC films,
Cr is soluble in the DLC matrix if it is in the range of 0.4 and 1.5 at% but, Cr exists as defected
Cr-carbide nanoparticles at higher Cr content. Results showed that, Cr-DLC films possess high
hardness as well as they exhibit low friction rate (up to 12 at% Cr) and low stable wear rate
about 10-7
mm3/N-m [37].
Figure 3-3 Wear rate of different Me-DLC’s as a function of at.% Me [34]
13
3.2.2 Ag doped DLC Thin Films
While various Me-DLC like WC, Co, Cr Ti, Nb exhibit excellent tribological properties
[24, 34, 35, 38], Ag incorporated DLC has numerous applications in biomedical and tribological
industries [39, 40]. Zhang et al. deposited 5.5-5.6 at% silver-containing hydrogenated and
hydrogen-free diamond-like carbon (DLC) nanocomposite thin films by plasma immersion ion
implantation-deposition methods and compared friction and surface roughness properties of
Ag/a-C:H and Ag/a-C thin films. The research done in Zhang et al. reported that Ag had more
pronounced effect on a-C than a-C:H in terms of surface roughness and surface energy.
Furthermore, Zhang et al. suggested that Ag content increases surface energy whereas
hydrogen has an opposite effect. Therefore, a-C:H films have lower friction than a-C films, while
Ag-DLC films had higher friction than pure DLC [41]. Lungu et al. incorporated C into the Ag film
on bronze substrate at a concentration between 19 and 42 mass % by thermionic vacuum arc
method. Lungu et al. found that C inclusion as DLC phase in the silver matrix reduced the
coefficient of friction in dry sliding up to 2.5 times compared to that of the bronze substrate [42].
In another study, Lungu et al. reported that friction coefficient decreases when the grain size of
film goes below 10 nm [40].
Narayan et al. deposited functionally gradient hydrogen-free Ag-DLC and Ti
nanocomposites by using pulsed laser deposition on Ti-6Al-4V alloy. Narayan et al. reported
that Ag-DLC films showed higher hardness (32 GPa) and E modulus (299 GPa) than Ti-DLC
films (29 and 274 GPa). However, the coefficient of friction of Ag-DLC film (0.149) was higher
than Ti-DLC (0.107) [43]. Xiang et al. deposited non-hydrogenated Ag-DLC films on silicon
wafers, in a mid-frequency dual-magnetron system and they investigated influence of Ag
content and grain size on microstructure and sliding tribological behaviors. Xiang et al. also
found that the Ag nanocrystallites were dispersed in the DLC matrix, and increased Ag content
will increase the grain size of Ag. The films with Ag content in between 3.3 and 11.4 at% having
small grain sizes in the range of 5.4-16.8 nm exhibits high hardness, low intrinsic stress,
14
improved adhesion, and low friction coefficient and wear rate as compared with those of high
gain size and content of the Ag. Xiang et al. suggested that the effective regime of Ag content
for accomplishing low coefficient of friction, wear rate and good mechanical properties is in the
range of 5 at% to 10 at% approximately. The best combined properties were achieved for the
film deposited with 8.7 at% Ag and with grain size 12.9 nm [44]. Ag-DLC thin films were
synthesized using hybrid CVD/PVD system, results shown that Ag nanoparticles of 4-7 nm in
size were uniformly distributed in DLC matrix. Microhardness of DLC films exhibited a hardness
of 22 GPa and it gradually decreases with increasing Ag content. As the Ag content increases,
the sp3 content decreases resulting in decreased film hardness [45]. Literature review shows
that there is a little study on tribological properties of Ag-DLC. Zhang [41] compared Nano-
frictional properties of hydrogenated and non-hydrogenated DLC thin films. The most detailed
research for non-hydrogenated Ag-DLC in terms of tribological properties was carried out by
Xiang [44]. However, the effect of the adding silver, which is used as a thin coating on hard
substrates for tribological properties, is still unclear.
3.2.3 Mechanical and Tribological Properties
a. Hardness
In DLC films, the hardness is affected by the sp3 content. The film with higher amount of
sp3 exhibits high hardness. Hardness and Young’s modulus measurements are made with
Nano-indenter. The maximum nano-hardness of hydrogenated amorphous carbon films and
hard amorphous carbon films containing 85-90% sp3 bonds are found to be 17 GPa, 80-88 GPa
respectively [46]. Hardness is calculated from the given equation with respect to the yield stress
and Young’s modulus.
(
) [19]
Where H is the hardness, E is the young’s modulus and Y is the yield stress.
15
b. Adhesion
Diamond like carbon thin films has applications in protective coatings because of their
adhesive strength. However, these films have large internal compressive stresses preventing
film growth, thereby making them useless [47, 48, 49]. It is assumed that the large internal
stresses are developed during the subimplantation mechanism of DLC. This mechanism
explains that large compressive stresses are developed when the incident energetic carbon
species bombards an existing DLC and this is because during the deposition at room
temperature, the atoms lack the mobility [47, 50]. If the internal stress exceeds a critical value,
adhesive failure takes place and if the mechanical energy density exceeds the energy needed
to create two new surfaces the thickness of the film, h, delaminates, such as
(
)
where, is the surface/interfacial energy, is the Poisson’s ratio, 1 the shear modulus
of the film and the strain in the film. There is research being done to improve the
adhesiveness of the diamond like carbon thin films included depositing a metallic interlayers
between the substrate and the DLC film, by incorporating foreign atoms and depositing carbide,
forming adhesive layers [19, 51, 52, 53].
c. Friction coefficient
Frictional behavior depends on intrinsic and extrinsic factors such as degree of sp2, sp
3
bonding and humidity [19, 33, 54]. DLC films are popular for their low frictional behavior
because of sp2 hybridization in their structure. The bonds broken in DLC during its formation,
become passive due to the C-H bonds, rendering the film inert. Diamond surface is
hydrophobic, closed shell bonded system and the contact between them is through the weak
van der Walls forces. So, when the surfaces in contact shear, the weak van der Wall forces
break resulting in deformation. At low humidity, when a-C:H comes in contact with the counter
surface, a transfer layer of a-C:H is formed. The friction coefficient in this case is low as there is
a contact between two hydrophobic a-C:H surfaces. Higher humidity causes transfer layer to
16
oxidize and thus hampers the formation of contact layer. Hence, in summary, there are no van
der Walls forces in the DLC and the transfer layer is not hydrophobic, increasing the friction
coefficient [19].
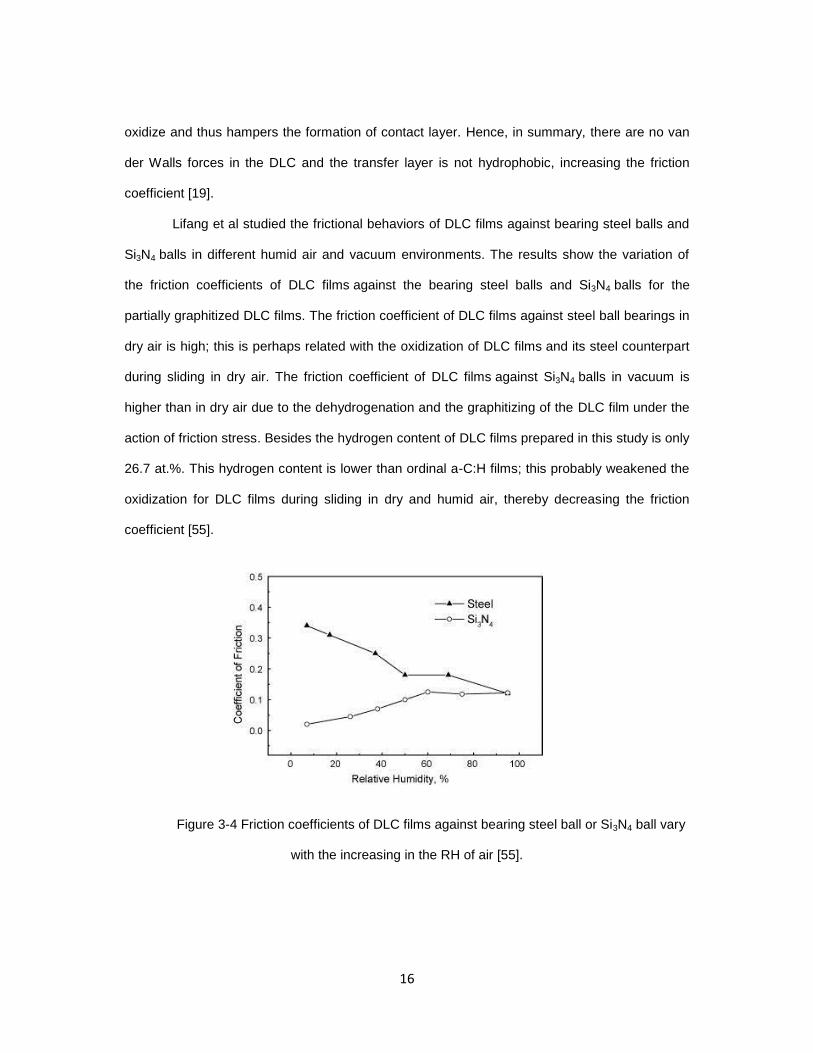
Lifang et al studied the frictional behaviors of DLC films against bearing steel balls and
Si3N4 balls in different humid air and vacuum environments. The results show the variation of
the friction coefficients of DLC films against the bearing steel balls and Si3N4 balls for the
partially graphitized DLC films. The friction coefficient of DLC films against steel ball bearings in
dry air is high; this is perhaps related with the oxidization of DLC films and its steel counterpart
during sliding in dry air. The friction coefficient of DLC films against Si3N4 balls in vacuum is
higher than in dry air due to the dehydrogenation and the graphitizing of the DLC film under the
action of friction stress. Besides the hydrogen content of DLC films prepared in this study is only
26.7 at.%. This hydrogen content is lower than ordinal a-C:H films; this probably weakened the
oxidization for DLC films during sliding in dry and humid air, thereby decreasing the friction
coefficient [55].
Figure 3-4 Friction coefficients of DLC films against bearing steel ball or Si3N4 ball vary
with the increasing in the RH of air [55].

17
d. Wear
Wear depends on different factors like applied load, material’s mechanical property and
environmental conditions. The wear rates for DLC films are as low as 10-8
mm3/Nm. Addition of
metals or other elements such as silicon into the films can lead to further reduction in wear rate
[56]. Baba et al. deposited Ag-DLC films by Magnetron Plasma Source Ion Implantation. He
reported that tribological properties of DLC films are affected when they doped with Ag. He also
states that the surface roughness is increased with silver content in the films and best wear
properties were derived for the DLC films with 1.8 at. %Ag. [57]. Wei et al conducted wear tests
and compared wear rates between pure DLC, Cu-DLC and Ti-DLC. They used a “crater
grinding method” based on microabrasion mechanism to do wear tests of the films under a
constant load of 5g. Figure 3-5 shows the wear test results for the DLC, Cu-DLC and Ti-DLC
films on silicon. They observed that the effect of titanium is stronger than that of copper. One
possible explanation for this behavior is that titanium forms strong carbide bonds in the film,
compared to Cu [58].
Figure 3-5 Wear test results of pure DLC, Cu-DLC and Ti-DLC [58].
18
3.2.4 Applications of DLC Thin films
a. Automobile Industry
DLC coatings have been used in automotive industry for the past few decades. The
coatings have become a solution for manufacturing tools or systems used in the industry,
providing reduced maintenance, improving efficiency, extending tool life and boosting the
performance without having any effect from the substrate properties. Automotive industry
demands Low friction rate with high wear resistance for good lubricant performance and the
DLC coatings provide a solution for these automobile applications in manufacturing components
such as gears, valve filters, fuel injector parts and wrist pins. The DLC coatings also enhance
properties such as hardness and wear resistance making them applicable in manufacturing
cutting and abrasive wear instruments such as drills and manufacturing machines.
b. Biomedical Industry
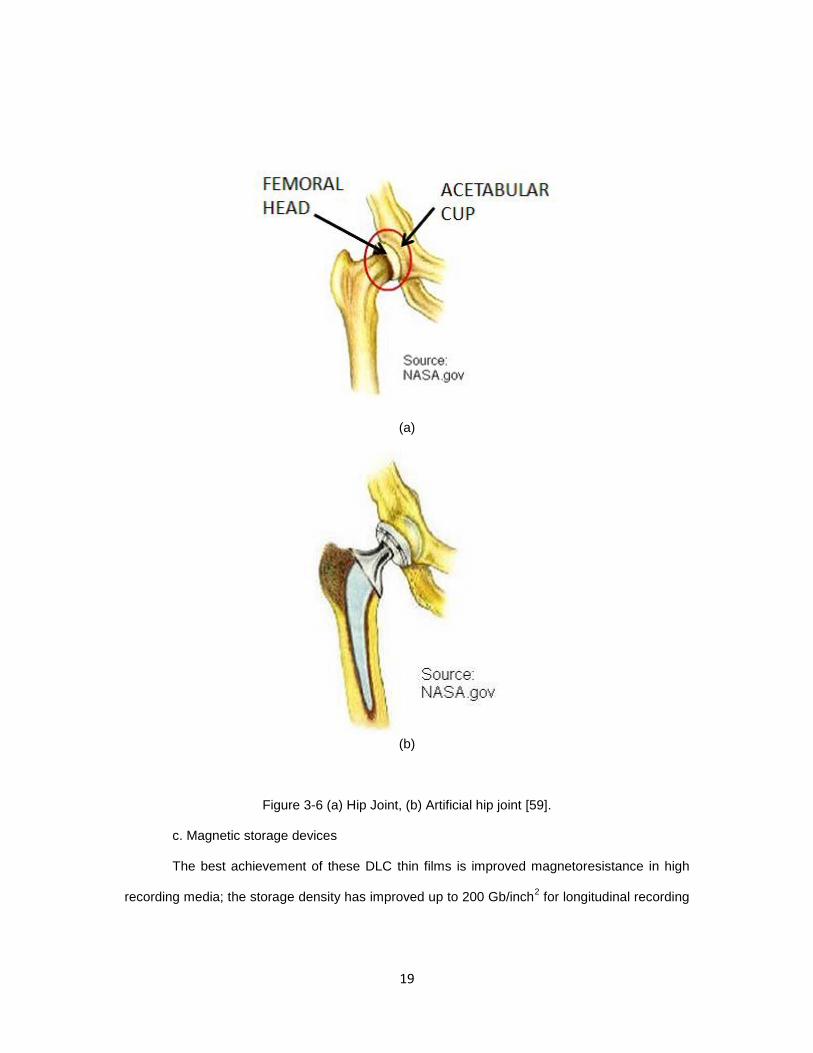
DLC films also can also be used biological applications, for components implanted into
the human body. These coatings have also been applied for the orthopedic implants like blood
pumps, heart valves and load bearing joints. Functionally graded multilayer DLC films prepared
by pulsed plasma techniques of DLC are being studied for their medical applications [43].
Figure 3-6 shows (a) hip joint and (b) an artificial hip joint [59].
19
(a)
(b)
Figure 3-6 (a) Hip Joint, (b) Artificial hip joint [59].
c. Magnetic storage devices
The best achievement of these DLC thin films is improved magnetoresistance in high
recording media; the storage density has improved up to 200 Gb/inch2 for longitudinal recording
20
applications. The ultra-thin DLC films also improved wear and corrosion protection of magnetic
hard disks. Because of its ultra-thin, atomically smooth, and dense properties, the gap between
recording head and the disk minimized resulting in achieving large storage densities [60]. Me-
doped DLC thin films for metals such as Co, Fe are used in recording media applications [61].
Co-DLC composites are mostly deposited on recording heads at the head-disc interface to
improve corrosion resistance and mechanical wear [62]. The devices like magnetic and
microwave circuits, magnetic recording media and magneto optical recording are being coated
with magnetic thin films.
d. Optical devices
DLC films have been used in optical storage devices due to their improved
transparence, band gap, and improved hardness. DLC films also have other optical applications
such as decorative coatings, phase-shift masks and electroluminescence and this has its
applications in controls interfacial colors. Current research is focused on solar photovoltaic
applications due to the semiconducting nature of the Films [63]. Synthesizing the DLC
structures are proven to be cheaper than silicon based cells. In the research field, regulating
defects and doping of diamond-like carbon structures are issues being addressed. Pure DLC
and Nitrogen doped DLC are being coated as antireflective coatings on silicon solar cells
improving their refractive index and reducing the adsorption coefficient.
21
CHAPTER 4
EXPERIMANTAL PROCEDURE
This chapter provides a brief description on how the process parameters, bias voltage,
DC current and chamber pressure affects the deposited film properties. In recent years, for
depositing nanolayered/multi layered thin films, different deposition techniques are in use for
large/small scale industries such as Ion beam deposition, Sputtering, Cathodic arc, Laser
ablation, Plasma enhanced CVD, etc. In our present research, for effective investigation and for
accurate results, all the experiments are carried out on a home-built hybrid Plasma enhanced
Chemical Vapor Deposition (i.e. Magnetron Sputtering) system. Construction and main
components of the system were explained later in this section. Both DLC and Metal doped
DLC’s were successfully deposited through this process using methane and Argon as precursor
gases. Finally, a study on silver content in diamond-like carbon on mechanical and tribological
properties of the films was performed.
4.1 Processing System: PECVD/PVD
4.1.1 Plasma enhanced CVD/PVD
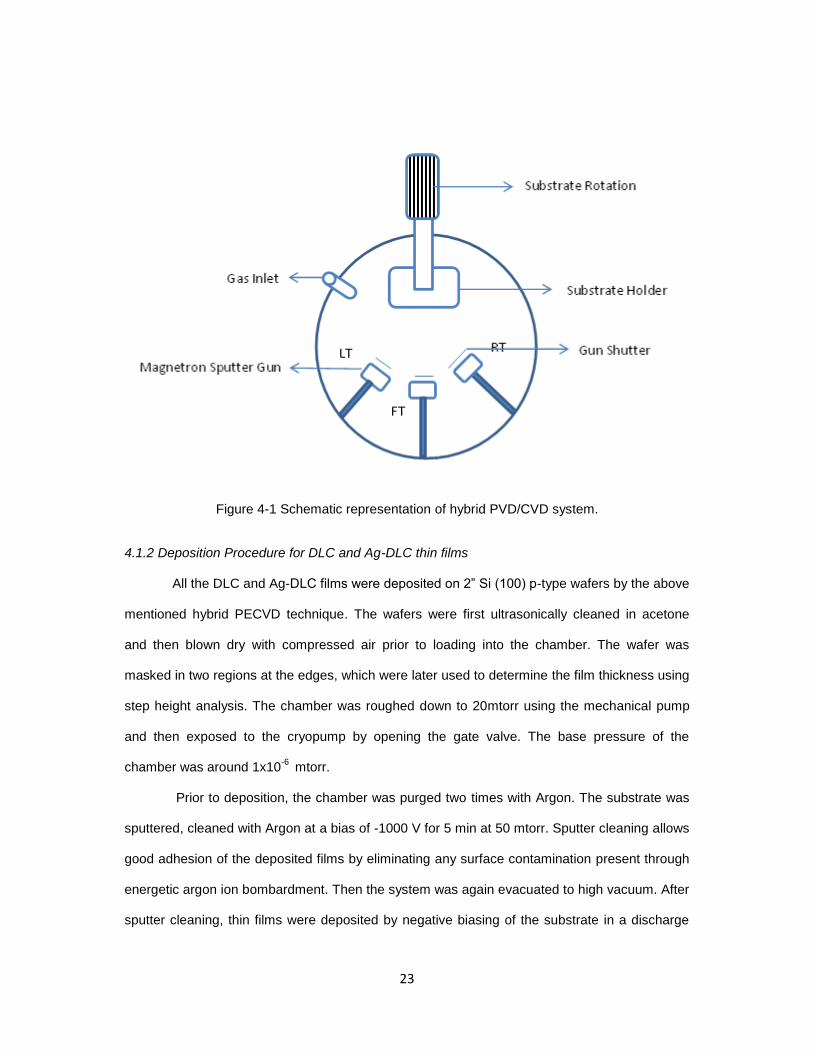
The DLC films have been synthesized by a home-built PECVD/PVD system. Figure 4-1
shows a schematic representation of its design and components. The cylindrical shaped
stainless steel chamber is 18.38’’ in diameter and 19.66’’ in length. This chamber has the
substrate holder, three magnetron guns and various different gauges installed into the system. It
is connected to a cryopump to achieve very clean vacuum. The substrate has both RF and DC
biasing connections, and it also has rotation for uniform deposition over the sample. It can be
heated for up to 850° C and a thermocouple is attached to measure the substrate temperature.
The temperature can be easily changed during the deposition process according to the
requirements. The 4” endplate substrate holder can hold a maximum of 4” diameter samples.
22
The three magnetron guns placed on the floor of the chamber can hold thicknesses of
0.125”, 0.185” and 0.250” targets. Magnetrons aid to direct ions coming from the target after its
bombardment towards the substrate, and applied magnetic field prevents diversion of these
ions according to Fleming’s left hand rule. Pneumatic shutters are used as a shield over the
magnetron guns. The gun can be DC biased for up to 1 kW through an MDX 10 K DC power
supply and RF biased through an RF generator. Either bias type causes plasma production
within the chamber when applied between the substrate and the floor of the chamber.
Roughing is achieved by a mechanical rotary valve pump. It depressurizes the lines, the
cryo pump, and the deposition chamber to 25 mtorr. A cryo compressor helps to cool the arrays
within the cryopump to 10 K. Next, base pressure of ~3x10⁻⁶
torr was achieved in the deposition
chamber by a cryo pump. As mentioned in the beginning, three different pressure gages are
installed, first gauge is thermocouple gauge and it measures the roughing line pressure. Second
one is a Baratron gauge, it measures chamber pressure during deposition and provides input to
the cryopump gate valve for maintaining a set point pressure during deposition. Last is the ion
gauge, which measures the pressure when the chamber is exposed to the high vacuum cryo
pump. The ion gauge operates only under a pressure below 10-4
mtorr. The precursor gases are
controlled through mass flow controllers and a read out box during deposition.
23
Figure 4-1 Schematic representation of hybrid PVD/CVD system.
4.1.2 Deposition Procedure for DLC and Ag-DLC thin films
All the DLC and Ag-DLC films were deposited on 2” Si (100) p-type wafers by the above
mentioned hybrid PECVD technique. The wafers were first ultrasonically cleaned in acetone
and then blown dry with compressed air prior to loading into the chamber. The wafer was
masked in two regions at the edges, which were later used to determine the film thickness using
step height analysis. The chamber was roughed down to 20mtorr using the mechanical pump
and then exposed to the cryopump by opening the gate valve. The base pressure of the
chamber was around 1x10⁻⁶
mtorr.
Prior to deposition, the chamber was purged two times with Argon. The substrate was
sputtered, cleaned with Argon at a bias of -1000 V for 5 min at 50 mtorr. Sputter cleaning allows
good adhesion of the deposited films by eliminating any surface contamination present through
energetic argon ion bombardment. Then the system was again evacuated to high vacuum. After
sputter cleaning, thin films were deposited by negative biasing of the substrate in a discharge
24
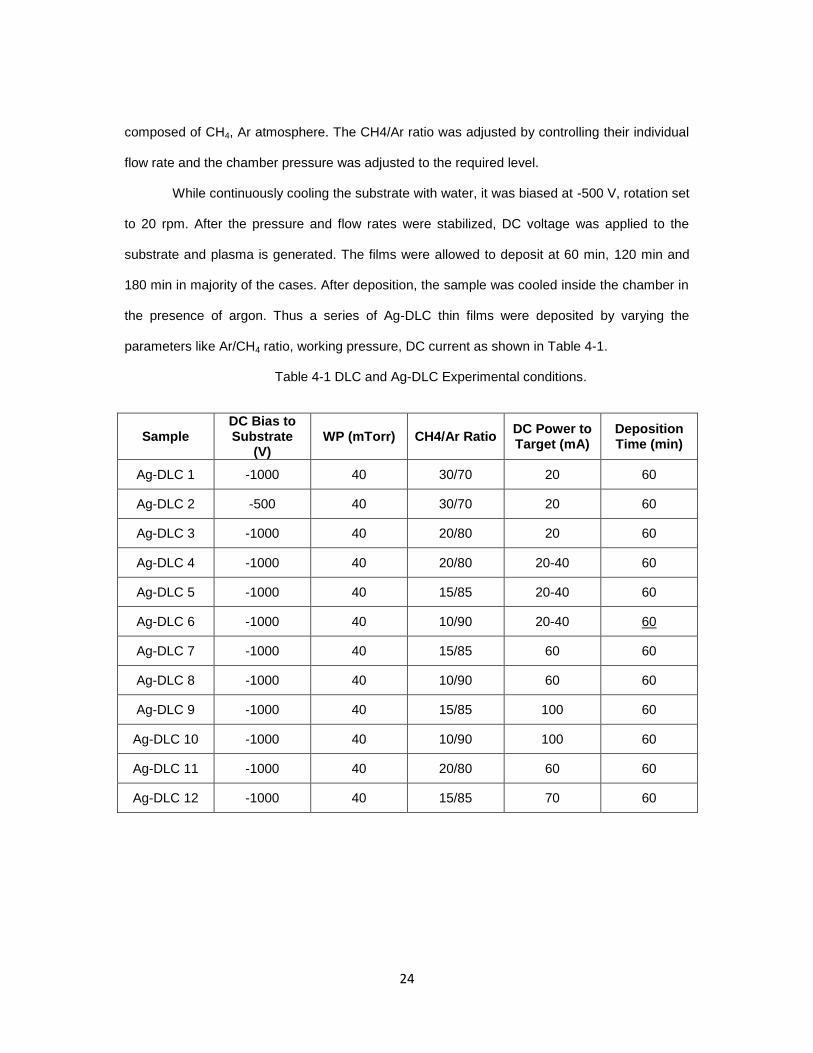
composed of CH4, Ar atmosphere. The CH4/Ar ratio was adjusted by controlling their individual
flow rate and the chamber pressure was adjusted to the required level.
While continuously cooling the substrate with water, it was biased at -500 V, rotation set
to 20 rpm. After the pressure and flow rates were stabilized, DC voltage was applied to the
substrate and plasma is generated. The films were allowed to deposit at 60 min, 120 min and
180 min in majority of the cases. After deposition, the sample was cooled inside the chamber in
the presence of argon. Thus a series of Ag-DLC thin films were deposited by varying the
parameters like Ar/CH4 ratio, working pressure, DC current as shown in Table 4-1.
Table 4-1 DLC and Ag-DLC Experimental conditions.
Sample
DC Bias to Substrate
(V) WP (mTorr) CH4/Ar Ratio
DC Power to Target (mA)
Deposition Time (min)
Ag-DLC 1 -1000 40 30/70 20 60
Ag-DLC 2 -500 40 30/70 20 60
Ag-DLC 3 -1000 40 20/80 20 60
Ag-DLC 4 -1000 40 20/80 20-40 60
Ag-DLC 5 -1000 40 15/85 20-40 60
Ag-DLC 6 -1000 40 10/90 20-40 60
Ag-DLC 7 -1000 40 15/85 60 60
Ag-DLC 8 -1000 40 10/90 60 60
Ag-DLC 9 -1000 40 15/85 100 60
Ag-DLC 10 -1000 40 10/90 100 60
Ag-DLC 11 -1000 40 20/80 60 60
Ag-DLC 12 -1000 40 15/85 70 60
25
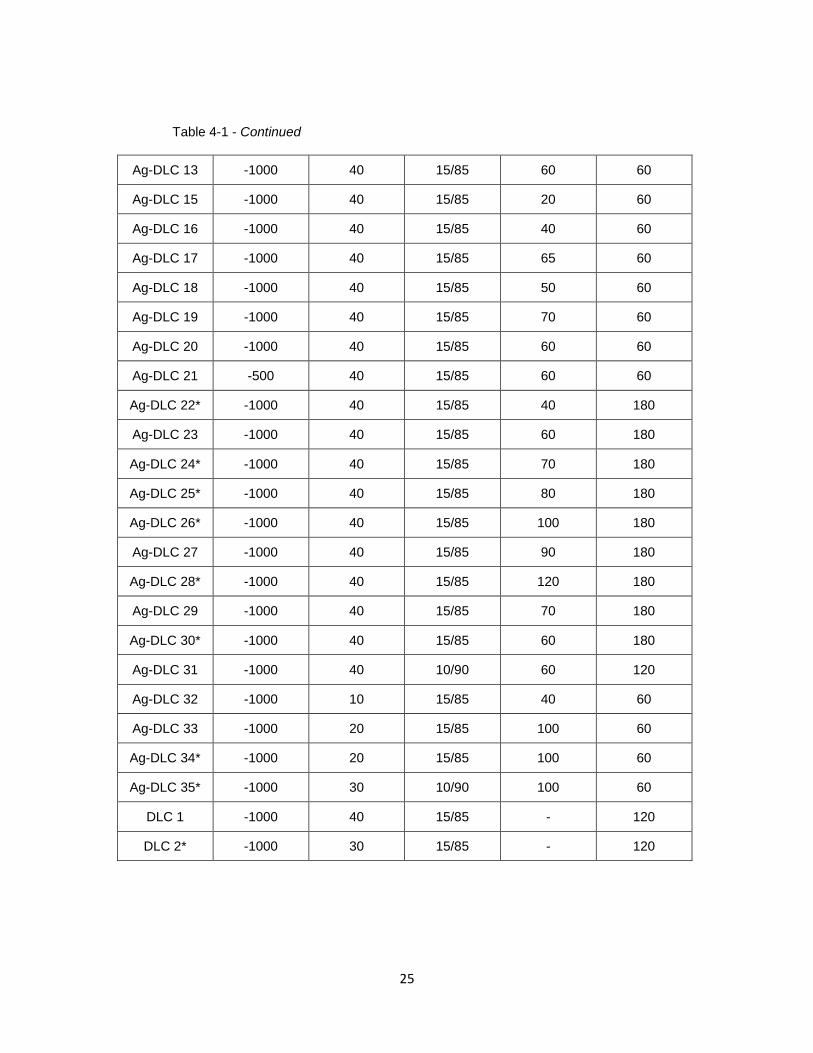
Table 4-1 - Continued
Ag-DLC 13 -1000 40 15/85 60 60
Ag-DLC 15 -1000 40 15/85 20 60
Ag-DLC 16 -1000 40 15/85 40 60
Ag-DLC 17 -1000 40 15/85 65 60
Ag-DLC 18 -1000 40 15/85 50 60
Ag-DLC 19 -1000 40 15/85 70 60
Ag-DLC 20 -1000 40 15/85 60 60
Ag-DLC 21 -500 40 15/85 60 60
Ag-DLC 22* -1000 40 15/85 40 180
Ag-DLC 23 -1000 40 15/85 60 180
Ag-DLC 24* -1000 40 15/85 70 180
Ag-DLC 25* -1000 40 15/85 80 180
Ag-DLC 26* -1000 40 15/85 100 180
Ag-DLC 27 -1000 40 15/85 90 180
Ag-DLC 28* -1000 40 15/85 120 180
Ag-DLC 29 -1000 40 15/85 70 180
Ag-DLC 30* -1000 40 15/85 60 180
Ag-DLC 31 -1000 40 10/90 60 120
Ag-DLC 32 -1000 10 15/85 40 60
Ag-DLC 33 -1000 20 15/85 100 60
Ag-DLC 34* -1000 20 15/85 100 60
Ag-DLC 35* -1000 30 10/90 100 60
DLC 1 -1000 40 15/85 - 120
DLC 2* -1000 30 15/85 - 120
26
4.2 Characterization of DLC and Ag-DLC Thin films
4.2.1 Thickness, Roughness and Deposition rate
The masked areas of the Si wafers reflect the film thickness. Both the thickness of the
film and surface roughness were measured by a WYKO NT 1000 surface optical profilometer
which functions on the principle of light interference at a magnification of 10X. The surface
profiler was operated under PSI mode and captured surface data, 3-D interactive display and x,
y profiles for thickness and roughness for all the samples. Both film thickness and surface
roughness values signify the average of at least three measurements. Film thickness and
deposition time determines the deposition rate.
4.2.2 Structural Characterization Techniques
4.2.2.1 Scanning Electron Microscopy (SEM)
The cross section morphology of the deposited films and the compositional analysis of
the Ag-DLC films were characterized by Scanning Electron Microscopy in conjunction with
Energy Dispersive Spectroscopy (EDS). Samples were characterized at an acceleration Voltage
of 20 keV.
4.2.2.2 Fourier Transform Infrared (FTIR) Spectroscopy
FTIR spectroscopy was conducted to obtain C-H bonding characteristics and determine
sp3/sp
2 ratios in the deposited film. A Nicolet FTIR system operated in transmission mode was
used for the analysis of the samples. The absorption response of the films is obtained by
subtracting the spectrum of DLC and Ag-DLC films from the Si wafer background. The resultant
curve was smoothed twice using 25 point smoothing in the OMNIC software. The resulting
spectrum of deposited films was deconvoluted in the regions of interest using Origin 8.0
software. Curve fitting was performed on the deconvoluted peaks in a Gaussian distribution and
the area under the component peaks was noted for sp3/sp
2 ratio determination.
27
4.2.2.3 Transmission Electron Microscopy
High-resolution transmission electron microscopy (HRTEM) of Ag-DLC samples were
performed on Hitachi H-9500 HRTEM electron microscope operated at 300 keV with a point-to-
point resolution of 0.18 nm. Cross sectional slices were obtained by cutting the samples along a
direction normal to the coating surface and then gluing, face to face, the two coating surfaces.
Cross-sectional specimens for TEM observation were prepared by mechanical polishing, and
dimpling followed by Ar-ion milling using a Gatan Precision Ion Polishing System (PIPSTM,
Model 691) with double mode at an angle of 4o. Examinations were conducted to determine the
distribution of Ag nanoparticles in the DLC matrix. The structural characterization was
conducted by selected area electron diffraction pattern analysis.
4.2.2.4 Raman Spectroscopy
Raman spectra provides abundant information regarding the amorphous films structure
due to its ability to distinguish between sp3 and sp
2 bonding types. Raman measurements were
obtained using a laser of wavelength 532 nm with a low input power of 2.5 mW in order to
minimize possible beam-heating effects. All bands in the Raman spectra have been fitted using
a Gaussian line shape.
4.2.2.5 X-Ray Photoelectron Spectroscopy
The binding energy of C atoms in the DLC and Ag-DLC films was determined using
XPS. XPS surface analysis was performed with Perkin-Elmer spectrometer using Al Kα
monochromatic x-ray source (1484.6 ev). The principle involves X-ray bombardment on to the
sample and the kinetic energy of photo-excited core electrons is determined from the samples
as a measure of their binding energy. The pressure was maintained below 10-9
Torr. The survey
spectra were obtained at constant pass energy of 100 eV taken in increments of 0.5 eV with
dwell times of 100 ms for 5 scans. The high resolution spectrum of each element was obtained
at 50 eV pass energy taken in increments of 0.2 eV with dwell times of 100 ms for at least 200
scans. To investigate the chemical state of the C-atoms, high resolution peak spectra was
28
obtained. Using CASA software, the peaks were deconvoluted, the amount of sp2and sp
3
in
deposited thin films was determined based on their areas.
4.2.3 Characterization of Mechanical and Tribological Properties
4.2.3.1 Nanoindentation
The hardness, H, and indentation modulus, E/(1-V2), were measure using a Hysitron
Ubi 1 nanonindenter. Nanoindentations on the DLC and various Ag-DLC thin films of
thicknesses above 250 nm were carried out on a three-sided, Berkovich-type pyramidal
indenter. The indenter shape function was obtained by an assumption of indenter contact depth
independent modulus, using a fused silica as the calibration specimen. The force was different
on each film, but the force was chosen in order to maintain an indentation depth just below
10% of the coating thickness.
4.2.3.2 Pin-on-disc Experiments
Pin-on-disc tests were performed on DLC and Ag-DLC films to illustrate their tribological
behavior i.e. wear rate and friction coefficient of the deposited film. The pin material is a 440C
steel ball of 9.5mm diameter for the experiments. A constant load of 5N was applied for these
experiments. These wear tests were performed in the presence of laboratory air with a relative
humidity of 40 ± 10%, at a 10 cm/s sliding velocity over a distance of 1000 m. The friction
coefficient was monitored continuously as a function of sliding distance.
By observing the wear track profile under a stylus profilometer, the wear rate was
obtained. The wear volume was measured by multiplying the cross sectional area of the wear
track with the length of the wear track. The wear rate of the film is given by:
( )
( ) ( )
SEM observations were performed on the wear tracks and also on the pin scar to determine
possible transfer layer formation. Optical microscopy was used to find the diameter of the wear
29
scar. The wear volume in the ball was calculated by measuring the diameter of the wear scar
and using the below formula:
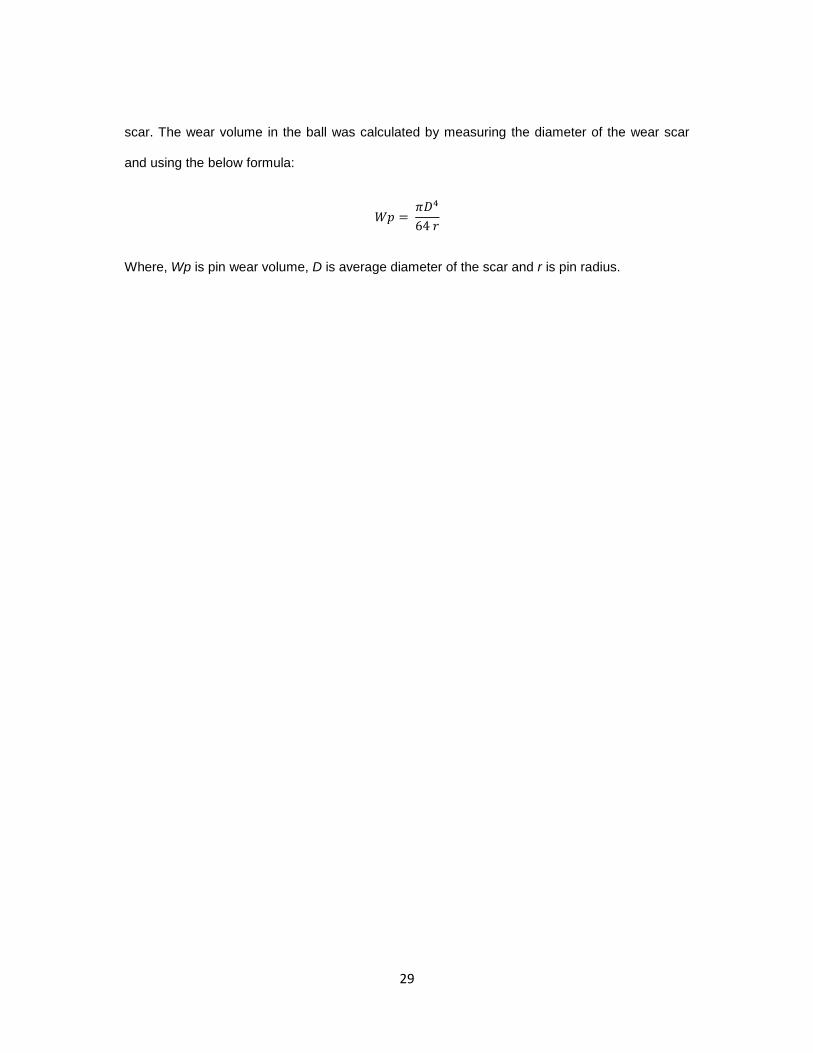
Where, Wp is pin wear volume, D is average diameter of the scar and r is pin radius.
30
CHAPTER 5
RESULTS AND DISCUSSION
5.1 Characterization
5.1.1 TEM
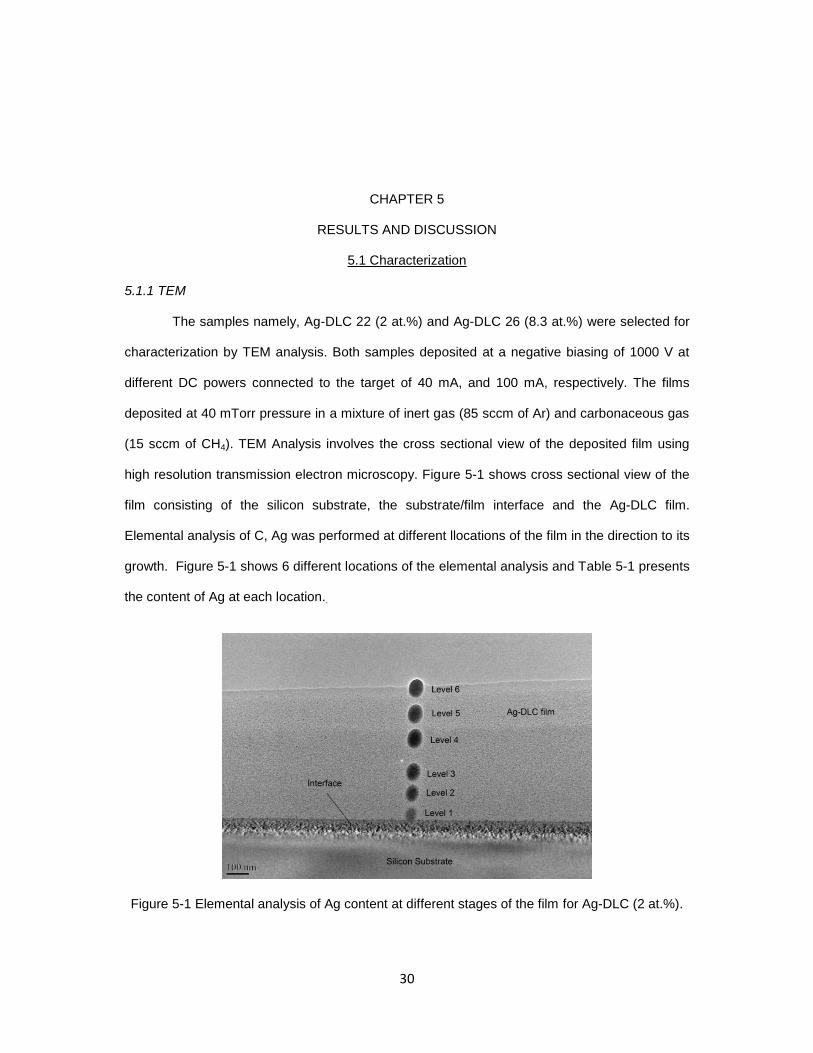
The samples namely, Ag-DLC 22 (2 at.%) and Ag-DLC 26 (8.3 at.%) were selected for
characterization by TEM analysis. Both samples deposited at a negative biasing of 1000 V at
different DC powers connected to the target of 40 mA, and 100 mA, respectively. The films
deposited at 40 mTorr pressure in a mixture of inert gas (85 sccm of Ar) and carbonaceous gas
(15 sccm of CH4). TEM Analysis involves the cross sectional view of the deposited film using
high resolution transmission electron microscopy. Figure 5-1 shows cross sectional view of the
film consisting of the silicon substrate, the substrate/film interface and the Ag-DLC film.
Elemental analysis of C, Ag was performed at different llocations of the film in the direction to its
growth. Figure 5-1 shows 6 different locations of the elemental analysis and Table 5-1 presents
the content of Ag at each location..
Figure 5-1 Elemental analysis of Ag content at different stages of the film for Ag-DLC (2 at.%).
31
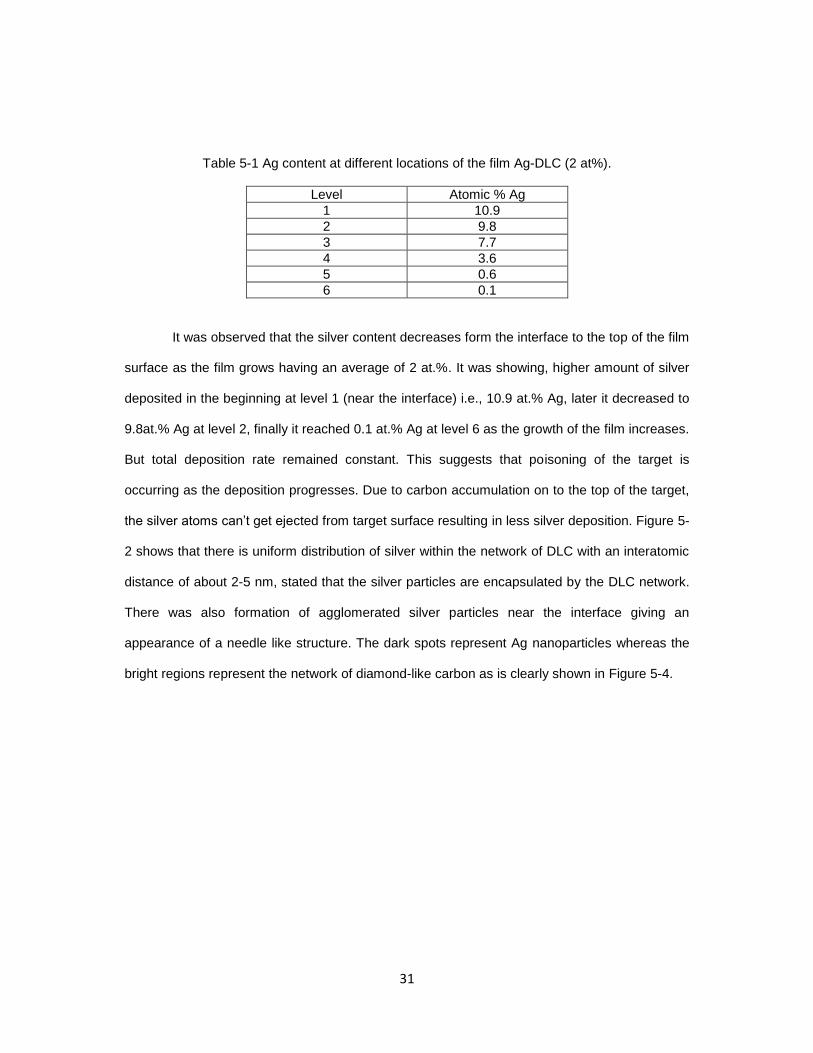
Table 5-1 Ag content at different locations of the film Ag-DLC (2 at%).
Level Atomic % Ag
1 10.9
2 9.8
3 7.7
4 3.6
5 0.6
6 0.1
It was observed that the silver content decreases form the interface to the top of the film
surface as the film grows having an average of 2 at.%. It was showing, higher amount of silver
deposited in the beginning at level 1 (near the interface) i.e., 10.9 at.% Ag, later it decreased to
9.8at.% Ag at level 2, finally it reached 0.1 at.% Ag at level 6 as the growth of the film increases.
But total deposition rate remained constant. This suggests that poisoning of the target is
occurring as the deposition progresses. Due to carbon accumulation on to the top of the target,
the silver atoms can’t get ejected from target surface resulting in less silver deposition. Figure 5-
2 shows that there is uniform distribution of silver within the network of DLC with an interatomic
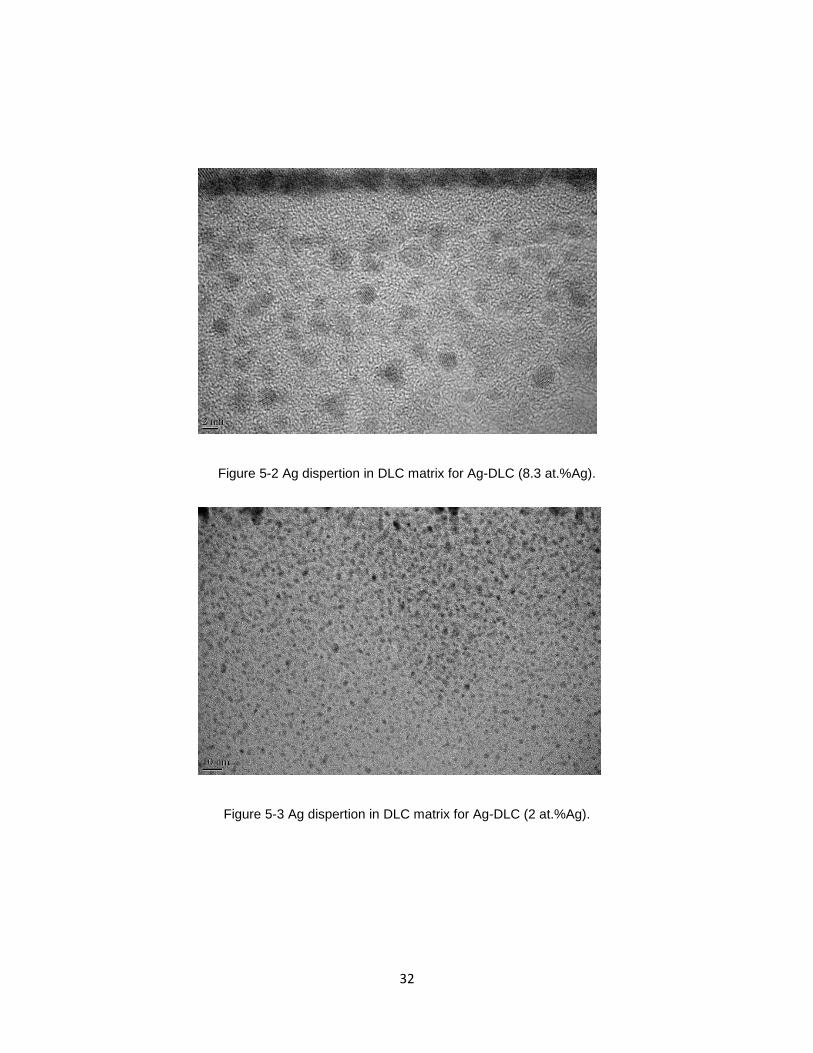
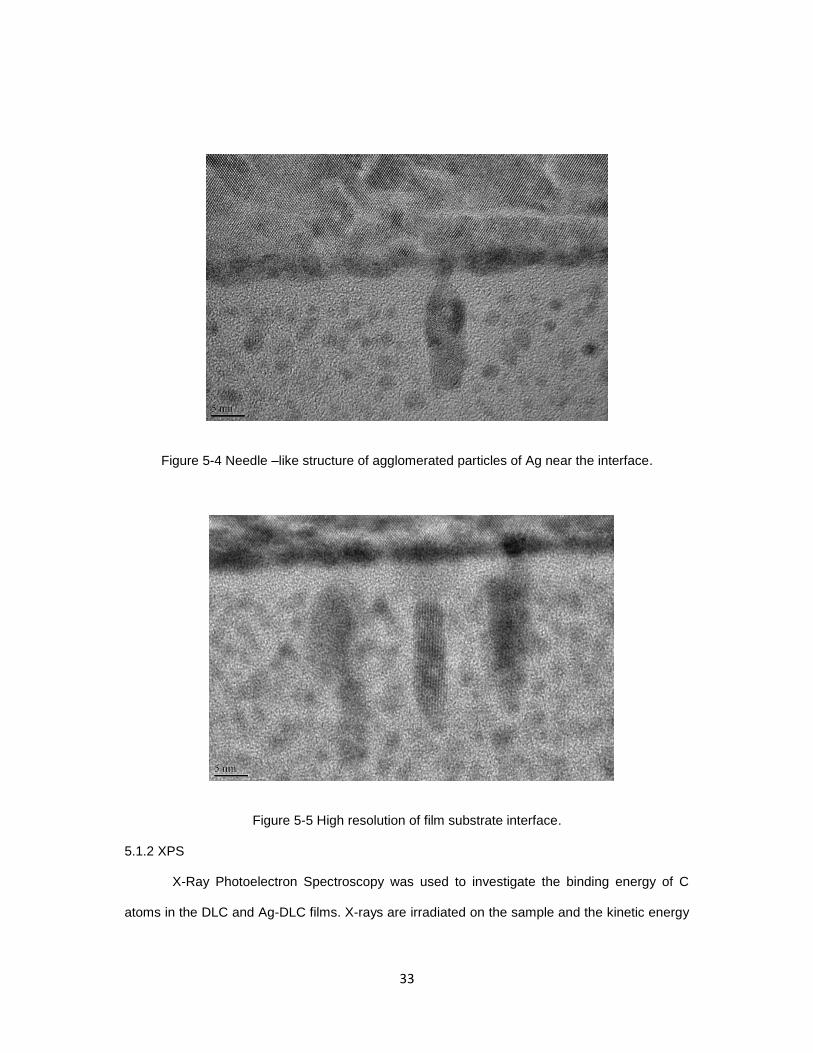
distance of about 2-5 nm, stated that the silver particles are encapsulated by the DLC network.
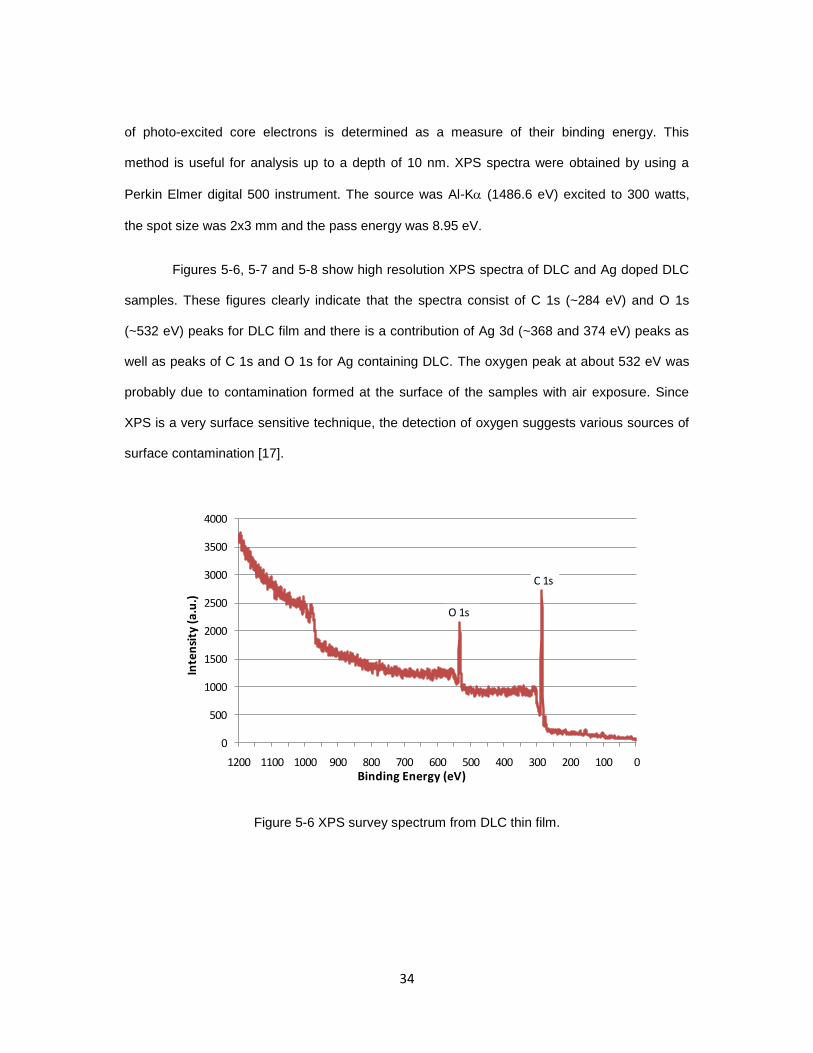
There was also formation of agglomerated silver particles near the interface giving an
appearance of a needle like structure. The dark spots represent Ag nanoparticles whereas the
bright regions represent the network of diamond-like carbon as is clearly shown in Figure 5-4.
32
Figure 5-2 Ag dispertion in DLC matrix for Ag-DLC (8.3 at.%Ag).
Figure 5-3 Ag dispertion in DLC matrix for Ag-DLC (2 at.%Ag).
33
Figure 5-4 Needle –like structure of agglomerated particles of Ag near the interface.
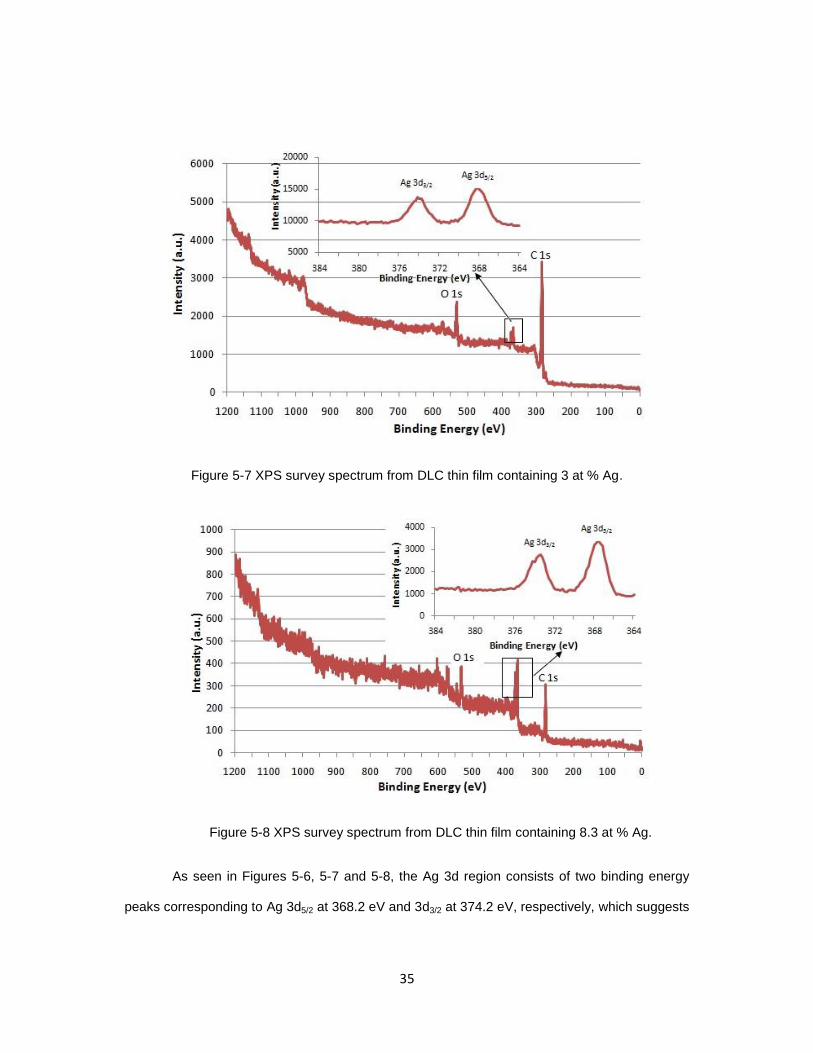
Figure 5-5 High resolution of film substrate interface.
5.1.2 XPS
X-Ray Photoelectron Spectroscopy was used to investigate the binding energy of C
atoms in the DLC and Ag-DLC films. X-rays are irradiated on the sample and the kinetic energy
34
0
500
1000
1500
2000
2500
3000
3500
4000
1200 1100 1000 900 800 700 600 500 400 300 200 100 0
Inte
nsi
ty (a
.u.)
Binding Energy (eV)
O 1s
C 1s
of photo-excited core electrons is determined as a measure of their binding energy. This
method is useful for analysis up to a depth of 10 nm. XPS spectra were obtained by using a
Perkin Elmer digital 500 instrument. The source was Al-K (1486.6 eV) excited to 300 watts,
the spot size was 2x3 mm and the pass energy was 8.95 eV.
Figures 5-6, 5-7 and 5-8 show high resolution XPS spectra of DLC and Ag doped DLC
samples. These figures clearly indicate that the spectra consist of C 1s (~284 eV) and O 1s
(~532 eV) peaks for DLC film and there is a contribution of Ag 3d (~368 and 374 eV) peaks as
well as peaks of C 1s and O 1s for Ag containing DLC. The oxygen peak at about 532 eV was
probably due to contamination formed at the surface of the samples with air exposure. Since
XPS is a very surface sensitive technique, the detection of oxygen suggests various sources of
surface contamination [17].
Figure 5-6 XPS survey spectrum from DLC thin film.
35
Figure 5-7 XPS survey spectrum from DLC thin film containing 3 at % Ag.
Figure 5-8 XPS survey spectrum from DLC thin film containing 8.3 at % Ag.
As seen in Figures 5-6, 5-7 and 5-8, the Ag 3d region consists of two binding energy
peaks corresponding to Ag 3d5/2 at 368.2 eV and 3d3/2 at 374.2 eV, respectively, which suggests
36
278 280 282 284 286 288 290 292 294 296 298 300 302
0
1x10⁴
2x10⁴
Inte
nsity (
a.u
.)
Binding Energy (eV)
Peak Analysis
Baseline:Line
Adj. R-Square=9.99196E-001 # of Data Points=101.
Degree of Freedom=97.SS=3.32810E+006
Chi^2=3.43103E+004
Date:2/23/2012Data Set:[Book1]Sheet1!B
Fitting Results
Max Height
7543.33263
16057.0183
Area IntgP
24.04118
75.95882
FWHM
2.03788
3.02498
Center Grvty
284.40137
284.98799
Area Intg
16363.43068
51700.75261
Peak Type
Gaussian
Gaussian
Peak Index
1.
2.
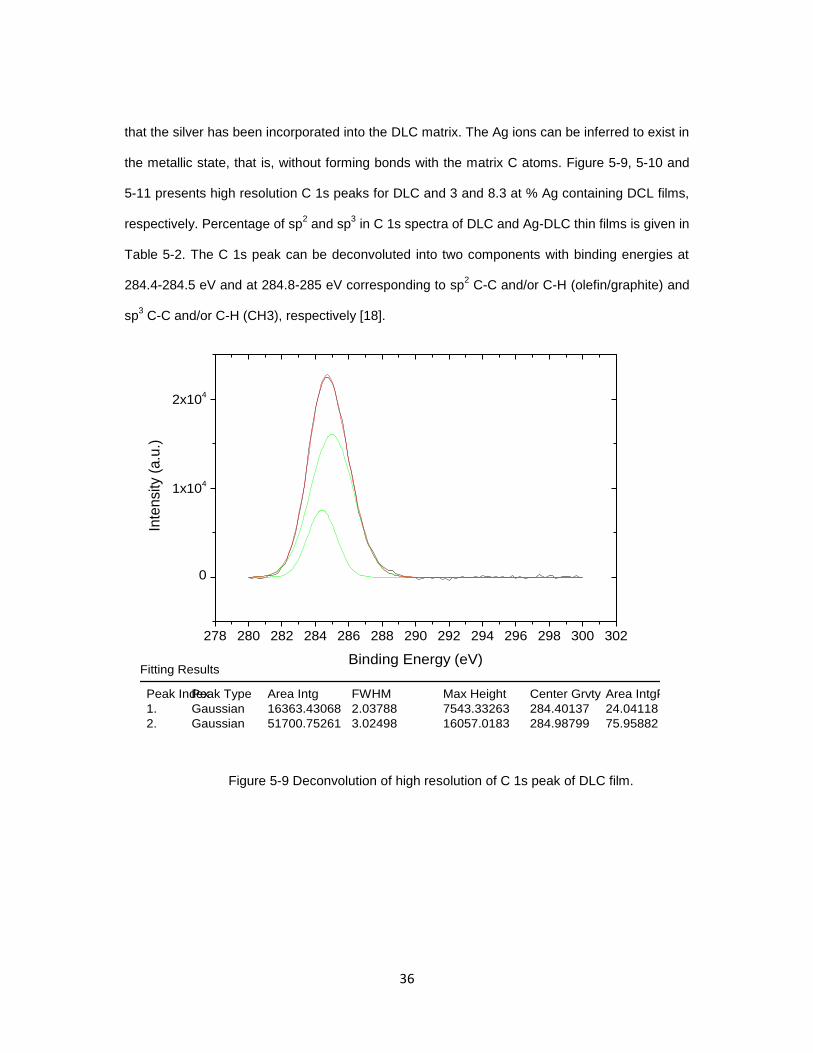
that the silver has been incorporated into the DLC matrix. The Ag ions can be inferred to exist in
the metallic state, that is, without forming bonds with the matrix C atoms. Figure 5-9, 5-10 and
5-11 presents high resolution C 1s peaks for DLC and 3 and 8.3 at % Ag containing DCL films,
respectively. Percentage of sp2 and sp
3 in C 1s spectra of DLC and Ag-DLC thin films is given in
Table 5-2. The C 1s peak can be deconvoluted into two components with binding energies at
284.4-284.5 eV and at 284.8-285 eV corresponding to sp2 C-C and/or C-H (olefin/graphite) and
sp3 C-C and/or C-H (CH3), respectively [18].
Figure 5-9 Deconvolution of high resolution of C 1s peak of DLC film.
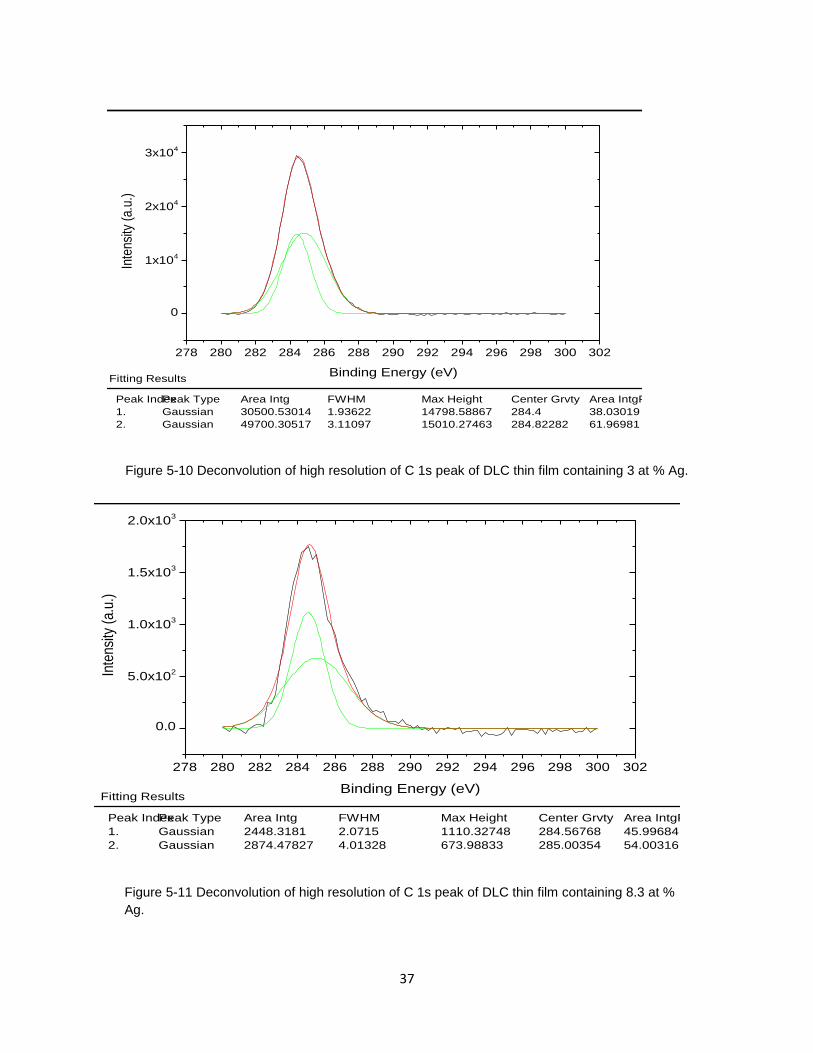
37
Figure 5-10 Deconvolution of high resolution of C 1s peak of DLC thin film containing 3 at % Ag.
Figure 5-11 Deconvolution of high resolution of C 1s peak of DLC thin film containing 8.3 at %
Ag.
278 280 282 284 286 288 290 292 294 296 298 300 302
0
1x10⁴
2x10⁴
3x10⁴
Inte
nsity
(a.
u.)
Binding Energy (eV)
Peak Analysis
Baseline:Line
Adj. R-Square=9.99352E-001 # of Data Points=101.
Degree of Freedom=97.SS=4.05025E+006
Chi^2=4.17552E+004
Date:2/23/2012Data Set:[Book1]Sheet1!B
Fitting Results
Max Height
14798.58867
15010.27463
Area IntgP
38.03019
61.96981
FWHM
1.93622
3.11097
Center Grvty
284.4
284.82282
Area Intg
30500.53014
49700.30517
Peak Type
Gaussian
Gaussian
Peak Index
1.
2.
278 280 282 284 286 288 290 292 294 296 298 300 302
0.0
5.0x10²
1.0x10³
1.5x10³
2.0x10³
Inte
nsity
(a.
u.)
Binding Energy (eV)
Peak Analysis
Baseline:Line
Adj. R-Square=9.86261E-001 # of Data Points=101.
Degree of Freedom=97.SS=3.30762E+005
Chi^2=3.40992E+003
Date:2/23/2012Data Set:[Book1]Sheet1!B
Fitting Results
Max Height
1110.32748
673.98833
Area IntgP
45.99684
54.00316
FWHM
2.0715
4.01328
Center Grvty
284.56768
285.00354
Area Intg
2448.3181
2874.47827
Peak Type
Gaussian
Gaussian
Peak Index
1.
2.
38
Table 5-2 Percentage of sp2 and sp
3 in C 1s spectra of DLC and Ag-DLC thin films.
Sample
Binding Energy (eV) Peak contribution (%)
sp2 sp
3 sp
2 sp
3
DLC 284.4 284.98 24 76
Ag-DLC (3 at %) 284.4 284.82 38 62
Ag-DLC (8.3 at %) 284.56 285 46 54
The sp2 ratio increases with increasing Ag content in the DLC. The film structure
significantly changes with increasing atomic percentage of silver, which is most evident from the
increasing intensity of the sp2 and the decreasing intensity of the sp
3. It is thus evident that the
DLC film changes to more graphitic as the Ag concentration increases [19]. These results are in
agreement with the previous experimental observations (FTIR and Raman) in the present study.
5.1.3 FTIR
FTIR spectra were taken for all samples to investigate the C-H bonding in the films.
Strong FTIR absorption of the C-H stretch was obtained in the range 2800-3150 cm-1
which
reveals a high H content in the films. A Nicolet FTIR system was used for the analysis. The
spectrum of DLC and Ag-DLC films was subtracted from the Si wafer background to obtain the
absorbance response of the films. The resultant curve was smoothed twice using 25 point
smoothing in the OMNIC software. The region for C-H stretching was selected and was
subjected to a base line correction. The corrected curve was subjected to Fourier Self
Deconvolution to get the component peaks. The deconvoluted peaks were curve fitted in a
Gaussian distribution and the area under the component peaks was noted for their percentage
determination.
39
Figure 5-12 shows FTIR spectra from obtained from the DLC and Ag-DLC thin films.
Generally, the vibration mode of the FTIR spectrum obtained from a-C:H films is classified into
stretching-type and deformation-type bands. The vibration mode of the stretching-type carbon-
hydrogen bond is observed in the range of 2850-3305 cm-1
and that of the deformation-type is
observed in the range of 1300-1700 cm-1
. In our examination, only the stretching-type vibration
mode was observed for the DLC films.
The C-H stretching mode is revealed at 2800-3300 cm-1
of the FTIR absorption
spectrum. The CH3 asymmetric stretching vibration occurs at around 2975-2950 cm
-1, whereas
for the absorption occurs at about 2930 cm-1
. The CH3 symmetric vibration occurs at about
2865-2885 cm-1
and the CH2 absorption occurs at about 2870-2840 cm
-1. As seen in Figure 5-
12, after wave number of 2950 cm-1
with increasing of Ag content into DLC, absorption peaks
shifted up. This implies that hydrogen content of the thin films changed accordingly sp3/sp
2 ratio
changed.
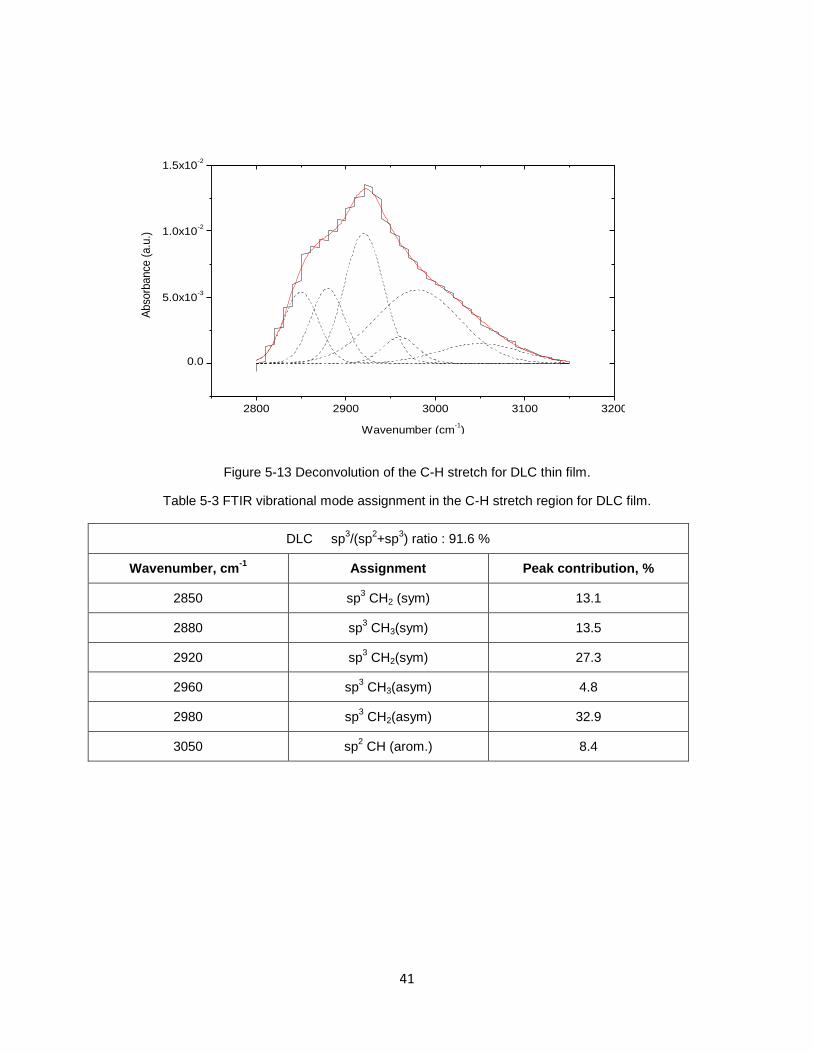
Deconvoluted FTIR spectra of C-H stretch for DLC and Ag-DLC are shown in Figure 5-
13 and the various bonding states of the C-H stretching and also role of Ag in the DLC films are
given in Table 5-3. The relative amount of each bonding type was obtained by estimating the
area under each peak. As seen in Fig 5-13 – Figure 5-18, with introducing of Ag into DLC, the
shoulders at ~2800-2850 cm−1
and at ~2970-3150 cm−1
arising due to sp3-CH symmetric and
sp2-CH olefinic stretching vibrations became prominent, respectively. The obvious absorption
peaks at 2830-2920 and 2960-2980 cm-1
are due to the hydrogen atom in the CH2 (sym-asym) /
CH3 (sym) stretching bands, all bonded to sp3-type carbon. The peaks located at 2950 cm
-1 and
in the range of 3000-3110 cm-1
may be assigned to sp2-CH2 (sym) and sp
2-CH (olef./arom.)
bonding stretching modes. From these results, it can be said that the bonding structures
between carbon and hydrogen in DLC and Ag-DLC films consists of sp3 and sp
2 bonds.
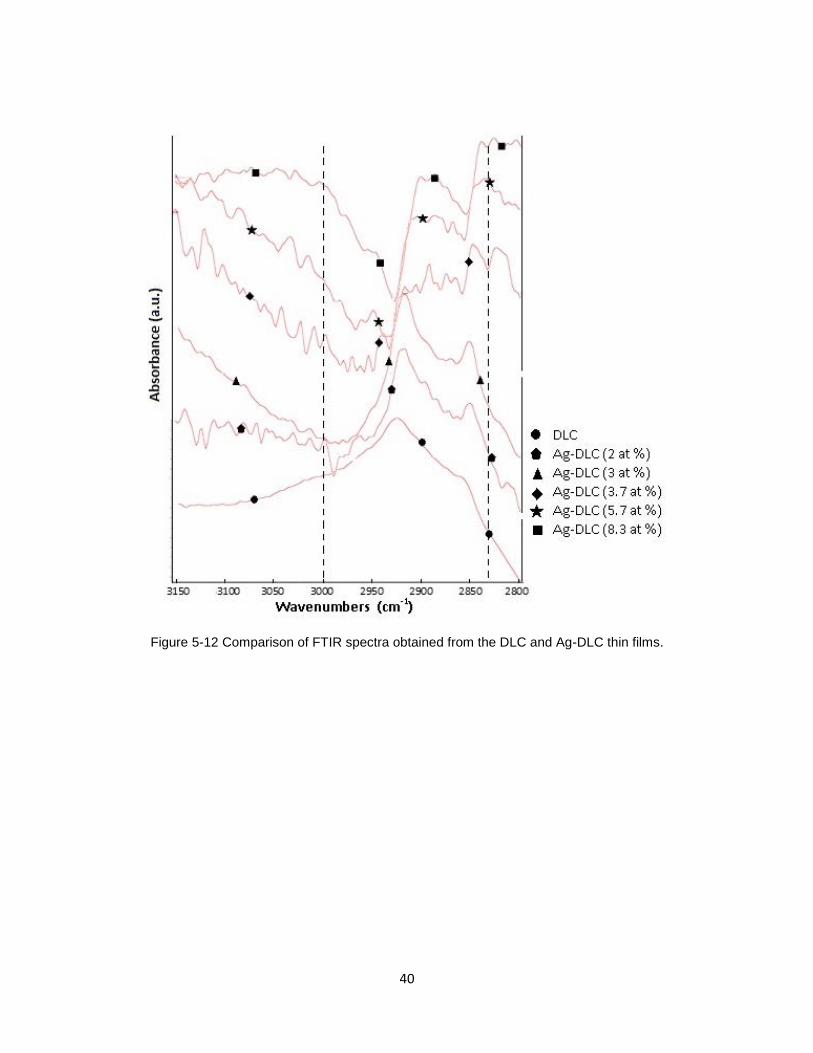
40
Figure 5-12 Comparison of FTIR spectra obtained from the DLC and Ag-DLC thin films.
41
Figure 5-13 Deconvolution of the C-H stretch for DLC thin film.
Table 5-3 FTIR vibrational mode assignment in the C-H stretch region for DLC film.
DLC sp3/(sp
2+sp
3) ratio : 91.6 %
Wavenumber, cm-1
Assignment Peak contribution, %
2850 sp3 CH2 (sym) 13.1
2880 sp3 CH3(sym) 13.5
2920 sp3 CH2(sym) 27.3
2960 sp3 CH3(asym) 4.8
2980 sp3 CH2(asym) 32.9
3050 sp2 CH (arom.) 8.4
2800 2900 3000 3100 3200
0.0
5.0x10⁻³
1.0x10⁻²
1.5x10⁻²
Abso
rbance
(a.u
.)
Wavenumber (cm-1)
Peak Analysis
Baseline:Line
How to add/change fields in the graph:
You will first need to customize what
field/label will report what quantity,
by changing the entries in the node
"Peak Characterization Report Fields"
under "Configure Graph" sub node of the
"Result" node on the Fit page of the PA.
Your assignments will then show up in the
labels. Simply drag labels over to the graph
and position them as desired.
Note that you can save your PA settings
as a theme for future use.
Adj. R-Square=-- # of Data Points=###
Degree of Freedom=###SS=--
Chi^2=--
Date:1/30/2012Data Set:###
Fitting Results
Max Height
0.00538
0.00565
0.00984
0.00199
0.00555
0.00148
Area IntgP
13.0818
13.49488
27.2576
4.84131
32.90676
8.41765
FWHM
45.63054
44.56339
51.73221
45.52328
110.79034
107.39025
Center Grvty
2849.66336
2879.6421
2920
2960.17009
2979.62438
3049.62792
Area Intg
0.25995
0.26816
0.54165
0.0962
0.65391
0.16727
Peak Type
Gaussian
Gaussian
Gaussian
Gaussian
Gaussian
Gaussian
Peak Index
1.
2.
3.
4.
5.
6.
Field 11Field 10Field 9Field 8
Field 15Field 14Field 13Field 12
Field 20Field 19Field 18Field 17Field 16
42
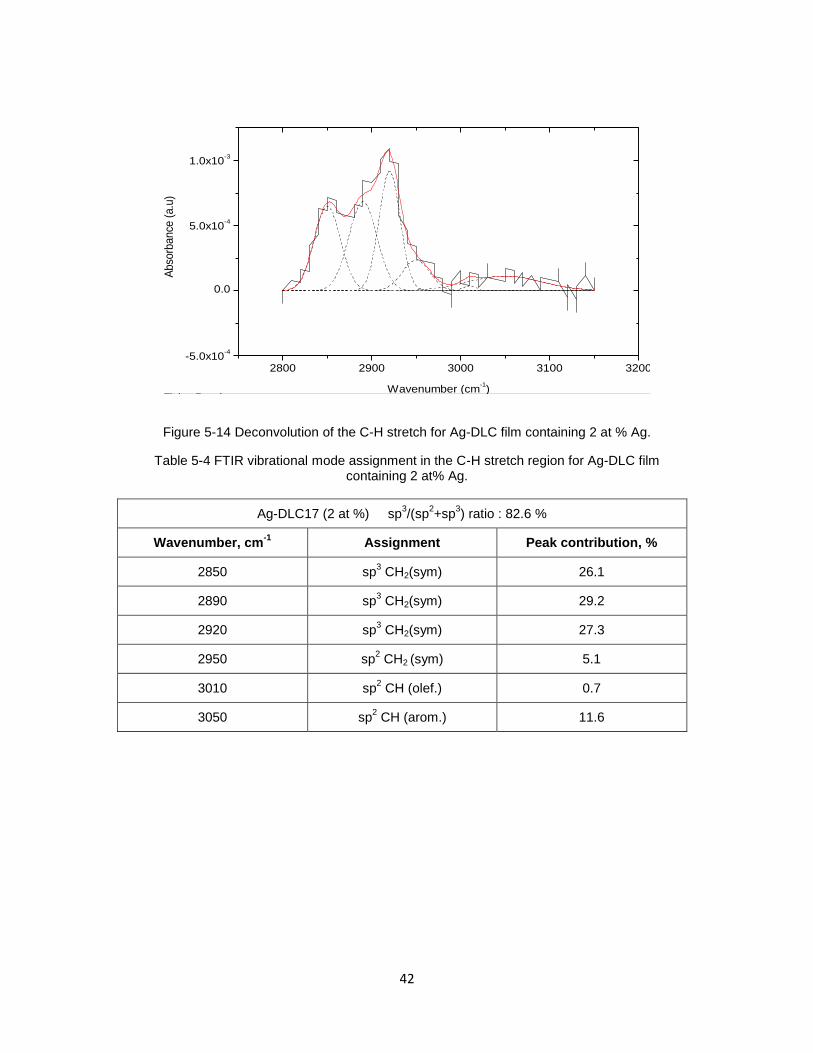
Figure 5-14 Deconvolution of the C-H stretch for Ag-DLC film containing 2 at % Ag.
Table 5-4 FTIR vibrational mode assignment in the C-H stretch region for Ag-DLC film containing 2 at% Ag.
Ag-DLC17 (2 at %) sp3/(sp
2+sp
3) ratio : 82.6 %
Wavenumber, cm-1
Assignment Peak contribution, %
2850 sp3 CH2(sym) 26.1
2890 sp3 CH2(sym) 29.2
2920 sp3 CH2(sym) 27.3
2950 sp2 CH2 (sym) 5.1
3010 sp2 CH (olef.) 0.7
3050 sp2 CH (arom.) 11.6
2800 2900 3000 3100 3200-5.0x10
-4
0.0
5.0x10⁻⁴
1.0x10⁻³
Abso
rbance
(a.u
)
Wavenumber (cm-1)
Peak Analysis
Baseline:Line
How to add/change fields in the graph:
You will first need to customize what
field/label will report what quantity,
by changing the entries in the node
"Peak Characterization Report Fields"
under "Configure Graph" sub node of the
"Result" node on the Fit page of the PA.
Your assignments will then show up in the
labels. Simply drag labels over to the graph
and position them as desired.
Note that you can save your PA settings
as a theme for future use.
Adj. R-Square=-- # of Data Points=###
Degree of Freedom=###SS=--
Chi^2=--
Date:1/30/2012Data Set:###
Fitting Results
Max Height
4E-5
6.5E-4
1.1E-4
6.8E-4
2.4E-4
9.2E-4
Area IntgP
0.69816
24.07785
11.57021
27.2383
9.07993
27.33554
FWHM
17.2284
34.88921
97.06387
37.49339
36.26357
28.07296
Center Grvty
3009.76258
2850
3049.78738
2890
2949.64564
2920
Area Intg
7E-4
0.02409
0.01158
0.02725
0.00908
0.02735
Peak Type
Gaussian
Gaussian
Gaussian
Gaussian
Gaussian
Gaussian
Peak Index
1.
2.
3.
4.
5.
6.
Field 11Field 10Field 9Field 8
Field 15Field 14Field 13Field 12
Field 20Field 19Field 18Field 17Field 16
0 2 4 6 8 10
0
2
4
6
8
10
43
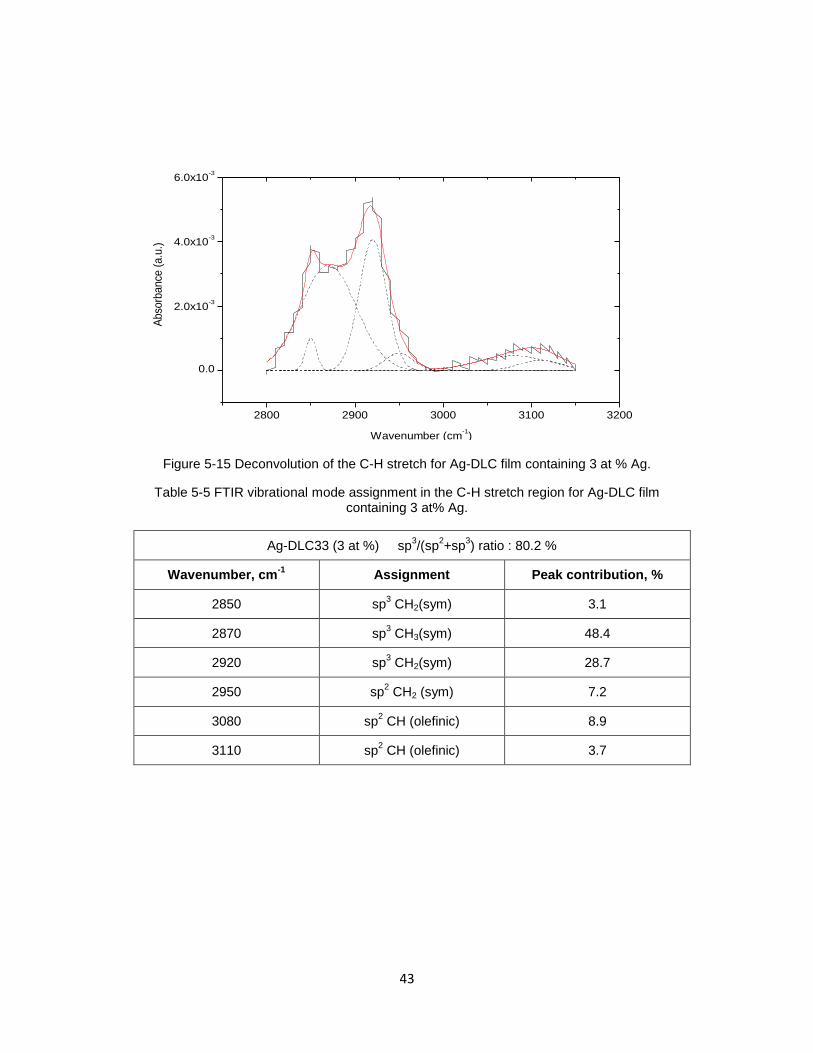
Figure 5-15 Deconvolution of the C-H stretch for Ag-DLC film containing 3 at % Ag.
Table 5-5 FTIR vibrational mode assignment in the C-H stretch region for Ag-DLC film containing 3 at% Ag.
Ag-DLC33 (3 at %) sp3/(sp
2+sp
3) ratio : 80.2 %
Wavenumber, cm-1
Assignment Peak contribution, %
2850 sp3 CH2(sym) 3.1
2870 sp3 CH3(sym) 48.4
2920 sp3 CH2(sym) 28.7
2950 sp2 CH2 (sym) 7.2
3080 sp2 CH (olefinic) 8.9
3110 sp2 CH (olefinic) 3.7
2800 2900 3000 3100 3200
0.0
2.0x10⁻³
4.0x10⁻³
6.0x10⁻³
Abso
rbance
(a.u
.)
Wavenumber (cm-1)
Peak Analysis
Baseline:Exponential
How to add/change fields in the graph:
You will first need to customize what
field/label will report what quantity,
by changing the entries in the node
"Peak Characterization Report Fields"
under "Configure Graph" sub node of the
"Result" node on the Fit page of the PA.
Your assignments will then show up in the
labels. Simply drag labels over to the graph
and position them as desired.
Note that you can save your PA settings
as a theme for future use.
Adj. R-Square=-- # of Data Points=###
Degree of Freedom=###SS=--
Chi^2=--
Date:1/30/2012Data Set:###
Fitting Results
Max Height
0.00101
0.00327
5.5E-4
0.00406
4.6E-4
3.3E-4
Area IntgP
3.06082
49.42162
4.21013
30.74326
8.86912
3.69505
FWHM
14.60556
74.09786
36.80432
36.61255
97.2028
57.33966
Center Grvty
2850
2869.91495
2949.8051
2920
3079.76612
3110.54217
Area Intg
0.01575
0.25431
0.02166
0.1582
0.04564
0.01901
Peak Type
Gaussian
Gaussian
Gaussian
Gaussian
Gaussian
Gaussian
Peak Index
1.
2.
3.
4.
5.
6.
Field 11Field 10Field 9Field 8
Field 15Field 14Field 13Field 12
Field 20Field 19Field 18Field 17Field 16
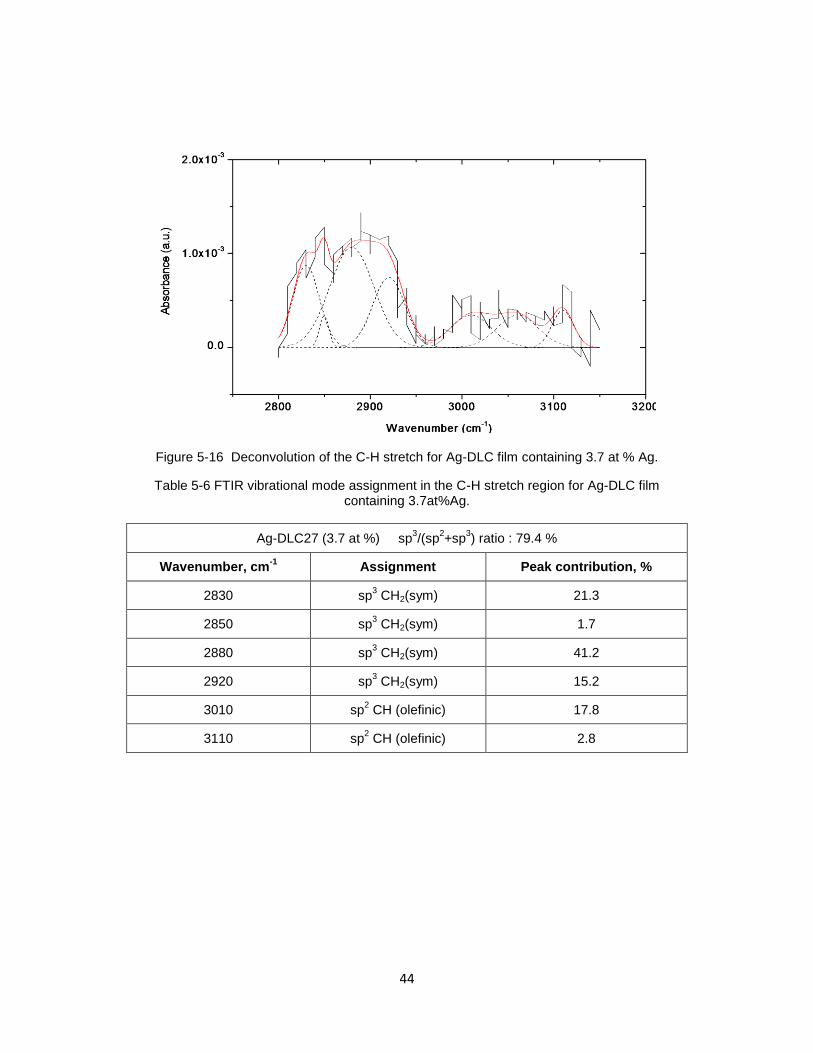
44
Figure 5-16 Deconvolution of the C-H stretch for Ag-DLC film containing 3.7 at % Ag.
Table 5-6 FTIR vibrational mode assignment in the C-H stretch region for Ag-DLC film containing 3.7at%Ag.
Ag-DLC27 (3.7 at %) sp3/(sp
2+sp
3) ratio : 79.4 %
Wavenumber, cm-1
Assignment Peak contribution, %
2830 sp3 CH2(sym) 21.3
2850 sp3 CH2(sym) 1.7
2880 sp3 CH2(sym) 41.2
2920 sp3 CH2(sym) 15.2
3010 sp2 CH (olefinic) 17.8
3110 sp2 CH (olefinic) 2.8
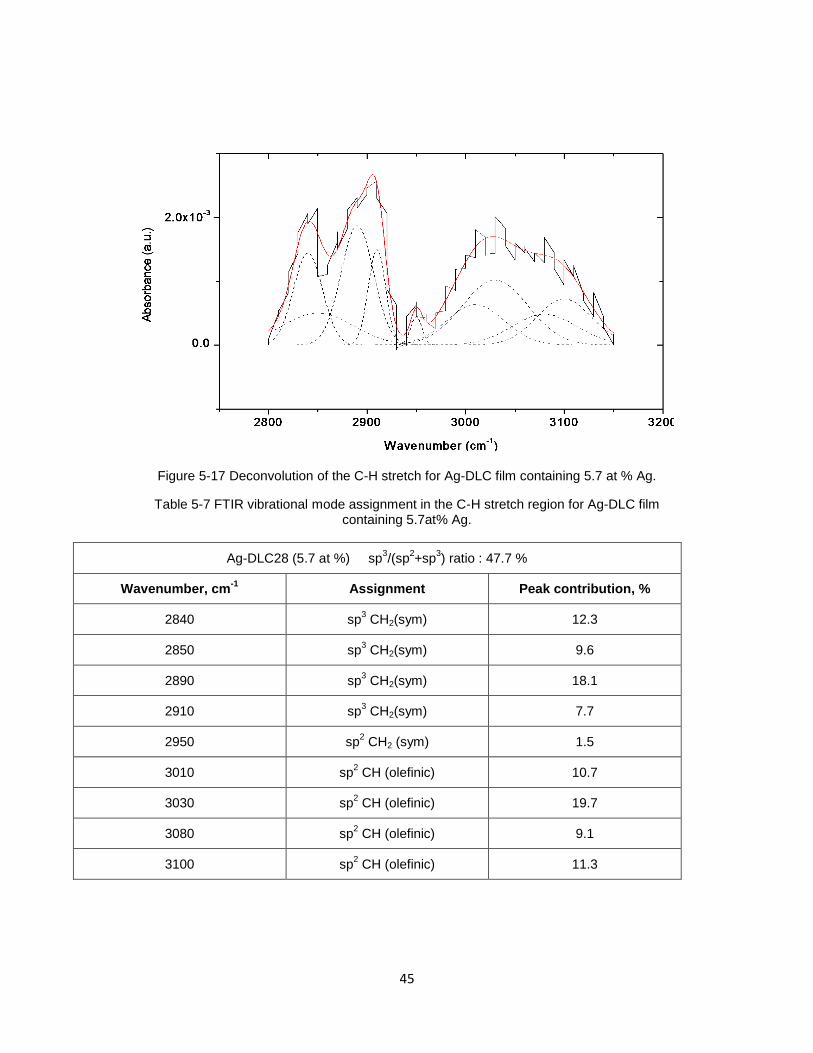
45
Figure 5-17 Deconvolution of the C-H stretch for Ag-DLC film containing 5.7 at % Ag.
Table 5-7 FTIR vibrational mode assignment in the C-H stretch region for Ag-DLC film containing 5.7at% Ag.
Ag-DLC28 (5.7 at %) sp3/(sp
2+sp
3) ratio : 47.7 %
Wavenumber, cm-1
Assignment Peak contribution, %
2840 sp3 CH2(sym) 12.3
2850 sp3 CH2(sym) 9.6
2890 sp3 CH2(sym) 18.1
2910 sp3 CH2(sym) 7.7
2950 sp2 CH2 (sym) 1.5
3010 sp2 CH (olefinic) 10.7
3030 sp2 CH (olefinic) 19.7
3080 sp2 CH (olefinic) 9.1
3100 sp2 CH (olefinic) 11.3
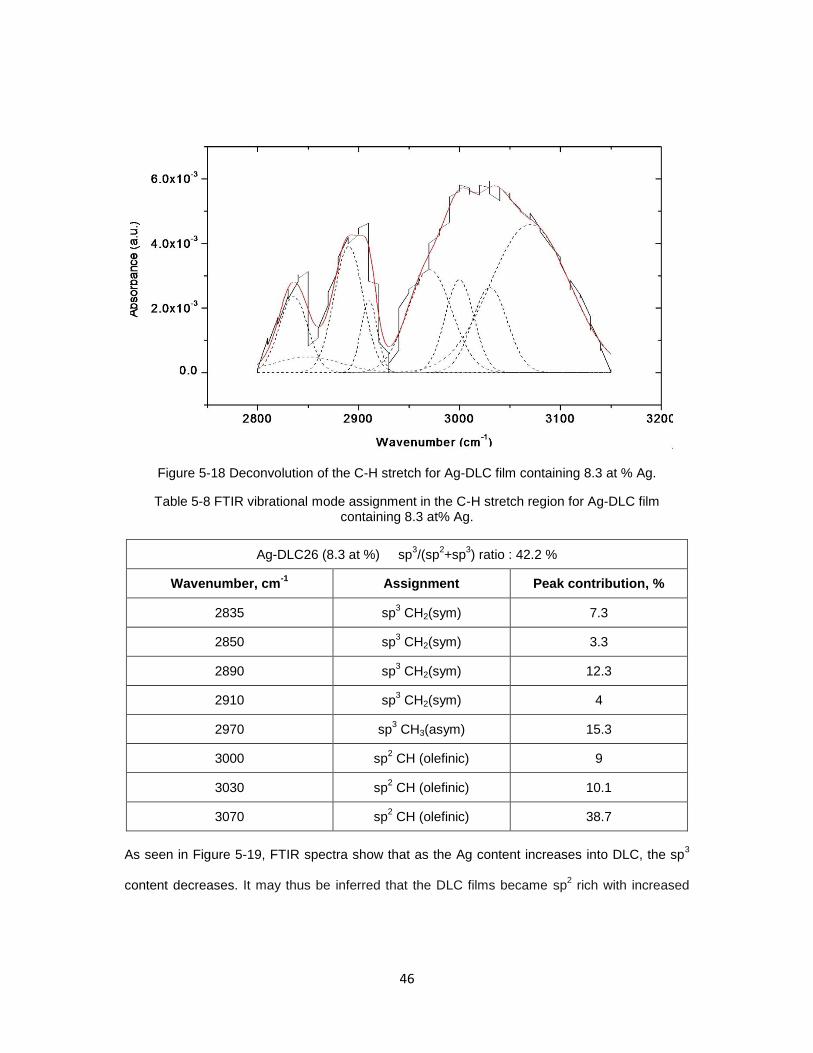
46
Figure 5-18 Deconvolution of the C-H stretch for Ag-DLC film containing 8.3 at % Ag.
Table 5-8 FTIR vibrational mode assignment in the C-H stretch region for Ag-DLC film containing 8.3 at% Ag.
Ag-DLC26 (8.3 at %) sp3/(sp
2+sp
3) ratio : 42.2 %
Wavenumber, cm-1
Assignment Peak contribution, %
2835 sp3 CH2(sym) 7.3
2850 sp3 CH2(sym) 3.3
2890 sp3 CH2(sym) 12.3
2910 sp3 CH2(sym) 4
2970 sp3 CH3(asym) 15.3
3000 sp2 CH (olefinic) 9
3030 sp2 CH (olefinic) 10.1
3070 sp2 CH (olefinic) 38.7
As seen in Figure 5-19, FTIR spectra show that as the Ag content increases into DLC, the sp
3
content decreases. It may thus be inferred that the DLC films became sp2 rich with increased
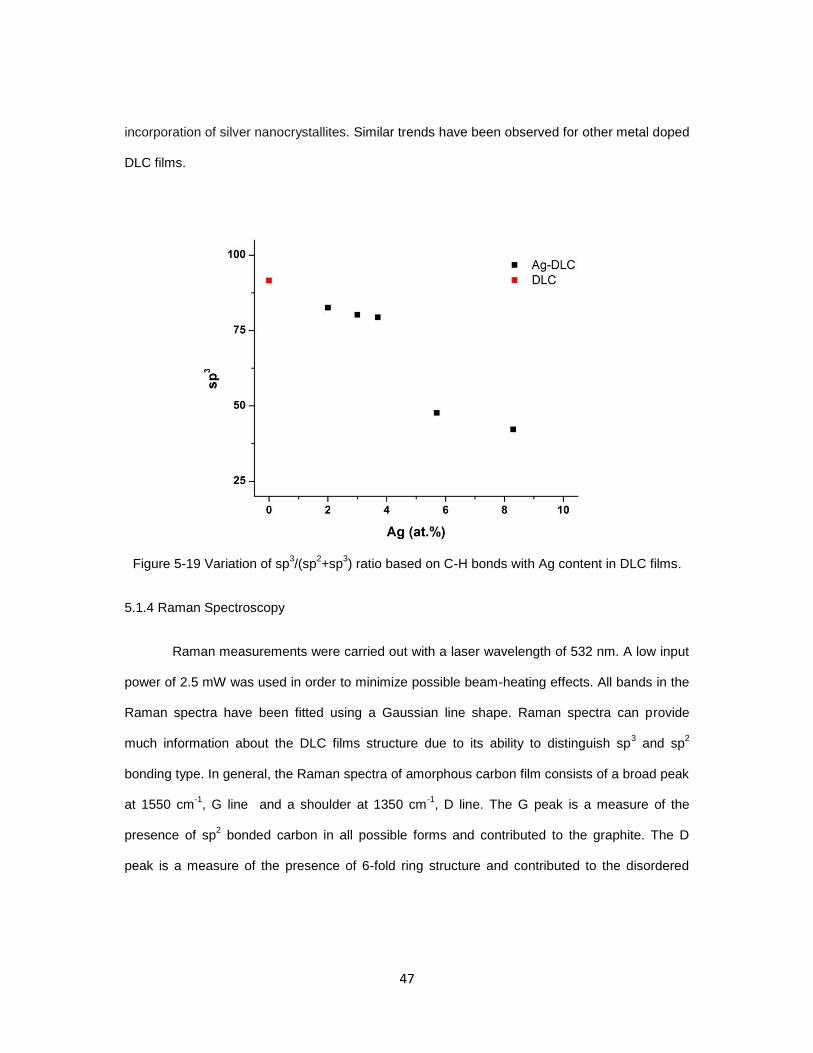
47
incorporation of silver nanocrystallites. Similar trends have been observed for other metal doped
DLC films.
Figure 5-19 Variation of sp
3/(sp
2+sp
3) ratio based on C-H bonds with Ag content in DLC films.
5.1.4 Raman Spectroscopy
Raman measurements were carried out with a laser wavelength of 532 nm. A low input
power of 2.5 mW was used in order to minimize possible beam-heating effects. All bands in the
Raman spectra have been fitted using a Gaussian line shape. Raman spectra can provide
much information about the DLC films structure due to its ability to distinguish sp3 and sp
2
bonding type. In general, the Raman spectra of amorphous carbon film consists of a broad peak
at 1550 cm-1
, G line and a shoulder at 1350 cm-1
, D line. The G peak is a measure of the
presence of sp2 bonded carbon in all possible forms and contributed to the graphite. The D
peak is a measure of the presence of 6-fold ring structure and contributed to the disordered
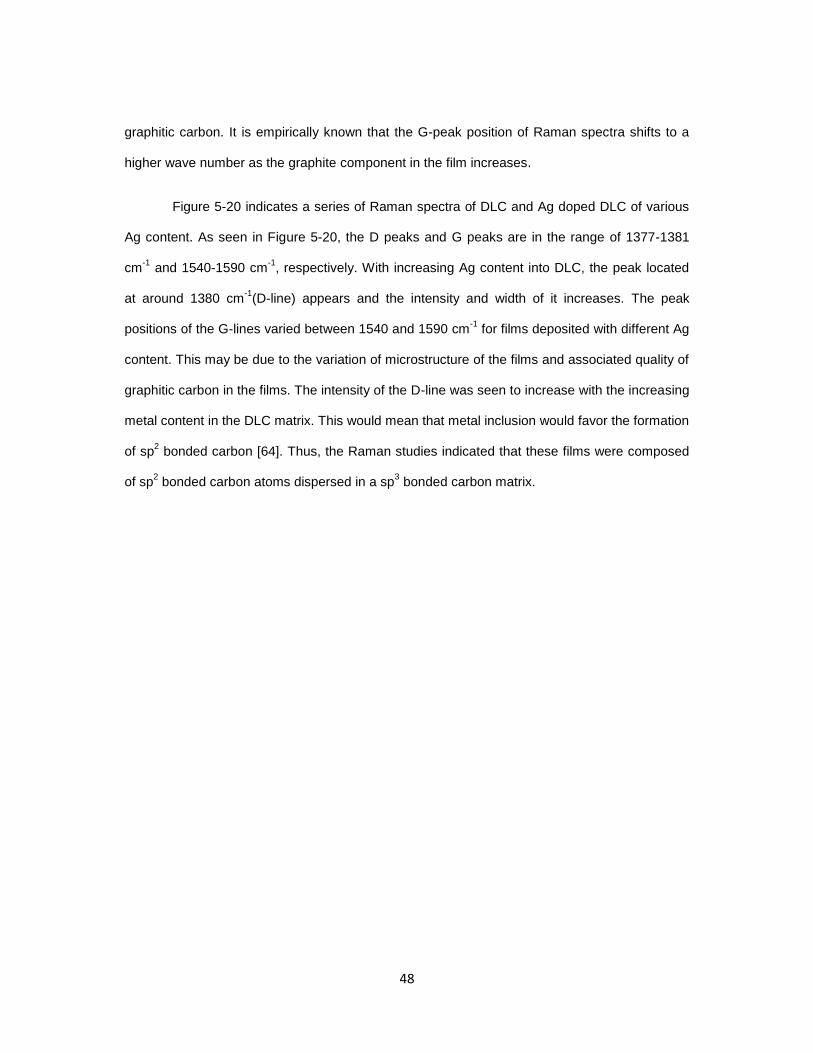
48
graphitic carbon. It is empirically known that the G-peak position of Raman spectra shifts to a
higher wave number as the graphite component in the film increases.
Figure 5-20 indicates a series of Raman spectra of DLC and Ag doped DLC of various
Ag content. As seen in Figure 5-20, the D peaks and G peaks are in the range of 1377-1381
cm-1
and 1540-1590 cm-1
, respectively. With increasing Ag content into DLC, the peak located
at around 1380 cm-1
(D-line) appears and the intensity and width of it increases. The peak
positions of the G-lines varied between 1540 and 1590 cm-1
for films deposited with different Ag
content. This may be due to the variation of microstructure of the films and associated quality of
graphitic carbon in the films. The intensity of the D-line was seen to increase with the increasing
metal content in the DLC matrix. This would mean that metal inclusion would favor the formation
of sp2 bonded carbon [64]. Thus, the Raman studies indicated that these films were composed
of sp2 bonded carbon atoms dispersed in a sp
3 bonded carbon matrix.
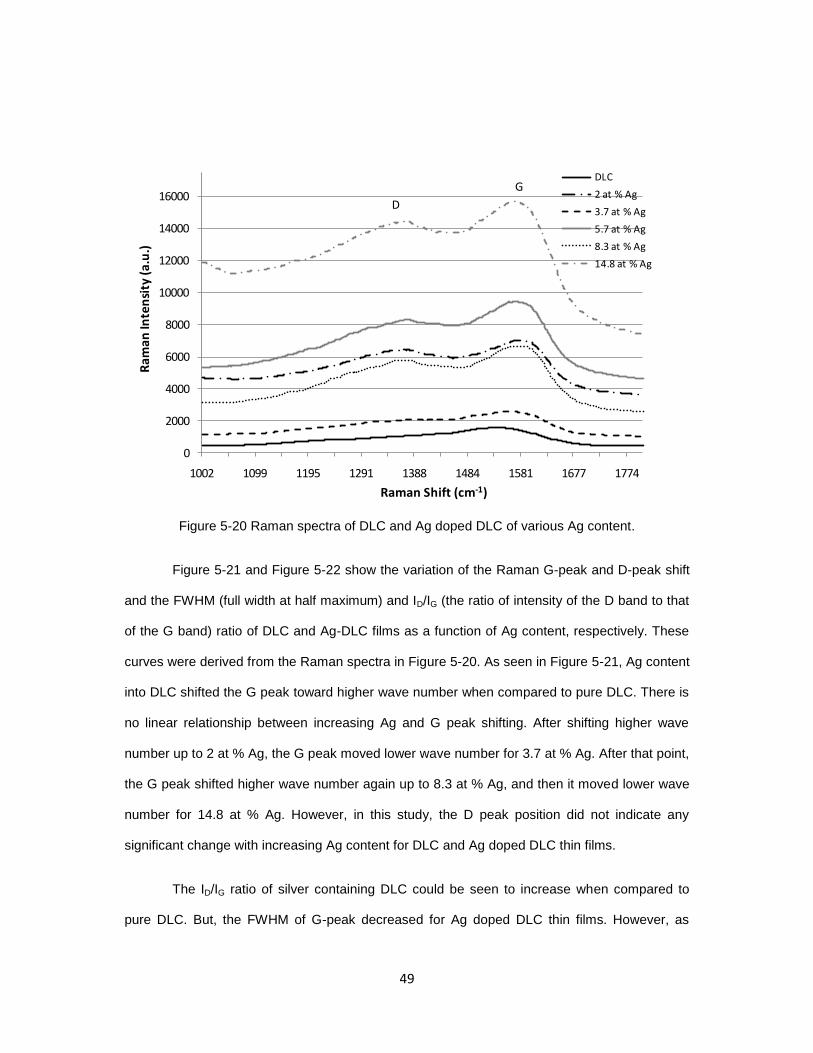
49
Figure 5-20 Raman spectra of DLC and Ag doped DLC of various Ag content.
Figure 5-21 and Figure 5-22 show the variation of the Raman G-peak and D-peak shift
and the FWHM (full width at half maximum) and ID/IG (the ratio of intensity of the D band to that
of the G band) ratio of DLC and Ag-DLC films as a function of Ag content, respectively. These
curves were derived from the Raman spectra in Figure 5-20. As seen in Figure 5-21, Ag content
into DLC shifted the G peak toward higher wave number when compared to pure DLC. There is
no linear relationship between increasing Ag and G peak shifting. After shifting higher wave
number up to 2 at % Ag, the G peak moved lower wave number for 3.7 at % Ag. After that point,
the G peak shifted higher wave number again up to 8.3 at % Ag, and then it moved lower wave
number for 14.8 at % Ag. However, in this study, the D peak position did not indicate any
significant change with increasing Ag content for DLC and Ag doped DLC thin films.
The ID/IG ratio of silver containing DLC could be seen to increase when compared to
pure DLC. But, the FWHM of G-peak decreased for Ag doped DLC thin films. However, as
0
2000
4000
6000
8000
10000
12000
14000
16000
1002 1099 1195 1291 1388 1484 1581 1677 1774
Ram
an In
ten
sity
(a.u
.)
Raman Shift (cm-1)
DLC
2 at % Ag
3.7 at % Ag
5.7 at % Ag
8.3 at % Ag
14.8 at % Ag
D
G
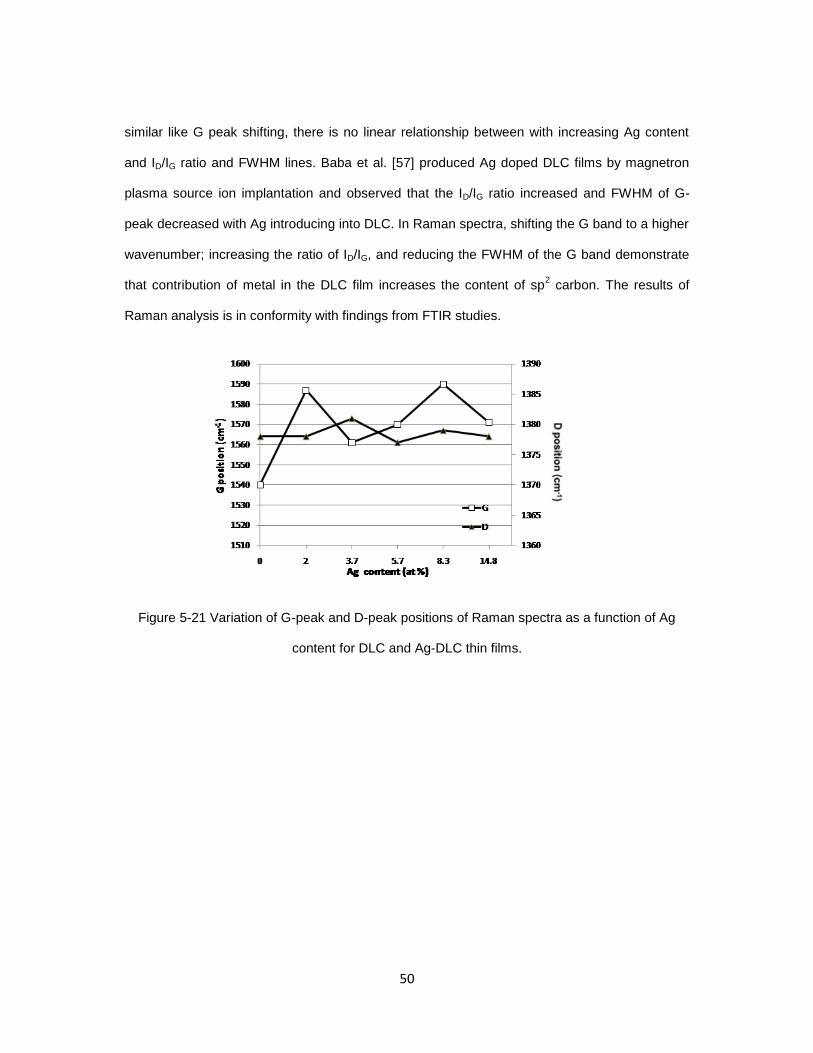
50
similar like G peak shifting, there is no linear relationship between with increasing Ag content
and ID/IG ratio and FWHM lines. Baba et al. [57] produced Ag doped DLC films by magnetron
plasma source ion implantation and observed that the ID/IG ratio increased and FWHM of G-
peak decreased with Ag introducing into DLC. In Raman spectra, shifting the G band to a higher
wavenumber; increasing the ratio of ID/IG, and reducing the FWHM of the G band demonstrate
that contribution of metal in the DLC film increases the content of sp2 carbon. The results of
Raman analysis is in conformity with findings from FTIR studies.
Figure 5-21 Variation of G-peak and D-peak positions of Raman spectra as a function of Ag
content for DLC and Ag-DLC thin films.
51
Figure 5-22 Variation of FWHM of G-peak and ID/IG ratio of Raman spectra as a function of Ag content for DLC and Ag-DLC thin films.
5.2 Tribological and Mechanical testing
5.2.1 Nanoindentation
Nanohardness results of the DLC and Ag-DLC films are shown in the Figure 5-10. It is
seen that with increase in Ag content in DLC films, the hardness values increased. It is
contradictory when compare with the previous research. Because, the sp3 content decreases
with increase in metal content resulting in lower hardness. This trend has been observed in
other Me-DLC [24, 37]. In Me-DLC, the C-C network is broken down by the presence of metal
nanoparticles and this results decrease in hardness.
0.2
0.3
0.4
0.5
0.6
0.7
0.8
80
130
180
230
280
0 2 3.7 5.7 8.3 14.8
FWH
M (G
)
Ag content (at %)
FWHM(G)
ID/IG
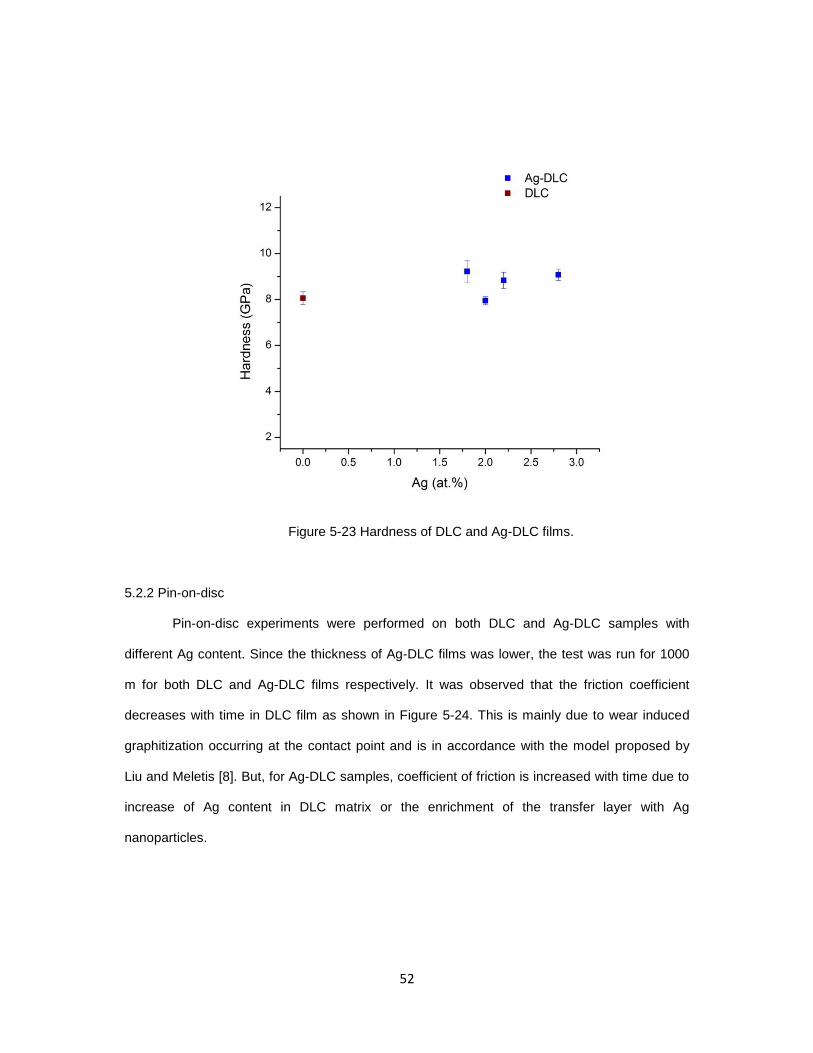
52
Figure 5-23 Hardness of DLC and Ag-DLC films.
5.2.2 Pin-on-disc
Pin-on-disc experiments were performed on both DLC and Ag-DLC samples with
different Ag content. Since the thickness of Ag-DLC films was lower, the test was run for 1000
m for both DLC and Ag-DLC films respectively. It was observed that the friction coefficient
decreases with time in DLC film as shown in Figure 5-24. This is mainly due to wear induced
graphitization occurring at the contact point and is in accordance with the model proposed by
Liu and Meletis [8]. But, for Ag-DLC samples, coefficient of friction is increased with time due to
increase of Ag content in DLC matrix or the enrichment of the transfer layer with Ag
nanoparticles.
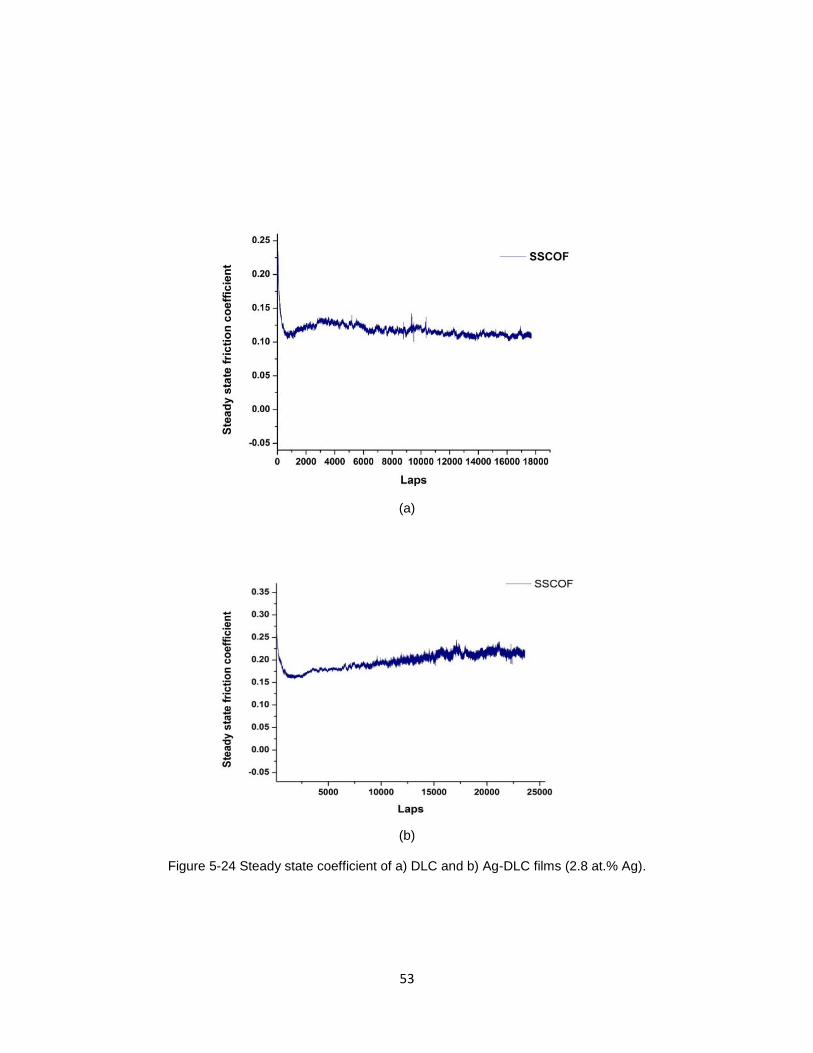
53
(a)
(b)
Figure 5-24 Steady state coefficient of a) DLC and b) Ag-DLC films (2.8 at.% Ag).
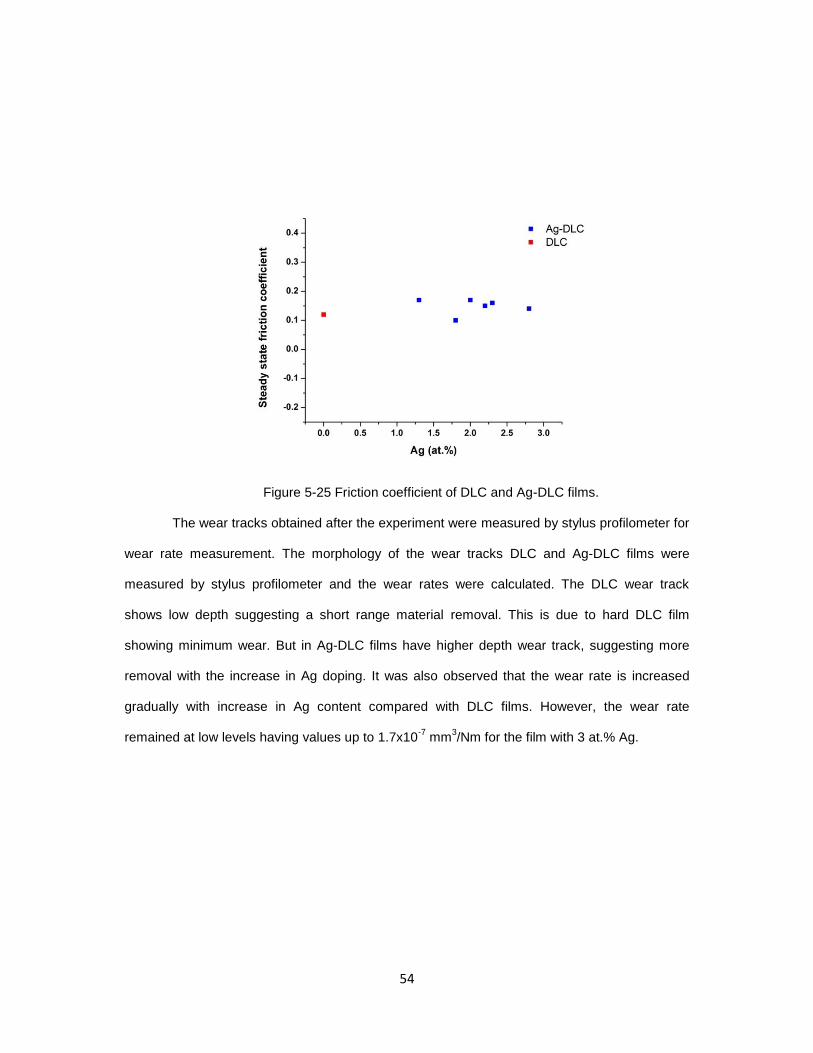
54
Figure 5-25 Friction coefficient of DLC and Ag-DLC films.
The wear tracks obtained after the experiment were measured by stylus profilometer for
wear rate measurement. The morphology of the wear tracks DLC and Ag-DLC films were
measured by stylus profilometer and the wear rates were calculated. The DLC wear track
shows low depth suggesting a short range material removal. This is due to hard DLC film
showing minimum wear. But in Ag-DLC films have higher depth wear track, suggesting more
removal with the increase in Ag doping. It was also observed that the wear rate is increased
gradually with increase in Ag content compared with DLC films. However, the wear rate
remained at low levels having values up to 1.7x10⁻⁷
mm3/Nm for the film with 3 at.% Ag.
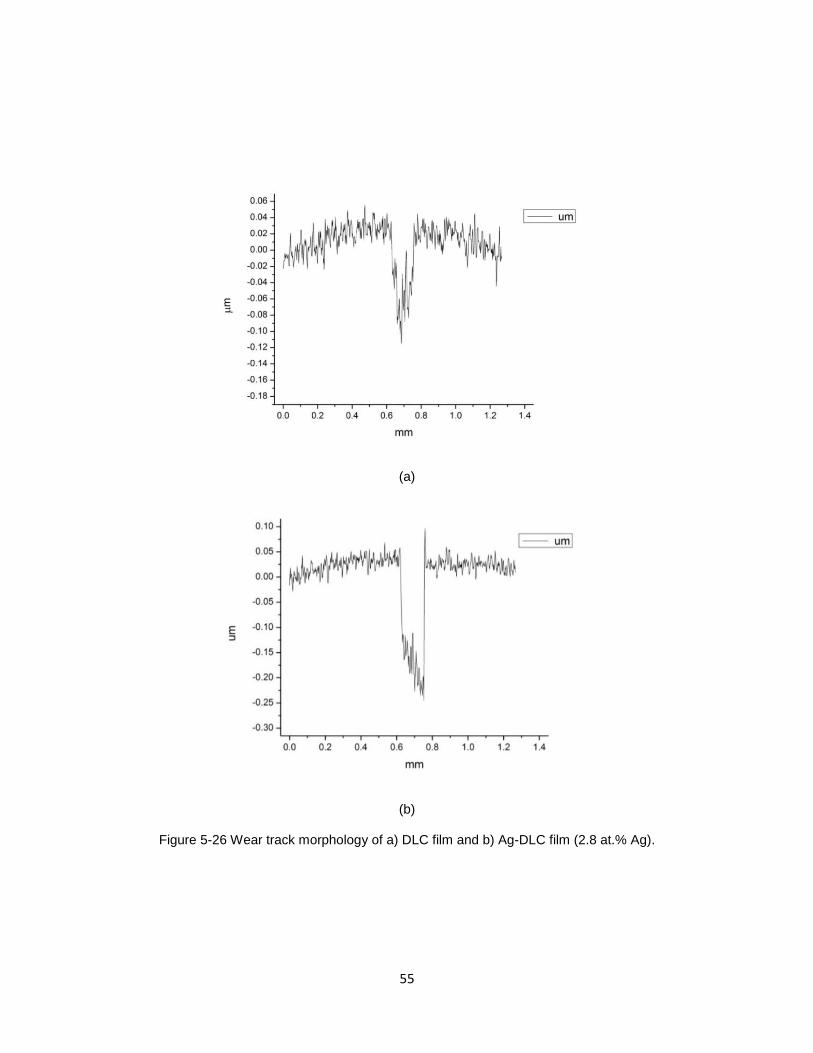
55
(a)
(b)
Figure 5-26 Wear track morphology of a) DLC film and b) Ag-DLC film (2.8 at.% Ag).
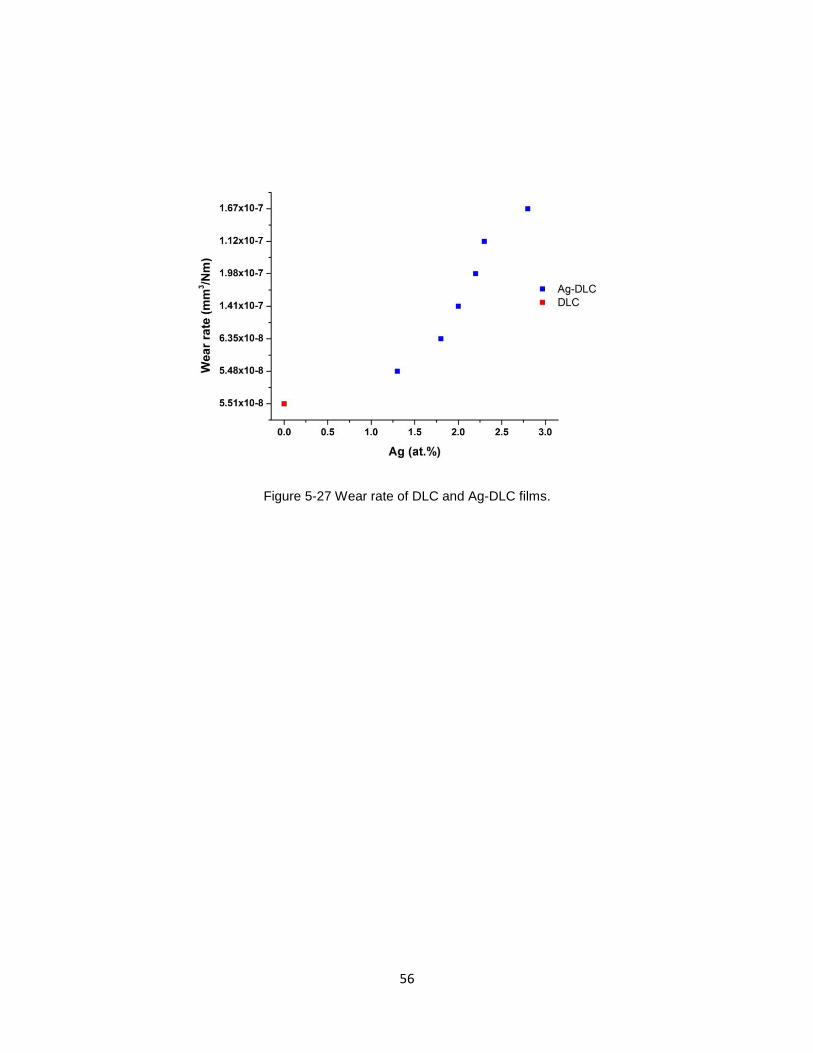
56
Figure 5-27 Wear rate of DLC and Ag-DLC films.
57
CHAPTER 6
CONCLUSIONS
1. This work shows the possibility of depositing good Ag doped DLC films without any
considerable degradation of the hardness, friction and wear rate when compared with
DLC films.
2. There is significant influence from process parameters, so they could be controlled in
order to improve the quality of the film and also to increase the Ag content in the DLC
matrix.
3. TEM observations revealed that the films contain a uniform distribution of Ag
nanoparticles in an amorphous DLC matrix but also revealed that Ag content is
decreasing with time in the direction of film growth due to poisoning of the target.
4. XPS, FTIR and Raman analysis showed that the sp2 content of the films increased by
increasing Ag content resulting in a subsequent reduction in hardness.
5. Based on the present results, functionality of Ag-DLC can be achieved by deposition of
a top Ag-DLC layer on a pure DLC under layer.
58
REFERENCES
1. J. Robertson, Properties of Diamond like carbon, Surface and Coating Technology, 50 (1992)
185.
2. A.A. Voevodin, J.P. O’Neill, J.S. Zabinski, Nanocomposite Tribological Coatings for
Aerospace Applications, Surface and Coating Technology., 116 (1999) 36.
3. J.S. Wang, Y. Sugimura, A.G. Evans, W.K. Tredway, The mechanical performance of DLC
films on steel substrates, Thin Solid Films, 325 (1998) 163.
4. A. Grill, Review of the tribology of diamond-like carbon, Wear 168 (1993) 143.
5. K.H. Habig, Fundamentals of the tribological behaviour of diamond, diamond- like carbon and
cubic boron nitride coatings, Surface and Coating Technology, 76 (1995) 540.
6. A. Erdemir, C. Bindal, J. Pagan, P. Wilbur, Characterization of transfer layers on steel
surfaces sliding against diamond-like hydrocarbon films in dry nitrogen, Surface and Coating
Technology, 76 (1995) 559.
7. Z.L. Akkerman, H. Efstathiadis, F.W. Smith, Thermal stability of diamond-like carbon films,
Journal of Applied Physics, 80 (1996) 3068.
8. Y. Liu, E.I. Meletis, Evidence of graphitization of diamond-like carbon films during sliding
wear. Journal of Materials Science, 32 (1997) 3491.
9. D. Sheeja, B.K. Tay, K.W. Leong, C.H. Lee, Effects of thermal annealing on amorphous
carbon nitride films by r.f. PECVD, Diamond and Related Materials, 11 (2002) 1643.
10. Y. Pauleau, F. Thiery, Deposition and characterization of nanostructured metalycarbon
composite films, Surface and Coatings Technology, 180 (2004) 313.
11. Sk. Faruque Ahmed, Myoung-Woon Moon, Kwang-Ryeol Lee, Effect of silver doping on
optical property of diamond like carbon films, Thin Solid Films 517 (2009) 4035.
12. S.C.H. Kwok, W. Zhang, G.J. Wan, D.R. McKenzie, M.M.M. Bilek, Paul K. Chu,
59
Hemocompatibility and anti-bacterial properties of silver doped diamond-like carbon
prepared by pulsed filtered cathodic vacuum arc deposition, Diamond and Related
Materials 16 (2007) 1353.
13. F.R. Marciano, L.F. Bonetti, R.S. Pessoa, J.S. Marcuzzo, M. Massi, L.V. Santos, V.J. Trava-
Airoldi, The improvement of DLC film lifetime using silver nanoparticles for use on space
devices, Diamond and Related Materials 17 (2008) 1674.
14. Sk. Faruque Ahmed, Myoung-Woon Moon, and Kwang-Ryeol Lee, Enhancement of electron
field emission property with silver incorporation into diamondlike carbon matrix, Applied
Physics Letters, 92 (2008) 193502.
15. H.L. Lee, J.M. Ting, Carbon-based composite thin films for use as microelectrode, Materials
Chemistry and Physics, 82 (2003) 567.
16. A. Grigonis, Z. Rutkuniene, V. Kopustinskas, G.J. Babonas, A. Reza, Investigation of optical
properties of a-C:H films deposited from acetylene using direct ion beam deposition
method, Vacuum, 78 (2005) 593.
17. L. Holland, S.M. Ojha, The growth of carbon films with random atomic structure ion impact
damage in a hydrocarbon plasma, Thin Solid Films, 58 (1979) 107.
18. M. Weiler, S. Sattel, K. Jung, H. Ehrhardt, V. Veerasamy, J. Robertson, Highly tetrahedral,
diamond- like amorphous hydrogenated carbon prepared from a plasma beam source,
Applied Physics Letters, 64 (1994) 2797.
19. J. Robertson, Diamond like amorphous carbon, Materials Science and Engineering R, 37
(2002) 129.
20. K. Yamamoto, K. Wazumi, T. Watanabe, Y. Koga, S. Iijima, Tribological properties of
diamond-like carbon films prepared by mass-separated ion beam deposition, Diamond and
Related Materials, 11 (2002) 1130.
21. D. Sheeja, B.K Tay, S.P Lau, X Shi, X Ding, Structure and tribological characterization of
60
multilayer ta-C films prepared by filtered cathodic vacuum arc with substrate pulse biasing,
Surface and Coating Technology, 132 (2000) 228.
22. S. Swann, Magnetron sputtering, Physics Technology, 19 (1988) 67.
23. G. Dearnaley, J. H. Arps, Biomedical applications of diamond-like carbon (DLC) coatings: A
review, Surface and Coating Technology, 200 (2005) 2518.
24. C. Corbella, M.Vives, A. Pinyol, E. Bertan, C. Canal, M. C. Polo, J. L. Andujar, Preparation
of Metal (W, Mo, Nb, Ti) containing a-C:H films by reactive magnetron sputtering, Surface
and Coating Technology, 409 (2004) 1777.
25. P. Gupta, V. Singh, E.I. Meletis, Tribological behavior of plasma-enhanced CVD a-C:H films.
Part I: effect of processing parameters, Tribology International, 37 (2004) 1019.
26. P. Gupta, E. I. Meletis, Tribological behavior of plasma-enhanced CVD a-C:H films.
Part II: multilayers, Tribology International, 37 (2004) 1031.
27. J. Robertson, Mechanism of sp3 bond formation in the growth of diamond-like carbon,
Diamond and Related Materials, 14 (2005) 942.
28. J. Robertson, Electronic structure of diamond-like carbon, Diamond and Related Materials,
6 (1997) 212.
29. H. X. Li, T. Xu, J. M. Chen, H. D. Zhou, H.W. Liu, The effect of applied dc bias voltage on
the properties of a-C:H films prepared in a dual dc-rf plasma system, Applied Surface
Science, 227 (2004) 364.
30. J. Robertson, Deposition mechanisms for promoting sp3 bonding in diamond-like carbon,
Diamond and Related Materials, 2 (1993) 984.
31. C. Casiraghi, A.C. Ferrari, Raman spectroscopy of hydrogenated amorphous carbons, J.
Robertson, Physical Review B, 72 (2005) 085401.
32. J. Robertson, Ultrathin carbon coatings for magnetic storage technology, Thin Solid Films,
383 (2001) 81.
61
33. A. Erdemir, C. Donnet, Tribology of diamond-like carbon films: recent progress and future
prospects, Journal of Applied Physics, 39 (2006) 311.
34. C. P Klages and R. Memming, Microstructure and Physical properties of Metal-containing
hydrogenated carbon films, Material Science Forum, 52 (1989) 609.
35. Y. Chang, D. Y. Wang, W. Wu, Catalysis effect of metal doping on wear properties of
diamond like carbon films deposited by a cathodic arc activated deposition process, Thin
Solid Films, 420 (2002) 241.
36. S. Gunjan, Fabrication and characterization of cobalt-diamond-like carbon nanocomposites,
The University of Texas at Arlington, 2007.
37. V. Singh, J. C. Jiang, E.I. Meletis, Cr-Diamondlike carbon nanocomposite films: Synthesis,
Characterization and properties, Thin Solid Films, 489 (2005) 150.
38. N. Ali, Y. Kousar, T. L. Okpalugo, V. Singh, M. Pease, A. A. Ogwu, J. Gracio, E.I. Meletis,
M.J. Jackson, Human micro-vascular endothelial cell seeding on Cr-DLC thin films for
mechanical heart valve applications, Thin Solid Films, 515 (2006) 59.
39. R.J. Narayan, H. Wang, A. Tiwari, Nanostructured DLC-Ag composites for biomedical
applications, Material Research Society Symposium Proceedings, 750 (2003) 205.
40. C. P. Lungu, Nanostructure influence on DLC-Ag tribological coating, Surface and Coating
Technology, 200 (2005) 198.
41. H.S. Zhang, J.L. Endrino, A. Anders, Comparative surface and nano-tribological
characteristics of nanocomposite diamond-like carbon thin films doped by silver, Applied
Surface Science 255 (2008) 2551.
42. C.P. Lungu, I. Mustata, G. Musa, V. Zaroschi, A. M. Lungu, K. Iwasaki, Low friction silver
DLC coatings prepared by thermionic vacuum arc method, Vacuum 76 (2004) 127.
43. R. J. Narayan, Pulsed laser deposition of functionally gradient diamond-like carbon–metal
nanocomposites, Diamond and Related Materials 14 (2005) 1319.
44. X. Yu, M. Hua, C. Wang, Influence of Ag content and nano grain size on microstructure,
62
mechanical and sliding tribological behaviors of Ag-DLC films, Journal of nanoscience and
nanotechnology, 9 (2009) 6366.
45. P. Hazarika, Synthesis, structure and characterization of Ag doped DLC thin films, The
University of Texas at Arlington, 2007.
46. T. A. Friedmann, K. F. McCarty, J. C. Barbour, M.P BartSiegal. D. C. Dibble, Thermal
stability of amorphous carbon films grown by pulsed laser deposition, Applied Physics
Letters, 68 (1996) 1643.
47. D. Nir., Intrinsic stress in diamond-like carbon films and its dependence on deposition
parameters, Thin Solid Films 146 (1987) 27.
48. M. Weiler, S. Sattel, T. Giessen, K. Ehrhardt, Preparation and properties of highly
tetrahedral hydrogenated amorphous carbon, Physics Review B, 53 (1996) 1594.
49. J.P. Sullivan, T.A. Friedmann, A.G. Baca, Stress relaxation and thermal evolution of film
properties in amorphous carbon, Journal of Electronic Materials, 26 (1997) 102
50. P. Koidl, C. Wild, B. Dischler, J. Wagner, M. Ramsteiner, Properties and characterization of
amorphous carbon films, Materials Science Forum, 52 (1989) 41.
51. M. Crischke, K. Bewilogua, K. Trojan. Dimigen, Application-oriented modifications of
deposition processes for diamond-like-carbon-based coatings, Surface and Coatings
Technology, 74 (1995) 739.
52. M.D. Bentzon, K. Mogensen, J.B. Hansen, C. Barholm-Hansen, C. Taholt, P. Holiday, S.S.
Eskildsen, Metallic interlayers between steel and diamond-like carbon, Surface and
Coatings Technology, 68 (1994) 651.
53. J Narayan, RD Vispute, K Jagannadham, interfacial processing and adhesion of diamond,
diamond-like, and tin films on metallic and polymeric substrates, Adhesion Journal of
Science and Technology, 9 (1995) 753.
63
54. K. Yamamoto, K. Wazumi, T. Watanabe, Y. Koga, S. Iijima, Characteristics of nickel-
containing carbon films deposited using electron cyclotron resonance CVD, Diamond and
Related Materials, 11 (2002) 1131.
55. L. Xia, G. Li, The frictional behavior of DLC films against bearing steel balls and Si3N4 balls
in different humid air and vacuum environments, wear 264 (2008) 1077.
56. H. Dimigen, C.P. Klages, Microstructure and wear behavior of metal-containing diamond-
like coatings, Surface and Coatings Technology, 49 (1991) 543.
57. K. Baba, R. Hatada, S. Flege, W. Ensinger, Preparation and Properties of Ag-Containing
Diamond-Like Carbon Films by Magnetron Plasma Source Ion Implantation, advances in
material science and engineering, 2012 (2012).
58. Q. Wei, A.K. Sharma, J. Sankar, J. Narayan, Mechanical Properties of diamond like carbon
composite thin films prepared by pulsed laser deposition, Composites part B: Engineering,
30 (1999) 675.
59. NASA, Better bone implants, 2002. Retrieved from http://science.nasa.gov/science-
news/science-at-nasa/2002/30oct_hipscience/
60. Casiraghia, A.C. Ferrari, R. Ohr, D. Chu, J. Robertson, Surface properties of ultra-thin
tetrahedral amorphous carbon films for magnetic storage technology, Diamond and Related
Materials, 13 (2004) 1416.
61. D.R. McKenzie, S.C.H. Kwok, M.M. Bilek, D.G. McCulloch, P.K. Chu, Soft ferromagnetic
materials based on iron/carbon multilayers, Physica B, 394 (2007) 273.
62. N. Gopinathan, C. Robinson, F. Ryan, Characterization and properties of diamond-like
carbon films for magnetic recording application, Thin Solid Films, 355 (1999) 401.
63. K.M. Krishna, M. Umeno, Y. Nukaya, T. Soga, T. Jimbo, Photovoltaic and spectral
photoresponse characteristics of n-C/p-C solar cell on a p-silicon substrate, Applied Physics
Letters, 77 (2000) 1472.

64
64. S.J. Bull, Tribology of carbon coatings: DLC, diamond and beyond, Diamond and Related
Materials 4 (1995) 827.
65
BIOGRAPHICAL INFORMATION
Venkatesh Majji was born in March 1990, in Srikakulam, India. He received his bachelor
degree in Metallurgical Engineering from Jawaharlal Nehru Technological University,
Hyderabad, India in 2011. His undergraduate research work was involved in the field of
Nanomaterials and Tribology. He has written his bachelor’s thesis on flow behavior of cu-4ti-1cr
alloy. After completing his undergrad studies, his aim was to pursue masters. Then went to
University of Texas at Arlington and started his Masters in August 2011. While he was a
graduate student, his research work mainly focused on thin film coatings in the Surface and
Nano-engineering laboratory. These research projects involve more about CVD and PVD
systems processing and growing thin films, which have numerous applications in automobiles,
optical devices, biomedical implants and etc. He is a candidate for the degree of Master of
Science in Materials Science and Engineering to be awarded in May 2013.