Embed Size (px)
Citation preview
Groihim,ro L,! Ciwwh,m,w Ac!u Vol. 53, pp. 3-8 Copyright 0 1989 Pergamon Press plc. Printed in U.S.A
0016.7037/89/%3.00 t .X3
Synthetic fluid inclusions: IX. Critical PVTX properties of NaCI-Hz0 solutions
C. L. KNIGHT and R. J. BODNAR
Department of Geological Sciences, Virginia Polytechnic Institute & State University, Blacksburg, VA 2406 I, II&A.
(Received August 4, 1988; accepted in Te~ised~r~ October 17, 1988)
Abstract-Critical PVTX properties of NaCl-Hz0 fluids having compositions ofO-30 wt% NaCl have been determined using the synthetic fluid inclusion technique. Critical temperatures and pressures increase from 374. I “C and 220 bars for pure H20, to 820°C and 1574 bars for 30.0 wt% NaCl. Critical specific volumes decrease from 3. I 1 to 1.44 cm3/g over this same salinity range.
Critical temperatures of NaCl-Hz0 fluids over the range O-30 wt% NaCl are described by the equation
7’= 374.1 + 8.800@ + 0.1771+ 0.02113~-‘+ 7.334. lO-4#
where Tis the critical tempemture in degrees Celsius (+4.O”C) and Cp is fluid com~sition in weight percent NaCl. The critical pressure, determined from the intersection of the critical isochore with the critical temperature in P-T space, is expressed as a function of the critical temperature according to the relationship
P = 2094 - 20.56T + 0.06896T2 - 8.903 X IO-‘T3 + 4.214. 10-8T4
where P is the critical pressure in bars (f21 bars) and T is the critical temperature in degrees Celsius. The critical specific volume is given as
SV = 3.106 - 0.59679 - O.O1066’P* + 0.01267@
where SV is the critical specific volume in cm’/g (?O.OZ cm’/g) and YI is related to the salinity as
~=ln(wt%NaCl+l)
The slopes @P/AT) of P-T projections of the critical isochores increase regularly with increasing salinity, from -2.8 bars/Y for pure H20 to -6.8 bars/Y for a 30 wt90 NaCl solution.
INTRODUCTION
THE SYSTEM NaCI-Hz0 may be used to model fluid com- position in a wide variety of geologic en~ronment~ inclu~ng porphyry copper and epithermal precious metals deposits and submarine and terrestrial geothermal systems. Recent studies have documented rather conclusively that boiling or immis- cibility plays an important role in the evolution of these var- ious hydrothermal systems. A better understanding of fluid evolution in these environments, therefore, requires knowl- edge of phase equilibria in NaCl-Hz0 fluids over a range of PTX conditions. One of the more important aspects of phase equilibria that is poorly understood at present is the Iocation of the critical point for NaCl-H20 fluids, particularly those with salinities greater than 15 wt% NaCl. Of equal or greater importance, but even more poorly constrained, are the vol- umetric properties (densities or specific volumes) of NaCI- Hz0 solutions at the critical point, and the P-T projection of the critical isochore.
Important features of the phase behavior of NaCI-HZ0 solutions in P-T space are illustrated on Fig. 1. Shown on this distorted schematic diagram is the large field of immis- cibility in which two fluid phases (liquid + vapor) may coexist. This held is bounded by the NaCl-H20 ice-liquid boundary, which extends from the eutectic point in the NaCl-HZ0 sys- tem (E; Fig. I) to the triple point of pure H20 [T(H,O); Fig. 11, the pure Hz0 liquid-vapor curve, which extends from the triple point of pure H20 [T(H,O); Fig. I] to the critical point of pure Hz0 [C(H~O); Fig. 1 J, the P-7’ projection of the NacI- H20 critical curve, which extends from the pure HZ0 critical point to the pure NaCl critical point [C(NaCl); Fig. 11, the
pure NaCl liquid-vapor curve, which extends from the triple point of pure NaCl [T(NaCl); Fig. l] to the critical point of NaCl, and the liquid + vapor + solid (L + V + S) curve for NaCl-HZO, which extends from the NaCl-H20 eutectic (E; Fig. 1) to the pure NaCl triple point. Between the NaCI-HZ0 eutectic (E; Fig. 1) and the NaCl-HZ0 peritectic (P, Fig. I), the stable solid phase along the L + V + S curve is hydrohalite, NaCl - 2H20. From the peritectic to the triple point of NaCl, the stable solid phase along the L + V + S curve is halite.
The pure Hz0 liquid field is bounded at lower temperatures by the solid-liquid curve [S(HzO)]L(H20); Fig. 11, which originates at the Hz0 triple point and extends to higher pres- sures with a negative slope. Dashed lines labelled [S(E) 1 L(E); Fig. l] and [S(NaCl-H20)]L(NaCl-H*O); Fig. I] represent solid-liquid equilibrium for NaCl-HZ0 solutions of the eu- tectic composition and some intermediate composition be- tween pure Hz0 and the eutectic composition, respectively.
For any given NaCl-HZ0 composition, a smaller field of immiscibility exists within the larger immiscibility field for the entire NaCI-1120 system described above. The limits of immi~ibility for a low to moderate salinity composition (less than approximately 25 wt% NaCl) are shown schematically by the shaded portion of Fig. 1. The liquid-vapor field for this composition [L + V (NaCI-H,O); Fig. I] is bounded by the ice-Iiquid-va~r curve, which extends from the NaCl- Hz0 eutectic (E; Fig. 1) to the freezing temperature (or ice- melting temperature) for the NaCI-HZ0 composition chosen [Tm(ice) (NaCl-HZO); Fig. I], the bubble-point/dew-point curve for the NaCl-HZ0 composition chosen, which extends from the freezing temperature [Tmfice) (NaCl-H,O); Fig. I], through the critical point for that composition [C(NaCl-H20);
3
C. L. Knight and R. J. Bodnar
TEMPERATURE -
RG. 1. Distorted schematic P-T projection of phase equilibria in the NaCl-HZ0 system modified from BODNAR et nf. (1985). Shown are the Hz0 triple point [T(H20)] at O.Ol”C and 0.006 bar, the Hz0 ice-liquid curve [S(H,O) 1 L(H*O)], the Hz0 liquid-vapor curve [L(H*O) / V(H*O)], the Hz0 critical point [C(H20)] at 374.1 “C and 220 bars, the NaCl triple point [T(NaCI)] at 801’C and - 1 bar, the NaCl squid-va~r curve extending Born the triple point to the critical point of NaCl [C{NaCl)] at -3600°C and -258 bars, the NaCl- Hz0 solubility curve (L + V + S) extending from the NaCl triple point to the NaCl-Hz0 eutectic (E) at -20.8”C and 0.001 bar [note: hydrohalite is the stable phase along the solubility curve from the NaCI-Hz0 eutectic to the pet-hectic (P)], the NaCl-Hz0 vapor-halite field (V + NaCl), the liquid-vapor field [L + V (NaCl-H,O), shaded] for an NaCl-Hi0 fluid of low or moderate salinity, and the critical point [C(NaCl-H*O)] for that salinity. See text for description of other symbols.
Fig. l] to its intersection with the L f V + S curve (point A; Fig. I). At low pressures the immiscibility field is bounded by that portion of the L + V + S curve extending from the eutectic point (E; Fig. 1) to its intersection with the dew- point curve (A; Fig. 1). At any P-T point within this immis- cibility field, an NaCl-Hz0 fluid having the bulk composition defining that field will split into a liquid phase having a salinity greater than the bulk salinity and a vapor phase having a salinity less than the bulk salinity.
Note that the critical point [C(NaCl-H,O); Fig. l] for an NaCl-Hz0 fluid is not the terminus of the liquid-va~r loop as it is in a single component system, such as pure H20. Rather, the critical point for a particular NaCI-HZ0 com- position simply represents a unique specific volume (and P- T point) along an otherwise continuous liquid-vapor curve.
In this paper we present new data on the critical properties of NaCl-Hz0 solutions having salinities 530 wt% NaCl. These data were obtained using the synthetic fluid inclusion tech- nique combined with an empirical equation describing PVTX relationships of NaCl-Hz0 solutions. We have extended the range of available data to higher salinities than was previously available, and we provide the first published data on the vol- umetric properties and P-Tprojections ofthe critical isochores for NaCl-HZ0 solutions.
PREVIOUS STUDIES
Critical properties of the NaCl-HZ0 system have been ex- amined by a number of workers using a variety of experi- mental and theoretical approaches. Most of these studies have yielded data over limited ranges in temperature and salinity
(e.g., BISCHOFF and ROSENBAUER, 1984; BI~CHOFF et al., 1986; KHAIBULLIN et al., 1979; MARSHALL and JONES, 1974; OLANDER and LIANDER, 1950; ROSENBAUER and BISCHOFF, 1987; and URUSOVA, 1974). SOURIRAJAN and KENNEDY (1962) conducted one of the more detailed early studies of phase equilibria in the NaCl-HZ0 system, and report critical temperatures and pressures for salinities to 26.4 wt% NaCl. Additionally, BISCHOFF and PITZER (1989) provide a com- prehensive summary of NaCl-HZ0 PTX properties to 500°C. While the data of these reports form a consensus on the P-T coordinates of the NaCl-HZ0 critical curve, there is a marked disagreement in terms of composition corresponding to a given P-T point. Fu~he~ore, owing to ex~~rnen~l difficulties, none of these studies have determined critical properties for compositions in excess of room temperature saturation (26.4 wt% NaCl).
EXPLEMENTAL PROCEDURE Critical properties of NaCl-HZ0 fluids were determined using the
synthetic fluid inclusion technique described by BODNAR and STER- NER (1987). In brief, fluid inclusions are synthesized by healing fmc- tures in natural, inclusion-free quartz in the presence of fluids of known composition at controlled pressures and temperatures. This is accomplished by placing thermally fractured inclusion-free quartz cores into platinum capsules along with dry amorphous silica powder and a few tens of microliters of NaCI-H20 solution. Samples of fluids with NaCl content greater than rim-tem~mture saturation are prepared with additional solid NaCl added to achieve the desired fluid bulk composition by weight. The capsules are sealed, placed in cold seal pressure vessels and taken rapidly to the desired P-T con- ditions, Pressures are read to the nearest 5 bar increment on a factory- calibrated Heise gauge (traceable to NBS) with an estimated accuracy of + 10 bars. Temperatures are measured and controlled to the nearest l.O’C with chromel-alumel thermocouples and are estimated to be accurate within +2.O”C. Run durations are typically three to seven davs at conditions ranaina from 550 to 850°C and 1 to 2 kb.
Upon cooling to ro~rn-tem~rature, runs are depressurized and samples are prepared and examined using a petrographic microscope equipped with a Fluid Inc. adapted USGS-type gas-flow heating/ freezing stage. Samples requiring observation at temperatures greeter than 700°C are examined on a Leitr Model 1350 microscope heating stage. Samples are frozen to verify their salinity, and approximately six to ten homogenization temperatures are measured across each sample. Critical temperatures recorded have an associated accuracy of +0.2”C at the critical point of pure water (374.1 “C), 42.O”C at 573°C and an estimated *5.O”C at 66O”C, based upon prior cali- bration of the heatin~fm~ing stage and observations of the &3 quarts transition.
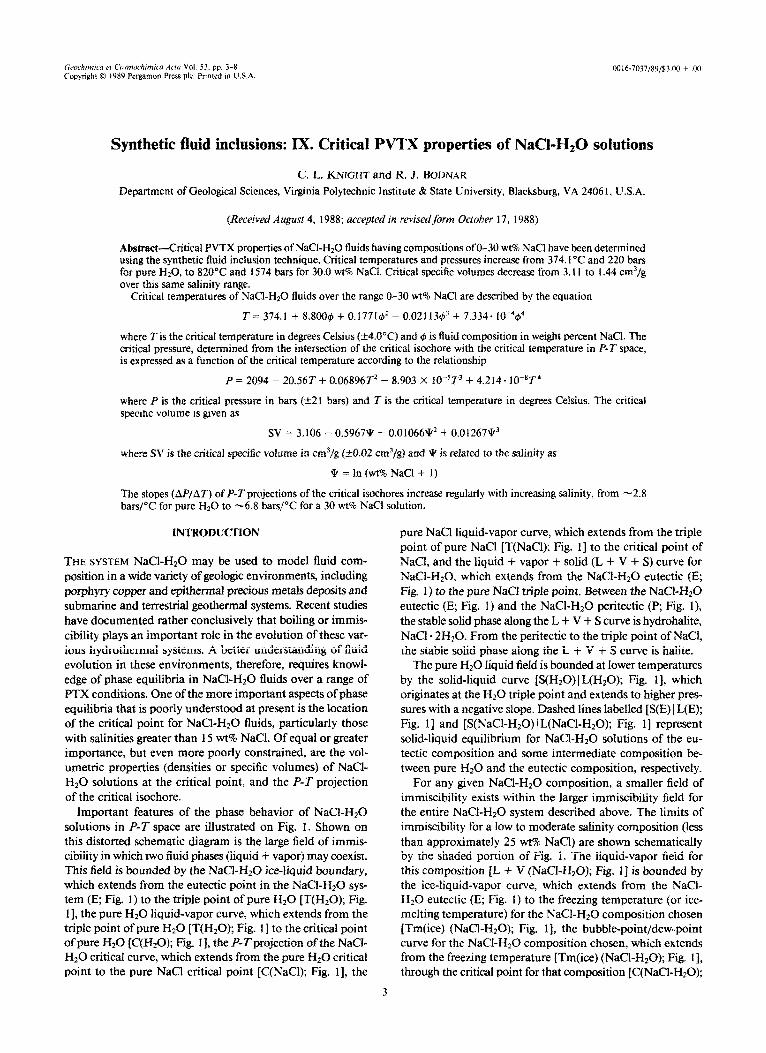
Run conditions were chosen on the basis of known or estimated fluid phase equilibria in P-Tspace for the NaCl-Hz0 system. Figure 2 shows the limits of immiscibility for some low to intermediate salinity in the NaCl-Hz0 system-this field of imm~ibility corre- sponds to the shaded region shown on Fig. 1. Also shown on Fig. 2 are the isochoric P-T paths followed by three fluid inclusions of dif- ferent densities as they are heated from room temperature (R.T.; Fig. 2). Fluid inclusions synthesized along an isochore of less than critical specific volume (as at point 1; Fig. 2) will homogenize to the liquid phase (L + V --, L; Fig. 2) at a subcritical temperature [Th( 1); Fig. 21 defined by the intersection of the isochore with the liquid-vapor curve. Fluids trapped at P-T conditions yielding a specific volume greater than the critical value (as at point 2; Fig. 2) will homogenize by expansion of the vapor phase (L + V + V, Fig 2) at a temperature above the critical temperature fTh(2); Fig. 21, defined by the inter- section of its isochore with the liquid-vapor curve. Fluids of critical specific volume can only be trapped at the critical point (C; Fig. 2) or along the critical isochore (as at point 3, Fig. 2). Fluid inclusions of the critical specific volume will homogenize neither by evapomtion of the liquid phase nor by condensation of the vapor phase. Rather, the density of the vapor will increase towards the critical value as the density of the liquid decreases until each phase occupies an equal volume within the inclusion. This mutual approach ofphysical prop
NaCl-Hz0 critical properties 5
R r. Th(1) Th(3) TW
TEMPERATURE -
2. Distorted schematic phase diagram of the low salinity NaCl- HZ0 composition illustrated in Fig. 1 showing the PTpaths followed by fluid inclusions of three different densities upon heating from room temperature (RT) to their homogenization temperatures [Th( 1), Th(2), Th(3)], and the relationship between homogenization modes (L + V -* L, L + V + V) of NaCl-Hz0 fluid inclusions and trapping conditions relative to the location of the critical isochore (see text for explanation).
erties causes the meniscus separating liquid from vapor to gradually fade and disappear upon homogenization at the critical temperature [Th(3); Fig. 21.
As a result of the long-range nature of the ionic forces between Na’ and Cl- in solution, variations in specific volume in the vicinity c f a critical point are not as large in the NaCl-Hz0 system as in the HZ0 system (BISCHOFF et al., 1986). In other words, the temperature- density projection of the solvus becomes more rounded, or less flat, with increasing salinity as the critical temperature is approached. Thus, there is a much narrower range of density or specific volume over which ~ud~~ti~ behavior may occur For higher salinity compositions as compared to lower salinities (see for example KHAI- BULLIN and BORISOV, 1965, their Fig. la; ROEDDER, 1984, his Figs. 4-5 and discussion on pages 89-90). Still, some gradational behavior in fluid inclusions of near-critical specific volume is expected near the critical isochores. Indeed, inclusions trapped adjacent to but not on a critical isochore will Frequently display near-critical behavior (ROEDDER, 1984), manifest in the “boiling” appearance and fading men&i of inclusions homogenizing at near-critical ~rn~mtu~. Slow heating rates and careful observation of those fluid inclusions exhib- iting pseudocritical behavior reveals the true homogenization mode; menisci of inclusions of less than critical specific volume will fade greatly prior to shrinking while those of inclusions with greater than critical specific volume will fade as they expand.
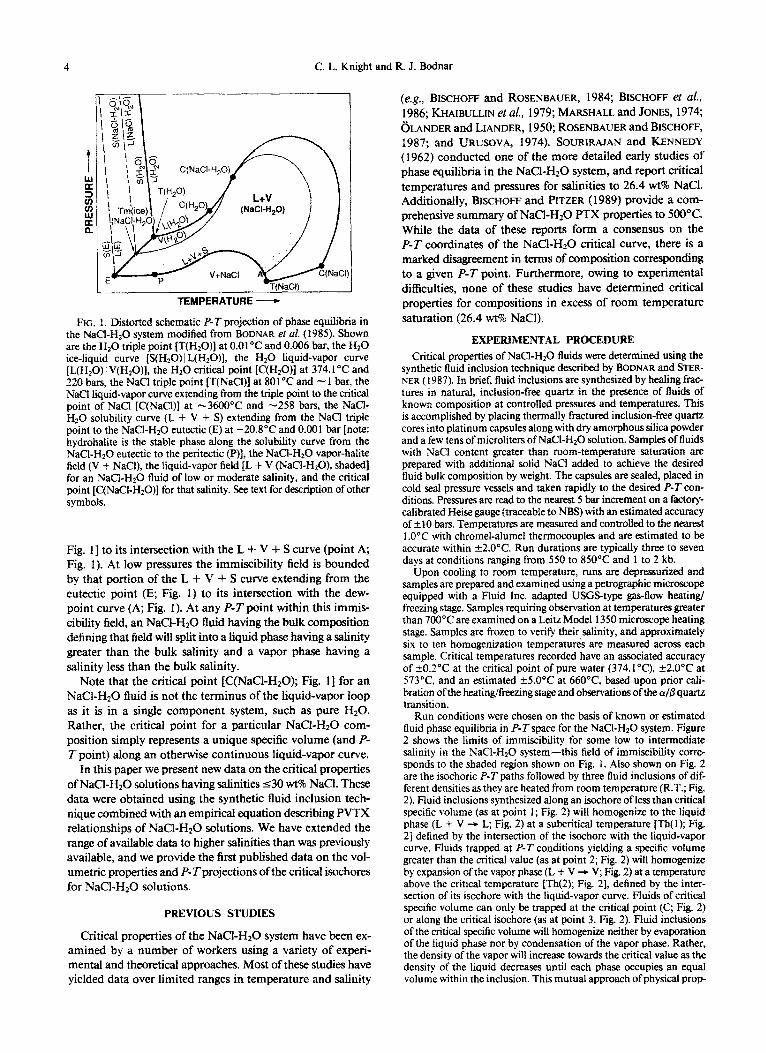
The relationship between specific volume and fluid inclusion be- havior upon heating to the homogenization tem~rature described above was used to define the critical properties of NaCl-Hz0 solutions. Runs are placed along isobaric P-Ttrajectories designed to intercept the critical isochore for the composition studied, as indicated by the dots bracketing the critical &chore on Fig. 3. Initially. P-Ttrajectories for the NaCI-HZ0 system are planned on the basis of critical points reported by SOURIRAJAN and KENNEDY (I 962), with isochores as- sumed to have positive siopes and to be straight lines over relatively short ranges in pressure and temperature. This PVT sampling tech- nique allows us to obtain a rough approximation of the position of the critical isochore. In subsequent runs, homogenization behavior of these synthetic fluid inclusions is used to determine the relative position of the critical isochore. The brackets thus defined are de- creased in each successive run until fluid inclusions displaying critical behavior (i.e., of critical specific volume) are obtained. The entire process is repeated along a second isobaric section in order to confirm the observed critical temperature and to obtain P-T coordinates of two points along each isochore. Once the position of the critical is- ochore has been determined in this manner, the critical pressure (PC;
Fig. 3) is defined as the pressure at the point of intersection of the critical isochore with the critical temperature (Tc; Fig. 3).
RESULTS
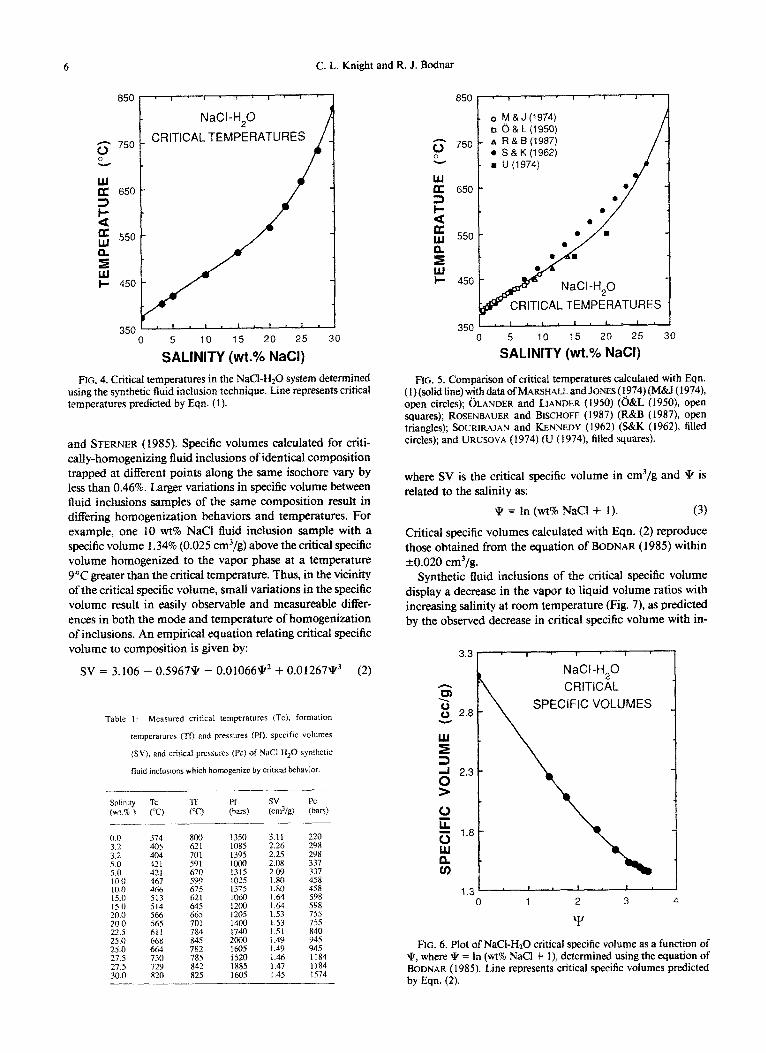
Critical temperatures were determined for NaCl-H,O bulk compositions from 0 to 30 wt% NaCl (Fig. 4). For all salinities except 22.5 and 30 wt% NaCI, inclusions homogenizing by critical behavior were trapped at two different P-T points along the critical isochore. All critical temperatures deter- mined from samples synthesized at two points along each critical isochore were reproduced to within C 1 .O”C, with the exception of the 25 wt% salinity sample, which was repro- ducible to +4.O”C. Only one critical-density sample was ex- amined for fluid compositions of 22.5 and 30.0 wt% NaCl. Formation conditions and measured homogenization tem- peratures of c~ti~i-density NaCI-Hz0 synthetic fluid inclu- sions are listed in Table 1.
Critical temperatures of NaCl-HZ0 solutions determined in this study are described by the empirical equation:
T = 374.1 -t 8.8OOr#~ + 0.1771#
- 0.021 1343 + 7.334. lo-4#4 (I)
where T is the critical temperature in “C and d, is fluid com- position in wt% NaCl. This equation was fitted to experi- mentally determined critical temperatures for NaCl-Hz0 so- lutions of 0 to 30 wt% NaCI, and should not be used to cal- culate critical temperatures for salinities > 30 wt% Nat2 Critical tem~mt~es calculated from Eqn. ( 1) reproduce our measured critical temperatures within i4.0°C and are com- pared with other published critical temperatures in Fig. 5.
Critical specific volumes for all compositions studied (Fig. 6) were calculated using an empirical equation of state de- veloped by BODNAR (1985) which relates molar volumes of NaCl-HZ0 fluids to PTX conditions over the range 100 to 900°C and 1 to 5 kb. Critical specific volumes (Table 1) were determined at the point of sampling along each critical is- ochore, eliminating the need to correct these values for ther- mal expansion of the host quartz, as described by BODNAR
TC
TEMPERATURE -
FIG. 3. Distorted schematic diagram of a particular NaCI-H20 composition illustrating the P-T trajectory sampling technique used to locate the critical isochore, and the graphical definition of the critical pressure (PC) at the intersection of the critical isochore with the critical temperature (Tc). Black dots represent hypothetical sample run conditions.
C. L. Knight and R. J. Bodnar
W 650 -
0 5 10 15 20 25 30 0 5 10 15 20 25 30
SALINITY (wt.% NaCI) SALINITY (wt.% NaCI)
FIG. 4. Critical temperatures in the NaCI-H20 system determined using the synthetic fluid inclusion technique. Line represents critical temperatures predicted by Eqn. (1).
FIG. 5. Comparison of critical temperatures calculated with Eqn. (1) (solid line) with data of MARSHALL and Jo?%s (!974) (M&J (1974), open circles); GLANDER and LIANDER (1950) (O&L (1950), open squares); ROSENBAUER and BISCHOFF (1987) (R&B (1987), open triangles); SOURIRAJAN and KENNEDY (1962) (S&K (1962), filled circles); and URUSOVA (1974) (U (1974), filled squares). and STERNER (198.5). Specific volumes calculated for criti-
clay-homogenizing fluid inclusions of identical composition trapped at different points along the same isochore vary by less than 0.46%. Larger variations in specific volume between fluid inclusions samples of the same composition result in differing homogenization behaviors and tem~mtur~. For example, one 10 wt% NaCl fluid inclusion sample with a specific volume 1.34% (0.025 cm3/g) above the critical specific volume homogenized to the vapor phase at a temperature 9°C greater than the critical temperature. Thus, in the vicinity of the critical specific volume, small variations in the specific volume result in easily observable and measureable differ- ences in both the mode and temperature of homogenization of inclusions. An empirical equation relating critical specific volume to composition is given by:
SV = 3.106 - 0.5967?T! - 0.01066\k2 + 0.01267q3 (2)
Table 1: Measured critical temperatures (Tc), formation
temperatures (TO and pressures (Pfk specific volumes
(SW, and critrcal pressures (PC) of N&-H20 synthetic
fluid inclusions which homogenize by critical behavior.
-.-
Sahnity Tc
(WI.% ) (“C)
_
Tf
(“0
0.0 3.2 3.2 5.0 5.0 IO.0 1O.O 15.0 15.0 20.0 20.0 22.5 25.0 25.0 27.5 27.5 30.0
374 405 404 421 421 467 4hb 513 514 566 565 611
Ez 730 729 820
ROO 621 701 591 670 599 675 621
$2 701 784 845 782 785 842 825
1350 3.11 220 108.5 2.26 298 139s 2.25 298 1000 2.08 337 1315 2.09 337 1025 1.80 458 137.5 1.80 4.58 1060 1.64 598 1200 1.64 598 1205 1.53 755 1400 I .53 755 1740 ISi 840 2ooo 1.49 945 L60.5 1.49 94s 1520 1.46 1184 1885 1.47 1184 1605 1.45 I574
; 650
z
!! 550
E I- 450
ITICAL TEMPERATURES .
where SV is the critical specific volume in cm3/g and 9 is related to the salinity as:
~=ln(~%NaCl+ 1). (3)
Critical specific volumes calculated with Eqn. (2) reproduce those obtained from the equation of BODNAR (1985) within kO.020 cm3/g.
Synthetic kid inclusions of the critical specific volume display a decrease in the vapor to liquid volume ratios with increasing salinity at room temperature (Fig. 7), as predicted by the observed decrease in critical specific volume with in-
SPECIFIC VOLUMES
FIG. 6. Plot of NaCI-Hz0 critical specific volume as a fun&on of 0, where P = In (wtW NaCl + 1), determined using the equation of BODNAR (1985). Line represents critical specific volumes predicted by Eqn. (2).
NaCI-Hz0 critical properties
FQG. 7. N&l-H20 synthetic fluid inclusions of critical specific volume at 20°C: (A) Pure I&O; scale bar = 50 gm. (B) 5.0 wt% NaCl; scale bar = 20 pm. (C) 10.0 wt% NaCI; male bar = 10 pm. (D) 20.0 wt% NaC1; scale bar = 15 pm. (E) 25.0 wt% N&l; scale bar = 20 pm.
creasing salinity shown on Fig. 6. A pure Hz0 fluid inclusion with the critical density (Fig. 7A) contains -69 volume per- cent vapor at room temperature, while an inclusion with a salinity of 25 wt% NaCl and the critical density contains only 44 volume percent vapor at room temperature (Fig. 7E). Thus, a pure Hz0 inclusion with a density only shghtly greater than the critical density might contain 65 volume percent vapor at room temperature and would homogenize to the liquid phase when heated. Similarly, a 25 wt% NaCl inclusion with a density only sligbtly less than the critical density might contain 46 volume percent vapor at room temperature and would homogenize to the vapor phase when heated. Determining ~~o~aphically whether a fluid inclu- sion is “vapor-rich” or “liquid-rich” is not easy, even under the best of conditions, and is particularly difficult if the liquid and vapor phases are present in approximately equal amounts. However, as the discussion above indicates, even if the liquid-to-vapor ratio can be determined petrographi- tally, it is still not possible to predict the mode of homoge- nization without knowledge of the inclusion composition. Thus, descriptions of inclusions as being “liquid-rich” or “vapor-rich”, which usually implies the mode of homoge- nization, must be used cautiously if these petrographic de-
6.0 -
CRITICAL lSOCH&E SLOPES
* ’ - ’ * ‘. I. ’ * 0 5 10 15 20 25 30
SALINITY (wt% NaCI)
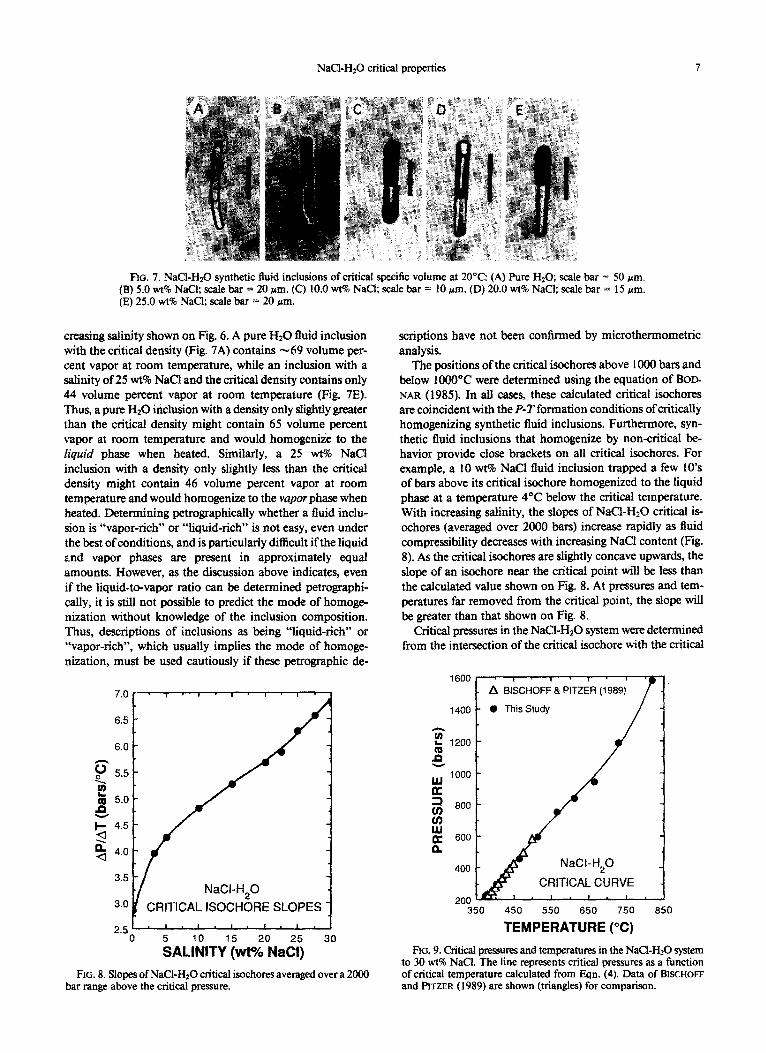
FIG. 8. Slopes of NaCl-Hz0 critical isochores averaged over a 2000 bar range above tbe critical pressure.
scriptions have not been confirmed by micro~e~om~c analysis.
The positions of the critical isochores above 1000 bars and below 1000°C were determined using the equation of BOD- NAR (1985). In all cases, these calculated critical isochores are coincident with the P-Tformation conditions ofcritically homogenizing synthetic fluid inclusions. Furthermore, syn- thetic fluid inclusions that homogenize by non-critical be- havior provide close brackets on all critical &chores. For example, a 10 wt% NaCl fluid inclusion trapped a few lo’s of bars above its critical isochore homogenized to the liquid phase at a temperature 4°C below the critical temperature. With increasing salinity, the slopes of NaCl-Hz0 critical is- ochores (averaged over 2000 bars) increase rapidly as fluid compressibility decreases with increasing NaCl content (Fig. 8). As the critical isochores are slightly concave upwards, the slope of an isochore near the critical point will be less than the calculated value shown on Fig. 8. At pressures and tem- peratures far removed from the critical point, the slope will be greater than that shown on Fig. 8.
Critical pressures in the NaCl-HZ0 system were determined from the intersection of the critical isochore with the critical
1600 * I . I ’ I - I - A BISCHOFF & PITZER (1989)
1400 l ThisStudy
CRITICAL CURVE
350 450 550 650 750 850
TEMPERATURE (“C)
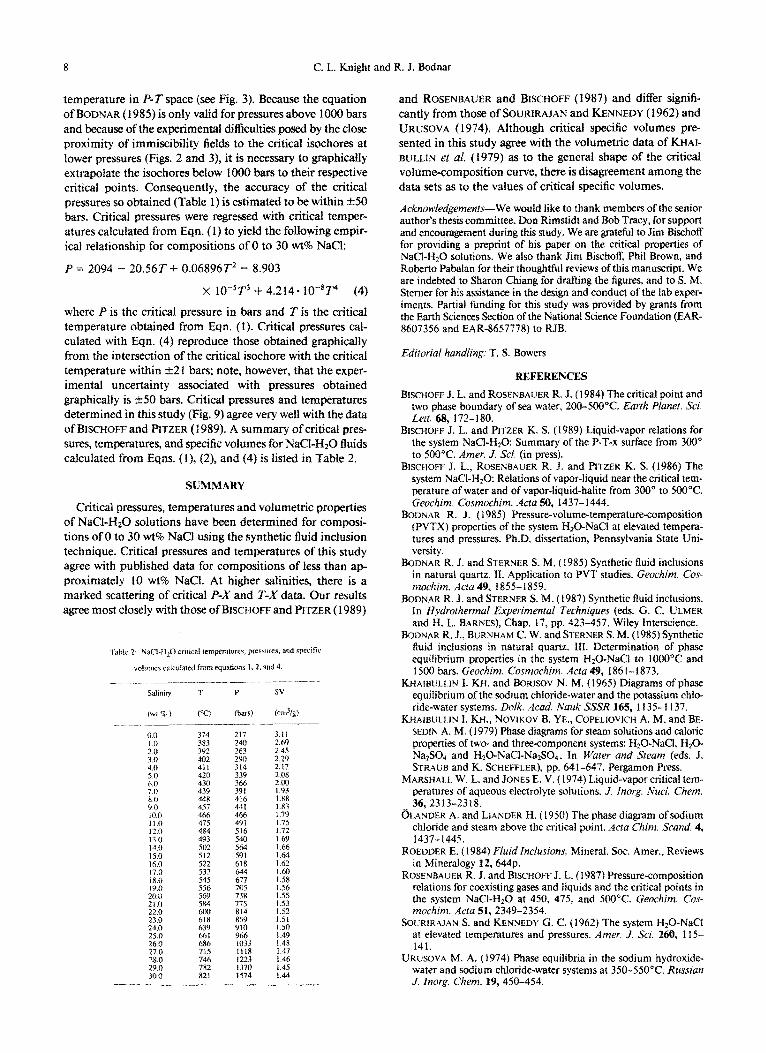
BIG. 9. Critical pressures and temperatures in the NaCI-Hz0 system to 30 wt% NaCI. The line represents critical pressures as a function of critical temperature calculated from Eqn. (4). Data of BISCHOFF and PITZER (1989) are shown (triangles) for comparison.
8 C. L. Knight and R. J. Bodnar
temperature in P-T space (see Fig. 3). Because the equation of BODNAR (1985) is only valid for pressures above 1000 bars and because of the experimental difficulties nosed by the close proximity of immiscibility fields to the critical isochores at lower pressures (Figs. 2 and 3f, it is necessary to ~phi~lly extrapolate the isochores below 1000 bars to their respective critical points. Consequently, the accuracy of the critical pressures so obtained (Table 1) is estimated to be within +50 bars. Critical pressures were regressed with critical temper- atures calculated from Eqn. (1) to yield the following empir- ical relationship for compositions of 0 to 30 wt% NaCI:
P = 2094 - 20.56T + 0.06896T2 - 8.903
x 10+T3 + 4.214. IO-*p (4)
where P is the critical pressure in bars and T is the critical temperature obtained from Eqn. (If. Critical pressures cal- culated with Eqn. (4) reproduce those obtained ~phi~~ly from the intersection of the critical isochore with the critical temperature within rt2 1 bars; note, however, that the exper- imental uncertainty associated with pressures obtained graphically is iSO bars. Critical pressures and tern~mtu~s determined in this study (Fig. 9) agree very well with the data of BIsCHoFF and PITZER ( 1989). A summary of critical pres- sures, temperatures, and specific volumes for NaCl-H20 fluids calculated from Eqns. (l), (2), and (4) is iisted in Table 2.
SUMMARY
Critical pressures, temperatures and volumetric properties of NaCLH20 solutions have been determined for composi- tions of 0 to 30 wt% NaCl using the synthetic fluid inclusion technique. Critical pressures and temperatures of this study agree with published data for compositions of less than ap proximately 10 wt% NaCI. At higher sahnities, there is a marked scattering of critical P-X and T-X data. Our results agree most closely with those of BISCHOFFand PITZER (1989)
0.0 374 10 383 2.0 392 3.0 402 4.0 411 5.0 420 6.0 430 7.0 439 8 0 448 90 457 10.0 466 11 0 475 12.0 484 13.0 493 14.0 502 15.0 512 16.0 522 17.0 532 180 545 19.0 5.56 20.0 569 21.0 584 22.0 23.0 E 24.0 639 25.0 661 26.0 686 27.0 715 28.0 746 29.0 782 30.0 x21
P
(bars) --
217 240 263 290 314 339 366 391 416 441 466 491 516 540 564
ii9 910 966 1033 1118 1223 1370 1574
3.11 2.69 245 2.29 2.17 2.08 2.00 1.93 I.88 1.83 1.79 175 1.72 1.69 1.66 1.64 162 1.60 1.58 1.56 1.55 1.53 1.52 1.51 1.50 1.49 148 1.47 1.46 1.45 1.44
and ROSENBAUER and BISCHOFF (1987) and differ signifi- cantly from those of SOURIRAJAN and KENNEDY (1962) and URUSOVA (1974). Although critical specific volumes pre- sented in this study agree with the volumetric data of h&AI- BULLIN d al. (1979) as to the general shape of the critical volume~omposition curve, there is disagreement among the data sets as to the values of critical specific volumes.
Acknow~edgemenfs-We would like to thank members of the senior author’s thesis committee, Don Rimstidt and Bob Tracy. for support and encoumgement during this study. We are gratefid to Jim Bischoff for providing a preprint of his paper on the critical properties of NaCt-H20 solutions. We also thank Jim Bischoff, Phil Brown, and Roberto Pabalan for their thoughtful reviews of this manuscript. We are indebted to Sharon Chiang for drafting the figures, and to S. M. Sterner for his assistance in the design and conduct of the lab exper- iments. Partial funding for this study was provided by grants from the Earth Sciences Section of the National Science Foundation (EAR- 8607356 and EAR-8657778) to RJB.
Editorial handling: T. S. Bowers
REFERENCES
BISCHOFF J. L. and ROSENBAUER R. J. (1984) The critical point and two ohase boundarv of sea water, ZOO-500°C. E&I P/anef. Sci. Ldt.‘ 68, 172- 180. _
BISCHOFF J. L. and PITZER K. S, (1989) Liquid-vapor relations for the svstem NaCI-H& Summarv of the P-T-x surface from 300” to S&C. Amer. J.Sci. (in press).
BISCHOFF J. L., ROSENBAUER R. J. and P~TZER K. S. (1986) The system NaCl-H20: Relations of vapor-liquid near the critical tem- perature of water and of vapor-liquid-halite from 300” to 500°C. Geochim. Cosmochim. Acta 50, 1437- 1444.
BODNAR R. J. (1985) P~ssure-volume-tem~mtu~m~sition (PVTX) properties of the system HzO-NaCI at elevated tempera- tures and pressures. Ph.D. dissertation, Pennsylvania State Uni- versity.
BO~NAR R. J. and STERNER S. M. (1985) Synthetic Buid inclusions in natural quartz. II. Application to PVT studies. Geochim. Cos- moc~im. Acta 49, 1855-1859.
BODNAR R. J. and STERNER S. M. (1987) Synthetic fluid inclusions. In hydrothermal Experimental Techniques (eds. G. C. ULMER and H. L. BARNES), Chap. 17, pp. 423-457. Wiley Interscience.
BODNAR R. J., BURNHAM C. W. and STERNER S. M. (1985) Synthetic fluid inclusions in natural quartz. III. ~te~ination of phase equiIib~um properties in the system H,O-NaCl to 1000°C and 1500 bars. Geochim. Casmochim. Acza 49, 186 1 - 1873.
KHAI~ULLIN I. IQ-t. and BORJSOV N. M, (1965) Diagrams of phase ~uilib~um of the sodium chloride-water and the potassium chlo- ride-water systems. I>&. Acad. Nuuk SSSR 165, 1135-l 137.
~AIBULLIN 1. KH., NOVIKOV B. YE., COPEL~OVICIJ A. M. and BE- SEDIN A. M. (I 979) Phase diagrams for steam solutions and caIoric properties of two- and three-component systems: H20-NaCI, H@- Na2S04 and H@-NaCI-Na#O,. In Water and Steam (eds. J. STRA~~B and K. SCHEFFLER), pp. 641-647. Pergamon Press.
MARSHALL W. L. and JONES E. V. (1974) Liquid-vapor critical tem- peratures of aqueous electrolyte solutions. f. Inorg. Ntcci. Chem. 36,23 13-23 18.
SLANDER A. and LIANDER H. (1950) The phase diagram of sodium chloride and steam above the critical point. Acta C&m. S&and. 4, 1437-1445.
ROEDDER E. (1984) Fluid Inclusions, Minerai. Sot. Amer., Reviews in MineraIogy 12,644~.
ROSENBAUER R. J. and BISCHOFF J. L. (1987) Pressure-composition relations for coexisting gases and liquids and the critical points in the system NaCI-HZ0 at 450, 475, and 500°C. Geochim. Cos- mochim. Acta 51,2349-2X4.
SOURIRAJAN S. and KENNEDY G. C. (1962) The system H20-NaQ at elevated temperatures and pressures. Amer. J. Sci. 260, I15- 141.
URUS~VA M. A. (1974) Phase equilibria in the sodium hydroxide- water and sodium chloride-water systems at 350-550°C. Russian J. Inorg. Chem. 19,450-454.