Embed Size (px)
Citation preview
Leckie, R.M., Sigurdsson, H., Acton, G.D., and Draper, G. (Eds.), 2000Proceedings of the Ocean Drilling Program, Scientific Results, Vol. 165
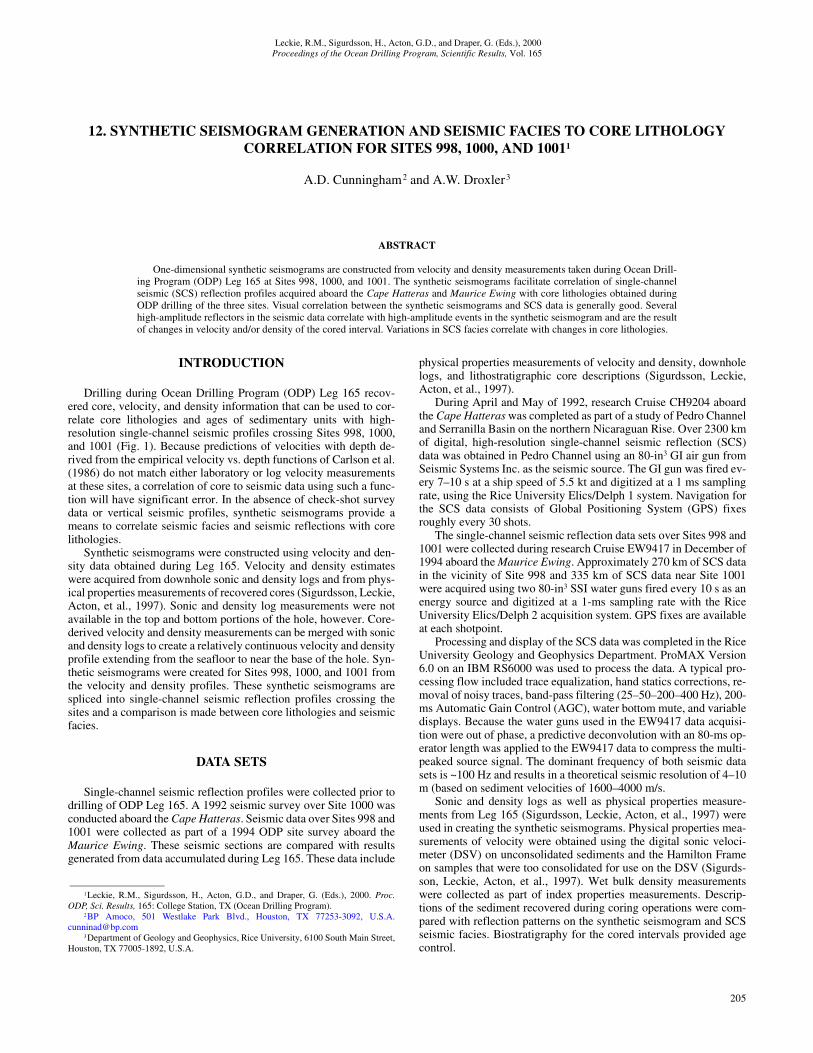
12. SYNTHETIC SEISMOGRAM GENERATION AND SEISMIC FACIES TO CORE LITHOLOGY CORRELATION FOR SITES 998, 1000, AND 10011
A.D. Cunningham2 and A.W. Droxler3
ABSTRACT
One-dimensional synthetic seismograms are constructed from velocity and density measurements taken during Ocean Drill-ing Program (ODP) Leg 165 at Sites 998, 1000, and 1001. The synthetic seismograms facilitate correlation of single-channelseismic (SCS) reflection profiles acquired aboard the Cape Hatteras and Maurice Ewing with core lithologies obtained duringODP drilling of the three sites. Visual correlation between the synthetic seismograms and SCS data is generally good. Severalhigh-amplitude reflectors in the seismic data correlate with high-amplitude events in the synthetic seismogram and are the resultof changes in velocity and/or density of the cored interval. Variations in SCS facies correlate with changes in core lithologies.
INTRODUCTION
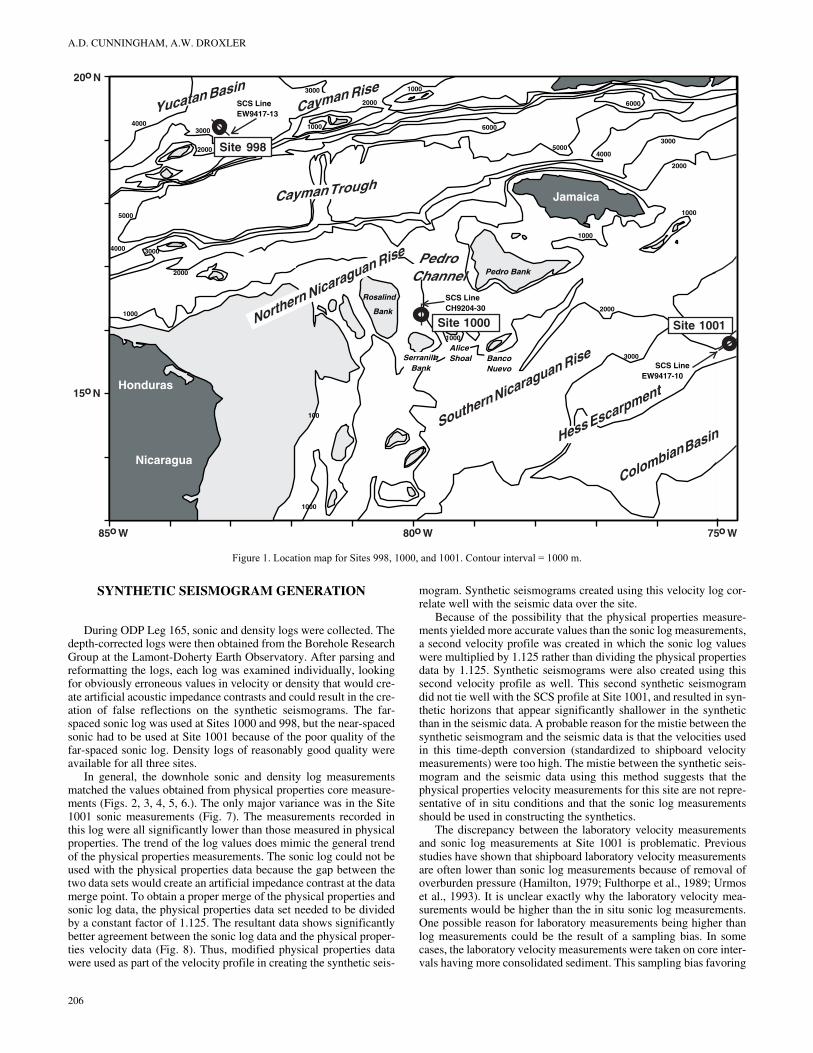
Drilling during Ocean Drilling Program (ODP) Leg 165 recov-ered core, velocity, and density information that can be used to cor-relate core lithologies and ages of sedimentary units with high-resolution single-channel seismic profiles crossing Sites 998, 1000,and 1001 (Fig. 1). Because predictions of velocities with depth de-rived from the empirical velocity vs. depth functions of Carlson et al.(1986) do not match either laboratory or log velocity measurementsat these sites, a correlation of core to seismic data using such a func-tion will have significant error. In the absence of check-shot surveydata or vertical seismic profiles, synthetic seismograms provide ameans to correlate seismic facies and seismic reflections with corelithologies.
Synthetic seismograms were constructed using velocity and den-sity data obtained during Leg 165. Velocity and density estimateswere acquired from downhole sonic and density logs and from phys-ical properties measurements of recovered cores (Sigurdsson, Leckie,Acton, et al., 1997). Sonic and density log measurements were notavailable in the top and bottom portions of the hole, however. Core-derived velocity and density measurements can be merged with sonicand density logs to create a relatively continuous velocity and densityprofile extending from the seafloor to near the base of the hole. Syn-thetic seismograms were created for Sites 998, 1000, and 1001 fromthe velocity and density profiles. These synthetic seismograms arespliced into single-channel seismic reflection profiles crossing thesites and a comparison is made between core lithologies and seismicfacies.
DATA SETS
Single-channel seismic reflection profiles were collected prior todrilling of ODP Leg 165. A 1992 seismic survey over Site 1000 wasconducted aboard the Cape Hatteras. Seismic data over Sites 998 and1001 were collected as part of a 1994 ODP site survey aboard theMaurice Ewing. These seismic sections are compared with resultsgenerated from data accumulated during Leg 165. These data include
1Leckie, R.M., Sigurdsson, H., Acton, G.D., and Draper, G. (Eds.), 2000. Proc.ODP, Sci. Results, 165: College Station, TX (Ocean Drilling Program).
2BP Amoco, 501 Westlake Park Blvd., Houston, TX 77253-3092, [email protected]
3Department of Geology and Geophysics, Rice University, 6100 South Main Street,Houston, TX 77005-1892, U.S.A.
physical properties measurements of velocity and density, downholelogs, and lithostratigraphic core descriptions (Sigurdsson, Leckie,Acton, et al., 1997).
During April and May of 1992, research Cruise CH9204 aboardthe Cape Hatteras was completed as part of a study of Pedro Channeland Serranilla Basin on the northern Nicaraguan Rise. Over 2300 kmof digital, high-resolution single-channel seismic reflection (SCS)data was obtained in Pedro Channel using an 80-in3 GI air gun fromSeismic Systems Inc. as the seismic source. The GI gun was fired ev-ery 7–10 s at a ship speed of 5.5 kt and digitized at a 1 ms samplingrate, using the Rice University Elics/Delph 1 system. Navigation forthe SCS data consists of Global Positioning System (GPS) fixesroughly every 30 shots.
The single-channel seismic reflection data sets over Sites 998 and1001 were collected during research Cruise EW9417 in December of1994 aboard the Maurice Ewing. Approximately 270 km of SCS datain the vicinity of Site 998 and 335 km of SCS data near Site 1001were acquired using two 80-in3 SSI water guns fired every 10 s as anenergy source and digitized at a 1-ms sampling rate with the RiceUniversity Elics/Delph 2 acquisition system. GPS fixes are availableat each shotpoint.
Processing and display of the SCS data was completed in the RiceUniversity Geology and Geophysics Department. ProMAX Version6.0 on an IBM RS6000 was used to process the data. A typical pro-cessing flow included trace equalization, hand statics corrections, re-moval of noisy traces, band-pass filtering (25–50–200–400 Hz), 200-ms Automatic Gain Control (AGC), water bottom mute, and variabledisplays. Because the water guns used in the EW9417 data acquisi-tion were out of phase, a predictive deconvolution with an 80-ms op-erator length was applied to the EW9417 data to compress the multi-peaked source signal. The dominant frequency of both seismic datasets is ~100 Hz and results in a theoretical seismic resolution of 4–10m (based on sediment velocities of 1600–4000 m/s.
Sonic and density logs as well as physical properties measure-ments from Leg 165 (Sigurdsson, Leckie, Acton, et al., 1997) wereused in creating the synthetic seismograms. Physical properties mea-surements of velocity were obtained using the digital sonic veloci-meter (DSV) on unconsolidated sediments and the Hamilton Frameon samples that were too consolidated for use on the DSV (Sigurds-son, Leckie, Acton, et al., 1997). Wet bulk density measurementswere collected as part of index properties measurements. Descrip-tions of the sediment recovered during coring operations were com-pared with reflection patterns on the synthetic seismogram and SCSseismic facies. Biostratigraphy for the cored intervals provided agecontrol.
205
A.D. CUNNINGHAM, A.W. DROXLER
Pedro Bank
Rosalind
Bank
Jamaica
Nicaragua
Honduras
100
1000
1000
1000
1000
1000
1000
2000
30004000
5000
2000
30004000
2000
3000
6000
6000
50004000
3000
2000
1000
3000
2000
Alice ShoalSerranilla
BankBancoNuevo
20o N
15o N
75o W80o W85o W
Northern Nicaraguan Rise
Southern Nicaraguan Rise
Site 998
Site 1001Site 1000
Colombian BasinHess Escarpment
Cayman Trough
Cayman RiseYucatan Basin
PedroChannel
SCS LineEW9417-13
SCS LineCH9204-30
SCS LineEW9417-10
Figure 1. Location map for Sites 998, 1000, and 1001. Contour interval = 1000 m.
SYNTHETIC SEISMOGRAM GENERATION
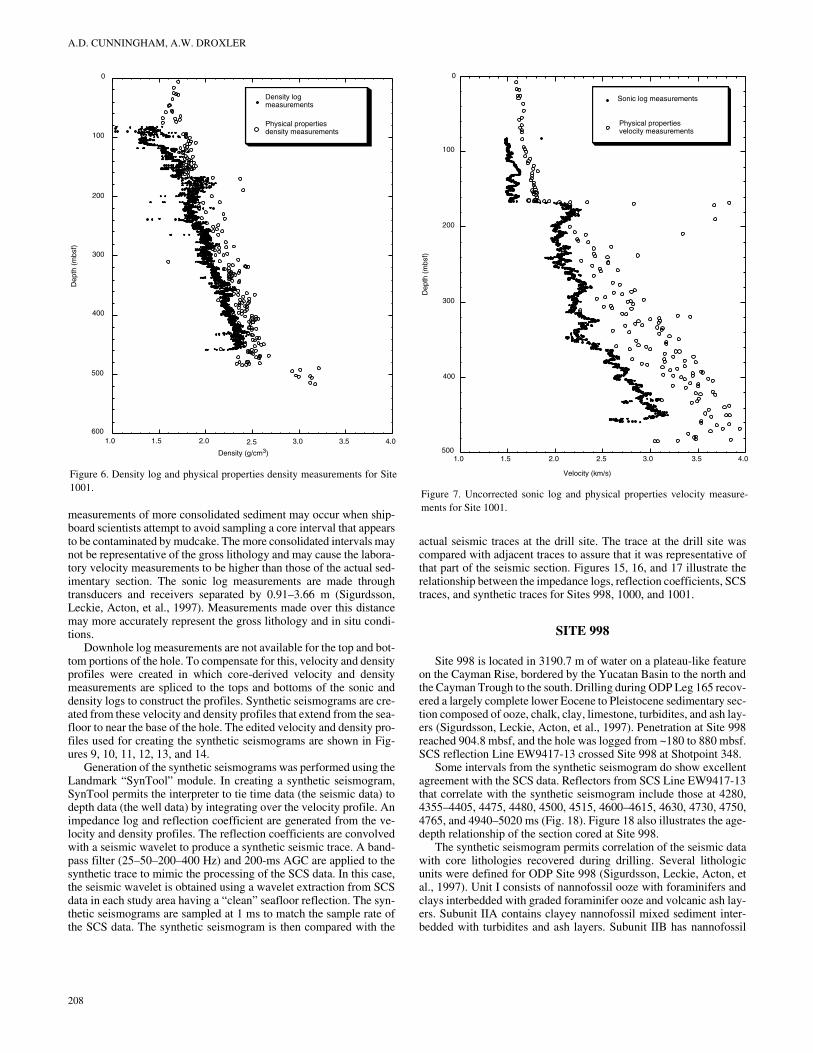
During ODP Leg 165, sonic and density logs were collected. Thedepth-corrected logs were then obtained from the Borehole ResearchGroup at the Lamont-Doherty Earth Observatory. After parsing andreformatting the logs, each log was examined individually, lookingfor obviously erroneous values in velocity or density that would cre-ate artificial acoustic impedance contrasts and could result in the cre-ation of false reflections on the synthetic seismograms. The far-spaced sonic log was used at Sites 1000 and 998, but the near-spacedsonic had to be used at Site 1001 because of the poor quality of thefar-spaced sonic log. Density logs of reasonably good quality wereavailable for all three sites.
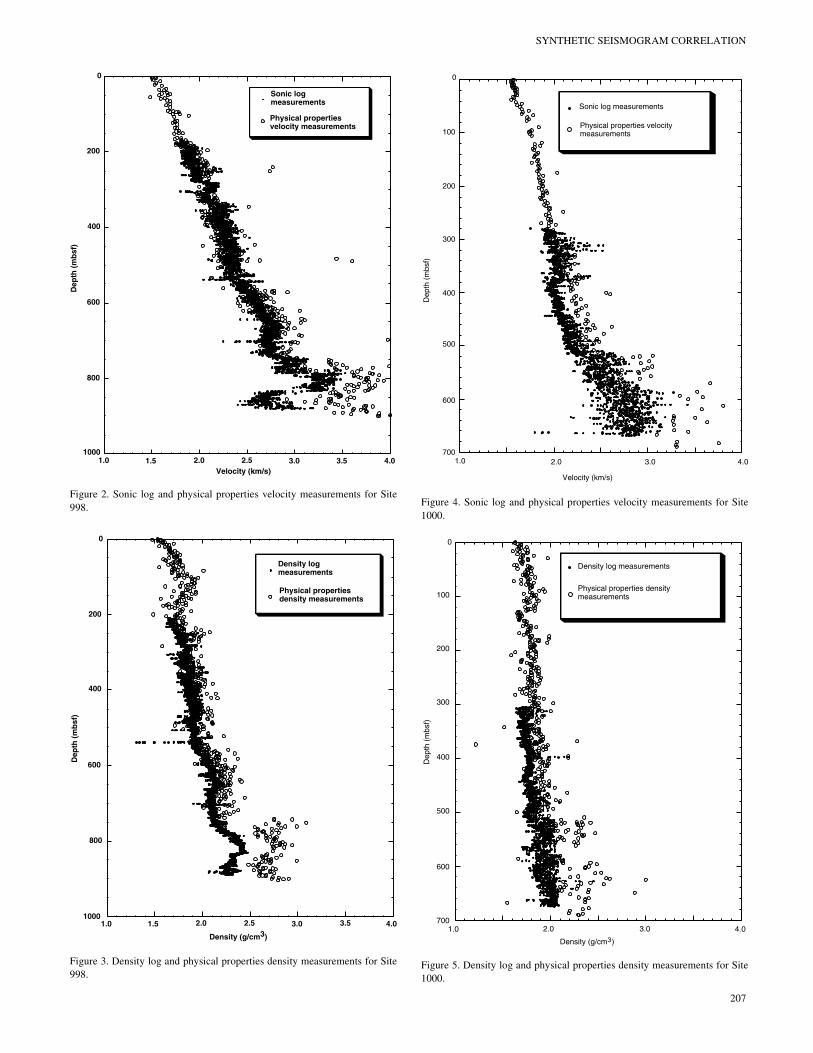
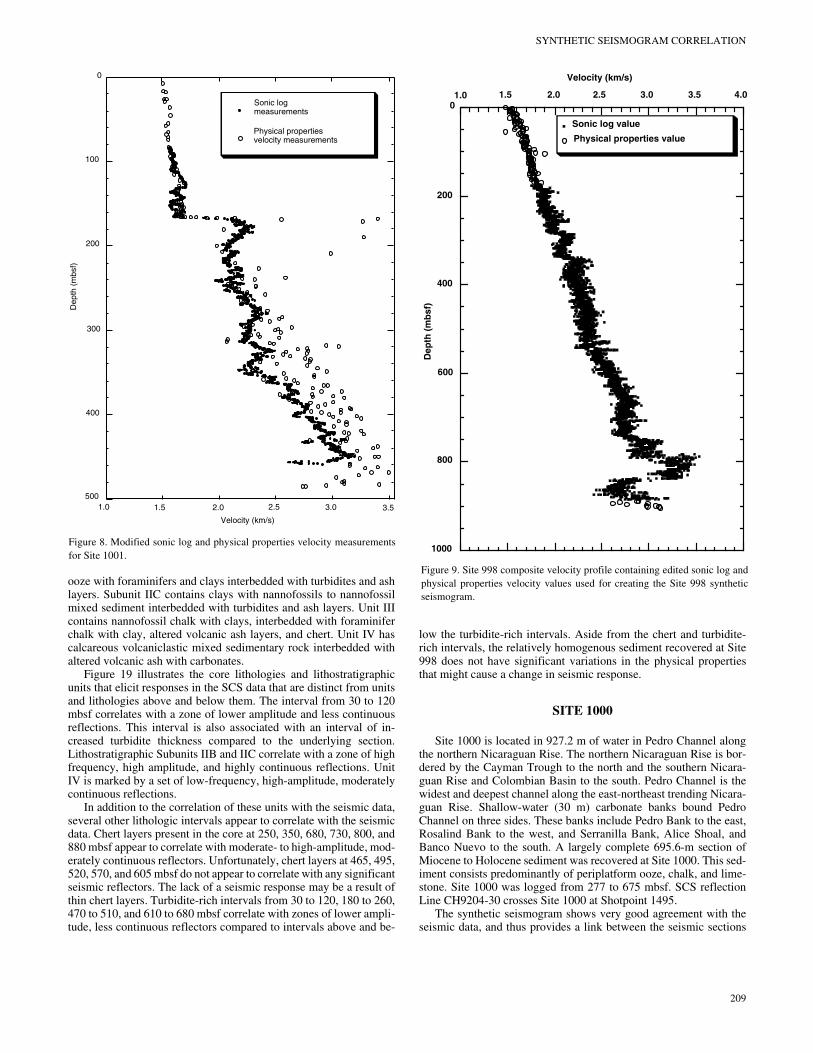
In general, the downhole sonic and density log measurementsmatched the values obtained from physical properties core measure-ments (Figs. 2, 3, 4, 5, 6.). The only major variance was in the Site1001 sonic measurements (Fig. 7). The measurements recorded inthis log were all significantly lower than those measured in physicalproperties. The trend of the log values does mimic the general trendof the physical properties measurements. The sonic log could not beused with the physical properties data because the gap between thetwo data sets would create an artificial impedance contrast at the datamerge point. To obtain a proper merge of the physical properties andsonic log data, the physical properties data set needed to be dividedby a constant factor of 1.125. The resultant data shows significantlybetter agreement between the sonic log data and the physical proper-ties velocity data (Fig. 8). Thus, modified physical properties datawere used as part of the velocity profile in creating the synthetic seis-
206
mogram. Synthetic seismograms created using this velocity log cor-relate well with the seismic data over the site.
Because of the possibility that the physical properties measure-ments yielded more accurate values than the sonic log measurements,a second velocity profile was created in which the sonic log valueswere multiplied by 1.125 rather than dividing the physical propertiesdata by 1.125. Synthetic seismograms were also created using thissecond velocity profile as well. This second synthetic seismogramdid not tie well with the SCS profile at Site 1001, and resulted in syn-thetic horizons that appear significantly shallower in the syntheticthan in the seismic data. A probable reason for the mistie between thesynthetic seismogram and the seismic data is that the velocities usedin this time-depth conversion (standardized to shipboard velocitymeasurements) were too high. The mistie between the synthetic seis-mogram and the seismic data using this method suggests that thephysical properties velocity measurements for this site are not repre-sentative of in situ conditions and that the sonic log measurementsshould be used in constructing the synthetics.
The discrepancy between the laboratory velocity measurementsand sonic log measurements at Site 1001 is problematic. Previousstudies have shown that shipboard laboratory velocity measurementsare often lower than sonic log measurements because of removal ofoverburden pressure (Hamilton, 1979; Fulthorpe et al., 1989; Urmoset al., 1993). It is unclear exactly why the laboratory velocity mea-surements would be higher than the in situ sonic log measurements.One possible reason for laboratory measurements being higher thanlog measurements could be the result of a sampling bias. In somecases, the laboratory velocity measurements were taken on core inter-vals having more consolidated sediment. This sampling bias favoring
SYNTHETIC SEISMOGRAM CORRELATION
Sonic logmeasurements
Physical propertiesvelocity measurements
0
200
400
600
800
10001.0 1.5 2.0 2.5 3.0 3.5 4.0
Velocity (km/s)
Dep
th (
mb
sf)
Figure 2. Sonic log and physical properties velocity measurements for Site998.
Density logmeasurements
Physical propertiesdensity measurements
1.0 1.5 2.0 2.5 3.0 3.5 4.01000
800
600
400
200
0
Dep
th (
mb
sf)
Density (g/cm3)
Figure 3. Density log and physical properties density measurements for Site998.
1.0 2.0 3.0 4.0
0
100
200
300
400
500
600
700
Sonic log measurements
Physical properties velocitymeasurements
Velocity (km/s)
Dep
th (
mbs
f)
Figure 4. Sonic log and physical properties velocity measurements for Site1000.
1.0 2.0 3.0 4.0
0
100
200
300
400
500
600
700
Density log measurements
Physical properties densitymeasurements
Density (g/cm )
Dep
th (
mbs
f)
3
Figure 5. Density log and physical properties density measurements for Site1000.
207
A.D. CUNNINGHAM, A.W. DROXLER
measurements of more consolidated sediment may occur when ship-board scientists attempt to avoid sampling a core interval that appearsto be contaminated by mudcake. The more consolidated intervals maynot be representative of the gross lithology and may cause the labora-tory velocity measurements to be higher than those of the actual sed-imentary section. The sonic log measurements are made throughtransducers and receivers separated by 0.91–3.66 m (Sigurdsson,Leckie, Acton, et al., 1997). Measurements made over this distancemay more accurately represent the gross lithology and in situ condi-tions.
Downhole log measurements are not available for the top and bot-tom portions of the hole. To compensate for this, velocity and densityprofiles were created in which core-derived velocity and densitymeasurements are spliced to the tops and bottoms of the sonic anddensity logs to construct the profiles. Synthetic seismograms are cre-ated from these velocity and density profiles that extend from the sea-floor to near the base of the hole. The edited velocity and density pro-files used for creating the synthetic seismograms are shown in Fig-ures 9, 10, 11, 12, 13, and 14.
Generation of the synthetic seismograms was performed using theLandmark “SynTool” module. In creating a synthetic seismogram,SynTool permits the interpreter to tie time data (the seismic data) todepth data (the well data) by integrating over the velocity profile. Animpedance log and reflection coefficient are generated from the ve-locity and density profiles. The reflection coefficients are convolvedwith a seismic wavelet to produce a synthetic seismic trace. A band-pass filter (25–50–200–400 Hz) and 200-ms AGC are applied to thesynthetic trace to mimic the processing of the SCS data. In this case,the seismic wavelet is obtained using a wavelet extraction from SCSdata in each study area having a “clean” seafloor reflection. The syn-thetic seismograms are sampled at 1 ms to match the sample rate ofthe SCS data. The synthetic seismogram is then compared with the
0
100
200
300
400
500
6001.0 1.5 2.0 2.5 3.0 3.5 4.0
Density logmeasurements
Physical propertiesdensity measurements
Dep
th (
mbs
f)
Density (g/cm3)
Figure 6. Density log and physical properties density measurements for Site1001.
208
actual seismic traces at the drill site. The trace at the drill site wascompared with adjacent traces to assure that it was representative ofthat part of the seismic section. Figures 15, 16, and 17 illustrate therelationship between the impedance logs, reflection coefficients, SCStraces, and synthetic traces for Sites 998, 1000, and 1001.
SITE 998
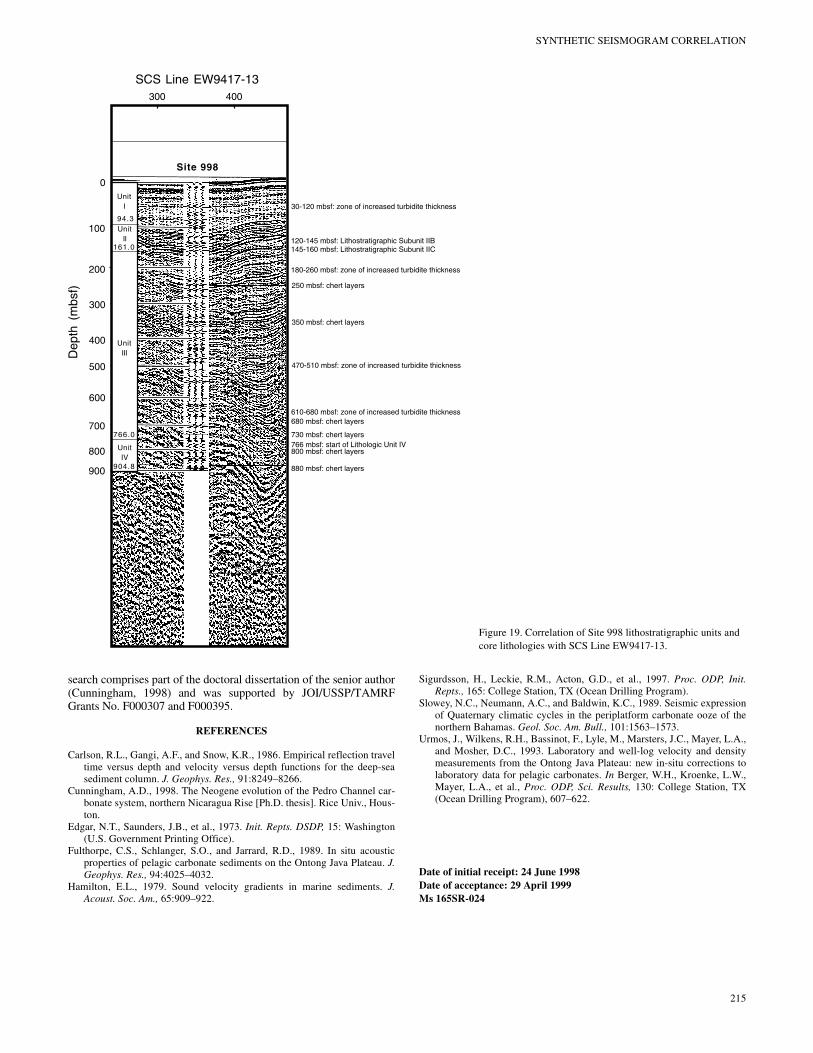
Site 998 is located in 3190.7 m of water on a plateau-like featureon the Cayman Rise, bordered by the Yucatan Basin to the north andthe Cayman Trough to the south. Drilling during ODP Leg 165 recov-ered a largely complete lower Eocene to Pleistocene sedimentary sec-tion composed of ooze, chalk, clay, limestone, turbidites, and ash lay-ers (Sigurdsson, Leckie, Acton, et al., 1997). Penetration at Site 998reached 904.8 mbsf, and the hole was logged from ~180 to 880 mbsf.SCS reflection Line EW9417-13 crossed Site 998 at Shotpoint 348.
Some intervals from the synthetic seismogram do show excellentagreement with the SCS data. Reflectors from SCS Line EW9417-13that correlate with the synthetic seismogram include those at 4280,4355–4405, 4475, 4480, 4500, 4515, 4600–4615, 4630, 4730, 4750,4765, and 4940–5020 ms (Fig. 18). Figure 18 also illustrates the age-depth relationship of the section cored at Site 998.
The synthetic seismogram permits correlation of the seismic datawith core lithologies recovered during drilling. Several lithologicunits were defined for ODP Site 998 (Sigurdsson, Leckie, Acton, etal., 1997). Unit I consists of nannofossil ooze with foraminifers andclays interbedded with graded foraminifer ooze and volcanic ash lay-ers. Subunit IIA contains clayey nannofossil mixed sediment inter-bedded with turbidites and ash layers. Subunit IIB has nannofossil
Sonic log measurements
Physical propertiesvelocity measurements
0
100
200
300
400
5001.0 1.5 2.0 2.5 3.0 3.5 4.0
Dep
th (
mbs
f)
Velocity (km/s)
Figure 7. Uncorrected sonic log and physical properties velocity measure-ments for Site 1001.
SYNTHETIC SEISMOGRAM CORRELATION
ooze with foraminifers and clays interbedded with turbidites and ashlayers. Subunit IIC contains clays with nannofossils to nannofossilmixed sediment interbedded with turbidites and ash layers. Unit IIIcontains nannofossil chalk with clays, interbedded with foraminiferchalk with clay, altered volcanic ash layers, and chert. Unit IV hascalcareous volcaniclastic mixed sedimentary rock interbedded withaltered volcanic ash with carbonates.
Figure 19 illustrates the core lithologies and lithostratigraphicunits that elicit responses in the SCS data that are distinct from unitsand lithologies above and below them. The interval from 30 to 120mbsf correlates with a zone of lower amplitude and less continuousreflections. This interval is also associated with an interval of in-creased turbidite thickness compared to the underlying section.Lithostratigraphic Subunits IIB and IIC correlate with a zone of highfrequency, high amplitude, and highly continuous reflections. UnitIV is marked by a set of low-frequency, high-amplitude, moderatelycontinuous reflections.
In addition to the correlation of these units with the seismic data,several other lithologic intervals appear to correlate with the seismicdata. Chert layers present in the core at 250, 350, 680, 730, 800, and880 mbsf appear to correlate with moderate- to high-amplitude, mod-erately continuous reflectors. Unfortunately, chert layers at 465, 495,520, 570, and 605 mbsf do not appear to correlate with any significantseismic reflectors. The lack of a seismic response may be a result ofthin chert layers. Turbidite-rich intervals from 30 to 120, 180 to 260,470 to 510, and 610 to 680 mbsf correlate with zones of lower ampli-tude, less continuous reflectors compared to intervals above and be-
0
100
200
300
400
5001.0 1.5 2.0 2.5 3.0 3.5
Velocity (km/s)
Dep
th (
mbs
f)
Sonic logmeasurements
Physical propertiesvelocity measurements
Figure 8. Modified sonic log and physical properties velocity measurementsfor Site 1001.
low the turbidite-rich intervals. Aside from the chert and turbidite-rich intervals, the relatively homogenous sediment recovered at Site998 does not have significant variations in the physical propertiesthat might cause a change in seismic response.
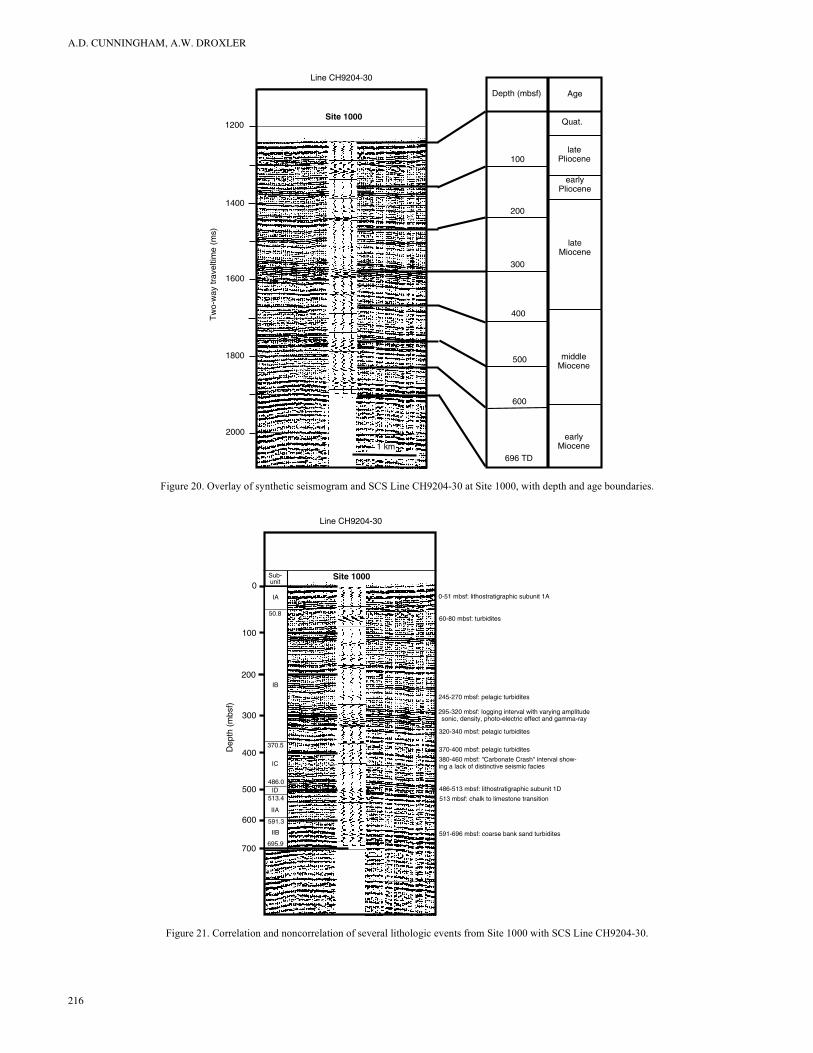
SITE 1000
Site 1000 is located in 927.2 m of water in Pedro Channel alongthe northern Nicaraguan Rise. The northern Nicaraguan Rise is bor-dered by the Cayman Trough to the north and the southern Nicara-guan Rise and Colombian Basin to the south. Pedro Channel is thewidest and deepest channel along the east-northeast trending Nicara-guan Rise. Shallow-water (30 m) carbonate banks bound PedroChannel on three sides. These banks include Pedro Bank to the east,Rosalind Bank to the west, and Serranilla Bank, Alice Shoal, andBanco Nuevo to the south. A largely complete 695.6-m section ofMiocene to Holocene sediment was recovered at Site 1000. This sed-iment consists predominantly of periplatform ooze, chalk, and lime-stone. Site 1000 was logged from 277 to 675 mbsf. SCS reflectionLine CH9204-30 crosses Site 1000 at Shotpoint 1495.
The synthetic seismogram shows very good agreement with theseismic data, and thus provides a link between the seismic sections
1.0 1.5 2.0 2.5 3.0 3.5 4.0
Velocity (km/s)
0
200
400
600
Dep
th (
mb
sf)
800
1000
Sonic log value
Physical properties value
Figure 9. Site 998 composite velocity profile containing edited sonic log andphysical properties velocity values used for creating the Site 998 syntheticseismogram.
209
A.D. CUNNINGHAM, A.W. DROXLER
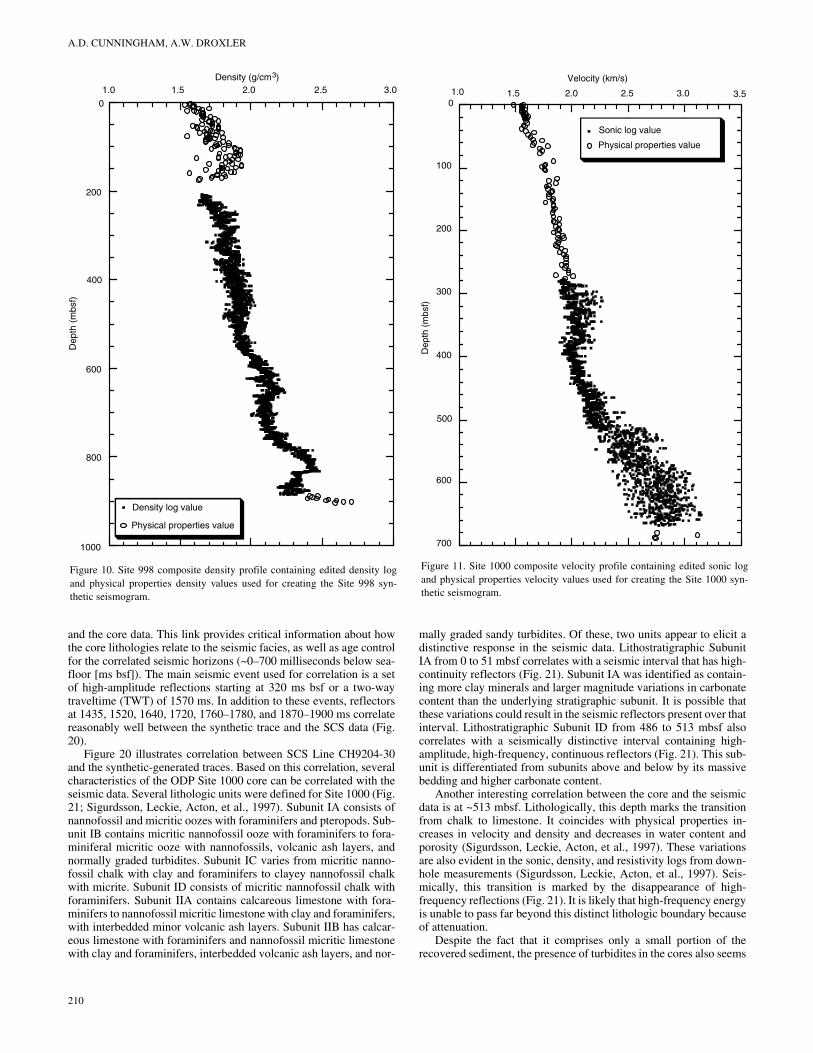
and the core data. This link provides critical information about howthe core lithologies relate to the seismic facies, as well as age controlfor the correlated seismic horizons (~0–700 milliseconds below sea-floor [ms bsf]). The main seismic event used for correlation is a setof high-amplitude reflections starting at 320 ms bsf or a two-waytraveltime (TWT) of 1570 ms. In addition to these events, reflectorsat 1435, 1520, 1640, 1720, 1760–1780, and 1870–1900 ms correlatereasonably well between the synthetic trace and the SCS data (Fig.20).
Figure 20 illustrates correlation between SCS Line CH9204-30and the synthetic-generated traces. Based on this correlation, severalcharacteristics of the ODP Site 1000 core can be correlated with theseismic data. Several lithologic units were defined for Site 1000 (Fig.21; Sigurdsson, Leckie, Acton, et al., 1997). Subunit IA consists ofnannofossil and micritic oozes with foraminifers and pteropods. Sub-unit IB contains micritic nannofossil ooze with foraminifers to fora-miniferal micritic ooze with nannofossils, volcanic ash layers, andnormally graded turbidites. Subunit IC varies from micritic nanno-fossil chalk with clay and foraminifers to clayey nannofossil chalkwith micrite. Subunit ID consists of micritic nannofossil chalk withforaminifers. Subunit IIA contains calcareous limestone with fora-minifers to nannofossil micritic limestone with clay and foraminifers,with interbedded minor volcanic ash layers. Subunit IIB has calcar-eous limestone with foraminifers and nannofossil micritic limestonewith clay and foraminifers, interbedded volcanic ash layers, and nor-
Density log value
Physical properties value
1.0 1.5 2.0 2.5 3.0
0
Density (g/cm )
200
400
600
800
1000
Dep
th (
mbs
f)3
Figure 10. Site 998 composite density profile containing edited density logand physical properties density values used for creating the Site 998 syn-thetic seismogram.
210
mally graded sandy turbidites. Of these, two units appear to elicit adistinctive response in the seismic data. Lithostratigraphic SubunitIA from 0 to 51 mbsf correlates with a seismic interval that has high-continuity reflectors (Fig. 21). Subunit IA was identified as contain-ing more clay minerals and larger magnitude variations in carbonatecontent than the underlying stratigraphic subunit. It is possible thatthese variations could result in the seismic reflectors present over thatinterval. Lithostratigraphic Subunit ID from 486 to 513 mbsf alsocorrelates with a seismically distinctive interval containing high-amplitude, high-frequency, continuous reflectors (Fig. 21). This sub-unit is differentiated from subunits above and below by its massivebedding and higher carbonate content.
Another interesting correlation between the core and the seismicdata is at ~513 mbsf. Lithologically, this depth marks the transitionfrom chalk to limestone. It coincides with physical properties in-creases in velocity and density and decreases in water content andporosity (Sigurdsson, Leckie, Acton, et al., 1997). These variationsare also evident in the sonic, density, and resistivity logs from down-hole measurements (Sigurdsson, Leckie, Acton, et al., 1997). Seis-mically, this transition is marked by the disappearance of high-frequency reflections (Fig. 21). It is likely that high-frequency energyis unable to pass far beyond this distinct lithologic boundary becauseof attenuation.
Despite the fact that it comprises only a small portion of therecovered sediment, the presence of turbidites in the cores also seems
Sonic log value
Physical properties value
1.0 1.5 2.0 2.5 3.0 3.50
100
200
300
400
500
600
700
Velocity (km/s)
Dep
th (
mbs
f)
Figure 11. Site 1000 composite velocity profile containing edited sonic logand physical properties velocity values used for creating the Site 1000 syn-thetic seismogram.
SYNTHETIC SEISMOGRAM CORRELATION
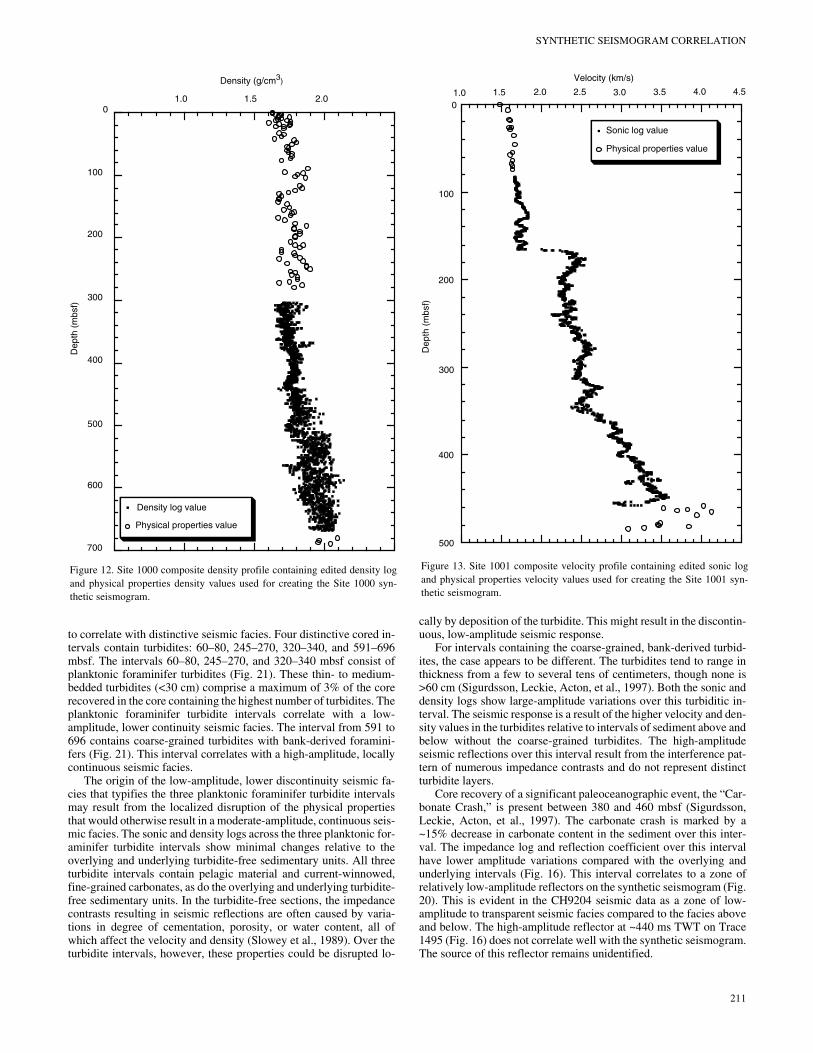
to correlate with distinctive seismic facies. Four distinctive cored in-tervals contain turbidites: 60–80, 245–270, 320–340, and 591–696mbsf. The intervals 60–80, 245–270, and 320–340 mbsf consist ofplanktonic foraminifer turbidites (Fig. 21). These thin- to medium-bedded turbidites (<30 cm) comprise a maximum of 3% of the corerecovered in the core containing the highest number of turbidites. Theplanktonic foraminifer turbidite intervals correlate with a low-amplitude, lower continuity seismic facies. The interval from 591 to696 contains coarse-grained turbidites with bank-derived foramini-fers (Fig. 21). This interval correlates with a high-amplitude, locallycontinuous seismic facies.
The origin of the low-amplitude, lower discontinuity seismic fa-cies that typifies the three planktonic foraminifer turbidite intervalsmay result from the localized disruption of the physical propertiesthat would otherwise result in a moderate-amplitude, continuous seis-mic facies. The sonic and density logs across the three planktonic for-aminifer turbidite intervals show minimal changes relative to theoverlying and underlying turbidite-free sedimentary units. All threeturbidite intervals contain pelagic material and current-winnowed,fine-grained carbonates, as do the overlying and underlying turbidite-free sedimentary units. In the turbidite-free sections, the impedancecontrasts resulting in seismic reflections are often caused by varia-tions in degree of cementation, porosity, or water content, all ofwhich affect the velocity and density (Slowey et al., 1989). Over theturbidite intervals, however, these properties could be disrupted lo-
Density log value
Physical properties value
0
100
200
300
400
500
600
700
1.51.0 2.0
Density (g/cm3)D
epth
(m
bsf)
Figure 12. Site 1000 composite density profile containing edited density logand physical properties density values used for creating the Site 1000 syn-thetic seismogram.
cally by deposition of the turbidite. This might result in the discontin-uous, low-amplitude seismic response.
For intervals containing the coarse-grained, bank-derived turbid-ites, the case appears to be different. The turbidites tend to range inthickness from a few to several tens of centimeters, though none is>60 cm (Sigurdsson, Leckie, Acton, et al., 1997). Both the sonic anddensity logs show large-amplitude variations over this turbiditic in-terval. The seismic response is a result of the higher velocity and den-sity values in the turbidites relative to intervals of sediment above andbelow without the coarse-grained turbidites. The high-amplitudeseismic reflections over this interval result from the interference pat-tern of numerous impedance contrasts and do not represent distinctturbidite layers.
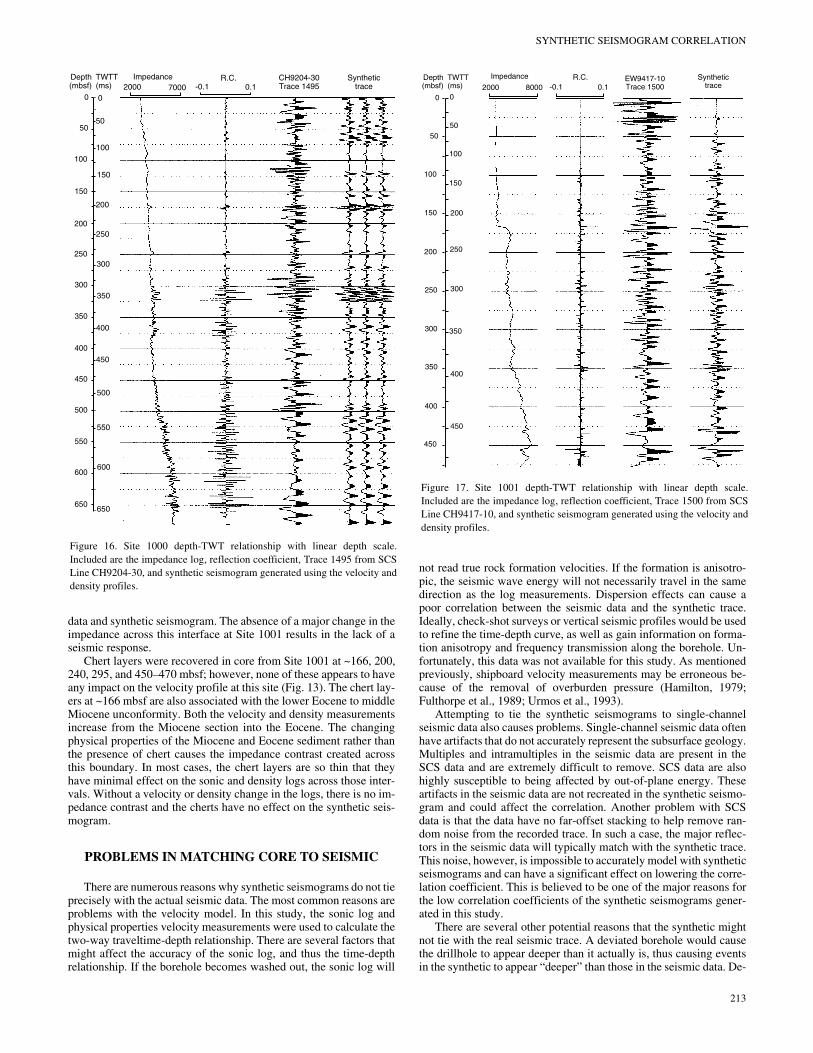
Core recovery of a significant paleoceanographic event, the “Car-bonate Crash,” is present between 380 and 460 mbsf (Sigurdsson,Leckie, Acton, et al., 1997). The carbonate crash is marked by a~15% decrease in carbonate content in the sediment over this inter-val. The impedance log and reflection coefficient over this intervalhave lower amplitude variations compared with the overlying andunderlying intervals (Fig. 16). This interval correlates to a zone ofrelatively low-amplitude reflectors on the synthetic seismogram (Fig.20). This is evident in the CH9204 seismic data as a zone of low-amplitude to transparent seismic facies compared to the facies aboveand below. The high-amplitude reflector at ~440 ms TWT on Trace1495 (Fig. 16) does not correlate well with the synthetic seismogram.The source of this reflector remains unidentified.
Sonic log value
Physical properties value
Velocity (km/s)
Dep
th (
mbs
f)
0
100
200
300
400
500
1.0 1.5 2.0 2.5 3.0 3.5 4.0 4.5
Figure 13. Site 1001 composite velocity profile containing edited sonic logand physical properties velocity values used for creating the Site 1001 syn-thetic seismogram.
211
A.D. CUNNINGHAM, A.W. DROXLER
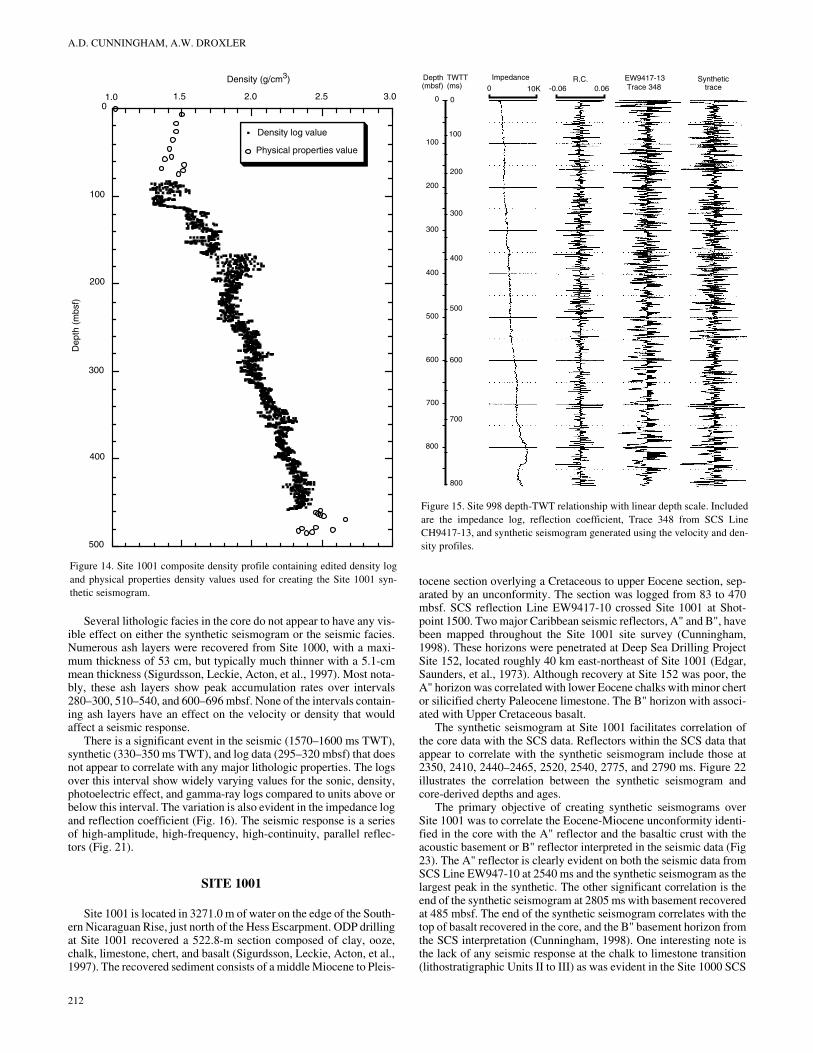
Several lithologic facies in the core do not appear to have any vis-ible effect on either the synthetic seismogram or the seismic facies.Numerous ash layers were recovered from Site 1000, with a maxi-mum thickness of 53 cm, but typically much thinner with a 5.1-cmmean thickness (Sigurdsson, Leckie, Acton, et al., 1997). Most nota-bly, these ash layers show peak accumulation rates over intervals280–300, 510–540, and 600–696 mbsf. None of the intervals contain-ing ash layers have an effect on the velocity or density that wouldaffect a seismic response.
There is a significant event in the seismic (1570–1600 ms TWT),synthetic (330–350 ms TWT), and log data (295–320 mbsf) that doesnot appear to correlate with any major lithologic properties. The logsover this interval show widely varying values for the sonic, density,photoelectric effect, and gamma-ray logs compared to units above orbelow this interval. The variation is also evident in the impedance logand reflection coefficient (Fig. 16). The seismic response is a seriesof high-amplitude, high-frequency, high-continuity, parallel reflec-tors (Fig. 21).
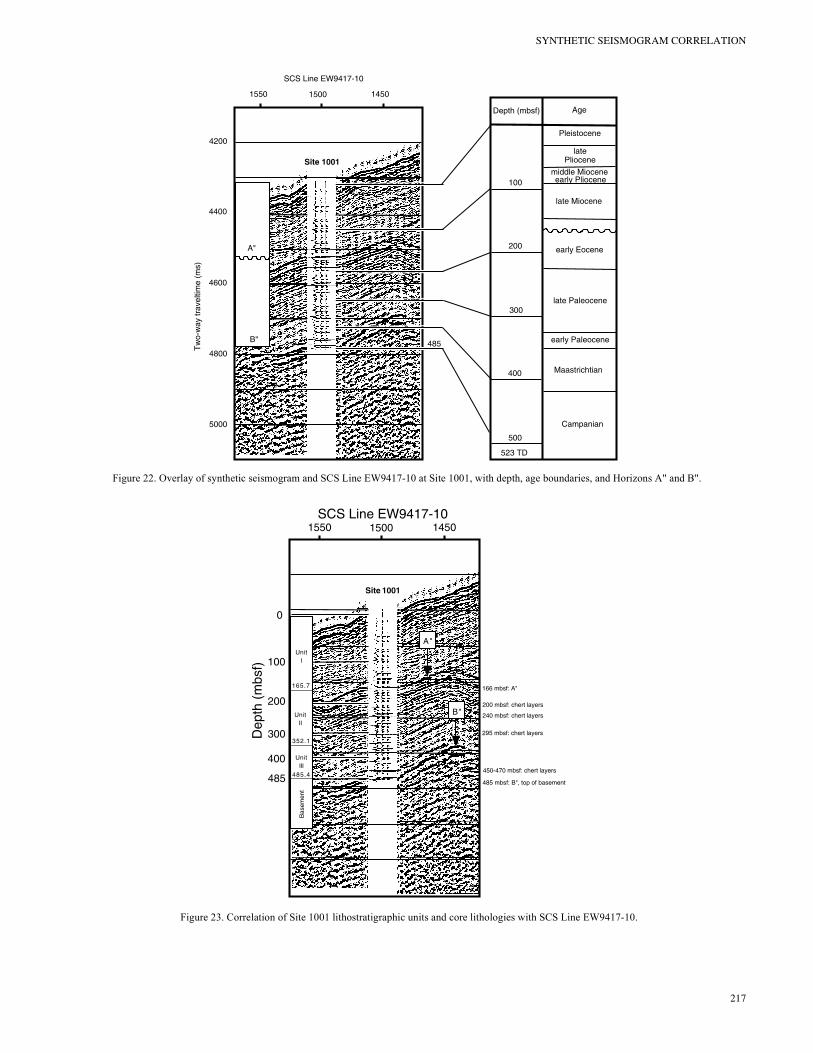
SITE 1001
Site 1001 is located in 3271.0 m of water on the edge of the South-ern Nicaraguan Rise, just north of the Hess Escarpment. ODP drillingat Site 1001 recovered a 522.8-m section composed of clay, ooze,chalk, limestone, chert, and basalt (Sigurdsson, Leckie, Acton, et al.,1997). The recovered sediment consists of a middle Miocene to Pleis-
Density log value
Physical properties value
Density (g/cm3)D
epth
(m
bsf)
1.0 1.5 2.0 2.5 3.00
100
200
300
400
500
Figure 14. Site 1001 composite density profile containing edited density logand physical properties density values used for creating the Site 1001 syn-thetic seismogram.
212
tocene section overlying a Cretaceous to upper Eocene section, sep-arated by an unconformity. The section was logged from 83 to 470mbsf. SCS reflection Line EW9417-10 crossed Site 1001 at Shot-point 1500. Two major Caribbean seismic reflectors, A" and B", havebeen mapped throughout the Site 1001 site survey (Cunningham,1998). These horizons were penetrated at Deep Sea Drilling ProjectSite 152, located roughly 40 km east-northeast of Site 1001 (Edgar,Saunders, et al., 1973). Although recovery at Site 152 was poor, theA" horizon was correlated with lower Eocene chalks with minor chertor silicified cherty Paleocene limestone. The B" horizon with associ-ated with Upper Cretaceous basalt.
The synthetic seismogram at Site 1001 facilitates correlation ofthe core data with the SCS data. Reflectors within the SCS data thatappear to correlate with the synthetic seismogram include those at2350, 2410, 2440–2465, 2520, 2540, 2775, and 2790 ms. Figure 22illustrates the correlation between the synthetic seismogram andcore-derived depths and ages.
The primary objective of creating synthetic seismograms overSite 1001 was to correlate the Eocene-Miocene unconformity identi-fied in the core with the A" reflector and the basaltic crust with theacoustic basement or B" reflector interpreted in the seismic data (Fig23). The A" reflector is clearly evident on both the seismic data fromSCS Line EW947-10 at 2540 ms and the synthetic seismogram as thelargest peak in the synthetic. The other significant correlation is theend of the synthetic seismogram at 2805 ms with basement recoveredat 485 mbsf. The end of the synthetic seismogram correlates with thetop of basalt recovered in the core, and the B" basement horizon fromthe SCS interpretation (Cunningham, 1998). One interesting note isthe lack of any seismic response at the chalk to limestone transition(lithostratigraphic Units II to III) as was evident in the Site 1000 SCS
0
100
200
300
400
500
600
700
800
800
700
600
500
400
300
200
100
0
Depth(mbsf)
TWTT(ms)
Impedance0 10K
R.C.-0.06 0.06
EW9417-13Trace 348
Synthetictrace
Figure 15. Site 998 depth-TWT relationship with linear depth scale. Includedare the impedance log, reflection coefficient, Trace 348 from SCS LineCH9417-13, and synthetic seismogram generated using the velocity and den-sity profiles.
SYNTHETIC SEISMOGRAM CORRELATION
data and synthetic seismogram. The absence of a major change in theimpedance across this interface at Site 1001 results in the lack of aseismic response.
Chert layers were recovered in core from Site 1001 at ~166, 200,240, 295, and 450–470 mbsf; however, none of these appears to haveany impact on the velocity profile at this site (Fig. 13). The chert lay-ers at ~166 mbsf are also associated with the lower Eocene to middleMiocene unconformity. Both the velocity and density measurementsincrease from the Miocene section into the Eocene. The changingphysical properties of the Miocene and Eocene sediment rather thanthe presence of chert causes the impedance contrast created acrossthis boundary. In most cases, the chert layers are so thin that theyhave minimal effect on the sonic and density logs across those inter-vals. Without a velocity or density change in the logs, there is no im-pedance contrast and the cherts have no effect on the synthetic seis-mogram.
PROBLEMS IN MATCHING CORE TO SEISMIC
There are numerous reasons why synthetic seismograms do not tieprecisely with the actual seismic data. The most common reasons areproblems with the velocity model. In this study, the sonic log andphysical properties velocity measurements were used to calculate thetwo-way traveltime-depth relationship. There are several factors thatmight affect the accuracy of the sonic log, and thus the time-depthrelationship. If the borehole becomes washed out, the sonic log will
0
50
100
150
200
250
300
350
400
450
500
550
600
650
0
50
100
150
200
250
300
350
400
450
500
550
600
650
Impedance R.C. CH9204-30Trace 1495
Synthetictrace-0.1 0.12000 7000
Depth(mbsf)
TWTT(ms)
Figure 16. Site 1000 depth-TWT relationship with linear depth scale.Included are the impedance log, reflection coefficient, Trace 1495 from SCSLine CH9204-30, and synthetic seismogram generated using the velocity anddensity profiles.
not read true rock formation velocities. If the formation is anisotro-pic, the seismic wave energy will not necessarily travel in the samedirection as the log measurements. Dispersion effects can cause apoor correlation between the seismic data and the synthetic trace.Ideally, check-shot surveys or vertical seismic profiles would be usedto refine the time-depth curve, as well as gain information on forma-tion anisotropy and frequency transmission along the borehole. Un-fortunately, this data was not available for this study. As mentionedpreviously, shipboard velocity measurements may be erroneous be-cause of the removal of overburden pressure (Hamilton, 1979;Fulthorpe et al., 1989; Urmos et al., 1993).
Attempting to tie the synthetic seismograms to single-channelseismic data also causes problems. Single-channel seismic data oftenhave artifacts that do not accurately represent the subsurface geology.Multiples and intramultiples in the seismic data are present in theSCS data and are extremely difficult to remove. SCS data are alsohighly susceptible to being affected by out-of-plane energy. Theseartifacts in the seismic data are not recreated in the synthetic seismo-gram and could affect the correlation. Another problem with SCSdata is that the data have no far-offset stacking to help remove ran-dom noise from the recorded trace. In such a case, the major reflec-tors in the seismic data will typically match with the synthetic trace.This noise, however, is impossible to accurately model with syntheticseismograms and can have a significant effect on lowering the corre-lation coefficient. This is believed to be one of the major reasons forthe low correlation coefficients of the synthetic seismograms gener-ated in this study.
There are several other potential reasons that the synthetic mightnot tie with the real seismic trace. A deviated borehole would causethe drillhole to appear deeper than it actually is, thus causing eventsin the synthetic to appear “deeper” than those in the seismic data. De-
Impedance R.C. EW9417-10Trace 1500
Synthetictrace-0.1 0.12000 8000
0
50
100
150
200
250
300
350
400
450
0
50
100
150
200
250
300
350
400
450
Depth(mbsf)
TWTT(ms)
Figure 17. Site 1001 depth-TWT relationship with linear depth scale.Included are the impedance log, reflection coefficient, Trace 1500 from SCSLine CH9417-10, and synthetic seismogram generated using the velocity anddensity profiles.
213

A.D. CUNNINGHAM, A.W. DROXLER
4000400300
5500
5000
4500
SCS Line EW9417-13
Tw
o-w
ay tr
avel
time
(ms)
Depth (mbsf) Age
100
200
300
400
500
600
700
800
900
Pleistocenelate Pliocene
early Pliocene
late Miocene
middleMiocene
earlyMiocene
lateOligocene
earlyOligocene
late Eocene
middleEocene
early Eocene
Interpretedbasement
Not
dril
led
Site 998
Figure 18. Overlay of synthetic seismogram and SCS Line EW9417-13 at Site 998, with depth and age boundaries.
spite using the seismic wavelet extraction procedure, the lack of anactual source wavelet could cause differences between the syntheticseismogram and seismic data. Finally, as mentioned earlier, there arenumerous factors that could affect the quality of the sonic and densitylogs as well as the physical properties data, any of which could ad-versely affect the resultant synthetic seismogram. Unfortunately,these effects are difficult to quantify.
SUMMARY
Correlation of SCS data and ODP core lithologies recovered atSites 998, 1000, and 1001 was accomplished by creating syntheticseismograms from velocity and density measurements. At all threesites, many of the major reflectors in the SCS data correlate withhigh-amplitude events in the synthetic seismograms. Furthermore,vertical changes in SCS facies can be related to downhole variationsin core lithologies.
The synthetic seismogram generated for Site 998 permits correla-tion of the Site 998 core with SCS data over the site. Several of theunits identified in the lithostratigraphic descriptions from Site 998(Sigurdsson, Leckie, Acton, et al., 1997) correlate quite well withseismic intervals having distinctive seismic character. Zones of low-continuity, low-amplitude seismic facies correlate with severalturbidite-rich core intervals. Several chert layers correlate with mod-erate- to high-amplitude, moderate- to high-continuity reflections.However, some intervals of chert layers cause no seismic response.
The synthetic seismogram results from Site 1000 also provide ex-cellent visual correlation with SCS data from Line CH9204-30. The
214
correlation with the biostratigraphy from the core permits age deter-mination of interpreted seismic horizons. The synthetic seismogramalso correlates several seismic characteristics with lithologies fromSite 1000. Several planktonic foraminifer turbidites correlate withzones of low continuity seismic reflectors. An interval of coarse-grained, neritic sand turbidites correlates with high-amplitude, mod-erately continuous reflectors. Finally, the chalk-limestone transitionis correlated with a high-amplitude reflection, below which there areno high-frequency reflections.
The synthetic seismogram created for Site 1001 facilitates corre-lation between the SCS data and the core recovered from Site 1001.The most significant correlation links the 30-Ma middle Miocene toearly Eocene unconformity in the core with the A" seismic reflectorand the sediment-basement interface with the B" seismic reflector.Several chert layers identified in the ODP core do not correlate withSCS reflectors.
ACKNOWLEDGMENTS
We would like to thank Gary Acton, Tobias Moerz, and anony-mous reviewers for their constructive insight in reviewing this manu-script. We thank the crews and scientists aboard the Cape Hatteras,Maurice Ewing, and JOIDES Resolution and at the Lamont-DohertyEarth Observatory for their efforts in the acquisition and processing ofthe data used in this study. The senior author wishes to thank AmocoExploration and Production Company (Alan Brown and MargaretKeillor) for providing access and support for use of the Landmarksoftware and workstations necessary to complete this study. This re-
SYNTHETIC SEISMOGRAM CORRELATION
400300
SCS Line EW9417-13D
epth
(m
bsf)
100
200
300
400
500
600
700
800
900
0
250 mbsf: chert layers
350 mbsf: chert layers
680 mbsf: chert layers
730 mbsf: chert layers
800 mbsf: chert layers
880 mbsf: chert layers
120-145 mbsf: Lithostratigraphic Subunit IIB145-160 mbsf: Lithostratigraphic Subunit IIC
766 mbsf: start of Lithologic Unit IV
30-120 mbsf: zone of increased turbidite thickness
180-260 mbsf: zone of increased turbidite thickness
470-510 mbsf: zone of increased turbidite thickness
610-680 mbsf: zone of increased turbidite thickness
UnitI
94.3
161.0
UnitII
UnitIV
UnitIII
766.0
904.8
Site 998
Figure 19. Correlation of Site 998 lithostratigraphic units and core lithologies with SCS Line EW9417-13.
search comprises part of the doctoral dissertation of the senior author(Cunningham, 1998) and was supported by JOI/USSP/TAMRFGrants No. F000307 and F000395.
REFERENCES
Carlson, R.L., Gangi, A.F., and Snow, K.R., 1986. Empirical reflection traveltime versus depth and velocity versus depth functions for the deep-seasediment column. J. Geophys. Res., 91:8249–8266.
Cunningham, A.D., 1998. The Neogene evolution of the Pedro Channel car-bonate system, northern Nicaragua Rise [Ph.D. thesis]. Rice Univ., Hous-ton.
Edgar, N.T., Saunders, J.B., et al., 1973. Init. Repts. DSDP, 15: Washington(U.S. Government Printing Office).
Fulthorpe, C.S., Schlanger, S.O., and Jarrard, R.D., 1989. In situ acousticproperties of pelagic carbonate sediments on the Ontong Java Plateau. J.Geophys. Res., 94:4025–4032.
Hamilton, E.L., 1979. Sound velocity gradients in marine sediments. J.Acoust. Soc. Am., 65:909–922.
Sigurdsson, H., Leckie, R.M., Acton, G.D., et al., 1997. Proc. ODP, Init.Repts., 165: College Station, TX (Ocean Drilling Program).
Slowey, N.C., Neumann, A.C., and Baldwin, K.C., 1989. Seismic expressionof Quaternary climatic cycles in the periplatform carbonate ooze of thenorthern Bahamas. Geol. Soc. Am. Bull., 101:1563–1573.
Urmos, J., Wilkens, R.H., Bassinot, F., Lyle, M., Marsters, J.C., Mayer, L.A.,and Mosher, D.C., 1993. Laboratory and well-log velocity and densitymeasurements from the Ontong Java Plateau: new in-situ corrections tolaboratory data for pelagic carbonates. In Berger, W.H., Kroenke, L.W.,Mayer, L.A., et al., Proc. ODP, Sci. Results, 130: College Station, TX(Ocean Drilling Program), 607–622.
Date of initial receipt: 24 June 1998Date of acceptance: 29 April 1999Ms 165SR-024
215
A.D. CUNNINGHAM, A.W. DROXLER
216
Site 1000
1600
1400
1200
2000
1800
Tw
o-w
ay tr
avel
time
(ms)
Age
Quat.
latePliocene
earlyPliocene
lateMiocene
middleMiocene
earlyMiocene
100
200
300
400
500
600
696 TD
Depth (mbsf)
Line CH9204-30
1 km
Figure 20. Overlay of synthetic seismogram and SCS Line CH9204-30 at Site 1000, with depth and age boundaries.
Site 1000
100
200
300
400
500
600
0
Dep
th (
mbs
f)
700
Line CH9204-30
245-270 mbsf: pelagic turbidites
320-340 mbsf: pelagic turbidites
513 mbsf: chalk to limestone transition
60-80 mbsf: turbidites
0-51 mbsf: lithostratigraphic subunit 1A
486-513 mbsf: lithostratigraphic subunit 1D
591-696 mbsf: coarse bank sand turbidites
295-320 mbsf: logging interval with varying amplitudesonic, density, photo-electric effect and gamma-ray
370-400 mbsf: pelagic turbidites
380-460 mbsf: "Carbonate Crash" interval show-ing a lack of distinctive seismic facies
IA
50.8
IB
370.5
IC
486.0ID
513.4
IIA
591.3
695.9
IIB
Sub-unit
Figure 21. Correlation and noncorrelation of several lithologic events from Site 1000 with SCS Line CH9204-30.
SYNTHETIC SEISMOGRAM CORRELATION
1550 1500 1450
SCS Line EW9417-10
4200
4400
4600
4800
5000
Tw
o-w
ay tr
avel
time
(ms)
Site 1001
early Eocene
early Pliocene
late Miocene
latePliocene
Pleistocene
late Paleocene
early Paleocene
Maastrichtian
Depth (mbsf) Age
100
200
300
500
400
523 TD
Campanian
middle Miocene
A"
B" 485
Figure 22. Overlay of synthetic seismogram and SCS Line EW9417-10 at Site 1001, with depth, age boundaries, and Horizons A" and B".
1550 1500 1450SCS Line EW9417-10
Site 1001
485
0
100
200
300
400
Dep
th (
mbs
f)
295 mbsf: chert layers
450-470 mbsf: chert layers
240 mbsf: chert layers
200 mbsf: chert layers
485 mbsf: B", top of basement
166 mbsf: A"
UnitI
165.7
485.4
UnitIII
UnitII
Bas
emen
t
352.1
A"
B"
Figure 23. Correlation of Site 1001 lithostratigraphic units and core lithologies with SCS Line EW9417-10.
217