Embed Size (px)
Citation preview
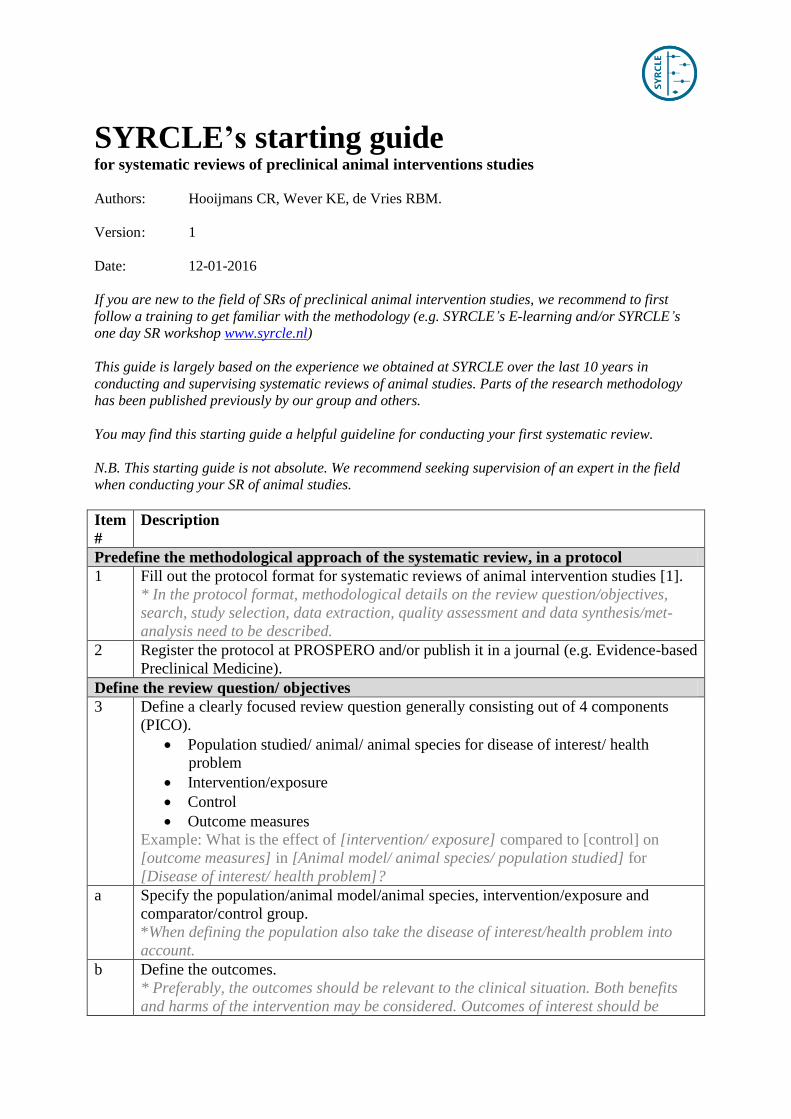
SYRCLE’s starting guide for systematic reviews of preclinical animal interventions studies
Authors: Hooijmans CR, Wever KE, de Vries RBM.
Version : 1
Date: 12-01-2016
If you are new to the field of SRs of preclinical animal intervention studies, we recommend to first
follow a training to get familiar with the methodology (e.g. SYRCLE’s E-learning and/or SYRCLE’s
one day SR workshop www.syrcle.nl)
This guide is largely based on the experience we obtained at SYRCLE over the last 10 years in
conducting and supervising systematic reviews of animal studies. Parts of the research methodology
has been published previously by our group and others.
You may find this starting guide a helpful guideline for conducting your first systematic review.
N.B. This starting guide is not absolute. We recommend seeking supervision of an expert in the field
when conducting your SR of animal studies.
Item
#
Description
Predefine the methodological approach of the systematic review, in a protocol
1 Fill out the protocol format for systematic reviews of animal intervention studies [1].
* In the protocol format, methodological details on the review question/objectives,
search, study selection, data extraction, quality assessment and data synthesis/met-
analysis need to be described.
2 Register the protocol at PROSPERO and/or publish it in a journal (e.g. Evidence-based
Preclinical Medicine).
Define the review question/ objectives
3 Define a clearly focused review question generally consisting out of 4 components
(PICO).
Population studied/ animal/ animal species for disease of interest/ health
problem
Intervention/exposure
Control
Outcome measures
Example: What is the effect of [intervention/ exposure] compared to [control] on
[outcome measures] in [Animal model/ animal species/ population studied] for
[Disease of interest/ health problem]?
a Specify the population/animal model/animal species, intervention/exposure and
comparator/control group.
*When defining the population also take the disease of interest/health problem into
account.
b Define the outcomes.
* Preferably, the outcomes should be relevant to the clinical situation. Both benefits
and harms of the intervention may be considered. Outcomes of interest should be

included regardless of the available evidence.
Define eligibility criteria
4 Define and describe the population studied
(When defining the population take also the disease of interest/health problem into
account.). Consider:
Which species are eligible
*e.g. not necessarily restricted to mice/rats
Which setting is appropriate
*e.g. laboratory animals with experimental Alzheimer’s disease
The most important characteristics that describe the population
*e.g. healthy animals, animals with co-morbidities, or transgenic animals
When an animal model is appropriate and when not
* e.g. one aspect of AD is ageing, should aged animals without known AD
pathology be included
Which demographic factors are appropriate
* e.g. age, sex etc
Which animal models which are clearly inappropriate
*e.g exclude a specific animal model with a known physiological mechanism
that does correspond to the mechanism in humans.
5 Define and describe intervention studied. Consider:
What is the intervention and control intervention of interest
Variations in the intervention (dosage, mode of delivery, timing, frequency,
duration etc)
Co-intervention allowed?
*e.g. Contamination (Intervention in combination with confounding drug/
intervention)
Define and describe control group of interest
*e.g. Placebo controlled animal studies, control groups with no intervention,
animals being their own control
6 Define and describe outcome measures. Consider:
Outcomes measures that are essential for decision making about the efficacy of
the intervention
Outcome measures that provide insight in possible harms caused by the
intervention
Outcome measures that have high external validity (can relatively easily be
generalized to other populations/ humans)
Outcome measures that are clinically relevant
Select outcomes based on relevance, not on what you expect to be reported in
the primary studies.
7 Define and describe general exclusion criteria. Consider:
Language restrictions (preferably none)
Specific study designs (e.g. case study, repeated measures etc)
Publication date restrictions (preferably none)
Peer reviewed
Duplicate studies (e.g. same data published in more than one paper)
Publication type (e.g. will you include reviews or conference abstracts?)
Irretrievable studies
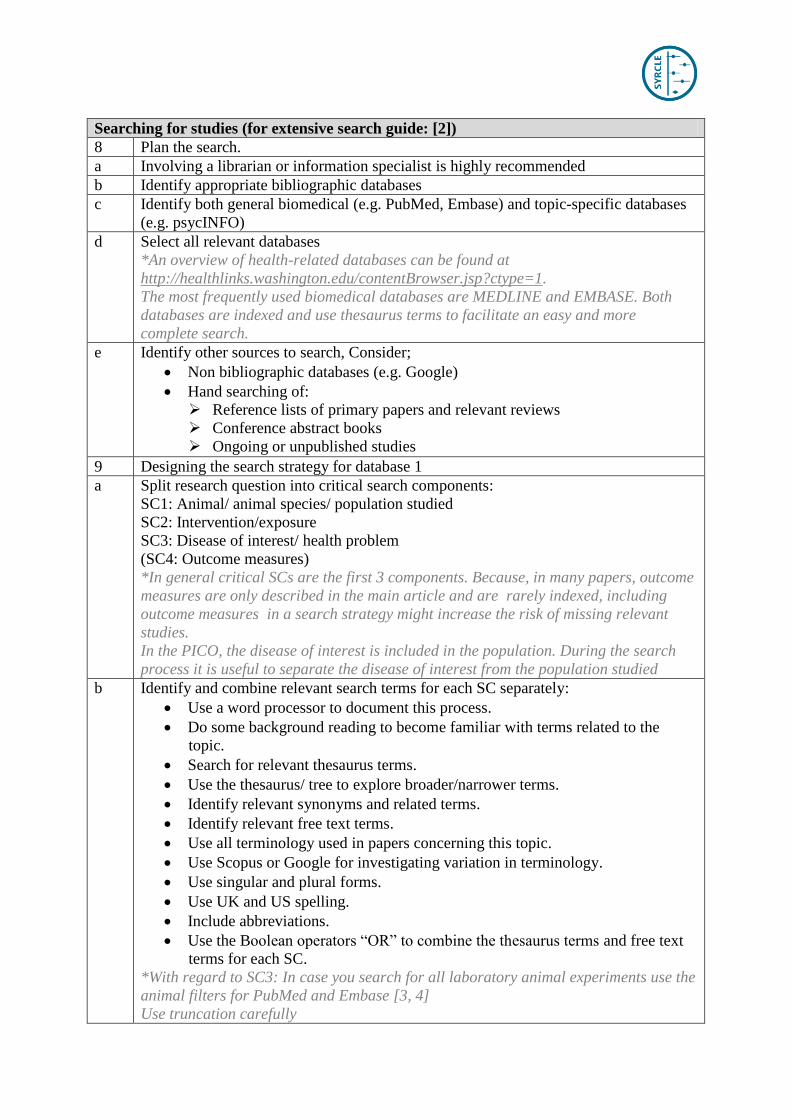
Searching for studies (for extensive search guide: [2])
8 Plan the search.
a Involving a librarian or information specialist is highly recommended
b Identify appropriate bibliographic databases
c Identify both general biomedical (e.g. PubMed, Embase) and topic-specific databases
(e.g. psycINFO)
d Select all relevant databases
*An overview of health-related databases can be found at
http://healthlinks.washington.edu/contentBrowser.jsp?ctype=1.
The most frequently used biomedical databases are MEDLINE and EMBASE. Both
databases are indexed and use thesaurus terms to facilitate an easy and more
complete search.
e Identify other sources to search, Consider;
Non bibliographic databases (e.g. Google)
Hand searching of:
Reference lists of primary papers and relevant reviews
Conference abstract books
Ongoing or unpublished studies
9 Designing the search strategy for database 1
a Split research question into critical search components:
SC1: Animal/ animal species/ population studied
SC2: Intervention/exposure
SC3: Disease of interest/ health problem
(SC4: Outcome measures)
*In general critical SCs are the first 3 components. Because, in many papers, outcome
measures are only described in the main article and are rarely indexed, including
outcome measures in a search strategy might increase the risk of missing relevant
studies.
In the PICO, the disease of interest is included in the population. During the search
process it is useful to separate the disease of interest from the population studied
b
Identify and combine relevant search terms for each SC separately:
Use a word processor to document this process.
Do some background reading to become familiar with terms related to the
topic.
Search for relevant thesaurus terms.
Use the thesaurus/ tree to explore broader/narrower terms.
Identify relevant synonyms and related terms.
Identify relevant free text terms.
Use all terminology used in papers concerning this topic.
Use Scopus or Google for investigating variation in terminology.
Use singular and plural forms.
Use UK and US spelling.
Include abbreviations.
Use the Boolean operators “OR” to combine the thesaurus terms and free text
terms for each SC.
*With regard to SC3: In case you search for all laboratory animal experiments use the
animal filters for PubMed and Embase [3, 4]
Use truncation carefully
c Evaluate search results:
Assess the results found per SC (evaluate the appropriateness of the used
terminology Consider context and number of results.
Use of the Boolean operator “NOT” might be useful to restrict your search and
reduce “noise”.
In case of relevant terminology, but no extra hits, keep the term in your search
in order to show the reviewers/ readers that you considered the term.
Compare your searchstring for each component with searchstrings used for the
same topic in for example Cochrane SRs or other published SRs.
Combine all SCs often by using the Boolean operator “AND”.
10 Designing the search strategy for database 2 in a manner similar to item 9.
*It might be useful to search also in Embase. This database contains compared to
PubMed/Medline; more journals (i.e. more European journals), conference abstracts
and thesaurus terms.
11 Design the search strategy for other sources.
*Think of topic specific databases such as:
PsycINFO: Identifies articles, books and dissertations in psychology and
related subjects.
CIINAHL: Cumulative Index to Nursing and Allied Health Literature.
12 Managing references.
Transfer all search results into a reference manager program (e.g. Endnote,
Reference Manager).
Make sure that you make a back-up before you are going to remove duplicates
etc.
Create a separate file for each database.
Combine search results of the various databases in a new file.
Remove duplicate citations (first automatically and secondly by hand).
13 Document and report the search:
Databases and other sources searched
Dates of the last search
Full search strategy
Restrictions used (for example language or publication status)
Grey literature searched
Organisations contacted
Unpublished or ongoing experiments
Selecting studies
14 Consider exporting the results from the combined file from your reference manger
program to EROS (http://www.eros-systematic-review.org/), software designed to
organize the initial phases of a systematic review such as the screening by title/abstract
and first agreement between co-reviewers (online).
* Some organisations have their own database or data warehouse to which the
references can be exported (e.g. CAMARADES database, Health Assessment
Workspace Collaborative (HAWC). 15 Sort and prioritize your exclusion criteria so that in case multiple exclusion criteria are
relevant for an abstract/paper it is clear what the primary exclusion criterion will be.
16 Select studies by at least 2 independent reviewers.
17 Define how disagreements are handled.
e.g. disagreements are solved by discussion, or a third reviewer decides.
18 Pilot test the eligibility criteria by randomly selecting 10-20 papers from your
reference manager file and applying the criteria. Discuss results with the second
observer.
19 Pre- screening based on title/abstract.
Report which studies are excluded and why.
Examine titles and abstracts and remove obviously irrelevant reports which do
not comply with eligibility criteria.
Do not screen on the presence or absence of specific outcome measures during
this phase, because often not all outcome measures are described in the
abstract.
Be over inclusive in this stage (in case of doubt, include paper).
20 Retrieve full text of potentially relevant reports.
*Consider using the option in Endnote to search for and retrieve full-text articles.
21 Full text screening.
Examine full text reports for compliance with eligibility criteria as described
above but now also exclude papers not meeting predescribed outcome
measures.
(do not exclude papers during this phase that do not contain data suitable for the
meta-analysis you planned.)
During full text screening it is easier to exclude papers concerning the:
o Presence of co-interventions
o Presence of co-morbidities
o Presence of incorrect control groups
22 Create a flow diagram.
The flow diagram depicts the flow of information through the different phases of a
systematic review.
*Consider using the PRISMA flow diagram: http://www.prisma-
statement.org/statement.htm
Collecting study characteristics
23 Decide on which study characteristics are important in order to create an overview of
the included studies and reporting quality, assessment of external validity and
explaining potential heterogeneity. Think of:
Study ID (e.g. authors, year)
Study design characteristics (e.g. experimental groups, number of animals)
Animal model characteristics (e.g. species, strain, sex, disease induction)
Intervention characteristics (e.g. intervention, timing, duration)
Outcome measures (e.g. type, timing, time points, sample size
Other (e.g. drop-outs)
24 Tabulate characteristics and present in manuscript.
Assessing study validity
25 Decide on assessing risk of bias and/or methodological/reporting quality in general.
26 Assess the risk of bias.
a Define criteria to assess the internal validity of included studies .
Think of criteria assessing: Selection bias; Performance bias; Attrition bias;
Detection bias; Reporting bias and Other types of bias.
(not all types of bias are relevant for all research questions)
Consider using SYRCLE’s risk of bias tool for animal intervention studies
(table 1) [5], but adapt to your research question. Table 1:
Item Type of bias Domain Review authors judgement
1 Selection
bias
Sequence
generation
Was the allocation sequence
adequately generated and
applied?
2 Selection
bias
Baseline
characteristics
Were the groups similar at
baseline or was adjusted for
confounders in the analysis?
3 Selection
bias
Allocation
concealment
Was the allocation adequately
concealed?
4 Performance
bias
Random housing Are the animals randomly
housed during the experiment?
5 Performance
bias
Blinding Were the caregivers/ and or
investigators during the course of
the experiment blinded from
knowledge of which intervention
each animal received?
6 Detection
bias
Random outcome
assessment
Were animals selected at random
for the outcome assessment?
7 Detection
bias
Blinding Was the outcome assessor
blinded?
8 Attrition bias Incomplete
outcome data
Were incomplete outcome data
adequately addressed?
9 Reporting
bias
Selective outcome
reporting
Are reports of the study free of
selective outcome reporting?
10 Other Other sources of
bias
Was the study apparently free of
other problems that could pose a
high risk of bias?
b Define how criteria for risk of bias are judged
*Use for help the signalling questions defined in [5].
* Make sure that you score the risk of bias and not the adequacy of reporting.
c Assess the risk of bias by at least 2 independent reviewers.
d As a pilot, start with a small number of studies and compare results between the
reviewers to make sure that you assess the risk of bias in the same way.
e Decide whether or not to contact authors for missing information for evaluating the
risk of bias (realize that this can cause bias as well).
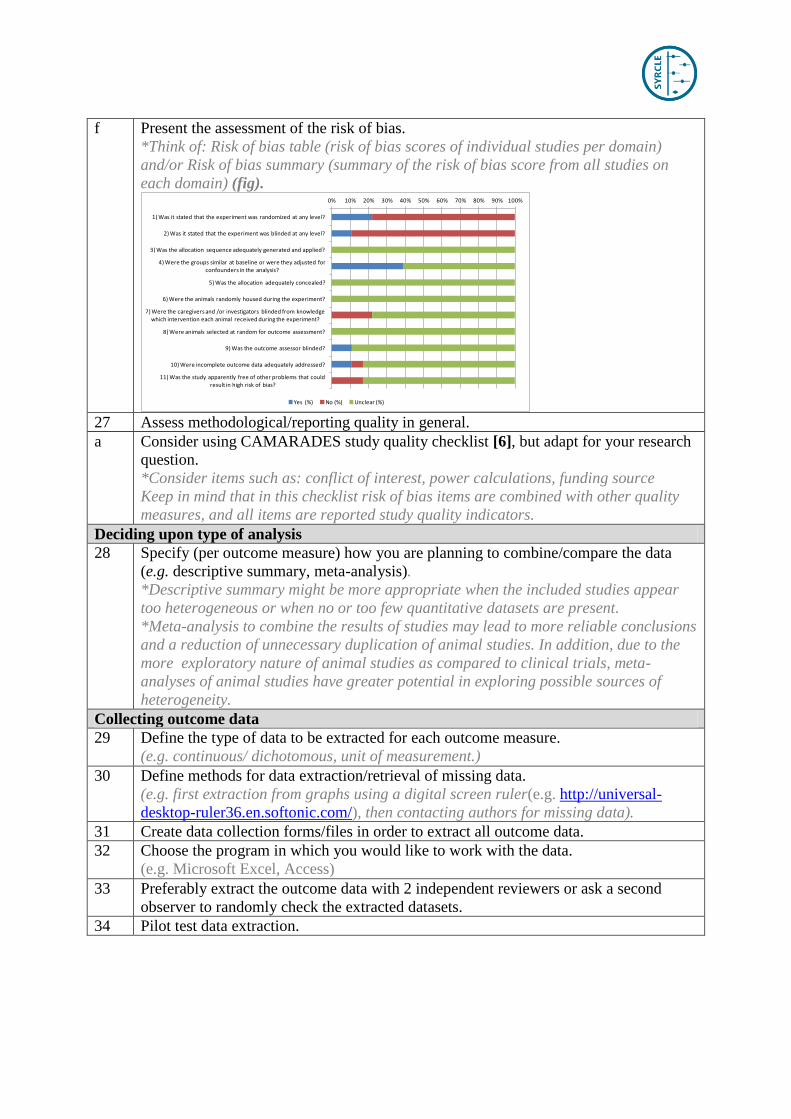
f Present the assessment of the risk of bias.
*Think of: Risk of bias table (risk of bias scores of individual studies per domain)
and/or Risk of bias summary (summary of the risk of bias score from all studies on
each domain) (fig). 0% 10% 20% 30% 40% 50% 60% 70% 80% 90% 100%
1) Was it stated that the experiment was randomized at any level?
2) Was it stated that the experiment was blinded at any level?
3) Was the allocation sequence adequately generated and applied?
4) Were the groups similar at baseline or were they adjusted for confounders in the analysis?
5) Was the allocation adequately concealed?
6) Were the animals randomly housed during the experiment?
7) Were the caregivers and /or investigators blinded from knowledge which intervention each animal received during the experiment?
8) Were animals selected at random for outcome assessment?
9) Was the outcome assessor blinded?
10) Were incomplete outcome data adequately addressed?
11) Was the study apparently free of other problems that could result in high risk of bias?
Yes (%) No (%) Unclear (%)
27 Assess methodological/reporting quality in general.
a Consider using CAMARADES study quality checklist [6], but adapt for your research
question.
*Consider items such as: conflict of interest, power calculations, funding source
Keep in mind that in this checklist risk of bias items are combined with other quality
measures, and all items are reported study quality indicators.
Deciding upon type of analysis
28 Specify (per outcome measure) how you are planning to combine/compare the data
(e.g. descriptive summary, meta-analysis).
*Descriptive summary might be more appropriate when the included studies appear
too heterogeneous or when no or too few quantitative datasets are present.
*Meta-analysis to combine the results of studies may lead to more reliable conclusions
and a reduction of unnecessary duplication of animal studies. In addition, due to the
more exploratory nature of animal studies as compared to clinical trials, meta-
analyses of animal studies have greater potential in exploring possible sources of
heterogeneity.
Collecting outcome data
29 Define the type of data to be extracted for each outcome measure.
(e.g. continuous/ dichotomous, unit of measurement.)
30 Define methods for data extraction/retrieval of missing data.
(e.g. first extraction from graphs using a digital screen ruler(e.g. http://universal-
desktop-ruler36.en.softonic.com/), then contacting authors for missing data).
31 Create data collection forms/files in order to extract all outcome data.
32 Choose the program in which you would like to work with the data.
(e.g. Microsoft Excel, Access)
33 Preferably extract the outcome data with 2 independent reviewers or ask a second
observer to randomly check the extracted datasets.
34 Pilot test data extraction.
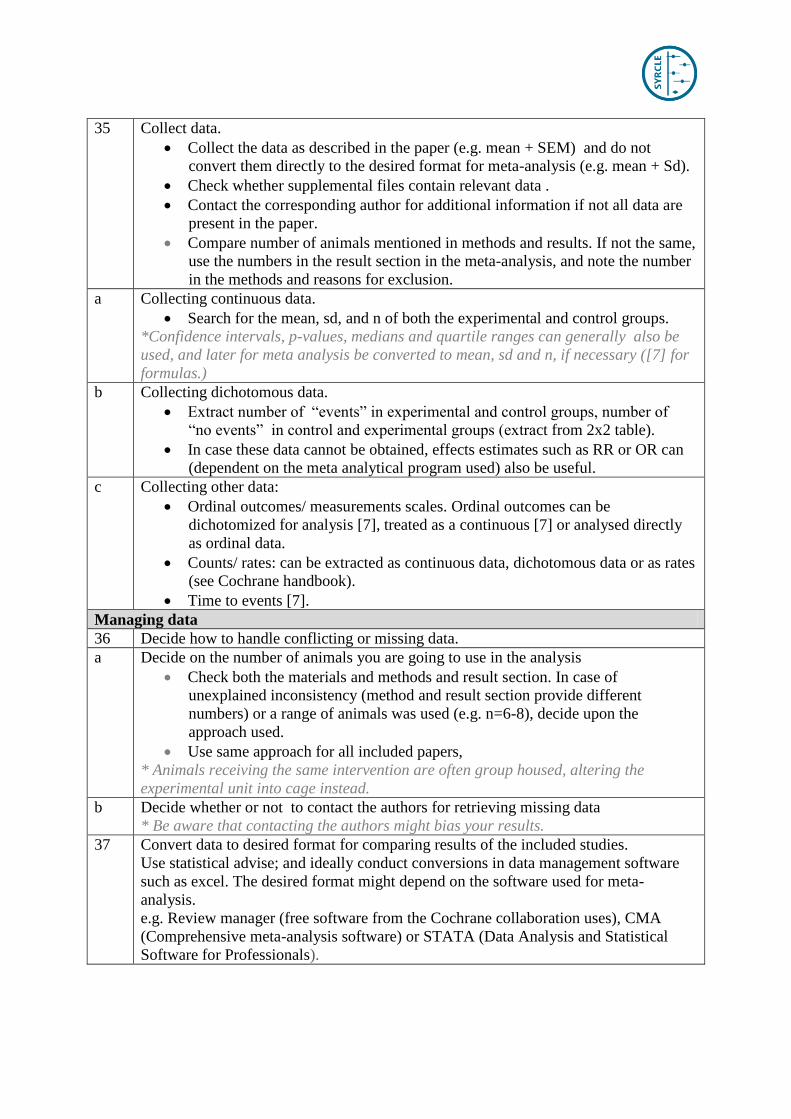
35 Collect data.
Collect the data as described in the paper (e.g. mean + SEM) and do not
convert them directly to the desired format for meta-analysis (e.g. mean + Sd).
Check whether supplemental files contain relevant data .
Contact the corresponding author for additional information if not all data are
present in the paper.
Compare number of animals mentioned in methods and results. If not the same,
use the numbers in the result section in the meta-analysis, and note the number
in the methods and reasons for exclusion.
a Collecting continuous data.
Search for the mean, sd, and n of both the experimental and control groups.
*Confidence intervals, p-values, medians and quartile ranges can generally also be
used, and later for meta analysis be converted to mean, sd and n, if necessary ([7] for
formulas.)
b Collecting dichotomous data.
Extract number of “events” in experimental and control groups, number of
“no events” in control and experimental groups (extract from 2x2 table).
In case these data cannot be obtained, effects estimates such as RR or OR can
(dependent on the meta analytical program used) also be useful.
c Collecting other data:
Ordinal outcomes/ measurements scales. Ordinal outcomes can be
dichotomized for analysis [7], treated as a continuous [7] or analysed directly
as ordinal data.
Counts/ rates: can be extracted as continuous data, dichotomous data or as rates
(see Cochrane handbook).
Time to events [7].
Managing data
36 Decide how to handle conflicting or missing data.
a Decide on the number of animals you are going to use in the analysis
Check both the materials and methods and result section. In case of
unexplained inconsistency (method and result section provide different
numbers) or a range of animals was used (e.g. n=6-8), decide upon the
approach used.
Use same approach for all included papers,
* Animals receiving the same intervention are often group housed, altering the
experimental unit into cage instead.
b Decide whether or not to contact the authors for retrieving missing data
* Be aware that contacting the authors might bias your results.
37 Convert data to desired format for comparing results of the included studies.
Use statistical advise; and ideally conduct conversions in data management software
such as excel. The desired format might depend on the software used for meta-
analysis.
e.g. Review manager (free software from the Cochrane collaboration uses), CMA
(Comprehensive meta-analysis software) or STATA (Data Analysis and Statistical
Software for Professionals).
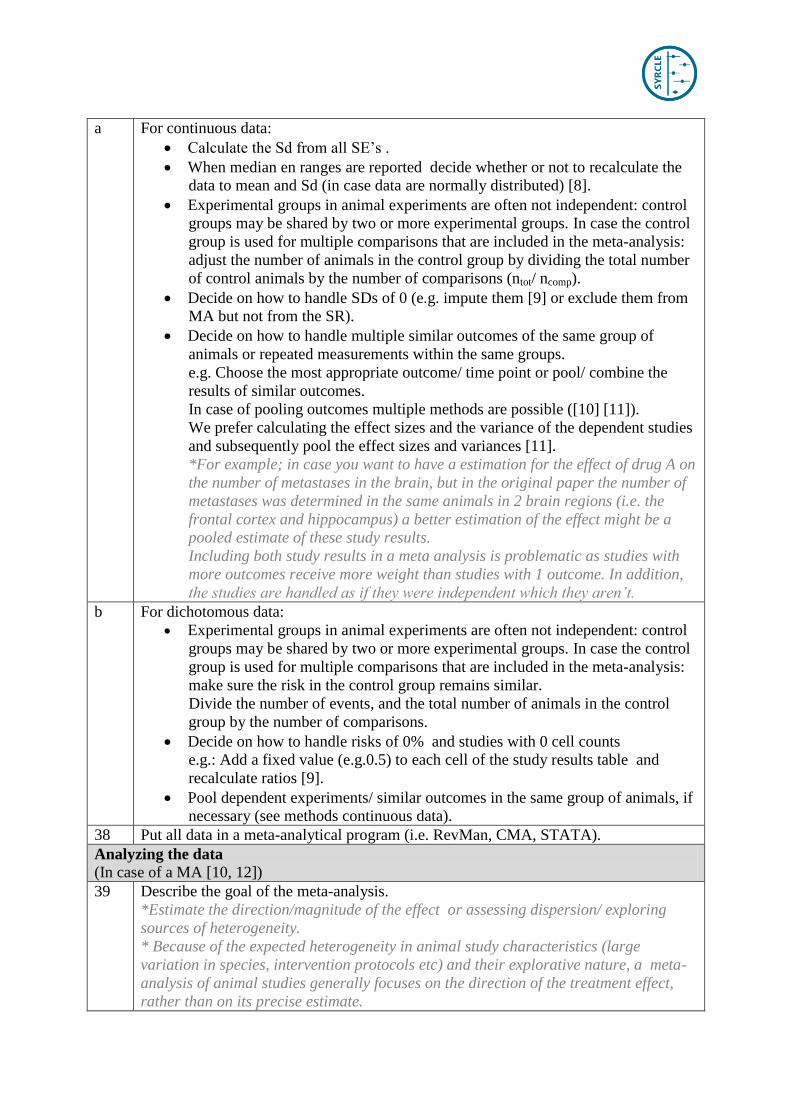
a For continuous data:
Calculate the Sd from all SE’s .
When median en ranges are reported decide whether or not to recalculate the
data to mean and Sd (in case data are normally distributed) [8].
Experimental groups in animal experiments are often not independent: control
groups may be shared by two or more experimental groups. In case the control
group is used for multiple comparisons that are included in the meta-analysis:
adjust the number of animals in the control group by dividing the total number
of control animals by the number of comparisons (ntot/ ncomp).
Decide on how to handle SDs of 0 (e.g. impute them [9] or exclude them from
MA but not from the SR).
Decide on how to handle multiple similar outcomes of the same group of
animals or repeated measurements within the same groups.
e.g. Choose the most appropriate outcome/ time point or pool/ combine the
results of similar outcomes.
In case of pooling outcomes multiple methods are possible ([10] [11]).
We prefer calculating the effect sizes and the variance of the dependent studies
and subsequently pool the effect sizes and variances [11].
*For example; in case you want to have a estimation for the effect of drug A on
the number of metastases in the brain, but in the original paper the number of
metastases was determined in the same animals in 2 brain regions (i.e. the
frontal cortex and hippocampus) a better estimation of the effect might be a
pooled estimate of these study results.
Including both study results in a meta analysis is problematic as studies with
more outcomes receive more weight than studies with 1 outcome. In addition,
the studies are handled as if they were independent which they aren’t.
b For dichotomous data:
Experimental groups in animal experiments are often not independent: control
groups may be shared by two or more experimental groups. In case the control
group is used for multiple comparisons that are included in the meta-analysis:
make sure the risk in the control group remains similar.
Divide the number of events, and the total number of animals in the control
group by the number of comparisons.
Decide on how to handle risks of 0% and studies with 0 cell counts
e.g.: Add a fixed value (e.g.0.5) to each cell of the study results table and
recalculate ratios [9].
Pool dependent experiments/ similar outcomes in the same group of animals, if
necessary (see methods continuous data).
38 Put all data in a meta-analytical program (i.e. RevMan, CMA, STATA).
Analyzing the data
(In case of a MA [10, 12])
39 Describe the goal of the meta-analysis.
*Estimate the direction/magnitude of the effect or assessing dispersion/ exploring
sources of heterogeneity.
* Because of the expected heterogeneity in animal study characteristics (large
variation in species, intervention protocols etc) and their explorative nature, a meta-
analysis of animal studies generally focuses on the direction of the treatment effect,
rather than on its precise estimate.
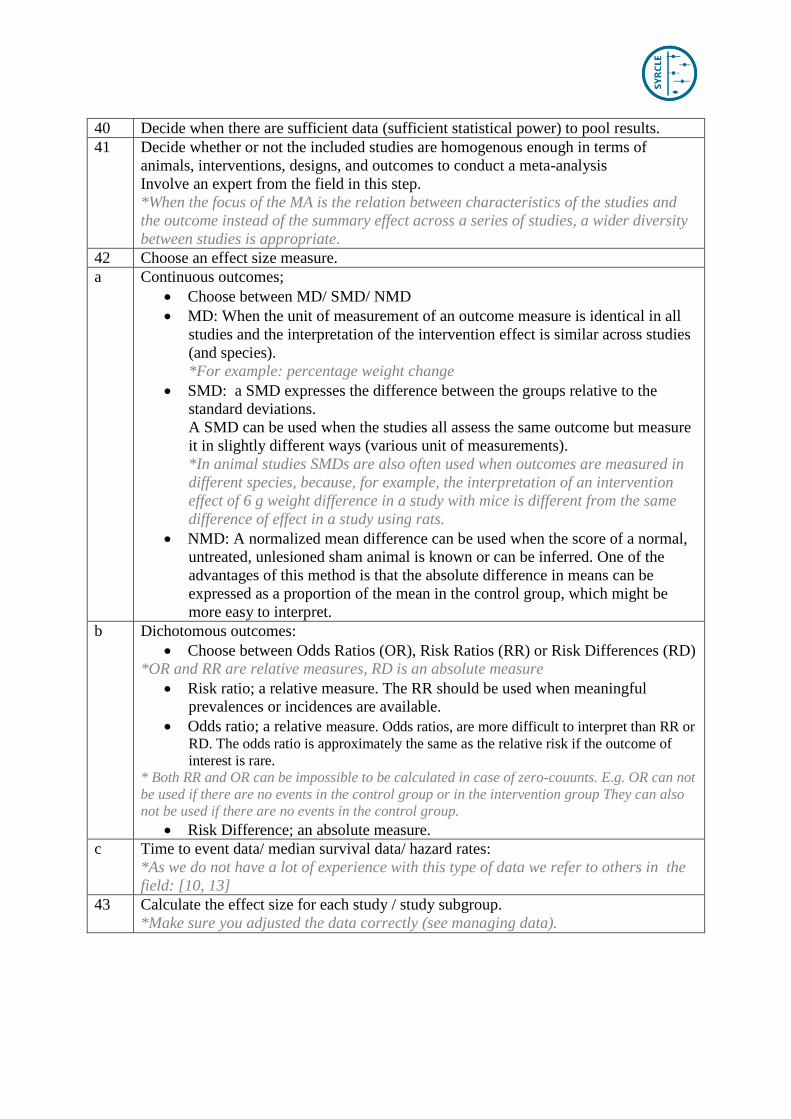
40 Decide when there are sufficient data (sufficient statistical power) to pool results.
41 Decide whether or not the included studies are homogenous enough in terms of
animals, interventions, designs, and outcomes to conduct a meta-analysis
Involve an expert from the field in this step.
*When the focus of the MA is the relation between characteristics of the studies and
the outcome instead of the summary effect across a series of studies, a wider diversity
between studies is appropriate.
42 Choose an effect size measure.
a Continuous outcomes;
Choose between MD/ SMD/ NMD
MD: When the unit of measurement of an outcome measure is identical in all
studies and the interpretation of the intervention effect is similar across studies
(and species).
*For example: percentage weight change
SMD: a SMD expresses the difference between the groups relative to the
standard deviations.
A SMD can be used when the studies all assess the same outcome but measure
it in slightly different ways (various unit of measurements).
*In animal studies SMDs are also often used when outcomes are measured in
different species, because, for example, the interpretation of an intervention
effect of 6 g weight difference in a study with mice is different from the same
difference of effect in a study using rats.
NMD: A normalized mean difference can be used when the score of a normal,
untreated, unlesioned sham animal is known or can be inferred. One of the
advantages of this method is that the absolute difference in means can be
expressed as a proportion of the mean in the control group, which might be
more easy to interpret.
b Dichotomous outcomes:
Choose between Odds Ratios (OR), Risk Ratios (RR) or Risk Differences (RD)
*OR and RR are relative measures, RD is an absolute measure
Risk ratio; a relative measure. The RR should be used when meaningful
prevalences or incidences are available.
Odds ratio; a relative measure. Odds ratios, are more difficult to interpret than RR or
RD. The odds ratio is approximately the same as the relative risk if the outcome of
interest is rare. * Both RR and OR can be impossible to be calculated in case of zero-couunts. E.g. OR can not
be used if there are no events in the control group or in the intervention group They can also
not be used if there are no events in the control group.
Risk Difference; an absolute measure.
c Time to event data/ median survival data/ hazard rates:
*As we do not have a lot of experience with this type of data we refer to others in the
field: [10, 13]
43 Calculate the effect size for each study / study subgroup.
*Make sure you adjusted the data correctly (see managing data).

44 Choose a random-effects (REM) or fixed-effects meta-analysis model (FEM).
FEM: the variation between the study results is only because of variation in
sample sizes. This assumption is reflected in the calculations of the study
weights. Larger studies receive more weight.
REM: A random-effects model assumes that the underlying effect size differ
slightly between the studies, thus the true effect size may be larger or smaller,
depending on the study characteristics. The random-effects model results in an
“mean” effect estimate, and both random error and true between study variance
are taken into account in the assigned study weights.
*Due to the nature of and diversity in animal studies (expected heterogeneity),
random-effects models is the model of choice for meta-analysis of animal studies. The
fixed-effects model is unlikely to be appropriate.
45 Specify subgroups, if applicable.
Consider which study characteristics will be examined as potential source of
heterogeneity.
Prespecify these characteristics in the protocol.
Decide when predefined subgroups are sufficiently large (sufficient statistical
power) to perform meaningful subgroup analysis.
*Subgroup analyses can be misleading, especially if subgroups are small and not pre-
specified.
*Subgroup analyses play a very important role in meta-analyses of animal studies.
Meta-analyses of animal studies are especially conducted to investigate modifying
factors influencing the effect of an intervention.
46 Calculate the summary effect, per subgroup and overall.
Consider consulting a statistician or somebody with experience in conducting
meta analyses (of animal studies).
Calculate effectsizes by hand or by using statistical packages such as RevMan:
www.ims.cochrane.org/revman/download, CMA: (Comprehensive meta-
analysis (www.meta-analysis.com), Stata (StataCorp, College Station, Texas),
R (http://www.R-project.org/).
47 Present results graphically (e.g forestplot).
48 Assess heterogeneity (variability in the results) in the meta analyses results per
subgroup and overall.
a Identify presence of statistical heterogeneity.
Inspect the forestplot visulally; check whether the direction of the effects are in
general similar and if the confidence intervals overlap sufficiently.
b Conduct a statistical test to identify heterogeneity.
Decide upon the statistical methods to assess heterogeneity (e.g. I2, Q ).
Conduct a statistical test to estimate the amount of heterogeneity.
*I2 estimates the inconsistency between the effects estimated by the individual studies
in a meta-analysis. It describes the percentage of total variation across studies that is
due to heterogeneity rather than chance, and lies between 0% and 100%. I2 = ((Q-df)/ Q) x 100%.
Q= Total amount of variation= WSS= weighted sum of squares = sum of ((deviations
of each effect size from the mean summary effect)2 * weight of the study)
Q-df= excess variation.
p-value Q= CHIDIST(Q,df)

49 Explore causes of heterogeneity and asses impact of study characteristics.
*In case of high heterogeneity; Check whether or not there are real differences with
respect to the study characteristics (animals, interventions, outcomes) that might
explain the high heterogeneity.
*In case of high heterogeneity decide whether it is sensible to pool the results at allor
only present the results per subgroup.
a Possible methods: Comparing the mean effect across subgroups:
In case of 2 groups (group A; Group B):
Check the possible overlap between CI of the subgroups:
Calculate the confidence interval of the difference
X1-X2 +/- 1.96 * SEpooled
SEpooled = SQRT (Sd12/n1 * Sd2
2/n2)
Z-test (in case of random effects model) [14].
Difference= Σ( ES* weight)a - Σ( ES* weight)b
Zdiff= diff/ SEdiff
SEdiff = SQRT (1/Σweighta +1/Σweightb)
P= (1- (NORMSDIST(ABS(Zdiff)))) *2
Partitioning the total amount of variance with the Q test based on the analysis
of variance [14].
Calculate Qa, Qb, Qwithin, in order to estimate Qbetween
Q= Σ weight * ES2 – (Σ (weight * ES)
2) / Σ weight)
Qbetween= Qtotal- Qwithin
Qwithin= Qa + Qb
P= CHIDIST(Qbetween, df)
Partitioning the total amount of variance with the Q test for heterogeneity
(Subgroups are treated here as studies) [14].
Calculate Q
Q= Σ weight * ES2 – (Σ (weight * ES)
2) / Σ weight)
P= CHIDIST(Q, df)
In case of more than 2 groups:
The Q test based on the analysis of variance or the Q test for heterogeneity should be
used (option 3 and 4)
*Adjust the p value when comparing more than 2 groups (for example multiply p value
by the number of comparisons.
b Possible methods: Assessing the relationship between (multiple) study level covariates
and effect size.
Only use meta regression in case of a sufficient number of studies (ideal; at
least 10 studies / continuous covariate, or per covariate-level).
Use methods described by: [10, 15].
* Important to realize that covariates are generally not randomised across the groups,
and spurious relationships can be the result. Be careful with the interpretation.
Conduct a sensitivity analysis.
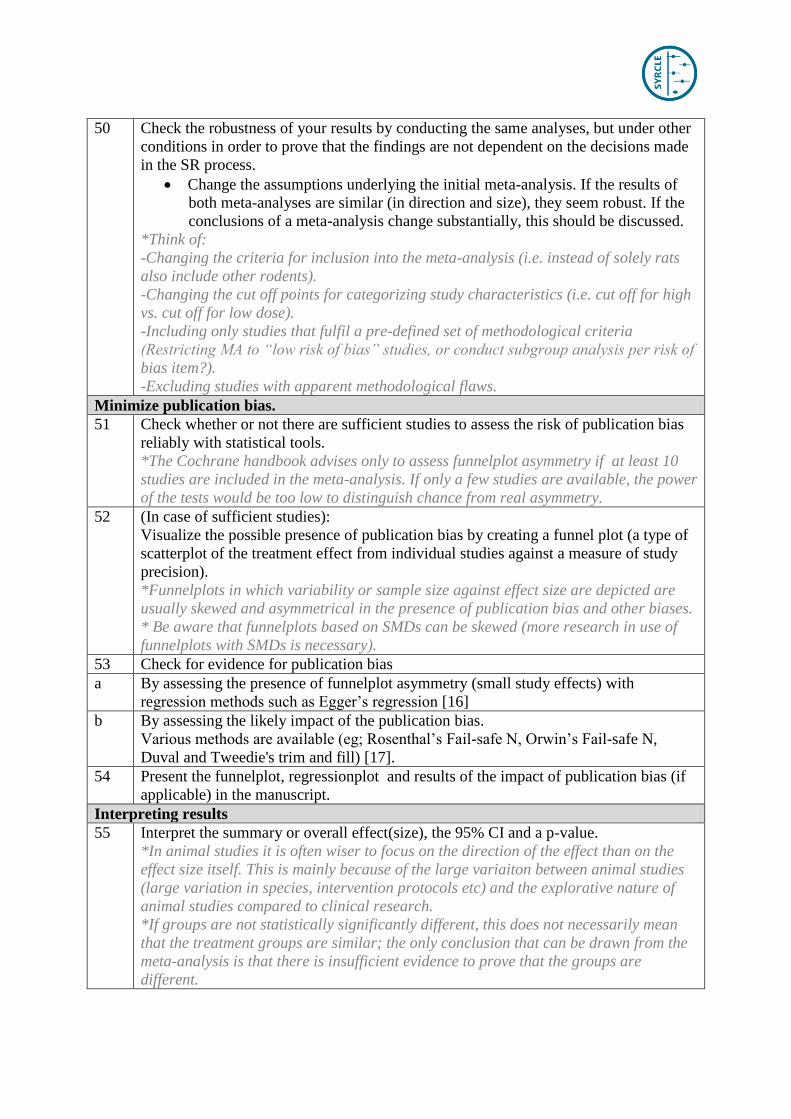
50 Check the robustness of your results by conducting the same analyses, but under other
conditions in order to prove that the findings are not dependent on the decisions made
in the SR process.
Change the assumptions underlying the initial meta-analysis. If the results of
both meta-analyses are similar (in direction and size), they seem robust. If the
conclusions of a meta-analysis change substantially, this should be discussed.
*Think of:
-Changing the criteria for inclusion into the meta-analysis (i.e. instead of solely rats
also include other rodents).
-Changing the cut off points for categorizing study characteristics (i.e. cut off for high
vs. cut off for low dose).
-Including only studies that fulfil a pre-defined set of methodological criteria
(Restricting MA to “low risk of bias” studies, or conduct subgroup analysis per risk of
bias item?).
-Excluding studies with apparent methodological flaws.
Minimize publication bias.
51 Check whether or not there are sufficient studies to assess the risk of publication bias
reliably with statistical tools.
*The Cochrane handbook advises only to assess funnelplot asymmetry if at least 10
studies are included in the meta-analysis. If only a few studies are available, the power
of the tests would be too low to distinguish chance from real asymmetry.
52 (In case of sufficient studies):
Visualize the possible presence of publication bias by creating a funnel plot (a type of
scatterplot of the treatment effect from individual studies against a measure of study
precision).
*Funnelplots in which variability or sample size against effect size are depicted are
usually skewed and asymmetrical in the presence of publication bias and other biases.
* Be aware that funnelplots based on SMDs can be skewed (more research in use of
funnelplots with SMDs is necessary).
53 Check for evidence for publication bias
a By assessing the presence of funnelplot asymmetry (small study effects) with
regression methods such as Egger’s regression [16]
b By assessing the likely impact of the publication bias.
Various methods are available (eg; Rosenthal’s Fail-safe N, Orwin’s Fail-safe N,
Duval and Tweedie's trim and fill) [17].
54 Present the funnelplot, regressionplot and results of the impact of publication bias (if
applicable) in the manuscript.
Interpreting results
55 Interpret the summary or overall effect(size), the 95% CI and a p-value.
*In animal studies it is often wiser to focus on the direction of the effect than on the
effect size itself. This is mainly because of the large variaiton between animal studies
(large variation in species, intervention protocols etc) and the explorative nature of
animal studies compared to clinical research.
*If groups are not statistically significantly different, this does not necessarily mean
that the treatment groups are similar; the only conclusion that can be drawn from the
meta-analysis is that there is insufficient evidence to prove that the groups are
different.

56 Interpret the results of subgroup analysis
Interpret the effect(size/ direction) and the 95% CI in each group.
Take into account whether the effect observed is practically relevant and the
difference between the groups is statistically significant [18].
*Subgroups in meta-analyses of animal studies are often very small and remain quite
heterogeneous as multiple characteristics in animal studies vary. Results of subgroup
analyses should therefore be used to generate rather than test hypotheses. Beware of
co-linearity.
57 Interpret the extent of heterogeneity.
Consider whether subgroup analysis explained heterogeneity.
*The aim of animal studies is explorative, so a substantial amount of heterogeneity
can be expected.
58 Interpret the findings from the sensitivity analysis.
*Are the results of the analysis robust? Can your methodological approach be justified?
59 Consider the effects of the risk of bias analysis on the study results.
*Is it plausible that the effect of the meta-analysis is influenced by the observed risk of
bias? Or what are the consequences of the results of the risk of bias analysis?
60 Describe the effects of reporting quality of important methodological details.
61 Interpret the evaluation of possible publication bias.
*Is it to be expected that there is a overestimation or underestimation of the overall
effect size?
62 Assess the generalisability and translatability of the results.
Check if preclinical conditions match the clinical setting with regard to the
population/ animal model, the intervention, the outcomes.
Check if the direction of effects between species is consistent.
*use the GRADE approach for animal studies for help by assessing the quality of the
evidence from preclinical animal intervention studies.
Drawing Conclusions.
63 Summarise main results.
64 Pay attention to the translational value of the results.
*It might be useful to structure the discussion regarding the main results according to
the GRADE factors (inconsistency, imprecision, indirectness, risk of bias, publication
bias) [19]
65 Describe possible implications for the clinical field (clinical relevance).
*It might be useful to structure the discussion regarding the main results according to
the GRADE factors (inconsistency, imprecision, indirectness, risk of bias, publication
bias) [19]
66 Describe implications for future research.
*Are additional animal studies necessary (is there sufficient evidence, is the quality of
the evidence sufficient?)
Based on the evidence from animal studies, could a clinical trial be the next step?
1. de Vries, R.B.M., et al., A protocol format for the preparation, registration and publication of
systematic reviews of animal intervention studies Evidence-based Preclinical Medicine.
Evidence-based Preclinical Medicine, 2015. 1(2): p. 1-9.
2. Leenaars, M., et al., A step-by-step guide to systematically identify all relevant animal studies.
Lab Anim, 2012. 46(1): p. 24-31.

3. de Vries, R.B., et al., Updated version of the Embase search filter for animal studies. Lab
Anim, 2014. 48(1): p. 88.
4. Hooijmans, C.R., et al., Enhancing search efficiency by means of a search filter for finding all
studies on animal experimentation in PubMed. Lab Anim, 2010. 44(3): p. 170-5.
5. Hooijmans, C.R., et al., SYRCLE's risk of bias tool for animal studies. BMC Med Res
Methodol, 2014. 14: p. 43.
6. Macleod, M.R., et al., Evidence for the efficacy of NXY-059 in experimental focal cerebral
ischaemia is confounded by study quality. Stroke, 2008. 39(10): p. 2824-9.
7. Higgins, J.P.T. and J.D. Deeks, Chapter 7: Selecting studies and collecting data, in Cochrane
Handbook for Systematic Reviews of Interventions. 2008, John Wiley and Sons Ltd: West
Sussex. p. 151-185.
8. Hozo, S.P., B. Djulbegovic, and I. Hozo, Estimating the mean and variance from the median,
range, and the size of a sample. BMC Med Res Methodol, 2005. 5: p. 13.
9. Higgins, J.P.T., J.J. Deeks, and D.G. Altman, Chapter 16: Special topics in statistics., in
Cochrane Handbook for Systematic Reviews of Interventions, G.S. Higgins JPT, Editor. 2011,
The Cochrane Collaboration.
10. Vesterinen, H.M., et al., Meta-analysis of data from animal studies: A practical guide. J
Neurosci Methods, 2013. 221C: p. 92-102.
11. Borenstein, M., et al., Chapter 24: Multiple Outcomes or Time-Points within a Study, in
Introduction to Meta-Analysis. 2009, John Wiley & Sons, Ltd.
12. Hooijmans, C.R., et al., Meta-analyses of animal studies: an introduction of a valuable
instrument to further improve healthcare. ILAR J, 2014. 55(3): p. 418-26.
13. Raave, R., et al., Drug delivery systems for ovarian cancer treatment: a systematic review and
meta-analysis of animal studies. PeerJ, 2015. 3: p. e1489.
14. Borenstein, M., et al., Chaper 19: Subgroup analyses, in Introduction to Meta-Analysis. 2009,
John Wiley & Sons, Ltd.
15. Borenstein, M., et al., Chapter 20: Meta-regression, in Introduction to Meta-Analysis. 2009,
John Wiley & Sons, Ltd.
16. Egger, M., et al., Bias in meta-analysis detected by a simple, graphical test. BMJ, 1997.
315(7109): p. 629-34.
17. Borenstein, M., et al., Chapter 30: Publication bias, in Introduction to Meta-Analysis. 2009,
John Wiley & Sons, Ltd.
18. Oxman, A.D. and G.H. Guyatt, A consumer's guide to subgroup analyses. Ann Intern Med,
1992. 116(1): p. 78-84.
19. Hooijmans, C.R., et al., Use of GRADE to assess the certainty in the evidence from preclinical
animal intervention studies. 2016.