Embed Size (px)
Citation preview
WP/16/123
Syria’s Conflict Economy
Jeanne Gobat and Kristina Kostial
IMF Working Papers describe research in progress by the author(s) and are published to elicit comments and to encourage debate. The views expressed in IMF Working Papers are those of the author(s) and do not necessarily represent the views of the IMF, its Executive Board, or IMF management.
© 2016 International Monetary Fund WP/16/123
IMF Working Paper
Middle East and Central Asia Department
Syria’s Conflict Economy1
Prepared by Jeanne Gobat and Kristina Kostial
Authorized for distribution by Annalisa Fedelino
June 2016
Abstract
Five years into the ongoing and tragic conflict, the paper analyzes how Syria’s economy and its people have been affected and outlines the challenges in rebuilding the economy. With extreme limitations on information, the findings of the paper are subject to an extraordinary degree of uncertainty. The key messages are: (1) that the devastating civil war has set the country back decades in terms of economic, social and human development. Syria’s GDP today is less than half of what it was before the war started and it could take two decades or more for Syria to return to its pre-conflict GDP levels; and that (2) while reconstructing damaged physical infrastructure will be a monumental task, rebuilding Syria’s human and social capital will be an even greater and lasting challenge.
JEL Classification Numbers: N15, O5, O053
Keywords: Macroeconomics, Economic Development, Syria Authors’ E-Mail Addresses: [email protected]; [email protected]
1 The authors would like to thank Daniela Gressani and Adnan Mazarei for their suggestions along with encouragement; Gaelle Pierre and World Bank colleagues Ibrahim Al-Ghelaiqah, Eric Le Borgne, Janet Lynn Minatelli, Victor Mosoti, Raja Rehan Arshad, and Sally Zgheib for their thorough comments and the Bank’s contributions on the initial damage assessments and sectoral analysis. The authors also would like to express their gratitude to Ramsey Andrawis and Gregory Basile for their excellent research assistance and Cecilia Pineda for her superb administrative support. Any remaining errors are our own.
IMF Working Papers describe research in progress by the author(s) and are published to elicit comments and to encourage debate. The views expressed in IMF Working Papers are those of the author(s) and do not necessarily represent the views of the IMF, its Executive Board, or IMF management.

2
Contents Page
Abstract ......................................................................................................................................1
Syria’s Conflict Economy ..........................................................................................................3
I. Before the Conflict .................................................................................................................3
II. Five Years Into the Conflict ..................................................................................................5 A. Syria’s People ...................................................................................................................6 B. Syria’s Economy ...............................................................................................................9
III. What are the Challenges in Rebuilding Syria? ..................................................................19 A. Physical and Human Capital ..........................................................................................20 B. Economic Reforms .........................................................................................................22
IV. Conclusion .........................................................................................................................23
References ................................................................................................................................25 Boxes 1. Syria’s Divisions ....................................................................................................................6 2. Damage Assessment for Selected Cities/Sectors .................................................................21 Figure 1. Exports and Imports by Commodity 2010 Versus 2014 ......................................................15 Tables 1. Key Economic Indicators ......................................................................................................9 2. Real GDP and Composition ................................................................................................10 Appendix Tables 3. Selected Economic Indicators ..............................................................................................27 4. Balance of Payments 2008–15 .............................................................................................28
3
SYRIA’S CONFLICT ECONOMY
Five years into the tragic and still ongoing conflict, this paper takes stock of its impact and analyzes how Syria’s economy and its people have been affected. It also outlines challenges Syria faces in rebuilding its economy. With extreme limitations on information, our findings are subject to an extraordinary degree of uncertainty. As the government publishes few economic data, the paper draws heavily on third-party information.
The key messages are: (1) that the devastating civil war has set the country back by decades in terms of economic, social, and human development. Syria’s GDP today is less than half of what it was before the war started and it could take two decades or more for Syria to return to its pre-conflict GDP levels; and (2) that, while reconstructing damaged physical infrastructure will be a monumental task, rebuilding Syria’s human capital and social cohesion will be an even greater and lasting challenge, with half of the population displaced, the social fabric torn, many children no longer schooled, and many people of all ages traumatized by the war.
I. BEFORE THE CONFLICT
1. In the early 2000s, Syria embarked on a gradual economic liberalization to spur growth. The reforms were motivated, in part, by the challenges posed by the decline in oil production and proven oil reserves, and the effect that had on fiscal sustainability.2 Structural reforms were aimed at deregulating and diversifying the tightly-managed, state-focused economy, while phasing out energy subsidies and streamlining the tax regime. In 2004, private banks were allowed to begin operating and in 2009 the stock market re-opened after more than 40 years. Syria requested to become a member of the WTO in 2001, and signed a free trade agreement with Turkey in 2007. Some elements of the structural reform agenda were supported through IMF technical assistance, including strengthening banking supervision and regulation, modernizing the monetary framework, developing a government debt market, strengthening and streamlining revenue administration, and improving public financial management.3
2. The economy was stable. Inflation was low and growth robust (non-oil growth averaged 4.4 percent during 2000–09). While the public sector remained dominant, fiscal deficits were manageable with public debt standing at 31 percent of GDP at the end of 2009. The current account was estimated to be largely in balance and international reserves were comfortable at more than nine months of imports of goods and services at the end of 2010.
2 IMF Country Report No. 10/86 and IMF Country Report No. 09/55.
3 The 2008 financial sector assessment (FSAP) identified financial sector reform priorities in the period ahead. These included the need to audit and restructure state banks; build up regulatory and supervisory capacity and strengthen enforcement of regulations; and enhance the monetary policy framework by modernizing the central bank and developing indirect monetary instruments.
4
Foreign direct investment at about 1.3 percent of GDP on average during 2000–09, focused on pharmaceuticals, food processing, and textiles.
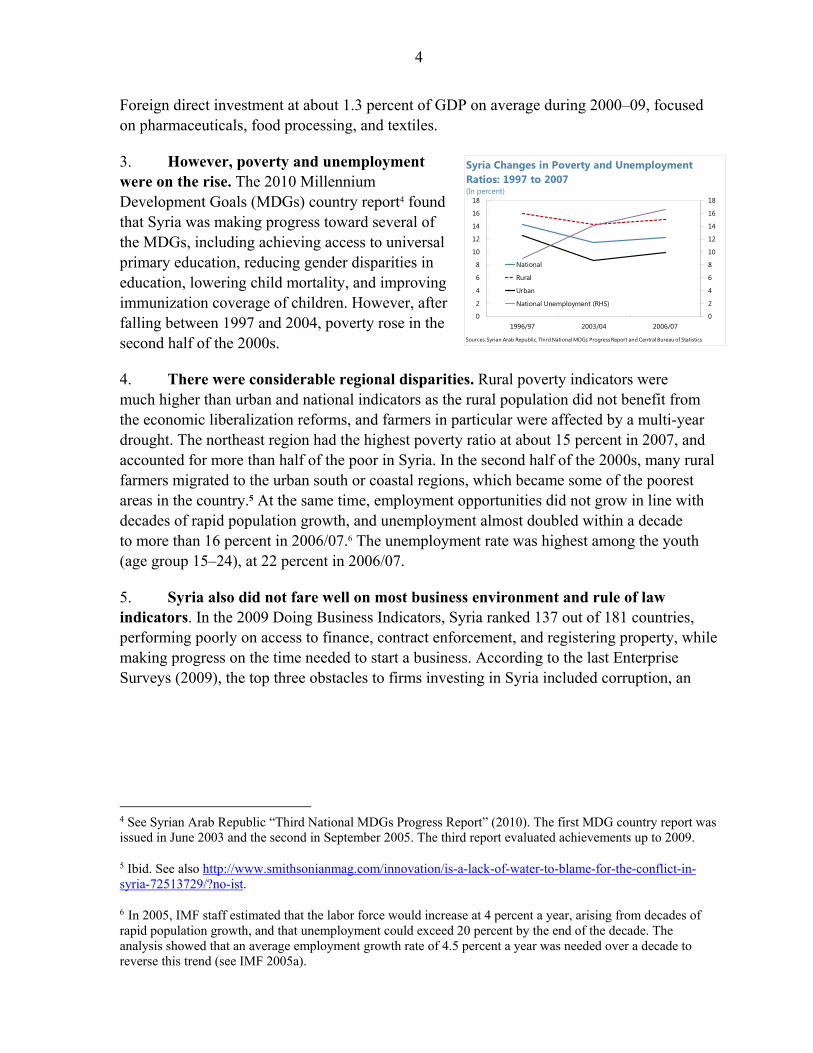
3. However, poverty and unemployment were on the rise. The 2010 Millennium Development Goals (MDGs) country report4 found that Syria was making progress toward several of the MDGs, including achieving access to universal primary education, reducing gender disparities in education, lowering child mortality, and improving immunization coverage of children. However, after falling between 1997 and 2004, poverty rose in the second half of the 2000s.
4. There were considerable regional disparities. Rural poverty indicators were much higher than urban and national indicators as the rural population did not benefit from the economic liberalization reforms, and farmers in particular were affected by a multi-year drought. The northeast region had the highest poverty ratio at about 15 percent in 2007, and accounted for more than half of the poor in Syria. In the second half of the 2000s, many rural farmers migrated to the urban south or coastal regions, which became some of the poorest areas in the country.5 At the same time, employment opportunities did not grow in line with decades of rapid population growth, and unemployment almost doubled within a decade to more than 16 percent in 2006/07.6 The unemployment rate was highest among the youth (age group 15–24), at 22 percent in 2006/07.
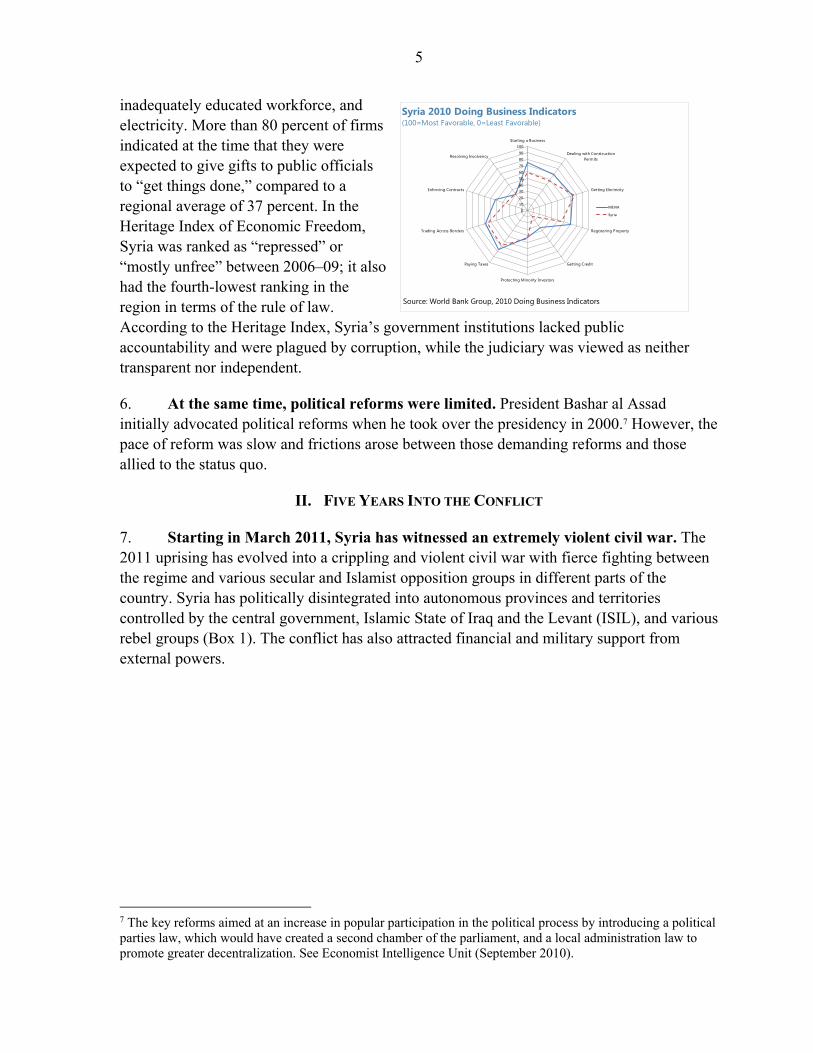
5. Syria also did not fare well on most business environment and rule of law indicators. In the 2009 Doing Business Indicators, Syria ranked 137 out of 181 countries, performing poorly on access to finance, contract enforcement, and registering property, while making progress on the time needed to start a business. According to the last Enterprise Surveys (2009), the top three obstacles to firms investing in Syria included corruption, an
4 See Syrian Arab Republic “Third National MDGs Progress Report” (2010). The first MDG country report was issued in June 2003 and the second in September 2005. The third report evaluated achievements up to 2009.
5 Ibid. See also http://www.smithsonianmag.com/innovation/is-a-lack-of-water-to-blame-for-the-conflict-in-syria-72513729/?no-ist.
6 In 2005, IMF staff estimated that the labor force would increase at 4 percent a year, arising from decades of rapid population growth, and that unemployment could exceed 20 percent by the end of the decade. The analysis showed that an average employment growth rate of 4.5 percent a year was needed over a decade to reverse this trend (see IMF 2005a).
0
2
4
6
8
10
12
14
16
18
0
2
4
6
8
10
12
14
16
18
1996/97 2003/04 2006/07
National
Rural
Urban
National Unemployment (RHS)
Syria Changes in Poverty and Unemployment Ratios: 1997 to 2007(In percent)
Sources: Syrian Arab Republic, Third National MDGs Progress Report and Central Bureau of Statistics
5
inadequately educated workforce, and electricity. More than 80 percent of firms indicated at the time that they were expected to give gifts to public officials to “get things done,” compared to a regional average of 37 percent. In the Heritage Index of Economic Freedom, Syria was ranked as “repressed” or “mostly unfree” between 2006–09; it also had the fourth-lowest ranking in the region in terms of the rule of law. According to the Heritage Index, Syria’s government institutions lacked public accountability and were plagued by corruption, while the judiciary was viewed as neither transparent nor independent.
6. At the same time, political reforms were limited. President Bashar al Assad initially advocated political reforms when he took over the presidency in 2000.7 However, the pace of reform was slow and frictions arose between those demanding reforms and those allied to the status quo.
II. FIVE YEARS INTO THE CONFLICT
7. Starting in March 2011, Syria has witnessed an extremely violent civil war. The 2011 uprising has evolved into a crippling and violent civil war with fierce fighting between the regime and various secular and Islamist opposition groups in different parts of the country. Syria has politically disintegrated into autonomous provinces and territories controlled by the central government, Islamic State of Iraq and the Levant (ISIL), and various rebel groups (Box 1). The conflict has also attracted financial and military support from external powers.
7 The key reforms aimed at an increase in popular participation in the political process by introducing a political parties law, which would have created a second chamber of the parliament, and a local administration law to promote greater decentralization. See Economist Intelligence Unit (September 2010).
0
10
20
30
40
50
60
70
80
90
100
Starting a Business
Dealing with ConstructionPermits
Getting Electricity
Registering Property
Getting Credit
Protecting Minority Investors
Paying Taxes
Trading Across Borders
Enforcing Contracts
Resolving Insolvency
MENA
Syria
Syria 2010 Doing Business Indicators(100=Most Favorable, 0=Least Favorable)
Source: World Bank Group, 2010 Doing Business Indicators

6
Box 1. Syria’s Divisions
Syria is deeply fragmented. According to the Syrian Observatory for Human Rights, ISIL controls about half of Syria’s territory (by land mass), in particular the resource-rich north and the eastern/central part of the country. The Kurds hold about 5 percent of the territory (by land mass) in the northeast and a small pocket in the northwest. The government controls most of the west—the coastal area and some parts of the south. These areas are more densely populated, with the west and Damascus accounting for about 55 to 70 percent of the population. There are also parts that are held by other anti-regime forces.
A. Syria’s People
Syria’s people are battling the crippling effects of the conflict, including widespread unemployment and poverty, homelessness, food and medicine shortages, and destruction of public services and infrastructure. Children have been profoundly affected by the war. 8. The conflict has turned into a humanitarian disaster. The population of Syria (which stood at about 22.1 million in 2010) is estimated to have shrunk by at least 20 percent since March 2011. According to the United Nations High Commission for Refugees (UNHCR), more than 250,000 people have been killed and more than 800,000 have been injured as a result of the fighting. As of February 2016, UNHCR reports that about 4.7 million people have fled to Syria’s immediate neighbors—Iraq, Jordan, Lebanon, and Turkey.8 Almost 900,000 refugees had declared political asylum in the EU by December 2015.9 At the same time, the United Nations Office for the Coordination of Humanitarian Affairs (OCHA) reports that there are 7.6 million internally displaced people
8 The numbers are likely higher than those reported by UNHCR, as many Syrians with financial means are not registered with UNHCR and also might have moved to other countries in the region.
9 http://data.unhcr.org/syrianrefugees/regional.php.
7
within Syria, with most having relocated to the coastal region or Damascus, both of which are under government control.
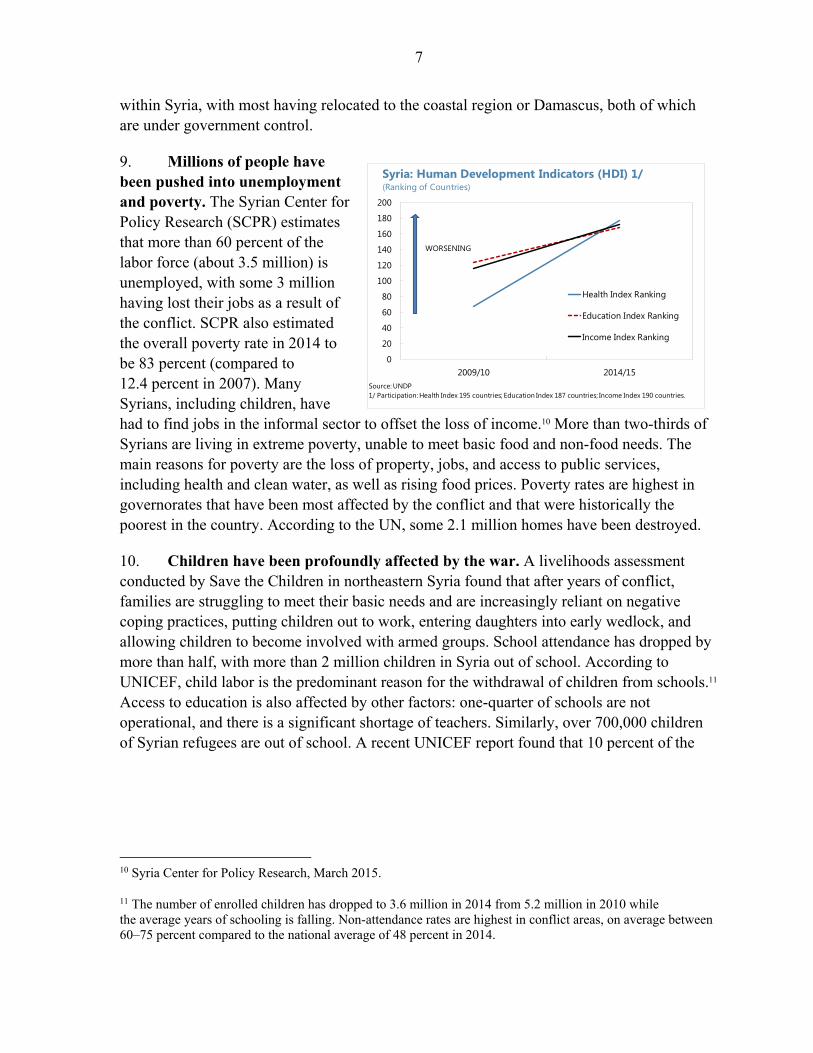
9. Millions of people have been pushed into unemployment and poverty. The Syrian Center for Policy Research (SCPR) estimates that more than 60 percent of the labor force (about 3.5 million) is unemployed, with some 3 million having lost their jobs as a result of the conflict. SCPR also estimated the overall poverty rate in 2014 to be 83 percent (compared to 12.4 percent in 2007). Many Syrians, including children, have had to find jobs in the informal sector to offset the loss of income.10 More than two-thirds of Syrians are living in extreme poverty, unable to meet basic food and non-food needs. The main reasons for poverty are the loss of property, jobs, and access to public services, including health and clean water, as well as rising food prices. Poverty rates are highest in governorates that have been most affected by the conflict and that were historically the poorest in the country. According to the UN, some 2.1 million homes have been destroyed.
10. Children have been profoundly affected by the war. A livelihoods assessment conducted by Save the Children in northeastern Syria found that after years of conflict, families are struggling to meet their basic needs and are increasingly reliant on negative coping practices, putting children out to work, entering daughters into early wedlock, and allowing children to become involved with armed groups. School attendance has dropped by more than half, with more than 2 million children in Syria out of school. According to UNICEF, child labor is the predominant reason for the withdrawal of children from schools.11 Access to education is also affected by other factors: one-quarter of schools are not operational, and there is a significant shortage of teachers. Similarly, over 700,000 children of Syrian refugees are out of school. A recent UNICEF report found that 10 percent of the
10 Syria Center for Policy Research, March 2015.
11 The number of enrolled children has dropped to 3.6 million in 2014 from 5.2 million in 2010 while the average years of schooling is falling. Non-attendance rates are highest in conflict areas, on average between 60–75 percent compared to the national average of 48 percent in 2014.
0
20
40
60
80
100
120
140
160
180
200
2009/10 2014/15
Health Index Ranking
Education Index Ranking
Income Index Ranking
Syria: Human Development Indicators (HDI) 1/(Ranking of Countries)
Source: UNDP1/ Participation: Health Index 195 countries; Education Index 187 countries; Income Index 190 countries.
WORSENING
8
3.7 million Syrian children that have been born since the conflict began in 2011 are born as refugees.12
11. Health conditions have dramatically worsened. According to SCPR (updating UNDP estimates of 2013), life expectancy has declined by 20 years within a span of four years (to 56 years in 2014, down from 76 years in 2010). Health clinics have been closed; health services severely curtailed; about one-fifth of all primary health care facilities are not functioning and another one-fifth are functioning at limited levels; and half of the country’s hospitals have been destroyed. The ratio of doctors to the overall population has declined to 1:4,000 in 2014,13 down from 1:661 in 2010. The collapse of the domestic pharmaceuticals industry has resulted in a scarcity of medicine, thereby precluding access to treatment for treatable and chronic diseases, especially among the poor. Vaccination rates for children have fallen to 50–70 percent from 99–100 percent before the crisis. And diseases that had long disappeared in Syria such as polio, measles, and typhoid have reappeared. Unsafe drinking water and poor hygiene practices are further increasing the risk of infections and illnesses among children. According to OCHA, about two thirds of children in Syria are without safe and reliable water.14 Only one third of Syria’s sewage is now treated.
12. There is little food security.15 People are having difficulties buying essential foods to survive, because of the contraction in agricultural output and high food prices. UNICEF estimates that more than 4 million children and women are in need of nutritional assistance. Since mid-2014, the government has cut price subsidies on bread, rice, sugar, and water, as well as closed down government-run bakeries in opposition held areas.16
13. Access to water and electricity has also been curtailed. The conflict has destroyed significant water infrastructure. In some cases, various groups have used tactical water and power cuts to reduce service provision to targeted population areas. Alternative service providers have sprung up to fill gaps in service delivery, including by selling drinking water
12 UNICEF (2016a and 2016b). Due to regional efforts, including through targeted programs in regional refugee and resilience plans (3RP), access to education among Syrian refugees in Egypt, Iraq, Jordan, Lebanon, and Turkey has increased from 33 percent in early 2015 to 53 percent late 2015.
13 According to UNICEF (2016b), the situation has dramatically worsened in particular in areas where the conflict has intensified since late 2015. For instance, only ten pediatricians are left in Aleppo to take care of an estimated 140,000 children.
14 OCHA (2016).
15 See July 2015, “Crop and Food Security Assessment Mission to the Syrian Arab Republic,” Food and Agricultural Organization (FAO) and World Food Program (WFP).
16 See http://carnegieendowment.org/sada/?fa=58941.
9
and electricity generation, but they typically charge high prices. The government has issued rules attempting to control prices but has not been able to enforce them.
14. Funding for, and access to, humanitarian aid poses a persistent challenge for relief agencies in Syria. The UN’s appeal for its Syria response plan has been underfunded over the past four years. OCHA and SCPR estimate that, as of early 2016, 13.5 million people in Syria are in need of humanitarian aid, including six million children. Of these, 4.6 million people are in hard-to-reach areas, including close to 500,000 people in besieged areas. At the same time, foreign NGOs have been somewhat restricted in their assistance, as they cannot distribute aid without formal authorization by the government and also face other restrictions in channeling aid, including through formal financial channels as a result of the international sanctions.17
B. Syria’s Economy
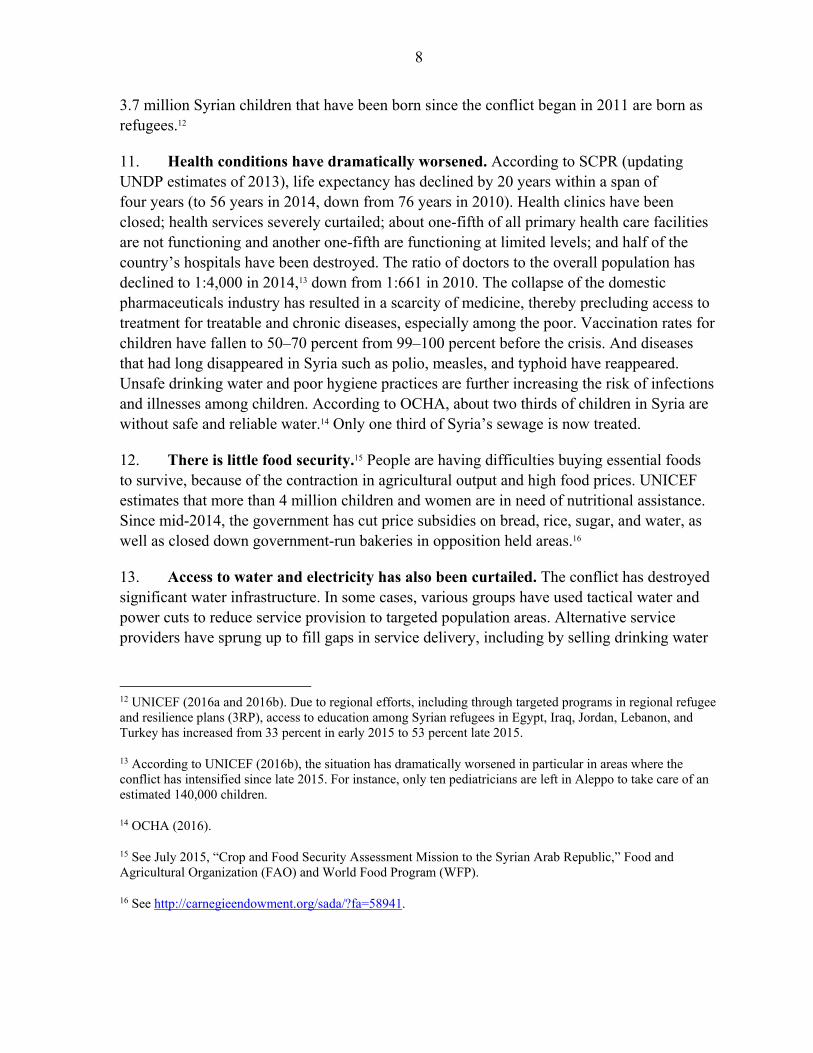
This section provides a rudimentary and tentative macroeconomic analysis of the impact of the war on the Syrian economy between 2010 and 2015. Relying heavily on third party sources, the analysis is based on scattered information and strong assumptions (which are spelled out in the text), particularly about how the war and economic sanctions are impacting the economy, the central bank’s balance sheet, and public finances. Although there has been major administrative fragmentation since the onset of the war, we present the macroeconomic framework for Syria as one country (Table 1; see Appendix for greater details on developments in the macro framework).
17 Yazigi (2014) and Thompson (2015).
Table 1. Syrian Arab Republic: Key Economic Indicators
Est.2008 2009 2010 2011 2012 2013 2014 2015
Real SectorReal GDP (change in percent) 4 6 3 -6 -21 -17 -17 -15
Oil 0 0 3 -10 -29 -14 -23 -70Non-oil 5 7 3 -5 -20 -18 -16 -9
Nominal GDP ($ billions) 1/ 53 54 60 59 42 30 21 14Overall unemployment rate (in percent) 11 8 9 15 ... ... 60 ...
Prices (change in percent)GDP deflator 16 -3 7 8 22 46 18 31CPI inflation (period average) 15 3 4 5 37 90 29 26
Central government finances (in percent of GDP)Revenue 20 24 21 15 14 9 7 6Expenditure 23 27 29 30 30 28 29 30Overall balance -3 -3 -8 -16 -16 -18 -22 -24Gross public debt 37 31 30 38 64 86 119 150
Balance of paymentsCurrent account balance (in percent of GDP) 0 -1 1 -4 -9 -21 -28 -35Official Gross foreign assets (in billions of U.S. dollars) 17 17 21 20 12 8 5 1(in months of imports of GNFS) 11 13 12 12 9 6 4 1
Exchange rateOfficial nominal exchange rate (LS/$, average) 47 47 46 48 65 109 154 260Parallel market nominal exchange rate (LS/$, average) 47 47 46 48 80 150 179 297
Sources: Syrian authorities; Syrian Center for Policy Research, World Bank, and Fund staff estimates and projections.
Proj.
10
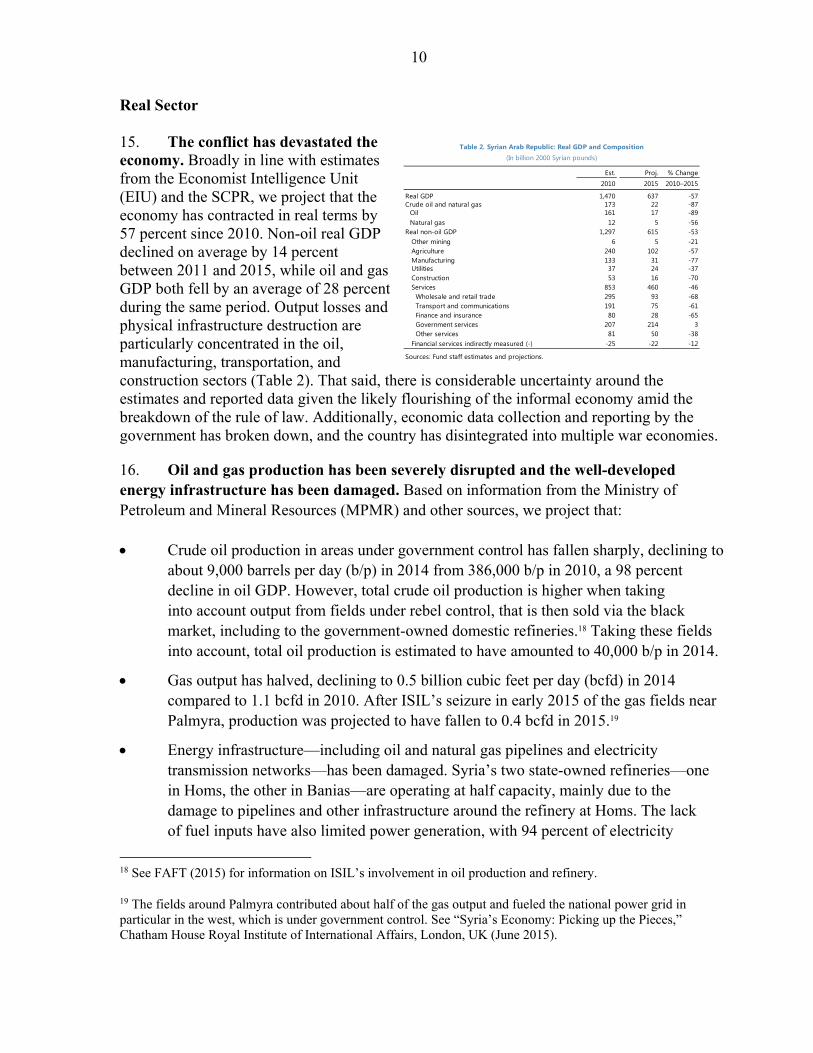
Real Sector 15. The conflict has devastated the economy. Broadly in line with estimates from the Economist Intelligence Unit (EIU) and the SCPR, we project that the economy has contracted in real terms by 57 percent since 2010. Non-oil real GDP declined on average by 14 percent between 2011 and 2015, while oil and gas GDP both fell by an average of 28 percent during the same period. Output losses and physical infrastructure destruction are particularly concentrated in the oil, manufacturing, transportation, and construction sectors (Table 2). That said, there is considerable uncertainty around the estimates and reported data given the likely flourishing of the informal economy amid the breakdown of the rule of law. Additionally, economic data collection and reporting by the government has broken down, and the country has disintegrated into multiple war economies.
16. Oil and gas production has been severely disrupted and the well-developed energy infrastructure has been damaged. Based on information from the Ministry of Petroleum and Mineral Resources (MPMR) and other sources, we project that:
Crude oil production in areas under government control has fallen sharply, declining to about 9,000 barrels per day (b/p) in 2014 from 386,000 b/p in 2010, a 98 percent decline in oil GDP. However, total crude oil production is higher when taking into account output from fields under rebel control, that is then sold via the black market, including to the government-owned domestic refineries.18 Taking these fields into account, total oil production is estimated to have amounted to 40,000 b/p in 2014.
Gas output has halved, declining to 0.5 billion cubic feet per day (bcfd) in 2014 compared to 1.1 bcfd in 2010. After ISIL’s seizure in early 2015 of the gas fields near Palmyra, production was projected to have fallen to 0.4 bcfd in 2015.19
Energy infrastructure—including oil and natural gas pipelines and electricity transmission networks—has been damaged. Syria’s two state-owned refineries—one in Homs, the other in Banias—are operating at half capacity, mainly due to the damage to pipelines and other infrastructure around the refinery at Homs. The lack of fuel inputs have also limited power generation, with 94 percent of electricity
18 See FAFT (2015) for information on ISIL’s involvement in oil production and refinery.
19 The fields around Palmyra contributed about half of the gas output and fueled the national power grid in particular in the west, which is under government control. See “Syria’s Economy: Picking up the Pieces,” Chatham House Royal Institute of International Affairs, London, UK (June 2015).
Table 2. Syrian Arab Republic: Real GDP and Composition(In billion 2000 Syrian pounds)
Est. % Change2010 2015 2010–2015
Real GDP 1,470 637 -57Crude oil and natural gas 173 22 -87
Oil 161 17 -89Natural gas 12 5 -56
Real non-oil GDP 1,297 615 -53 Other mining 6 5 -21 Agriculture 240 102 -57 Manufacturing 133 31 -77 Utilities 37 24 -37 Construction 53 16 -70 Services 853 460 -46 Wholesale and retail trade 295 93 -68 Transport and communications 191 75 -61 Finance and insurance 80 28 -65 Government services 207 214 3 Other services 81 50 -38
Financial services indirectly measured (-) -25 -22 -12
Sources: Fund staff estimates and projections.
Proj.

11
generation before the war coming from conventional thermal power plants.20 By early 2013, more than 30 of Syria’s power stations were inactive, and at least 40 percent of the country’s high voltage lines had been attacked, according to Syria’s Minister of Electricity.
17. Agricultural production, which accounted for one-fifth of GDP before the conflict, has experienced significant losses.21 Agricultural areas have been affected by the destruction of farmland and shortages of inputs such as seeds, fertilizer, pesticide, fuel, and farm labor, as well as damage to irrigation systems, mills, and farming equipment. Farmers also have sold off their livestock, or taken them across the border. Further, some of the more fertile areas such as the Aleppo and Raqqa governorates, which accounted for half of Syria’s agricultural production, are largely outside government control. Farmers are also facing serious transportation and storage problems due to the loss of government control over roads and territory, making it difficult to get food on time from production and surplus areas to core markets.22
Cereal production has been disrupted. Wheat production—the largest produced crop in terms of harvested area and tons—was estimated at 2.5 million tons in 2015, 20 percent lower than 2010. By contrast, barley, the next most important crop, has increased by 40 percent to 0.9 million tons since 2010 because of good rainfall.23
Since 2010, livestock production has declined by 30 percent in cattle, by 40 percent in sheep and goats, and by 50 percent in poultry.24 It accounted for about 35–40 percent of total agricultural production and occupied about 20 percent of the rural labor force; sheep, goats and chicken were also important export commodities.
Fruit production has suffered from the felling of trees for firewood, and from shortages of pesticides and fertilizers. The Ministry of Agriculture estimates that olive production has declined to 400,000 tons per year in 2015 from one million tons per year; olive production used to employ 100,000 families and Syria was the fourth-largest olive producer in the world. By contrast, citrus production (about
20 In 2008, Syria started to become a net importer of natural gas. The conflict and sanctions have affected the country’s ability to receive natural gas. The only source of natural gas imports, the Arab Gas Pipeline which transports natural gas from Egypt, became the target of attacks as the conflict intensified, forcing the pipeline to shut down.
21 See the 2015 UN Food and Agriculture Organization (FAO) and World Food Program (WFP) report.
22 The transfers of wheat surpluses from the northeast to the food deficit areas of the west have slowed. Unsold wheat stocks are accumulating in the north east, while the west largely relies on imports.
23 Barley is a predominantly rain-fed crop and not dependent on irrigation systems and fertilizers like wheat.
24 The FAO/WFP report noted that the veterinary service is running out of vaccines and routine drugs.
12
one million tons per year) has been less affected by the war, as most of the production is in government-controlled areas along the coast.
Industrial crops such as sugar beet, cotton, and tobacco have also fallen.25
18. The services sector has also been hit hard. While no data are available, we estimate that services—such as retail, wholesale, transportation, construction, and banking—have contracted sharply on account of a collapse of the overall economy, particularly tourism, and with heighted security risks, destruction of roads, and economic fragmentation impeding trade and commerce. Banking has been further impacted by the economic sanctions. The government contributed positively to economic growth in the initial conflict years as public sector wages and military spending increased sharply between 2011 and 2013. Since then, however, there have been cuts in the provision of services in the face of falling revenue and export oil earnings.
19. Manufacturing production has likely suffered a disproportionately large decline. The sector has been affected by shortages in fuel, power, and other raw materials, limited access to trade finance, and severe destruction to infrastructure. The centers of Syria’s manufacturing base were in Aleppo, Homs, and the suburbs of Damascus—areas which have been most affected by the conflict.26 Reports indicate that equipment in factories has been plundered. Many businesses have moved their production from war-torn areas to more secure locations along the coast. There is also anecdotal evidence that companies and entrepreneurs, in particular around Aleppo,27 have left the country, taking with them capital and equipment across the border to neighboring countries. For instance, many Syrian small and medium enterprises (SMEs) and entrepreneurs have allegedly moved their production to Turkey and are selling their goods back to Syria. In 2014, Syrians accounted for 26 percent of new businesses registered in Turkey while Turkey’s exports to Syria recovered to their pre-crisis level of $1.8 billion in 2014 from $500 million in 2012.
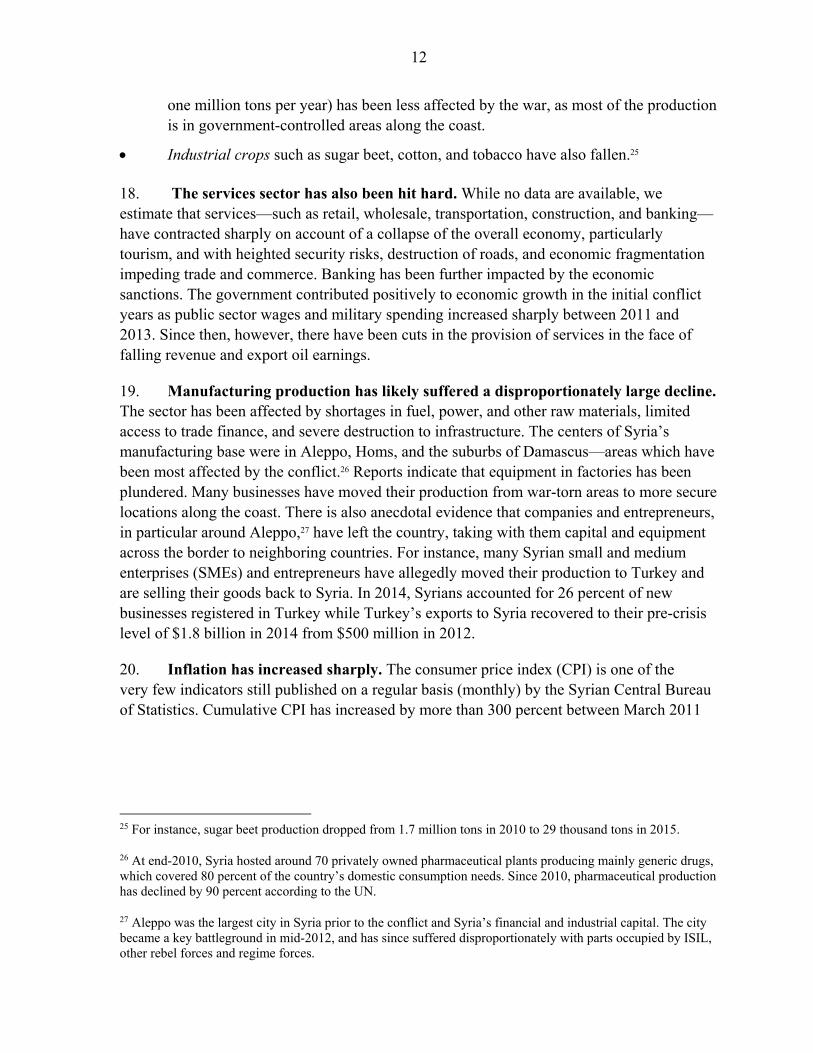
20. Inflation has increased sharply. The consumer price index (CPI) is one of the very few indicators still published on a regular basis (monthly) by the Syrian Central Bureau of Statistics. Cumulative CPI has increased by more than 300 percent between March 2011
25 For instance, sugar beet production dropped from 1.7 million tons in 2010 to 29 thousand tons in 2015.
26 At end-2010, Syria hosted around 70 privately owned pharmaceutical plants producing mainly generic drugs, which covered 80 percent of the country’s domestic consumption needs. Since 2010, pharmaceutical production has declined by 90 percent according to the UN.
27 Aleppo was the largest city in Syria prior to the conflict and Syria’s financial and industrial capital. The city became a key battleground in mid-2012, and has since suffered disproportionately with parts occupied by ISIL, other rebel forces and regime forces.
13
and May 2015. This reflects a combination of supply shortages of basic goods such as food, medicine, and fuel, along with cuts in government subsidies (water, food, electricity, and fuel) and the depreciating currency (Figure 1). After being relatively stable in 2014, food prices increased again in 2015 in the wake of further subsidy cuts, supply shortages, and a more rapid pace of exchange rate depreciation. As a result of food price inflation, the 2015 FAO/WFP report found that households are now spending a disproportionate amount just on food—well over 50 to 60 percent in many areas.
External Sector
21. The conflict and international trade embargos have led to a sharp widening in the external current account.28 We estimate the 2015 current account deficit to be 13 percent of GDP, compared with about 0.6 percent of GDP in 2010 (see Table 1 and Appendix Table 4). Most of the deterioration comes from the collapse in oil exports and tourism.29 The deficit has been largely financed through a drawdown of reserves and some external financing.
The trade balance has deteriorated and trading patterns have shifted. Trade with EU countries—Syria’s single largest trading partner in 2010 after Iraq—has collapsed entirely.30 This mainly reflects the sanctions imposed in late 2011 by the EU, which was once Syria’s largest market for heavy crude oil (more than 90 percent of Syrian oil exports headed to the EU in 2010). At the same time, the importance of Iraq and Saudi Arabia as trading partners has increased.
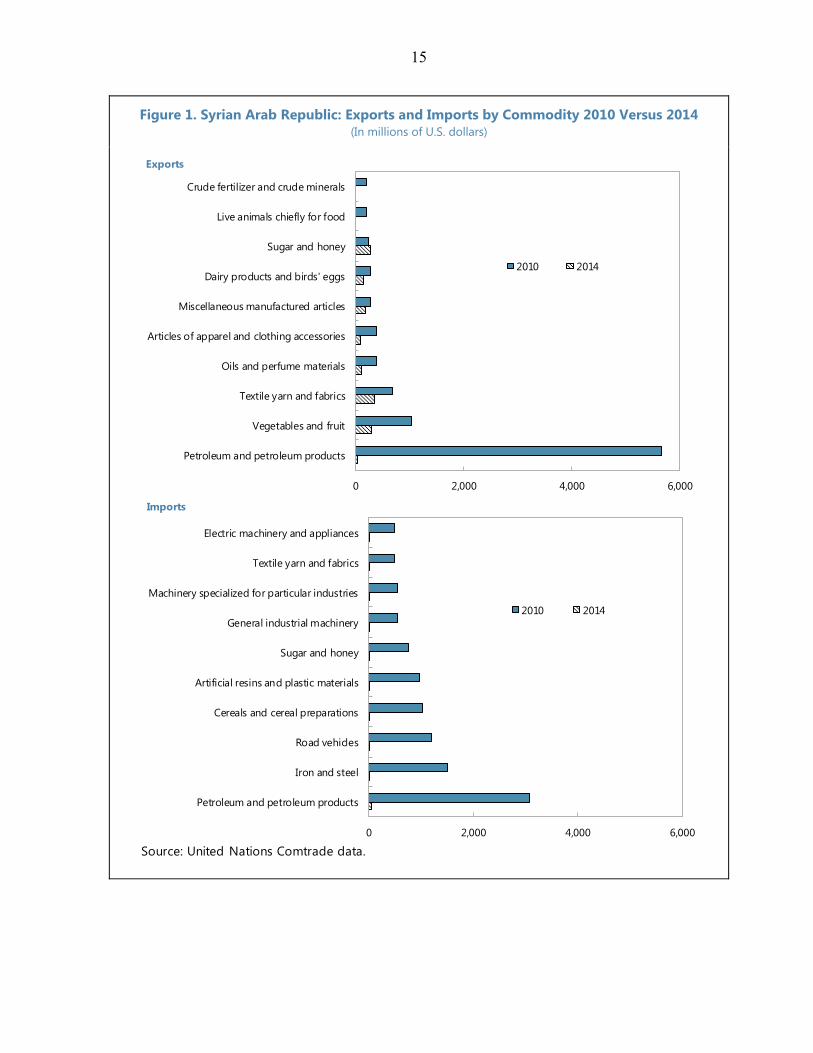
Exports are very roughly estimated to have collapsed by about 70 percent to about $4 billion between 2010–15 due to the international embargo, the impact of the conflict on economic activity, and a collapse in cross-border trade. Syria’s key export goods prior to 2011 were crude oil/petroleum, other minerals, garments
28 The economic sanctions by the EU, the U.S. and others largely apply to crude oil sales as well as state-owned enterprises, while the private sector is still able to trade internationally.
29 As the Central Statistics Office no longer publishes trade data, this note draws on the UN Comtrade database and the IMF Direction of Trade Statistics (DOTs).
30 Exports to EU countries amounted to $4.2 billion and imports to $4.7 billion in 2010. In 2014, they had declined to $17 million and $611 million, respectively.
-20
0
20
40
60
80
100
120
140Food and non-alcoholic beveragesAlcoholic beverages and tobaccoRent, electricity, gas and other energy productsTransportationClothing and shoesHousehold products and servicesOther
Contribution to End-of-Period Inflation(In percent, y-o-y)
Sources: Central Bureau of Statistics; and IMF staff calculations.
14
and other textiles, and agricultural products such as fruits and livestock—all sectors which have been severely disrupted by the conflict.
Imports are expected to have declined by almost 40 percent to $10.5 billion between 2010 and 2015. Syria’s key imports prior to 2011 were transportation equipment, machinery, iron, steel, and some petroleum products and consumer durables. With the exception of petroleum products, the demand for most of these products has been hit hard by the loss in household income, the disproportionate loss in manufacturing output, import restrictions by the central bank, and foreign currency shortages. Car imports, for instance, have fallen from 87,000 in 2010 to 1,000 in 2014.31 By contrast, imports of essential goods—such as medicine, finished food, wheat, baby milk, sugar, and seeds— military goods, and crude oil and petroleum products have increased.32
Also the income and services balance has worsened. It is reasonable to assume that the conflict and sanctions have made it considerably more expensive for Syrians to trade internationally, pushing up freight and insurance costs because of risks of theft and loss. Earnings from tourism, which at $4 billion in 2010 was the second-largest source of foreign exchange after oil, have completely dried up.
By contrast, transfers have held up. Despite the conflict, we assume that the Syrian expatriate community continues to find ways to informally send financial support, such as remittances, to families who have remained in Syria. Similarly, NGOs in Syria have been receiving donor support, which is channeled to them through UNHCR. Also, UN agencies have spent a total of about $1 billion per year.
22. There has been likely major capital flight while capital inflows have been limited. Reflecting the sanctions and conflict, we assume that Syria in the past several years: (1) received no private financial and capital flows, as well as no investment; (2) no longer serviced its debt; and (3) no longer allowed any repatriation of any profits. We assume that the only official financial assistance is the announced credit lines by the Iranian government, amounting to $1.9 billion in 2013, $3 billion in 2014, and $0.97 billion in 2015.33 At the same time, a considerable amount of money has also reportedly left the country, mainly through informal channels to avoid capital controls, as Syrians have reallocated into safer assets.34
31 The Syria Report, Nov 30, 2015.
32 See Butter (2015).
33 There have been reports that Syria’s government may have also received financial and economic support from Russia and China.
34 http://www.ft.com/intl/cms/s/0/ed152aee-00ab-11e1-ba33-00144feabdc0.html#axzz43k8N9Z5S; and http://www.jadaliyya.com/pages/index/10617/capital-flight-and-the-consequences-of-the-war-eco.
15
Figure 1. Syrian Arab Republic: Exports and Imports by Commodity 2010 Versus 2014 (In millions of U.S. dollars)
Source: United Nations Comtrade data.
0 2,000 4,000 6,000
Petroleum and petroleum products
Vegetables and fruit
Textile yarn and fabrics
Oils and perfume materials
Articles of apparel and clothing accessories
Miscellaneous manufactured articles
Dairy products and birds' eggs
Sugar and honey
Live animals chiefly for food
Crude fertilizer and crude minerals
2010 2014
Exports
0 2,000 4,000 6,000
Petroleum and petroleum products
Iron and steel
Road vehicles
Cereals and cereal preparations
Artificial resins and plastic materials
Sugar and honey
General industrial machinery
Machinery specialized for particular industries
Textile yarn and fabrics
Electric machinery and appliances
2010 2014
Imports
16
23. International reserves are estimated to have dropped to $1 billion by the end of 2015 (equivalent to about 1 month of imports).35 That said, there is considerable uncertainty surrounding the level of available convertible reserves to the Central Bank. This is because a significant portion could have fallen under the 2012 EU and U.S. sanctions, which froze the Central Bank’s assets and those of commercial banks and entities associated with the regime. In projecting reserve developments, we assume that 80 percent of the Central Bank’s international reserves at the end of 2011 were available for intervention while the rest was frozen.
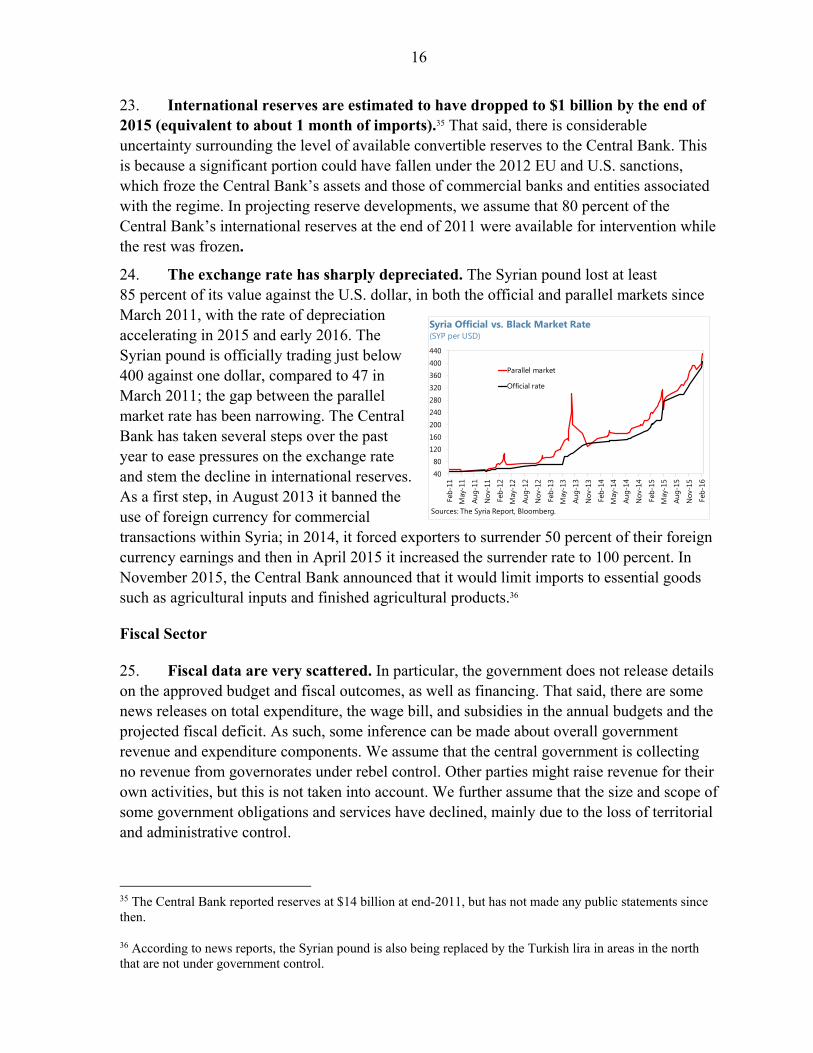
24. The exchange rate has sharply depreciated. The Syrian pound lost at least 85 percent of its value against the U.S. dollar, in both the official and parallel markets since March 2011, with the rate of depreciation accelerating in 2015 and early 2016. The Syrian pound is officially trading just below 400 against one dollar, compared to 47 in March 2011; the gap between the parallel market rate has been narrowing. The Central Bank has taken several steps over the past year to ease pressures on the exchange rate and stem the decline in international reserves. As a first step, in August 2013 it banned the use of foreign currency for commercial transactions within Syria; in 2014, it forced exporters to surrender 50 percent of their foreign currency earnings and then in April 2015 it increased the surrender rate to 100 percent. In November 2015, the Central Bank announced that it would limit imports to essential goods such as agricultural inputs and finished agricultural products.36
Fiscal Sector
25. Fiscal data are very scattered. In particular, the government does not release details on the approved budget and fiscal outcomes, as well as financing. That said, there are some news releases on total expenditure, the wage bill, and subsidies in the annual budgets and the projected fiscal deficit. As such, some inference can be made about overall government revenue and expenditure components. We assume that the central government is collecting no revenue from governorates under rebel control. Other parties might raise revenue for their own activities, but this is not taken into account. We further assume that the size and scope of some government obligations and services have declined, mainly due to the loss of territorial and administrative control.
35 The Central Bank reported reserves at $14 billion at end-2011, but has not made any public statements since then.
36 According to news reports, the Syrian pound is also being replaced by the Turkish lira in areas in the north that are not under government control.
40
80
120
160
200
240
280
320
360
400
440
Feb-
11
May
-11
Aug-
11
Nov
-11
Feb-
12
May
-12
Aug-
12
Nov
-12
Feb-
13
May
-13
Aug-
13
Nov
-13
Feb-
14
May
-14
Aug-
14
Nov
-14
Feb-
15
May
-15
Aug-
15
Nov
-15
Feb-
16
Syria Official vs. Black Market Rate (SYP per USD)
Parallel market
Official rate
Sources: The Syria Report, Bloomberg.
17
26. We estimate that the fiscal deficit has widened to over 20 percent of GDP in 2015 from 8 percent of GDP in 2010. While in nominal terms the budget has almost doubled from SP800 billion in 2010 to SP1.3 trillion in 2015, in real terms the 2015 budget is 40 percent lower than the budget of 2010. We estimate that revenue fell to 6 percent of GDP, compared to 21 percent of GDP before the crisis, mainly due to the loss of oil revenue, a collapsing economy and international trade, a growing informal economy, political fragmentation, and weak administrative collection capacity; the only reliable revenue source appears to be income from two telecom operators.37 Capital spending is expected to be negligible,38 but current spending as a percent of GDP is higher than it was in 2010. This reflects more spending on public sector wages, the military, and imports of essential commodities. Foreign currency and raw material shortages have forced the government to cut back on decade-long subsidies for food (such as wheat, bread, and sugar), fuel, water, and electricity. At the same time, the size and scope of some government obligations have shrunk, helping to contain the budget somewhat. To account for this, we assume that the public workforce and the number of pensioners have declined by 30 percent since 2010 due to refugees, war casualties, and the closure of government services.
27. Public debt is large and mostly financed domestically. The Iranian credit is assumed to have been the only external financial support between 2011 and 2015. Therefore, the remaining deficit had to be covered domestically by the Central Bank and commercial banks.39 We estimate that public debt was above 100 percent of GDP at the end of 2015, up from 31 percent of GDP at the end of 2009.40 The growing dependence on bilateral financial support, in particular from Iran, along with the significant exchange rate depreciation and collapse in GDP, is expected to have pushed external debt to 60 percent of GDP from 9 percent at the end of 2009.
28. The delivery of public services varies largely across the country. The government supposedly has focused the budget and its spending largely on areas under its control, including for education, road maintenance, food, fuel, medicine supply, and public sector wages and pensions. Further, the government announced in 2015 that it would begin outsourcing services by allowing the private sector to take over the management of assets and properties owned by cities. Reports also indicate that the government has reached agreements
37 World Bank (2015).
38 Before the conflict, capital spending was at least one third of total spending.
39 The Central Bank stopped producing monetary statistics at the end of 2011. Net claims to the central government from the banking system increased by 340 percent between end-2010 and end-2011, accounting for the lion share of domestic credit growth.
40 Similar to the experience in other conflict countries, it is likely that the government has built up domestic arrears, including by delaying salary payments.
18
with ISIL or the Kurds to buy Syrian crude oil and gas, as well as to ensure the provision of essential services, such as water and power, to areas under regime control.41
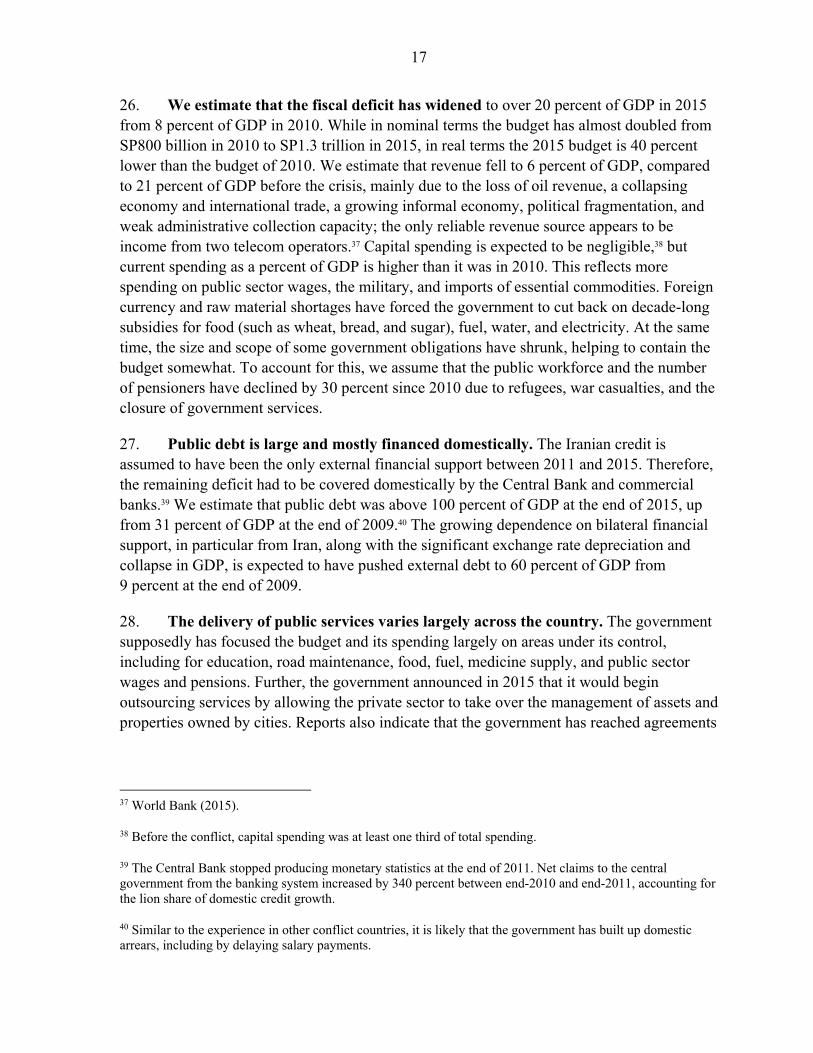
Financial Sector 29. Sanctions and the war have affected Syria’s financial system. Banks are largely isolated from the international banking market. As part of the international sanctions, the central and state-owned banks—which account for three-quarters of banking assets—are largely shut off from the international payment and settlement systems, as well as the credit markets. This is also visible in the sharp decline of foreign bank exposures to Syrian banks since the onset of the conflict. Any assets held abroad in countries that have imposed sanctions have been frozen. The banking system has also been affected by the outflow of deposits and the collapse in economic activity, although there have been no reported bank closures. The stock exchange, located in Damascus, has continued to stay open throughout the conflict, with a small number of investors continuing to trade on a regular basis.
30. Non-performing loans (NPLs) are a large problem. Because of large scale deposit withdrawals and the limited ability to do business domestically, bank balance sheets and net income have both shrunk. That said, banks started out with relatively robust capital buffers, high liquidity, and low exposure to foreign exchange risks, which has helped them deal with some of the losses coming from a significant rise in NPLs, and uncollectable and destroyed collateral. NPLs are estimated to have increased from 4 percent at the end of 2010 to 35 percent by September 2013.
31. The integrity of the Syria’s financial system has been eroded, with a reported rise in financial crime activities and terrorist financing risk. Prior to the conflict, Syria was identified by the Financial Action Task Force (FATF) as a country with strategic deficiencies in the area of anti money laundering and combating financing of terrorism (AML/CFT), but was making progress toward addressing these. The conflict and weaker enforcement of domestic regulations in some areas have likely reversed many of these efforts. For instance, a recent FATF report outlined ISIL’s methods and channels to raise funding within Syria, including from proceeds of criminal activities, illegal exploitation of oil and petroleum products, extortion activities, and bank robberies.42 The reports shows that part
41 For instance, reports indicate that the government has entered into an agreement with ISIS over the Euphrates dam near Raqqa, which is held by ISIS and maintained with technical assistance from the government. There are also reports that ISIS is selling crude oil to the Syrian government and other countries.
42 FATF (2015).
0
100
200
300
400
500
600
700
800
900
BIS Reporting Foreign Banks' Total Claims on Syrian Banks(In U.S. dollar millions)
Source: Bank of International Settlements, Consolidated Banking Statistics

19
of ISIL money has been moved through regulated bank branches and money and transfer services (MVTS) that they control in Syria.
III. WHAT ARE THE CHALLENGES IN REBUILDING SYRIA?
32. Many factors will determine the extent and speed of rebuilding the country. Most importantly, the timeframe and success of any reconstruction will hinge on when and how the conflict is resolved. This, in turn, will shape the scope and pace of political and economic reforms. And it will determine how much external assistance is forthcoming, including whether Syria will be able to attract private investment. It will be critical to establish quick wins, including in the energy sector and agriculture, as well as in labor-intensive industries such as textile or food processing, which could become drivers of growth.
33. The recovery will likely take a long time. The literature on post-conflict recovery shows that a longer-lasting conflict will have a more negative impact on the economy and institutions, and prolong the recovery.43 For instance, it took Lebanon, which experienced 16 years of conflict, 20 years to catch up to the real GDP level it enjoyed before the war, while it took Kuwait, which endured two years of conflict, seven years to regain its pre-war GDP level. Given the unprecedented scale of devastation, it may be difficult to compare Syria with other post conflict cases. That said, if we hypothetically44 assume that for Syria the post-conflict rebuilding period will begin in 2018 and the economy grows at its trend rate of about 4½ percent, it would take the country about 20 years to reach its pre-war real GDP level.45 Achieving a higher growth rate would allow the country to achieve a faster recovery.46 This assumes that the country can quickly restore its production capacity and human capital levels and remains intact as a sovereign territory. Any break-up of the country would affect potential growth and might require creating new institutions and governance structures.
43 See Sab (2014).
44 This assumes that a peace agreement and new government are in place by the end of 2017 and that conditions permit investors and international donors to safely engage in the country’s rebuilding efforts.
45 This is a conservative assumption. The catching up could be faster if in the immediate post conflict reconstruction phase, international financial assistance is large and there is capacity to implement the reconstruction strategy.
46 With a one-standard deviation higher growth rate relative to trend, it would take Syria 10 years to catch up to 2010 GDP levels.
0
200
400
600
800
1000
1200
1400
1600
1990 1994 1998 2002 2006 2010 2014 2018 2022 2026 2030 2034
Real GDP (In billion Syrian pounds at 2000 prices)
Sources: Authorities and IMF staff estimates and calculations.
2018 Post Recovery

20
A. Physical and Human Capital
34. Rebuilding damaged physical infrastructure will be a monumental task, with reconstruction cost estimates in the range of $100 to $200 billion (Box 2 discusses an assessment of damage to public and energy assets in six large cities). SCPR estimates that the destruction of physical infrastructure between 2011 and 2014 amounted to US$72–75 billion, equivalent to about 120 percent of 2010 GDP. The MPMR estimated in early 2015 that the conflict has cost the oil industry alone US$27 billion from the destruction of wells, pipelines, and refineries.47 Similarly, the U.S. Energy Information Administration (EIA) suggests that it will take years for Syrian’s domestic energy system to return to its pre-conflict operating status, even after the conflict subsides.48 With the escalation of the conflict since the second half of 2015, the rebuilding estimates are likely to be much higher. More recently, the UN Economic and Social Commission for Western Asia (ESCWA) estimated that Syria would require about $180 to $200 billion—three times the 2010 GDP.49
35. Syria will also have to grapple with deep-rooted socioeconomic challenges. The extreme rise in mass poverty, destruction of health and education services, and large-scale displacement of Syrians will pose huge challenges. Syria’s population has shrunk by 20–30 percent, with 50 percent of the population internally displaced, destroyed homes, and many highly skilled workers and entrepreneurs having left the country. Moreover, the currently low school enrollment rate of children will negatively impact the country’s potential output for years to come. SCPR estimated in 2014 that the loss of years of schooling by children represents a human capital deficit of $5 billion in education investment. A recent UNICEF report placed the loss in human capital at $10.5 billion from the loss of education of Syrian children and youth.50 Many children have been born into conflict and exposed to violence, and studies show that exposure to violent conflicts has long-term effects on generations to come.51 Therefore, considerable resources will need to go to rebuilding the lives of internally displaced people, and to encouraging the return and reintegration of refugees. Further, the conflict has exacerbated existing, and created new, divisions and tensions between various sectarian communities across the country that will need to be addressed in a meaningful way to promote social and political cohesion.
47 This figure includes the cost of looting and the foregone revenue from significantly lower production levels. According to MPMR, many oil wells in areas not under state control have been set on fire.
48 See http://www.eia.gov/beta/international/analysis.cfm?iso=SYR.
49 See http://www.huffingtonpost.com/bassem-awadallah/the-challenge-of-a-new-regional-political-economy-_b_7348502.html.
50 UNICEF (2015).
51 World Bank (2016).
21
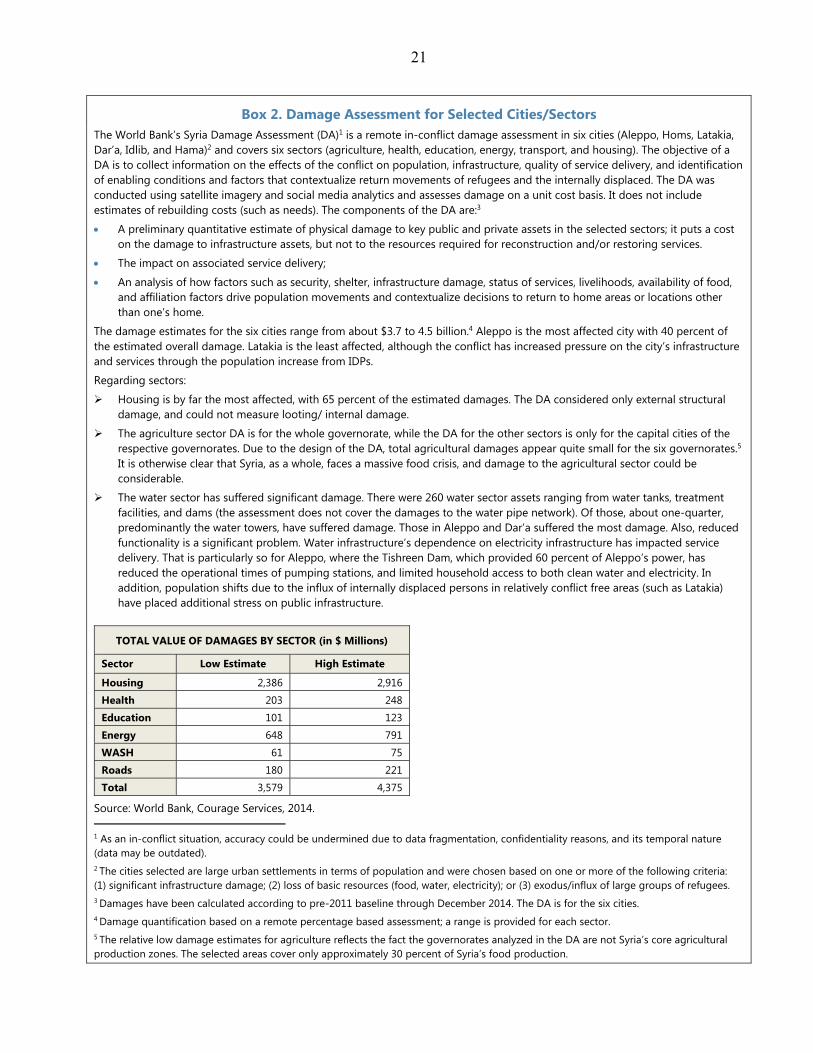
Box 2. Damage Assessment for Selected Cities/Sectors The World Bank’s Syria Damage Assessment (DA)1 is a remote in-conflict damage assessment in six cities (Aleppo, Homs, Latakia, Dar’a, Idlib, and Hama)2 and covers six sectors (agriculture, health, education, energy, transport, and housing). The objective of a DA is to collect information on the effects of the conflict on population, infrastructure, quality of service delivery, and identification of enabling conditions and factors that contextualize return movements of refugees and the internally displaced. The DA was conducted using satellite imagery and social media analytics and assesses damage on a unit cost basis. It does not include estimates of rebuilding costs (such as needs). The components of the DA are:3
A preliminary quantitative estimate of physical damage to key public and private assets in the selected sectors; it puts a cost on the damage to infrastructure assets, but not to the resources required for reconstruction and/or restoring services.
The impact on associated service delivery;
An analysis of how factors such as security, shelter, infrastructure damage, status of services, livelihoods, availability of food, and affiliation factors drive population movements and contextualize decisions to return to home areas or locations other than one’s home.
The damage estimates for the six cities range from about $3.7 to 4.5 billion.4 Aleppo is the most affected city with 40 percent of the estimated overall damage. Latakia is the least affected, although the conflict has increased pressure on the city’s infrastructure and services through the population increase from IDPs.
Regarding sectors:
Housing is by far the most affected, with 65 percent of the estimated damages. The DA considered only external structural damage, and could not measure looting/ internal damage.
The agriculture sector DA is for the whole governorate, while the DA for the other sectors is only for the capital cities of the respective governorates. Due to the design of the DA, total agricultural damages appear quite small for the six governorates.5 It is otherwise clear that Syria, as a whole, faces a massive food crisis, and damage to the agricultural sector could be considerable.
The water sector has suffered significant damage. There were 260 water sector assets ranging from water tanks, treatment facilities, and dams (the assessment does not cover the damages to the water pipe network). Of those, about one-quarter, predominantly the water towers, have suffered damage. Those in Aleppo and Dar’a suffered the most damage. Also, reduced functionality is a significant problem. Water infrastructure’s dependence on electricity infrastructure has impacted service delivery. That is particularly so for Aleppo, where the Tishreen Dam, which provided 60 percent of Aleppo’s power, has reduced the operational times of pumping stations, and limited household access to both clean water and electricity. In addition, population shifts due to the influx of internally displaced persons in relatively conflict free areas (such as Latakia) have placed additional stress on public infrastructure.
TOTAL VALUE OF DAMAGES BY SECTOR (in $ Millions)
Sector Low Estimate High Estimate
Housing 2,386 2,916
Health 203 248
Education 101 123
Energy 648 791
WASH 61 75
Roads 180 221
Total 3,579 4,375
Source: World Bank, Courage Services, 2014.
1 As an in-conflict situation, accuracy could be undermined due to data fragmentation, confidentiality reasons, and its temporal nature (data may be outdated). 2 The cities selected are large urban settlements in terms of population and were chosen based on one or more of the following criteria: (1) significant infrastructure damage; (2) loss of basic resources (food, water, electricity); or (3) exodus/influx of large groups of refugees. 3 Damages have been calculated according to pre-2011 baseline through December 2014. The DA is for the six cities. 4 Damage quantification based on a remote percentage based assessment; a range is provided for each sector. 5 The relative low damage estimates for agriculture reflects the fact the governorates analyzed in the DA are not Syria’s core agricultural production zones. The selected areas cover only approximately 30 percent of Syria’s food production.
22
B. Economic Reforms
36. In the short run, economic reforms should focus on stabilization and helping the poorest. After restoring security, the immediate economic challenges include the output and employment collapse in the tradable sector, low level of international reserves, destruction of infrastructure, accelerated exchange rate depreciation, dollarization, high and rising inflation, and legal and financial issues associated with frozen assets. These challenges could impose significant constraints on the scope and pace of reform implementation (for instance, Syria’s low level of reserves could make it more difficult for it to meet its high import needs). Also, an urgent focus is needed on providing for the poorest through humanitarian assistance.
37. Once reconstruction is underway, more far-reaching economic reforms should be considered. A prioritized and sequenced reform program could focus on: (1) developing non-oil sectors to cope with the decline in oil production and the need for job creation; and (2) maintaining fiscal sustainability while providing social protection to a growing number of young unemployed. In order to achieve these goals, further diversification of the economy through private sector development is critical. There is also scope for increasing productivity by raising the skills of its labor force52 and improving its technological base.
38. There are major environmental and natural resource challenges. Syria is considered semi-arid and thus must manage scarcity and high variability of water supplies. Rapid pre-war population growth and agricultural intensification strained the quality and quantity of available resources. Of the seven national basins, only the Aleppo Basin (encompassing the coast and the Euphrates River) managed excess water supplies. Pre-war irrigation consumed 90 percent of available water resources compared to 8 percent for domestic use and 2 percent for industry. Groundwater has been the primary source of water supply and most of the country’s aquifers are severely over-exploited. Over-extraction of groundwater and pollution due to domestic and industrial wastewater effluent severely impacts the quality and quantity of water available for sustainable growth. Even before the crisis, most regions suffered from water supply shortages, particularly during the summer when supply was rationed and made available to households only for a few hours a day.53 Incentives for more efficient water use were lacking both for irrigation and domestic consumption, as emphasis was placed on increasing supply. The sanitation sector was also challenged before the crisis. With the damage to some of these assets, the crisis has put further stress on both the water supply and sanitation sectors.
39. The post-conflict reconstruction efforts should seek to address regional disparities in income and social inclusion. Poverty and extreme poverty, according to
52 Even before the conflict, Syrian workers appear uncompetitive by regional standards. Major upgrading of the quality of the human resource base would be required, including the quality of education in schools, universities, and vocational training systems. 53 This also reflects the pre-crisis water dispute between Turkey and Syria, with Turkey through the construction of dams and hydropower in the 1970s and 1980s having severely curtailed the flow of water of the Euphrates River.
23
SCPR, have worsened further with the conflict, and are highest in governorates that have been most affected by the conflict and that were historically the poorest in the country.
Addressing the underpinnings of these disparities should be central to any policy package intended to bring about peace and prosperity. Innovative approaches will be required to improve the provision of public services, including reconstruction of damaged water pipelines, farm irrigation and drainage, roads, schools and hospitals, employment prospects, and access to finance at the regional levels. Institutional and governance arrangements should be considered to give local authorities greater controls over service delivery, including greater forms of fiscal decentralization.54 However, for fiscal decentralization to work, certain critical governance conditions will need to be in place, including ensuring local authorities are held accountable and resources are spent in a transparent manner. Therefore, any decentralization efforts have to take into account Syria’s new governance model, as well as the state of its institutions.
40. Rebuilding public institutions and improving governance will be key. This includes making fiscal policy and fiscal management effective, fair, and transparent; developing the rule of law and judiciary independence; and re-establishing and strengthening the capacity for monetary operations and banking supervision, and reforming the bank regulatory framework, including the anti money laundry and combating terrorist financing (AML/CFT) regime.55 These efforts would help address governance issues that plagued the country prior to the start of the conflict and contributed to regional and income disparities, and that likely have further deteriorated. They would also help facilitate the re-integration of the domestic financial system into the global economy, lower transaction costs, and reduce the size of the informal sector. Lessons from other post conflict countries show that framing an overall consistent technical assistance strategy at the outset of the post-conflict phase and securing donor coordination are critical for successful implementation of economic and institutional reforms.
IV. CONCLUSION
41. The conflict has set the country back decades in terms of economic, social, and human development. Syria’s GDP today is less than half of what it was before the war started. Inflation is high double digits, and there has been a large depreciation of the exchange rate. International reserves have been depleted to finance large fiscal and current account deficits, while public debt has more than doubled. Syria’s people are struggling with the devastating effects of the conflict, including widespread unemployment and poverty, homelessness, food and medicine shortages, and destruction of public services and infrastructure. The situation for those who have stayed in Syria is dire: half of the population is displaced, the social fabric is torn, many children are no longer schooled, access to
54 See “Can Fiscal Decentralization Help Resolve Regional Conflicts in the Middle East?,” by Ehtisham Ahmad and Adnan Mazarei (January 2015), http://www.imf.org/external/np/blog/nafida/012315.pdf.
55 See IMF (2005b).

24
medicine, food and clean water is limited, and many people of all ages are traumatized by the war.
42. Rebuilding the country will be a complex and monumental task. Reconstructing damaged physical infrastructure will require substantial international support and prioritization. Rebuilding Syria’s human capital and social cohesion will be an even greater and lasting challenge. Considerable resources will need to go to rebuilding the lives of internally displaced people, and to encouraging the return and reintegration of refugees along with reducing the divisions and tensions between various sectarian communities. Far-reaching economic reforms will be needed to create stability, growth, and job prospects. The immediate focus would need to be on urgent humanitarian assistance, restoring macroeconomic stability and rebuilding institutional capacity to implement cohesive and meaningful reforms. In the medium term, the reform agenda could include diversifying the economy, creating jobs for the young and displaced, tackling environmental issues, and addressing long-standing issues such as the regional disparities in income and greater political and social inclusion.
25
REFERENCES
Butter, David, 2015, “Syria’s Economy: Picking up the Pieces,” The Royal Institute of International Affairs (June) (Chatham House, London, United Kingdom).
———, 2016, “Salvaging Syria’s Economy,” The Royal Institute of International Affairs (March) (Chatham House, London, United Kingdom).
Economist Intelligence Unit, 2015, “Syria: Country Report” (London, United Kingdom).
Financial Action Task Force (FATF) February 2015, “Financing of the Terrorist Organisation Islamic State in Iraq and the Levant,” (FATF Secretariat, Paris, France).
International Monetary Fund, 2005a, “Syrian Arab Republic: 2005 Article IV Consultation,” IMF Country Report No. 05/356 (October) (Available at www.IMF.org/external).
———, 2005b, “Rebuilding Fiscal Institutions in Post-Conflict Countries,” Available at http://www.imf.org/external/np/fad/2005/022505.htm.
———, “Syrian Arab Republic: 2008 Article IV Consultation,” IMF Country Report No. 09/56 (February 2009) (available at www.IMF.org/external).
———, “Syrian Arab Republic: 2009 Article IV Consultation,” IMF Country Report No. 10/86 (March 2010) (available at www.IMF.org/external).Office for the Coordination of Humanitarian Affairs, 2014, “2015 Strategic Response Plan: Syrian Arab Republic” (December) (http://www.unocha.org/Syria).
———, “Syrian Humanitarian Needs Overview” (February 2016) (http://www.unocha.org/Syria).
Sab, Randa, 2014, “Economic Impact of Selected Conflicts in the Middle East: What Can We Learn from the Past?” IMF Working Paper No. 14/100 (Washington: International Monetary Fund).
Sayigh, Yezid, 2015, “The War Over Syria’s Gas Fields,” Available via Internet: http://carnegieendowment.org/syriacrisis (June).
Syrian Arab Republic, 2010, “Third National MDGs Progress Report,” Available via Internet: (http://www.sy.undp.org/content/syria/en/home/mdgoverview.html).
Syria Center for Policy Research, March 2015, “Syria: Alienation and Violence: Impact of Syria Crisis Report 2014” (Damascus, Syria).
Thompson, Edwina, 2015, “Technical Assessment: Humanitarian Use of Hawala in Syria,” (July) (Beechwood International, London, United Kingdom).
United Nations High Commission for Refugees, 2015, “Syrian Refugees: Inter-Agency Regional Update” (August) (http://data.unhcr.org/syrianrefugees/regional.php).
26
United Nations International Children’s Emergency Fund, December 2015, “Economic Loss from School Dropout Due to the Syria Crisis: A Cost-Benefit Analysis of the Impact of the Syria Crisis on the Education Sector.”
———, January 2016, “Syria Crisis Humanitarian Highlights and Results,” Available at http://childrenofsyria.info/2016/02/29/syria-crisis-january-2016-humanitarian-highlights-results/.
———, March 2016, “No Place for Children: The Impact of Five Years of War on Syria’s Children and Their Childhood” Available at http://childrenofsyria.info/.
United Nations Children’s Fund and Save the Children, 2015, “Child Protection Assessment North-Eastern Syria” (July) (Regional Office for the Middle East and Eurasia, Amman, Jordan).
———, 2015, “Small Hands, Heavy Burden: How the Syria Conflict is Driving More Into the Workforce” (June) (Regional Office for the Middle East and Eurasia, Amman Jordan).
World Bank, 2015, “Syria Economic Monitoring Note: Fall 2015” (IBRD, Washington, D.C.).
———, April 2016, “Syria: Reconstruction For Peace,” (IBRD, Washington, D.C.).
Yazigi, Jihad, 2014, “Syria’s War Economy,” ECFR/97 (April) (European Council on Foreign Relations, London, United Kingdom).
27
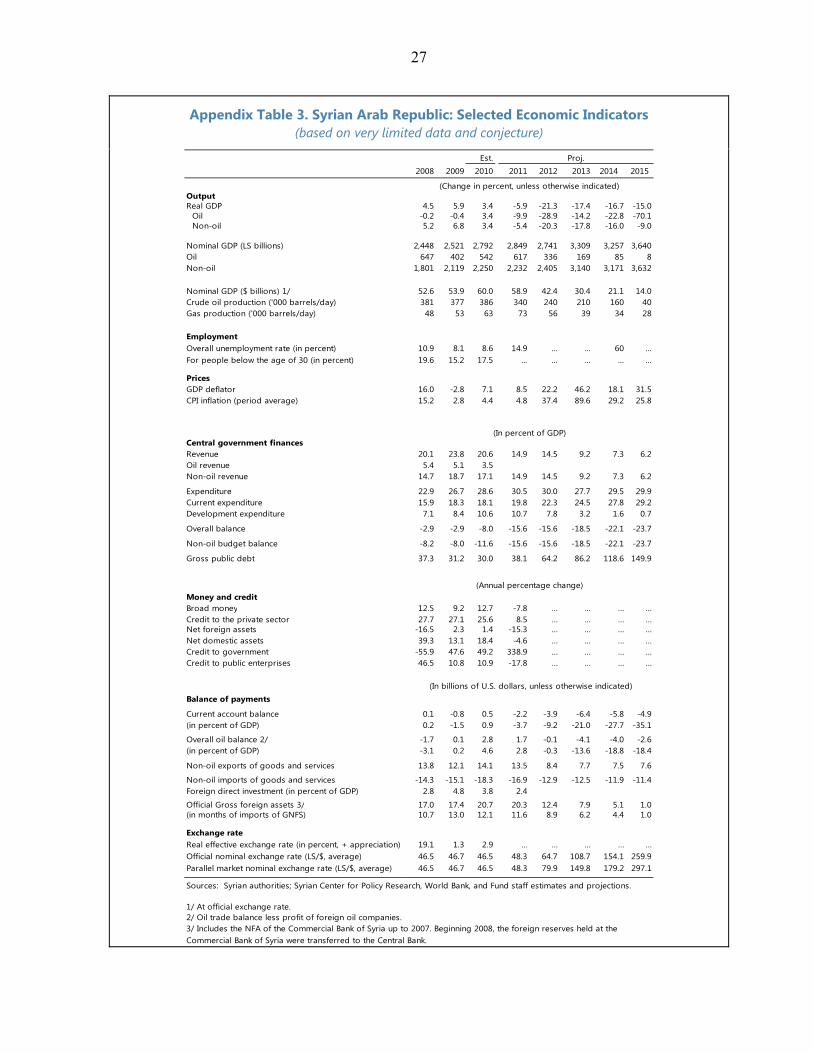
Appendix Table 3. Syrian Arab Republic: Selected Economic Indicators (based on very limited data and conjecture)
Est.2008 2009 2010 2011 2012 2013 2014 2015
OutputReal GDP 4.5 5.9 3.4 -5.9 -21.3 -17.4 -16.7 -15.0
Oil -0.2 -0.4 3.4 -9.9 -28.9 -14.2 -22.8 -70.1Non-oil 5.2 6.8 3.4 -5.4 -20.3 -17.8 -16.0 -9.0
Nominal GDP (LS billions) 2,448 2,521 2,792 2,849 2,741 3,309 3,257 3,640Oil 647 402 542 617 336 169 85 8Non-oil 1,801 2,119 2,250 2,232 2,405 3,140 3,171 3,632
Nominal GDP ($ billions) 1/ 52.6 53.9 60.0 58.9 42.4 30.4 21.1 14.0Crude oil production ('000 barrels/day) 381 377 386 340 240 210 160 40Gas production ('000 barrels/day) 48 53 63 73 56 39 34 28
EmploymentOverall unemployment rate (in percent) 10.9 8.1 8.6 14.9 ... ... 60 ...For people below the age of 30 (in percent) 19.6 15.2 17.5 ... ... ... ... ...
PricesGDP deflator 16.0 -2.8 7.1 8.5 22.2 46.2 18.1 31.5CPI inflation (period average) 15.2 2.8 4.4 4.8 37.4 89.6 29.2 25.8
Central government financesRevenue 20.1 23.8 20.6 14.9 14.5 9.2 7.3 6.2Oil revenue 5.4 5.1 3.5Non-oil revenue 14.7 18.7 17.1 14.9 14.5 9.2 7.3 6.2
Expenditure 22.9 26.7 28.6 30.5 30.0 27.7 29.5 29.9Current expenditure 15.9 18.3 18.1 19.8 22.3 24.5 27.8 29.2Development expenditure 7.1 8.4 10.6 10.7 7.8 3.2 1.6 0.7
Overall balance -2.9 -2.9 -8.0 -15.6 -15.6 -18.5 -22.1 -23.7
Non-oil budget balance -8.2 -8.0 -11.6 -15.6 -15.6 -18.5 -22.1 -23.7
Gross public debt 37.3 31.2 30.0 38.1 64.2 86.2 118.6 149.9
Money and creditBroad money 12.5 9.2 12.7 -7.8 … … … …Credit to the private sector 27.7 27.1 25.6 8.5 … … … …Net foreign assets -16.5 2.3 1.4 -15.3 … … … …Net domestic assets 39.3 13.1 18.4 -4.6 … … … …Credit to government -55.9 47.6 49.2 338.9 … … … …Credit to public enterprises 46.5 10.8 10.9 -17.8 … … … …
Balance of payments
Current account balance 0.1 -0.8 0.5 -2.2 -3.9 -6.4 -5.8 -4.9(in percent of GDP) 0.2 -1.5 0.9 -3.7 -9.2 -21.0 -27.7 -35.1
Overall oil balance 2/ -1.7 0.1 2.8 1.7 -0.1 -4.1 -4.0 -2.6(in percent of GDP) -3.1 0.2 4.6 2.8 -0.3 -13.6 -18.8 -18.4
Non-oil exports of goods and services 13.8 12.1 14.1 13.5 8.4 7.7 7.5 7.6
Non-oil imports of goods and services -14.3 -15.1 -18.3 -16.9 -12.9 -12.5 -11.9 -11.4Foreign direct investment (in percent of GDP) 2.8 4.8 3.8 2.4
Official Gross foreign assets 3/ 17.0 17.4 20.7 20.3 12.4 7.9 5.1 1.0(in months of imports of GNFS) 10.7 13.0 12.1 11.6 8.9 6.2 4.4 1.0
Exchange rateReal effective exchange rate (in percent, + appreciation) 19.1 1.3 2.9 … … … … …Official nominal exchange rate (LS/$, average) 46.5 46.7 46.5 48.3 64.7 108.7 154.1 259.9Parallel market nominal exchange rate (LS/$, average) 46.5 46.7 46.5 48.3 79.9 149.8 179.2 297.1
Sources: Syrian authorities; Syrian Center for Policy Research, World Bank, and Fund staff estimates and projections.
1/ At official exchange rate.2/ Oil trade balance less profit of foreign oil companies.
(In billions of U.S. dollars, unless otherwise indicated)
3/ Includes the NFA of the Commercial Bank of Syria up to 2007. Beginning 2008, the foreign reserves held at the Commercial Bank of Syria were transferred to the Central Bank.
Proj.
(Change in percent, unless otherwise indicated)
(In percent of GDP)
(Annual percentage change)
28
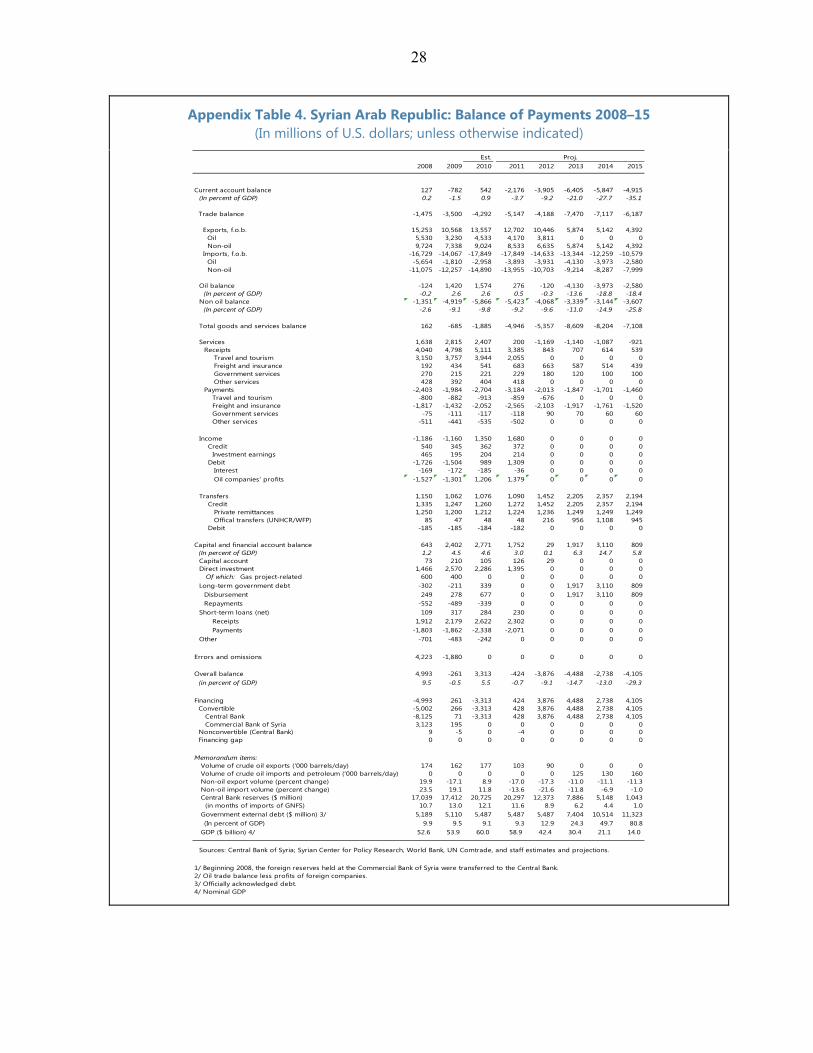
Appendix Table 4. Syrian Arab Republic: Balance of Payments 2008–15 (In millions of U.S. dollars; unless otherwise indicated)
Est.2008 2009 2010 2011 2012 2013 2014 2015
Current account balance 127 -782 542 -2,176 -3,905 -6,405 -5,847 -4,915(In percent of GDP) 0.2 -1.5 0.9 -3.7 -9.2 -21.0 -27.7 -35.1
Trade balance -1,475 -3,500 -4,292 -5,147 -4,188 -7,470 -7,117 -6,187
Exports, f.o.b. 15,253 10,568 13,557 12,702 10,446 5,874 5,142 4,392 Oil 5,530 3,230 4,533 4,170 3,811 0 0 0 Non-oil 9,724 7,338 9,024 8,533 6,635 5,874 5,142 4,392 Imports, f.o.b. -16,729 -14,067 -17,849 -17,849 -14,633 -13,344 -12,259 -10,579 Oil -5,654 -1,810 -2,958 -3,893 -3,931 -4,130 -3,973 -2,580 Non-oil -11,075 -12,257 -14,890 -13,955 -10,703 -9,214 -8,287 -7,999
Oil balance -124 1,420 1,574 276 -120 -4,130 -3,973 -2,580 (In percent of GDP) -0.2 2.6 2.6 0.5 -0.3 -13.6 -18.8 -18.4Non oil balance -1,351 -4,919 -5,866 -5,423 -4,068 -3,339 -3,144 -3,607 (In percent of GDP) -2.6 -9.1 -9.8 -9.2 -9.6 -11.0 -14.9 -25.8
Total goods and services balance 162 -685 -1,885 -4,946 -5,357 -8,609 -8,204 -7,108
Services 1,638 2,815 2,407 200 -1,169 -1,140 -1,087 -921Receipts 4,040 4,798 5,111 3,385 843 707 614 539
Travel and tourism 3,150 3,757 3,944 2,055 0 0 0 0Freight and insurance 192 434 541 683 663 587 514 439Government services 270 215 221 229 180 120 100 100Other services 428 392 404 418 0 0 0 0
Payments -2,403 -1,984 -2,704 -3,184 -2,013 -1,847 -1,701 -1,460 Travel and tourism -800 -882 -913 -859 -676 0 0 0 Freight and insurance -1,817 -1,432 -2,052 -2,565 -2,103 -1,917 -1,761 -1,520 Government services -75 -111 -117 -118 90 70 60 60 Other services -511 -441 -535 -502 0 0 0 0
Income -1,186 -1,160 1,350 1,680 0 0 0 0 Credit 540 345 362 372 0 0 0 0 Investment earnings 465 195 204 214 0 0 0 0 Debit -1,726 -1,504 989 1,309 0 0 0 0
Interest -169 -172 -185 -36 0 0 0 0Oil companies' profits -1,527 -1,301 1,206 1,379 0 0 0 0
Transfers 1,150 1,062 1,076 1,090 1,452 2,205 2,357 2,194 Credit 1,335 1,247 1,260 1,272 1,452 2,205 2,357 2,194
Private remittances 1,250 1,200 1,212 1,224 1,236 1,249 1,249 1,249Offical transfers (UNHCR/WFP) 85 47 48 48 216 956 1,108 945
Debit -185 -185 -184 -182 0 0 0 0
Capital and financial account balance 643 2,402 2,771 1,752 29 1,917 3,110 809 (In percent of GDP) 1.2 4.5 4.6 3.0 0.1 6.3 14.7 5.8
Capital account 73 210 105 126 29 0 0 0Direct investment 1,466 2,570 2,286 1,395 0 0 0 0 Of which: Gas project-related 600 400 0 0 0 0 0 0Long-term government debt -302 -211 339 0 0 1,917 3,110 809
Disbursement 249 278 677 0 0 1,917 3,110 809Repayments -552 -489 -339 0 0 0 0 0
Short-term loans (net) 109 317 284 230 0 0 0 0 Receipts 1,912 2,179 2,622 2,302 0 0 0 0 Payments -1,803 -1,862 -2,338 -2,071 0 0 0 0Other -701 -483 -242 0 0 0 0 0
Errors and omissions 4,223 -1,880 0 0 0 0 0 0
Overall balance 4,993 -261 3,313 -424 -3,876 -4,488 -2,738 -4,105 (in percent of GDP) 9.5 -0.5 5.5 -0.7 -9.1 -14.7 -13.0 -29.3
Financing -4,993 261 -3,313 424 3,876 4,488 2,738 4,105 Convertible -5,002 266 -3,313 428 3,876 4,488 2,738 4,105 Central Bank -8,125 71 -3,313 428 3,876 4,488 2,738 4,105 Commercial Bank of Syria 3,123 195 0 0 0 0 0 0 Nonconvertible (Central Bank) 9 -5 0 -4 0 0 0 0 Financing gap 0 0 0 0 0 0 0 0
Memorandum items: Volume of crude oil exports ('000 barrels/day) 174 162 177 103 90 0 0 0 Volume of crude oil imports and petroleum ('000 barrels/day) 0 0 0 0 0 125 130 160 Non-oil export volume (percent change) 19.9 -17.1 8.9 -17.0 -17.3 -11.0 -11.1 -11.3 Non-oil import volume (percent change) 23.5 19.1 11.8 -13.6 -21.6 -11.8 -6.9 -1.0 Central Bank reserves ($ million) 17,039 17,412 20,725 20,297 12,373 7,886 5,148 1,043 (in months of imports of GNFS) 10.7 13.0 12.1 11.6 8.9 6.2 4.4 1.0 Government external debt ($ million) 3/ 5,189 5,110 5,487 5,487 5,487 7,404 10,514 11,323
(In percent of GDP) 9.9 9.5 9.1 9.3 12.9 24.3 49.7 80.8 GDP ($ billion) 4/ 52.6 53.9 60.0 58.9 42.4 30.4 21.1 14.0
Sources: Central Bank of Syria; Syrian Center for Policy Research, World Bank, UN Comtrade, and staff estimates and projections.
Proj.
1/ Beginning 2008, the foreign reserves held at the Commercial Bank of Syria were transferred to the Central Bank. 2/ Oil trade balance less profits of foreign companies. 3/ Officially acknowledged debt.4/ Nominal GDP