Embed Size (px)
Citation preview
System Configurations in U rhan Transportation Planning
HERBERT S. LEVINSON and KENNETH R. ROBERTS Respectively, Principal Associate, and Associate, Wilbur Smith and Associates, New Haven, Conn.
Urban transportation facilities should be planned, designed and operated as a unified system. Accordingly, some of their system configuration aspects are analyzed with emphasis on highway networks. Two approaches are utilized: (a) empirical analyses of existing and proposed systems; and (b) travel patterns simu -lated for a hypothetical community of nearly 3 million people with vehicular trips assigned to a series of alternate networks. Both studies clearly emphasize the importance of avoiding route convergence in areas of high trip density.
•URBAN transportation facilities should be planned, designed, and operated as a unified system. Despite the importance of transportation system considerations, prior emphasis has been largely placed on the many other aspects of urban transportation planning, such as land use-traffic generation quantification, and traffic distribution models.
The system concept, however, is usually the end result of the comprehensive transportation planning process (or, in more specific terms, the traffic engineer's operational analyses). Origin-destination (0- D) patterns, and urban trip linkages have little meaning to the road user, per se; his interest is in system efficiency, when and where he travels.
Accordingly, some general analyses on urban transportation system configuration are set forth. In developing systems (as in achieving transportation "balance") two basic criteria emerge. First, it is necessary to determine how much transportation can be provided within an urban area, by each of the various modes-this relates to desired levels of service and abilities to finance the recommended system. Second, it is necessary to determine the shape or configuration patterns of the recommended transportation system. The present study concentrates on this second aspect.
Most 0-D studies have compared alternate systems to some extent. Generally, they have emphasized effects of shifting alignments and/ or adding or subtracting links rather than altering configuration patterns.
The problem has been approached theoretically by Smeed in England (__!_). His studies indicate that average distances traveled by radial routings are 48 percent greater than ring routings, and 68 percent greater than direct routings where work places are uniformly distributed; when work places are proportional to distance, radial routings are 38 percent greater and ring routings 90 percent greater. Thus, high capacity radial routes continued to the center of town are likely to encourage people to travel by routes which pass through the central area.
This paper sets forth practical, observable characteristics of transportation systems and derives inferences based on planned systems; it also simulates loadings on hypothetical systems. It is an outgrowth of a study in process on urban transportation balance.
Paper sponsored by Special Co=ittee on Urban Transportation Research .
71
72
"Systems," as used herein, refer to the total regional street or transit network. This contrasts sharply with the system configuration aspects of site plans for shopping centers, world's fairs, or civic centers, or with the analysis of a particular route or interchange.
HISTORICAL, OBSERVABLE, AND EMPIRICAL RELATIONSHIPS
The street systems of the world's cities date to antiquity-to the grids of MohenjoDaro (2800-2500 B. C.) and to the random patterns of Athens and Pompeii. Historically, many urban circulation systems developed radially from downtown. This is particularly true of many street patterns in the Old World. It is also true in older American cities where plank roads, horse-car lines and railroad routes helped shape urban transportation and land-use patterns. Even today, for example, there are comparatively few crosstown public transportation routes except in larger cities. In contrast, most Spanish-American cities adapted to the grid system, as did cities laid out as part of public land's surveys (~).
Existing Systems in Perspective
A general overview of existing urban transportation systems provides a logical point of departure. History, topography, and economic factors, as well as community attitudes and entrepreneurial foresight influenced patterns.
Most rapid-transit routes developed radially from downtown, although circumferential routes were developed extensively in Paris and Berlin. Within the United States, radial routes predominate, except for a single crosstown facility between Brooklyn and Queens and the Bloor Street line under construction in Toronto. The latter, however, may be construed largely as a radial facility, and may serve to shift the focus of downtown to the Bloor-Yonge intersection.
Generally, rapid transit lines were located under or over streets, and followed direct and optimum alignments. The notable exceptions, however, were the many lines developed over alleys or at-grade in Chicago, often involving right-angle turns and located several blocks from major business centers; their poor alignment adversely influences patronage, particularly short-haul and non-CBD trips.
Urban street systems vary far more widely in terms of capacity and configuration. £astern cities-established long uefure the aul01uobile-often have narrow (and even discontinuous) arterial street systems; in contrast newer cities have wide multilane arterials (for example, Newport, R. I. , compared with Salt Lake City, Utah).
Urban street patterns combine radial circumferential and grid-iron configurations. Boston, Providence, Hartford, Nashville, and St. Louis, for example, have radial circumferential street patterns; the planned street systems of Buffalo, Washington, Detroit, and Indianapolis provide radial systems superimposed on grids; Manhattan, Chicago, Kansas City, Los Angeles, Philadelphia, San Francisco, Oklahoma City, Tulsa, Phoenix and Tucson have rectangular street grids (in some cases with a few radials superin1posed). The majority of radial routes in all cities focu.s on downtown ;
Each street pattern has its relative merHs. Radial streets, for example, will reduce travel distances, particularly to downtown. They are usually well developed in central cities and suburbs, whereas circumferential routes are notably absent from suburban areas. Radials can, however, develop undue convergence, especially on approaches to downtown.
Diagonal streets superimposed on grid-iron systems create capacity and congestion problems where they intersect grid arterials. In Chicago, for example, the major diagonal routes usually require multiphase signal controls where they cross section -line streets. But the absence of diagonal routes (e.g. , Tulsa) can create unduly heavy turning movements at conventional intersections, and also require multiphase signal operations.
Problem of Route Convergence
In most cities, major roadways generally converge on downtown and then traverse the central area. Thus daily, only one-third to one-half of all vehicular traffic enter-
73
ing downtown actually has its destination there (~, _1_). A considerable proportion of this non -CBD traffic would be divertible to alternate facilities, such as inner or intermediate freeway loops.
Undue convergence of transportation facilities, generally results in operational problems, inadequate capacity and queueing. Examples of convergence include the Santa Ana and San Bernardino Freeways , junction on the east side of the four- level interchange in Los Angeles, the Route 128 and Southeast Expressways converging on the Fitzgerald Expressway, in Boston and the Meadowbrook- Long Island Expressway Junction in Nassau County. In Boston, five street-car routes converge on a two-track Boylston Street Subway, frequently resulting in peak-hour delays. Similarly, before the opening of the State Street subway in Chicago, four northside rapid transit routes converged on a two-track approach to the Loop, resulting in backups over two miles during the morning peak hours. Problems of convergence are also endemic in sections of the New York subway system; therefore, they are not limited to any particular mode of transportation.
The focusing of all streets on downtown should be carefully re-evaluated in light of current travel patterns, and anticipated growth trends. In most large cities, generally less than 10 percent of all motor vehicle trips have origins or destinations in the CBD (Table 1). Similarly, within the next 20 years, the greatest growths in travel can be expected between non-downtown locations (Table 2).
A fundamental question is, therefore, if the majority of all urban motor vehicle trips do not have origins or destinations downtown, why focus all freeway routes within the urban area on the CBD? Moreover, since convergence of routes develops difficult problems of balancing capacities, can a freeway system be developed that avoids undue route convergence, particularly in central areas?
System Configuration Alternatives
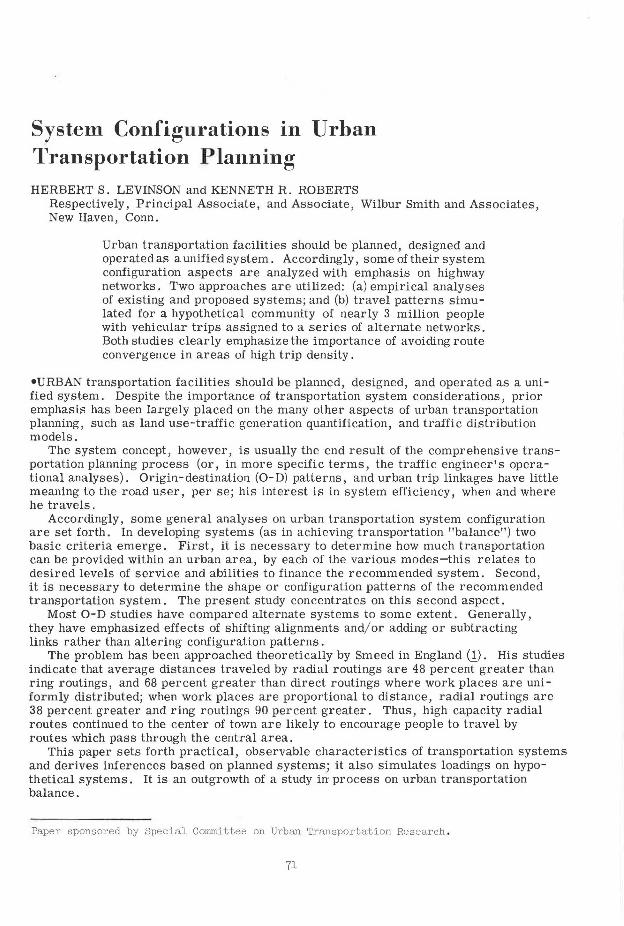
The optimum urban freeway configuration will obviously depend on urban area land use, topography, and street patterns. Freeway systems (Fig. 1) include four types of particular interest (also, see~ and~).
Single Route. - In all but the smallest TABLE 1 urban areas, more than a single free
way will be required to (a) provide areawide distribution and (b) to avoid overloads. The Hollywood Freeway, Long Island Expressway, and Fitzgerald Expressway illustrate single radial routes in large urban areas.
PERCENT OF URBAN AREA AUTO DRIVER AND PASSENGER TRIPS MADE TO OR FROM THE CBIJ'l
Radial Systems. - Radial systems of freeways conform to the radial patterns of urban travel. They reduce vehiclemiles of travel for downtown oriented trips, adapt to varying conditions of topog-
Urban Area
Chicago Philadelphia Detroit Washington, D. C, Pittsburgh Minneapolis-St . Paul St. Louis Houston Kansas City Phoenix Nashville Tucson
Year
1956 1960 1953 1955 1958 1958 1957 1953 1957 1957 1959 1960
:computed from 0-D studies in each urban area. Zero sector.
cMinneapolis CBD.
TABLE 2
GROWTH INDICESa IN SELECTED URBAN AREAS (Percent Increase to 1980)
City and Study Year
C V h Yehl. cle- Pcc_BrllDOI\ Population Ow"-,,"'cd Teri1·pcsle Miles Tril>S
Chicago, 1956 51 94 79 120 10 Detroit 1 1953 48 61 67 75 22 Washi ngton, 1955 73 114 100 177 26 Pittsburgh, 1958 29 66 75 60 B
acamputed from 0 - D studies; also see ref. @.
Non- CBD Person Trips
80 85
135 66
Percent
3. S 3.4 6. 5
25 . 30 7.9 9.4° 6.4
12. 2 8. 7
14. 8 14.1 10, 8
74
• GRIDIRON
RADIAL WITH C B D LOOP
RADIAL - CIRCUMFERENTIAL
RADIAL
RADIAL - CIRCUMFERENTIAL
RADIAL· GRIDIRON
raphy, and encourage corridor expansion . Generally, they have variable spacing between routes, although their tributary populations may be the same. They may engender high concentrations along closein portions of freeways, involve convergence of routes, funnel all freeway traffic into system focal points, and require varying amounts of surface street travel. Moreover, radial freeways alone do not serve the rapidly growing circumferential trip linkages.
Radial Circumferential Pattern. -Radialcircumferential patterns (or a variant, radial freeways interconnected by a down -town freeway loop) have been traditionally planned in many urban areas. Such systems vastly improve the accessibility and trading area of downtown, expecially in small- or medium -sized areas. They provide an even distribution of facilities with demands and afford direct access among all parts of the urban area.
The systems, however, focus routes on downtown, making travel through downtown the most direct route for many non-CBD linkages. They may, therefore, achieve high traffic concentrations on close-in
, freeway sections and also involve some Typical urban freeway system route convergence with complex inter-configurations.
Figure 1.
changes. Grid-Iron Pattern. -Grid-iron freeway
patterns are simple and regular in their design and spacing. They avoid undue route convergence and focus, and enable downtown loop freeways to serve primarily downtown. They tend to equalize growth opportunities for all parts of the region. They do not, however, necessarily adapt to areas with restricted topography.
Some Empirical Investigations
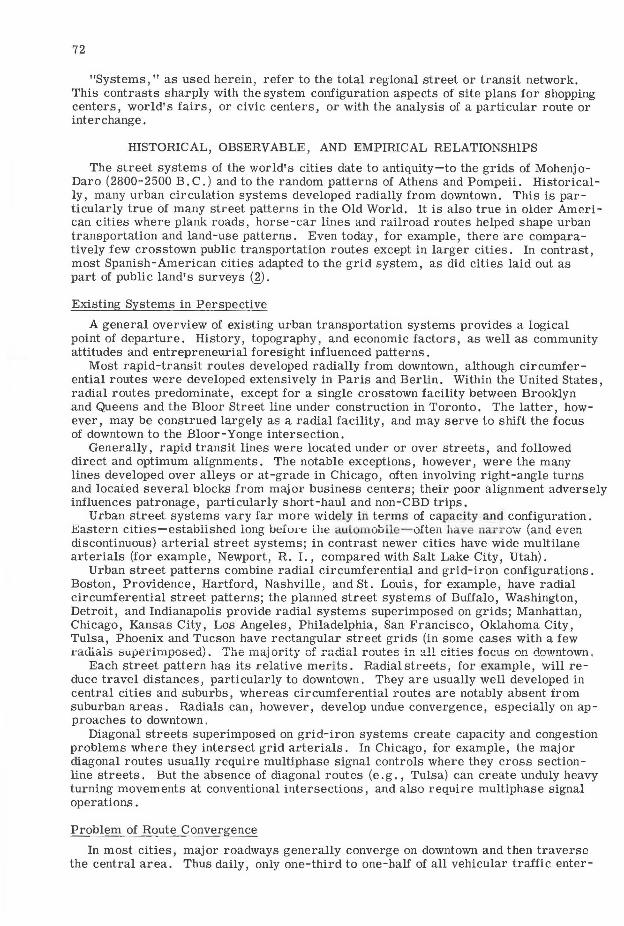
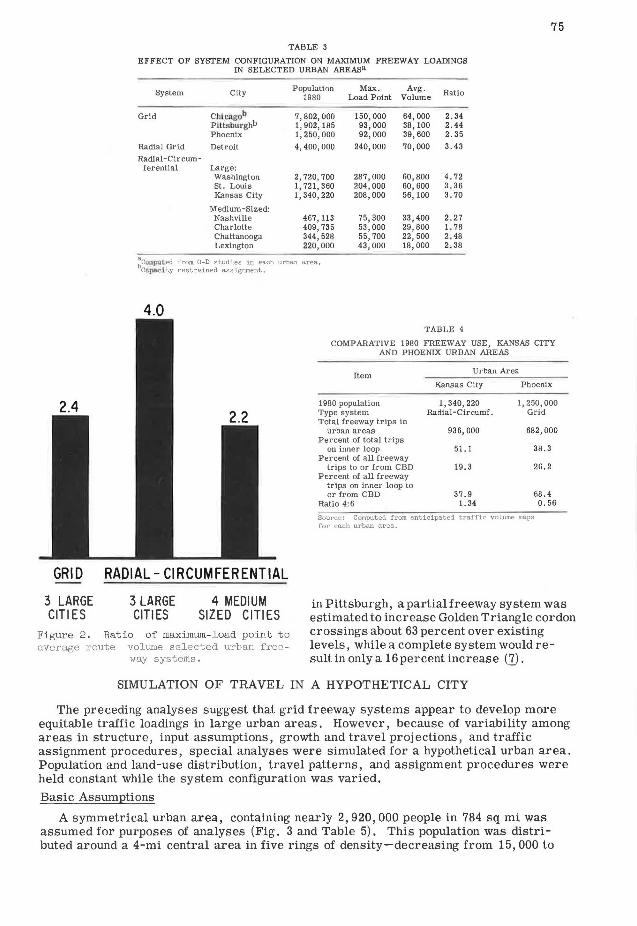
To investigate the effect of alternate configurations, the relation between maximum and average loadings on selected urban freeway systems was analyzed (Table 3 and ~'ig. 2). The ratio between anticipated 111axiinurn 1980 load=point volumes and average volumes approximates 2. 4 for grid systems in large cities, 4. 0 for radial-cir cum -f erential systems in large cities and 2. 2 in medium -siz.ed cities.
The relative use of downtown freeway loops by through and CBD traffic provides another measure of the "convergence aspects" of urban freeways. Anticipated 1980 use of freeways in Kansas City and Phoenix is compared in Table 4. Both cities would have a 1980 population of about 1,250,000. In Kansas City, with a radial circumferential system, approximately 51 percent of all freeway trips would enter the inner loop as compared with 38 in Pheonix. However, 68 percent of all inner loop freeway trips in Phoenix would have origins or destinations in the CBD as compared with only 38 in Kansas City. Thus, Kansas City's inner loop freeways would carry predominantly non-downtown trips.
Analyses of two partial freeway systems clearly clenote the desirability of system continuity. In Los Angeles, completion of the south (Santa Monica Freeway) leg of the Inner Loop, delivered 40,000 additional vehicles daily into the freeway system-these vehicles negotiated a "U" type routing to avoid more direct arterial travel. Similarly,
GRID
3 LARGE CITIES
75
TABLE 3
EFFECT OF SYSTEM CONFIGURATION ON MAXIMUM FREEWAY LOADINGS IN SELECTED URBAN AREASa
System Ciiy Population Max, Avg . Ratio 1980 Load Point Volume
Grid Chlcagob 7,802,000 150, 000 64, 000 2. 34 Plltsburghb 1,902, 185 93, 000 38 , 100 2. 44 Phoenix 1, 250, 000 92, 000 39,600 2 . 35
Radial Grid Detroit 4, 400,000 240,000 70,000 3. 43
Radial-Circum-ferential Large:
Washington 2, 720 , 700 287, 000 60 ,800 4. 72 St. Louis 1, 721 , 360 204, 000 60, 600 3 . 36 Kansas City 1, 340,220 208,000 56, 100 3. 70
Medium-Sized: Nashville 467,113 75 , 300 33 , 400 2. 27 Charlotte 409, 735 53, 000 29,800 1. 78 Chattanooga 344, 528 55 ,700 22,500 2, 48 Lexington 220,000 43,000 18 ,000 2.38
~CCII\JNted from 0-D studies in each urban area , CApncity restre,ined assignment ,
4.0
RADIAL- CIRCUMFERENTIAL
3 LARGE CITIES
4 MEDIUM SIZED CITIES
TABLE 4
COMPARATIVE 1980 FREEWAY USE, KANSAS CITY AND PHOENIX URBAN AREAS
Item Urban Area
Kansas City Phoenix
1980 population 1,340 ,220 1,250,000 Type system Radial-Circumf . Grid Total freeway trips in
urban areas 936, 000 682,000 Percent of total trips
on inner loop 51.1 38 . 3 Percent of all freeway
trips to or from CBD 19 . 3 26 , 2 Percent of all freeway
trips on inner loop to or from CBD 37. 9 68.4
Ratio 4:6 !. 34 0 . 56
Source: Computed from ant icipated traffic volume maps for each urban area,
Figure 2 . Ratio of maximum- load point to average route volume selected urban free
way systems .
in Pittsburgh, a partial freeway system was estimated to increase Golden Triangle cordon crossings about 63 percent over existing levels , while a complete system would result in only a 16percent increase ('I).
SIMULATION OF TRAVEL IN A HYPOTHETICAL CITY
The preceding analyses suggest that grid freeway systems appear to develop more equitable traffic loadings in large urban areas. However, because of variability among areas in structure, input assumptions, growth and travel projections , and traffic assignment procedures , special analyses were simulated for a hypothetical urban area . Population and land-use distribution, travel patterns , and assignment procedures were held constant while the system configuration was varied.
Basic Assumptions
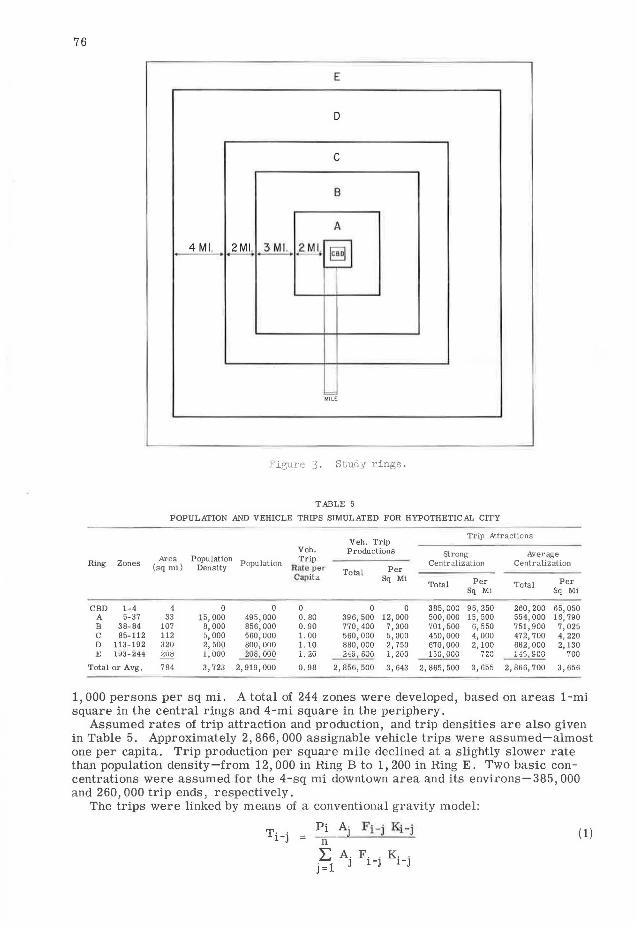
A symmetrical urban area, containing nearly 2,920,000 people in 784 sq mi was assumed for purposes of analyses (Fig. 3 and Table 5). This population was distributed around a 4-mi central area in five rings of density-decreasing from 15,000 to
76
E
D
C
B
A
4M I. 2MI. 3 Ml. 2 ML §]
= MI LE
Figure 3 . Study rings.
TABLE 5
POPULATION AND VEHICLE TRIPS SIMULATED FOR HYPOTHETIC AL CITY
Veh. Trip Trip Attr ac tions
Veh. Productions Strong Average Ring Zones
Area Population P opulation Trip Cent r aliz ation Cent r alization (sq mi) Density Rntc per Total Per
Capita Sq Ml Per Per Total Total Sq Mi Sq Mi
CBD 1-4 4 0 0 0 0 0 385,000 96,250 260,200 65, 050 A 5-37 33 15,000 495,000 0. 80 396, 500 12,000 500,000 15,500 554,000 16, 790 B 38-84 107 8,000 856, 000 0. 90 770,400 7,300 701,500 6,550 751,900 7,025 C 85-112 112 5,000 560,000 1. 00 560,000 5,000 450,000 4,000 472,700 4, 220 D 113-192 320 2,500 800,000 1. 10 880,000 2,750 670,000 2, 100 682,000 2,130 J,; rn~-i44 208 1,000 208,000 i. 20 249! 600 1,200 1 GO, 000 720 145, sec 700
Total or Avg. 784 3, 723 2, 919,000 0. 98 2, 856, 500 3, 643 2,865,500 3,655 2,866,700 3,656
1, 000 persons per sq mi, A total of 244 zones were developed, based on areas 1-mi square in the central rings and 4-mi square in the periphery.
Assumed rates of trip attraction and production, and trip densities are also given in Table 5. Approximately 2,866,000 assignable vehicle trips were assumed-almost one per capita. Trip production per square mile declined at a slightly slower rate than population density-from 12,000 in Ring B to 1,200 in Ring E. Two basic concentrations were assumed for the 4-sq mi downtown area and its environs-385, 000 and 260,000 trip ends, respectively.
The trips were linked by means of a conventional gravity model:
Ti-j Pi A Fi-j Ki-j (1) = J
n
I: A. F. K. . j=l
1 -j 1-J
in which
Pi = productions in zone i;
Aj = attractions in zone j;
F- . = friction factor between zones i and 1· ,· l -J
T. . = trips from zone i to zone j; l -J
~-j = "kay" factor between zones i and j, assumed as 1. O; and
n = number of zones.
77
A sufficient number of iterations were run to converge the trips attracted to within 5 percent of the trip attraction in each ring. The friction factor curve was based on that developed for a large metropolitan area of comparable population. The resulting trip lengths averaged about 20 minutes. Eighty-five percent of all trips were 30 minutes or less and trips under 3 minutes accounted for only 10 percent of the total.
Thus, the trip estimates did not fully include intrazonal trips, which could substantially increase the number of trips without any substantial change in the total number of vehicle-miles. (To some extent, the long average trip length serves to compensate for exclusion of commercial vehicles and external trips.)
The gravity model was based on minimum time paths between zones on Freeway System 1. A 2-mi arterial street grid was assumed to cover areas outside of the intermediate loop freeway and a 1-mi grid was assumed within the loop. Local streets were spaced at intermediate distances. Speeds were assumed at 15 mph on local streets, 25 mph on arterials and 45 mph on freeways; these speeds are consistent with general practice. A 15-sec turn penalty was added at intersections to eliminate zigzag routings. Traffic was assigned on all-or-nothing allocation basis according to minimum travel time paths. The system configuration required access to and from zone centroids via arterial streets. Only arterials were connected directly to the freeway system.
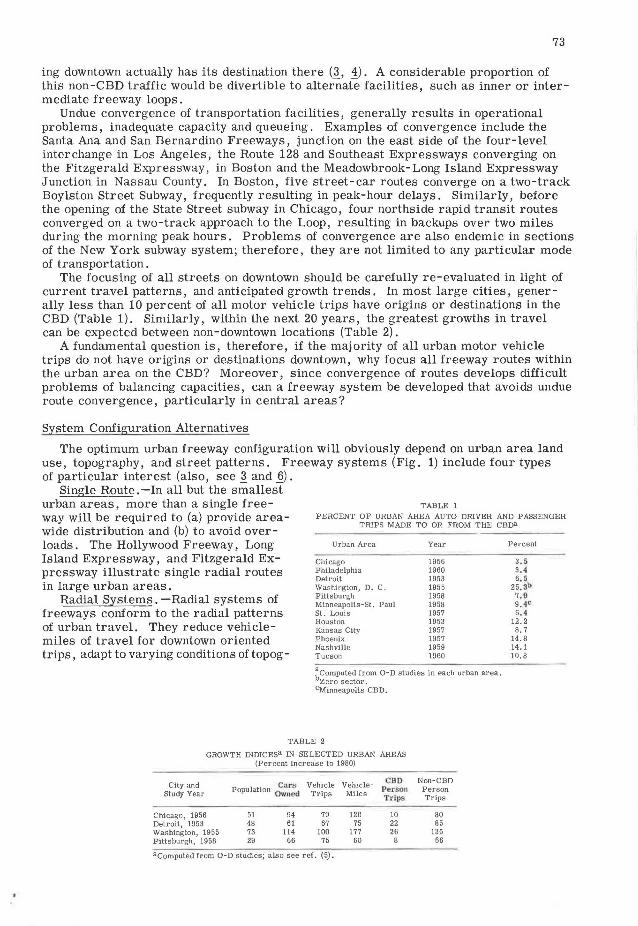
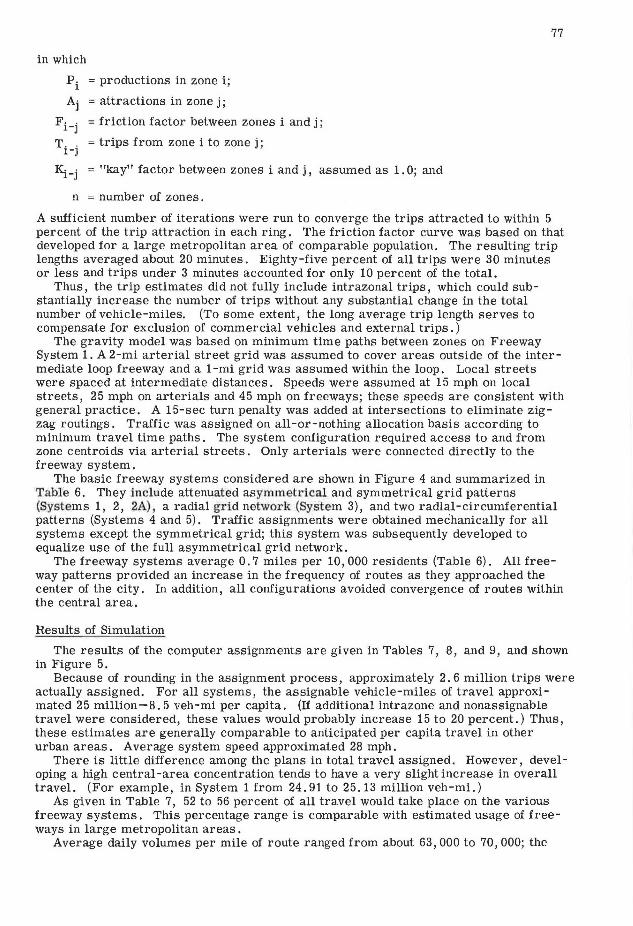
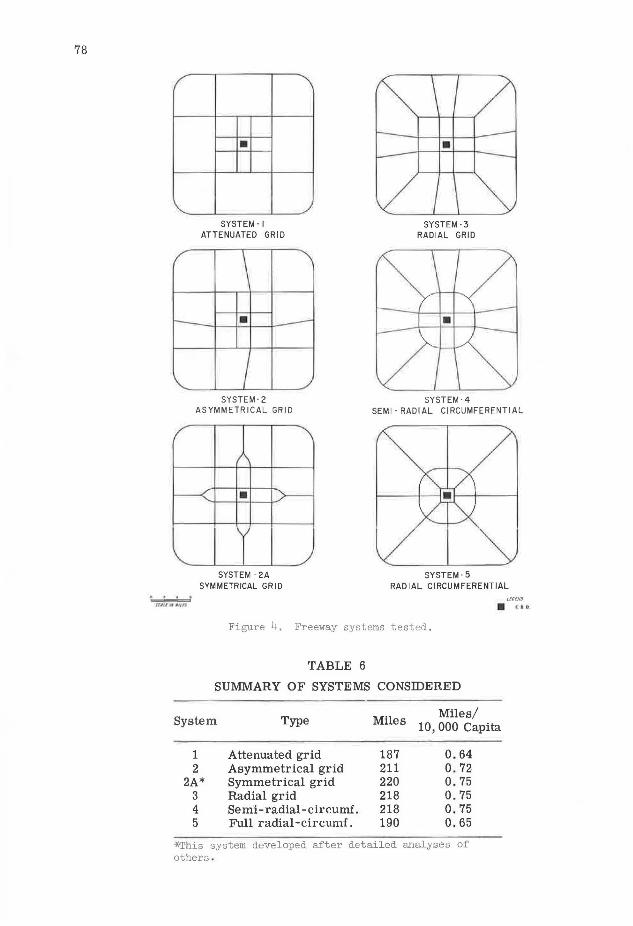
The basic freeway systems considered are shown in Figure 4 and summarized in Table 6. They include attenuated asymmetrical and symmetrical grid patterns (Systems 1, 2, 2A), a radial grid network (System 3), and two radial-circumferential patterns (Systems 4 and 5). Traffic assignments were obtained mechanically for all systems except the symmetrical grid; this system was subsequently developed to equalize use of the full asymmetrical grid network.
The freeway systems average O. 7 miles per 10,000 residents (Table 6). All freeway patterns provided an increase in the frequency of routes as they approached the center of the city. In addition, all configurations avoided convergence of routes within the central area.
Results of Simulation
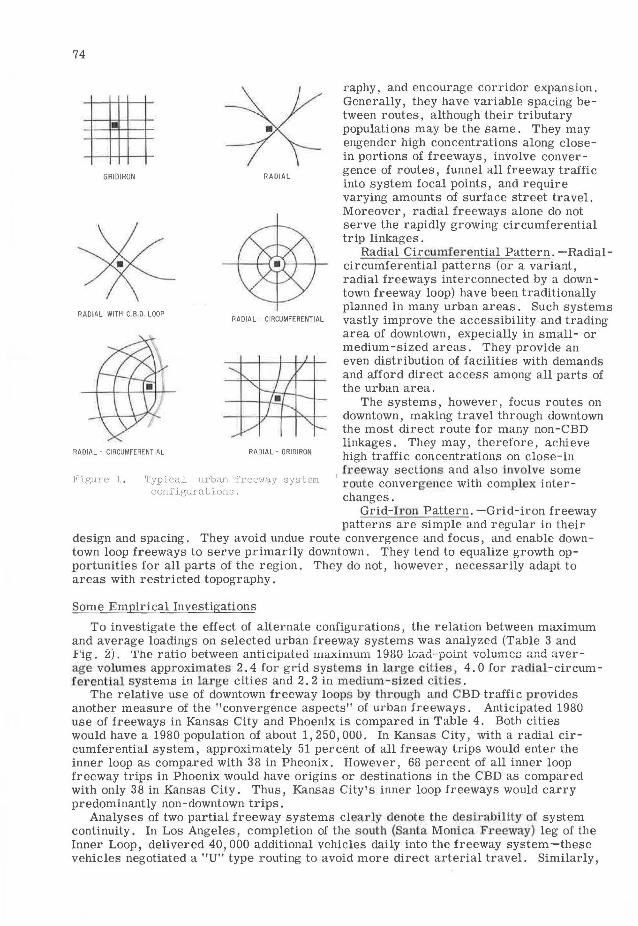
The results of the computer assignments are given in Tables 7, 8, and 9, and shown in Figure 5.
Because of rounding in the assignment process, approximately 2. 6 million trips were actually assigned. For all systems, the assignable vehicle-miles of travel approxi -mated 2 5 million -8. 5 veh-mi per capita. (If additional intrazone and nonassignable travel were considered, these values would probably increase 15 to 20 percent.) Thus, these estimates are generally comparable to anticipated per capita travel in other urban areas. Average system speed approximated 28 mph.
There is little difference among the plans in total travel assigned. However, developing a high central-area concentration tends to have a very slight increase in overall travel. (For example, in System 1 from 24.91 to 25.13 million veh-mi.)
As given in Table 7, 52 to 56 percent of all travel would take place on the various freeway systems. This percentage range is comparable with estimated usage of freeways in large metropolitan areas.
Average daily volumes per mile of route ranged from about 63,000 to 70,000; the
78
/
/
--
'--
•
SYSTEM· I ATTENUATED GRID
\ •
I
---
•
SYSTEM - 3 RAD IAL GRID
SYSTEM ·4 SYSTEM-2 ASYMMETRICAL GRID SEMI· RADIAL CIRCUMFERENTIAL
SYSTEM - 5 SYSTEM - 2A SYMMETRICAL GRID RADIAL CIRCUMFERENTIAL
Figure 4. Freeway systems tested.
TABLE 6
SUMlVIARY OF SYSTEMS CONSIDERED
/£UNO
• tllOI
System Type M.1 Miles/ 1 es 10, 000 Capita
1 2
2A* 3 4 5
Attenuated grid Asymmetrical grid Symmetrical grid Radial grid Semi-radial-circumf. Full radial -circumf.
187 211 220 218 218 190
0.64 0.72 0.75 0. 75 0.75 0.65
-l<This system developed after detailed analyses of others .
79
TABLE 7
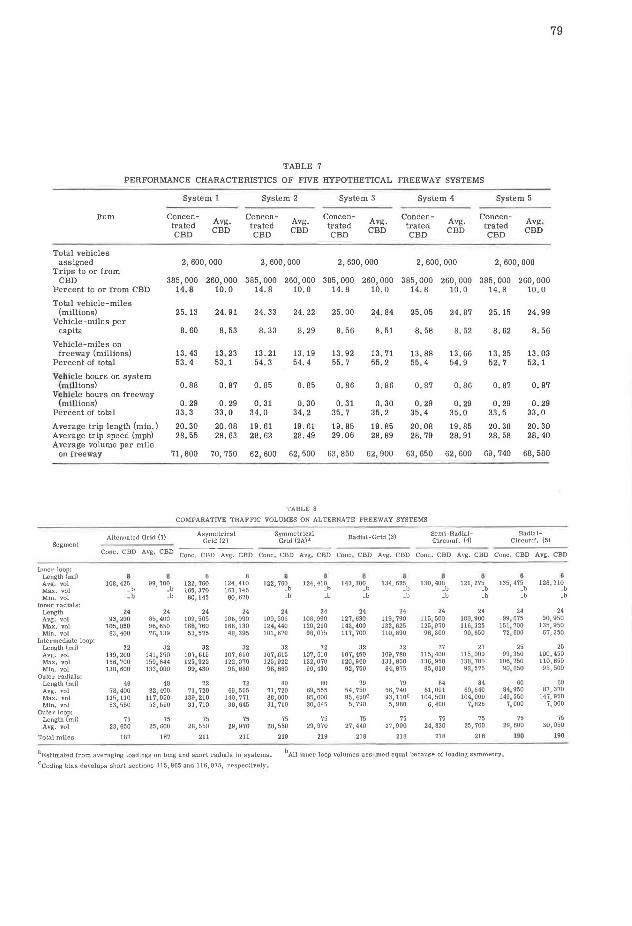
PERFORMANCE CHARACTERISTICS OF FIVE HYPOTHETICAL FREEWAY SYSTEMS
System 1 System 2 System 3 System 4 System 5
Item Concen-Avg. Concen- Avg.
Concen-Avg. Concen-
Avg. Concen-
Avg. trated !rated !rated !rated !rated CBD CBD CBD CBD CBD CBD CBD CBD CED CED
Total vehicles assigned 2,600,000 2,600,000 2,600,000 2,600,000 2,600,000
Trips to or from CED 385,000 260,000 385,000 260,000 385,000 260,000 385,000 260,000 385,000 260, 000
Percent to or from CBD 14.8 10.0 14. 8 10. 0 14. 8 10.0 14. 8 10. 0 14. 8 10. 0
Total vehicle-miles (millions) 25. 13 24. 91 24. 33 24. 22 25. 00 24. 84 25. 05 24. 87 25.15 24. 99
Vehicle-miles per capita 8. 60 8. 53 8. 33 8. 29 8. 56 8. 51 8. 58 8. 52 8. 62 8. 56
Vehicle -miles on freeway (millions) 13. 43 13. 23 13. 21 13 . 19 13 . 92 13. 71 13. 88 13 . 66 13. 25 13 . 03
Percent of total 53. 4 53 . 1 54. 3 54. 4 55. 7 55. 2 55. 4 54. 9 52. 7 52. 1
Vehicle hours on system (millions) o. 88 o. 87 o. 85 0. 85 o. 86 o. 86 o. 87 o. 86 0. 87 o. 87
Vehicle hours on freeway (mlllions) 0. 29 0. 29 0. 31 0. 30 o. 31 0.30 0 . 29 o. 29 o. 29 o. 29
Percent of total 33. 3 33. 0 34. 0 34. 2 35. 7 35. 2 35. 4 35. 0 33. 5 33 . 0
Average trip length (min.) 20. 30 20. 08 19. 61 19. 61 19. 85 19. 85 20. 08 19. 85 20. 30 20. 30 Average trip speed (mph) 28. 55 28. 63 28. 62 28. 49 29.06 28. 89 28. 79 28 . 91 28. 58 28.40 Average volume per mile
on freeway 71 , 800 70 , 750 62,600 62 , 500 63,850 62,900 63,650 62,600 69, 740 68,580
J'A8LE 8
COMPARATIVE TRAFFIC VOLUMES ON ALTERNATE FREEWAY SYSTEMS
Altenualed Grid (1) Asymetrical Symmetrical Radial-Grid (3) Semi-Radial- Radial-
Grid (2) Grid (2A)a Circumf. (4) Clrcumf. (5) Segment
Cone. CBO Avg. CBD Cone . CBD Avg. CBD Cone. CBD Avg. CBD Cone, CBD Avg. CBD Cone. CBD Avg. CBD Cone. CBD Avg. CBD
Inner loop: Length (mil a 8 8 8 a 8 8 I a B Avg. vol 10B, 425 99,700 122,760 124 , 410 122, 76~b 124, 4l~b 143, 30~b 134,625 130,400 121,275 135,475 128,310 Max. vol _b _b 165,370 163,145 _b _b _b _b -b
Min. vol _,, _b 80,145 BO, 6'10 _b _b _b _b _b _b _b _b
Inner radials: Length 24 24 24 24 24 24 24 24 24 24 24 24 Avg. vol 93, 200 85, 400 109. 505 106,990 109,505 106,990 127,630 119,790 115, 500 100. 900 99 , 675 90,950 Max. vol 105, 850 96,650 168, 760 166,130 124,440 120,210 142, 400 133,625 125,970 116, 325 151,700 135,950 Min. vol 83,400 76,139 53,575 48,395 101,670 98,075 117,700 110,890 98,300 90,650 72,600 67,350
Intermediate loop: Length (mi) 32 32 32 32 32 32 32 32 27 27 25 25 Avg. vol 139, 200 141. 350 107,615 107,610 107,615 107,610 107, 450 109,780 1151 400 115, 000 99,350 100,450 Max. vol 156,700 159,644 125, 922 122,070 125,922 122,070 120. 960 131,850 136. 950 138,700 106,750 110,650 Min . vol 130,600 133,000 99,430 98,880 98, 880 99,430 92 , 750 84. 875 85,810 921 575 90,650 95,500
Outer radials: Length (mi) 48 48 72 72 80 80 79 79 84 84 60 60 Avg. ,101 78,400 82,400 71. 720 69,555 71,720 69,555 54,750 56,740 61,091 60,640 84,950 83,370
Max. vol 115,110 117,950 139, 210 140,771 88,000 851000 95, 450c 93, noc 104,500 1041 000 149,550 147,950
Min. vol 53,550 53. 550 31,710 30,845 31. 710 30 , 645 5,790 5,980 6,400 7,825 7,000 7,000 Outer loop:
Length (mt) 75 75 75 75 75 75 75 75 75 75 75 75 Avg. vol 23,650 25,600 28,550 29,970 26,550 29,970 27,440 27,990 24,830 25,700 29,600 30,050
Total miles 187 187 211 211 219 219 218 218 218 218 lDO 190
aEstimated from averaging loadings on long and short radials ln systems. b All Inner loop volumes assumed equal because of Loading symmetry.
cCoding bias develops short sections 115,965 and 116,075, respectively .
80
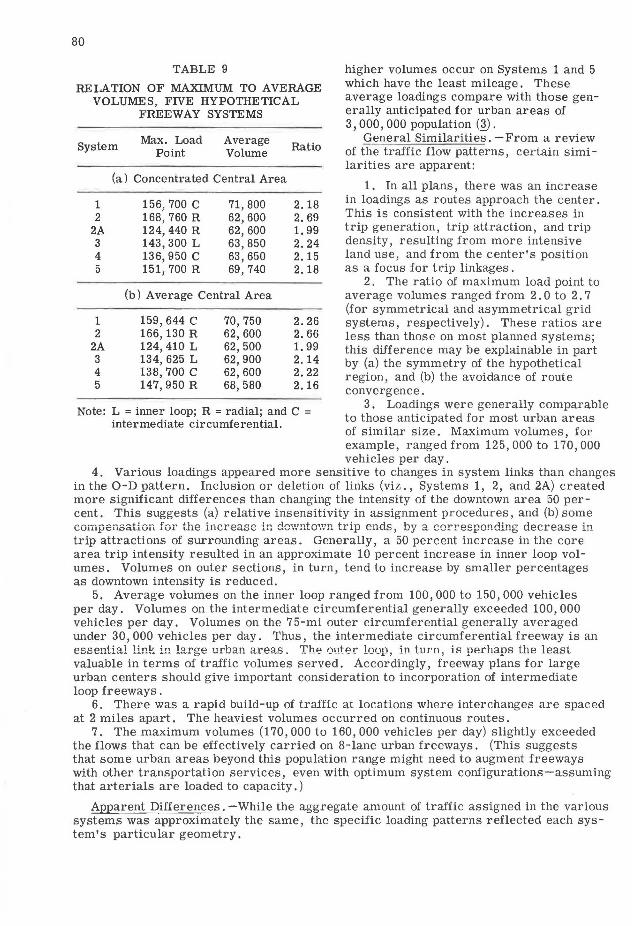
TABLE 9
RELATION OF MAXIMUM TO AVERAGE VOLUMES, FIVE HYPOTHETICAL
FREEWAY SYSTEMS
System Max. Load Point
Average Volume
(a) Concentrated Central Area
1 2
2A 3 4 5
1 2
2A 3 4 5
156, 700 C 71,800 168,760 R 62,600 124,440 R 62,600 143,300 L 63,850 136, 950 C 63,650 151, 700 R 69,740
(b) Average Central Area
159, 644 C 166, 130 R 124,410 L 134, 625 L 138,700 C 147,950 R
70,750 62,600 62,500 62,900 62,600 68,580
Ratio
2.18 2.69 1. 99 2.24 2.15 2.18
2.26 2.66 1. 99 2.14 2.22 2.16
Note: L = inner loop; R = radial; and C = intermediate circumferential.
higher volumes occur on Systems 1 and 5 which have the least mileage. These average loadings compare with those generally anticipated for urban areas of 3, 000, 000 population (1) .
General Similarities. -From a review of the traffic flow patterns, certain simi -larities are apparent:
1. In all plans , there was an increase in loadings as routes approach the center. This is consistent with the increases in trip generation, trip attraction, and trip density, resulting from more intensive land use, and from the center's position as a focus for trip linkages.
2. The ratio of maximum load point to average volumes ranged from 2.0 to 2. 7 (for symmetrical and asymmetrical grid systems, respectively). These ratios are less than those on most planned systems; this difference may be explainable in part by (a) the symmetry of the hypothetical region, and (b) the avoidance of route convergence.
3. Loadings were generally comparable to those anticipated for most urban areas of similar size. Maximum volumes, for example, ranged from 125,000 to 170,000 vehicles per day.
4. Various loadings appeared more sensitive to changes in system links than changes in the 0-D pattern. Inclusion or deletion of links (viz., Systems 1, 2, and 2A) created more significant differences than changing the intensity of the downtown area 50 percent. This suggests (a) relative insensitivity in assignment procedures, and (b) some compensation for the increase in do,vntov1n trip ends, by a corresponding decrease in trip attractions of surrounding areas. Generally, a 50 percent increase in the core area trip intensity resulted in an approximate 10 percent increase in inner loop volumes. Volumes on outer sections, in turn, tend to increase by smaller percentages as downtown intensity is reduced.
5. Average volumes on the inner loop ranged from 100,000 to 150,000 vehicles per day. Volumes on the intermediate circumferential generally exceeded 100,000 vehicles per day. Volumes on the 75-mi outer circumferential generally averaged under 30, 000 vehicles per day. Thus, the intermediate circumferential freeway is an essential link in large urban areas. The outer loop, in turn, i R perhaps the least valuable in terms of traffic volumes served. Accordingly, freeway plans for large urban centers should give important consideration to incorporation of intermediate loop freeways .
6. There was a rapid build-up of traffic at locations where interchanges are spaced at 2 miles apart. The heaviest volumes occurred on continuous routes.
7. The maximum volumes (170,000 to 160,000 vehicles per day) slightly exceeded the flows that can be effectively carried on 8-lane urban freeways. (This suggests that some urban areas beyond this population range might need to augment freeways with other transportation services, even with optimum system configurations-assuming that arterials are loaded to capacity. )
Apparent Differences. -While the aggregate amount of traffic assigned in the various systems was approximately the same, the specific loading patterns reflected each system's particular geometry.
r
r
G I t •
SCAlE IN llllfS
ti• c&O
•
SYSTEM I
,
I I -- -I
SYSTEM 2
..,, , u.,..,._lf!INTS•IW"AH.101 " c:11111u~ •~ot. u11--.c-r,
SYS TEM 3
SYSTEM 4
SYSTEM 5
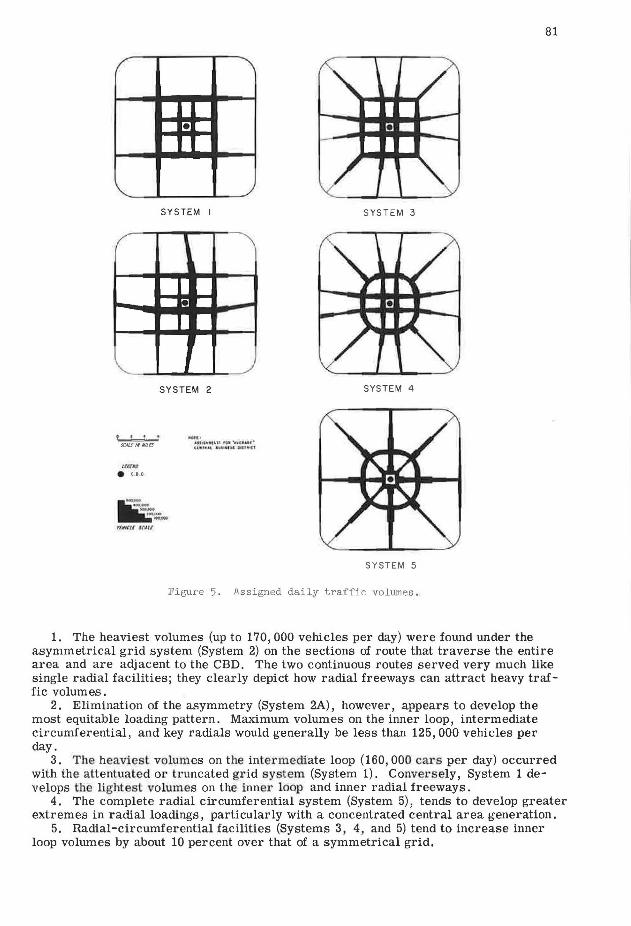
Figure 5, Assigned daily traffic volumes.
81
1. The heaviest volumes (up to 170, 000 vehicles per day) were found under the asymmetrical grid system (System 2) on the sections of route that traverse the entire area and are adjacent to the CBD. The two continuous routes served very much like single radial facilities; they clearly depict how radial freeways can attract heavy traffic volumes.
2. Elimination of the asymmetry (System 2A), however, appears to develop the most equitable loading pattern. Maximum vol um es on the inner loop, intermediate circumferential, and key radials would generally be less than 125,000 vehicles per day.
3. The heaviest volumes on the intermediate loop (160,000 cars per day) occurred with the a ttentuated or truncated grid system (System 1). Convers ely, System 1 develops t he lightest volumes on the inner loop and inner radial freeways.
4. The complete radial circumferential system (System 5), tends to develop greater extremes in radial loadings, particularly with a concentrated central area generation.
5. Radial-circumferential facilities (Systems 3, 4 , and 5) tend to increase inner loop volumes by about 10 percent over that of a symmetrical grid.
82
6. The differences in inner loop use do not, however, appear significant among the various systems. However, the complete radial-circumferential network (System 5) has the tightest loop in area. Thus, it is subject to eight freeway interchanges as compared with four on the other systems. This suggests more difficult geometry, and increased intra-stream conflicts.
Evaluation
The hypothetical study represents a pilot attempt at synthesizing urban travel patterns and freeway loadings. The conclusions derived, therefore, are merely suggestive, and are obviously subject to additional refinement and verification.
The study achieves realistic traffic volume patterns consistent in magnitude and spatial location to those found in urban areas of comparable size. It shows that loadings are more sensitive to adding, deleting, or "warping" links, than to downtown concentration, per se. It shows how system continuity, i.e., extending freeway routes throughout an urban area, tends to maximize their use. It demonstrates the importance of the intermediate freeway loop in large urban areas. Moreover, the importance of avoiding route convergence is clearly indicated.
The study suggests that a carefully designed grid system would achieve a more equitable loading system than a radial-circumferential system with fewer operating problems on the inner loop. But the distinction is not clear, particularly in light of the study limitations.
To develop a workable model, it was necessary to oversimplify study networks and trip-distribution patterns. Yet, despite these limitations, the study appears to represent a feasible prototype for subsequent analyses.
The traffic patterns obtained, for example, are generally similar to those set forth by Fisher and Boukidis (~). However, the differences between radial and grid systems are somewhat less pronounced. The study also tends to verify some of the system planning criteria set forth in recent transportation studies.
EMERGENT PRINCIPLES AND CONCLUSIONS
In analyzing and appraising freeway system configuration, it is often hard to rely on precise quantification alone. Just as in the analysis of simple traffic designs, oneway systems, intersP.ction channelizations, and site plans. the total design should look natural and prove workable. Accordingly, various system planning principles emerge from the analyses set forth herein, in terms of both system operations and relation to the urban environment. These principles include:
1. System permanence-The relation of the system to the permanent elements of urban structure, and the avoidance of compromises in structure or configuration.
2. System adaptability-The ability to work under alternative loading patterns or land-use plans, since, in the final analysis, any future loadings represent a projection that may or may not be actually achieved.
3. Conlinuity of capacity -=-The minimization of differentials in capacity bet,veen various points along the system.
4. Equalization of lane densities-A changing of lanes only at locations where comparable changes in the overall traffic magnitudes are anticipated.
5. Regularity and clarity-Provision of a clearly discernible and easily recognizable pattern. The elimination of multiphase or offset intersections has its counterpart in freeway system configuration; offsets and stubs should be avoided.
One basic principle emerges from the various studies set forth herein: Urban freeway systems should be carefully designed to avoid route convergence in central areas. The analyses also suggest the desirability of grid, rather than radial, freeway systems in large urban areas. It is, of course, recognized that the freeway system should adapt to the urban street configuration, and to topographic and land-use controls.
One of the most significant conclusions emerges as a by-product of the study. The synthesis of the urban travel and freeway traffic volumes, although still in initial stages, appears feasible and desirable. This pilot study suggests that, given the
83
population distribution for an urban area, its basic land form and geography and various system geometrics, future freeway traffic volumes might be developed with less dependence on precise trip allocation models.
REFERENCES
1. Smeed, R. J., "Route Development in Urban Areas: Part 1, The Effect of Some Kinds of Routing Systems on the Amount of Traffic in the Central Area of Towns." Jour. Inst. of Hwy. Engineers, Vol. 10, No. 1, p. 5-30 (Jan. 1963).
2. Stanislawski, D., "The Origin and Spread of the Grid Pattern Town." Geographic Review, Vol. XXVI, No. 1, p. 105-120 (1946).
3. "Future Highways and Urban Growth." Wilbur Smith and Associates (1961). 4. Schmidt, R. E., and Campbell, M. D., "Highway Traffic Estimation." Eno
Foundation, Saugatuck, Conn. 5. "Urban Transportation Issues and Trends." Automobile Manufacturers Assoc.,
Detroit (June 1963). 6. "Chicago Area Transportation Study." Vol. 3 (1963). 7 . Pittsburgh Area Transportation Study, Vol. 3 . 8. Fisher, H. J. , and Boukidis, N. A. , "The Consequences of Obliquity in Arterial
Systems." Traffic Quarterly (Jan. 1963).