Embed Size (px)
Citation preview

83A. Reiterer, A. Wagner – System Considerations of an Image Assisted Total Station – Evaluation and Assessment
Fachbeitrag begutachtet |
System Considerations of an Image Assisted Total Station – Evaluation and Assessment Systembetrachtungen einer bildgestützten Totalstation – Evaluierung und EinordnungAlexander Reiterer, Andreas Wagner
To close the gap between existing low-resolution, medium-accuracy sensors and conventional (co-op-
erative target-based) surveying systems, Image Assisted Total Stations are a promising solution. The
combination of image-based measurement methods with a motorized total station enables the develop-
ment of a highly accurate and fully-automated point detection system. The study at hand evaluates this
new multi-sensor system with regard to the image components. The evaluation includes a comparison of
different image-based measurement methods, an investigation regarding the precision, an assessment
of target/object size and rotation, and a long-time stability test. An estimation of the potential of Image
Assisted Total Stations for the future completes this study resulting in a broad overview of these new
measurement systems.
Keywords: Image Assisted Total Station, Image Point Detection, Edge Detection, Template Matching.
Bildgestützte Tachymeter stellen eine vielversprechende Neuentwicklung dar, um die Lücke zwischen
niedrig auflösenden Systemen mittlerer Genauigkeit und konventionellen Messsystemen (basierend
auf kooperativen Zielpunkten) zu schließen. Die Kombination von Bildmessmethoden und motorisier-
tem Tachymeter ermöglicht die Entwicklung von hoch genauen und voll automatisierten Punkterfas-
sungssystemen. Der vorliegende Beitrag präsentiert eine Evaluierung dieser neuen Messsysteme, unter
dem speziellen Gesichtspunkt der bildgebenden Sensorik. Die Untersuchung inkludiert einen Vergleich
unterschiedlicher Bildmessmethoden, Tests hinsichtlich der Präzision, Versuche betreffend der Größe
und Rotation von Zielobjekten, und einen Langzeittest. Eine Abschätzung des zukünftigen Potenzials
bildgestützter Tachymeter komplettiert die Publikation, welche dem Leser einen breiten Überblick über
diese neuen Messsysteme gibt.
Schlüsselwörter: Bildgestützte Totalstation, Bildpunktdetektion, Kantendetektion, Mustererkennung
1 INTRODUCTION:
Image Assisted Total Stations (IATS) represent a new kind of
tacheometers. They offer the user (metrology expert) an image cap-
turing system (CCD/CMOS camera) in addition to a polar 3D point
measurement system. The system is capable of capturing pano-
ramic image mosaics through camera rotation – with appropriate
calibration, these images are accurately geo-referenced and ori-
ented, and can be immediately used for direction measurements
with no need for object control points or further photogrammetric
orientation processes.
The development of IATS has to be seen in combination with re-
search work done in the field of reflectorless distance measurement
systems (e.g. GOTTWALD 1987, KATOWSKI 1989). The latest develop-
ments in the area of IATS are done by Leica Geosystems (WALSER 2004, LEICA GEOSYSTEMS 2011), the Ruhr-Universität Bochum (SCHERER
84 avn | 119 ( 2012 ) 3
| Fachbeitrag begutachtet
2004), the i-MeaS project at Vienna University of Technology (REIT-ERER ET AL. 2010), the alpEWAS project at the Technische Universität
München (WASMEIER 2009), Topcon (TOPCON 2011), and Trimble (TRIM-BLE 2011).
Some previous evaluations on precision and potential of these
new measurement systems can be found in WALSER (2004), REITERER (2004), and WASMEIER (2009). The aim of the work at hand is to
evaluate three object detection methods for IATS and to analyse the
potential for future applications.
The paper is divided into two main parts: The first part (Section 2)
gives an overview about the system design of an IATS and image-
based measurement techniques. The second part (Sections 3 and 4)
presents an evaluation of the used image-based measurement tech-
niques in combination with the IATS and an assessment of the po-
tential of this combination. A conclusion (Section 5) completes the
paper.
2 IMAGE-BASED TACHEOMETRY
2.1 The Measurement System (Image Assisted Total Station)
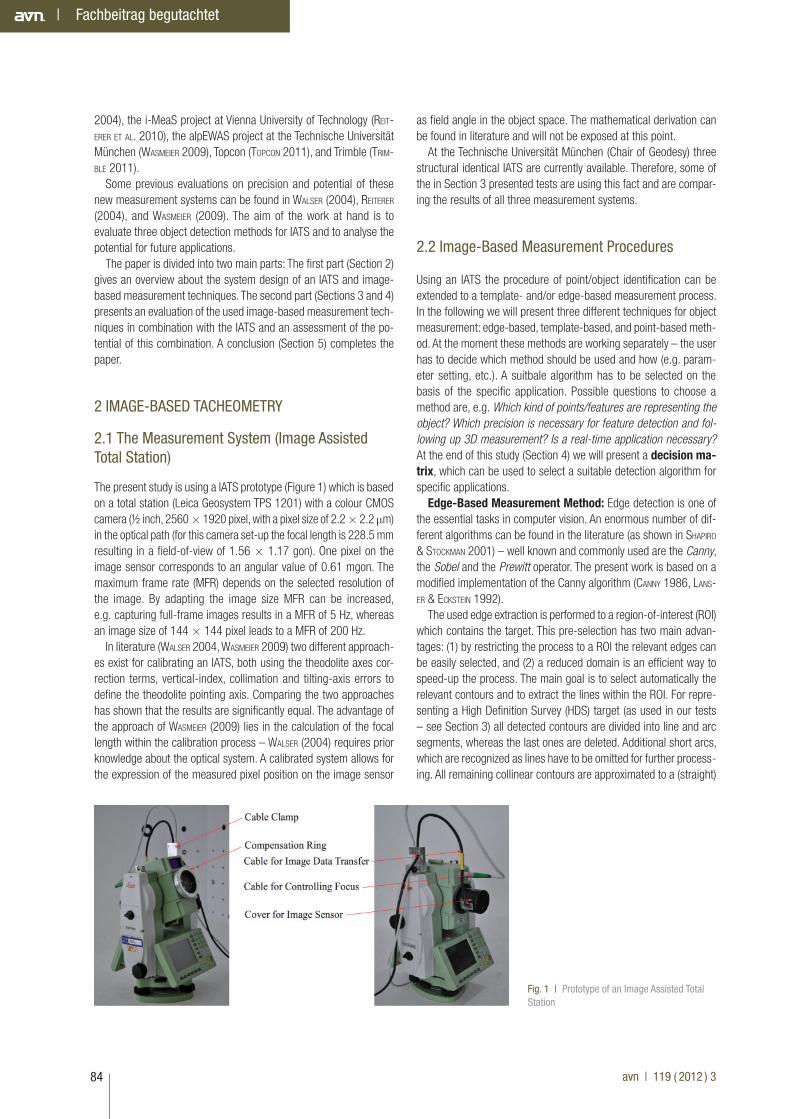
The present study is using a IATS prototype (Figure 1) which is based
on a total station (Leica Geosystem TPS 1201) with a colour CMOS
camera (½ inch, 2560 � 1920 pixel, with a pixel size of 2.2 � 2.2 �m)
in the optical path (for this camera set-up the focal length is 228.5 mm
resulting in a field-of-view of 1.56 � 1.17 gon). One pixel on the
image sensor corresponds to an angular value of 0.61 mgon. The
maximum frame rate (MFR) depends on the selected resolution of
the image. By adapting the image size MFR can be increased,
e.g. capturing full-frame images results in a MFR of 5 Hz, whereas
an image size of 144 � 144 pixel leads to a MFR of 200 Hz.
In literature (WALSER 2004, WASMEIER 2009) two different approach-
es exist for calibrating an IATS, both using the theodolite axes cor-
rection terms, vertical-index, collimation and tilting-axis errors to
define the theodolite pointing axis. Comparing the two approaches
has shown that the results are significantly equal. The advantage of
the approach of WASMEIER (2009) lies in the calculation of the focal
length within the calibration process – WALSER (2004) requires prior
knowledge about the optical system. A calibrated system allows for
the expression of the measured pixel position on the image sensor
as field angle in the object space. The mathematical derivation can
be found in literature and will not be exposed at this point.
At the Technische Universität München (Chair of Geodesy) three
structural identical IATS are currently available. Therefore, some of
the in Section 3 presented tests are using this fact and are compar-
ing the results of all three measurement systems.
2.2 Image-Based Measurement Procedures
Using an IATS the procedure of point/object identification can be
extended to a template- and/or edge-based measurement process.
In the following we will present three different techniques for object
measurement: edge-based, template-based, and point-based meth-
od. At the moment these methods are working separately – the user
has to decide which method should be used and how (e.g. param-
eter setting, etc.). A suitbale algorithm has to be selected on the
basis of the specific application. Possible questions to choose a
method are, e.g. Which kind of points/features are representing the
object? Which precision is necessary for feature detection and fol-
lowing up 3D measurement? Is a real-time application necessary?
At the end of this study (Section 4) we will present a decision ma-
trix, which can be used to select a suitable detection algorithm for
specific applications.
Edge-Based Measurement Method: Edge detection is one of
the essential tasks in computer vision. An enormous number of dif-
ferent algorithms can be found in the literature (as shown in SHAPIRO & STOCKMAN 2001) – well known and commonly used are the Canny,
the Sobel and the Prewitt operator. The present work is based on a
modified implementation of the Canny algorithm (CANNY 1986, LANS-ER & ECKSTEIN 1992).
The used edge extraction is performed to a region-of-interest (ROI)
which contains the target. This pre-selection has two main advan-
tages: (1) by restricting the process to a ROI the relevant edges can
be easily selected, and (2) a reduced domain is an efficient way to
speed-up the process. The main goal is to select automatically the
relevant contours and to extract the lines within the ROI. For repre-
senting a High Definition Survey (HDS) target (as used in our tests
– see Section 3) all detected contours are divided into line and arc
segments, whereas the last ones are deleted. Additional short arcs,
which are recognized as lines have to be omitted for further process-
ing. All remaining collinear contours are approximated to a (straight)
Fig. 1 | Prototype of an Image Assisted Total Station
85A. Reiterer, A. Wagner – System Considerations of an Image Assisted Total Station – Evaluation and Assessment
Fachbeitrag begutachtet |
line by weighted least square fitting. To reduce outliers in the fitting
procedure the approach of MOSTELLER & TUKEY (1977) is used, where
the dependent variables are weighted by a function of the residuals.
For all test series the same evaluation parameters have been used,
such as the size of the edge detection filter or minimum length of a
detected line. However, automated selection, classification and seg-
mentation of the detected lines is a crucial task and can processed
by means of high programming effort and long learning phases only1.
Advantages of the edge-based approach are the high precision
and reliability of feature detection, the real-time capability, and the
availability of a huge number of different detection algorithms and
implementations. The disadvantages are the sensitivity to changes
of the light situation, and the required user interaction for the selec-
tion of necessary parameter.
Template-Based Measurement Method: Template matching
enables to find and localize objects based on a pattern, which is
presented in a training image. A common recognition technique is to
find the maximum correlation between two functions (template and
¹ Examples for parameters which have to be specified by the user, are the (upper
and lower) thresholds for the hysteresis. Points with an amplitude (second deri-
vative) larger than the upper threshold are immediately accepted as belonging to
an edge, while points with an amplitude smaller than the lower threshold are
rejected. The selection of the thresholds is correlated with the amplitude and
width of the line as well as the choice of the filter width (for our examples the
upper threshold has been determined on the basis of the minimum plus the half
range of the grey values of the image, the lower threshold has been fixed to 1).
search image) based on grey values. Unfortunately correlation-based
matching is unreliable when objects are scaled or rotated, or illumi-
nation is changed. This disadvantage can be eliminated by extracting
features along contours and using them for matching, which leads
to the approach of shape-based matching.
For our approach each template pixel as well as each pixel of the
search space is associated with the direction vector by (identical)
edge filtering. The similarity measure is the sum of the dot product
of these vectors over all points of the model. In this way the algorithm
is robust to occlusion and clutter, because missing parts or frag-
ments in the search image will result in a zero-sum or mostly in small
values. The result of that product is a score between 0 and 1, where-
as the latter indicates a perfect match.
To speed up the matching process an image pyramid (both for the
model and the search space image) is created, consisting of the
original, full-sized image and a set of down-sampled images (the
number of levels has to be chosen depending on the complexity of
image and template – in our study 7 levels represent the best com-
promise between reliability and computation time). The actual search
is performed for the top level pyramid and the similarity measures
are computed for all model variations. A potential correspond is de-
fined by a larger score as an user-defined threshold and a local-
maximum with respect to neighbouring scores. After having recog-
nized such a potential match it is tracked through the resolution
hierarchy until it is found at the lowest pyramid level. This process

86 avn | 119 ( 2012 ) 3
| Fachbeitrag begutachtet
results in the parameters of the affine transformation for the (centre
of gravity of the) model: translation, rotation and scale.
To achieve highest precision several approaches are used: (1) the
extracted model points as well as the feature points in the image are
calculated with sub-pixel accuracy, (2) a polynomial fit to the similar-
ity measurement values in the neighbourhood around the maximum
score is applied, and (3) a least square adjustment minimizes the
sum of squared distances for each model and image point, whereas
additional information from the direction vectors is used. STEGER (2000, 2002) formulates a precision of 1/22 pixel and 1/100 degree
for this approach.
Advantages of the template-based approach are the capability to
fully automate the detection process, the real-time capability, and the
possibility to design the process as an user-driven procedure (user
has the possibility to select a template directly in the search image).
The disadvantage is the sensitivity to changes of the light situation.
Point-Based Measurement Method: In the literature a huge
number of different methods for image point detection exists (HARRIS & STEPHENS 1988, FÖRSTNER & GÜLCH 1987, SMITH & BRADY 1997, MARR & HILDRETH 1980, LOWE 2004, ROSTEN & DRUMMOND 2005, 2006). As a
measurement system has to be able to capture object points in
(nearly) real time, we are using a point detection method on the
basis of the determinant of the Hessian (BAY et al. 2008). This meth-
od works with second order Gaussian derivations and delivers inter-
est points in blob-like structures directly. An implementation working
on this principles is SURF (BAY et al. 2008), which was developed
originally at the ETH-Zurich (the acronym stands for „Speeded Up
Robust Features”). This algorithm uses an approach similar to the
well-known SIFT operator (LOWE 2004) with a special focus on re-
duced computation time.
REITERER ET AL. (2010) were the first to implement the SURF algo-
rithm for an Image Assisted Total Station. They used the measure-
ment procedure for deformation monitoring of natural objects – the
work at hand is based on this implementation and parameter setting.
In the present study 10 image points are detected for each image
(this number is a compromise between resulting precision and pro-
cessing time). These image points are averaged to one point which
describes the actual image/target.
Advantages of the point-based approach (SURF) are the capabil-
ity to fully automate the detection process, the possibility to use the
result for 3D-point detection/measurement directly (using spatial
intersection by two IATS), and the availability of run-time optimized
implementations. The disadvantages are the sensitivity to changes
of the light situation, and the computational complexity (not fully
real-time capable).
3 EVALUATION OF IMAGE-BASED MEASUREMENT METHODS
Measurement precision and reliability depend on the measurement
sensor (hardware), measurement methods and calculation methods
(software). As the hardware of such a system is based on a conven-
tional total station, we will focus our study on the components which
are integrated additionally: image sensor and image-based data
acquisition methods. Due to the fact that the separation of these two
components is not possible (for most tests), we will pool these parts
as imaging system. Several studies (STEMPFHUBER & WUNDERLICH 2004, JURETZKO 2006) have confirmed the high precision of the basic sensor
(Leica Geosystems TPS 1201) given by the manufacturer (angle
measurement standard deviation of 0.3 mgon, reflectorless distance
measurement accuracy of �2 mm �2 ppm).
Because image-based measurements are highly depending on
the configuration of the imaging system (e.g. position of the focus
lens) the tests are performed by means of one (fixed) configuration.
For most tests (expected the test concerning daylight/artificial light,
and resolution) the whole measurement setting was based in a cli-
matic chamber (7 � 2 m) to ensure constant temperature and light
situation. Furthermore, for all tests (expected long-time stability test)
a warm-up phase of 3 hours has been taken into account (warm-up
of the measurement system at ambient temperature and with con-
nected power supply). The IATS was mounted on a grounded meas-
urement pillar, the target (resp. target sheet) was fixed on the wall of
the chamber. Distance between the measurement system and the
target was 6.08 m. As target a compilation of different signs (includ-
ing edges, a HDS target, and a structured area) was used (see Fig-
ure 2). As the used image processing techniques achieve their high-
est precision on the basis of black-and-white images, we have used
grey level instead of colour information.
All subsequent tests have been performed repetitively by captur-
ing image. The first image of each series has been defined as refer-
ence – differences (�) are calculated between actual image and
reference. The stated standard deviations (�) are based on these
differences – uncertainties of the standard deviations have been
calculated as described in BIPM (GUM) (2008). It should be noted
that the presented data have been captured under laboratory condi-
tions for well selected measurement configurations. To have robust
results each scenario has been repeated at least three times.
Fig. 2 | Template captured by different focus positions (a=focus position 1 – f=focus position 6)
87A. Reiterer, A. Wagner – System Considerations of an Image Assisted Total Station – Evaluation and Assessment
Fachbeitrag begutachtet |
3.1 Precision
The precision (sometimes also referred to as “internal accuracy”) of
an image-based system has been defined by WOLF (1966) as a
measure of quality depending on repetitive captured images and
subsequent processing steps only. Standard deviation describing the
precision is depending on image capturing, data transfer from image
sensor to the processing unit, and image processing algorithms. The
following tests have been processed on short distances (6.08 m)
capturing images in short time intervals (3 Hz). They present the
most representative data sets and figures of different time series
which have captured under comparable conditions. The relevant fac-
tors describing the precision of our measurement system are the
object detection algorithms, their precision, the signal-to-noise-ratio
of the image sensor and the resolution of the imaging system.
(a) Precision of Object Detection Algorithms
The following tests are based on the configuration as described at
the beginning of this section. The target has been captured by 300
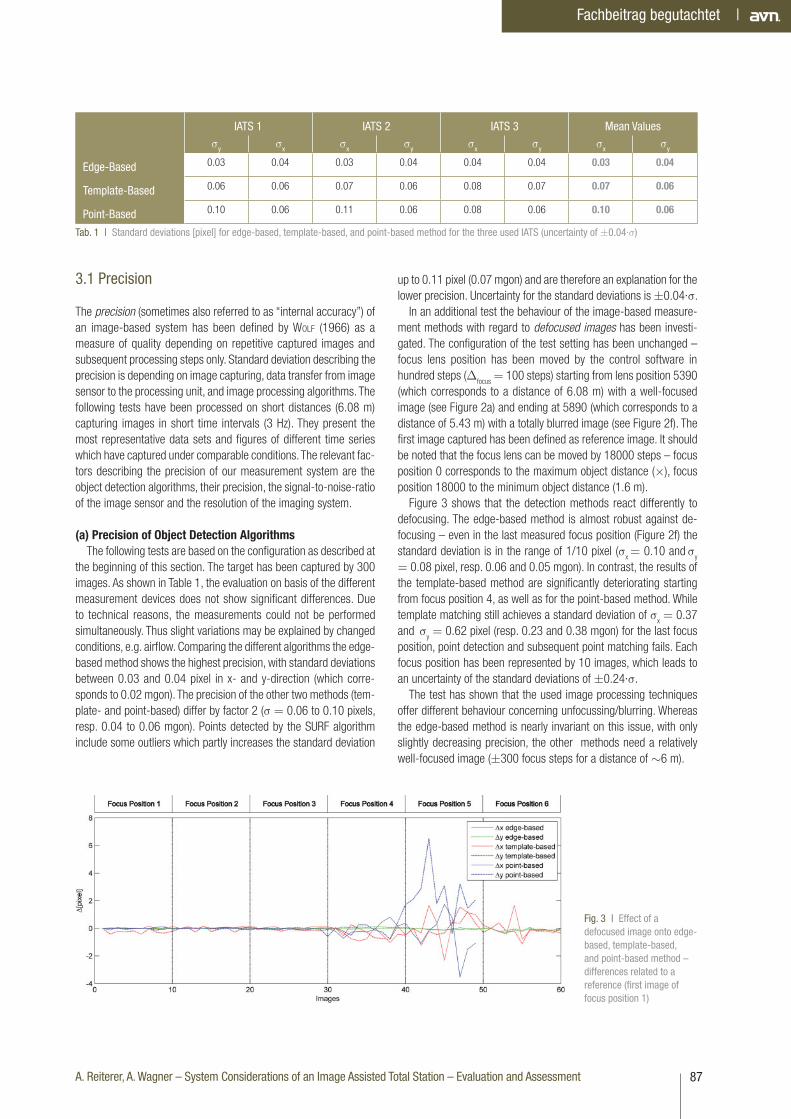
images. As shown in Table 1, the evaluation on basis of the different
measurement devices does not show significant differences. Due
to technical reasons, the measurements could not be performed
simultaneously. Thus slight variations may be explained by changed
conditions, e.g. airflow. Comparing the different algorithms the edge-
based method shows the highest precision, with standard deviations
between 0.03 and 0.04 pixel in x- and y-direction (which corre-
sponds to 0.02 mgon). The precision of the other two methods (tem-
plate- and point-based) differ by factor 2 (� � 0.06 to 0.10 pixels,
resp. 0.04 to 0.06 mgon). Points detected by the SURF algorithm
include some outliers which partly increases the standard deviation
up to 0.11 pixel (0.07 mgon) and are therefore an explanation for the
lower precision. Uncertainty for the standard deviations is �0.04·�.
In an additional test the behaviour of the image-based measure-
ment methods with regard to defocused images has been investi-
gated. The configuration of the test setting has been unchanged –
focus lens position has been moved by the control software in
hundred steps (�focus
� 100 steps) starting from lens position 5390
(which corresponds to a distance of 6.08 m) with a well-focused
image (see Figure 2a) and ending at 5890 (which corresponds to a
distance of 5.43 m) with a totally blurred image (see Figure 2f). The
first image captured has been defined as reference image. It should
be noted that the focus lens can be moved by 18000 steps – focus
position 0 corresponds to the maximum object distance (�), focus
position 18000 to the minimum object distance (1.6 m).
Figure 3 shows that the detection methods react differently to
defocusing. The edge-based method is almost robust against de-
focusing – even in the last measured focus position (Figure 2f) the
standard deviation is in the range of 1/10 pixel (�x � 0.10 and
�
y
� 0.08 pixel, resp. 0.06 and 0.05 mgon). In contrast, the results of
the template-based method are significantly deteriorating starting
from focus position 4, as well as for the point-based method. While
template matching still achieves a standard deviation of �x � 0.37
and �
y � 0.62 pixel (resp. 0.23 and 0.38 mgon) for the last focus
position, point detection and subsequent point matching fails. Each
focus position has been represented by 10 images, which leads to
an uncertainty of the standard deviations of �0.24·�.
The test has shown that the used image processing techniques
offer different behaviour concerning unfocussing/blurring. Whereas
the edge-based method is nearly invariant on this issue, with only
slightly decreasing precision, the other methods need a relatively
well-focused image (�300 focus steps for a distance of �6 m).
Fig. 3 | Effect of a defocused image onto edge-based, template-based, and point-based method – differences related to a reference (first image of focus position 1)
IATS 1 IATS 2 IATS 3 Mean Values�y �x �x �y �x �y �x �y
Edge-Based 0.03 0.04 0.03 0.04 0.04 0.04 0.03 0.04
Template-Based 0.06 0.06 0.07 0.06 0.08 0.07 0.07 0.06
Point-Based 0.10 0.06 0.11 0.06 0.08 0.06 0.10 0.06
Tab. 1 | Standard deviations [pixel] for edge-based, template-based, and point-based method for the three used IATS (uncertainty of �0.04·�)
88 avn | 119 ( 2012 ) 3
| Fachbeitrag begutachtet
Comparing the processing time of the three detection algorithms
leads to 0.5 second for edge-based, 0.2 second for template-based,
and 5 second for point-based method (it should be noted that pro-
cessing time depends on the number of extracted features). Perfor-
mance can be improved by using special implementation techniques,
such as using the graphical processing unit (GPU) and/or using par-
allel central processing units (CPU) to extract distinctive features
from an image. As a consequence of the runtime behavior edge-
based and template-based method can be described as fully real-
time capable, point-based method as nearly real-time capable. This
fact can be useful for the selection of a suitable algorithm for perfor-
mance critical applications.
(b) Signal-to-Noise-Ratio (SNR)
The signal-to-noise-ratio (SNR) is used to characterize the quality
of signal detection of a measuring system. For an image-based
measurement system the SNR is given by the ratio of the light signal
to the sum of the noise signals. It is expressed as a ratio or factor in
units of decibels [dB]:
SNRg
gdB
n
= ⋅( )
⎛
⎝⎜⎜⎜⎜
⎞
⎠⎟⎟⎟⎟[ ]20 log ,
� (1)
where g is the mean of the grey levels and �n(g) the correspond-
ing standard deviation. Noise not only changes depending on expo-
sure setting and camera model, but it can also vary within an indi-
vidual image (characteristics of the captured scene). Therefore it is
important to evaluate the SNR for different grey tones.
For measuring and evaluating SNR a target consisting of five dif-
ferent areas each filled by a specified grey tone has been captured
under two different lighting situations – (1) using an illumination of
25 lx representing ideal laboratory light conditions, (2) using an il-
lumination of 200 lx representing a slightly overexposed situation.
For the test stable lighting is of fundamental importance and is en-
sured by performing the test as described at the beginning of Sec-
tion 3. Table 2 shows SNR for the five grey tones (10 %, 20 %, 40 %,
60 %, and 70 %).
It should be noted how noise becomes less pronounced as the
tones become darker. Brighter regions have a stronger signal due to
more light, resulting in a higher SNR. Therefore overexposed images
will have higher visible noise – even if image brightening is pro-
cessed afterwards. Calculating mean values for SNR results in 70
and 86 dB, respectively. The first value (for an illumination of 25 lx)
can be described as slightly higher than SNR of conventional indus-
trial imagining systems (typical values are between 20 and 60 dB),
the latter one (for an illumination of 200 lx) as clearly higher. Both
values confirm that IATS should be used preferably under ideal light
situations (e.g. well-illuminated objects). Especially over- and under-
exposed scenes result in noisy images and may lead to inaccurate
object detection. A rigorous analysis of the influence of SNR to the
precision of object detection is beyond the scope of this study
– a detailed evaluation will be the subject of further research work.
(c) Resolution of the Imaging System
To test the resolution (the capability to capture and measure two
single objects as separated) of IATS an evaluation as published by
WASMEIER (2009) has been performed. As the results are equal, we
will only summarize them – for a detailed description we refer to the
literature.The evaluation shows that (under laboratory conditions) the reso-
lution of the imaging system combined with sub-pixel object or point
detection exceeds the precision of angle measurements (visual aim-
ing) of the total station by a factor of 2-4 – the used total station as
basis for the IATS represents the limiting factor. Measuring objects
or differences between objects by one single image only without
moving the telescope, the system can benefit from the high precision
of the imaging system (precision then depends on relative measure-
ments inside the captured image only) – a tenth pixel is possible,
which corresponds to 0.06 mgon. Scanning an object by an image
bundle leads to the precision of angular measurements of the total
station which is as accurate as the basic total station (the used
Leica Geosystems total station works with an angle measurement
standard deviation of 0.3 mgon).
3.2 Influence of Light Condition
One of the most important preconditions for using an image-based
measurement system is the stability of the detection of points and
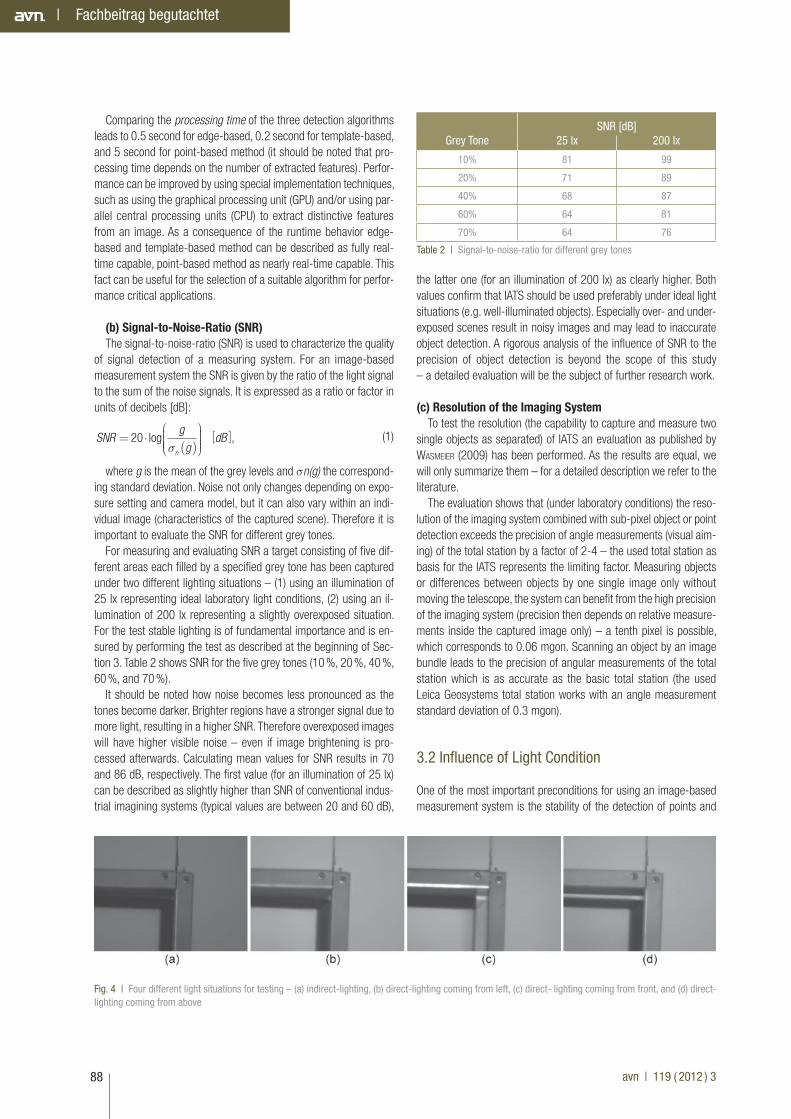
Fig. 4 | Four different light situations for testing – (a) indirect-lighting, (b) direct-lighting coming from left, (c) direct- lighting coming from front, and (d) direct-lighting coming from above
SNR [dB]Grey Tone 25 lx 200 lx
10% 81 99
20% 71 89
40% 68 87
60% 64 81
70% 64 76
Table 2 | Signal-to-noise-ratio for different grey tones

89A. Reiterer, A. Wagner – System Considerations of an Image Assisted Total Station – Evaluation and Assessment
Fachbeitrag begutachtet |
objects under different light conditions. This means that changing
the direction and intensity of illumination shall not have any effects
on the result. This is an unalterable condition applying the measure-
ment system to objects under uncontrollable lighting situations
(variable sun light, luminosity, etc.).
We have captured and measured the corner of a 3D steel con-
struction under different illuminations. Lighting has been varied by
moving a 500 W light source around the object – four different sce-
narios have been simulated (see Figure 4): indirect-lighting, direct-
lighting coming from left, direct-lighting coming from front, and di-
rect-lighting coming from above. The illumination causes a
considerable effect on the different structures of the objects (e.g.
edges are stressed out by varying shadows – cf. Figure 4a and d).
Each light situation has been captured by 100 images – measure-
ment set-up has been designed as described at the beginning of
Section 3. Calculation of SNR for all images returns values between
64 and 65 dB (constant signal-to-noise-ratio).
For the edge-based method we have chosen the two rivets on the
upper part of the steel construction. Each one can be described by
a circle with approximately known diameter (depending on shadow)
– all following results are based on the left rivet, since both objects
showed identical behaviour. Figure 5 shows very impressive the im-
pact of shadow to edge-based method. For the first light situation
(indirect lighting), the already identified precision (cf. Section 3.1a)
is achieved. In the second scenario (direct light from left), the rivet
casts a shadow in the upper right side. The edge-based algorithm
detects alternately the (true) edge of the rivet and the edge of the
shadow, which results in lower x- and higher y-values – all together
the precision rises significantly. With direct light from front, only parts
of the circles were detected, caused by the light reflections on the
lower part of the metal surface. This leads to a displacement of the
y-values (compared with the first light condition). The last scenario
(direct light from above) shows the rivet most clearly with nearly no
shadow. Detecting the edges results in y-values which correspond
to the reference and clearly shifted x-values.
For the template-based method a region just enclosing a rivet has
been selected. The results are comparable to those of edge-based
method. However, differences can be found in the second and third
scenario. While direct lighting from left results in higher, direct light-
ing from front leads to lower precision. That means, light reflections
influence the template-based algorithm, particularly, as in all 400
images the object recognition failed 8 times, mostly in this third
lighting scenario. Nevertheless, a recognition rate of 98% was
reached which corresponds to STEGER (2002).The point-based method has been applied on the image(s) without
image pre-processing or selecting a ROI. The results are comparable
to the other two methods – especially, changing the illumination from
indirect to a frontal-direct lighting leads to a shifting of detected
points around edges, whereas detection on “flat regions” gets results
which scattered within the precision formulated in Section 3.1. Fur-
thermore, changing the direction of light results in a huge number of
mismatched points. The elimination of such outliers is possible by
using RANSAC.
It can be summarised, that the used detection methods are
strongly depending on stable light situation. Measuring under natural
light can cause considerable problems – image pre-processing tech-
niques (e.g. adaptive histogram equalisation) may help to reduce
these influences (KNÖTZL & REITERER 2010).
CASOTT (1999) has worked out that image-based measurement
systems are depending on the type of light which is used for illumi-
nating the scene. This is emphasized by several publications from
Computer Vision and Image Processing (e.g. NAKAMURA (2006)) de-
scribing the selection of suitable illumination as a crucial element in
determining the quality of the captured images. To test the influence
of different light sources we have processed measurements under
artificial light (fluorescent tubes) and under natural light (sun light).
The results show no influence of the used light source. A possible
explanation of this phenomenon could be the relatively low measure-
ment frequency. Increasing MFR up to 50 Hz results in similar stand-
ard deviations. Measuring with a frequency of 200 Hz (artificial light
sources as fluorescent tubes are working with �100 Hz) requires a
significant reduction of image size (see Section 2.1) resulting in a
decreased precision – corresponding standard deviations are there-
fore not comparable.
3.3 Influence of Target Size
Targets with the dimensions of 290 � 233 pixel (target 1), 578 �
470 pixel (target 2), and 1148 � 931 pixel (target 3) have been
captured (distance to the object � 6.08 m, measurement frequency
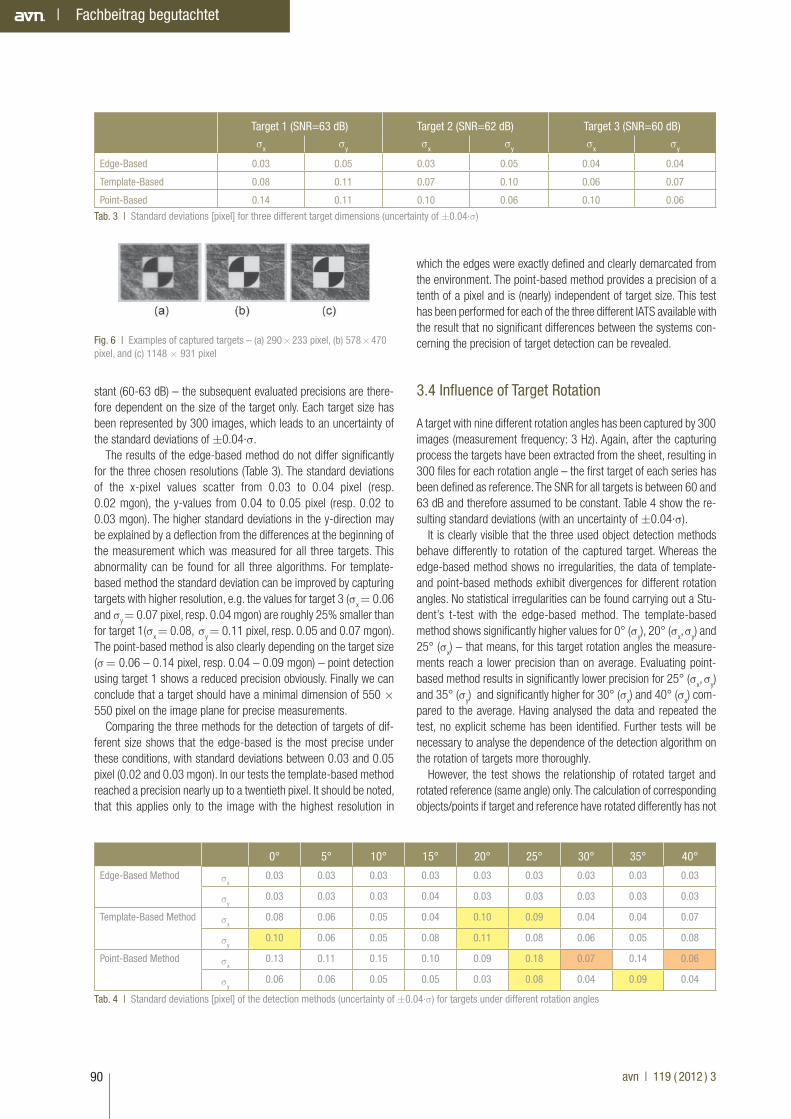
� 3 Hz). Figure 6 demonstrates the quality of the images resulting
from the different target sizes. To take the influence of the noise into
account, for the extracted targets the SNR has been calculated (see
Table 3). It can be noted, that the SNR for all targets is nearly con-
Fig. 5 | Mean values and corresponding standard deviations for the edge-based method (each scene has been represented by 100 images – the first image captured under indirect lighting has been defined as global reference)
90 avn | 119 ( 2012 ) 3
| Fachbeitrag begutachtet
stant (60-63 dB) – the subsequent evaluated precisions are there-
fore dependent on the size of the target only. Each target size has
been represented by 300 images, which leads to an uncertainty of
the standard deviations of �0.04·�.
The results of the edge-based method do not differ significantly
for the three chosen resolutions (Table 3). The standard deviations
of the x-pixel values scatter from 0.03 to 0.04 pixel (resp.
0.02 mgon), the y-values from 0.04 to 0.05 pixel (resp. 0.02 to
0.03 mgon). The higher standard deviations in the y-direction may
be explained by a deflection from the differences at the beginning of
the measurement which was measured for all three targets. This
abnormality can be found for all three algorithms. For template-
based method the standard deviation can be improved by capturing
targets with higher resolution, e.g. the values for target 3 (�x � 0.06
and �y � 0.07 pixel, resp. 0.04 mgon) are roughly 25% smaller than
for target 1(�x � 0.08,
�
y � 0.11 pixel, resp. 0.05 and 0.07 mgon).
The point-based method is also clearly depending on the target size
(� � 0.06 – 0.14 pixel, resp. 0.04 – 0.09 mgon) – point detection
using target 1 shows a reduced precision obviously. Finally we can
conclude that a target should have a minimal dimension of 550 �
550 pixel on the image plane for precise measurements.
Comparing the three methods for the detection of targets of dif-
ferent size shows that the edge-based is the most precise under
these conditions, with standard deviations between 0.03 and 0.05
pixel (0.02 and 0.03 mgon). In our tests the template-based method
reached a precision nearly up to a twentieth pixel. It should be noted,
that this applies only to the image with the highest resolution in
which the edges were exactly defined and clearly demarcated from
the environment. The point-based method provides a precision of a
tenth of a pixel and is (nearly) independent of target size. This test
has been performed for each of the three different IATS available with
the result that no significant differences between the systems con-
cerning the precision of target detection can be revealed.
3.4 Influence of Target Rotation
A target with nine different rotation angles has been captured by 300
images (measurement frequency: 3 Hz). Again, after the capturing
process the targets have been extracted from the sheet, resulting in
300 files for each rotation angle – the first target of each series has
been defined as reference. The SNR for all targets is between 60 and
63 dB and therefore assumed to be constant. Table 4 show the re-
sulting standard deviations (with an uncertainty of �0.04·�).
It is clearly visible that the three used object detection methods
behave differently to rotation of the captured target. Whereas the
edge-based method shows no irregularities, the data of template-
and point-based methods exhibit divergences for different rotation
angles. No statistical irregularities can be found carrying out a Stu-
dent’s t-test with the edge-based method. The template-based
method shows significantly higher values for 0° (�y), 20° (�
x, �
y) and
25° (�x) – that means, for this target rotation angles the measure-
ments reach a lower precision than on average. Evaluating point-
based method results in significantly lower precision for 25° (�x, �
y)
and 35° (�y) and significantly higher for 30° (�
x) and 40° (�
x) com-
pared to the average. Having analysed the data and repeated the
test, no explicit scheme has been identified. Further tests will be
necessary to analyse the dependence of the detection algorithm on
the rotation of targets more thoroughly.
However, the test shows the relationship of rotated target and
rotated reference (same angle) only. The calculation of corresponding
objects/points if target and reference have rotated differently has not
0° 5° 10° 15° 20° 25° 30° 35° 40°
Edge-Based Method �x0.03 0.03 0.03 0.03 0.03 0.03 0.03 0.03 0.03
�y0.03 0.03 0.03 0.04 0.03 0.03 0.03 0.03 0.03
Template-Based Method �x0.08 0.06 0.05 0.04 0.10 0.09 0.04 0.04 0.07
�y0.10 0.06 0.05 0.08 0.11 0.08 0.06 0.05 0.08
Point-Based Method �x0.13 0.11 0.15 0.10 0.09 0.18 0.07 0.14 0.06
�y0.06 0.06 0.05 0.05 0.03 0.08 0.04 0.09 0.04
Tab. 4 | Standard deviations [pixel] of the detection methods (uncertainty of �0.04·�) for targets under different rotation angles
Target 1 (SNR=63 dB) Target 2 (SNR=62 dB) Target 3 (SNR=60 dB)�x �y �x �y �x �y
Edge-Based 0.03 0.05 0.03 0.05 0.04 0.04
Template-Based 0.08 0.11 0.07 0.10 0.06 0.07
Point-Based 0.14 0.11 0.10 0.06 0.10 0.06
Tab. 3 | Standard deviations [pixel] for three different target dimensions (uncertainty of �0.04·�)
Fig. 6 | Examples of captured targets – (a) 290 233 pixel, (b) 578 470 pixel, and (c) 1148 � 931 pixel
91A. Reiterer, A. Wagner – System Considerations of an Image Assisted Total Station – Evaluation and Assessment
Fachbeitrag begutachtet |
been tested yet – a first assessment for point-based detection can
be found in REITERER ET AL. (2010).
3.5 Long-time Stability
One of the most essential characteristics of measurement systems
is their long time stability. Measuring the same target in different time
epochs should lead to results which scattered within system’s preci-
sion only. To test long-time stability and the run-in period a target
has been monitored over a period of 36 hours with a measurement
frequency of four images per minute. For analysing the data the
edge-based method has been used since this detection algorithm is
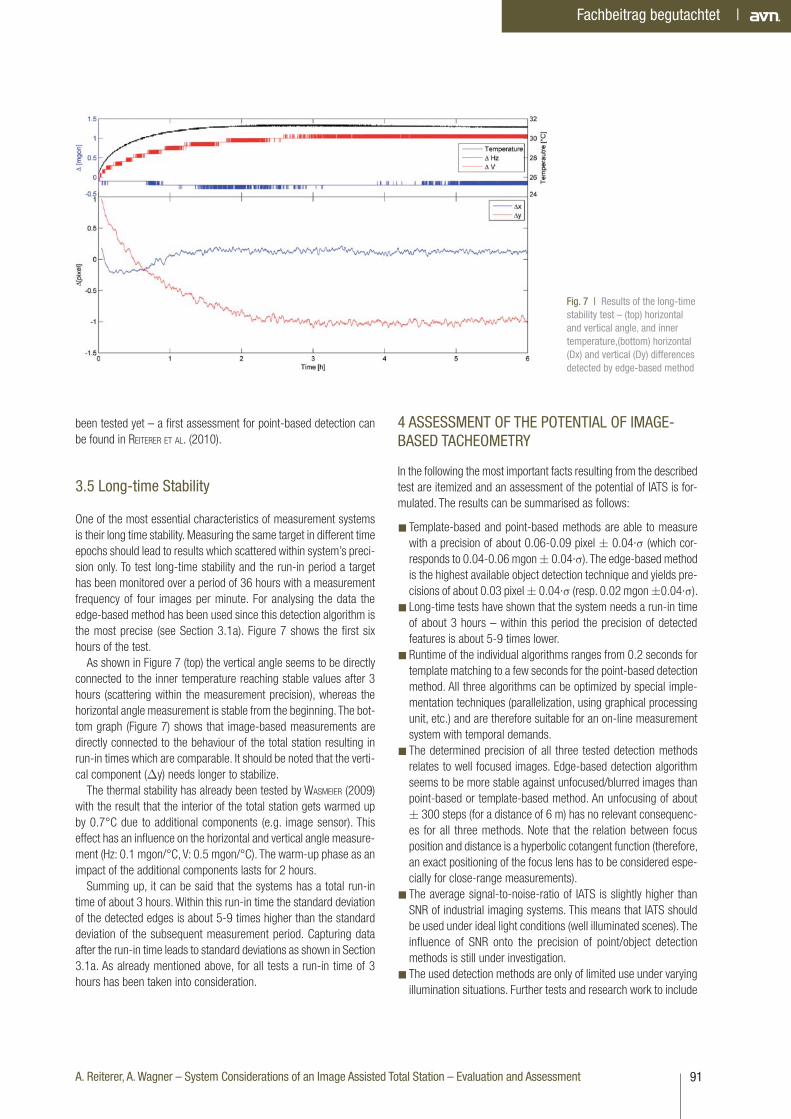
the most precise (see Section 3.1a). Figure 7 shows the first six
hours of the test.
As shown in Figure 7 (top) the vertical angle seems to be directly
connected to the inner temperature reaching stable values after 3
hours (scattering within the measurement precision), whereas the
horizontal angle measurement is stable from the beginning. The bot-
tom graph (Figure 7) shows that image-based measurements are
directly connected to the behaviour of the total station resulting in
run-in times which are comparable. It should be noted that the verti-
cal component (�y) needs longer to stabilize.
The thermal stability has already been tested by WASMEIER (2009) with the result that the interior of the total station gets warmed up
by 0.7°C due to additional components (e.g. image sensor). This
effect has an influence on the horizontal and vertical angle measure-
ment (Hz: 0.1 mgon/°C, V: 0.5 mgon/°C). The warm-up phase as an
impact of the additional components lasts for 2 hours.
Summing up, it can be said that the systems has a total run-in
time of about 3 hours. Within this run-in time the standard deviation
of the detected edges is about 5-9 times higher than the standard
deviation of the subsequent measurement period. Capturing data
after the run-in time leads to standard deviations as shown in Section
3.1a. As already mentioned above, for all tests a run-in time of 3
hours has been taken into consideration.
4 ASSESSMENT OF THE POTENTIAL OF IMAGE-BASED TACHEOMETRY
In the following the most important facts resulting from the described
test are itemized and an assessment of the potential of IATS is for-
mulated. The results can be summarised as follows:
� Template-based and point-based methods are able to measure
with a precision of about 0.06-0.09 pixel � 0.04·� (which cor-
responds to 0.04-0.06 mgon � 0.04·�). The edge-based method
is the highest available object detection technique and yields pre-
cisions of about 0.03 pixel � 0.04·� (resp. 0.02 mgon �0.04·�).
� Long-time tests have shown that the system needs a run-in time
of about 3 hours – within this period the precision of detected
features is about 5-9 times lower.
�Runtime of the individual algorithms ranges from 0.2 seconds for
template matching to a few seconds for the point-based detection
method. All three algorithms can be optimized by special imple-
mentation techniques (parallelization, using graphical processing
unit, etc.) and are therefore suitable for an on-line measurement
system with temporal demands.
� The determined precision of all three tested detection methods
relates to well focused images. Edge-based detection algorithm
seems to be more stable against unfocused/blurred images than
point-based or template-based method. An unfocusing of about
� 300 steps (for a distance of 6 m) has no relevant consequenc-
es for all three methods. Note that the relation between focus
position and distance is a hyperbolic cotangent function (therefore,
an exact positioning of the focus lens has to be considered espe-
cially for close-range measurements).
� The average signal-to-noise-ratio of IATS is slightly higher than
SNR of industrial imaging systems. This means that IATS should
be used under ideal light conditions (well illuminated scenes). The
influence of SNR onto the precision of point/object detection
methods is still under investigation.
� The used detection methods are only of limited use under varying
illumination situations. Further tests and research work to include
Fig. 7 | Results of the long-time stability test – (top) horizontal and vertical angle, and inner temperature,(bottom) horizontal (Dx) and vertical (Dy) differences detected by edge-based method

92 avn | 119 ( 2012 ) 3
| Fachbeitrag begutachtet
image pre-processing techniques (e.g. adaptive histogram equal-
isation) may help to minimise this problem (KNÖTZL & REITERER
2010).
� The system seems to be independent of the dimensions of the
used target, but as a requirement for highly accurate target rec-
ognition and measurement we can formulate a minimal target size
of 550 � 550 pixel.
� The use of template- and edge-based methods is limited in prac-
tice (artificial objects can be described by lines and geometrical
features, whereas natural objects are rarely characterised by lined
structures) – point-based measurement methods are more famil-
iar for geodetic applications and can be used more flexible for
describing objects and there surface.
Possible applications are:
� Semi-automated object reconstruction systems as described
by WALSER (2004) and VICOVAC (2008). Natural geometric primitives
(e.g. corner and edges) can be used to detect descriptive parts of
the object. The reconstruction of an object with regular structure
could be done by describing and capturing one object element in
a learning phase and by detecting and measuring the remaining
parts in an automated process (e.g. by template-based measure-
ment methods).
� Fully-automated deformation monitoring systems as de-
scribed by REITERER ET AL. (2009). The object can be scanned by an
image-bundle followed by point detection. Using a calibrated
multi-sensor system and working with spatial intersection the
captured “image point cloud” can be transferred into 3D object
space in nearly real-time.
� Industrial measurement systems as described by KNOBLACH (2011). Due to the integrated image sensor IATS can placed with-
out direct access to the eyepiece – targeting can be done by
means of a “live-view” manually or automatically. This enables the
use of the system under particularly dangerous conditions or in
environments which are difficult to access.
�Measurements of vibration amplitude could be realised by
means of high-frequency image measurements on the basis of
IATS. Using the capability of reducing the size of the image matrix
and as a consequence thereof the possibility of capturing images
with a frame rate of up to 200 Hz (for 144 � 144 pixel) opens
new application fields for IATS – the measurement of small vibra-
tion amplitudes by abstracting the objects with edge- or template
based methods could be one (WASMEIER 2009). � The image sensor enables the capturing of additional information
like high-frequency motions or intensity fluctuations of patterns to
derive the temperature gradient of atmosphere as decisive influ-
ence parameter for angular refraction effects. Theoretical
foundations regarding such a procedure have been published by
BRUNNER (1979), HENNES (1995) and ESCHELBACH (2009), practical
tests with industrial image-based sensors have been done by Ca-
sott (1999), DEUSSEN (2000) and FLACH (2000). Currently, a research
project at Technische Universität München (Chair of Geodesy)
explores the suitability of IATS (using edge detection) for such
applications.
�Monitoring of cracks as described by WASMEIER (2009) and HUEP (2010). The appearance of cracks on buildings is one of the main
problems concerning the stability of artificial structures. Monitor-
ing the changes in crack width is an important diagnostic tech-
nique for determining the cause and specifying the remedial work.
Using an IATS in combination with edge- or point-based methods
could help to document, georeference and measure very pre-
cisely these phenomenons.
On the basis of the evaluation a decision matrix for the three de-
tection methods can be formulated (see Table 5).
5 CONCLUSION
The paper at hand presented the evaluation of an Image Assisted
Total Station, a new kind of geodetic sensor for rapid and precise
measurements. The tests have shown that with suitable image pro-
cessing measurements a precision of �0.05 pixel � 0.04·� is pos-
sible (which corresponds to 0.03 mgon � 0.04·�). These results
have to be seen under the consideration that such measurements
are image-based only. For measuring in 3D object space the preci-
sion of pointing has to be taken into account. KNÖTZL (2010) has
evaluated different IATS system configurations, using polar methods
and spatial intersection to measure 3D object points. Polar method
results in homogeneous error ellipses, independent of the relative
Edge-Based Method Template-Based Method Point-Based Method
Object Reconstruction x x
Deformation Monitoring x
High Precision Industrial Applications x x x
Measurements of Vibration Amplitude x x
Angular Refraction Effects x
Monitoring of Cracks x x
Comments Actual the most precise detec-tion method, suitable for a large variety of applications, not fully automatable, real-time capable.
Fully automatable method, fully real-time capable, user-driven approach (selection of templates).
Fully automatable method, not fully real-time capable, point-based results can be used for geodetic deformation analysis directly.
Tab. 5 | Decision matrix for the selection of a suitable detection method

93A. Reiterer, A. Wagner – System Considerations of an Image Assisted Total Station – Evaluation and Assessment
Fachbeitrag begutachtet |
position of the observation area, whereas spatial intersection results
in error ellipses, which tend to spread along the measurement direc-
tion axis (precision of 3D point detection strongly depends on the
configuration of the spatial intersection). Note, that polar methods
can only be used for distances up to 400 m, because of the limited
range of the reflectorless distance measurement.
The study at hand has identified some important facts using Image
Assisted Total Stations, e.g. run-in time, long-time stability, depend-
ency from target size and rotation, etc. These facts and the wide
experience from practical applications show the high potential of
IATS. However, some important influence factors on the precision of
the measurements have to be investigated in the future, e.g. SNR,
atmospheric effects. The next development step has to be the inte-
gration of an Image Assisted Total Station into a general work flow of
object monitoring and/or object reconstruction. Furthermore, the
automation of IATS measurements will be one of the challenging
tasks for the future.
Finally the user (metrology expert, surveyor, etc.) has to decide
whether this new measurement system represents a major gain for
geodetic work. Total station manufacturers will have to react on the
market situation and integrate IATS into their work flow and product
line. Commercial systems like Leica’s Viva-TS-Series or Trimble’s VX
using image data for visualisation represent a first step in this direc-
tion.
ACKNOWLEDGEMENT:
The research presented in this paper has been supported by the
Alexander von Humboldt Foundation.
REFERENCES:
Bay, H.; Ess, A., Tuytelaars T.; van Gool, l. (2008): SURF: Speeded Up Robust Features. In: Computer Vision and Image Understanding (CVIU), 2008, Vol. 110, No. 3, pp. 346-359.
BIPM (GUM) (2008): Evaluation of Measurement Data – Guide to the Expres-sion of Uncertainty in Measurement. JCGM 100.
Brunner, F. K. (1979): Vertical Refraction Angle Derived from the Variance of the Angle-Of-Arrival Fluctuations. In: Refractional Influences in Astronomy and Geodesy, Tengström, E. / Teleki, G. (Eds.), pp. 227-238.
Canny, J. (1986): A Computational Approach To Edge Detection. In: IEEE Trans. Pattern Analysis and Machine Intelligence, Vol. 8, No. 6, pp. 679-698.
Casott, N. (1999): Erfassung des Einflusses der „turbulenten Refraktion” auf optische Richtungsmessungen mit CCD-Sensoren. PhD Thesis, Rheinischen Friedrich-Wilhems-Universität Bonn.
Deußen, D. (2000): Meßverfahren zur Erfassung der Vertikalrefraktion unter Nutzung der atmosphärischen Turbulenz. PhD Thesis, Rheinischen Friedrich-Wilhems-Universität Bonn.
Eschelbach, C. (2009): Refraktionskorrekturbestimmung durch Modellierung des Impuls- und Wärmeflusses in der Rauhigkeitsschicht. KIT Scientific Pu-blishing.
Flach, P. (2000): Analysis of Refraction Influences in Geodesy Using Image Processing and Turbulence Models. PhD Thesis, ETH-Zurich.
Förstner, W.; Gülch, E. (1987): A Fast Operator for Detection and Precise Lo-cation of Distinct Points, Corners and Centres of Circular Features. ISPRS Conference on Fast Processing of Photogrammetric Data, pp. 281-305.
Gottwald, R. (1987): Kern E2-SE – Ein neues Instrument nicht nur für die Industrievermessung? In: Allgemeine Vermessungs-Nachrichten (AVN), No. 4, pp. 147.
Harris, C.; Stephens, M. J. (1988): A Combined Corner and Edge Detector. In: Alvey Vision Conference, pp. 147-152.
Hennes, M. (1995): Entwicklung eines Messsystems zur Ermittlung von Tur-bulenzparametern der Atmosphäre für Anwendungen in der Geodäsie. PhD Thesis, University of Bonn.
Huep, W. (2010): Scannen mit der Trimble VX Spatial Station. In: Zeitschrift für Vermessungswesen (ZfV), No. 5, pp. 330-336.
Juretzko, M. (2006): Leistungsfähigkeit des reflektorlosen Distanzmessmo-duls R300 der Tachymeterserie TPS1200 von Leica. In: Flächenmanagement und Bodenordnung, No. 68/2, pp. 90-95.
Katowski, O. (1989): Deformationsmessung an Bauwerken mit dem automa-tischen Theodolitmess-System ATMS. In: Proceedings of Optical 3-D Measu-rement Techniques, pp. 393-403.
Knoblach, S. (2011): Entwicklung, Kalibrierung und Erprobung eines ka-meraunterstützten Hängetachymeters. In: Allgemeine Vermessungs-Nach-richten (AVN), No. 4, pp. 122-130.
Knötzl, C.; Reiterer, A. (2010): Evaluation of an Image-Assisted Deformation Monitoring System. In: Proceedings of the Junior Scientist Conference, Vi-enna University of Technology.
Lanser, S.; Eckstein, W. (1992): A Modification of Deriche´s Approach to Edge Detection, In: 11th International Conference on Pattern Recognition, pp. 633-637.
Lowe, D. G. (2004): Distinctive Image Features from Scale-Invariant Keypo-ints. In: International Journal of Computer Vision, 2004, Vol. 60, pp. 91-110.
Marr, D.; Hildreth, E. C. (1980): Theory of Edge Detection. In: Proceedings of the Royal Society of London. No. 207, pp. 187-217.
Mosteller, F.; Tukey, J. (1977): Data Analysis and Regression. Reading, MA. Addison-Wesley.
Nakamura, J. (2006): Image Sensors and Signal Processing for Digital Still Cameras. Taylor & Francis.
Reiterer, A. (2004): A Knowledge-Based Decision System for an On-Line Videotheodolite-Based Multisensor System. PhD Thesis, Vienna University of Technology.
Reiterer, A., et al. (2009): A 3D Optical Deformation Measurement System Supported by Knowledge-Based and Learning Techniques. In: Journal of Ap-plied Geodesy, Vol. 3, pp. 1-13.
Reiterer, A.; Huber, B.; Bauer, A. (2010): Image-Based Point Detection and Matching in a Geo-Monitoring System. In: Allgemeine Vermessungs-Nach-richten (AVN), No. 4, pp. 129-139.
Rosten, E.; Drummond, T. (2005): Fusing Points and Lines for High Perfor-mance Tracking. In: Proceedings of IEEE International Conference on Com-puter Vision, Vol. 2, pp. 1508-1511
Rosten, E.; Drummond, T. (2006): Machine Learning for High-Speed Corner Detection. In: Proceedings of the European Conference on Computer Vision, pp. 430-443.
Scherer, M. (2004): Intelligent Scanning with Robot-Tacheometer and Image Processing a Low Cost Alternative to 3D Laser Scanning? In: Proceedings of the FIG Working Week, Athens, Greece.
Shapiro, L. G.; Stockman, G. C. (2001): Computer Vision. Prentice Hall.
Smith, S. M.; Brady, J. M. (1997): SUSAN – A New Approach to Low Level Image Processing. In: International Journal of Computer Vision, Vol. 23, No. 1, pp. 45-78.

94 avn | 119 ( 2012 ) 3
| Fachbeitrag begutachtet
Steger, C. (2000): Subpixel-Precise Extraction of Lines and Edges. In: Pro-ceedings of the XIXth ISPRS Congress, Vol.XXXIII-B3 of International Archives of Photogrammetry and Remote Sensing, pp. 141.
Steger, C. (2002): Occlusion, Clutter, and Illumination Invariant Object Rec-ognition. In: Proceedings of the ISPRS working group III/5, Photogrammetric Computer Vision, Vol. XXXIV, Part 3A/B.
Stempfhuber, W.; Wunderlich, T. (2004): Leica System 1200: Auf dem Weg zur Sensorsynchronisation von GPS und TPS für kinematische Messaufga-ben. In: Allgemeine Vermessungs-Nachrichten (AVN), No. 5, pp. 175-184.
Thuro, K. et al. (2009): Development and Testing of an Integrative 3D Early Warning System for Alpine Instable Slopes (alpEWAS). In: 17. Tagung für In-genieurgeologie, Zittau.
Vicovac, T. (2008): Evaluierung der Leica IATS fur die konkrete Aufgaben-stellung der on-line Objektrekonstruktion. Diploma Thesis, Vienna University of Technology.
Walser, B. (2004): Development and Calibration of an Image Assisted Total Station. PhD Thesis, ETH-Zürich.
Wasmeier, P. (2009): Grundlagen der Deformationsbestimmung mit Messda-ten bildgebender Tachymeter. PhD Thesis, Technische Universität München.
Wolf, H. (1966): Die Beurteilung der äußeren und inneren Messgenauigkeit als ein statistisches Problem. Acta Geodaetica, Geophysica et Montanistica Acad. Sci. Hung., pp. 215-223.
WEBPAGES:
Leica Geosystems (2011): http://www.leica-geosystems.de
(accessed: 12/2011).
Topcon (2011): http://www.topcon.com (accessed: 12/2011).
Trimble (2011): http://www.trimble.com (accessed: 12/2011).
AUTHORS:
Dipl.-Ing. Dr. Alexander ReitererCHAIR OF GEODESY TECHNISCHE UNIVERSITÄT MÜNCHEN
Arcisstraße 21 | D-80333 München
E-Mail: [email protected]
Dipl.-Ing.(FH) M.Sc. Andreas WagnerCHAIR OF GEODESY TECHNISCHE UNIVERSITÄT MÜNCHEN
Arcisstraße 21 | D-80333 München
E-Mail: [email protected]
Manuskript eingereicht: 29.07.2011 | Im Peer-Review-Verfahren begutachtet


![Biodiversity on the Brink: The Role of “Assisted …...2015] Biodiversity on the Brink 159 This Article does not address considerations such as the ethics of assisted mi-gration,5](https://img.pdfslide.net/doc/110x75/5f45324f2710f564b9683360/biodiversity-on-the-brink-the-role-of-aoeassisted-2015-biodiversity-on-the.jpg)