Embed Size (px)
Citation preview

System Design Assessment for a Helicopter Structural Usage Monitor
By
Richard A. SewerskyB.S. Management Engineering, WPI, Worcester, MA (1980)
M.S. Computer Science, RPI, Hartford, CT (1986)
Submitted to the System Design and Management Programin Partial Fulfillment of the Requirements for the Degree of
Master of Science in Engineering and Management
at the Massachusetts Institute of Technology
June, 1999
@1999 Richard A. Sewersky. All rights reserved. The author hereby grants to MITpermission to reproduce and to distribute publicly paper and electronic copies of this
thesis document in whole or in part.
Signature of AuthorSystem Design and Management Program
May 1999
Certified by1 ofe sor G. Apostolakis
Department of Nuclear Engineering
Certified by r wit - - - -Professor W. Harris
Department of Aeronautics,gd Astronautics
Certified byProfessor A. Odoni
Department of Aeronautics and Astronautics
Accepted byProfessor J. R. Williams
Co-dir ct System Design1 Aanagement Program
1

SYSTEM DESIGN ASSESSMENT FOR A HELICOPTERSTRUCTURAL USAGE MONITOR
by
Richard A. Sewersky
Submitted to the System Design and Management Programon May 7, 1999 in Partial Fulfillment of the Requirements for the
Degree of Master of Science in Engineering and Management
Abstract
Helicopter dynamically loaded components are typically removed from service after apredefined number of flight hours, which is derived from a combination of analysis andtesting. The design and test process is based on an assumed spectrum of flight maneuversestablished at the beginning of the helicopter development project. During the testprogram, flight loads are measured during each maneuver and these loads are used instructural fatigue damage calculations to conservatively estimate safe life of the parts (inflight hours). New approaches are being developed whereby service life will bedynamically adjusted for individual components based on measured actual usagespectrums while the helicopter is in day to day service. These techniques have beencalled Structural Usage Monitoring and have significant potential to save partsreplacement costs if the helicopter is flown less aggressively than originally assumed.This research examines a specific structural usage monitor system level architecture fromthe point of view of cost benefit and risks to ensure that the fielding of the system makeseconomic sense and is safe. Spreadsheet models are prepared to calculate potential life
adjustments for a set of high cost parts on the Sikorsky S-76 model helicopter given 3alternate usage scenarios based on field data. These models show significant cost savingspotential for these parts if structural usage lifing is applied. Risk is examined usingfunctional hazard analysis for aircraft level hazards and fault tree analysis for thestructural usage system. This risk analysis shows that if properly designed andimplemented in accordance with FAA guidelines and requirements, these cost savingscan be achieved without additional risk to helicopter passengers.
Thesis Supervisors:Professor G. ApostolakisDepartment of Nuclear Engineering
Professor W. HarrisDepartment of Aeronautics and Astronautics
Professor A. OdoniDepartment of Aeronautics and Astronautics
2

Acknowledgements
I am deeply indebted to many people for the work contained herein, especially my familywho has patiently stood by to support me. First is my loving wife Susan who more thanmet her initial commitment to give me the help and freedom that I needed to get througha difficult period of balancing work, school and family. Next are my two childrenStephanie and Alexander who patiently waited for their turn at brief periods of myattention and often shared in my excitement of "going back to school". Last but not leastare my parents Eleonora and George whose lifetime encouragement to further myeducation has truly become one of my core values that I will try to pass on to mychildren.
I am also grateful to Sikorsky Aircraft Corporation for sponsoring my MIT education andto Lee Teft in particular for his continued support. To my supervisors, Ray Carlson, JoePratt and Jan Marcus, I extend gratitude for their encouragement and patience and withmy sometimes crazy schedule. I wish to thank Roy Bailey who appreciates the value ofwhat we are attempting to do in the HUMS field and often guided me to resources thatgreatly simplified tasks. I am especially grateful to Dave Adams who served as mySikorsky advisor and patiently taught me some of the intricacies of how Sikorsky keepstheir helicopters safe.
I want to thank my team of thesis advisors, Professors George Apostolakis, WesleyHarris and Amedeo Odoni who generously gave of their time and shared their expertise inguiding me to successful completion of this work.
This work is dedicated to my family, whose sacrifices made it possible.

Biographical Note
The author has been an engineer at Sikorsky Aircraft for over 17 years, most recently inthe Diagnostics Group of the Avionics Branch. His primary projects have involveddevelopment of Health and Usage Monitoring Systems (HUMS) and enablingtechnologies. This work is based on a project to develop a production HUMS forinstallation on Sikorsky's commercial models which is currently starting the process ofcertification by the Federal Aviation Administration. He is a native of Stony Point, NYand currently resides in Cheshire, CT. He has a Bachelor Degree in ManagementEngineering from Worcester Polytechnic Institute and a Masters Degree in ComputerScience from Rensselaer Polytechnic Institute.
Address correspondence to:
Richard Sewersky Phone (203) 272-1699293 Country Club Road Email [email protected], CT 06410
4

Table of Contents
ABSTRACT .................................................................................................................................................. 2
ACKNOW LEDGEMENTS ......................................................................................................................... 3
BIOGRAPHICAL NOTE ............................................................................................................................ 4
TABLE OF CONTENTS ............................................................................................................................. 5
LIST OF FIGURES...................................................................................................................................... 6
LIST OF TABLES........................................................................................................................................7
CHAPTER 1 - INTRODUCTION............................................................................................................... 8
1.1 WHAT IS STRUCTURAL USAGE MONITORING ........................................................................................ 81.2 TO P L EV EL A RCHITECTURE................................................................................................................. 101.3 T H E S IS................................................................................................................................................. I
CHAPTER 2 - RELATED W ORK ........................................................................................................... 13
2.1 VIBRATION, STRUCTURAL LIFE AND ENGINE DIAGNOSTICS SYSTEM (VSLED) ................................. 142.2 CAA/BRISTOw HELICOPTERS USAGE STUDY ..................................................................................... 142.3 NAVY STRUCTURAL USAGE MONITOR (SUM) PROGRAM................................................................... 142.4 LOAD ESTIMATION (KAMAN).............................................................................................................. 142.5 MONTE CARLO SIMULATION OF STRUCTURAL LIFING ..................................................................... 142.6 AEROSTRUCTURES/NAVY SDRS PROGRAM...................................................................................... 142.7 BELL HELICOPTER USAGE TRIAL WITH PETROLEUM HELICOPTERS INCORPORATED (PHI) ................ 152.8 SIKORSKY VISIT REPORT TO BRISTOW HELICOPTERS ....................................................................... 152.9 STRUCTURAL USAGE MONITOR FOR MH-47E .................................................................................. 152.10 STRUCTURAL DATA RECORDER SET FOR AIR FORCE HH-60G ...................................................... 152 .11 D RA PER L A B S STU D Y ........................................................................................................................ 152.12 ROTORCRAFT INDUSTRY TECHNOLOGY ASSOCIATION (RITA) CBAM .......................................... 162.13 US NAVY COMMERCIAL OPERATIONAL SUPPORT SAVINGS INITIATIVE (COSSI) HUMS ................ 16
CHAPTER 3 - COST BENEFIT ANALYSIS ....................................................................................... 17
3.1 MODEL STRUCTURE AND SELECTED PARTS ...................................................................................... 173.2 DEVELOPMENT OF COST BENEFIT ANALYSIS .................................................................................. 213 .3 K E Y R E SU L T S ...................................................................................................................................... 2 23.4 ExAMPLE OF THE SAVINGS CALCULATION........................................................................................ 243.5 DETAILED REVIEW OF RESULTS ........................................................................................................ 243.6 OPERATOR AIRCRAFT UTILIZATION ................................................................................................. 29
CHAPTER 4 - RISK ASSESSMENT.................................................................................................... 33
4.1 FAA REGULATORY REQUIREMENTS ..................................................................................................4.2 SYSTEM FUNCTIONAL DESCRIPTION ................................................................................................ 354.3 FUNCTIONAL HAZARD ASSESSMENT (FHA)..................................................................................... 394 .4 FA U LT T R EE A N A LY SIS ....................................................................................................................... 4 14.5 SYSTEM SAFETY ASSESSMENT ............................................................................................................ 444.6 MONTE CARLO SIMULATION TO ESTABLISH STRUCTURAL RELIABILITY ......................................... 47
5

CHAPTER 5 - CONCLUSIONS ........................................................................................................ 50
5 .1 C O ST B EN E FIT R E SU LT S ................................................... . ............................................................... 5 05.2 R ISK A SSESSM EN T R ESU LTS .............................................................................................................. 5 1
CHAPTER 6 - RECOMMENDATIONS FOR FUTURE WORK ..................................................... 53
6.1 C OST B EN EFIT M O DEL EXTEN SIONS ................................................................................................... 536.2 R ISK A N A LY SIS E XTEN SIO N S .............................................................................................................. 54
R EFER ENCES .......................................... . ----..................................................................................... 55
APPENDIX I - COST BENEFIT SPREADSHEET MODEL .............................................................. 58
A 1.1 SUM M ARY OF CALCULATIONS ....................................................................................................... 58A 1.2 E X C ELL W O R K BO O K S ..................................................................................................................... 59
APPENDIX II - ASSUMPTIONS USED IN DEVELOPING USAGE SCENARIOS ....................... 85
APPENDIX III - S-76 UTILIZATION SUMMARY ............................................................................ 95
APPENDIX IV - CAFTA FAULT TREE MODEL ............................................................................... 103
A 4.1 FAULT TREE A NALYSIS - Q UALITATIVE ........................................................................................ 103A 4.2 C UTSETS AND B ASIC EVENTS ....................................................................................................... 10 4
APPENDIX V - EXTRACT FROM FAR 29.1309 EQUIPMENT, SYSTEMS ANDIN STA LLA TIO NS.................................- - .---------------...... ---.................................................................. 106
APPENDIX VI - EXTRACT FROM HUMS FUNCTIONAL HAZARD ASSESSMENT........ 108
List of Figures
FIGURE 1 - SIKORSKY SAFE-LIFE SUBSTANTIATION PROCESS ........................................................................ 8FIGURE 2 - SIMPLIFIED BLOCK DIAGRAM OF HUM S .................................................................................. 10FIGURE 3 - S-76 O UTLINE DRAW ING ....................................................................................................... 18FIGURE 4 - SPINDLE A SSEM BLY (ID #1) .................................................................................................... 18FIGURE 5 - TAIL ROTOR GEARBOX - SHAFT (ID# 5) AND FLANGE (ID# 4)............................................... 19FIGURE 6 - TAIL ROTOR RETAINING BRACKET (ID# 3).............................................................................. 19FIGURE 7 - MAIN GEARBOX INCLUDING MAIN ROTOR SHAFT (ID# 2)...................................................... 20FIGURE 8 - POSSIBLE COST/BENEFIT VARIATIONS USING SELECTED FACTORS ........................................ 20FIGURE 9 - SUMMARY OF SAVINGS PER FLIGHT HOUR . ----------------... ----.............................................. 25FIGURE 10 - DISCOUNTED TOTAL SAVINGS (REPLACEMENT ACCRUAL).................................................... 26FIGURE 11 - DISCOUNTED TOTAL SAVINGS (LIFETIME ACCRUAL) .....--.....--........................................ 27FIGURE 12 - DISCOUNTED TOTAL SAVINGS (1000 HOURS PER YEAR) ................................................ 28FIGURE 13 - DISCOUNTED TOTAL SAVINGS (MULTIPLE PART LIFETIMES)....-......................................... 28FIGURE 14 - DISCOUNTED TOTAL SAVINGS (5% DISCOUNT RATE) .................................... 29FIGURE 15 - FLIGHT HOUR DISTRIBUTION (ALL OPERATORS) ................................................................... 30FIGURE 16 - FLIGHT HOUR DISTRIBUTION (CORPORATE OPERATORS) ........................................................ 31FIGURE 17 - FLIGHT HOUR DISTRIBUTION (OIL/PASSENGER OPERATORS) ................................................. 31FIGURE 18 - FLIGHT HOUR DISTRIBUTION (UTILITY OPERATORS).............................................................. 32FIGURE 19 - RELATIONSHIPS BETWEEN FAA AND INDUSTRY DOCUMENTS ............................................... 34FIGURE 20 - S-76C+ HUMS BLOCK DIAGRAM-.-------..........................------...................................... 36FIGURE 21 - DATAFLOW FOR NORMAL ONBOARD OPERATION .................................................................. 37FIGURE 22 - DATAFLOW FOR NORMAL GROUNDSTATION OPERATION....................................................... 37
6

FIGURE 23 - DATAFLOW FOR AIRCRAFT MECHANICAL CONFIGURATION CHANGES ................................ 37
FIGURE 24 - DEVELOPMENT OF AND CHANGES To REGIME DEFINITIONS............................................... .. 38
FIGURE 25 - DEVELOPMENT OF AND CHANGES To DAMAGE MAPPING ..................................................... 38
FIGURE 26 - SUMMARY OF USAGE SYSTEM SAFEGUARDS......................................................................... 45
FIGURE 27 - VARIATION OF SAFE-LIFE WITH RELIABILITY ........................................................................... 48
FIGURE 28 - UH-60A SPINDLE/TIEROD ASSEMBLY ................................................................................... 49
List of Tables
TABLE I - CHRONOLOGICAL SUMMARY OF RELATED RESEARCH ................................................................. I3
TABLE 11 - SUMMARY OF S-76 HELICOPTER PARTS USED IN STUDY............................................................ 17
TABLE 111 - SUM M ARY OF COST/BENEFIT CASES......................................................................................... 21
TABLE IV - SUM MARY OF FAULT TREE CUTSETS......................................................................................... 42
TABLE V - RANKED ORDER OF BASIC EVENT CRITICALITY ....................................................................... 43
7

Chapter 1 - Introduction
1.1 What is Structural Usage Monitoring
Helicopters contain a number of life limited parts. These parts are dynamically loadedand hence subject to development of fatigue cracks. Many of these parts are flight criticalin that failure of one of these parts could cause a catastrophic accident. Traditionally, tomaintain safety, these parts are assigned a safe-life limit in flight hours after which theparts must be removed from the aircraft and discarded. Limits in calendar time or cycles(e.g., landings for landing gears) are also used. The theoretical basis of calculating safelife is contained in Miner's Cumulative Damage Theory. (Reference 1)
The process Sikorsky Aircraft uses to establish a safe-life limit is shown graphically inFigure 1. When a new aircraft is developed, with customer's input, an assumption ismade regarding the "worst case" of how the helicopter will be flown during its life(usage). This typically consists of a list of flight maneuvers (called regimes), theirmaximum expected frequency of occurrence, or percent usage within a particular timeperiod (such as per 100 flight hours). This assumed spectrum is then used in defining andexecuting flight tests where critical loads are measured during each of these maneuvers.
Strength
TestLoad
Cy
Laboratosimulate
Loads |
FlightLoad
Usage|
RccRate
cles Regim e Nunber Regime Nun
ry bench testing Flight testing provides Customer'ss flight loading measured loads defines occur
M iner's Rule
mher
spectrumence rates
Method for calculatingaccumulated damage
Load
Cycles
A CRTCalculatedRetirement Time
Figure 1 - Sikorsky Safe-Life Substantiation Process
8
The margin of assumed worst case usage over actual usage is deliberately included andcontributes to the overall structural reliability goal.
Combined with material strength characteristics and results from sample part testing todestruction, the assumed flight loads are then use to establish an acceptable CalculatedRetirement Time (CRT) for these parts using Miner's Rule.
Recently, there have been a number of efforts (summarized in Chapter 2) to explore thepossibility of substituting actual measured usage for the assumed "worst case" usage thatwas originally used to calculate retirement times. This would allow continualadjustments of part retirement time based on the actual measured usage. The benefits ofthis approach would be to increase the accuracy of safe-life estimates for parts on fieldedaircraft. Whereby the actual measured usage is more benign than the assumed usage, partlives could be safely extended. Where the measured usage was more severe than theassumed usage, part lives should be shortened to maintain safety margins.
The specific methods used to determine safe-life and retirement times are developed byaircraft manufacturers and sanctioned by the Federal Aviation Administration (FAA) forcivil aircraft or the relevant military engineering organization for military aircraft. Theiroversight is meant to insure that the traveling public or military personnel are safelytransported using these aircraft. Where these new methods are proposing to change theexisting accepted calculation methods, they will require approval of these regulatoryauthorities.
The term "Structural Usage Monitoring" has been coined to describe systems which willautomatically recalculate retirement times based on in-flight measurements. A typicalarchitecture is shown in Figure 2. The usage monitoring function works in the followingmanner. An on-board computer is used to acquire automated sensor readings, which arefed to special algorithms to determine the current aircraft regime. In real-time, theregimes are determined approximately once per second and stored to a data file. At theend of the flight, this data file is summarized into a histogram with the number ofoccurrences and times spent in each regime. Using the regime histograms, the totaldamage fraction (where "1" means the part's safe-life is used up) is recalculated for eachfailure mode of each tracked component. This damage data is then transmitted to aground-based computer, which may post the damage to log cards for each component.When the total damage for a particular component exceeds its acceptable life, themaintainer can be reminded to remove the component from service.
Substituting actual measured usage for assumed "worst case" usage removes some of themargin from the process of determining retirement lives. One of the concerns in theapplication of this methodology to possibly extend part lives is whether there is anyadverse affect on overall part reliability. For example, the US Army expects flightcritical parts to have less than "one-in-a-million" chance of catastrophic failure(probability of 1 x 10⁻⁶). Sikorsky has done some simulations using Monte Carlomethods to examine whether the existing safe-life methods statistically provide this level
9

of reliability (References 2,3 & 4). These simulation studies have shown that the partsfor which simulations were conducted have shown to be close to that level of reliability.They also show that usage accounts for about 1/6t of the reliability margin while strengthand load measurement accounts for the remaining 5 /6 ' of reliability margin. This allowsestimation of an upper bound on the worst case reliability reduction from errors by usagemonitoring. Several methods have been discussed to regain the 1/6t of reliability marginthat could be lost in removing some of the conservatism. These include limiting themaximum life extension to 2-3 times the existing CRT and/or adjusting the method bywhich damage is calculated to increase conservatism. Even with these proposed changes,it is believed that substantial cost savings can still be achieved.
1.2 Top Level Architecture
The structural usage function is typically part of a Health and Usage Monitoring System(HUMS). In addition to structural usage, the HUMS will record exceedances ofoperational limits, calculate rotor system adjustments, monitor for vibrations from powertrain components such as gearboxes and drive shafts, and package data for a flight datarecorder (black box). Figure 2 illustrates the basic physical architecture of a HUMSsystem.
- Recognizes Histogramsregimes Damage summary:
- Creates Raw datahistograms
- Calculatesincrementaldamage
- Stores resultsand raw data(sealed withCRC)
On-ground
Unpack file - Total flight hoursCheck CRC - Total damage hoursDisplay resultsBookeep damage
by component(optional)
Figure 2 - Simplified Block Diagram of HUMS
The left side of the diagram describes what happens on-board the aircraft while the rightside of the diagram describes ground processing. A number of sensors, most of whichalready exist on the aircraft for piloting are fed into the on-board processor. Its role in
10
Sensors
On-aircraft

structural usage is to recognize the regimes, summarize regime data, calculate damage forthat flight, and store the raw data for archive purposes. For other HUMS functions, itmay interface to dedicated sensors such as accelerometers, process and store the results.It may also interface to a shared or dedicated display (not shown) to allow interactionwith the pilot. The data will then be passed to a memory card and "sealed" using a CyclicRedundancy Code (CRC). This data card is then carried via the pilot to the groundprocessor and inserted into a card drive. The ground processor will then download thedata, verify the CRC, and display the results to the maintainer. Optionally, thegroundstation may account for the damage for each component and generates updates tothe component log cards. These log cards are part of the official record of the aircraft andcontain total flight hours and total damage hours for each component.
1.3 Thesis
The basic thesis of this paper is that application of structural usage techniques to theSikorsky S-76 model helicopter has significant potential to provide direct financialbenefits to helicopter operators and that it is possible to achieve this benefit withoutentailing significant risk to aircraft or passengers.
The potential financial benefits are driven by the choice of aircraft life limited parts thatare enrolled in usage monitoring and the specific way an operator flies each individualaircraft versus how the aircraft designer assumed it would be flown. To assess thepotential financial benefits for this study, the existing and proposed damage calculationsfor a specific set of high cost/low life parts were modeled using spreadsheet models.Several alternate usage patterns were then examined for each part and the savings (orloss) calculated using discounted cash flow techniques. The sensitivity of the analysis toseveral key assumptions were then examined including accrual method, discount rate andutilization of aircraft (flight hours per year). This combination of analysis by examplesprovides concrete case studies of savings that could be achieved through investment inusage monitoring by helicopter operators. The spreadsheet models allow these cases tobe adjusted to better apply to specific operator's circumstances, explore sensitivities toother parameters or extend the analysis to other components or aircraft models. Chapter3 describes these models and the results of their application. In this way, the models canbecome a generic tool to examine the appropriateness of structural usage monitoring tospecific situations.
The risk is examined by application of several key stages of system safety assessment asrequired by the Federal Aviation Administration (FAA) in development of an applicationfor system certification. Because the structural usage function will modify an approvedFAA procedure, it will ultimately require FAA approval and certification. It should benoted that the purpose of this risk analysis is not to prove that the system will be safe, butto examine the issues surrounding design and system development that can affect safety.The proof of safety will come during the detailed design, implementation and testingprocess required for FAA certification.
I I

In Chapter 4, following a brief review of the regulatory environment and the systemconceptual design, a set of analyses of system risk are completed. The specific analysescompleted and discussed include:
- a Functional Hazard Analysis (FHA) where the top level aircraft functions areexamined for the criticality of each potential system failure mode to aircraft safety(in this case, chronic undercounting of usage associated damage could contributeto failure of flight critical parts)- a fault tree analysis of the possible ways failure of the structural usage systemcould lead to the undercounting of damage and the methods/crosschecks neededto minimize this possibility.- previous work at Sikorsky to examine the reliability aspects of the part lifesubstantiation process and the ways usage monitoring can affect reliability.
Following the risk analysis, Chapter 5 will provide conclusions and Chapter 6 will offerrecommendations for future research.
12

Chapter 2 - Related Work
Due to the significant potential for cost savings, structural usage techniques have beenresearched over significant period of years. This section will highlight some of the keyresearch that has had a direct feed into the current project. A chronological summary ofthis research is provided in Table I and additional detail is provided in sections 2.1 to2.13.
Table I - Chronological Summary of Related Research
Reference Year Organization(s) Project Contribution5 1987 Bell Vibration, Structural Life and Engine One of the first projects to
Diagnostics System (VSLED) for V-22 Tilt build in usage and mechanicalRotor diagnostics into a new aircraft
design.6 1987 CAA, Bristow Usage trail on Puma (civil) Usage scenario (1000 hours)7 1986-94 US Navy, Sikorsky Structural Usage Monitor (SUM) for SH- Regime recognition process
60B (military) (patented) - validated on 6aircraft
8,9 1988-89 US Army, MDHC, Application of Holometrics to Apache Demonstrated potential toKaman helicopter synthesize rotating system
loads from fixed systemmeasurements.
10 1989-90 US Army, Sikorsky Structural Usage Monitor (SUM) for UH- Regime recognition process60A & L (military) (patented) - validated on 3
aircraft, 6 mo each2,3,4 1990-91 US Army, Sikorsky Monte Carlo simulation of reliability of UH- Component strength, flight
60A main rotor components. loads and usage variability (inthat order) contribute tocomponent reliability and thatSikorsky methodologyachieves .999999 reliability onsimulated components.
11 1993-6 US Navy, Structural Data Recorder Set (SDRS) for Regime recognition validatedAerostructures Navy AH-1W Helicopter on 50 aircraft for total of 3400
hrs, cost benefit study12 1996 US Army, Usage trail on Bell 412SP (civil) Operational Feasibility,
NASA,FAA, Bell, detailed cost benefit, usagePetroleum scenario (450 hours)Helicopters Inc(PHI)
13 1996 Sikorsky, Bristow Informal survey of -76 & -61 (civil) Usage scenario
14 1997 US Army, Boeing Structural Usage Monitor System (SUMS) Significant discussionfor MH-47E (military) regarding robust handling of
sensor data.15 1998 US Air Force, Structural Data Recorder Set (SDRS) for -Usage scenario for 6 aircraft
Georgia Tech AF HH-60G Helicopter (900 hours)25 1997-9 US Navy, COSSI Navy HUMS Program for SH-60B Planned production
BFGoodrich and CH-53E Helicopter Implementation after extendedtrials on 12 aircraft.
13~
2.1 Vibration, Structural Life and Engine Diagnostics System (VSLED)
The V-22 is a tilt rotor aircraft being developed for military and commercial applications.It is fairly complex mechanically and included one of the first attempts to include on-board capability to monitor mechanical systems and aircraft usage.
2.2 CAA/Bristow Helicopters Usage Study
A brief report was acquired which enumerates the usage profile for one Puma helicopteroperating in the North Sea (over 1000 flight hours). Its value to the current effort is that itprovides a basis for one set of the usage scenarios ("Puma") that is presented for the S-76model in the cost benefit analysis chapter. (Reference 6)
2.3 Navy Structural Usage Monitor (SUM) Program
This project was conducted about 8 years ago by Sikorsky under contracts to US Navyand Army to install usage monitors in about 10 aircraft. It proved out an approach to realtime regime recognition, which became the basis of several follow-on efforts includingthe approach currently being implemented on Sikorsky aircraft. (Reference 7)
2.4 Load Estimation (Kaman)
Holometrics constitutes a method where measured parameters are mathematicallymodeled to attempt to simulate actual loads in components. The calculated loads wouldthen be used in damage calculations. (References 8,9)
2.5 Monte Carlo Simulation of Structural Lifing
Sikorsky started this area of research under US Army sponsorship. It provides the basisof the ability to estimate the potential effects of usage monitoring on reliability of criticalparts. It is discussed in more detail in section 4.6. (References 2-4)
2.6 Aerostructures/Navy SDRS Program
This project was funded by the Navy for the AH- 1 W helicopter and involved installingprototype usage monitors. It involved a large number of aircraft and validated a tree-based approach to regime recognition with over 3400 hours of flight. Lessons learned arebeing applied to the Sikorsky usage monitor. The key output was a detailed costjustification for that fleet. (Reference 11)
14

2.7 Bell Helicopter Usage Trial with Petroleum Helicopters Incorporated (PHI)
Bell installed a commercial HUMS on a Bell 412 model owned by PHI. They collecteddata onboard and processed damage calculations on the groundstation. The contributionwas a good set of lessons learned and a summary of how the measured spectrumcompared to the assumed spectrum. Sample cost savings were quoted for comparison. Itprovides a basis for one set of the usage scenarios ("PHI") that is used in the S-76 costbenefit model. (Reference 12)
2.8 Sikorsky Visit Report to Bristow Helicopters
One of Sikorsky's structural engineers visited several European sites where Sikorskyhelicopters are operated and interviewed pilots and maintenance personnel. Hesummarized some observations of how their described usage differs from Sikorsky'sassumed spectrum. It provides a basis for one of the usage scenarios ("Renna") that isused in the S-76 model cost benefit analysis. (Reference 13)
2.9 Structural Usage Monitor for MH-47E
This program was sponsored by the US Army for application to the MH-47E tandemrotor aircraft. It involved capture of data using a flight data recorder and processing thedata to recognize regimes using a ground based PC. The system was tested at Ft.Campbell, Kentucky in 1996 for 5 flights and showed accuracy of regime identificationbetween 98 and 100% after limits were adjusted. The effort also included extensive workto establish input data filtering and quality control. (Reference 14)
2.10 Structural Data Recorder Set for Air Force HH-60G
This program was sponsored by the US Air Force and the work was performed byGeorgia Tech Research Institute (GTRI) for application on the Sikorsky HH-60G modelhelicopter. It involved equipment built by Systems and Electronics, Inc., installed on 6operating aircraft at 3 different bases. The regime recognition was performed on groundbased equipment by GTRI. The flight test effort had accumulated 631 flight hours as of9/97 and was targeted to cover about 1200 flight hours cumulative. Initial resultsindicated that in most cases, measured usage was less severe than assumed usage butcame close to assumed usage on the training aircraft surveyed. (Reference 15)
2.11 Draper Labs study
Draper conducted a cost benefit analysis for the Navy for possible HUMS introduction tothe CH-53E model. It covered usage monitoring in a cursory manner and provided in-depth analysis of the spare parts pipeline affects. This may be useful to future extensionsof the current study. It also summarized potential development and fielding costs of such
15

a system. An extension of this study to the Navy plans for fleetwide HUMSimplementation is currently underway. (Reference 22)
2.12 Rotorcraft Industry Technology Association (RITA) CBAM
This is a model developed by Booze-Allen to allow either airframe manufacturers or
operators to complete sensitivity analysis of various cost benefit assumptions to their fleetbased on their operating assumptions. It could be used as an eventual host of the modelsdeveloped under this project. (Reference 21)
2.13 US Navy Commercial Operational Support Savings Initiative (COSSI) HUMS
DARPA funded initiative to save operational costs through implementation of HUMS tolargely commercial specifications on the Navy's helicopter fleet. BFGoodrich isdeveloping the system under a cost share arrangement. The Sikorsky commercial HUMSwill be a derivative design that will be FAA certified. It may become the first fieldedstructural usage system. (Reference 25)
16

Chapter 3 - Cost Benefit Analysis
This chapter presents the cost benefit analysis model for structural usage monitoring asapplied to the Sikorsky S-76 model helicopter. There are a number of subsections asfollows:
- structure of the model and the parts that were chosen,- process of developing the analysis,- review of key results,- detailed savings calculations,- detailed results and sensitivity studies,- data regarding operator utilization of the S-76 fleet.
3.1 Model Structure and Selected Parts
A set of Microsoft Excel spreadsheets were developed which includes the mapping ofregimes to damage for several key life limited parts on the Sikorsky S-76 modelhelicopter. The chosen parts are summarized in Table II below. Note that part 3 and 4are generally replaced as a unit and have the same damage calculations. They are treatedas one part in the cost benefit models. The main and tail rotor shafts are integral parts ofthe main and tail gearboxes respectively and hence replacement of the shafts and overhaulof the gearboxes must be time synchronized.
Table II - Summary of S-76 Helicopter Parts Used in Study
ID # Part Number Part Name Retirement Qty/ CurrentTime (flight aircraft price perhours) part in $
1 76102-08603-041 Spindle/liner assembly 5000 4 39,7322 76351-09630-041 Main rotor shaft: 4900 1 23,402
76351-09600-044 Affects Main Gear Box Overhaul 3000 1 184,2183 76102-05001-047 TR outboard retaining plate 7000 1 8,4304 76358-05118-047 Tail gear box output flange 7000 1 15,5345 76358-05124-042 Tail gear box output shaft: 7000 1 17,063
76358-05600-041 Affects Tail Gear Box Overhaul 3500 1 32,620
Figure 3 shows the overall arrangement of the S-76 Helicopter. The chosen parts areused in the main and tail rotor assemblies and each are shown in Figures 4 through 7.The parts were chosen on the basis of cost and retirement time (expensive and low life).
17

Tail Rotor including TRShaft and Flange /Retainerassemblies
Figure 3 - S-76 Outline drawing
Figure 4 - Spindle Assembly (ID #1)
18

Figure 5 - Tail Rotor Gearbox - Shaft (ID# 5) and Flange (ID# 4)
Figure 6 - Tail Rotor Retaining Bracket (ID# 3)
19

Figure 7 - Main Gearbox including Main Rotor Shaft (ID# 2)
For each part, baseline damage calculations are modeled for the assumed regime usagespectrum and baseline cost per flight hour is calculated. Starting from the baseline partmodels, alternate savings cases are calculated by varying a number of factors as depictedin Figure 8 which also maps the possible combinations of alternate cases. The key factoris usage scenario and three different usage scenarios are developed from sourcedocuments described in Chapter 2 (references 6, 12 and 13) and the revised lives based onthese spectra are calculated. The savings for each scenario are then accrued two waysusing two usage rates of the helicopter, limited by useful aircraft life. They are thencorrected for present day dollars using two different discount rates. Table III illustratesthe subset of possible cases that were developed and the average discounted savings.
Baseline Usage Savings Usage Rate Relation to Interest RateDamage Scenario Accrual (hours/year) Aircraft Life (percent)
Calculation (severity) M ethodM odel
Figure 8 - Possible Cost/Benefit Variations Using Selected Factors
20
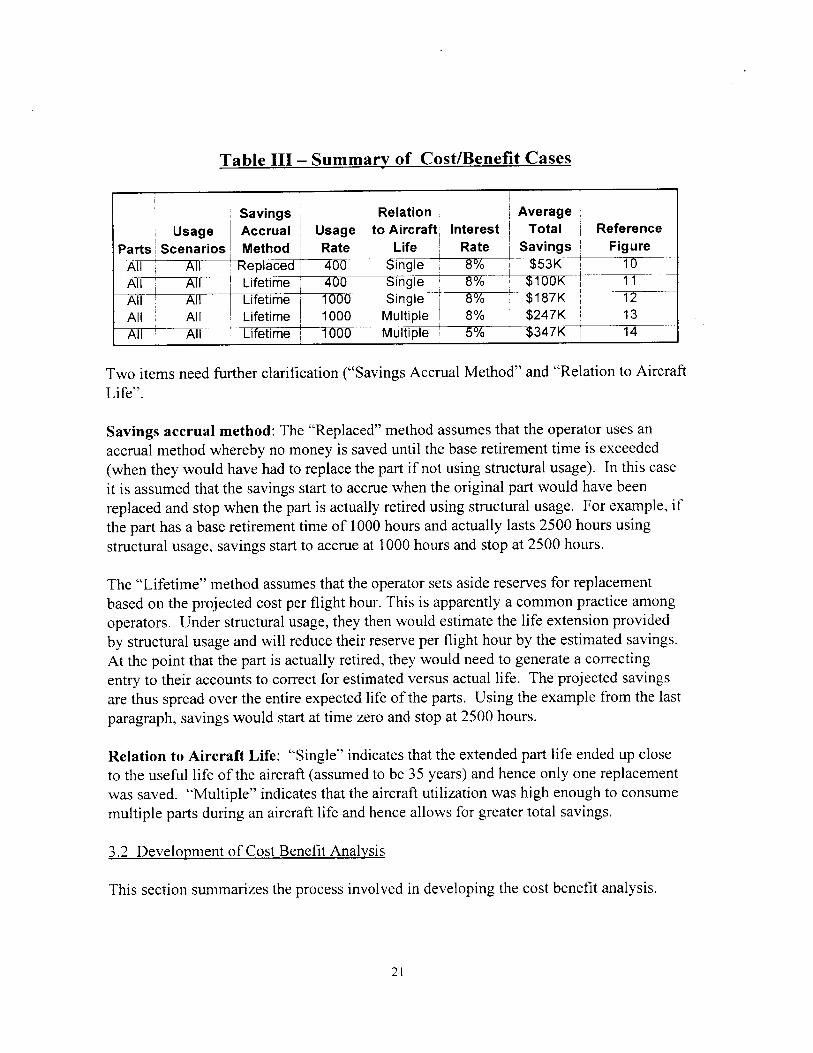
Table III - Summary of Cost/Benefit Cases
Savings Relation Average
Usage Accrual Usage to Aircraft Interest Total Reference
Parts Scenarios I Method Rate Life Rate Savings Figure
All All Replaced 400 $ingle 8% $53K 10All All Lifetime 400 Single 8% $100K 11
All All Lifetime 1000 Single 8% $187K 12
All All Lifetime 1000 Multiple 8% $247K 13All All Lifetime 1000 Multiple 5% $347K 14
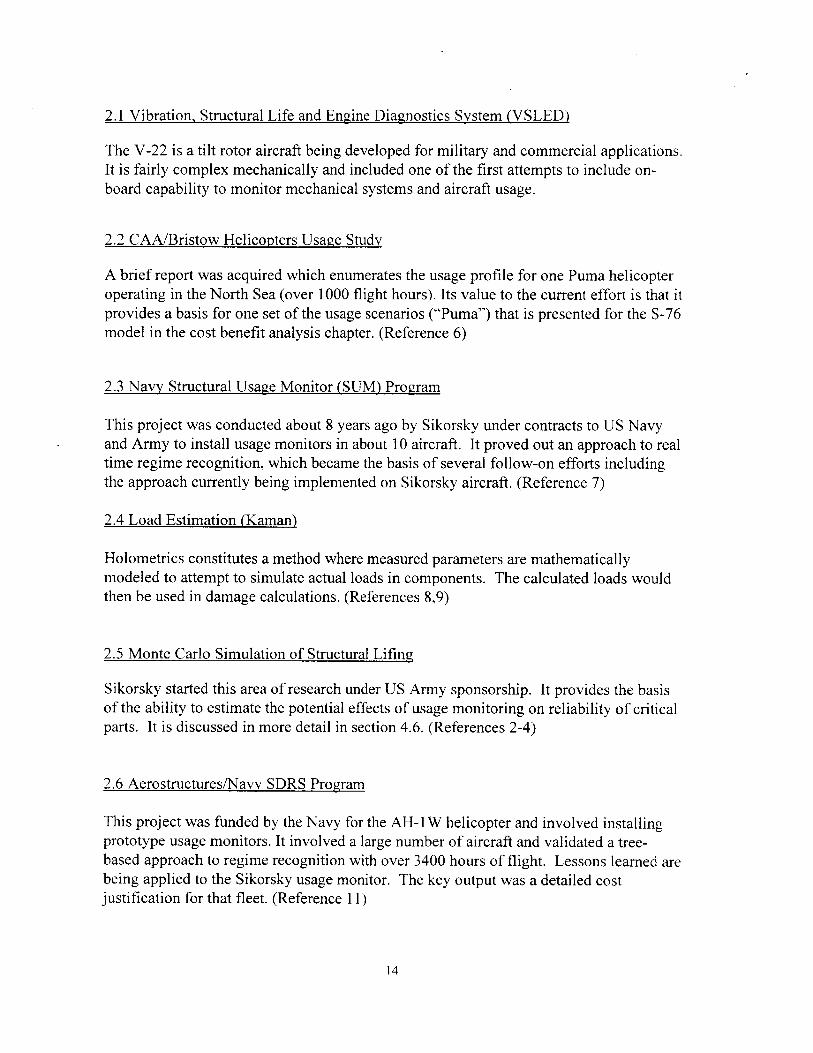
Two items need further clarification ("Savings Accrual Method" and "Relation to Aircraft
Life".
Savings accrual method: The "Replaced" method assumes that the operator uses an
accrual method whereby no money is saved until the base retirement time is exceeded
(when they would have had to replace the part if not using structural usage). In this case
it is assumed that the savings start to accrue when the original part would have been
replaced and stop when the part is actually retired using structural usage. For example, if
the part has a base retirement time of 1000 hours and actually lasts 2500 hours using
structural usage, savings start to accrue at 1000 hours and stop at 2500 hours.
The "Lifetime" method assumes that the operator sets aside reserves for replacement
based on the projected cost per flight hour. This is apparently a common practice among
operators. Under structural usage, they then would estimate the life extension provided
by structural usage and will reduce their reserve per flight hour by the estimated savings.
At the point that the part is actually retired, they would need to generate a correcting
entry to their accounts to correct for estimated versus actual life. The projected savings
are thus spread over the entire expected life of the parts. Using the example from the last
paragraph, savings would start at time zero and stop at 2500 hours.
Relation to Aircraft Life: "Single" indicates that the extended part life ended up close
to the useful life of the aircraft (assumed to be 35 years) and hence only one replacement
was saved. "Multiple" indicates that the aircraft utilization was high enough to consume
multiple parts during an aircraft life and hence allows for greater total savings.
3.2 Development of Cost Benefit Analysis
This section summarizes the process involved in developing the cost benefit analysis.
21

1. Chose the parts to examine:
- The S-76 maintenance manual Chapter 4 - "Airworthiness Limitations" was
consulted and those parts were selected which had a replacement time less than 10,000hours. (At an average aircraft utilization of 400 hours per year it would take up to 25years to use up a 10,000-hour part.)
- The Illustrated Parts Bulletin (IPB) was examined to understand sub-assemblycontent. The main and tail rotor shafts are examples of parts that limited the life ofreplaceable sub-assemblies (the main or tail gearboxes).
- Catalog prices for each part were checked and parts that were expensive enoughto track with usage monitoring were selected.
2. Damage calculations for the selected parts were researched in the Sikorsky archives.The damage calculations were entered into a spreadsheet so they could be manipulated.
3. Alternate usage scenarios were researched. Three were found that were usable forcommercial aircraft (several pertaining to military aircraft are contained in thereferences). Each scenario was converted to the S-76 usage format by making reasonablemapping assumptions between similar regimes. These mappings are detailed inAppendix II.
4. Aircraft utilization data was examined to pick utilization rates to use for savingscalculations. These are summarized in section 3.6 and the backup data is included inAppendix III.
5. The final cost spreadsheets that calculate alternate part lives for the four selected partsgiven the three alternative usage scenarios were constructed. The models include otherfactors that can be varied (cost savings allocation method, aircraft utilization rate anddiscount rate). The actual cost spreadsheets are included in Appendix I.
6. Cost analyses and sensitivity studies were completed and summarized. Key results aresummarized in section 3.3 and details are reviewed in section 3.5.
3.3 Key Results
Based on an examination of the cost savings analysis and sensitivity studies, thefollowing conclusions can be drawn about the benefits of usage monitoring.
First, usage monitoring can provide potentially significant cost savings. As shown infigure 9, total savings per flight hour from the four parts studied ranged from $17.73 to$24.99 with the average savings of $21.63. Under one usage scenario, two of the partsactually lose life (extra cost of $2.32 and $0.46 per flight hour). This loss of part life was
22

expected and provides a safety benefit of usage monitoring in that some parts are beingflown outside the assumed spectrum and have an increased risk of failure.
The net present value of usage savings ranged between $46K to $430K. The actual
amount of savings that the operator experiences is affected by several factors including:
- how they account for part replacement cost- how much they fly their aircraft (10 to over 1400 hrs per year)- what discount rate they use (cost of money assumed at either 5 or 8%)- how long they keep their aircraft (assumed to be 35 years based on Sikorsky'sS-61 commercial model which has been in service since the early 60's)- how they fly the aircraft (benign to severe).
The low scenario ($46K) was for an operator that:
- accrued savings after the first part replacement for one part life- flew 400 hours per year- cost of money is eight percent
- Spent 75 percent more time than the assumed spectrum in the most damaging
regime (full power climbs). Note that there are 13 regimes that accrue damage for thesefour parts.
The high scenario ($430 K) was for an operator that:
- spread savings over repeated part lives for the full 35 year aircraft life- flew 1000 hours per year- cost of money is five percent- spends 25 percent less time than the assumed spectrum in the most damaging
regime (although spends twice the time in 2 other regimes which contributed relativelylittle damage).
Business and regulatory issues will drive the final savings to the operator because:
- some part costs are buried in "power by the hour" rates for gearboxes (wherebythe operator elects to pay for gearbox time by the flight hour and Sikorsky bears the costof an overhaul at the prescribed time including replacing any parts that have reached theirfatigue retirement time).
- the FAA will pass judgment on granting life extensions, limiting extensions tomultiples of existing life and /or other controls imposed to ensure safety.
- system acquisition and maintenance costs will be determined by specificinstallation details on each model helicopter as well as policy that drives OEM, supplierand operator efforts to maintain the system.
23

3.4 Example of the Savings Calculation
The following example will take the reader through a simple saving calculation, given anadjustment in part life. In this case, let's use replacing an automobile transmission. Thisrepresents the thought process behind the spreadsheet model, which was used to calculateand examine sensitivity of usage savings. To further simplify the example, we will ignorethe time value of money.
First let's assume the transmission costs $1000, normally lasts for five years and the car isused an average of 100 hours/year. That is a baseline cost of $1000/5 or $200 per year.On a per hour basis it would be $200/100 or $2 per hour. Now let's assume that we wereable to monitor the ratio of stop-and-go versus highway miles and where the monitorshows over 80% highway use, doubled the life of the transmission to 10 years. At theend of five years you would normally buy a new part for $1000, but with the extendedlife part, you don't have to replace it, thus saving $1000 total.
These savings could be spread in two different ways, depending on how the ownerbudgets for repairs. If he pays cash for the replacement transmission when it must bereplaced, he begins to save money when it exceeds the expected life of 5 years andcontinues to save until he finally has to replace it after 10 years. The savings would thusbe $200/year for 5 years starting at year 6.
If the owner budgets and sets aside money for this transmission replacement on a cost perhour basis he would calculate the expected savings in a different manner. Based on pastexperience, most of his driving is on the highway, so he would estimate that he would getdouble the life of the transmission. On a per hour basis it would now cost him$1000/1000 hours or $1/hour instead of the $2 per hour baseline for a savings of $1 perhour. Annually it would be $1 per hour times 100 hours per year or $100 per year overten years.
If the car ended up rusting to the point that he had to junk it after only 8 years, his realcost per hour would be $1000/800 hours or $1.25 per hour. Subtracted from his baselinecost of $2 gives a saving of $0.75 per hour.
3.5 Detailed Review of Results
The following section uses a number of layered bar graphs to present the results of thecost benefit analysis. Referring to Figure 9, let's start by walking through the contents ofthe graph and its format. The y-axis is in units of savings in dollars (in this first exampleit is savings per flight hour). Each of the first three bars represents a different usagescenario and the fourth bar is the average of the three scenarios. The legend shows thehatch patterns of the four parts whose savings make up each bar. In all graphs, thespindle assembly makes up the largest part of the savings. The main rotor shaft is
24

typically next. The tail rotor shaft and combination of tail rotor flange/retaining bracketare fairly minor. Listed above each graph for convenience is the total savings number.The details that back up the graphs are included in Appendix I.
You'll note from this graph that for the third scenario, the tail rotor shaft and flange shownegative savings (below the zero dollar line). As mentioned earlier, the negative savingsare due to the fact that the third scenario is more severe than the assumed usage spectrumin areas that are relatively more damaging to these two parts than to the other two.
As you can see from this graph, the average saving per flight hour from the four parts isestimated at $21.63. It should also be noted that while there is some variation in savingsbetween the three scenarios it is not a major variation.
Summary of Savings per Flight Hour
W... _.$24.99$25.0o $2.1 $17.73 $16
$20.00
$15.00 ED TR Flange
$10.00ETR Shaft
$5.0o Z MR Shaftso.oo E Spindle
($5.00)1 2 3 Avg
Scenario
Figure 9 - Summary of Savings per Flight Hour
The next two graphs as shown in Figures 10 and 11, show total savings discounted backto the present year. The discounting is done using one of two methods. In the firstmethod (Figure 10) the operator is expected to see savings starting at the time they wouldhave replaced the first part until the end of the extended life. In the spreadsheets, thesetwo points are calculated and the total savings are spread equally between them over thatperiod of years. The savings are then discounted back to present-day dollars using a netpresent value formula with a given discount rate.
25

The second accrual method (Figure 11) assumes that the operator pre-allocates part costto each flight hour of aircraft use. Thus the savings per flight hour is spread over theentire part life from when it is installed to when it is removed.
The first graph shows an average lifetime savings of $53 K. This is based on an eightpercent discount rate and aircraft utilization of 400 hours per year. Comparing this withthe next graph, you can see that spreading the savings over the full part life (starting inyear 1) nearly doubles the average lifetime savings to $100 K. It should also be noted onthe first graph that $46 K. for the third scenario is the low end of the savings ranges.
Summary of Discounted Total SavingsSavings Acrued when Replaced (A/C used 400 hrs/yr)
$70,000 $60K
$60,000 $52K 46K $53
$50,000
$40,000 m TR Flange$30,000$20,000 EITR Shaft
$10,000 Z MR Shaft$0- S Spindle
($10,000)1 2 3 Avg
Scenario
Figure 10 - Discounted Total Savings (Replacement Accrual)
26

Summary of Discounted Total SavingsSavings Acrued over Part Life (A/C used 400 hrs/yr)
$116K$120,000 - $100K
499K $85K$100,000
$80,000
$60,000- IIITR Flange
$40,000 IllTR Shaft
$2,0 MR Shaft$20,000-
$o S Spindle
($20,000)-1 2 3 Avg
Scenario
Figure 11 - Discounted Total Savings (Lifetime Accrual)
The next graph as shown in Figure 12, is the same as the previous one except that theaircraft utilization has been increased to 1000 hours per year. You can see that thisroughly doubles the discounted savings to an average of $187K where the savings arespread over the entire part life.
27

Summary of Discounted Total SavingsSavings Acrued over Part Life (A/C used 1000 hrs/yr)
$247K$250,000 -
$200,000- 16 K$ 7
$150,000
--- D TR Flange$100,000 -
ITR Shaft$50,000- 0 MR Shaft
$0 _F_..._.._.... ESpindle
($50,000)1 2 3 Avg
Scenario
Figure 12 - Discounted Total Savings (1000 hours per year)
Figure 13 - Discounted Total Savings (Multiple Part Lifetimes)
28
I I

The next graph as shown in Figure 13, illustrates an effect that can significantly increasethe total savings. In this case we take advantage of the shortened time span during whichthe part life is consumed due to the higher utilization rate of 1000 hours per year. Overthe assumed 35-year aircraft life, rather than having to limit savings because one part islasting over 35 years, the parts are now being replaced several times in 35 years. We canthus accrue savings from several parts in sequence. This increases the average savings byabout $60K.
The last of this series of graphs (Figure 14) illustrates the impact of reducing the discountrate to 5 percent with all other factors being kept the same as the previous graph. Thisincreases the average total savings to $347K (or an additional $1 00K). Note that thesecond scenario is the high of the range at $430K.
Summary of Discounted (5%) Total SavingsSavings Acrued over 35 yr Aircraft Life (A/C used 1000 hrs/yr)
$430K$450,000- $347K$400,000 $276$350,000 -
$300,000-$250,000 -
$200,000 - ITR Flange$150,000 1iJTR Shaft$100,000 0MR Shaft
$50,000 -
$0 E3 Spindle
Figure 14 - Discounted Total Savings (5% Discount Rate)
3.6 Operator Aircraft Utilization
For the S-76 fleet of close to 500 aircraft worldwide, there is great variation in the aircraftusage. Sikorsky maintains a database of these aircraft and to provide a basis for theaircraft usage rate assumptions, its distribution was examined and summarized. Figure15 shows the distribution for the subset of aircraft for which reliable data was available(397 aircraft). The relevant details of the database are included in Appendix III.
29
1 2 3 Avg
Scenario

The range of utilization included one operator who flew an average of 10 hours per yearto one with an average of 1473 hours per year. They tended to group at around 400 hours
per year and at around 1,000 hours per year so these points were chosen for savingscalculations. The database of 397 aircraft was further grouped by three use categories:
- 133 Corporate, with an average of 258 hours per year (Figure 16)
- 157 Oil/Passenger with an average of 654 hours per year (Figure 17)
- 107 Utility with an average of 358 hours per year. (Figure 18)
Annual Flight Hour Distribution
18
15
i i
00C)00 00 000 00 00 0m" 11 tO (ON- W m)
o) Co C 0 0 0 to 0 0 0 0 0 00 - ( c, .1 LC)
Annual Flight Hours
Figure 15 - Flight Hour Distribution (All Operators)
30
0
EZ
00)
22
15
7 605
0)0)C%4
I 0

Annual Flight Hour Distribution - S-76 Corporate
24 24
17
108
7
2 200 10 0 0I
Annual Flight Hours
Figure 16 - Flight Hour Distribution (Corporate Operators)
Annual Flight Hour DistributionS-76 Oil/Passenger
16
14
1211
109
8 88 87
4 84 5
0 0 0 0
o> C C> C 0> 0 0 0 0) 0 0 0) 0 0 0 2V)LA LA L LO LO LA LO LA LA LO LA LA LA LA 0
CN, m~ I~ VA to r-- 00 m) 0 M-CJ ~
Annual Flight Hours
Figure 17 - Flight Hour Distribution (Oil/Passenger Operators)
31
T
0
Ez
0
.0
Ez

Annual Flight Hour DistributionS-76 Utility
0C 0 0 0) 0 0 0 0LO U) U") LO U) U'O LO U') L0 U) L) U'O
C4 CY) 11 U') (0 r- 00 0) 0C)
Annual Flight Hours
Figure 18 - Flight Hour Distribution (Utility Operators
32
0
Ez

Chapter 4 - Risk Assessment
The goal of this risk assessment is to examine the conceptual design of the structuralusage subsystem and generate specific safety requirements that must be met to keepaircraft risks from system malfunctions to acceptable levels. As this paper cannotexamine specific design details (these are proprietary to the HUMS supplier), it cannot
make concrete statements regarding safety of the fielded system. This level of proof mustultimately be provided to the FAA as part of the application for certification of theHUMS system. This chapter will review system level risks, identify concerns andpotential ways to address these concerns and prioritize areas of focus in the detaileddesign effort of developing a certified system. The analysis will be covered in severalsubsections as follows:
- An overview of the regulatory environment which imposes safety requirements.
- A review of the current system requirements and conceptual design.
- An examination of key system dataflows.
- A summary of possible aircraft level hazard effects.
- A summary of key failure paths from a subsystem level fault tree.
- A summary of the Monte Carlo method of estimating reliability.
4.1 FAA Regulatory Requirements
As mentioned in Chapter 1, the FAA (in Chapters 4 and 5 of the aircraft maintenancemanual) approves existing retirement times. The application of structural usagedynamically changes these limits using an automated system. The worst-case failureeffect of such system would be to chronically under calculate damage, hence leaving apart on the aircraft too long, increasing the possibility of structural failure. The FederalAir Regulation (FAR) 29.1309 requires any on-board equipment, which can affect aircraftsafety, to be developed and tested using specified procedures. Relevant sections of29.1309 are summarized below and included in Appendix V. As 29.1309 is fairlygeneral, other FAA and industry documents provide more specific guidance. Figure 19graphically depicts the relationship between key FAA and industry documents thatgoverns certification.
One of the key documents in the approval process at the time of this publication is a draftadvisory circular for HUMS (Reference 24). It highlights existing guidance regarding
33

development of on-board systems and provides specific guidance for certification offunctions implemented on a PC-based groundstation. The key challenge on thegroundstation is how to show reliability of software and hardware that is largely buildswith commercial-off-the-shelf (COTS) components, which have no certification pedigree.As structural usage is a fairly critical function Sikorsky has avoided much of the COTSissue by completing critical processes on the certified on-board system.
Based on these regulations a number of documents are being prepared:
- Functional Hazard Assessment (FHA)- which defines the aircraft level effects ofpotential system failure modes.
- System Safety Assessment - which typically includes a fault tree of the criticalfailure modes and how they relate to each other.
- Preliminary Software Aspects of Certification (PSAC) - which describes the
approach to develop and test certified software.
- Software Configuration Index - which describes the exact software that is beingdeveloped and fielded.
- Software Accomplishment Summary - which describes the series of documents
and tests that were performed as evidence of certifiability.
Figure 19 - Relationships between FAA and Industry Documents
34

One key requirement is that the occurrence of potentially dangerous or catastrophicsituations is "improbable" or "extremely improbable". Definitions of these terms areattempted in ARP 4761 Table 3.1-1 (Reference 16) and translate to lx10-7 and lx 10',respectively. Note that these are more stringent than the US Army requirement cited in
Chapter 1. The second key requirement is that compliance shall be shown through acombination of analysis and testing which addresses:
- possible failure modes and their probability- possibility of independent and multiple failures- resulting effects on aircraft and occupants- corrective actions including possible crew warnings.
There are two SAE documents, ARP 4761 and 4754 (references 16 and 17), that providedescriptions of acceptable means of accomplishing the safety assessment and subsequentdesign and testing of a certifiable system. They both refer to RTCA DO 1 78B (reference18) for the process to follow in developing certified software. The specific process isdependent on the level of criticality as established by the FHA.
4.2 System Functional Description
This section is a top-level description of the overall HUMS system and the structuralusage subsystem in particular at a level of detail necessary to understand the fault treespresented in section 4.4. This material is derived from the Sikorsky HUMS SystemSpecification (Reference 20). Because the actual system design data is proprietary to theHUMS supplier and is still under development, the analysis presented in this paper willbe at the system requirements level. The block diagram shown in Figure 20 shows thetop-level architecture for the Sikorsky S-76C+ model (which is currently in production).Key differences to other Sikorsky model implementations involve the source of specificinput signals and how interaction with the pilot is accomplished. Figures 21-25 tracebasic system dataflows for various structural usage processes that will help the readerunderstand the details of the fault tree that follows in section 4.4.
35

S76C+ HUMS BLOCK DIAGRAM++
AIR
CPLT CNTR I PLTIDISPLAY DISPLAY DISPLAY1
UNIT UNIT UNIT
HUM SComponen
SOCKET
CPLT 11|DS PLT ACHANNEL CHANNE- INTER
CNTR
CHNL
ARI NC 429
ts
HIUMS CACOLUSI
ADC (2) , ARINC 429 UNIT (D
AHRS (2)
DISCRETE SIGNALSCH P DETECTORS
P U T E R \OVWADING REFERENCE VENT BLOVWER
DICATING IIDS CAUT1ONADV PANEL
R UNIT)UND SUPPORT
AY UNITHEELS SWITCHECORDER
FACE
SERIALDIGITALINTERFACE
SYNCHROSPI TCH
ROLL
MAG HEAD
SERIAUIDIGTAL
SENSORSfANALOGSACCELEROMETERSTEMPERATURESBLADE TRACK SENSORMAG CONTACTORSPOSITON POTS
Figure 20 - S-76C+ HUMS Block Diagram
36
GROUND
GROUND SUPPORT| STATION/PORTABLE GSS
Key to abbreviations:ADC - AIR DATA COMAHRS - ATTITUDE HESYSTEMIIDS -INTEGRATED INDISPLAY SYSTEMDTU -DATA TRANSFEPGSS -PORTABLE GRSTATIONCDU - COCKPIT DISPLWOW - WEIGHT ON WFDR - FLIGHT DATA R

Regime Regime todefinition Current damage map
table regime
Regime Regimerecognition summarizing
processing
Instru mentdata
Constructraw data )1records
CalculateCRC
Aircraftconfiguration
Calculatedamage foreach part
type/mode
Regime Damagehistogram summary
CalculateCRC
Store ondata card
Figure 21 - Dataflow for Normal Onboard Operation
Data card Raw data file > Unpack file . .Calculate &to hard drive to hard drive check CRCfor archive
)1 Display to _ Pass damage tooperator maintenance
management systemfor posting to
individual
Optional components
hardcopy
Figure 22 - Dataflow for Normal Groundstation Operation
/ Old & new part
number/ serialnumber
Generate Display to Calculate Onboard Update
configuration ) mechanic for ) CRC, store to ) system ) aircraft
management verification upload card checks CRC configuration
file file
37
Sensorinputs
CalculateCRC
Store ondata card
Store ondata card
Maintenancechanges
component
Fieure 23 - Dataflow for Aircraft Mechanical Configuration Changes

List ofavailable
parameters
Flight datatraces from )test flights
Draft regime Consistency Bench test Flight Final regitne
definition ) check for - with - validation test ) definition
table mutual simulated table
exclusion data
Pilotexperience
alculate Store onCRC maintenance
card
Upload to Calculate & Run onboard
onboard check CRC software testsystem
Figure 24 - Development of and Changes to Regime Definitions
FAA Adjust Draft damage Bench test Flight
accepted working y mapping with validation test
damage curves tables simulated
calculations data
Final damagemapping
table
Calculate Store on Upload to Calculate & Run onboard
0 CRC ) maintenance ) onboard 30 check CRC - software test
card system
Figure 25- Development of and Changes to Damage Mapping
38

4.3 Functional Hazard Assessment (FHA)
From page 33 of SAE document ARP 4754, the goal of the FHA is to clearly identify the
circumstances and severity of each failure condition along with the rationale for its
classification. The various failure effects can be one of Catastrophic, Hazardous/Severe-
Major, Major, Minor or No Safety Effect, which map to system development assurance
levels A-E respectively. The worst case failure of the structural usage function maps to
Hazardous/Severe-Major or level B. The rationale is provided in the extract of the
Sikorsky HUMS FHA as summarized below and presented in Appendix VI (Reference
23). The key statements from the FHA are presented along with descriptions of their
safety implications. This is another source of derived safety requirements and they are
highlighted in bold font and explained in parenthetical statements below the affected text.
The basic organization of the FHA is as follows:
Description of the functionWorst case failure effectPossible mitigating actionsProposed software criticality levels (per DOI 78B)
The FHA contains three sections that deal with different aspects of the usage monitoring
function. The first assumes that the data will be recorded over a long period of time and
that Sikorsky will only use the data to statistically change the baseline assumed spectrum
and thus change fleetwide part lives. The second assumes that regime data will be used
for automated life adjustments but only deals with the regime gathering function. The
last section deals with the damage calculations themselves.
Regime Data Gathering for Fleetwide Life Adjustments
This function involves onboard calculation and accumulation of raw flight data and usage spectra
for eventual use by Sikorsky engineering to make fleetwide adjustments of retirement times
(rather than for individual aircraft). The FHA states that "This data will be sealed with anerror checking protocol and downloaded to the groundstation for display and archive. Thedata seal can be manually verified at the time the data is imported into the database orused." [The worst case failure of this function would be an incorrect increase in fleetwideretirement time based on erroneous HUMS data and that] "the error goes undetected by theengineer completing the life calculations".
There are three main safeguards in this process that contribute to the safety of potential fleetwide
adjustments. The most important one is that there is a "man-in-the-loop" and that we are notallowing the computer full autonomous authority to adjust retirement times. This allows use of
good engineering practices and judgement including cross-checking results with other experience
39

and data sources. Missing regime data will be compensated for by assuming conservatively thatregime usage, during a period for which data is missing or questionable, would be based on the
worst case composite regime usage rate currently used to manually determine componentretirement times.
The second safeguard is the use of error checking to seal the data as it is removed from the level
B certified onboard system. This ensures that the data has survived the trip between the onboard
system in the field and the computer where the Sikorsky engineer collates field data in
preparation for a fleetwide life adjustment. As these files will be arriving from many field
locations, the original sealed file being sent to Sikorsky for reprocessing should be designed to
be relatively self-contained regarding embedded identifying information.
The third safeguard is the possible use of redundant dissimilar processing of the data to improvetolerance of software errors that made it through the certification process. The raw sensor data
can be used to recalculate usage on the operator's groundstation or at Sikorsky using differenthardware (PC vs. onboard computer) and different software (e.g., C++ vs. Ada) although the
algorithm will be the same. As long as the algorithm is coded in different languages, it is highlyunlikely that the same software error could happen in both versions.
These safeguards will minimize risk of statistical distortion of the usage database.
Regime Data For Component Retirement Calculations
The same usage spectrum data described above can be used by the component retirementcalculation function to adjust individual component life based on actual usage. In this case, wewill now rely on the computer to autonomously complete the calculations with little humanoversight. The worst case failure effect would be the incorrect specification of a life adjustmentfor a component on a particular aircraft. This could leave a component in service beyond anappropriate retirement time, significantly reducing its structural reliability margin.
There are several system design and procedural safeguards to improve the probability thatpotential system failures are detected and compensated for correctly. A number of failures canresult in missing regime data such as sensor failure, incorrect regime definitions causing loss of
data from certain regimes, or general processor failure causing entire blocks of time with no data.The FHA states that "Flight time will be recorded by HUMS [using clock time from a reliable,battery-backed clock on the airborne unit] and used to determine if some regime data ismissing. Missing regime data would be compensated for by assuming conservatively thatusage during a period for which data are missing would be proportional to the worst casecomposite usage accumulation rate currently used by Sikorsky to evaluate componentretirement times." This is the most conservative way to deal with missing or incomplete data.
Despite extensive efforts during development and test of the system, the fielded aircraft may notbe flown within the regime boundaries anticipated by the engineers. For example, some noveluse of the aircraft may be devised which includes maneuvers not originally defined and tested.
40

The FHA states "To protect against deficiencies in regime definitions or unexpected uses of
the aircraft, data added to the component usage database will be subjected to a periodic
reasonableness check by Sikorsky." The Sikorsky oversight function will require a formal
review of the database looking for data that is inconsistent with similar data from other sources,
internal crosschecks or other indications of trends that are unexpected or illogical. Specific
checks will be devised as a starting point and expanded as experience is gathered and problems
discovered. A formal report from each review will be issued to the FAA and any discrepancies
will be investigated and resolved.
Component Retirement Calculations
For selected components, the airborne system will apply usage spectrum data (as derived in the
previous section) to calculate expected retirement times by applying calculations that translate
the usage spectrum to life used during this flight for each component type. The output is
provided in the form of life decrements (in equivalent flight hours) for each component type and
failure mode. The worst case failure effect is the same as the previous section (significant
reduction in part reliability).
In addition to previously stated safeguards, the FHA states that "A component life adjustment
limit for each component, based on some multiple of the current component retirement
time recommended by Sikorsky, will be put in place to minimize the possible reduction in
structural reliability margin." The time extension limit is intended as a "catch all" for
potentially runaway calculations and is discussed in section 4.6.
To summarize, the FHA calls for several safeguards to be built into the system and operating
procedures to minimize the possibility of undercalculating usage.
4.4 Fault Tree Analysis
Fault trees are a commonly used technique to model the combination of system failures
that can result in a particular hazardous state. In the case of usage monitoring, the worst
case failure from the aircraft FHA described in the previous section was an increased
possibility of a component structural failure (termed "significantly reduce the structural
reliability margin"). This could result from undercounting damage to the point that the
part has been left on the aircraft too long. This state was considered the top event in the
fault tree and many of the various ways of arriving at this state were modeled via about60 elements using an automated tool called Computer Aided Fault Tree Analysis
(CAFTA) (Reference 20). Fault tree analysis can be either qualitative or quantitative.
Qualitative analysis uses the structure of the fault tree logic to examine possible failure
paths (called cutsets) to assist in developing defensive strategy and set priorities.
Quantitative analysis will assign probabilities to each lowest level event (called basic
events) and using the tree logic, calculates the probability of reaching any particular point
in the tree. This is very useful for hardware intensive systems where actual failure rates
41

may be measured and used to establish probabilities but is nearly impossible in softwaredriven systems. DO178B (Reference 18) states in section 2.2.3 that software reliabilityrates based on software levels cannot be used in the system safety assessment process.Because of this limitation, this analysis will be entirely qualitative.
The actual fault tree is included in Appendix IV along with relevant descriptions andanalyses that are automatically generated by the software tool. A brief walkthrough of thefault tree is also included there. This section draws from the model to describe onepossible method to rank the various failure modes in order of importance and describe theimplications of that ranking. It should be noted that the fault tree is logically correct at itslevel of application but is not complete. For example, the regime recognition processuses inputs from a large number of sensor sources with various paths of data flow to thepoint where the inputs are usable by the system. The fault tree model only covers severaltypical examples but not all of the sensors. This allows focusing on the types of failuresand system defenses against them without getting "bogged down" in all the details ofsuch a complex system. These details will be provided to the FAA as part of the systemsafety assessment.
One of the key outputs of fault tree analysis is a list of possible combinations of failuresneeded to reach the top event (the one we are trying to avoid). Each combination iscalled a "cutset" and the most serious ones have very few events that must happensimultaneously. Table IV summarizes the list of cutsets from the model shown in orderof number of events per cutset. It has been grouped by the number of events in eachcutset, which is one way of qualitatively establishing importance.
Table IV - Summary of Fault Tree Cutsets
C utset Event 1 Event 2 Event 3 Event 4 Event 51 G0032 G0043 G019 G0/8 G0794 G012 G078 G0795 G018 G078 G079
6 G033 G078 G0797 G034 G078 G079
8 G036 G078 G079
9 G013 G078 G079
10 G064 G078 G079
11 G031 G032 6078 G0/912 G024 G060 G078 G079
13 G037 G038 G078 G079
14 G024 G043 G078 G079
15 G024 G059 G078 G079
16 G024 G050 G078 G079
17 G067 G068 G078 G079
18 G 02 5 G 02 6 G 078 G 07 91 9 G 02 4 G 044 G 07 8 G 07 920 G 02 4 G081 G 07 8 G 07 921 G002 9 G003 0 G0b 2 G0/78 G 0/7922 G 02 4 G04 5 G 04 6 G07 8 G 07 923 G 02 4 G05 5 G 05 6 G07 8 G 07 924 GO02 4 G05 7 G 05 8 G07 8 G 07 9
42
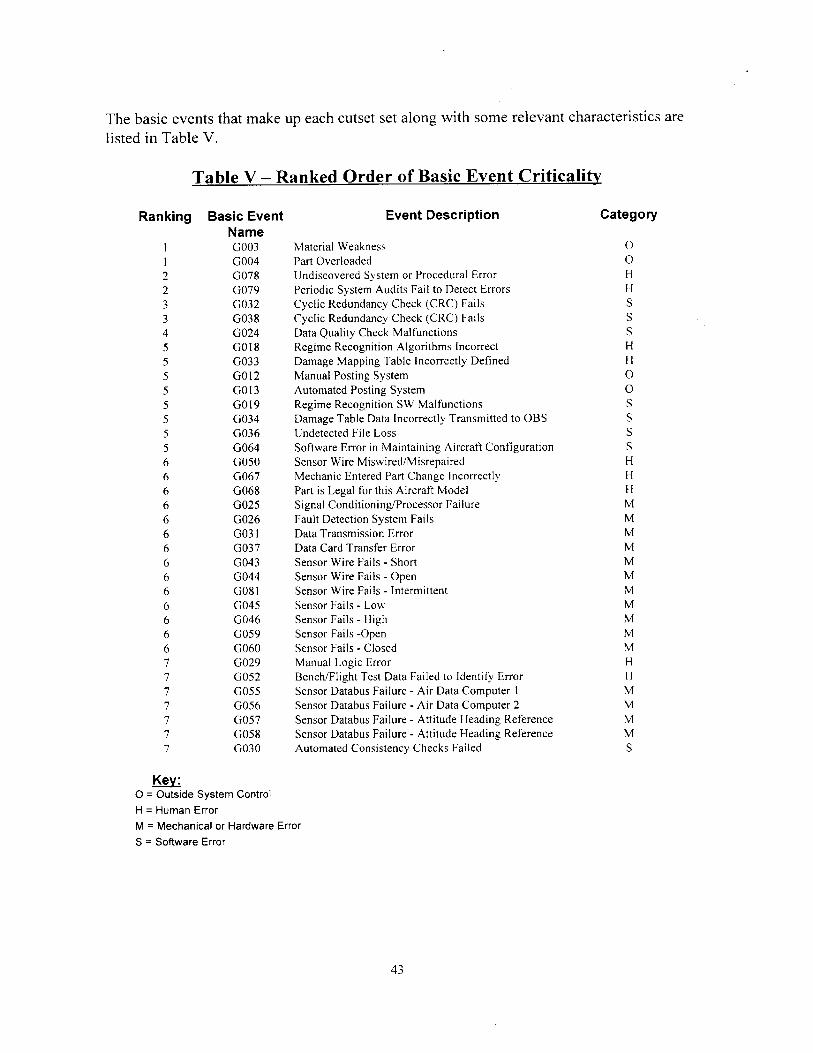
The basic events that make up each cutset set along with some relevant characteristics arelisted in Table V.
Table V - Ranked Order of Basic Event Criticality
Ranking Basic EventName
I G003I G0042 G0782 G0793 G0323 G0384 G0245 G0185 G0335 G0125 G0135 G0195 G0345 G0365 G0646 G0506 G0676 G0686 G0256 G0266 G0316 G0376 G0436 G0446 G0816 G0456 G0466 G0596 G0607 G0297 G0527 G0557 G0567 G0577 G0587 G030
Event Description
Material WeaknessPart OverloadedUndiscovered System or Procedural ErrorPeriodic System Audits Fail to Detect ErrorsCyclic Redundancy Check (CRC) FailsCyclic Redundancy Check (CRC) FailsData Quality Check MalfunctionsRegime Recognition Algorithms IncorrectDamage Mapping Table Incorrectly DefinedManual Posting SystemAutomated Posting SystemRegime Recognition SW MalfunctionsDamage Table Data Incorrectly Transmitted to OBSUndetected File LossSoftware Error in Maintaining Aircraft ConfigurationSensor Wire Miswired/MisrepairedMechanic Entered Part Change IncorrectlyPart is Legal for this Aircraft ModelSignal Conditioning/Processor FailureFault Detection System FailsData Transmission ErrorData Card Transfer ErrorSensor Wire Fails - ShortSensor Wire Fails - OpenSensor Wire Fails - IntermittentSensor Fails - LowSensor Fails - HighSensor Fails -OpenSensor Fails - ClosedManual Logic ErrorBench/Flight Test Data Failed to Identify ErrorSensor Databus Failure - Air Data Computer 1Sensor Databus Failure - Air Data Computer 2Sensor Databus Failure - Attitude Heading ReferenceSensor Databus Failure - Attitude Heading ReferenceAutomated Consistency Checks Failed
Key:o = Outside System Control
H = Human Error
M = Mechanical or Hardware Error
S = Software Error
4-3
Category
00HHSSSHH00SSSSHHHMMMMMMMMMMMHHMMMMS

Table V includes a field called "Ranking" which rates criticality from 1 to 7 where 1 is ofmost concern. The rankings were derived as follows:
Ranking 1 - included the two events that were cutsets of single elements (butwere outside of the scope of control of this system). Their occurrence is prevented byother methods.
Ranking 2 - are two events that are a part of all the other cutsets. They areessentially an oversight function by Sikorsky engineering of the functioning of thestructural usage process designed to catch any system or procedural errors that may haveescaped detection in the development and implementation process.
Ranking 3 - are two events which represent a common mode error due to the factthat they involve a software module that is extensively reused in an number of processesto validate critical data transfers (CRC check).
Ranking 4 - is one event, which is a part of 8 other cutsets, making it similar to acommon mode failure.
Ranking 5 - are single events, which, together with the ranking 2 items form agroup of cutsets of 3 events.
Ranking 6 - are a set of pairs of two events, which, together with the ranking 2items form a group of cutsets of 4 events.
Ranking 7 - are a set of events which, participate to form a group of cutsets of 5elements.
The other field of interest is the "Category" which tries to describe the nature of the faultthat makes up that event. The categories include:
Outside System - which includes events over which the system has no control(outside the architectural boundaries that have currently been drawn).
Human - includes errors in the basic design of the system or procedural errors inoperating it. It does not include software design or implementation errors, which arecovered next.
Software - are essentially design errors in the software that have not been foundby the rigorous software certification process. Due to software complexity, it is virtuallyimpossible to test all possible software paths of execution so we must accept thepossibility that undiscovered software design errors exist.
Mechanical - these are the traditional hardware failures such as broken wires,damaged chips, etc., which can cause a system malfunction.
4.5 System Safety Assessment
Based on the fault tree analysis, several key basic events will be discussed includingsystem protections designed to minimize the probability of occurrence or reduce theconsequences of failure. This section ignores events beyond the control of the structuralusage system. They will be addressed in order of their appearance in the ranking.
44

Ranking 1 items (Material Weakness, Part Overloaded) involve the design, fabricationand use of the physical aircraft parts in terms of the total aircraft flight envelope.Structural usage only applies to use of the aircraft that is within its legal flight envelopeas defined in the flight manual. There is another HUMS function called "exceedancemonitoring" which detects and records excursions outside the legal flight envelope aswell as specific mechanical systems that make up the aircraft.
Ranking 2 items (Undiscovered System or Procedural Error, Periodic System AuditsFail to Detect Errors) require an oversight function designed to find system or proceduralerrors that made it through the certification process undetected or creep in afterdeployment. These might include items such as regime definitions that miss somemaneuvers as they are performed in the field. If missed, insufficient damage may beaccumulated over the long term. These missing regimes might be detected by looking at afleet's usage and noticing that it is significantly different than expected for some otherportion of the fleet. This type of audit is a stated function in the FHA and will requireSikorsky engineering to accumulate fleet usage and damage data and periodically reviewand report appropriate statistical measures and crosschecks. Figure 26 summarizes thisand other means of safeguarding system performance.
Sikorsky Oversight
CERTIFIED NON-CERTIFIEDPilot Verification
AIRBORNE I GROUND
ComponentUsage I Grundstation Log CardsMonitoring T
Sikorsky
Database
Flight Regime ComponentHistory Recognition - LifeData Calculations
2-3X life Extension Limit
Figure 26 - Summary of Usage System Safeguards
There are some other points that are made by Figure 26, which include:- Component usage monitoring will run in parallel with structural usage and will be
used in various crosschecks. This function may be pilot verified as it involves simplemeasures such as flight time and takeoffs/landings which the pilot may be expected toremember or note.
45

- A two to three times limit is expected to be placed on life extensions to prevent the
possibility of a runaway calculation error. The exact number may be determined on a
part by part basis and may eventually be relaxed after sufficient experience is gained
with system operation.- The process of posting incremental damage to specific serial number parts is
considered outside the scope of the certified system and is typically performed bymanual or automated maintenance management systems. The FAA approves suchsystems as part of operational rules governing maintenance policy.
Ranking 3 items (the Cyclic Redundancy Check) are based on well-known and usedalgorithms that are present in most communications systems. It still must be carefully
implemented and tested as it is used extensively for data integrity checks before and after
data transfers.
Ranking 4 item (the Data Quality Check) validates sensor data output. This is actually a
series of checks that include looking at measures such as over or under scale, rates of
change, inactivity, statistical noise, etc. As there are many sensors that contribute toregime recognition, this is an especially critical function that will be relied upon for
system integrity. The system specification requires a high level of reliability here andspecial attention must be paid to thorough development testing.
Ranking 5 items include software and data tables used in the regime recognition, damagetracking and maintenance of aircraft configuration processes. The software will bedeveloped to DO1 78B level B (Reference 18) which requires extensive design andimplementation verification. The data tables will be validated mostly through flight-testing and review of service experience and once stable, should not cause any furthertrouble. They are, however, subject to the risk of missing new maneuvers that aparticular operation or mission may require that was not covered during early flighttesting. These could show up as unrecognized and will be referred to Sikorsky throughthe audit process if they exceed some minor percentage level. All unrecognized regimeswill incur worst case usage until they are resolved. Maintenance of aircraft configurationis almost entirely a procedural issue that will be carefully addressed in systemmaintenance instructions and possibly through the audit log.
Ranking 6 items include hardware errors such as broken wires, sensor failures, data
transfer errors and procedural errors like configuration maintenance. The main defense isthe data quality checks described above and good procedures that ensure sensor hardwareis well maintained. There has already been a serious accident in Europe where a sensorwas left un-repaired and hence missed a serious mechanical fault (part of the vibrationmonitoring function). As a result, the CAA (United Kingdom equivalent of FAA) ismandating strict oversight of HUMS maintenance policy and may ground an aircraft thathas one or more inoperative sensors.
Ranking 7 items include databus errors, a regime definition design error, developmenttesting error and failure of software consistency tests. The databus errors should be
46

detected by databus monitoring functions. The periodic Sikorsky auditing functionmentioned above must pick up the design and test errors. The software consistencychecks are part of configuration table design aids. These will require careful tool designand testing.
4.6 Monte Carlo Simulation to Establish Structural Reliability
One of the main measures of risk as applied to structural usage is what effect it mighthave on overall structural reliability. Sikorsky has studied this in some detail on anumber of Army UH-60A parts (References 2-4). This section will overview themethodology and highlight significant findings. Essentially, a model was built of thefactors that determine structural reliability and these factors were strategically varied innumerous simulations of life of individual parts. The distribution of life outcomes (howlong did they last in simulation) defines the probability of failure over that selectedassumed part lifetime. Changing the mix of variations allows exploration of the relativecontribution of each factor to overall reliability.
The first of the three papers established the basic process for several UH-60A parts andconcluded that the existing safe-life process comes very close to the Army's expectationof six-nines reliability (0.999999). The second paper enhanced the model's realism inseveral key areas and reapplied the enhanced model to the previous batch of parts as wellas some new ones (a total of 13 cases). The third paper extended the methodology to fail-safe components where some flaw tolerance is assumed and showed opportunity forpotential cost savings from the benefits of redundant structure.
Some key findings from these simulations are summarized below:
1. The reliability is a very steep function of the hours in service as shown in Figure 27(which is adapted from data in Table 3 of Reference 3). This shows the hours inservice for a group of parts versus various reliability levels. For example, the MRShaft Extender could be left in service for nearly 1 million hours if you are willing toaccept a 1% chance of failure. To get to a 1 in one million chance of failure, youneed to reduce the in-service time to 26000 hours, (which is still fairly long inhelicopter flight time).
2. The relative contribution of part strength variations, applied load variations and partusage variations is 3 nines, 2 nines and 1 nine, respectively. This was derived byremoving the simulated variation of each component's strength, load and usage one ata time and observing the effect on overall reliability. One inference that could bedrawn is that the probable effect of errors in usage measurement (within the defineddistribution) could affect reliability by about a factor of 10 at most. It has beenproposed to recapture this reliability by temporarily increasing conservatism instructural usage calculations through reducing working load curves from 3 sigma to3.7 sigma. This reduction could later be alleviated when real usage data allowmeasurement of real usage variation.
47

3. Use of fail-safe design, which includes certain structural redundancies, could result insignificant cost savings over safe-life design that ignores such redundancy. Forexample, Reference 4 reported calculated reliability for the spindle/tierodcombination pictured in Figure 28. It was found that for the same reliability, the CRTcould be extended from 2500 hours to 20,000 hours. (Note that the spindle of the S-76C+ provides the largest share of cost savings in this study)
In general, Monte Carlo simulation provides a valuable tool for understanding theimplications of methods like structural usage and ways to deploy them without addingrisk. There are some recommended uses of this tool to the cost analysis presented hereinin the last section.
UH-60A Main Rotor Reliability
300,000 9 OK
0 250,000
200,000 IIMR Shaft Extender
150,000 E3MR Hub
0 DMR Shaft w/o chafing
100,000 N MR Shaft w/ chafing
1 50,000-
0
0.990000 0.999000 0.999900 0.999990 0.999999
Reliability
Figure 27 - Variation of Safe-life with Reliability
48

Figure 28 - UH-60A Spindle/Tierod Assembly
49

Chapter 5 - Conclusions
This thesis shows that implementing structural usage monitoring can be cost effective forSikorsky's customers and if properly designed and implemented in accordance with FAAguidelines and requirements, should pose no additional safety risk to their passengers.The cost benefit issues are summarized in section 5.1 and risk issues are discussed insection 5.2.
5.1 Cost Benefit Results
As presented in Chapter 3, the savings potential to an S-76C+ operator is significant. Ona flight hour basis, the results of the model range between $17.73 and $24.99 with anaverage value of $21.63. In investment terms, the discounted lifetime benefit rangedfrom $53K to $430K in current year dollars. While these potential savings aresignificant, there are several factors that could limit the net savings that the helicopteroperator actually experiences. These could include the proposed 2-3X part life extensionlimit, the reduction in working curve to regain potentially lost reliability and costs ofmaintaining the system after fielding.
This lifetime savings could be curtailed by a 2-3X limit on part life extension. Asexplained in sections 4.3 and 4.6, a cap on life changes may be imposed to account forpossible undiscovered system problems. In the cost benefit analyses, several scenariosresulted in extensions slightly above that range (but none greater than 4X). Such a limitwould thus affect the maximum numbers quoted above.
Application of a change from 3 sigma to 3.7 sigma working curve could have asignificant effect on savings. The proper application of such a concept and its duration iscurrently being examined in the US Navy COSSI HUMS program (Reference 25). Itmay be mitigated after the database is complete enough to document real usagevariability. Estimating the effect of a working curve reduction at this time is difficult inthat flight loads data for each part must be examined and damage mappings reworked(this is suggested in Chapter 6).
Note that the analysis does not include any estimates of system acquisition cost. PreviousHUMS systems have ranged between $200K to $300K for a complete installed systemwhich covers a number of functions beyond structural usage. It is difficult to separate thecost of the structural usage function from the total cost of a HUMS system. Installationcosts will also vary considerably between aircraft that have most parameters availableover data busses and those where sensors must be directly interfaced. Operational andmaintenance costs for the structural usage function are not included. They would includesuch items as a service contract to the HUMS supplier (typically 10% of
50

hardware/software cost), a fee to Sikorsky for ongoing support with required FAAoversight and life extension applications, and operator costs to collect and archive thedata.
One could conclude that whether or not this function paid for itself would depend on eachoperator's situation and would need to be examined on a case by case basis at the time thesystem is proposed to the operator as part of an aircraft purchase. Chapter 6 outlinesseveral model extensions that would support such a use.
5.2 Risk Assessment Results
There are two types of risks that have been addressed. The first is at an overall fleet leveland the second is for an individual aircraft.
Reliability is a good measure to use for fleet wide risk. Largely based upon the MonteCarlo simulation work reported in References 2 through 4, the worst-case loss of partreliability due to incorrect measurement of usage is one-9 or a 10 times reduction inreliability due to usage variability (from Table 2 of Reference 3). This assumes that a 2-3X limit in part life extension is in place to preclude a runaway process that could resultin a much higher reduction in reliability. More recent simulations by Sikorsky on severalNavy parts (unpublished) indicated that a reduction in working curve from the 3 to 3.7sigma improves reliability by about one-9. Thus the combined effect of usage monitoringbased life extensions limited to 2-3X and reducing the working curve used in damagecalculations should result in no net change in simulated fleet reliability.
To address the risk to an individual aircraft, procedures and safeguards need to be addedto reduce the chance of individual system errors that could result in consistent under-counting of damage. To examine this risk in some detail, a fault tree was constructed andqualitatively analyzed to look for areas of concern regarding the system design andimplementation. Section 4.6 reviewed these risks and presented several methods tominimize their potential impact. Two of the most significant concerns and their possiblemitigation are:
1. The possibility of latent errors in the regime recognition process software or amismatch between the regime definitions and how aircraft are flown in the field.An example of this would be an individual regime that is more heavily used in somelocale and is not being correctly recognized. There is also the possibility of operatorprocedural errors or sloppiness.
To mitigate these risks Sikorsky plans to sample and collect a database of field usage andpart damage that will be statistically examined at regularly prescribed intervals withresults reported to the FAA. This enforces discipline at the operator's site to insure data isnot lost (they won't get life reductions without the data). It also forces Sikorsky tomonitor system performance including a fleet wide view. There are also possible side
51
benefits to monitoring usage. Knowing that they are being watched by the system, pilots
may tend to change their behavior toward more benign usage. Knowledge of therelationship between flight techniques and cost enables operators to direct flyingtechnique changes to minimize damage and hence save money.
2. Many sensors feed into the recognition process and failures of one or more couldskew the recognition process into false conclusions. To safeguard against this theremust be system design emphasis on built-in test processing and data quality checks.
In summary, the safeguards and damage calculation changes should minimize anyadditional risk and allow for a safe and controlled replacement of conservative assumedspectra with measured spectra.
52

Chapter 6 - Recommendations for Future Work
6.1 Cost Benefit Model Extensions
Several changes could be made to the cost benefit model as well as additionalapplications of it to other parts or aircraft models.
1. Since the working curve reduction and the limits on life extension can have asignificant effect upon part cost savings, some effort should be made to tailor thesefactors specifically to the S-76 parts used for this study. This could be accomplished byextending the Monte Carlo simulation (Reference 4) to these S-76 parts and tailoring thespreadsheet model based on those results.
2. The Excel model prepared for this study uses a number of formulas that must be handadjusted as changes occur. This is especially true in the area where life-cycle costs arecalculated. One possible enhancement would be to develop spreadsheet programs(macros) that automate the development of lifetime cost benefits scenarios. It could havea user interface that accepts changes to assumptions and produces summary graphs andtables. This would allow efficient extensions to additional parts and customizing savingprojections for specific customer proposals. Typical inputs should include:
- changes to assumed current usage spectrum,
- selection of accrual method for savings,
- entry of the annual usage of aircraft (hours per year),
- entry of discount rate,
- entry of replacement part cost and price escalation rate.
3. The calculations completed in this study were for the S-76 C+ model and assumedinstallation on a new aircraft. Application coverage could be extended to parts from oldermodels to support retrofit business. Some parts used on older models have lower CRT'swhich may accrue savings quicker and show significant payback.
4. There are a number of HUMS cost benefit models that have recently been developed.This model could be interfaced to the more complete models to handle life cycle andlogistical savings. Examples of these other models include the Rotorcraft IntegratedTechnology Association RITA Cost Benefit Analysis Model (Reference 21), and theDraper Labs COSSI study (Reference 22).
53

5. This model was focused on commercial helicopter parts. The model could be appliedto selected U.S. Navy and Army parts that show high potential savings. Candidatesinclude parts being analyzed by worst-case composite spectrum from other more heavilyutilized aircraft. This happens because the military supply system is not currently able toseparately track the same parts that are used on different aircraft models.
6.2 Risk Analysis Extensions
1. The current analysis was limited to the system requirements level. This was due to therequirement to publish the thesis in the public domain and hence lower levels of detailwere inaccessible because they are proprietary to the HUMS supplier. Adding detailsfrom the real HUMS architecture could enhance the fault tree model. Detailed designeffort could then be better focused if detailed architectural models were used. The modelcould also be extended to include all sensors and system interfaces instead of the typicalexamples used in this study.
2. The fault tree analysis used in this study was qualitative. This was partly due to theinability to assign probabilities to software risk as well as the limitation to stay awayfrom architectural details. The fault tree model could be loaded with real eventprobabilities based on specific reliability history (where they are available) or modeledMTBF calculations based on Military handbooks. The resulting top-level reliability orprobability of failure could be compared to that expected by the FAA for a level B systemand reliability budgets could be developed for components that had not yet been finalized(especially sensors). This would allow development of a program risk mitigation planthat focuses implementation and testing on areas were they could be most cost-effective.
54

References
1. Stevens, Patricia W.; Hall, David L.; Smith, Edward C., " A MULTIDISCIPLINARYRESEARCH APPROACH TO ROTORCRAFT HEALTH AND USAGEMONITORING" American Helicopter Society 52nd Annual Forum, Washington, D.C.,June 4-6, 1996.
2. Thompson, A. E.; Adams, D.O. "A COMPUTATIONAL METHOD FOR THEDETERMINATION OF STRUCTURAL RELIABILITY OF HELICOPTER DYNAMICCOMPONENTS". American Helicopter Society Annual Forum, Washington, DC. May1990.
3. Adams, David 0.; Thompson, Audbur E.; Herter, John R. "Use of a Reliability Modelin the Fatigue Substantiation of Helicopter Dynamic Components". American HelicopterSociety National Specialist's Meeting on Test Technology, Scottsdale, Arizona. October1990,
4. Thompson, A. E.; Adams, D.O. "A STRUCTRAL RELIABILITY EVALUATION OFFAIL-SAFE HELICOPTER DYNAMIC COMPONENTS". AHS National RotorcraftStructures Technical Specialist's Meeting, Williamsburg, Virginia. October 1991.
5. Augustin, M. J. and Philips, J., "The V-22 Vibration, Structural Life and EngineDiagnostic System, VSLED," SAE Aerotech Symposium, Long Beach, CA, Oct.1987.
6. Civil Aviation Authority. "Bristows Helicopters Super Puma Operational UsageProgram - Preliminary Analysis - 1000 Hours". CAA-SRG Research Note 64 Issue 1.December 1987.
7. Molnar, G.; Prince, L. "SH-60B Structural Usage Monitor Final Report".Sikorsky DOCUMENT NUMBER SER-520859. May 1990.
8. Gunsallus, C. T. et al., "Holometrics: An InformationTransformation Methodology," American Helicopter Society 44th Annual Forum,Washington, DC, June 1988.
9. Gunsallus, C. T., "Rotating System Load Monitoring Using Minimum Fixed SystemInstrumentation," American Helicopter Society National Specialists Meeting on FatigueMethodology, Scottsdale, AZ. October 3-5, 1989
10. Sikorsky Engineering Report SER-701760. "Black Hawk Structural Usage Monitor".9/15/91.
55

11. Moon, Dr. Suresh,; Menon, Dinesh,; Barndt, Gene, "FATIGUE LIFERELIABILITY BASED ON MEASURED USAGE, FLIGHT LOADS AND FATIGUESTRENGTH VARIATIONS". American Helicopter Society 52nd Annual Forum,Washington, D.C., June 4-6, 1996.
12. Romero, Raylund; Summers, Harold; Cronkhite, James. "Feasibility Study ofRotorcraft Health and Usage Monitoring System (HUMS): Results of Operator'sEvaluation". NASA Contractor Report 198446 DOT/FAA/A R-95150. Feb. 1996.
13. Sikorsky Internal Memorandum AVO 96-F 1-515. "On-Site Review of BristowHelicopters S-76 Usage". 12/16/96.
14. Larchuk, Terry J. et.al. "Regime Recognition For MH-47E Structural UsageMonitoring", American Helicopter Society 53rd Annual Forum, Virginia Beach, Va.April 29 to May 1, 1997.
15. Presentation by Georgia Tech Research Institute (GTRI) "HH-60G Mission UsageSpectrum Survey Emerging Results". 1/12/98.
16. ARP 4761, "Guidelines and Methods for Conducting the Safety Assessment Processon Civil Airborne Systems". Society of Automotive Engineers (SAE). 3/29/96 Draft 16.
17. ARP 4754, "Certification Considerations for Highly-Integrated or Complex AircraftSystems". Society of Automotive Engineers (SAE). 9/1/95.
18. DO-178B, "Software Considerations in Airborne Systems and EquipmentCertification", Radio Technical Commission for Aeronautics (RTCA). 12/1/92.
19. Sikorsky Engineering Specification SES-920222. "SYSTEM SPECIFICATION FORTHE COMMERCIAL HEALTH AND USAGE MONITORING SYSTEM". 10/24/97.
20. Science Applications International Corporation (SAIC) "CAFTA for Windows -Fault Tree Analysis System - User's Manual". October 1995.
21. Rotorcraft Industry Technology Association (RITA). "Cost Benefit Analysis Model(CBAM) User's Guide". 1998.
22. The Charles Stark Draper Laboratory, Inc. "Cost Benefit Analysis for IntegratedMechanical Diagnostics". April 1997.
23. Sikorsky Engineering Report SER-920343. "FUNCTIONAL HAZARD ANALYSISFOR HEALTH AND USAGE MONITORING SYSTEM (HUMS)". 7/2/98.
24. FAA Draft Advisory Circular "Airworthiness Approval of Health and UsageMonitoring Systems (HUMS). 2/13/98.
56

25. US Navy Commercial Operational Support Savings Initiative (COSSI) HUMSProgram. Website: Helicopter Integrated Mechanical Diagnosticshttp: pmia261.navair.navyv.mil.
57

Appendix I - Cost Benefit Spreadsheet Model
Al.1 Summary of calculations
This section explains in words how each of the fields in the cost spreadsheet are
calculated.
Usage Retirement Time -- mathematical inverse of total damage multiplied by 100 (where
damage is expressed as a fraction of the part life used per 100 hours).
Baseline Retirement Time -- user entered existing retirement time from maintenancemanuals.
Improvement Percent -- maximum number of ships-sets saved by extension as ratio of
new to old retirement time.
Useful Life of Aircraft -- user entered maximum economical aircraft life (assumed to be
35 years based upon Sikorsky S-61).
Annual Usage -- user entered average flight hours per year.
Part Cost -- user entered cost of each part.
Units per Ship-set -- user entered multiple of parts per aircraft.
Interest Rate -- user entered assumed discount rate for savings period.
Maximum Savings -- savings in hours if entire part life can be used. Difference between
new and old retirement time.
Limited Savings -- savings limited to aircraft life (if part extension exceeds useful life of
aircraft).
Ship-set Cost -- part cost multiplied by units per ship-set.
Total Savings -- value of ship-sets saved (as limited by aircraft life). Ship-set cost
multiplied by ratio of limited savings to baseline.
Costs per Flight Hour -- "Baseline" is ships set cost divided by a baseline retirement time.
"New" is ships-set cost divided by the sum of baseline and saved hours. "Savings" is
difference between baseline and new.
58

Projected Original Replacement Year -- year at which accrued flight hours exceedbaseline retirement time.
Projected Usage Retirement Year -- year at which flight hours exceed limited usageretirement time.
Projected Annual Savings -- spreading total savings over a number of extended years.Note: if loss, the formula needs modification.
Discounted Total Savings -- net present value of projected cash flows (annual savingsspread over extended years) discounted using user entered interest rate. Note that anadjusting entry is placed in last year to complete the cash flows to match total savings.
Checksum Raw Savings -- non-discounted total of cash flows entered. Note that the cashflows below need to be adjusted manually if user entered values change. They shouldcorrespond to spread years (original and usage replacements), annual savings shouldadjust automatically.
A1.2 Excell Workbooks
The following Excel workbooks were prepared. Printed versions of all relevanttabs of the workbooks are attached including the Summary tabs which back upthe graphs in Figures 10 through 14. Each printout is titled with the worksheetand tab that it comes from. The worksheets are titled as follows:
Regimes.xis - is the starting case with utilization at 400 hours per year.
Regimel k.xIs - is the same with utilization increased to 1000 hours per year.
Regime3k.xls - allows all 35 years of life to be used.
Regime5k.xls - changes the discount rate to 5%.
Within the "regimes.xls" workbook, the tabs are as follows:
The "Baseline" tab - includes Sikorsky's mapping between flight regimes and partdamage. The flight regimes are divided into two groups, "Steady State" and "Transient".The steady state regimes accumulate damage by percent time. The transient regimesaccumulate damage by the frequency per 100 hours. For a given part the assumeddamage is totaled in the "Check Totals" row. The inverse is then taken to come up withthe retirement time. The adjusted retirement time is derived by engineering judgment.
59

The "Renna " tab - represents the first usage scenario, which was derived from a tripmemo written by an engineer named Renna covering a visit to one of our customers todiscuss aircraft usage. (Reference 13).
The "Puma" tab -- represents the Puma scenario in a similar manner. The Puma scenariowas derived from a report regarding usage of the Eurocopter Puma aircraft deployed inthe North Sea. (Reference 6).
The "PHI" tab -- scenario was derived from a government funded study using a Bellhelicopter owned by a Petroleum Helicopters Inc. (PHI) (Reference 12).
The following table summarizes the cost cases represented by the other spreadsheets.Note the "xxxx" covers all three scenarios for each case. The summary tabs add up allthe supporting spreadsheets and calculate the average case.
Savings Rladon AveageAccrl ag toAircraft Itest Tol RerenceMethod RlMW Life Rae Savings Figue Spreadalet DetalI Tabs Sumary TabReaoed 400 Sngle 8% $53K 10 regnes.xis >ooo(s) SunmyLifetine 400 Sngle 8% $100K 11 regnmes.ds ooo(2s) amry (2)Lifeinre 1000 Sngle 8% $187K 12 regine1kxs Xoo(2s) Sumstry (2)Ufetine 1000 lMAiple 8% $247K 13 regine3kxs ooo(2s) Summy (2)Lifetire 1000 vAtiple 5% $347K 14 regimeWkxs xoo(2s) &mary (2)
60

File: Regimes.xis Tab: baseline
Regime
Ref Steady State1 Hover IGE2 Left Side Flight3 Left Side Flight4 Right Side Flight5 Right Side Flight6 Rearward Flight7 Rearward Flight8 Forward Flight9 Forward Flight
10 Forward Flight11 Forward Flight12 Forward Flight13 Forward Flight w/ Sideslip14 Forward Flight w/ Sideslip15 Forward Flight w/ Sideslip16 Forward Flight w/ Sideslip17 Forward Flight w/ Sideslip18 Forward Flight w/ Sideslip19 Moderate Turns20 Moderate Turns21 Moderate Turns22 Moderate Turns23 Severe Turns24 Severe Turns25 Severe Turns26 Severe Turns27 Climb28 Climb29 Climb30 Power on Descent31 Power on Descent32 Power on Descent33 Power on Descent34 Power on Descent35 Power on Descent36 Power on Descent37 Power on Descent38 Autorotative Descent39 Autorotative Descent40 Autorotative Descent41 Autorotative Descent
Transient42 Takeoff and Climb43 Rudder Reversals44 Rudder Reversals45 Rudder Reversals46 Lateral Reversals47 Lateral Reversals48 Lateral Reversals49 Longitudinal Reversals50 Longitudinal Reversals51 Longitudinal Reversals52 Symmetrical Pullouts53 Symmetrical Pullouts54 Symmetrical Pushovers55 Symmetrical Pushovers56 Hover Turns57 Hover Turns58 Hover Turns59 Hover Turns60 Entry to/Recover from61 Entry to/Recover from62 Entry to/Recover from63 Entry tg/Recover from64 Entry to/Recover from65 Entry to/Recover from66 Entry to/Recover from67 Entry to/Recover from68 Entry to/Recover from69 Approach to Hover70 Approach and Run-On Landing71 Approach and Run-On Landing72 Rotor Engagement73 Rotor Shutdown74 Taxi and Taxi Turns75 Ground-Air-Ground Cycle76 Ground-Air-Ground Cycle77 Total GAG
7879808182838485868788899091929394
Up to 1OKt Wind10-25 Kts25-35 Kts10-25 Kts25-35 Kts10-25 Kts25-35 Kts.5 VNE.8 VNE.9 VNE1.0 VNE96% Nr @OE1 VNE5deg L @ .8 VNE5deg R @ .8 VNE5deg L @ 1.0 VNE5deg R @ 1.0 VNE1Odeg L @ .8 VNE10deg R @ .8 VNELeft 30deg AOB @ .8 VNERight 30deg AOB @ .8 VNELeft 30deg AOB OEI @ .8 VNERight 30deg AOB OEl @ .8 VNELeft 30deg AOB @ 1.0 VNERight 30deg AOB @ 1.0 VNELeft 45deg AOB @ .8 VNERight 45deg AOB @ .8 VNESteady (BROC)Left 30degRight 30deg.5 VNE.8 VNE.9 VNE1.0 VNE1.1 VNE96% Nr @OE1 VNELeft 30degRight 30deg.5 Auto VNE.8 Auto VNELeft 30degRight 30deg
Hover.8 VNE1.0 VNEHover.8 VNE1.0 VNEHover.8 VNE1.0 VNE@ VNEUp to 0.8 VNE@ VNEUp to 0.8 VNEModerate LeftModerate RightSevere LeftSevere RightAutorotationRight Side FlightLeft Side FlightRearward FlightPartial Power DescentModerate Left TurnModerate Right TurnSevere Left TurnSevere Right Turn
@ 40 kts@ 20 kts
Per FlightPer Shutdown
Extreme ManueversForward Flight > 10 deg SS @ .8 VNEForward Flight > 5 deg SS @ .8 VNESevere Turns 45 deg AOB @ VNE LeftSevere Turns 45 deg AOB @ VNE RightAuto Descent @ Auto VNEAuto Descent @ Auto VNE @ SideslipAuto Turns 45 deg AOB @ Auto VNEPower Descent Turns 45 deg AOB @ Auto VNEClimbing Turns 45 deg AOBClimb with SideslipCollective Reversals up to VNEControl Reversals in Auto up to Auto VNEControl Reversals in PPD up to VNEControl Reversals at 96% Nr up to OEI VNE155 Kt Engine Cut - 85% NrCategory A Engine Cut on Take-OffCategory B Land Back
76102-08500-045 76351-09630-041 76358-05124-042 76102-05001-047 &76358-05118-047
Main Rotor Spindle Main Rotor Shaft Tail Rotor Shaft Tail Rotor Retention Plate & Flange% Time per100hrs Ref1 Ref 2 Ref 5 Ref 3 & 4
3.60.2
0.050.2
0.050.2
0.057.42030151
0.450.450.20.2
0.150.151.451.450.050.050.450.450.160.163.60.20.2
10.60.50.1
0.020.10.20.2
0.150.320.050.05
%Time2.5
0.130.1
0.010.1
0.060.01
0.10.060.010.030.280.030.280.670.670.030.030.030.080.080.070.160.220.220.060.061.53
per 100 hrs450160120
101207510
12075107
1007
100240240
202030
10010080
400400400100100380
0.09 150.44 105
200200
1.00 800250200450
0.0080.0060.020.02
0.0130.00008
0.00330.0013
0.0160.057
1121322
0.0015
0.0182
0.01240.00051
0.00002
0.0002
0.00004
0.00010.0004
0.0003
0.00070.00040.0003
0.0204 0.0002
0.01240.0005
0.00002
0.0002
0.00010.0004
0.0003
0.00070.00040.0003
0.0001
0.0001
Check totals 100.1447 0.0198
Retirement TimeAdjusted Retirement Time
50515000
0.0204 0.01557
49024900
64237000
Page 61
0.01542
64857000

File: Regimes.xls Tab: Renna
76102-08500-045Regime
Steady StateHover IGELeft Side FlightLeft Side FlightRight Side FlightRight Side FlightRearward FlightRearward FlightForward FlightForward FlightForward FlightForward FlightForward FlightForward Flight w/ SideslipForward Flight w/ SideslipForward Flight w/ SideslipForward Flight w/ SideslipForward Flight w/ SideslipForward Flight w/ SideslipModerate TurnsModerate TurnsModerate TurnsModerate TurnsSevere TurnsSevere TurnsSevere TurnsSevere TurnsClimbClimbClimbPower on DescentPower on DescentPower on DescentPower on DescentPower on DescentPower on DescentPower on DescentPower on DescentAutorotative DescentAutorotative DescentAutorotative DescentAutorotative Descent
TransientTakeoff and ClimbRudder ReversalsRudder ReversalsRudder ReversalsLateral ReversalsLateral ReversalsLateral ReversalsLongitudinal ReversalsLongitudinal ReversalsLongitudinal ReversalsSymmetrical PulloutsSymmetrical PulloutsSymmetrical PushoversSymmetrical PushoversHover TurnsHover TurnsHover TurnsHover TurnsEntry to/Recover fromEntry to/Recover fromEntry to/Recover fromEntry to/Recover fromEntry to/Recover fromEntry to/Recover fromEntry to/Recover fromEntry to/Recover.fromEntry to/Recover fromApproach to HoverApproach and Run-On LandingApproach and Run-On LandingRotor EngagementRotor ShutdownTaxi and Taxi TurnsGround-Air-Ground CycleGround-Air-Ground CycleTotal GAG
Up to 1OKt Wind10-25 Kts25-35 Kts10-25 Kts25-35 Kts10-25 Kts25-35 Kts.5 VNE.8 VNE.9 VNE1.0 VNE96% Nr @OE1 VNE5deg L @ .8 VNE5deg R @ .8 VNE5deg L @ 1.0 VNE5deg R @ 1.0 VNE1Odeg L @ .8 VNE1Odeg R @ .8 VNELeft 30deg AOB @ .8 VNERight 30deg AOB @ .8 VNELeft 30deg AOB OEI @ .8 VNERight 30deg AOB OEl @ .8 VNELeft 30deg AOB @ 1.0 VNERight 30deg AOB @ 1.0 VNELeft 45deg AOB @ .8 VNERight 45deg AOB @ .8 VNESteady (BROC)Left 30degRight 30deg.5 VNE.8 VNE.9 VNE1.0 VNE1.1 VNE96% Nr @OE1 VNELeft 30degRight 30deg.5 Auto VNE.8 Auto VNELeft 30degRight 30deg
Hover.8 VNE1.0 VNEHover.8 VNE1.0 VNEHover.8 VNE1.0 VNE@ VNEUp to 0.8 VNE@ VNEUp to 0.8 VNEModerate LeftModerate RightSevere LeftSevere RightAutorotationRight Side FlightLeft Side FlightRearward FlightPartial Power DescentModerate Left TurnModerate Right TurnSevere Left TurnSevere Right Turn
@ 40 kts@ 20 kts
Main Rotor Spindle% Time per 100 hrs Ref 1
3.60.2
0.050.2
0.050.2
0.057.4203015
1000000
1.451.450.050.050.450.45
0.0080.008
3.60.20.2
10.60.50.1
0.020.10.20.2
0.150.320.050.05
% Time2.5
0.130.1
0.010.1
0.060.010.1
0.060.010.030.280.030.280.670.670.030.03
0.0030.080.080.070.160.220.220.060.061.530.090.44
1
0.0080.006
0.020.02
0.0130.00008
0.00330.0013
0.0160.057
Per FlightPer Shutdown
Extreme ManueversForward Flight > 10 deg SS @ .8 VNEForward Flight > 5 deg SS @ .8 VNESevere Turns 45 deg AOB @ VNE LeftSevere Turns 45 deg AOB @ VNE RightAuto Descent @ Auto VNEAuto Descent @ Auto VNE @ SideslipAuto Turns 45 deg AOB @ Auto VNEPower Descent Turns 45 deg AOB @ Auto VNEClimbing Turns 45 deg AOBClimb with SideslipCollective Reversals up to VNEControl Reversals in Auto up to Auto VNEControl Reversals in PPD up to VNEControl Reversals at 96% Nr up to OEl VNE155 Kt Engine Cut - 85% NrCategory A Engine Cut on Take-OffCategory B Land Back
per 100 hrs450
6952
452324
523247
1007
100240240
20203
10010080
400505055
38015
1052002008008971
160
76351-09630-041 76358-05124-042 76102-05001-047 &76358-05118-047
Main Rotor Shaft Tail Rotor Shaft Tail Rotor Retention PlateRef 2 Ref 5 Ref 3 & 4
0.01240.00051
0.00002
0.00008
0.000016
0.000040.00040.0015
0.0003
0.00008750.00002
0.000015
0.00647 0.00725 7.11111E-05
0.01240.0005
0.00002
0.00008
0.000040.0004
0.0003
0.00008750.00002
0.000015
3.55556E-05
0.00010
2
322
Check totals 98.21368
Usage Retirement TimeBaseline Retirement Time
0.008071111 0.007253333 0.013959611
123905000
137874900
71647000
Page 62
0.013898056
71957000

File: Regimes.xls Tab: Puma
76102-08500-045 76351-09630-041 76358-05124-042
Regime
Ref Steady State1 Hover IGE2 Left Side Flight3 Left Side Flight4 Right Side Flight5 Right Side Flight6 Rearward Flight7 Rearward Flight8 Forward Flight9 Forward Flight
10 Forward Flight11 Forward Flight12 Forward Flight13 Forward Flight w/ Sideslip14 Forward Flight w/ Sideslip15 Forward Flight w/ Sideslip16 Forward Flight w/ Sideslip17 Forward Flight w/ Sideslip18 Forward Flight w/ Sideslip19 Moderate Turns20 Moderate Turns21 Moderate Turns22 Moderate Turns23 Severe Turns24 Severe Turns25 Severe Turns26 Severe Turns27 Climb28 Climb29 Climb30 Power on Descent31 Power on Descent32 Power on Descent33 Power on Descent34 Power on Descent35 Power on Descent36 Power on Descent37 Power on Descent38 Autorotative Descent39 Autorotative Descent40 Autorotative Descent41 Autorotative Descent
Transient42 Takeoff and Climb43 Rudder Reversals44 Rudder Reversals45 Rudder Reversals46 Lateral Reversals47 Lateral Reversals48 Lateral Reversals49 Longitudinal Reversals50 Longitudinal Reversals51 Longitudinal Reversals52 Symmetrical Pullouts53 Symmetrical Pullouts54 Symmetrical Pushovers55 Symmetrical Pushovers56 Hover Turns57 Hover Turns58 Hover Turns59 Hover Turns60 Entry to/Recover from61 Entry to/Recover from62 Entry to/Recover from63 Entry to/Recover from64 Entry to/Recover from65 Entry to/Recover from66 Entry to/Recover from67 Entry to/Recover from68 Entry to/Recover from69 Approach to Hover70 Approach and Run-On Landing71 Approach and Run-On Landing72 Rotor Engagement73 Rotor Shutdown74 Taxi and Taxi Turns75 Ground-Air-Ground Cycle76 Ground-Air-Ground Cycle77 Total GAG
Up to 1OKt Wind10-25 Kts25-35 Kts10-25 Kts25-35 Kts10-25 Kts25-35 Kts.5 VNE.8 VNE.9 VNE1.0 VNE96% Nr @OE1 VNE5deg L @ .8 VNE5deg R @ .8 VNE5deg L @ 1.0 VNE5deg R @ 1.0 VNE1Odeg L @ .8 VNE10deg R @ .8 VNELeft 30deg AOB @ .8 VNERight 30deg AOB @ .8 VNELeft 30deg AOB OEI @ .8 VNERight 30deg AOB OEl @ .8 VNELeft 30deg AOB @ 1.0 VNERight 30deg AOB @ 1.0 VNELeft 45deg AOB @ .8 VNERight 45deg AOB @ .8 VNESteady (BROC)Left 30degRight 30deg.5 VNE.8 VNE.9 VNE1.0 VNE1.1 VNE96% Nr @OE1 VNELeft 30degRight 30deg.5 Auto VNE.8 Auto VNELeft 30degRight 30deg
Hover.8 VNE1 .0VNEHover.8 VNE1.0 VNEHover.8 VNE1.0 VNE@ VNEUp to 0.8 VNE@ VNEUp to 0.8 VNEModerate LeftModerate RightSevere LeftSevere RightAutorotationRight Side FlightLeft Side FlightRearward FlightPartial Power DescentModerate Left TurnModerate Right TurnSevere Left TurnSevere Right Turn
@ 40 kts@ 20 kts
Per FlightPer Shutdown
Extreme Manuevers78 Forward Flight > 10 deg SS @ .8 VNE79 Forward Flight > 5 deg SS @ .8 VNE80 Severe Turns 45 deg AOB @ VNE Left81 Severe Turns 45 deg AOB @ VNE Right82 Auto Descent @ Auto VNE83 Auto Descent @ Auto VNE @ Sideslip84 Auto Turns 45 deg AOB @ Auto VNE85 Power Descent Turns 45 deg AOB @ Auto VNE86 Climbing Turns 45 deg AOB87 Climb with Sideslip88 Collective Reversals up to VNE89 Control Reversals in Auto up to Auto VNE90 Control Reversals in PPD up to VNE91 Control Reversals at 96% Nr up to OEl VNE92 155 Kt Engine Cut - 85% Nr93 Category A Engine Cut on Take-Off94 Category B Land Back
% Time0.64
0.0080.0020.6320.1580.0050.005
0.380.848
50.110.450.45
0.20.2
0.150.15
0.0480.048
0.00160.0016
0.030.022
0.010.008
2.70.20.2
1.711.030.860.17
0.0340.170.340.340.180.39
0.0050.005
% Time0.460.160.410.020.070.450.020.220.01
0.0050.00050.0040.030.28
0.0250.0250.030.03
0.0550.2530.003
0.00140.27
0.00730.0073
0.0040.0030.330.090.44
3.63
Main Rotor Spindle
per 100 hrs Ref 1
76102-05001-047 &76358-05118-047
Main Rotor Shaft Tail Rotor Shaft Tail Rotor Retention PlateRef 2 Ref 5 Ref 3 & 4
0.00930.00051
per 100 hrs83
192492
2020
56320
264135127
10099
202055
31642
684131375
8315
105200200
29007357
130
0.0080.006
0.020.02
0.0130.000080.00330.00130.0160.057
0.000214286
3.68889E-06
0.0004
0.00008
0.000055.71429E-05
0.0003
0.000022750.0000280.000015
0.00526 0.00589 5.77778E-05
0.00930.0005
3.68889E-06
0.0004
0.000055.71429E-05
0.0003
0.000022750.0000280.000015
2.88889E-05
0.00010
2
322
Check totals 73.33138
Usage Retirement TimeBaseline Retirement Time
0.005572063 0.005893333 0.01082436 0.010705471
179475000
169684900
92387000
93417000
Page 63

File: Regimes.xls Tab: PHI
76102-08500-045Regime
Ref Steady State1 Hover IGE2 Left Side Flight3 Left Side Flight4 Right Side Flight5 Right Side Flight6 Rearward Flight7 Rearward Flight8 Forward Flight9 Forward Flight
10 Forward Flight11 Forward Flight12 Forward Flight13 Forward Flight w/ Sideslip14 Forward Flight w/ Sideslip15 Forward Flight w/ Sideslip16 Forward Flight w/ Sideslip17 Forward Flight w/ Sideslip18 Forward Flight w/ Sideslip19 Moderate Turns20 Moderate Turns21 Moderate Turns22 Moderate Turns23 Severe Turns24 Severe Turns25 Severe Turns26 Severe Turns27 Climb28 Climb29 Climb30 Power on Descent31 Power on Descent32 Power on Descent33 Power on Descent34 Power on Descent35 Power on Descent36 Power on Descent37 Power on Descent38 Autorotative Descent39 Autorotative Descent40 Autorotative Descent41 Autorotative Descent
Transient42 Takeoff and Climb43 Rudder Reversals44 Rudder Reversals45 Rudder Reversals46 Lateral Reversals47 Lateral Reversals48 Lateral Reversals49 Longitudinal Reversals50 Longitudinal Reversals51 Longitudinal Reversals52 Symmetrical Pullouts53 Symmetrical Pullouts54 Symmetrical Pushovers55 Symmetrical Pushovers56 Hover Turns57 Hover Turns58 Hover Turns59 Hover Turns60 Entry to/Recover from61 Entry to/Recover from62 Entry to/Recover from63 Entry to/Recover from64 Entry to/Recover from65 Entry to/Recover from66 Entry to/Recover from67 Entry to/Recover from68 Entry to/Recover from69 Approach to Hover70 Approach and Run-On Landing71 Approach and Run-On Landing72 Rotor Engagement73 Rotor Shutdown74 Taxi and Taxi Turns75 Ground-Air-Ground Cycle76 Ground-Air-Ground Cycle77 Total GAG
Up to 1OKt Wind10-25 Kts25-35 Kts10-25 Kts25-35 Kts10-25 Kts25-35 Kts.5 VNE.8 VNE.9 VNE1.0 VNE96% Nr @OE1 VNE5deg L @ .8 VNE5deg R @ .8 VNE5deg L @ 1.0 VNE5deg R @ 1.0 VNE1Odeg L @ .8 VNE10deg R @ .8 VNELeft 30deg AOB @ .8 VNERight 30deg AOB @ .8 VNELeft 30deg AOB OEl @ .8 VNERight 30deg AOB OEI @ .8 VNELeft 30deg AOB @ 1.0 VNERight 30deg AOB @ 1.0 VNELeft 45deg AOB @ .8 VNERight 45deg AOB @ .8 VNESteady (BROC)Left 30degRight 30deg.5 VNE.8 VNE.9 VNE1.0 VNE1.1 VNE96% Nr @OE1 VNELeft 30degRight 30deg.5 Auto VNE.8 Auto VNELeft 30degRight 30deg
Hover.8 VNE1.0 VNEHover.8 VNE1.0 VNEHover.8 VNE1.0 VNE@ VNEUp to 0.8 VNE@ VNEUp to 0.8 VNEModerate LeftModerate RightSevere LeftSevere RightAutorotationRight Side FlightLeft Side FlightRearward FlightPartial Power DescentModerate Left TurnModerate Right TurnSevere Left TurnSevere Right Turn
@ 40 kts@ 20 kts
Per FlightPer Shutdown
Extreme Manuevers78 Forward Flight > 10 deg SS @ .8 VNE79 Forward Flight > 5 deg SS @ .8 VNE80 Severe Turns 45 deg AOB @ VNE Left81 Severe Turns 45 deg AOB @ VNE Right82 Auto Descent @ Auto VNE83 Auto Descent @ Auto VNE @ Sideslip84 Auto Turns 45 deg AOB @ Auto VNE85 Power Descent Turns 45 deg AOB @ Auto VNE86 Climbing Turns 45 deg AOB87 Climb with Sideslip88 Collective Reversals up to VNE89 Control Reversals in Auto up to Auto VNE90 Control Reversals in PPD up to VNE91 Control Reversals at 96% Nr up to OEl VNE92 155 Kt Engine Cut - 85% Nr93 Category A Engine Cut on Take-Off94 Category B Land Back
% Time2.7504
0.20.0976
0.20.0379
0.20
2.18933.3681
11.148465.4612
10.450.450.20.2
0.150.15
0.48941.2422
0.050.05
0.39620.2726
0.160.16
6.31630.20.2
1.56490.93890.78240.15650.03130.04070.3130.313
00.32
0.00710.0128
% Time0.42180.0968
0.10
0.03590.06
00.0331
0.060
0.01820.0862
0.030.28
0.38090.433
0.030.03
0.00040.080.080.070.160.220.220.060.06
0.54610.090.44
1
0.0080.0060.020.02
0.0130.000080.00330.0013
0.0160.057
Main Rotor Spindle
per 100 hrs Ref 1
76351-09630-041 76358-05124-042 76102-05001-047 &76358-05118-047
Main Rotor Shaft Tail Rotor Shaft Tail Rotor Retention PlateRef 2 Ref 5 Ref 3 & 4
0.0217561440.00051
per 100 hrs76
120120
045750
407504
307
1001401602020
176
1950
626135345
8861
14015
105200200800250200178
3.37778E-06
0
0.000857143
0.00720
0
00.000228571
0.0003
0.000603750.0003520.000183
0.00807 7.91111 E-05
0.0217561440.0005
3.37778E-06
0
00.000228571
0.0003
0.000603750.0003520.000183
3.95556E-05
0.00010
2
322
Check totals 107.5373
Usage Retirement TimeBaseline Retirement Time
0.008156254 0.008069333 0.024015955
122615000
123934900
41647000
Page 64
0.023966399
41737000

File:Regimes.xis Tab:Renna (s)
Usage Retirement TimeBaseline Retirement Time
Improvement (%)Useful Life of Aircraft (years)Annual Usage (flight hours)Part CostUnltslshipsetInterest Rate (%)Max. Savings (Flight Hours)Umited Savings(Flight Hours) Note 1Shipset CostTotal Savings (in Dollars)Baseline cost per flight hourNew cost per flight hourSavings per flight hourProjected original replacement yearProjected usage replacement yearProjected annual savingsDiscounted total savings (8%)Checksum Raw Savings (in Dollars)YriYr2Yr3Yr4YrsYr6Yr7Yr8Yr9Yr1OYriyr12yr13yr14yr15yr16yr17yr18yr19yr2Oyr21yr22yr23yr24yr25yr26yr27yr28yr29yr3Oyr31yr32yr33yr34yr35
Main Rotor Spindle123905000148%
35400
$39,73248
73907390
$158,928$234,891
$31.79$12.83
$18.961432
$12,714$44,328
$234,8910.00.00.00.00.00.00.00.00.00.00.00.00.0
$12,714$12,714$12,714$12,714$12,714$12,714$12,714$12,714$12,714$12,714$12,714$12,714$12,714$12,714$12,714$12,714$12,714$12,714
$6,035
Main Rotor Shaft137874900181%
35400
$23,40218
88878887
$23,402$42,442
$4.78$1.70
$3.081335
$1,951$7,869
$42,4420.00.00.00.00.00.00.00.00.00.00.00.0
$1,951$1,951$1,951$1,951$1,951$1,951$1,951$1,951$1,951$1,951$1,951$1,951$1,951$1,951$1,951$1,951$1,951$1,951$1,951$1,951$1,951$1,464
Tail Rotor Shaft71647000
2%35
400$17,063
18
164164
$17,063$399
$2.44$2.38
$0.061919
$399$92
$3990.00.00.00.00.00.00.00.00.00.00.00.00.00.00.00.00.00.0
$399
Tail Rotor Flange/Ret Pit
71957000
3%35
400$23,964
18
195195
$23,964$668$3.42$3.33
$0.091919
$668$155$668
0.00.00.00.00.00.00.00.00.00.00.00.00.00.00.00.00.00.0
$668
Note 1 - Savings are limited by the usefull life of the aircraft - assumed to be 35 years.
Page 65

File:Regimes.xis Tab:Renna (2s)
Main Rotor Spindle Main Rotor Shaft Tail Rotor Shaft Tail Rotor Flange/Ret PitUsage Retirement Time 12390 13787 7164 7195Baseline Retirement Time 5000 4900 7000 7000
Improvement (%) 148% 181% 2% 3%Useful Life of Aircraft (years) 35 35 36 35Annual Usage (flight hours) 400 400 400 400Part Cost $39,732 $23,402 $17,063 $23,964Units/shipset 4 1 1 1Interest Rate (%) 8 8 8 8Max. Savings (Flight Hours) 7390 8887 164 195Limited Savings(Flight Hours) Note 1 7390 8887 164 195Shipset Cost $158,928 $23,402 $17,063 $23,964Total Savings (in Dollars) $234,891 $42,442 $399 $668Baseline cost per flight hour $31.79 $4.78 $2.44 $3.42New cost per flight hour $12.83 $1.70 $2.38 $3.33Savings per flight hour $18.96 $3.08 $0.06 $0.09Projected original replacement year 14 13 19 19Projected usage replacement year 32 35 19 19Projected annual savings Note 2 $7,346 $1,213 $21 $35Discounted total savings (8%) $83,988 $14,133 $202 $338Checksum Raw Savings (in Dollars) $234,891 $42,442 $399 $668Yr1 $7,346 $1,213 $21 $36Yr2 $7,346 $1,213 $21 $35Yr3 $7,346 $1,213 $21 $36Yr4 $7,346 $1,213 $21 $35Yr6 $7,346 $1,213 $21 $36Yr6 $7,346 $1,213 $21 $35Yr7 $7,346 $1,213 $21 $36Yr8 $7,346 $1,213 $21 $36Yr9 $7,346 $1,213 $21 $35Yr1O $7,346 $1,213 $21 $36Yr11 $7,346 $1,213 $21 $35yr12 $7,346 $1,213 $21 $36yr13 $7,346 $1,213 $21 $36yr14 $7,346 $1,213 $21 $35yr16 $7,346 $1,213 $21 $36yr16 $7,346 $1,213 $21 $36yr17 $7,346 $1,213 $21 $36yr18 $7,346 $1,213 $21 $36yr19 $7,346 $1,213 $19 $35yr2O $7,346 $1,213yr21 $7,346 $1,213yr22 $7,346 $1,213yr23 $7,346 $1,213yr24 $7,346 $1,213yr26 $7,346 $1,213yr26 $7,346 $1,213yr27 $7,346 $1,213yr28 $7,346 $1,213yr29 $7,346 $1,213yr3O $7,346 $1,213yr31 $7,346 $1,213yr32 $7,160 $1,213yr33 $1,213yr34 $1,213yr36 $1,213
Note I - Savings are limited by the usefull life of the aircraft - assumed to be 35 years.Note 2 - Savings are spread over the entire useful life of the part.
Page 66

File: Regimes.xis Tab: Puma (s)
Usage Retirement TimeBaseline Retirement Time
Improvement (%)Useful Life of Aircraft (years)Annual Usage (flight hours)Part CostUnitslshipsetInterest Rate (%)Max. Savings (Flight Hours)Umited Savings(Flight Hours) Note IShipset CostTotal Savings (in Dollars)Baseline cost per flight hourNew cost per flight hourSavings per flight hourProjected original replacement yearProjected usage replacement yearProjected annual savingsDiscounted total savings (8%)Checksum Raw Savings (in Dollars)YrIYr2Yr3Yr4Yr5Yr6Yr7Yr8Yr9YrIOYriiyr12yr13yr14yrl6Syri6Byr17yr18yr19yr2Oyr2lyr22yr23yr24yr26yr26yr27yr28yr29yr3Oyr31yr32yr33yr34yr36
Main Rotor Spindle179475000
259%36
400$39,732
48
129479000
$158,928$286,070
$31.79$11.35
$20.431435
$13,306$49,457
$286,0700.00.00.00.00.00.00.00.00.00.00.00.00.0
$13,306$13,306$13,306$13,306$13,306$13,306$13,306$13,306$13,306$13,306$13,306$13,306$13,306$13,306$13,306$13,306$13,306$13,306$13,306$13,306$13,306
$6,663
Main Rotor Shaft169684900
246%36
400$23,402
18
120689100
$23,402$43,461
$4.78$1.67$3.10
1335
$1,998$8,058
$43,4610.00.00.00.00.00.00.00.00.00.00.00.0
$1,998$1,998$1,998$1,998$1,998$1,998$1,998$1,998$1,998$1,998$1,998$1,998$1,998$1,998$1,998$1,998$1,998$1,998$1,998$1,998$1,998$1,499
Tail Rotor Shaft9238700032%
36400
$17,06318
22382238
$17,063$5,456
$2.44$1.85
$0.591924
$975$1,066$5,456
0.00.00.00.00.00.00.00.00.00.00.00.00.00.00.00.00.00.0
$976$976$976$976$976$681
Tail Rotor Flange/Ret Pit9341700033%
36400
$23,96418
23412341
$23,964$8,014
$3.42$2.57
$0.861924
$1,369$1,552$8,014
0.00.00.00.00.00.00.00.00.00.00.00.00.00.00.00.00.00.0
$1,369$1,369$1,369$1,369$1,369$1,167
Note I - Savings are limited by the usefull life of the aircraft - assumed to be 35 years.
Page 67

File: Regimes.xIs Tab: Puma (2s)
Main Rotor Spindle Main Rotor Shaft tail Rotor Shaft Tail Rotor Flange/Ret PitUsage Retirement Time 17947 16968 9238 9341Baseline Retirement Time 5000 4900 7000 7000
Improvement (%) 259% 246% 32% 33%Useful Life of Aircraft (years) 35 36 35 35Annual Usage (flight hours) 400 400 400 400Part Cost $39,732 $23,402 $17,063 $23,964Unitslshipset 4 1 1 1interest Rate (%) 8 8 8 8Max. Savings (Flight Hours) 12947 12068 2238 2341Limited Savings(Flight Hours) Note 1 9000 9100 2238 2341Shipset Cost $158,928 $23,402 $17,063 $23,964Total Savings (in Dollars) $286,070 $43,461 $5,456 $8,014Baseline cost per flight hour $31.79 $4.78 $2.44 $3.42New cost per flight hour $11.35 $1.67 $1.85 $2.57Savings per flight hour $20.43 $3.10 $0.59 $0.86Projected original replacement year 14 13 19 19Projected usage replacement year 35 35 24 24Projected annual savings Note 2 $8,173 $1,242 $226 $329Discounted total savings (8%) $95,258 $14,472 $2,387 $3,482Checksum Raw Savings (in Dollars) $286,070 $43,461 $5,456 $8,014Yr1 $8,173 $1,242 $226 $329Yr2 $8,173 $1,242 $226 $329Yr3 $8,173 $1,242 $226 $329Yr4 $8,173 $1,242 $226 $329YrG $8,173 $1,242 $226 $329Yr6 $8,173 $1,242 $226 $329Yr7 $8,173 $1,242 $226 $329Yr8 $8,173 $1,242 $226 $329Yr9 $8,173 $1,242 $226 $329Yr1o $8,173 $1,242 $226 $329Yr11 $8,173 $1,242 $226 $329yrl2 $8,173 $1,242 $226 $329yrl3 $8,173 $1,242 $226 $329yr14 $8,173 $1,242 $226 $329yr15 $8,173 $1,242 $226 $329yr16 $8,173 $1,242 $226 $329yr17 $8,173 $1,242 $226 $329yr18 $8,173 $1,242 $226 $329yr19 $8,173 $1,242 $226 $329yr2O $8,173 $1,242 $226 $329yr2l $8,173 $1,242 $226 $329yr22 $8,173 $1,242 $226 $329yr23 $8,173 $1,242 $226 $329yr24 $8,173 $1,242 $226 $329yr26 $8,173 $1,242 $22 $116yr26 $8,173 $1,242yr27 $8,173 $1,242yr28 $8,173 $1,242yr29 $8,173 $1,242yr3O $8,173 $1,242yr31 $8,173 $1,242yr32 $8,173 $1,242yr33 $8,173 $1,242yr34 $8,173 $1,242yr36 $8,173 $1,242
Note 1 - Savings are limited by the usefull life of the aircraft - assumed to be 35 years.Note 2 - Savings are spread over the entire useful life of the part.
Page 68

File: Regimes.xis Tab: PHI (s)
Usage Retirement TimeBaseline Retirement Time
Improvement (%)Useful Life of Aircraft (years)Annual Usage (flight hours)Part CostUnits/shipsetInterest Rate (%)Max. Savings (Flight Hours)Limited Savings(Flight Hours) Note 1Shipset CostTotal Savings (in Dollars)Baseline cost per flight hourNew cost per flight hourSavings per flight hourProjected original replacement yearProjected usage replacement yearProjected annual savingsDiscounted total savings (8%)Checksum Raw Savings (in Dollars)Yr1Yr2Yr3Yr4Yr5Yr6Yr7Yr8Yr9Yr1OYr1 Iyr12yr13yr14yr15yr16yr17yr18yr19yr2Oyr21yr22yr23yr24yr25yr26yr27yr28yr29yr3Oyr31yr32yr33yr34yr35
Main Rotor Spindle122615000145%
35400
$39,73248
72617261
$158,928$230,780
$31.79$12.96
$18.821432
$12,714$43,977
$230,7800.00.00.00.00.00.00.00.00.00.00.00.00.0
$12,714$12,714$12,714$12,714$12,714$1Z714$1Z714$12,714$12,714$12,714$12,714$12,714$12,714$12,714$12,714$12,714$12,714$12,714$1,924
Main Rotor Shaft123934900153%
35400
$23,40218
74937493
$23,402$35,784
$4.78$1.89
$2.891332
$1,910$7,238
$35,7840.00.00.00.00.00.00.00.00.00.00.00.0
$1,910$1,910$1,910$1,910$1,910$1,910$1,910$1,910$1,910$1,910$1,910$1,910$1,910$1,910$1,910$1,910$1,910$1,910$1,397
Tail Rotor Shaft41647000-41%
35400
$17,063I8
-2836-2836
$17,063-$6,913
$2.44$4.10
($1.66)1911
-$975-$2,373-$6,913
0.00.00.00.00.00.00.00.00.00.0
-$975-$975-$975-$975-$975-$975-$975
-$88
Tail Rotor Flange/Ret Pit41737000-40%
35400
$23,96418
-2827-2827
$23,964-$9,680
$3.42$5.74
($2.32)1911
-$1,369-$3,326-$9,680
0.00.00.00.00.00.00.00.00.00.0
-$1,369-$1,369-$1,369-$1,369-$1,369-$1,369-$1,369
-$94
Note 1 - Savings are limited by the usefull life of the aircraft - assumed to be 35 years.
Page 69

File: Regimes.xis Tab: PHI (2s)
Usage Retirement TimeBaseline Retirement Time
Improvement (%)Useful Life of Aircraft (years)Annual Usage (flight hours)Part CostUnitalshipsetInterest Rate (%)Max. Savings (Flight Hours)Umited Savings(Flight Hours) Note iShipset CostTotal Savings (in Dollars)Baseline cost per flight hourNew cost per flight hourSavings per flight hourProjected original replacement yearProjected usage replacement yearProjected annual savings Note 2Discounted total savings (8%)Checksum Raw Savings (in Dollars)Yr1Yr2Yr3Yr4Yr6Yr6Yr7Yr8Yr9Yr1OYr1llyr12yr13yr14yr16Syri6yr17yr18yr19yr2Oyr21yr22yr23yr24yr26yr26yr27yr28yr29yr3Oyr3lyr32yr33yr34yr35
Main Rotor Spindle122615000145%
36400
$39,73248
72617261
$158,928$230,780
$31.79$12.96
$18.821432
$7,291$83,160
$230,780$7,291$7,291$7,291$7,291$7,291$7,291$7,291$7,291$7,291$7,291$7,291$7,291$7,291$7,291$7,291$7,291$7,291$7,291$7,291$7,291$7,291$7,291$7,291$7,291$7,291$7,291$7,291$7,291$7,291$7,291$7,291$4,749
Main Rotor Shaft123934900153%
36400
$23,40218
74937493
$23,402$35,784
$4.78$1.89
$2.891332
$1,119$12,793$35,784
$1,119$1,119$1,119$1,119$1,119$1,119$1,119$1,119$1,119$1,119$1,119$1,119$1,119$1,119$1,119$1,119$1,119$1,119$1,119$1,119$1,119$1,119$1,119$1,119$1,119$1,119$1,119$1,119$1,119$1,119$1,119$1,098
Tail Rotor Shaft41647000-41%
36400
$17,06318
-2836-2836
$17,063-$6,913
$2.44$4.10
($1.66)1911
-$606-$4,424-$6,913
460646064606460646064606460646064606460646064248
Tail Rotor Flange/Ret Pit41737000-40%
36400
$23,96418
-2827-2827
$23,964-$9,680
$3.42$5.74
($2.32)1911
-$847-$6,190-$9,680
-$847-$847-$847-$8474847-$847-$847-$847-$847-$847-$847-$366
Note 1 - Savings are limited by the usefull life of the aircraft - assumed to be 35 years.Note 2 - Savings are spread over the entire useful life of the part.
Page 70

File: Regimes.xls Tab: Summary
Savings Acrued When Replaced(A/C used 400 hrs/yr, 8% discount rate)
Scenario I - RennaSavings per flight hourProjected annual savingsDiscounted total savings (8%)Raw Savings (in Dollars)
Scenario 2 - Puma.Savings per flight hourProjected annual savingsDiscounted total savings (8%)Raw Savings (in Dollars)
Scenario 3 - PHISavings per flight hourProjected annual savingsDiscounted total savings (8%)Raw Savings (in Dollars)
Average ScenarioSavings per flight hourProjected annual savingsDiscounted total savings (8%)Raw Savings (in Dollars)
Spindle$18.96
$12,714$44,328
$234,891
Spindle$20.43
$13,306$49,457
$286,070
Spindle$18.82
$12,714$43,977
$230,780
Spindle$19.40
$12,911.36$45,920.61
$250,580.70
MR Shaft$3.08
$1,951$7,869
$42,442
MR Shaft$3.10
$1,998$8,058
$43,461
MR Shaft$2.89
$1,910$7,238
$35,784
MR Shaft$3.02
$1,953.32$7,721.82
$40,562.45
TR Shaft$0.06$399
$92$399
TR Shaft$0.59$975
$1,066$5,456
TR Shaft($1.66)($975)
($2,373)($6,913)
TR Shaft($0.34)
$132.87($405.04)($352.76)
TR Flanne$0.09$668$155$668
TR Flanue$0.86
$1,369$1,552$8,014
TR Flanae($2.32)
($1,369)($3,326)($9,680)
TR Flange($0.46)
$222.81($539.55)($332.33)
Total$22.19
$15,733$52,444
$278,401
Total$24.99
$17,648$60,133
$343,002
Total$17.73
$12,280$45,517
$249,971
Total$21.63
$15,220.35$52,697.84
$290,458.06
Page 71

File: Regimes.xis Tab: Summary (2)
Savings Acrued Over Part Life(A/C used 400 hrs/yr, 8% discount rate)
Scenario I - RennaSavings per flight hourProjected annual savingsDiscounted total savings (8%)Raw Savings (in Dollars)
Scenario 2 - PumaSavings per flight hourProjected annual savingsDiscounted total savings (8%)Raw Savings (in Dollars)
Scenario 3 - PHISavings per flight hourProjected annual savingsDiscounted total savings (8%)Raw Savings (in Dollars)
Average ScenarioSavings per flight hourProjected annual savingsDiscounted total savings (8%)Raw Savings (in Dollars)
Spindle$18.96$7,346
$83,988$234,891
Spindle$20.43$8,173
$95,258$286,070
Spindle$18.82$7,291
$83,160$230,780
Spindle$19.40$7,604
$87,468$250,581
MR Shaft$3.08
$1,213$14,133$42,442
MR Shaft$3.10
$1,242$14,472$43,461
MR Shaft$2.89
$1,119$12,793$35,784
MR Shaft$3.02
$1,191$13,799$40,562
Page 72
TR Shaft$0.06
$21$202$399
TR Shaft$0.59$226
$2,387$5,456
TR Shaft($1.66)($606)
($4,424)($6,913)
TR Shaft($0.34)($119)($612)($353)
TR Flange$0.09
$35$338$668
TR Flange$0.86$329
$3,482$8,014
TR Flanae($2.32)($847)
($6,190)($9,680)
TR Flange($0.46)($161)($790)($332)
Total$22.19$8,615
$98,660$278,401
Total$24.99$9,971
$115,599$343,002
Total$17.73$6,958
$85,338$249,971
Total$21.63$8,514
$99,866$290,458

File: Regimelk.xis Tab: Renna (2s)
Usage Retirement TimeBaseline Retirement Time
Improvement (%)Useful Life of Aircraft (years)Annual Usage (flight hours)Part CostUnitslshipsetInterest Rate (%)Max. Savings (Flight Hours)Umited Savings(Flight Hours) Note IShipset CostTotal Savings (in Dollars)Baseline cost per flight hourNew cost per flight hourSavings per flight hourProjected original replacement yearProjected usage replacement yearProjected annual savings Note 2Discounted total savings (8%)Checksum Raw Savings (in Dollars)YrlYr2Yr3Yr4Yr6Yr6Yr7Yr8Yr9Yr1OYrllyr12yr13yr14yr15yr16yr17yr18yr19yr2Oyr2lyr22yr23yr24yr25yr26yr27yr28yr29yr3Oyr31yr32yr33yr34yr35
Main Rotor Spindle12390
5000148%
351000
$39,73248
73907390
$158,928$234,891
$31.79$12.83
$18.966
13$17,542
$140,980$234,891
$17,542$17,542$17,542$17,542$17,542$17,542$17,542$17,542$17,542$17,542$17,542$17,542$17,542
$6,839
Main Rotor Shaft137874900181%
351000
$23,40218
88878887
$23,402$42,442
$4.78$1.70
$3.086
15$2,870
$24,375$42,442
$2,870$2,870$2,870$2,870$2,870$2,870$2,870$2,870$2,870$2,870$2,870$2,870$2,870$2,870$2,258
Tail Rotor Shaft71647000
2%35
1000$17,063
18
164164
$17,063$399
$2.44$2.38$0.06
88
$49$285$399$49$49$49$49$49$49$49$49$8
Tail Rotor Flange/Ret PIt71957000
3%35
1000$23,964
18
195195
$23,964$668
$3.42$3.33
$0.0988
$82$477$668
$82$82$82$82$82$82$82$82$16
Note 1 - Savings are limited by the usefull life of the aircraft - assumed to be 35 years.Note 2 - Savings are spread over the entire useful life of the part.
Page 73

File: Regimelk.xls Tab: Puma (2s)
Main Rotor Spindle Main Rotor Shaft Tail Rotor Shaft Tail Rotor Flange/Ret PIt
Usage Retirement Time 17947 16968 9238 9341Baseline Retirement Time 5000 4900 7000 7000
improvement (%) 259% 246% 32% 33%Useful Life of Aircraft (years) 36 35 35 35Annual Usage (flight hours) 1000 1000 1000 1000Part Cost $39,732 $23,402 $17,063 $23,964Unitalshipset 4 1 1 1Interest Rate (%) 8 8 8 8Max. Savings (Flight Hours) 12947 12068 2238 2341Limited Savings(Flight Hours) Note 1 12947 12068 2238 2341Shipset Cost $158,928 $23,402 $17,063 $23,964Total Savings (in Dollars) $411,518 $57,637 $5,456 $8,014Baseline cost per flight hour $31.79 $4.78 $2.44 $3.42New cost per flight hour $8.86 $1.38 $1.85 $2.57Savings per flight hour $22.93 $3.40 $0.59 $0.86Projected original replacement year 6 6 8 8Projected usage replacement year 19 18 10 10Projected annual savings Note 2 $21,720 $3,208 $533 $775Discounted total savings (8%) $208,320 $30,037 $3,630 $5,314Checksum Raw Savings (in Dollars) $411,518 $57,637 $5,456 $8,014Yrl $21,720 $3,208 $533 $776Yr2 $21,720 $3,208 $533 $775Yr3 $21,720 $3,208 $533 $775Yr4 $21,720 $3,208 $533 $775Yr5 $21,720 $3,208 $533 $775Yr6 $21,720 $3,208 $533 $775Yr7 $21,720 $3,208 $533 $775Yr8 $21,720 $3,208 $633 $775Yr9 $21,720 $3,208 $533 $775Yr1O $21,720 $3,208 $533 $776Yrl1 $21,720 $3,208 $127 $264yr12 $21,720 $3,208yr13 $21,720 $3,208yr14 $21,720 $3,208yr15 $21,720 $3,208yrl6 $21,720 $3,208yr17 $21,720 $3,208yr18 $21,720 $3,106yr19 $20,562yr2Oyr2lyr22yr23yr24yr25yr26yr27yr28yr29yr3Oyr3lyr32yr33yr34yr35
Note 1 - Savings are limited by the usefull life of the aircraft - assumed to be 35 years.Note 2 - Savings are spread over the entire useful life of the part.
Page 74

File: Regimelk.xls Tab: PHI (2s)
Main Rotor Spindle Main Rotor Shaft Tail Rotor Shaft Tail Rotor Flange/Ret PitUsage Retirement Time 12261 12393 4164 4173Baseline Retirement Time 5000 4900 7000 7000
Improvement (%) 145% 153% -41% -40%Useful Life of Aircraft (years) 36 36 36 36Annual Usage (flight hours) 1000 1000 1000 1000Part Cost $39,732 $23,402 $17,063 $23,964Units/shipset 4 1 1 1Interest Rate (%) 8 8 8 8Max. Savings (Flight Hours) 7261 7493 -2836 -2827Limited Savings(Flight Hours) Note 1 7261 7493 -2836 -2827Shipset Cost $158,928 $23,402 $17,063 $23,964Total Savings (in Dollars) $230,780 $35,784 -$6,913 -$9,680Baseline cost per flight hour $31.79 $4.78 $2.44 $3.42New cost per flight hour $12.96 $1.89 $4.10 $5.74Savings per flight hour $18.82 $2.89 ($1.66) ($2.32)Projected original replacement year 6 6 8 8Projected usage replacement year 13 13 5 5Projected annual savings Note 2 $17,404 $2,672 -$1,339 -$1,871Discounted total savings (8%) $139,097 $21,475 -$5,484 -$7,675Checksum Raw Savings (in Dollars) $230,780 $35,784 -$6,913 -$9,680Yr1 $17,404 $2,672 41,339 -$1,871Yr2 $17,404 $2,672 -$1,339 41,871Yr3 $17,404 $2,672 -$1,339 -$1,871Yr4 $17,404 $2,672 -$1,339 -$1,871Yrs $17,404 $2,672 -$1,339 -$1,871Yr6 $17,404 $2,672 -$219 -$323Yr7 $17,404 $2,672Yr8 $17,404 $2,672Yr9 $17,404 $2,672Yr1O $17,404 $2,672Yri1 $17,404 $2,672yr12 $17,404 $2,672yr13 $17,404 $2,672yr14 $4,634 $1,049yr16yrl6yr17yr18yr9yr2Oyr2lyr22yr23yr24yr26yr26yr27yr28yr29yr3Oyr3lyr32yr33yr34yr36
Note 1 - Savings are limited by the usefull life of the aircraft - assumed to be 35 years.Note 2 - Savings are spread over the entire useful life of the part.
Page 75

File: Regimelk.xls Tab: Summary (2)
Savings Acrued Over Part Life(A/C used 1000 hrs/yr, 8% discount rate)
Scenario 1 - RennaSavings per flight hourProjected annual savingsDiscounted total savings (8%)Raw Savings (in Dollars)
Scenario 2 - PumaSavings per flight hourProjected annual savingsDiscounted total savings (8%)Raw Savings (in Dollars)
Scenario 3 - PHISavings per flight hourProjected annual savingsDiscounted total savings (8%)Raw Savings (in Dollars)
Average ScenarioSavings per flight hourProjected annual savingsDiscounted total savings (8%)Raw Savings (in Dollars)
Spindle$18.96
$17,542$140,980$234,891
Spindle$22.93
$21,720$208,320$411,518
Spindle$18.82
$17,404$139,097$230,780
Spindle$20.24
$18,889$162,799$292,396
MR Shaft$3.08
$2,870$24,375$42,442
MR Shaft$3.40
$3,208$30,037$57,637
MR Shaft$2.89
$2,672$21,475$35,784
MR Shaft$3.12
$2,917$25,296$45,288
TR Shaft$0.06
$49$285$399
TR Shaft$0.59$533
$3,630$5,456
TR Shaft($1.66)
($1,339)($5,484)($6,913)
TR Shaft($0.34)($252)($523)($353)
TR Flange$0.09
$82$477$668
TR Flange$0.86$775
$5,314$8,014
TR Flanae($2.32)
($1,871)($7,675)($9,680)
TR Flange($0.46)($338)($628)($332)
Page 76
Total$22.19
$20,543$166,117$278,401
Total$27.78
$26,235$247,301$482,626
Total$17.73
$16,865$147,414$249,971
Total$22.56
$21,215$186,944$336,999

File: Regime3k.xls Tab: Renna (2s)
Main Rotor Spindle Main Rotor Shaft Tail Rotor Shaft Tail Rotor Flange/Ret PitUsage Retirement Time 12390 13787 7164 7195Baseline Retirement Time 5000 4900 7000 7000
Improvement (%) 148% 181% 2% 3%Useful Life of Aircraft (years) 35 35 35 35Annual Usage (flight hours) 1000 1000 1000 1000Part Cost $39,732 $23,402 $17,063 $23,964Units/shipset 4 1 1 1Interest Rate (%) 8 8 8 8Max. Savings (Flight Hours) 7390 8887 164 195Umited Savings(Flight Hours) Note 1 7390 8887 164 195Shipset Cost $158,928 $23,402 $17,063 $23,964Total Savings per Set Replaced (in Dollars) $234,891 $42,442 $399 $668Baseline cost per flight hour $31.79 $4.78 $2.44 $3.42New cost per flight hour $12.83 $1.70 $2.38 $3.33Savings per flight hour $18.96 $3.08 $0.06 $0.09Projected original replacement year 6 6 8 8Projected usage replacement year 13 15 8 8Projected annual savings Note 2 $17,542 $2,870 $49 $82Discounted total savings (8%) $204,450 $33,452 $569 $951Checksum Raw Savings (in Dollars) $613,987 $100,461 $1,709 $2,855Yr1 $17,542 $2,870 $49 $82Yr2 $17,542 $2,870 $49 $82Yr3 $17,642 $2,870 $49 $82Yr4 $17,542 $2,870 $49 $82Yr5 $17,542 $2,870 $49 $82Yr6 $17,542 $2,870 $49 $82Yr7 $17,542 $2,870 $49 $82Yr8 $17,542 $2,870 $49 $82Yr9 $17,542 $2,870 $49 $82Yr1O $17,542 $2,870 $49 $82Yr1l $17,542 $2,870 $49 $82yr12 $17,542 $2,870 $49 $82yrl3 $17,542 $2,870 $49 $82yr14 $17,542 $2,870 $49 $82yr15 $17,642 $2,870 $49 $82yr16 $17,542 $2,870 $49 $82yr17 $17,542 $2,870 $49 $82yr18 $17,542 $2,870 $49 $82yr19 $17,542 $2,870 $49 $82yr2O $17,542 $2,870 $49 $82yr21 $17,542 $2,870 $49 $82yr22 $17,542 $2,870 $49 $82yr23 $17,542 $2,870 $49 $82yr24 $17,542 $2,870 $49 $82yr25 $17,542 $2,870 $49 $82yr26 $17,542 $2,870 $49 $82yr27 $17,542 $2,870 $49 $82yr28 $17,642 $2,870 $49 $82yr29 $17,642 $2,870 $49 $82yr3O $17,542 $2,870 $49 $82yr31 $17,542 $2,870 $49 $82yr32 $17,642 $2,870 $49 $82yr33 $17,542 $2,870 $49 $82yr34 $17,542 $2,870 $49 $82yr35 $17,542 $2,870 $49 $82
Note I - Savings are limited by the usefull life of the aircraft - assumed to be 35 years.Note 2 - Savings are spread over the entire useful life of the part.
Page 77

File: Regime3k.xIs Tab: Puma (2s)
Main Rotor Spindle Main Rotor Shaft Tail Rotor Shaft Tail Rotor Flange/Ret PitUsage Retirement Time 17947 16968 9238 9341Baseline Retirement Time 5000 4900 7000 7000
Improvement (%) 259% 246% 32% 33%Useful Life of Aircraft (years) 35 35 35 35Annual Usage (flight hours) 1000 1000 1000 1000Part Cost $39,732 $23,402 $17,063 $23,964Units/shipset 4 1 1 1Interest Rate (%) 8 8 8 8Max. Savings (Flight Hours) 12947 12068 2238 2341Limited Savings(Flight Hours) Note 1 12947 12068 2238 2341Shipset Cost $158,928 $23,402 $17,063 $23,964Total Savings per Set Replaced (in Dollars) $411,518 $57,637 $5,456 $8,014Baseline cost per flight hour $31.79 $4.78 $2.44 $3.42New cost per flight hour $8.86 $1.38 $1.85 $2.57Savings per flight hour $22.93 $3.40 $0.59 $0.86Projected original replacement year 6 6 8 8Projected usage replacement year 19 18 10 10Projected annual savings Note 2 $21,720 $3,208 $533 $775Discounted total savings (8%) $253,135 $37,385 $6,211 $9,032Checksum Raw Savings (in Dollars) $760,193 $112,270 $18,652 $27,125Yrl $21,720 $3,208 $533 $775Yr2 $21,720 $3,208 $533 $775Yr3 $21,720 $3,208 $533 $775Yr4 $21,720 $3,208 $533 $775Yr5 $21,720 $3,208 $533 $775Yr6 $21,720 $3,208 $533 $775Yr7 $21,720 $3,208 $533 $775Yr8 $21,720 $3,208 $533 $775Yr9 $21,720 $3,208 $533 $775Yr1O $21,720 $3,208 $533 $775Yrll $21,720 $3,208 $533 $775yr12 $21,720 $3,208 $533 $775yr13 $21,720 $3,208 $533 $775yr14 $21,720 $3,208 $533 $775yr15 $21,720 $3,208 $533 $775yr16 $21,720 $3,208 $533 $775yr17 $21,720 $3,208 $533 $775yr18 $21,720 $3,208 $533 $775yr19 $21,720 $3,208 $533 $775yr2O $21,720 $3,208 $533 $775yr2l $21,720 $3,208 $533 $775yr22 $21,720 $3,208 $533 $775yr23 $21,720 $3,208 $533 $775yr24 $21,720 $3,208 $533 $775yr25 $21,720 $3,208 $533 $775yr26 $21,720 $3,208 $533 $775yr27 $21,720 $3,208 $533 $775yr28 $21,720 $3,208 $533 $775yr29 $21,720 $3,208 $533 $775yr3O $21,720 $3,208 $533 $775yr31 $21,720 $3,208 $533 $775yr32 $21,720 $3,208 $533 $775yr33 $21,720 $3,208 $533 $775yr34 $21,720 $3,208 $533 $775yr35 $21,720 $3,208 $533 $775
Note 1 - Savings are limited by the usefull life of the aircraft - assumed to be 35 years.Note 2 - Savings are spread over the entire useful life of the part.
Page 78

File: Regime3k.xIs Tab: PHI (2s)
Usage Retirement TimeBaseline Retirement Time
Improvement (%)Useful Life of Aircraft (years)Annual Usage (flight hours)Part CostUnitslshipsetInterest Rate (%)Max. Savings (Flight Hours)Limited Savings(Flight Hours) Note 1Shipset CostTotal Savings per Set Replaced (in Dollars)Baseline cost per flight hourNew cost per flight hourSavings per flight hourProjected original replacement yearProjected usage replacement yearProjected annual savings Note 2Discounted total savings (8%)Checksum Raw Savings (in Dollars)YrlYr2Yr3Yr4Yr6Yr6Yr7Yr8Yr9Yr1OYr1lyrl2yrl3yr14yr16yr16yr17yr18yr19yr2Oyr21yr22yr23yr24yr26yr26yr27yr28yr29yr3Oyr31yr32yr33yr34yr36
Main Rotor Spindle122615000145%
361000
$39,73248
72617261
$158,928$230,780
$31.79$12.96
$18.826
13$17,404
$202,831$609,124$17,404$17,404$17,404$17,404$17,404$17,404$17,404$17,404$17,404$17,404$17,404$17,404$17,404$17,404$17,404$17,404$17,404$17,404$17,404$17,404$17,404$17,404$17,404$17,404$17,404$17,404$17,404$17,404$17,404$17,404$17,404$17,404$17,404$17,404$17,404
Main Rotor Shaft123934900153%
361000
$23,40218
74937493
$23,402$35,784
$4.78$1.89
$2.896
13$2,672
$31,140$93,517
$2,672$2,672$2,672$2,672$2,672$2,672$2,672$2,672$2,672$2,672$2,672$2,672$2,672$2,672$2,672$2,672$2,672$2,672$2,672$2,672$2,672$2,672$2,672$2,672$2,672$2,672$2,672$2,672$2,672$2,672$2,672$2,672$2,672$2,672$2,672
Tail Rotor Shaft41647000-41%
351000
$17,06318
-2836-2836
$17,063-$6,913
$2.44$4.10
($1.66)85
-$1,339-$15,603-$46,856
-$1,339-$1,339-$1,339-$1,339-$1,339-$1,339-$1,339-$1,339-$1,339-$1,33941,339-$1,339-$1,33941,339-$1,339-$1,339-$1,339-$1,33941,33941,339-$1,339-$1,339-$1,33941,339-$1,339-$1,339-$1,339-$1,339-$1,339-$1,339-$1,339-$1,339-$1,339-$1,339-$1,339
Tail Rotor Flange/Ret Pit41737000-40%
351000
$23,96418
-2827-2827
$23,964-$9,680
$3.42$5.74
($2.32)85
-$1,871-$21,810-$65,498
-$1,871-$1,871-$1,871-$1,871-$1,871-$1,871-$1,871-$1,871-$1,871-$1,871-$1,871-$1,871-$1,871-$1,871-$1,871-$1,871-$1,871-$1,871-$1,871-$1,871-$1,871-$1,871-$1,871-$1,871-$1,871-$1,871-$1,871-$1,871-$1,871-$1,871-$1,871-$1,871-$1,871-$1,871-$1,871
Note 1 - Savings are limited by the usefull life of the aircraft - assumed to be 35 years.Note 2 - Savings are spread over the entire useful life of the part.
Page 79

File: Regime3k.xis Tab: Summary (2)
Savings Acrued Over Part LifeSavings Acrued over 35 yr Aircraft Life (A/C used 1000 hrs/yr)
Scenario I - RennaSavings per flight hourProjected annual savingsDiscounted total savings (8%)Raw Savings (in Dollars)
Scenario 2 - PumaSavings per flight hourProjected annual savingsDiscounted total savings (8%)Raw Savings (in Dollars)
Scenario 3 - PHI.Savings per flight hourProjected annual savingsDiscounted total savings (8%)Raw Savings (in Dollars)
Average ScenarioSavings per flight hourProjected annual savingsDiscounted total savings (8%)Raw Savings (in Dollars)
Spindle$18.96
$17,542$204,450$234,891
Spindle$22.93
$21,720$253,135$411,518
Spindle$18.82
$17,404$202,831$230,780
Spindle$20.24
$18,889$220,139$292,396
MR Shaft$3.08
$2,870$33,452$42,442
MR Shaft$3.40
$3,208$37,385$57,637
MR Shaft$2.89
$2,672$31,140$35,784
MR Shaft$3.12
$2,917$33,992$45,288
TR Shaft$0.06
$49$569$399
TR Shaft$0.59$533
$6,211$5,456
TR Shaft($1.66)
($1,339)($15,603)($6,913)
TR Shaft($0.34)($252)
($2,941)($353)
TR Flanae$0.09
$82$951$668
TR Flanae$0.86$775
$9,032$8,014
TR Flange($2.32)
($1,871)($21,810)
($9,680)
TR Flanae($0.46)($338)
($3,942)($332)
Page 80
Total$22.19
$20,543$239,422$278,401
Total$27.78
$26,235$305,763$482,626
Total$17.73
$16,865$196,558$249,971
Total$22.56
$21,215$247,248$336,999

File: Regime5k.xis Tab: Renna (2s)
Main Rotor Spindle Main Rotor Shaft Tail Rotor Shaft Tail Rotor Flange/Ret PIt
Usage Retirement Time 12390 13787 7164 7195Baseline Retirement Time 5000 4900 7000 7000
Improvement (%) 148% 181% 2% 3%Useful Life of Aircraft (years) 35 35 35 35Annual Usage (flight hours) 1000 1000 1000 1000Part Cost $39,732 $23,402 $17,063 $23,964Units/shipset 4 1 1 1Interest Rate (%) 5 6 5 5Max. Savings (Flight Hours) 7390 8887 164 195Limited Savings(Flight Hours) Note 1 7390 8887 164 195Shipset Cost $158,928 $23,402 $17,063 $23,964Total Savings per Set Replaced (in Dollars) $234,891 $42,442 $399 $668Baseline cost per flight hour $31.79 $4.78 $2.44 $3.42New cost per flight hour $12.83 $1.70 $2.38 $3.33Savings per flight hour $18.96 $3.08 $0.06 $0.09Projected original replacement year 6 6 8 8Projected usage replacement year 13 15 8 8Projected annual savings Note 2 $17,542 $2,870 $49 $82Discounted total savings (5%) $287,244 $46,999 $800 $1,336Checksum Raw Savings (in Dollars) $613,987 $100,461 $1,709 $2,855Yr1 $17,542 $2,870 $49 $82Yr2 $17,542 $2,870 $49 $82Yr3 $17,542 $2,870 $49 $82Yr4 $17,542 $2,870 $49 $82Yr5 $17,542 $2,870 $49 $82Yr6 $17,542 $2,870 $49 $82Yr7 $17,542 $2,870 $49 $82Yr8 $17,542 $2,870 $49 $82Yr9 $17,542 $2,870 $49 $82Yrio $17,542 $2,870 $49 $82Yr 11 $17,542 $2,870 $49 $82yr12 $17,542 $2,870 $49 $82yrl3 $17,542 $2,870 $49 $82yr14 $17,542 $2,870 $49 $82yr15 $17,542 $2,870 $49 $82yrl6 $17,542 $2,870 $49 $82yr17 $17,542 $2,870 $49 $82yr18 $17,542 $2,870 $49 $82yr19 $17,542 $2,870 $49 $82yr2O $17,642 $2,870 $49 $82yr2l $17,542 $2,870 $49 $82yr22 $17,542 $2,870 $49 $82yr23 $17,542 $2,870 $49 $82yr24 $17,542 $2,870 $49 $82yr25 $17,642 $2,870 $49 $82yr26 $17,542 $2,870 $49 $82yr27 $17,542 $2,870 $49 $82yr28 $17,542 $2,870 $49 $82yr29 $17,542 $2,870 $49 $82yr3O $17,542 $2,870 $49 $82yr3l $17,542 $2,870 $49 $82yr32 $17,542 $2,870 $49 $82yr33 $17,542 $2,870 $49 $82yr34 $17,542 $2,870 $49 $82yr35 $17,542 $2,870 $49 $82
Note 1 - Savings are limited by the usefull life of the aircraft - assumed to be 35 years.Note 2 - Savings are spread over the entire useful life of the part.
Page 81
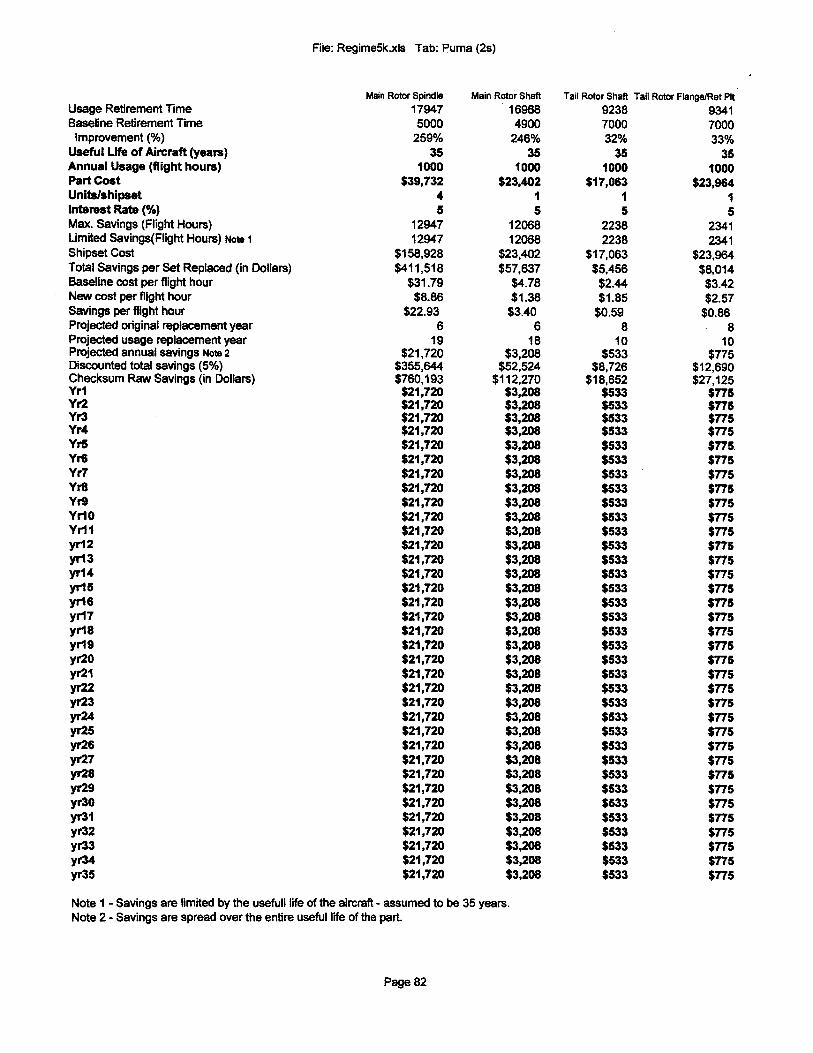
File: Regime5k.xIs Tab: Puma (2s)
Usage Retirement TimeBaseline Retirement Time
Improvement (%)Useful Life of Aircraft (years)Annual Usage (flight hours)Part CostUnitalshipsetInterest Rate (%)Max. Savings (Flight Hours)Limited Savings(Flight Hours) Note 1Shipset CostTotal Savings per Set Replaced (in Dollars)Baseline cost per flight hourNew cost per flight hourSavings per flight hourProjected original replacement yearProjected usage replacement yearProjected annual savings Note 2Discounted total savings (5%)Checksum Raw Savings (in Dollars)YrlYr2Yr3Yr4Yr5Yr6Yr7Yr8Yr9Yr1oYr1 Iyr12yr13yr14yr15yr16yr17yr18yr1gyr2Oyr21yr22yr23yr24yr25yr26yr27yr28yr29yr3Oyr31yr32yr33yr34yr35
Main Rotor Spindle179475000
259%35
1000$39,732
45
1294712947
$158,928$411,518
$31.79$8.86
$22.936
19$21,720
$355,644$760,193
$21,720$21,720$21,720$21,720$21,720$21,720$21,720$21,720$21,720$21,720$21,720$21,720$21,720$21,720$21,720$21,720$21,720$21,720$21,720$21,720$21,720$21,720$21,720$21,720$21,720$21,720$21,720$21,720$21,720$21,720$21,720$21,720$21,720$21,720$21,720
Main Rotor Shaft169684900
246%35
1000$23,402
15
1206812068
$23,402$57,637
$4.78$1.38
$3.406
18$3,208
$52,524$112,270
$3,208$3,208$3,208$3,208$3,208$3,208$3,208$3,208$3,208$3,208$3,208$3,208$3,208$3,208$3,208$3,208$3,208$3,208$3,208$3,208$3,208$3,208$3,208$3,208$3,208$3,208$3,208$3,208$3,208$3,208$3,208$3,208$3,208$3,208$3,208
Tail Rotor Shaft9238700032%
351000
$17,06315
22382238
$17,063$5,456
$2.44$1.85
$0.598
10$533
$8,726$18,652
$533$533$533$533$533$533$533$533$533$533$533$533$533$533$533$533$533$533$533$533$533$533$533$533$533$533$533$533$533$533$533$533$533$533$533
Tail Rotor Flange/Ret Pit9341700033%
351000
$23,96415
23412341
$23,964$8,014
$3.42$2.57$0.86
810
$775$12,690$27,125
$775$775$775$775$775$775$775$775$775$775$775$775$775$775$775$775$775$775$775$775$775$775$775$775$775$775$775$775$775$775$775$775$775$775$775
Note I - Savings are limited by the usefull life of the aircraft - assumed to be 35 years.Note 2 - Savings are spread over the entire useful life of the part.
Page 82

File: Regime5k.xis Tab: PHI (2s)
Usage Retirement TimeBaseline Retirement Time
Improvement (%)Useful Life of Aircraft (years)Annual Usage (flight hours)Part CostUnitsishipsetInterest Rate (%)Max. Savings (Flight Hours)Umited Savings(Flight Hours) Note 1Shipset CostTotal Savings per Set Replaced (in Dollars)Baseline cost per flight hourNew cost per flight hourSavings per flight hourProjected original replacement yearProjected usage replacement yearProjected annual savings Note 2Discounted total savings (5%)Checksum Raw Savings (in Dollars)Yr1Yr2Yr3Yr4Yr6Yr6Yr7Yr8Yr9Yr1OYr1 Iyr12yri3yri4yrl5yr16yrl7yr18yr19yr2Oyr21yr22yr23yr24yr26yr26yr27yr28yr29yr3Oyr3lyr32yr33yr34yr36
Main Rotor Spindle12261
5000145%
361000
$39,73245
72617261
$158,928$230,780
$31.79$12.96
$18.826
13$17,404
$284,969$609,124
$17,404$17,404$17,404$17,404$17,404$17,404$17,404$17,404$17,404$17,404$17,404$17,404$17,404$17,404$17,404$17,404$17,404$17,404$17,404$17,404$17,404$17,404$17,404$17,404$17,404$17,404$17,404$17,404$17,404$17,404$17,404$17,404$17,404$17,404$17,404
Main Rotor Shaft Tail Rotor Shaft Tail Rotor Range/Ret Pit1239490153
3100
$23,40
749749
$23,40$35,78
$4.7$1.8$2.8
1$2,67
$43,75$93,51$2,67$2,67$2,67$2,67$2,67$2,67$2,67$2,67$2,67$2,67$2,67$2,67$2,67$2,67$2,67$2,67$2,67$2,67$2,67$2,67$2,67$2,67$2,67$2,67$2,67$2,67$2,67$2,61$2,61$2,61$2,61$2,61$2,61$2,61$2,61
Note 1 - Savings are limited by the usefull life of the aircraft - assumed to be 35 years.Note 2 - Savings are spread over the entire useful life of the part.
Page 83
3 41640 7000% -41%6 350 10002 $17,0631 16 63 -28363 -28362 $17,0634 -$6,9138 $2.449 $4.109 ($1.66)6 83 52 -$1,3391 -$21,9217 -$46,8562 41,3392 41,3392 -$1,3392 -$1,3392 41,3392 -$1,3392 -$1,3392 41,3392 41,3392 41,3392 -$1,3392 -$1,3392 -$1,3392 -$1,3392 -$1,3392 -$1,3392 -$1,3392 -$1,3392 41,3392 -$1,3392 -$1,3392 -$1,3392 -$1,3392 -$1,3392 -$1,3392 41,3392 41,3392 -$1,3392 -$1,3392 -$1,3392 -$1,3392 -$1,3392 -$1,3392 -$1,3392 -$1,339
41737000-40%
361000
$23,96416
-2827-2827
$23,964-$9,680
$3.42$5.74
($2.32)85
-$1,871-$30,642-$65,49841,87141,871-$1,871-$1,871-$1,871-$1,87141,87141,871-$1,871-$1,871-$1,871-$1,871-$1,871-$1,871-$1,87141,871-$1,871-$1,871-$1,87141,871-$1,871-$1,87141,871-$1,87141,871-$1,87141,871-$1,871-$1,87141,871-$1,871-$1,87141,871-$1,871-$1,871

File: Regime5k.xls Tab: Summary (2)
Savings Acrued Over Part LifeSavings Acrued over 35 yr Aircraft Life (A/C used 1000 hrs/yr)
Scenario 1 - RennaSavings per flight hourProjected annual savingsDiscounted total savings (5%)Raw Savings (in Dollars)
Scenario 2 - PumaSavings per flight hourProjected annual savingsDiscounted total savings (5%)Raw Savings (in Dollars)
Scenario 3 - PHISavings per flight hourProjected annual savingsDiscounted total savings (5%)Raw Savings (in Dollars)
Average ScenarioSavings per flight hourProjected annual savingsDiscounted total savings (5%)Raw Savings (in Dollars)
Spindle$18.96
$17,542$287,244$234,891
Spindle$22.93
$21,720$355,644$411,518
Spindle$18.82
$17,404$284,969$230,780
Spindle$20.24
$18,889$309,286$292,396
MR Shaft$3.08
$2,870$46,999$42,442
MR Shaft$3.40
$3,208$52,524$57,637
MR Shaft$2.89
$2,672$43,751$35,784
MR Shaft$3.12
$2,917$47,758$45,288
TR Shaft$0.06
$49$800$399
TR Shaft$0.59$533
$8,726$5,456
TR Shaft($1.66)
($1,339)($21,921)($6,913)
TR Shaft($0.34)($252)
($4,132)($353)
Page 84
TR Flange$0.09
$82$1,336
$668
TR Flange$0.86$775
$12,690$8,014
TR Flange($2.32)
($1,871)($30,642)
($9,680)
TR Flange($0.46)($338)
($5,539)($332)
Total$22.19
$20,543$336,378$278,401
Iotal$27.78
$26,235$429,584$482,626
Total$17.73
$16,865$276,156$249,971
Total$22.56
$21,215$347,373$336,999

Appendix II - Assumptions Used in DevelopingUsage Scenarios.
These are the details that support how the data from each of the three scenarios werecross-referenced into the S-76 list of regimes.
85

Generation of "Renna" Profdie
Adjusted damage by creating a ratio (multiplier) of baseline usage to new profile based on AVO 96-Fl-515dated 12/16/96 (Reference 13). For steady state regimes, the ratio is between baseline % of time and new% of time. For transient regimes, the ratio is between baseline occurrences and new occurrences.Completed check totals between baseline and unadjusted Renna sheet. Specific notes on translations areprovided below.
P2 2nd paragraph: "....landed 1.6 times per hour.. .design landing rate of 4.5 per hour" - assumed thistranslated to 160 GAG cycles and allocated 89 (56%) to per flight and 71 (44%) to per shutdown.
P3 table item "slideslip" - actual "Infrequently .... always at <60 KTS" - removed all (changed % times forforward flight w/ slideslip to zero.
P3 table item "Control Reversals" - actual "3 per hour" - reduced # occurrences by 57% (4/7).
P3 table item 30 deg AOB turns" - actual "<0.5 per hour" - changed entry to/recovery from moderate turnsto 50.
P3 table item 45 deg AOB turns" - actual "almost never" - changed entry to/recovery from severe turns to5, reduced severe turns (45 deg AOB) to 5% of baseline (0.16 x 0.05) = 0.008.
P3 table item "autorotations" - "3 per 100 hours" - changed entry to / recovery from Autorotation to 3 per100,0.003%.
86

Generation of "PUMA" Profile
Built spreadsheet "CAAPuma" of data from CAA SRG Research note 64 dated Dec 1987 (Reference 6) assuming % time and #occurrences change linearly with each other. Mapped these elements to closely corresponding S-76 regimes and adjusted % time and# of occurrences as per the CAA data. Specific items are noted below.
Regime number 74: changed % time to 3.63 and # occurrences to 2900 (3.63 x 800).Regime number 77: changed # occurrences to 130 split between #75 73 (130 x .56) and #76 (130 X .44).Regime number 1: changed % time to 0.64.Regime number 46: changed % time to 0.07 and # occurrences to 84 (0.7 x 120).Regime number 49: changed % time to 0.22 and # occurrences to 264 (2.2 x 120).Regime number 43: changed % time to 0.16 and # occurrences to 192 (1.2 x 160).Regime number 56, 57: changed % time to 0.025 and # occurrences to 9 (0.037 x 240) (assume applies to moderate hover turns only)Regime number 6, 7: changed % time to 0.005.Regime number 4, 5: changed % time to from 0.25 total to 0.79 total 0.632 (3.16 x 0.2) and 0.158 (3.16 x 0.05).Regime number 2, 3: changed % time from 0.25 total to 0.01 total 0.008 (0.04 x 0.2) and 0.002 (0.04 x 0.05).Regime number 42: changed % time from 2.5 to 0.46 (2.5 x 83/450) and # occurrences from 450 to 83.Regime number 69: changed % time from 1.53 to 0.33 (1.53 x 83/380) and # occurrences from 380 to 83.Regime number 8: changed % time from 7.4 to 0.38.Regime number 9: changed % time from 20 to 0.8.Regime number 10: changed % time from 30 to 48.Regime number 11: changed % time from 15 to 5.Regime number 24, 26: changed % time from 0.45 and 0.16 to 0.22(0.03/0.61 x 0.45) and 0.008 (0.03/0.61 x 0.16) (assume "rightturn" & "left turn" are mapped to severe turns).Regime number 23,25: changed % time from 0.45 and 0.16 to 0.030 (0.04/0.61 x 0.45) and 0.010 (0.04/0.61 x 0.16)# occurrences to2900 (3.63 x 800).Regime number 27: changed % time from 3.6 to 2.7.Regime number 30-37: changed % time from 2.72 total to 4.66 total as distributed below:#30 1.71 (1 x 1.71)#31 1.03 (0.6 x 1.71)#32 0.86 (0.5 x 1.71)#33 0.17 (0.1 x 1.71)#34 0.034 (0.02 x 1.71)#35 0.17 (0.1 x 1.71)#36 0.34 (0.2 x 1.71)#37 0.34 (0.2 x 1.71)#64 0.27 (0.16 x 1.71), # occurrences to 684 (400 x 1.71).Regime number 44: changed % time to 0.41 and # occurrences to 492 (120 x 0.4/0.1).Regime number 45: changed % time to 3.63 and # occurrences to 2900 (3.63 x 800).Regime number 47: changed % time to 3.63 and # occurrences to 2900 (3.63 x 800).Regime number 48: changed % time to 3.63 and # occurrences to 2900 (3.63 x 800).Regime number 50: changed % time to 0.41 and # occurrences to 492 (120 x 0.4/0.1).Regime number 51: changed % time to 0.41 and # occurrences to 492 (120 x 0.4/0.1).Regime number 19-22: changed % time from 3.0 total to 0.1 total as distributed below:#19 0.048 (1.45 x 0.033)#20 0.048 (1.45 x 0.033)#21 0.0016 (0.05 x 0.033)#22 0.0016 (0.05 x 0.033)#65,66 0.0073 (0.22 x 0.033), # occurrences to 13 (400 x 0.033).#61 0.253 (3.16 x 0.08), # occurrences to 316 (3.16 x 100).#62 0.0032 (0.04 x 0.08), # occurrences to 4 (.0400 x 100).#63 0.0014 (0.02 x 0.07), # occurrences to 2 (.2 x 80).#67 0.004 (0.066 x 0.06), # occurrences to 7(.066 x 100).#68 0.003 (0.049 x 1.833), # occurrences to 5 (.049 x 100).#60 0.055 (0.03 x 0.033), # occurrences to 13#12 0.011#52,53 0.005 (0.005 x 0. 31), # occurrences to 13 .#53 0.004 (0.22 x 0.033)#40,41 0.005 (0.22 x 0.033).
#89 no basis for change.
87

CAAPuma.xls
Total Time 1085:36:51 %Time Oec/100hrs
Ground 309:04:08SU 3:32:43 0.33%SD 3:54:07 0.36%SG 262:15:51 24.16%TA 39:21:27 3.63%TO 991 91.3TD 991 91.3RS 406 37.4RO 385 35.5
Flight 776:04:00 71.49%Very low speed 21:33:30 1.99%
SH 6:55:19 0.64%YR 0:44:06 0.07%XR 2:21:42 0.22%HR 1:43:09 0.16%HS 0:30:12 0.05%AL 0:40:53 0.06%FL 0:00:18 0.00%BF 0:00:59 0.00%SR 8:31:53 0.79%SL 0:04:59 0.01%TF 899 82.8TH 899 82.8
Forward 747:35:05 68.86%10 0:50:35 0.08%13 1:55:05 0.18%Is 4:08:55 0.38%17 8:40:36 0.80%18 520:55:06 47.98%19 51:39:45 4.76%VE 0:00:47 0.00%VI 0:00:13 0.00%RT 0:21:39 0.03%LT 0:27:08 0.04%CM 29:11:28 2.69%Cl 0:00:21 0.00%AL 0:12:16 0.02%PP 50:32:21 4.66%YR 7:20:55 0.68%XR 1:09:14 0.11%HR 8:50:55 0.82%YR 4:53:19 0.45%XR 0:06:58 0.01%HR 4:27:45 0.41%YR 0:12:29 0.02%XR 0:00:17 0.00%HR 0:10:49 0.02%AD 49:09:13 4.53%HT 1:02:32 0.10%SE 1:14:08 0.11%PU 0:00:16 0.00%
Autorotation 6:55:25 0.64%LT 0:00:22 0.00%RT 0:00:32 0.00%YR 0:19:51 0.03%XR 0:07:11 0.01%HR 0:18:42 0.03%PU 0:00:02 0.00%SA 6:08:45 0.57%EN 600 55.3EX 573 52.8
Undefined77 0:28:43 0.04%
88

FIGURE 3
SUMARY OF RESULTS FROM FIRST 1085 HOURS OF DATA FROM AS332L SUPER PUMA 6-BMCX.
Note: Bad or poor data accounted for a further 31hrs 58mins 46secs. The data recovery rate is 97%.
Time | Percentage | Percentage | | Rate perIFlight Phase of ROTOR | of GROUND Event ROTOR RUN |jCondition f Event Acronym j hh:mm:ss J RUN time I time Count hour
--------------------------------- ------------------------ IIGROUN CONDITIONS GR-Total 09:04:08 28.47
ISpin-Up SU 3:32:43 0.33 1.14ISpin-Down So 3:54: 7 0.36 1.26ISteady Ground SG 262:15:51 24.16 84.85 -
~71+ |Taxying TA 139:21:27 3.63 12.73
-77 ITake-Off Event TO 991 0.91ITouch-0own Event TD 991 0.91
72 |Rotor Start Event RS 406 0.37 |73 1Rotor off Event RO 385 0.35 I
Time I Percentage j Percentage j j Rate perlFlight Phase I.j of ROTOR of AIRBORNE ' Event AIRBORNE ICondition / Event Acronym I'hh.-m:ss j RUN time | time Count, hour------------------------- - - - - - - - - - - -
)TOTAL FLIGHT TIME 76:04:00 71.49 100.00
1VERT LOW SPEED FLIGHT NO-Total 21:33:30 1.99 2.78
it
-- 7
/ 9
ISteady Hover SH 6:55;19 0.64 0.89ILateral Reversal YR 0:44: 6 0.07 0.09Longitudinal Reversal XR 2:21:42 0.22 0.301Directional Reversal HR 1:43: 9 0.16 0.22ISpot Turn HS 0:30:12 0.05 0.06lApproach & Landing AL 0:40:53 0.06 0.09[Flare FL 0: 0:18 :<0.005 <0.005 ,-jBackwards Flight BF 0: 0:59 <0.005 <0.005Right Sideways SR 8:31:53 0.79 1.10 -
ILeft Sideways SL 0: 4:59 0.01 0.01ITransition to Cruise TF 899 1.16ITransition to Hover TH 899 1.16
89
2
Cf

FIGURE 3 (continued)
- . Time
IFlight Phase(Condition / Event Acrony! [ hh:=m:ss
---------------------------IFORWARO FLIGHT CL LE DE-Tot1 747:35:05
LCruise Below 30% VNE 10 0:50:35|Cruise 30% - 50% VNE 13 1:55: 5
K |Cruise 50% - 70% VNE 15 4: 8:55i |Cruise 70% --80% VNE 17 8:40:36
J \O |Cruise 80% - 90% VNE 18 520:55: 6
I f | [Cruise 90% -_100% VNE 19 51:39:45|Cruise 100% - 106% VNE VE 0: 0:47ICruise above 106% VNE Vi 0: 0:13
24
1 -7, -
£7
V £
VqV'V 5-IV1+
Percentageof ROTORRUN time
68.86
0.080.180.380.80
47.984.76
<O.005<0.005
Percentage | Rate perI of AIRBORNE Event AIRBORNE
(time Count jhour
96.33 -
0.11~ A ___
0.250.531.12 [
67.126.66 - -<0.005<0.005
IRight Turn RT 0:21:39 0.03 0.05
Left Turn LT 0:27: 8 0.04 0.0QIClimb at Max Cont Power CM 29:11:28 2.69 3.76|Climb at Int Cont Power CI 0: 0:21 <0.005 <0.005jApproach a Landing AL 0:12:16 0.02 0.03IPartial Power Descent PP 50:32:21 4.66 6.50Lateral Reversal YR [7:20:55 0.68 0.95ILongitudinal Reversal XR 1: 9:14 0.11 0.15.IDirectional Reversal HR 8:50:5V 0.82 1.14|at Rev at 80% VNE YR 4:53:19 0.45 0.63.|Long Rev at 80% VNE XR 0: 6:58 0.01 0.01|Dir Rev at 80% VNE HR 4:27:45 0.41 0.58.jLat Rev at VNE YR 0:12:29 0.02 0.03
|Long Rev at VNE XR 0: 0:17 <0.005 <0.005
|Dir -ev at VNE HR .0:10:49 ... .02 10.02lAcceleration/Decel. AD 49: 9:13 4.53 6.33jModerate Turn MT 0' 0.13
ISingle Engine Operation SE 1:14: 8 0.11 0.16Pull Up PU 0: 0:16 <0.005 <0.005
f Time j Percentage I Percentbge Rate pcrFlight Phase of ROTOR I of AIRBORNE j Event ( AIRBORNECondition / Event Acronym j hh:m:ss J RUN time J time j Count 1 hour
AUTOROTATION AU-Total 6:55:25 0.64 0.89
40
S0
Left Turn LT 0: 0:22 <0.005 <C.005 1IRight Turn- ' RT 0: 0:32 <0.005 <0.005hLateral -Reversal YR 0:19:51 . 0.03 0.04
|Longitudinal Reversal XR 0: 7:11 0.01 0.02.IDirectional Reversal HR 0:18:42 0.03 0.04 -|Pull Up PU 0: 0: 2 <0.005 <0.065|Steady Autorotation SA 6: 8:45 0.57 0.79lEnter Autorotation EN 6...600 0.55lExit Autorotation EX I 573 0.53
Time ( Percentage I Percentage Rate perIFlight Phase of ROTOR of AIR40RNE Event AIRBORNE|Condition / Event Acronym J hh:=:ss J RUN time j time Count hour-------------:----------------------------------------------------------
|UNDEFINED PHASE 77 0:28:43 0.04 0.05 |
V4
|
{
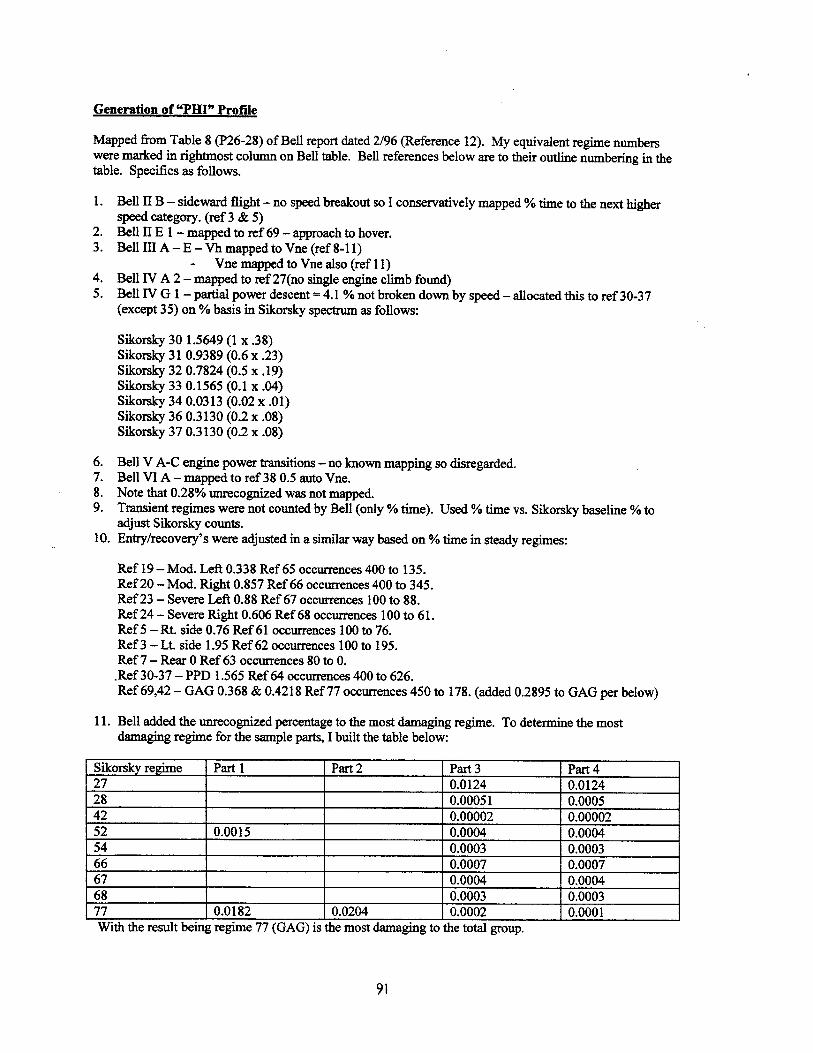
Generation of "PHI" Profile
Mapped from Table 8 (P26-28) of Bell report dated 2/96 (Reference 12). My equivalent regime numberswere marked in rightmost column on Bell table. Bell references below are to their outline numbering in thetable. Specifics as follows.
1. Bell II B - sideward flight - no speed breakout so I conservatively mapped % time to the next higherspeed category. (ref 3 & 5)
2. Bell I E 1 - mapped to ref 69 - approach to hover.3. Bell III A - E - Vh mapped to Vne (ref 8-11)
- Vne mapped to Vne also (ref 11)4. Bell IV A 2 - mapped to ref 27(no single engine climb found)5. Bell IV G 1 - partial power descent = 4.1 % not broken down by speed - allocated this to ref 30-37
(except 35) on % basis in Sikorsky spectrum as follows:
Sikorsky 30 1.5649 (1 x .38)Sikorsky 31 0.9389 (0.6 x .23)Sikorsky 32 0.7824 (0.5 x .19)Sikorsky 33 0.1565 (0.1 x .04)Sikorsky 34 0.0313 (0.02 x .01)Sikorsky 36 0.3130 (0.2 x .08)Sikorsky 37 0,3130 (0.2 x .08)
6. Bell V A-C engine power transitions - no known mapping so disregarded.7. Bell VI A - mapped to ref 38 0.5 auto Vne.8. Note that 0.28% unrecognized was not mapped.9. Transient regimes were not counted by Bell (only % time). Used % time vs. Sikorsky baseline % to
adjust Sikorsky counts.10. Entry/recovery's were adjusted in a similar way based on % time in steady regimes:
Ref 19 - Mod. Left 0.338 Ref 65 occurrences 400 to 135.Ref 20 - Mod. Right 0.857 Ref 66 occurrences 400 to 345.Ref 23 - Severe Left 0.88 Ref 67 occurrences 100 to 88.Ref 24 - Severe Right 0.606 Ref 68 occurrences 100 to 61.Ref 5 - Rt. side 0.76 Ref 61 occurrences 100 to 76.Ref 3 - Lt. side 1.95 Ref 62 occurrences 100 to 195.Ref 7 - Rear 0 Ref 63 occurrences 80 to 0..Ref 30-37 - PPD 1.565 Ref 64 occurrences 400 to 626.Ref 69,42 - GAG 0.368 & 0.4218 Ref 77 occurrences 450 to 178. (added 0.2895 to GAG per below)
11. Bell added the unrecognized percentage to the most damaging regime. To determine the mostdamaging regime for the sample parts, I built the table below:
Sikorsky regime Part I Part 2 Part 3 Part 427 0.0124 0.012428 0.00051 0.000542 0.00002 0.0000252 0.0015 0.0004 0.000454 0.0003 0.000366 0.0007 0.000767 0.0004 0.000468 0.0003 0.000377 0.0182 0.0204 0.0002 0.0001With the result being regime 77 (GAG) is the most damaging to the total group.
91

Table 8. Comparison of Assumed Certification Spectrum and DerivedOperator Spectrum
Spectrum ComparisonFlight Condition
Certification OpFtrator Cond. No
Ground Conditions
A. Rotor Start 0.0000 0.0000 1
B. Ground Tine 0.0000 0.0000 2(RPM 250 - 324)
C. Normal Shutdown 0.0000 0.0000 3W/Coll
II. IGE Maneuvers
A. Hovering
1. Steady @ 314 RPM 1.3000 0.5501 4
2. Steady @ 324 RPM 2.5950 2.2003 5
3. 900 Right Turn 0.0900 0.4330 6
4. 90* Left Turn 0.0900 0.3809 7
5. Cont-ol Reversal
a. Longitudinal 0.0120 0.0331 8
b. Lateral 0.0120 0.0359 9
c. Rudder 0.0120 0.0968 10
B. Sideward Flight
1. Right 0.3250 0.0379 11
2. Left 0.3250 0.0976 12
C. Rearward Flight 0.1300 0.0000 13
D. Norm T/O and Accel to 1.7510 0.1323 14Climb A/S
E. Norm Approach and Land
1. Twin Engine 2.0450 0.5461 15
2. Single Engine 0.0430 0.0084 16
III. Forwaid Level Flight
A. 0.4 VH 314 RPM 0.8000 0.0000 17
324 RPM 0.2000 0.0000 18
92
3
-7
35
y1

Table 8. Comparison of Assumed Certification Spectrum and DerivedOperator Spectrum (Continued)
Spectrum ComparisonFlight Condition
Certification Operator Cond. No.
B. 0.6 VH 314 RPM 2.4000 0.4379 19
324 RPM 0.6000 1.7514 20
C. 0.8 VH 314 RPM 12.0000 0.6736 21
324 RPM 3.0000 2.6945 22
D. 0.9 VH 314 RPM 16.0000 2.2297 23
324 RPM 4.0000 8.9187 24
E. 1.0 VH 314 RPM 30.4000 12.6411 25
324 RPM 7.6000 50.5644 26
F. VNE 314 RPM 0.8000 0.4511 27
324 RPM (1.20%)0 1.8046 28
IV. Power-On Maneuvers
A. Full Power Climbs
1. Twin Engine 4.7500 gig3B50 - 29
2. Single Engine 0.1200 0.0013 30
B. Cyclic Pullups
1. 0.6 VH 0.1500 0.0862 31
2. 0.9 VH 0.0500 0.0182 32
C. Norm Accel from Climb 1.0000 0.0000 33A/S to 0.9 VH
D. Turns
1. Right
a. 0.6 VH 1.0000 1.2422 34
b. 0.9 VH 1.0000 0.2726 35
2. Left
a. 0.6 VH 1.0000 0.4894 36
b. 0.9 VH 1.0000 0.3962 37
93
-7.
10
ii2-3
270
!935-2

Table 8. Comparison of Assumed Certification Spectrum and DerivedOperator Spectrum (Concluded)
Spectrum ComparisonFlight Condition
Certification Operator Cond. No.
E. Cont Rev @0.9 VH1. Longitudinal 0.0500 0.0000 38
2. Lateral 0.0500 0.0000 39
3. Rudder 0.0500 0.0000 40
F. Decel from 0.9 VH to 0.1800 0.0000 41Descent A/S
G. Part Power Descent1. Twin Engine 2.6440 4.1055 427
2. Single Engine 0.1300 0.0323 43
V. Power Transitions
A. Twin to Sin le Engine in 0.0100 0.0003 44Full Power Climb
B. Twin to Single Engine at 0.0100 0.0065 450.9 VH
C. Single to Twin Engine in 0.0100 0.0051 46Power Descent
D. Twin Power to Auto
1. 0.6 VH 0.0050 0.0003 47
2. 0.9 V H 0.0050 0.0001 48
E. Stab Auto to Twin Engine - 0.0100 0.0000 49Norm Auto A/S
VI. Autorotation Flight at VNE(AR)
A. Stab Forward Flight
1. At Min RPM 0.0200 0.0000 50
2. At Max R"vt 0.0200 0.0000 51
B. Turns
1. Right 0.0030 0.0128 52
2. Left 0.0030 0.0071 53
VII. Unrecognized 0.0000 0.28951
TOTAL 100.0000 100.0000
94
G(2
15
3 33<g

Appendix Ill - S-76 Utilization Summary
The attached spreadsheets summarize the S-76 Operator database that the Sikorskycustomer service organization maintains. To protect privacy, only the following fields areincluded and the individual records are simply identified with a sequential number thatcould be traced back into the original database. They are sorted in ascending yearlyaverage hours order within the major groupings of Corporate, Oil/Passenger, and Utility.This data was summarized in figures 15-18 in the text. The major groupings were madeby combining the missions as shown in the spreadsheet. Questionable items wereexcluded as shown in the shaded cells in the sheet.
95

S-76 FLIGHT HOURS
MsinYr
Bef MISSION Summary 87 88 89 90 91 92 93 9 4 95 96 97 98 Average1 VIP Corporate 38 40 10 3 232 CORP Corporate 47 0 69 119 30 80 0 0 130 36 39 29 403 VIP Corporate _ 73 36 554 VIP Corporate 58 65 84 79 82 28 53 14 585 CORP Corporate 10 0 103 68 88 84 104 35 626 CORP Corporate I JR 132 87 44 0 0 179 34 66 17 627 CORP Corporate 285 20 142 40 0 81 0 0 48 688 CORP Corporate 113 163 80 53 76 32 70 18 759 CORP Corporate 134 120 49 0 176 42 69 18 76
10 CORP Corporate 163 72 65 64 43 8111 VIP Corporate 96 142 122 122 27 10 86 0 0 63 152 237 8812 CORP Corporate 151 28 9013 VIP Corporate 175 9 9214 CORP Corporate 103 114 75 84 118 84 125 86 75 62 178 35 9515 CORP Corporate 57 96 48 33 328 17 9716 VIP Corporate 27 168 83 130 144 110 128 135 64 132 34 10517 CORP Corporate 116 137 137 57 89 129 47 90 139 78 213 55 10718 CORP Corporate 137 477 99 5 0 77 99 53 55 88 10919 CORP Corporate 50 33 342 13 10920 CORP Corporate 110 0 240 56 284 92 24 11521 VIP Corporate 252 70 280 99 32 0 0 0 122 113 331 85 11522 CORP Corporate 120 124 272 141 105 64 0 65 225 148 38 11823 CORP Corporate 68 200 125 110 61 34 338 28 12124 CORP Corporate 363 443 321 71 25 36 6 0 32 96 62 39 12425 CORP Corporate 75 178 12726 CORP Corporate 118 167 153 116 80 133 176 109 74 234 138 54 12927 CORP Corporate 15 18 12 10 0 157 542 289 13028 CORP Corporate 75 0 2 72 184 223 281 178 325 88 99 63 13229 CORP Corporate 1 162 103 13330 VIP Corporate 185 107 14631 CORP Corporate 50 147 221 177 14932 CORP Corporate $ r 171 51 59 112 153 146 409 105 15133 CORP Corporate 1 182 125 15334 CORP Corporate 165 208 235 190 236 102 103 91 120 142 197 78 15535 CORP Corporate 233 172 188 304 62 141 33 16236 CORP Corporate 69 132 141 114 127 178 72 53 696 48 16337 CORP Corporate 477 0 6 22 116 171 224 171 239 193 270 68 16338 CORP Corporate 111 114 268 16439 CORP Corporate 215 183 200 214 181 177 125 140 223 179 140 111 17440 CORP Corporate 249 159 316 180 86 118 93 114 97 141 426 110 17441 CORP Corporate 209 259 161 173 30 205 340 144 47 17442 CORP Corporate 60 146 167 188 199 242 234 197 17943 CORP Corporate 148 365 284 255 205 124 162 294 75 45 21 18044 VIP Corporate 40 101 170 396 200 223 291 109 140 208 234 49 18045 VIP Corporate 280 216 216 208 161 145 205 43 18446 CORP Corporate 285 86 18547 CORP Corporate 300 291 139 167 86 263 227 227 222 144 67 104 18648 CORP Corporate 228 274 206 213 219 263 143 122 244 99 81 157 18749 CORP Corporate 345 278 241 178 187 220 158 151 167 98 153 75 18750 CORP Corporate 234 236 335 332 49 181 90 262 295 117 103 27 18851 CORP Corporate 133 218 226 169 234 210 189 217 182 142 19252 VIP Corporate 131 329 329 112 400 70 129 45 19353 CORP Corporate 194 249 216 200 180 178 135 136 206 223 277 141 19554 CORP Corporate 311 308 105 243 131 288 156 47 19955 CORP Corporate 152 222 189 266 245 257 109 0 325 96 89 447 20056 CORP Corporate 182 165 164 201 130 260 226 199 352 289 184 88 20357 CORP Corporate 214 297 100 296 255 354 360 184 128 96 78 91 20458 CORP Corporate 329 204 231 242 196 201 149 132 171 151 398 53 20559 CORP Corporate 100 310 20560 CORP Corporate 161 242 234 255 222 176 147 20561 CORP Corporate 290 258 192 266 292 218 201 193 210 95 174 84 20662 CORP Corporate 199 88 101 82 25 149 80 24 500 454 292 594 21663 CORP Corporate 285 195 149 477 495 196 0 232 42 138 340 88 22064 CORP Corporate 293 250 451 269 273 228 118 144 252 80 124 177 22165 CORP Corporate 269 298 348 278 148 302 154 332 45 78 22566 CORP Corporate 193 276 210 319 140 22767 CORP Corporate 149 310 283 270 176 204 192 150 71 5717 161 231
96

S-76 FUGHT HOURS
Mission. YrBsef MISSION Summnry 87 88' 89 901 91 92 93 94 95 96 9 7 1 98 Average67 CORP Corporate 149 310 283 270 176 204 192 150 71 571 168 CORP Corporate 1371 389 1 253 2091 257 216 130 3 18 5 23169 CORP Corporate 315 51 477 84 23270 CORP Corporate 231 215 205 255 1671 383 175 23371 CORP Corporate 167 233 306 23572 CORP Corporate 89 336 281 23573 CORP Corporate 255 495 461 541 229 153 127 157 138 124 83 133 24174 CORP Corporate 447 421 189 232 212 170 188 235 225 219 217 146 24275 CORP Corporate 129 100 499 2771 299 168 24576 CORP Corporate I _ i i 226 268 24777 CORP Corporate 2041 356 r 1411 357 1791 24778 CORP Corporate 122 2941 2911 259 195 2101 3041 315 2811 216 24979 CORP Corporate 1 22 325 190 24980 CORP Corporate 293 315 246 336 303 235 250 0 502 149 288 126 1 25481 CORP Corporate 1 387 280 2661 2391 2571 415 313] 20 1681 2991 228 127 26582 CORP Corporate 93 188 221 286 348 349 407 246 26783 CORP Corporate {1j2971 2981 2081 26884 CORP Corporate 306 1323 1184 271
85 CORP Corporate 529 509 455 285 349 90 191 10 136 161 323 212 27186 CORP Corporate 571 317 303 301 287 256 250 330 309 231 361 273871 CORP Corporate 189 196 2691 2601 3141 1931 318 7881 -23 242 27588 CORP Corporate 1 57 17 30 200 512] 497-1615-705 468 109 28089 CORP Corporate 307 0 0 171 253 326 371 13391 394 539 633 99 28690 CORP Corporate 602 615 612 720 2331 461 0 1 1 4 15291 72 1 28691 CORP Corporate 114 398 403 402 295 429 166 222 363 85| 28892 CORP Corporate 146 323 383 440 365 378 32 4 2271 20'E 290
C CORP Corporate 274, 350 257 j 29494 CORP Corporate 2721 343] 318 291 480 279 349 275 92 126 440 290 29695 CORP Corporate 1 480 458 1 428] 370 236 235 219 1511 98 29796 CORP Corporate 323 339 2621 330 345 330] 3061 367 1207[ 2501 2751 2441 29897 CORP I Corporate 821 529 197 01 10 299 3441 92 4241 4401 399 143 30898 CORP Corporate 445 409 1 3721 2921 292 285 314 265 296 325 269 180 31299 CORP Corporate _ 274 497 369 608 126 205 337 96 314100 CORP Corporate 374 459 493 452 418 352 170 429 277 273 105 65 322101 CORP I Corporate 393 502 464 460 326 306 355 286 21 148 326102 CORP Corporate 205271 390 460 334 436 |261 337103 CORP Corporate 1 3901 3741 303j 2811 346 419 12431 4971 2581 1821 2521 5251 339104 CORP I Corporate I1 4991 389 3841 322 248 292 280 445 194 339105 CORP Corporate 313 481132912001299 121 1 104 0 511 272 658 795 340106 CORP Corporate 325 459 405t 404 469 505 115 357 92 348107 CORP Corporate f 50 119 314, 6611 377 315 1053 0 207 408 471 390 364108 CORP Corporate 570 542 3391 298 299 272 2961 114 318 2981 377109 CORP Corporate 489 4561 485 227 436 381 3241 4301 3791 359 2351 382110 CORP Corporate 196 540 1553 1307 1329 385S111 CORP Corporate 1 1 360 1413 386112 CORP Corporate 316 582 623 596 547 530 265 366 183 134 163 391113 CORP Corporate 1348 551 539 523 152 162 172 160 255 294 1 260 295 392114 CORP Corporate I 4 1 270' 524 397115 CORP CuI punMe 635 45 272 471 145 60 0 1230[ 120 359 110471 469 404116 CORP Corporate 100 1630 1490 406117 VIP Corporate 587 1399 1274 420118 CORP Corporate 221 552 603 525 309 343 268 6081 643 230 430119 CORP Corporate 313 310 457 440 587 5 18 452 439120 CORP Corporate 602 499 332 326 440121 CORP Corporate 240 1_588 5741 512 486 421 434 592 126 441122 CORP Corporate 56 488 415 566 875 550 390] 477j1231 COHP Corporate 789 196 493124 CORP Corporate 682 567 598 542 488 688 702 141 134 505125 CORP Corporate 675 600 507 502 523 3641 621 641 556 623 446 77 5111262 CORP Corporate 81 5931 651 619 412 511127 CORP Corporate 821 6__24 1 20I7 1 651 362 533128 CORP Corporate 360 825 532 572129 CORP Corporate 504 1872 688 453 629130 CORP Corporate 698 4111 517J 565 111391 5231 642131 CORP Corporate 1 9011 10131 9371 909 8921 8391 12 214 1328 193 1216 951 700132 CORP Corporate 1117 1082 839 1278 584 612 760 0 1761 1 729 18451 423 91913 CORP Corporate 718 1706 11428 1765 1168 1 866 942
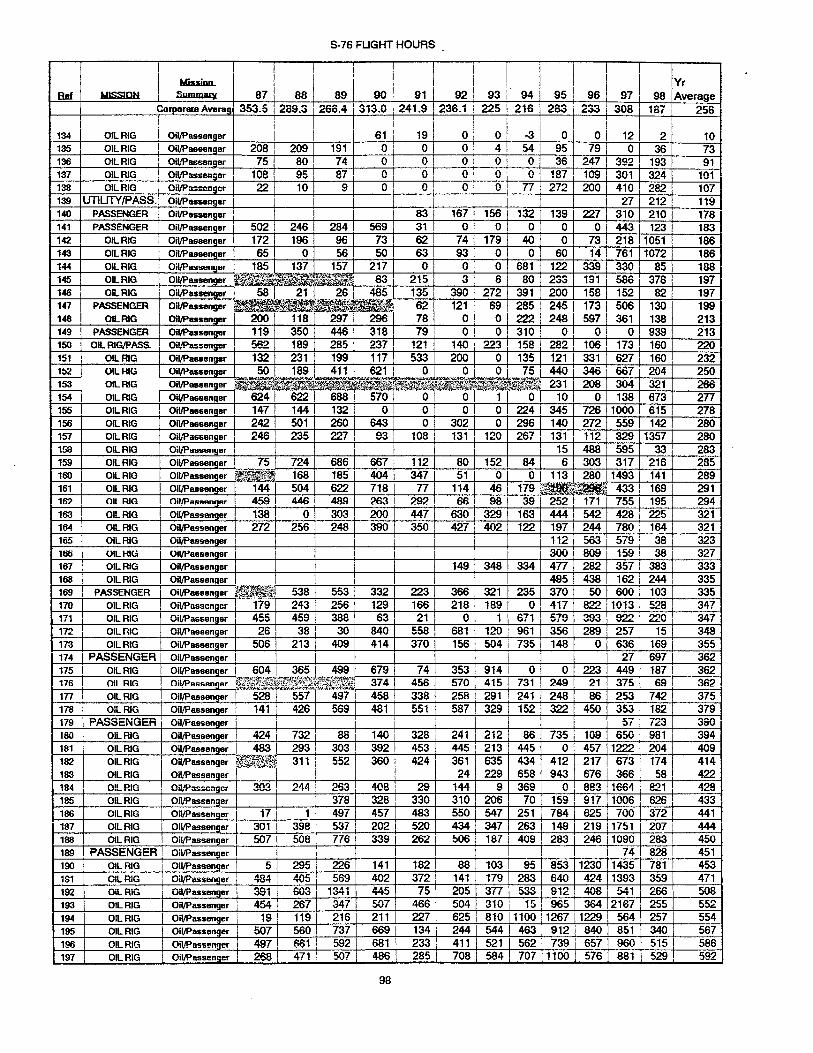
S-76 FLIGHT HOURS
Mission JYref M mISSION _umm 87 _88 89 90 91 92 93 94 95 96 97 98 Average
Corporate Averag 353.5 289.3 266.4 313.0 241.9 1236.1 225 216 283 233 308 1871 258
134 OIL RIG Oil/Passenger 1 61 19 0 0 1-31 0 01 12 2 10135 OIL RIG Oil/Passenger 208 209 19 1 0 0 0 4 54 95 79 0 36 73136 OIL RIG Oi/L'Passenger 175 80 74 0 0 0 0 0 36 247 392 193 91137 OL RIG OiPassenger 108 95 1 87 0 0 0 0 0 187 109 1 301 324 101138 OIL RIG Oil/Passcngcr 22 10 9 0 0 0 0 77 272 200 410 282 107139 UTITY/PASS. Oil/Passenger 27 212 119140 PASSENGER Oil/Passenger 83 167 156 132 139 227 310 2101 178141 PASSENGER Oil/Passenger 502 246 284 569 31 0 0 0 0 0 443 1 123 1 183142 OIL RIG Oil/Passenger 172 196 961 73 62 741 1791 40 01 731 218 110511 186143 OIL RIG Oil/Passenger 1 651 0 561 501 63 93 0 0 60 14 761 1072 186144 OIL RIG Oil/PasSenUger 185 137 157 217 0 0 681 122 339 330 85 188145 OILRIG IOlPassenger 83 215 3 6 80 2331 191 586 378 197146 OILRIG Oil/Passenger 8 21 26 485 135 390 272 391 200 158 152 | 82 197147 PASSENGER Oil/Passenger 4 _62 121 69 285 245 173 506 130 199148 OIL RIG Oil/Passenger 1 297 2 78 0 0 222 248 597 361 138 2131149 PASSENGER Oil/Passenger 119 350 446 318 79 0 0 310 0 0 0 939 213150 OILRIG/PASS. Oil/Passenger 562 189 285 237 121 140 223 158 282 106 173 160 220151 OIL RIG Oil/Passenger 132 231 199 117 533 200 0 135 121 331 627 160 23212 OIL HIG Oil/Passenger 50 1891 411 621 0 00 75 1 440 346 667 204 250153 OIL RIG Oil/Passenger F t 231 208 304 321 266154 OIL RIG Oil/Passenger 624 622 1 688 5700 0 0 o 10 0 138 673 277155 OIL RIG Oil/Passenger 1471 1441 132 1 0 0 0 0 224 3451 726 10001 6151 278156 OIL RIG Oil/Passenger 1 2421 501 260 643 0 3021 0 296 140 2721 5591 142 280157 OIL RIG Oil/Passenger 246 235 2271 93 108 131 120 267 131' 112 329 1357 280158 OIL RIG Oil/PubsungeI 15 488 595 33 283159 OILRIG Oil/Passenger 75 724 6861 667 112 80 152 84 6 303 [ 317 216 285160 OIL RIG Oil/Passenger 168 1 185 404 347 51 0 0 113 1 280 1493 141 289161 OILRIG Oil/Passenger 1441 5041 6221 718 77 1141 46 1 179 RE si 433 169 291162 Oi RIG I it/Pnanngr 459 446 489 263 292 66 98 39 252 1711755 195 294163 OIL RIG Oil/Passenger 138 0 3031 200 4471 630 1329 163 444 542 428 225 321164 OIL RIG Oil/Passenger 272 256 248 390 350 1 427 1 402 122 197 244 780 164 321165 OIL RIG Oil/Passenger 112 563 579 38 32316 OIL HIG I Oil/Passenger ;300 809 159] 38 327167 OIL RIG Oil/Passenger 149 348 J 334 477 282 357 383 333168 OIL RIG Oil/Passenqer 495 1438 162 12441 335169 PASSENGER Oil/Passenger f', 538 553 332 223 366 321 235 370 50 1600 1103 335170 OIL RIG Oil/Passcnger 1 179 243 256 129 166 218 189 0 417 822 11013 528 347171 OIL R % Oil/Passenger 455 4591 388 63 21 0 1 671 579 393 922 2201 347172 OIL IC Oil/Passenger 26 38 30 840 558 681 120 961 356 289 257 115 348173 OIL RIG Oil/Passenger 506 213 409 414 370] 156] 504 7354 148 0 636 169 355174 PASSENGER] Oil/Passenger 27 697 362175 OIL RIG Oil/Passenger 604! 365 1 4991 679 741 3531 9141 01 0 223 449 1871 362176 Oil RIG Oil/Pasanngar 3741 4561 570 1 415 1 731 249 21 375 69 362177 OIL RIG Oil/Passenger 528 557 497 458 338 258 1 291 1 241 1-248! 86 253 742 1 375178 OIL RIG Oil/Passenger 141 426 569 481 551 587 29 1152 322 450 353 182 379179 PASSENGER Oil/Passenger 'I 1 57 723 390180 OIL RIG oil/Passen or 424 732 88 140 328 241 212 86 735 109 650 981 394181 OIL RIG Oil/Passenger 483 293 303 392 453 445 213 445 0 457 11222 204 409182 OILRIG Oil/Passenger 311 552 360 424 361 635 434 412 217 673 174 414183 OIL RIG Oil/Passenger 24 229 658 943 676 366 58 422184 OL RIG Oil/Passengcr 303 244 263 408 29 144 9 3 69 t 0 883 1664 821 428185 OILRIG Oil/Passenger 378 328 330 310 206 70 159 917 1006 626 433186 OIL RIG Oil/Passenger 17 1 497 457 483 550 547 251 1 784 625 700 372 441187 OIL RIG Oil/Passenger 301 398 537 202 520 434 347 263 1 149 219 1751 207 444J188 OIL RIG I Oil/Passenqer 507 I 508 I 7761 339 262 506 1187 409 1 283 246 1090 2831 4501189 PASSENGER oil/Passenger I 1 1 1 74 8281 451190 OIL RIG Oil/Passenger 5 295 226 141 182 88 103 95 853 1230 1435 781 453191 OIL RIG Oil/Passenger 484 405 569 402 3 141 179 283 640 424 1393 359 471192 OIL RIG Oil/Passenger 391 603 1341 445 75 2051 377 533 1912j 408 541 266 508193 OIL RIG Oil/Passenger 454[ 267 347 507 466 5041 310 15 ] 965 364 2167 255 552194 OIL RIG [Oil/Passenger 19 119 216 211 2271 625 1810 1100 11267 1229 564 1257] 554195 OIL RIG Oil/Passenger 507 560 737 669 1341 244 544 4631 912 840 851 340] 567196 OIL RIG I Oil/Passenger 497 661 592 681 I 233 411 521 1 562 I 739 6571 960 515 I 586197 O!L RIG Oil/Passenger 968 471 507 486 285 708 584 1 707 111001, 576' 8811 529 1 592
98

S-76 FUGHT HOURS
Missa.ionII YrBafw MUSmN Summa y 871 88 89 90 91 92 931 941 95 96 97 98 Average198 OiLRIG iassenger 414 924 1 6 7 537 566 00 52 7 412 596199 OIL RIG Oil/Passenger 214 695 465_ 7771 606 623 1607 _337 _332 859 943 701 _ 597
200 OILRIG Oil/Passenger 622 552 8141 374[ 165 6 0 1113 11321 11152 12861 824 602201 OIL RIG Oil/Passenger 731] 691 565 646 407 608202 OIL RIG Oil/Passenger 1 854 735 494 T 652 462 63923 OIL RIG Oil/Passenger 8 12 7 45 715 495 447f 643204 OILRIG Oil/Passenger 132 0 0 0 492 1496 1126 1128 897 14 87 353 10611 681205 OIL RIG Oil/Passenger 2021 706 812 612 544 619 860 677 1219 643 9191 554 697206 OIL RIG Oil/Passenger 1 1052 889 568 43 0 1731 563 16661631 1327 1536 1936 699207 OILRIG Oil/Passenger 462 6311 5751 343 1 653 789 940 128 1293 112711 708208 OILRIG Oil/Passenger 825 284 2701 9861 8441 7441 864 210 1 454 11740 613 690 710209 OILRIG Oil/Passenger 5731 659 6741 795 721 4821 802 726 110601 7081 818 569 71610 OIL IC Oil/Passenger 828 616 602 1114 692 7531 644 804 578 400 982 575 716
211 OIL RIG Oil/Passenger 907 983 897 774 8201 8081 577 456 560 795 673 383 719212 OILRIG Oil/Passenger 767 766 1015 9191 8271 583 11043 11128 656 445 115 486 729213 OIL RIG Oil/Passenger 1 171 8521 659 8391 495 6941 769 1 932 11110 [ 866 [ 839 689 1 730214 OIL RIG Oil/Passenger 1 1 I I I I J 375 [ 993 11045 15171 732215 OILRIG Oil/Passenger 13! 653 820 1 1142 1 737 1 9841 8061 562 1021 777 731 6001 737216 OILRIG Oil/Passenger 248 1111 1014 588 740217 OIL RIG Oil/Passenger 385 688 811 1000 956 107 0 173 417 750 1028 1061 578 743218 OILRIG Oil/Passenger 279 623 0 866 684 1096 1056 7631113 780 1141 549 746219 OIL RIG Oil/Passenger 742 6691 5901 745 617 685 850 779 9871 837 8301 627 747220 OIL - LEASED Oil/Passenger 1438 1070j 1081 622 267 1468 1192 74 391 494 250 638 749221 OIL RIG Oil/Passenger 0 5951 8471 618 848 861 1945 957 1069 1082 983 267 756222 OILRIG Oil/Passenger 4471 7181 8211 2961 293 177 642 11126 11285 11179 1414 746 762223 OIL RIG Oil/Passenger 317 830 11294 612 763224 OIL lC Oil/Passenger 728 __ 936 686 783
225 OILRIG Oil/Passenger 637 821 7661 686 839 1018 465 448 844 919 1566 436 787226 OIL RIG Oil/Passenger 1262 1227 8271 1294 1199 107 427 822 292 1317 396 286 788227 OILRIG Oil/Passenger 7401 805 932 932 932 781 724 9531 705 450 1250 348 796228 OIL RIG Oil/Passenger 1 411 11156 11071 1811 543 798229 OIL RIG Oil/Passenger 963 752 1001 799 1082 656 569 439 460 12191 8941 8311 805230 OIL RIG Oil/Passenger 848 930 1039 8711 10271 1294 1012 1054 353 5411 424 374 814231 OILRIG IOi/Passenger1 570 808 692 83 111 10131 883 493 783 1040 1039 1 5321 819
232 OILRIG Oi/Passenger 482 900 864 850 111 1228 928 1073 568 530 11901 1431 822233 OIL RIG I Oil/Passenger 1514 12021 763 826
234 OILRIG Oil/Passenger 769 847 645 10031 8611 1131 112861 673 7511 497 779 690 828235 OIL RIG Oil/Passenger 201 734 1058 894 1060 966 937 313 1141 892 1255 515 83036 OIL RIG Oil/Passenger 790 606 726 1027 701 8851 831 1061 920 1864 0 559 831
237 OILRIG Oil/Passengert 902 896 781 7721 857 898 744 554 1 142 1021 861 5641 8332 OIL RIG Oil/Passengar 1 841 1033 1273 530 1016 726 823 973 821 1323 1308 365 83623 OIL RIG Oil/Passenger 748 665 670 1089 740 930 866 968 1019 910 960 531 841240 OIL RIG Oil/Passenger 869 755 888 1052 12771 1072 11001 7601 6401 461 7101 542 844241 OILRIG Oil/Passenger 887 I 962 789 573 837 768 851 1 902 I 999 1 755 115711 316 851242 OIL RIG Oil/Passenger 754 469 979 900 964 420 5381 7211 409 1379 11589 11089 851243 OIL RIG Oil/Passenger 1065 1467 1252 1368 1373 1201 38 471 64 1015 926 11531 855244 OIL RIG Oil/Passu 736 1309 1510 1 0 483' 608 720 954 1055 993 1507 42-0 858245 OiLRIG Oii/Passenger 943 1028 1230 1074 1063 I1041 903 ' 459 525 11213 821 0 858
I-1 1 1123011 3117 151 6246 OIL RIG Oil/Passenger 953 489 815 700 933 570 11010 358 1071 1033 1870 521 860247 OIL RIG Oil/Passenger 324 1307 1202 856 968 | 2211 168 1 348 11142 1392 11418 1981 861248 OIL RIG Oil/Passenger 1 609 11040 1002 [1102 5691 864
249 OIL RIG Oil/Passenger 841 846 796 672 812 631 768 1215 1139 424 1850 438 869250 O!L RIG Oil/Passenger 1244 1374 1202 1455 1374 155 38 29 1 42 1080 975 1478 870251 OIL RIG Oil/Passenger 786 1034 881 944 1022 1078 988, 460 1042 999 900 345 873252 OIL HIG ilassenger 754 1215 971 1017 1019 700 762 4171 9271 812 11514 3761 874253 OILRIG Oil/Passenger 297] 9251 724 773 966 3741 7871 842 817 11319 '1669 11064 880254 OILRIG Oil/Passenger I I i _ i _ _ 1 625 1109 11143110231 555 891255 OIL RIG Oil/Passenger 823 772 801 528 772 1 8871 804 11143 9901 78320271 452 898256 OIL RIG Oil/Passenqer 743 894 962 991 1082 1 1081 1 808 1 304 11449 11007 946 5241 899257 OIL RIG Oi/Passenger 515 905 954 122 149 12721 807 1684 11338 11170 110301 90428 OIL RIG Oi/Puassugur 875 987 889 650 811 888 884 1043 1047 724 1728 358' 90729 OIL RIG Oil/Passenger 1 978 855 783 657 807 930 892 901 1925 746 2006 452 911260j OIL RIG Oil/Passenger 756 10541 1085 1032] 1148 1 849 1 994] 224 11265] 845 1174] 534] 913261 OILRIG Oil/Passenger 1379 1066] 856 709 1 591 1 533 11121] 935] 891 1 661 11778 4951 9189f9 Oil RIG I Oil/Pasanngfr 588 869 1303 1183 982 1 875 1 764 1 766 467 1679 11138 470 1 924263 OIL RIG Oil/Passenger 1018 1158 1138 1050 11240 733 1156] 570 ] 963 232 926264 OIL RIG Oil/Passenger 878I 993 758 5.91 839 861 866 1 920 1043 1 733 12218 439 928
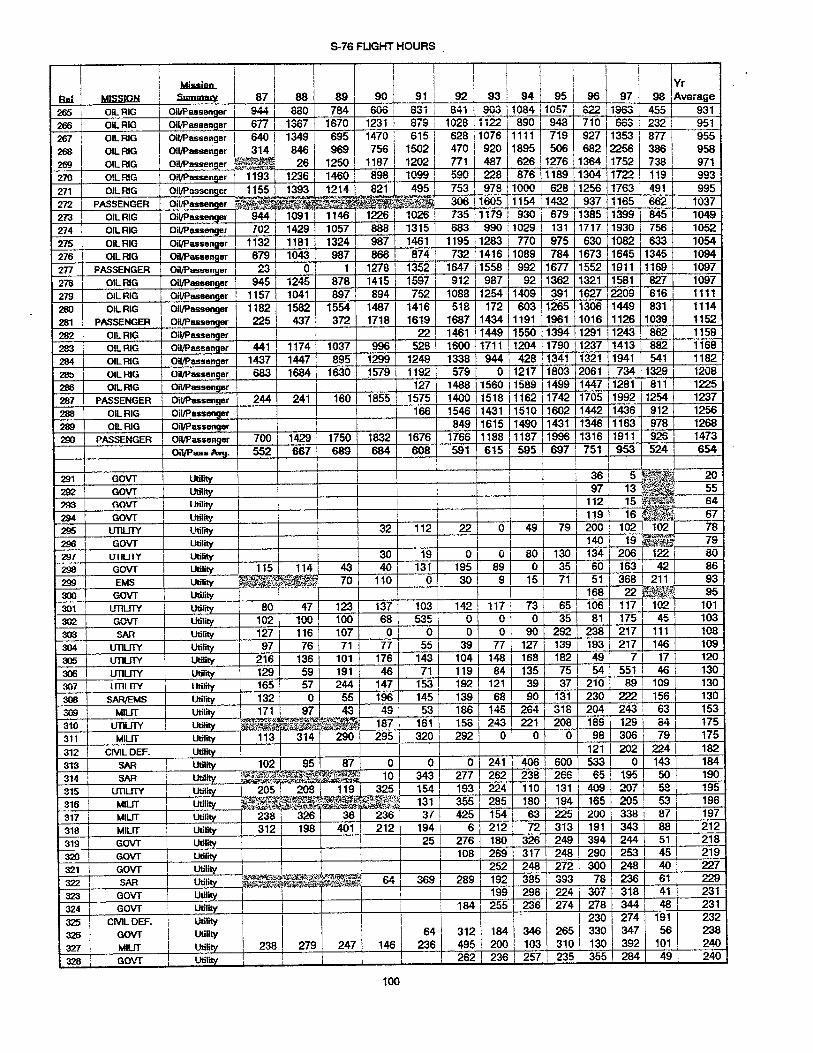
S-76 FUGHT HOURS
Miasin Yr
Baf MISSION 'summary 87 88 89 1 90 91 92 93 94 95 96 97 98 AverageOiL RIG Oil/Passenger 1 944 880 784 606 831 841 903 11084 1057 822 11963 455 931
266 OIL RIG Oil/Passenger 677 1367 1 16701 1231 879 1028 11122 1 8901 948 L 710L 6631 232 951267 OILRIG Oil/Passenger 640 1349 695 14701 6151 628 11076 11111 1 7191 927 113531 8771 955268 OILRIG Oil/Passenger 1 3141 846 969 756 1 1502 1 470 1 920 1895 1 506 1 682 12256 386 958269 OIL RIG Oil/Passenger M 26 1250 1187 | 12021 771 487 626 1276 1364 11752 738 971
270 OIL RIG Oil/Passenger 1 193 1236 1460 898 1099 590 228, 87 6 1 18 9 1130 4 117 221 1191 993271 OIL RIG Oil/Passenger 1155 1393 1214 821 495 753 978 1000 628 1256 11763 491 995272 PASSENGER Oil/Passenger 2i 306 1605 115 4 1432 937 1165 62 1037273 OILRIG Oil/Passenger [ 944 1091 1146 1226 10261 735 111791 930 679 1385 1399 18451 1049
274 OIL RIG Oil/Passenger 702| 1429 1057 1 888 1 1315 6831 990 10291 131 11717 11930] 756 1052275 OILRIG Oil/Passenger 1132 1181 13241 987 1461 1195 11283 | 770 1 9751 630 1082 1633 10541276 OIL RIG Oil/Passenger 679 1043 987 t 8661 874 732 11416 11089 78411673 11645 113451 1094277 PASSENGER OH/Pussenger 23 0 11 1278 1352 1647 1558 1 992 1677 1552 1911 1169 1097278 1 OILRIG Oil/Passenger 945 1245 878 1415 1597 912 987 1 92 [1362 1321 1581 827 1097
279 OIL RIG Oil/Passenger 1157 1041 897 894 752 1088 1254 14091 391 1627 2209 16161 1111280 OILRIG Oil/Passenger 1182 1582 15541 1487 1416 518 172 603 11265 11306 1449 18311 1114281 PASSENGER Oil/Passenger 225 437 372 1718 1619 1687 1434 1191 11961 1016 1126 1039 1152282 OILRIG Oil/Passenger 22 1461 1449 1550 1394 11291 11243 862 1159283 OIL RIG Oil/Passenger 441 1174 1037 996 528 1600 1711 1204 1790 1237 1413 882 1168
284 OIL RIG Oil/Passenger 14 37 1447 895 1299 1249 1338 944 428 1341 1321 1941 541 1182
2M OILHI G Oil/Passenger 6831 1684 1630 1579 1192 579 0 1217 11803 j2061 1 734 1329 1208
286 OIL RIG Oil/Passenger 1 1 127 1 1488 1560 11589 11499 11447 1281 811 1225
287 PASSENGER Oil/Passenger 1 2441 241 160 18551 15751 1400 11518 1162 11742 11705 11992 112541 1237288 OILRIG Oil/Passenger 1 1661 1546 11431 11510 11602 11442 14361 9121 1256
289 OIL RIG Oil/Passenger { 849 1615 11490 11431 1346 11631 9781 1268290 PASSENGER Oil/Passenger 700 1429 1750 1832 1676 1766 1188 1187 19 96 13 16 19 11 926 1473
___ il/P Av . 552 667 689 684 608 591 615 1595 697 751 953 524 654
291 GOVT Utility 36 5 20
GOVT | Utility 97 13 55m GoVT I itility 112 15 64
294 GOVT Utility 119 16 67
295 UTITY Utility 32 112 22 0 49 791 200 102 102 78296 GOVT Utility 1401 19 ?1 7929f ujniY utility 1 301 194 0 0 801 1301 1341 206 122 80298 GOVT Utility 1 115| 114 43 40 131 195 89 0 35 60 163 42 86
2991 EMS Utility g 70 110 0 30 91 151 71 51 368 211 93
300 GOVT Utility 168 22 1795301 UTIUlY Utility 80 47 123 137 103 142 117 73 65 106 117 102 101
302 GOVT Utility 102 100 100 681 535 0 0 01 35 81 175 45 103303 SAR Utility 127 116 107 0 0 0 0 90 292 238 217 111 108
304 UTILY Utility 97 761 71 7 55 391 771 127 139 193 217 146 109
5 UTIUrTY I Utility 2161 1361 101 1761 143 1041 1481 1681 1821 491 7 |17 120
306 UTILTY Utility 1 129 59 1 191 46 71 1191 84 1351 75 154 1 551 1 461 130307 Imi rY utility 165 57 244 147 153 192 121 39 371 2101 89 109 t 130
308 SAR/EMS Utility 1 132 0 55 196 145 139 68 90 131 230 222 156 130
309 MILT Utility 171 97 49 53 186 145 264 318 204 2 63 153310 UTIUTY Utity 187 161 1581 243 221 208 18911291 84 175
311 MIUT Utility 113 314 290 295 320 292 0 0 0 98 306 79 175
312 CIVIL DEF. Utility 1I 121 202 224 182
313 SAR Utility | 1023 951 87 0 0 0 241 406 600 533 0 143 184314 SAR Utility 10 343 277 262 2 238 266 65 195 50 190
315 UTIUTY Utility 2 111 325 1 154 193 224 110 131 409 1207 58 195'3161 MULility 205~ __ 2 4 1 0 13194098316 Mu utility 131 355 285 180 194 165 205 53 196
317 MILT ut ility 238 [ 326 36 236 i 37 4254 1541 63 2251 200 338 87 197318 MiLrr Utility 312 1981 401 212 1 1941 6 12121 72 313 1191 3431 88 212
3191 GOVT I Utility 1 1 251 2761 180 1 326 1249 1394 2441 511 218
320 GOVT Utility 108 1269 317 248 290 253 45 219
321 GOVT utility 252 248 272 300 248 40 227
322 SAR Utility 64 369 289 192 1385 93 78 236 61 229
323 GOVT Utiy 1 _ 199 298 224 307 318 411 231
324 GOVT utility 184 255 236 274 278 344 1_48 231
325 CIVIL DEF. Utility 230 274 191 232
326 GOVT Utility 64 312 184 346 265 330 347 56 238327 MIUT Utility 238 279 2471 146 236 495 200 103 310 130 39291 101 240
328 GOVT Utility . 262 2361 2571 235 355 2841 49 240
100

S-76 FUGHT HOURS
MissinI Yr
E_ MISSiQN Summar 87[ 88 891 902 9 93 941 95 961 97 98 ]Average329 GOVT Utility ' 303 3671 77 369 278 134 231 2 3 201 185 188f 62 244
33 . EMS Utility 256 333 [ 264 255 169 152 293 266 241 377 150 187 245331 GOVT Utility 2081 220 323 244 363 316 51 246332 SAR Utility 103 453] 2341 1901 463 4011 98 259 67 25233 UTIUTY Utility 400' 577 441 I0 0 275 259 260 67 253334 CIVIL DEF. utility t t 277 268 298 178 255
5 EMS utility 25 488 257336 EMS Utility 353 203 4381 1451 741 934 230 74 235 501 737 190 273337 EMS utility 257 256 95 336 245 150 25 421 518 592 343 1961 286m3I SA Utility *g g 296 198 378 I 308 374 164 286
339 EMS Utility 3031 267 195 223 52 406 82 108 303 1 6041 769 133 287340 GOVT utility 397 | 552 4201 5881 5091 131 0 828 1 431 155 1-375 101 287341 MININC Utility 423 3206 205 253 87 461 303 463 390 241 301 143 298342 EMS Utility 377 428 323 219 293 297 311 27 3101 419 343' 236 299343 GOVT Utity 191 123 288 305 181 307 266 300 287 501 238 1647 303344 GOVT utility 201 558 393 228 152 4181 3651 0 868 289 178 7 310345 CIVIL DEF. Utility _ _ 320 353 2731 315346 SAR utility 531 0 517 288 320 3981 01 6121 259 382 1189 318347 EMS Utility^ 302 359 3 3 20 151 159 9 445 551 618 395 207 321
4 U_rY Utility 208 349 446 529 510 180 296 76 324
34 U1 TY Utility 743 531 5261 132 424 379 430 144 160 207 132 126 328350 EMS Utility 422 139 375 1211 427 535 197 918 573 312 11 50 340
_351 EMS Utility 421 423 301 3761 3031 3021 2341 294 | 223 1542 402 265 340
352 _ _EMS utility 241 250 291 412 450 1375 1461 1375 1267 3181 34435 '_UTUTY Utility 290 439 14951 565 499 104 3191 821 349354 ULilLfY utility 1 25 676 3 50
355 CML Dcr. Utility 316 451 402 243 353
356 EMS utility 448 191 341 182 205 68 0 12~ 53 41 451 197 355357 EMS utility __ 88 441 562 411 265 846 1;02 244 2621 358
358 EMS utility 4541 4091 443 299 1282 236 329 0 711 1245 773 11761 363359 EMS Utility 779 1 7631 458 87 164 01 581 3051 304 500 587 509 1 376
360 GOVT utility 138 667 501 253 390361 FMS litility 246 321 400 402 511 449 543 545 332 260 401
362 76 1 1101 1 42 271 204 1 ~ 25 1362 TIm LTY I Utility 3 2201 7615 110 346 615 235 412
3 UTUTY Utility 441 103 538 720 7261 5011 3921 281 392 699 473 251 427
364 EMS Utility 197i 213 152 135 6121 7301 5381 121 206 187 1887 193 431365 UTIULTY utility 01 0 25471 290 1941 2001 98 145 700 434 422 333 447366 EMS Utility 92 53 504 398 587 605 63 350 731 536 1041 438 450367 EMS Utility 494 525 481 689 544 527 0 458 467 582 333 452 463
368 EMS Utility 46 341 579 6041 438 671 665 10 393 1 5391 807 594 474369 EMS utility 121 177 488 626 606 729 424, 610 542 536 634 349 478370 EMS Utility 290 327 498 382 586 481 593 612 645 663 7 206 502
371 EMS Utility 379 275 515 542 640 493 426 505 492 346 1163 13241 508
372 EMS I Utility I 4491 233 875 842 617 433 I 313 1 8181 83 1 37 11275 1 3551 527
373 UTILITY Utility 582 634 561 469 4541 412 1 5201 4751 190 1 402 13731 3541 535374 EMS Utility 302 525 644 507 639 294 477 o 550 4101 538 11345 3471 548375 EMS Utility 395 430 529 420 605 395 258 843 744 686 10354 2891 552376 EMS Utility 407 ' 4761 496 4141 5531 528 475 788 629 637.1051 293 562377 EMS utility 389 5021 548 4221 4961 599 5791 6841 683 1 639 1129 315 582378 EMS Utility 532 1 851 202| 462 552 4701 589 6841 841 796 9151236 594379 UTUTY Utility 636] 11021 750 963 1057 1208 351 335 208 242 217 190 605380 EMS Utility 319 1 409 286 657 7781 676 478 694 706 684 1311 365 614381 UTIUTY utility 274 138 263 533 561 797 1137 997, 886 619 6213 EMS Utility 937 623 584 610 156 463 650 527 529 1314 319 6248 MS Utility 713 458 629 8171 894 245 330 8261 418 39411538 375 636
384 EMS 1 Utility 125 130 604 965 1018 897 1687 945 720 752 1 6141 2471 642
385 EMS Utility 1127 663 1023 1 8931 7671 296 1794 888 485 411 1 335 12741 663386 EMS 1 utility Z- 6661 12641 7611 3181 6411 524 647 6781 3721 1174] 2641 6641387 UTIULTY Utility I I I I 1 1 697 1647 672
388 EMS utility 212' 729 796 644 857 750' 666 940 280' 606 11266 353 67538 UrnuTY Utility 324 239 70 1760 656 1036 714 727 689 50511102 498 693
390 UTILTY utility 302 34 70 987 12751 1418 14741 7721 152 531 11668 569 1 69
391 UTIUTY Utility 754 649 701
392 EMS Utility W 825 1170 1173 1216 659 4721 487] 290] 286 10941 305 725
m9 UIUnTY utility 826 1013 744 915 885 1105 11217 1431 407 910 1689 1440 799
394 UTIUITY Utility 844 1100 1083 942 1020 684 1 735 961 436 , 327 1407 363 825
101

S-76 FUGHT HOURS
i i IYr
Rd MS i Summay 87 88 89, 901 91 92 93 94 95 96 97 98 !Average95 UmitiY utiitry 2158 10021 899 531 7 O 17 918 842 357 343 11137 293 830
396 EMS Utility 4721 987 | 944 845 7511 923 786 | 941 860 561 1509i 421 833
397 UTLrrY Utility 1280 1261 | 824 398 1 943 1319 11183 11628 1679 1343 2148 | 599 1217Utility Avg 379 401 442 389 402 388 322 393 393 356 514 231 358
Grand Ave "2 59 515 5a 4Ee 40 416 42A -48Z M ml 33 1
102

Appendix IV - CAFTA Fault Tree Model
A4.1 Fault Tree Analysis - Qualitative
Following section will briefly walk through the highlights of the fault tree for thestructural usage monitor system. The top-level fault for this fault tree would be a"components structural failure" (G002). There are three different ways to reach thisfailure state. The first would be a basic weakness in the material the part is made of ordamage caused by manufacturing or maintenance. An example of this would be a castingflaw. The second possible cause would be complete overloading of the part during a verystressful maneuver. The third and most likely cause would be the application of too manyload cycles to the part as shown in box (G075). The entirety of the structural usagemonitoring system falls under this fault mode. To reach this state, two things must occur.First there must be a load cycle under count and second this problem must remainundetected for a long period of time (as most parts are designed to last for a number ofyears under reasonably normal usage).
To reach state (G077), the problem must be both an undiscovered system or proceduralerror which was not covered by the software testing, and periodic audits of this system(meant to detect this fault) must have failed. The audits are expected to consist of aperiodic review of database status, quality, and compliance with procedures performed bySikorsky engineering staff.
Returning to (G007), this state can be reached by misapplication of damage calculationsdone by the usage monitoring system. These can take the form of an error posting thedamage (either manual or automated). Both of these functions are considered outside thescope of the usage monitoring system and are done by either manual log cards orautomated maintenance tracking systems.
Another way to undercount loads cycles would be to make an error deriving the correctdamage (GO 11). Even if calculated correctly, the damage data and could be transmittedin error or applied against the wrong part type by the airborne system (G009, G061). Thetransmission error could occur either during file transmission from the on-board system tothe ground station due to a data card transfer error and the failure of its CyclicRedundancy Check (CRC) meant to validate data transfers, or the entire file could be lostwithout detection (G009). Damage could be applied against the wrong part type eitherdue to a software error by the module that maintains aircraft configuration or a userentered configuration error (G06 1). The manual entry error would be a combination of amechanic error entering a new configuration and that the part that he is incorrectlyentering is a legal part for this aircraft model (G066).
103

Returning to the damage derivation error, which is the key function of structural usagemonitoring (GO 11), could be caused by a regime being incorrectly identified or themapping between regimes and damage being incorrect (GO 15). The mapping could beincorrect due to a bad damage mapping table (G033) or incorrect transmission of thistable from the ground system to the on-board system (G034).
Failure of regime recognition (G 014) could be due to bad sensor data, incorrect regimedefinition table, incorrect recognition algorithms or the malfunction of the regimerecognition software. Starting with this simpler branch, the regime definition table couldbe incorrect (GO 17) due to an incorrectly defined regime table or a correct table beingincorrectly transmitted to the on-board system from the ground station due to datatransmission error and simultaneous failure of the CRC check (G028). An incorrectregime definition table (G027) could be due to manual logic error in defining the regime,and simultaneous failure of the automated consistency checks in the definition software,and failure of the bench and flight tests to find this error.
Returning to sensor data incorrect (GO 16) this could be caused by an undetected sensormalfunction or less likely an undetected malfunction of the HUMS processor due tofailure of the signal conditioning processor and the fault detection system designed todetect that failure. To reach the detected sensor malfunction state (G020) you need both asensor hardware failure and a failure of the software and hardware to detect that failure(G024). The sensor hardware failure could occur in any of the systems that are feedingthe usage monitoring function. While the fault tree has not included all possible sensorsystems, several systems have been shown as examples. The pitch sensor wire failure(G041) could occur due to failure of the wire as a short, open, intermittant or any errorduring maintenance such as miswiring or faulty repairs (G050). The failure of the pitchsensor system could be either in the high state or low state. Some feeding sensors areredundant such as the attitude heading reference system and thus would require failure ofboth systems to provide bad data to the usage monitor (G05 1). The weight-on-wheelssensor could fail in either the open or closed position (G053). Finally the air datacomputer is also a redundant system and would require failure of both to provide bad data(G054).
A4.2 Cutsets and Basic Events
Attached are the CAFTA system output of analyzed cutsets and a listing of the basicevents. The probabilities are just filler values needed to get the system to output itsanalysis and have no significance in the analysis. These were the basis of Tables IV andV in the text.
104

Material Weakness Part Overloaded
It t~li
Damage Posting Error(incorrect amount orwrong component)
Manual Posting ISystem AutmatdPosting
-- Systm
Pitch Sensor Wire Pitch Sensor Failure Sensor Databus FailureFailure - Attitude Heading
Reference System(AHRS)
G041 G042 G051
Sensor Wire Fails - Short Sensor Wire Fails - Sensor Wire Sensor Wire has Sensor Fails - Low Sensor Fails - High Sensor Databus Failure Sensor Databus FailureOpen Miswired/Misrepaired intermittant Failure- Attitude Heading - Attitude Headling
Reference System 1 Reference System 2(AHRSt) (AHRS2)
G044 G050 ~~G081G45G6G5758
Too Many Load Cycles Damage Mapping Damage TaTable Incorrectly Incorrectly T
Defined to O
G075
Load Cycle Problem UndetectedUndercount for Long Period (>1
year)
G007
Page 5
Sensor Dabt Incorrect
Undetected Sensor Undetected ProcessorMalfunction Malfunction
G020 G021
Sensor Hardware Data Quality Check Signal Fault Detection SystemFalture Malfunctions Conditioning/Processor Fails
Failure
G023
6 7 IIQ~
TITLE
Structural Usage System LevelFault Tree
DRAWING NUMBER
Page 1DATE
5/24/99
Component StructuralFailure
G002
Damage Derivation Damage Data Damage AppliedError (by component Transmittal Error Against Wrong
type by mode) PartType
G011IItI
Page 3 Page 4
Regime Incorrectly Regime to DamageIdentified Mapping Incorrect
GOtAGt
G0148
Pe?
Regime Definition Regime Recognition Cc i e R ecognitionTable Incorrect Algorithms Incorrect SW Malfunctions
G029 G30GG17 G018 G03 9
Regimeefintion Table Data IncorrectlyTable Incorrectly Transmitted to OBS
Defined
G027 G028
Manual Logic Error Automate Bench/Flight Test Data Data Transmission Error Cyclic RdnacConsistancy Checks Failed to Identify Error Check CC al
Sensor Databus Failure-Air Data Computer
Sensor Databus Failure Sensor Databus Failure- Air Data Computer -Air Data Computer 2
G055t
2 3 4 I 5 I 8 9 10 11 12 13 14
I
I I
I
WOW Sensor Falure
Sensor Fails -Open Sensor Fils - Closed
9IG60
1 I 76

Appendix V - Extract from FAR 29.1309Equipment, Systems and Installations
The following extract from Federal Aviation Regulations, Part 29 rev. Dec. 1996 is thebasis of FAA requirements on the HUMS system. The key sections are highlighted inBOLD and indicate that any system failure that creates hazard must be unlikely and that asafety assessment is required.
Sec. 29.1309 Equipment, systems. and installations.
"(a) The equipment, Systems, and installations whose functioning is required by thissubchapter must be designed and installed to ensure that they perform their intendedfunctions under any foreseeable operating condition.(b) The rotorcraft systems and associated components, considered separately and inrelation to other systems must be designed so that--
(1) For Category B rotorcraft, the equipment, systems, andinstallations must be designed to preventhazards to the rotorcraft if they malfunction or fail; or(2) For Category A rotorcraft-
(i) The occurrence of any failure condition which would preventthe continued safe flight and landing of the rotorcraft is extremely
improbable; and(ii) The occurrence of any other failure conditions whichwould reduce the capability of the rotorcraft orthe ability of the crew to cope with adverse operatingconditions is improbable.
(c) Warning information must be provided to alert the crew tounsafe system operating conditions and toenable them to take appropriate corrective action. Systems,controls, and associated monitoring andwarning means must be designed to minimize crew errors whichcould create additional hazards.(d) Compliance with the requirements of paragraph (b)(2) of this section must beshown by analysis and, where necessary, by appropriate ground, flight, orsimulator tests. The analysis must consider-
(1) Possible modes of failure, including malfunctions and damagefrom external sources;(2) The probability of multiple failures and undetected failures;(3) The resulting effects on the rotorcraft and occupants,considering the stage of flight and operating
106

conditions; and(4) The crew warning cues, corrective action required, and thecapability of detecting faults."
107

Appendix VI - Extract from HUMS FunctionalHazard Assessment
The key statements from the FHA are presented along with descriptions of their safetyimplications. This is another source of derived safety requirements and they arehighlighted in bold font and explained in parenthetical statements below the affected text.
The basic organization of the FHA document is as follows:
Description of the functionWorst case failure effectPossible mitigating actionsProposed software criticality levels (per DO178B)
There are three sections (renumbered to 1-3 for simplicity) here that deal with differentaspects of the usage monitoring function. The first assumes that the data will be recordedover a long period of time and that Sikorsky will only use the data to statistically changethe baseline assumed spectrum and thus change fleetwide part lives. The second assumesthat regime data will be used for automated life adjustments but only deals with theregime gathering function. The last section deals with the damage calculationsthemselves.
"STRUCTURAL USAGE MONITORING
The following functions pertain to structural usage monitoring by the HUMS. Note that onlyregime data gathering will be certified initially and component retirement calculations will becertified in the future as part of a controlled service introduction.
1.0 Regime Data Gathering for Fleetwide Life AdjustmentsThe HUMS airborne system will accumulate time and number of occurrences for each definedflight regime (usage spectrum) as well as the sensor data that was used to determine the usagespectrum. This data will be sealed with an error checking protocol and downloaded to thegroundstation for display and archive. It will subsequently be provided to Sikorsky for thepurpose of evaluation of actual helicopter usage. Sikorsky can use this data statistically torecalculate retirement lives for a subset of the aircraft fleet based on actual usage instead ofpredefined usage.(note that the seal will be done with multiple CRC's and the raw sensor data can be used torecalculate usage on the groundstation with dissimilar hardware and software although thealgorithm will be the same)
1.1 Worst Case Failure Effect Without Mitigating Action
108

In the event that the HUMS on a fleet of aircraft erroneously records time and cycles for one ormore regimes and this error goes undetected by the engineer completing the life calculations,the worst case failure effect would be the incorrect specification of a fleetwide life adjustment fora component on that aircraft type. This could subsequently leave components in service beyondan appropriate retirement time, reducing their structural reliability margin. The baselinecriticality level for the airborne function would be C - Major hazard due to a potentiallysignificant reduction in fleetwide structural reliability.(here we rely on basic engineering judgement and practices of crosschecking results with otherexperience and data sources)
The baseline criticality level for the groundstation function would be D - Minor hazard becauseimproper functioning or loss of this function will not have significantly reduced aircraft safety.
1.2 Mitigating ActionNone required.
The data seal can be manually verified at the time the data is imported into the database orused. The data can be examined by the engineer that uses it for calculating retirement times.Missing regime data will be compensated for by assuming conservatively that regime usageduring a period for which data are missing would be proportional to the worst case compositeregime usage rate currently used to manually determine component retirement times. Data addedto the usage database will be subjected to a periodic reasonableness check by Sikorsky.(this implies that the original sealed file be sent to Sikorsky for reprocessing and that it isdesigned to be relatively self contained regarding embedded identifying information)
Note, regime data gathering does not change how components are currently lifed unless Sikorskydecides to change a fleetwide component life based on looking at the usage data statistically.
1.3 Software Criticality Level With Mitigating ActionThe software criticality level proposed for the airborne function is DO-178B, Level C.The software criticality level proposed for the GSS function is DO-178B, Level D.
1.4 Software Criticality Level JustificationThe justification for the assignment of DO-178B Level C Major Hazard is due to a potentiallysignificant reduction in fleetwide structural reliability. The justification for the assignment ofDO-178B Level D criticality to the GSS portion of this function is the determination thatundetected improper functioning or loss of this function may reduce the fleetwide structuralreliability margin of one or more components on the aircraft by a slight amount. Theconservative assumption for missing data and periodic reasonableness checks of data added tothe database will minimize risk of statistical distortion of the usage database.
2.0 Regime Data For Component Retirement CalculationsThe HUMS airborne system will accumulate time and number of occurrences (same as Section1.1) for each defined flight regime (usage spectrum) as well as the sensor data that was used to
109

determine the usage spectrum.. This usage spectrum data will be used by the componentretirement calculations function (See Section 3.0) to adjust component life based on actual usage.This data will be sealed with an error checking protocol and downloaded to the GSS for displayand archive.
2.1 Worst Case Failure Effect Without Mitigating ActionIn the event that the HUMS on one aircraft erroneously records time and cycles for one or moreregimes, the worst case failure effect would be the incorrect specification of a life adjustment fora component on that aircraft. This could leave a component in service beyond an appropriateretirement time, reducing it's structural reliability margin. The baseline criticality level for theairborne function is B - Hazardous/Severe Major Hazard due to large reductions in structuralreliability margins.
The baseline criticality level for the groundstation function would be D - Minor Hazard becauseimproper functioning or loss of this function will not have significantly reduced aircraft safety.
2.2 Mitigating ActionsNone required.
Note, the following system design and procedural safeguards will ensure that potential systemfailures are detected and compensated for correctly. Flight time will be recorded by HUMS(section 8.1) and used to determine if some regime data is missing. Missing regime datawould be compensated for by assuming conservatively that usage during a period forwhich data are missing would be proportional to the worst case composite usageaccumulation rate currently used by Sikorsky to evaluate component retirement times. Toprotect against deficiencies in regime definitions or unexpected uses of the aircraft, dataadded to the component usage database will be subjected to a periodic reasonablenesscheck by Sikorsky. Revisions to regime definition tables may require recalculation ofaccumulated usage to date from stored/archived sensor data. In this event, therecalculation will be completed on a groundstation with approved procedures underSikorsky supervision.(use of clock time implies a reliable, battery-backed clock on the airborne unit. The Sikorskyoversight function has been discussed already. A method to safely batch process a potentiallyhuge amount of archived raw data needs to be developed and due care in regime definition andverification must be taken to minimize the need for this potentially difficult process)
2.3 Software Criticality Level With Mitigating ActionThe software criticality level proposed for the airborne function is DO-178B, Level B. Note thata failure modes and effects analysis for this function will be provided at a later time.
The software criticality level proposed for the GSS function is DO-178B, Level D.
2.4 Software Criticality Level JustificationThe justification for the assignment of DO-178B Level B criticality to the function is thedetermination that improper functioning, loss of this function may significantly reduce thestructural reliability margin of one or more components on individual aircraft. This would not
110

significantly affect overall fleet reliability. The justification for the assignment of DO-I 78BLevel D to the GSS function is the determination that improper functioning or loss of thisfunction will not have significantly reduced aircraft safety.
3.0 Component Retirement CalculationsFor selected components, the airborne system will apply usage spectrum data to calculateexpected retirement times by applying calculations that translate the usage spectrum (See Section2.0) to life used during this flight for each component type. Life decrements (in equivalent flighthours) for each component type and failure mode will be calculated in the airborne system. Thisdata will be sealed with an error checking protocol and stored to the data card for transfer to theGSS. The GSS will be able to display the results, pass the results to some external system andarchive the results. A separate manual or automated function may accumulate component life.and track components.
3.1 Worst Case Failure EffectIn the event that the airborne system provides erroneous calculations of component retirementtimes, the worst case failure effect would be incorrect specification of life adjustment whichcould leave a component in service beyond an appropriate retirement time, significantly reducingit's structural reliability margin. The baseline criticality level is B - Hazardous/Severe MajorHazard due to the significant decrease in structural reliability.
The baseline criticality level for the groundstation function would be D - Minor Hazard becauseimproper functioning or loss of this function will not have significantly reduced aircraft safety.
3.2 Mitigating ActionsNone required.
Note, the following system design and procedural safeguards will ensure that potential systemfailures are detected and compensated for correctly. A component life adjustment limit foreach component, based on some multiple of the current component retirement timerecommended by Sikorsky, will be put in place to minimize the possible reduction instructural reliability margin. To protect against deficiencies in damage mapping definitionsor systemic data processing errors, data added to the component lifing database will besubjected to a periodic reasonableness check by Sikorsky. Revisions to damage mappingtables may require recalculation of accumulated usage to date from stored/archived usagespectrum data. In this event, the recalculation will be completed on a groundstation withapproved procedures under Sikorsky supervision.(the time extension limit is intended as a "catch all" for potentially runaway calculations and isdiscussed under the Monte Carlo section below. Sikorsky oversight described previously.Recalculation of damage alone is much easier that regime changes as the input to the process issimply the regime spectrum and a spreadsheet-like calculation.)
3.3 Software Criticality Level With Mitigating Action
111

The software criticality level proposed for the airborne function is DO-178B, Level B. Note thata failure modes and effects analysis for this function will be provided at a later time.
The software criticality level proposed for the airborne function and the GSS function is DO-178B, Level D.
3.4 Software Criticality Level JustificationThe justification for the assignment of DO-178B Level B criticality to the airborne portion of thisfunction is the determination that improper functioning or loss of this function may significantlyreduce the structural reliability margin of one or more components on individual aircraft. Thiswould not significantly affect overall fleet reliability. The justification for the assignment ofDO-178B Level D to the GSS function is the determination that improper functioning or loss ofthis function will not have significantly reduced aircraft safety."
112