Embed Size (px)
Citation preview

SYSTEM DYNAMICS and SYSTEM DYNAMICS and Systems ThinkingSystems Thinking
developed by James R. Burnsdeveloped by James R. Burns

Prepared by James R. Burns
Why????Why????
Because of the frenetic increases Because of the frenetic increases in complexity—society is becoming in complexity—society is becoming increasing complex and we need increasing complex and we need tools to cope with ittools to cope with it
This is certainly true in the IS/IT This is certainly true in the IS/IT arena as wellarena as well

Prepared by James R. Burns
Coping toolsCoping tools
Causal modelingCausal modeling SimulationSimulation
• Discrete stochastic (Promodel)Discrete stochastic (Promodel)• Continuous deterministic (Vensim)Continuous deterministic (Vensim)

Prepared by James R. Burns
System Dynamics and System Dynamics and VensimVensim
A tutorial on Vensim is provided at A tutorial on Vensim is provided at the end of Chapter 6 in your copy the end of Chapter 6 in your copy packet, beginning on page 35 of packet, beginning on page 35 of that chapterthat chapter

Prepared by James R. Burns
Dynamic problems Dynamic problems appropriate for Vensim appropriate for Vensim (rather than promodel)(rather than promodel)
There is change over timeThere is change over time The changing character of the The changing character of the
situation IS THE PROBLEMsituation IS THE PROBLEM The problem should be studied in The problem should be studied in
aggregatesaggregates The problem does not have a The problem does not have a
significant stochastic component or significant stochastic component or complexion to itcomplexion to it

Prepared by James R. Burns
Start with descriptions of Start with descriptions of the followingthe following
PURPOSEPURPOSE PERSPECTIVEPERSPECTIVE PROBLEMPROBLEM MODEMODE

Prepared by James R. Burns
What are we doing What are we doing here????here????
Attempting to characterize, cope Attempting to characterize, cope with and understand complexitywith and understand complexity• Especially DYNAMIC complexityEspecially DYNAMIC complexity
Inventing a physics for a systems Inventing a physics for a systems or processes for which there exists or processes for which there exists no physicsno physics• You get to become a Newton, a You get to become a Newton, a
Liebnitz, a Galileo, an Einstein, a ….Liebnitz, a Galileo, an Einstein, a ….

Prepared by James R. Burns
StepsSteps
Be problem-drivenBe problem-driven Interview people familiar with the problem Interview people familiar with the problem Gather verbal descriptions of the problemGather verbal descriptions of the problem Formulate a list of variablesFormulate a list of variables Develop a causal loop diagramDevelop a causal loop diagram Develop a stock-and-flow diagramDevelop a stock-and-flow diagram Create a working simulation in VENSIMCreate a working simulation in VENSIM

Prepared by James R. Burns
How many of you have used How many of you have used a model to solve a problem a model to solve a problem or make a decision?or make a decision? You’ve been through this drill You’ve been through this drill
before!before! All of you have….all of the time!All of you have….all of the time!

Prepared by James R. Burns

Prepared by James R. Burns
Uses to which these Uses to which these models can be putmodels can be put
What IF experiments—hands on What IF experiments—hands on experimentationexperimentation
Decision makingDecision making• PlanningPlanning• Problem solvingProblem solving• CreativityCreativity• Out of the box thinkingOut of the box thinking
Hypothesis testingHypothesis testing Finding leverage points, points of Finding leverage points, points of
interventionintervention LEARNINGLEARNING

Prepared by James R. Burns
Some notation--Some notation--
CLD – Causal Loop DiagramCLD – Causal Loop Diagram SFD – Stock-and-Flow DiagramSFD – Stock-and-Flow Diagram BOT – Behavior Over Time ChartBOT – Behavior Over Time Chart

Prepared by James R. Burns
A CLD of the US energy A CLD of the US energy systemsystem

Prepared by James R. Burns
Coal
U.S. Oil
Foreign Oil
U.S. Natural Gas
Foreign Natural Gas
Uranium
Solar
Electric Utilities
Transportation
Residential/commercial
Industrial
SOURCES CONSUMPTION SECTORS
biofuels
Wind
Geothermal
Hydropower
A roadmap for the U.S. energy system

Prepared by James R. Burns
BOT—Behavior Over Time BOT—Behavior Over Time chartchart
For US energy marketFor US energy market
Prepared by James R. Burns
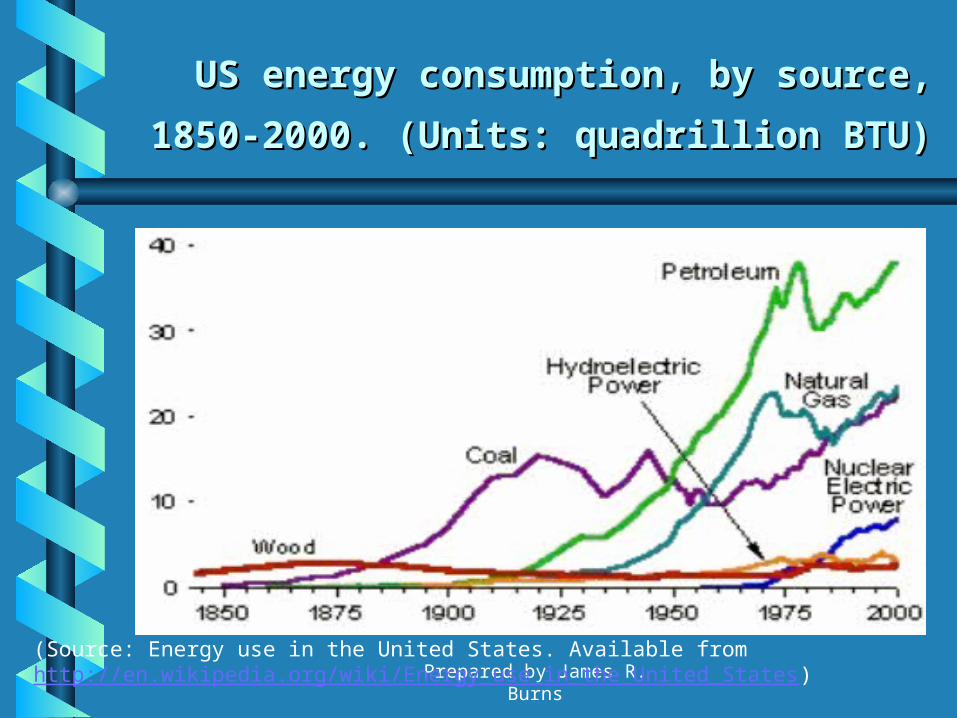
US energy consumption, by source, US energy consumption, by source,
1850-2000. (Units: quadrillion BTU)1850-2000. (Units: quadrillion BTU)
(Source: Energy use in the United States. Available from http://en.wikipedia.org/wiki/Energy_use_in_the_United_States)

Prepared by James R. Burns
From CLD to SFDFrom CLD to SFD
A B+
A B-vs.
Stockoutflowinflow
0tStock dsOutflow(s)-Inflow(s))(Stock 0
tt
t
System dynamics modelSystem dynamics modelCausal loop diagramCausal loop diagram
Stock-and-flow diagramStock-and-flow diagram
Mathematical representation for stock:

Extraordinary Extraordinary Organizations…Organizations…
Are those that engage people’s Are those that engage people’s commitment and capacity to learn at commitment and capacity to learn at all levels in the organizationall levels in the organization
Will recognize that the only truly Will recognize that the only truly sustainable competitive advantage is sustainable competitive advantage is the rate at which organizations learnthe rate at which organizations learn
Nothing compares to the exhilaration Nothing compares to the exhilaration that comes from working within that comes from working within learning orgs.learning orgs.

Ordinary Organizations….Ordinary Organizations….
Learn slowly if at allLearn slowly if at all Characterize an organization that Characterize an organization that
you are aware of…..you are aware of…..

Disciplines of the Learning Disciplines of the Learning OrganizationOrganization
Personal MasteryPersonal Mastery Mental ModelsMental Models Shared VisionShared Vision Team (Organizational) LearningTeam (Organizational) Learning Systems ThinkingSystems Thinking

Personal MasteryPersonal Mastery
Continually clarifying and Continually clarifying and deepening our personal visiondeepening our personal vision
Getting better at what we do bestGetting better at what we do best

Mental ModelsMental Models
Deeply engrained assumptions, Deeply engrained assumptions, generalizationsgeneralizations

Shared VisionShared Vision
Where there is genuine vision, Where there is genuine vision, people excelpeople excel
““Where there is no vision the Where there is no vision the people perish”people perish”

Team LearningTeam Learning
The The synergysynergy of teams is of teams is
the ultimate exhilarationthe ultimate exhilaration Some people, having experienced Some people, having experienced
it once, spend the rest of their it once, spend the rest of their lives looking for itlives looking for it

Systems ThinkingSystems Thinking
All human endeavors are systemsAll human endeavors are systems

The Fifth DisciplineThe Fifth Discipline
IS, OF COURSE, SYSTEMS IS, OF COURSE, SYSTEMS THINKINGTHINKING
Subsumes and permeates all of the Subsumes and permeates all of the other disciplinesother disciplines
By enhancing the other disciplines, it By enhancing the other disciplines, it continually reminds us that the whole continually reminds us that the whole can exceed the sum of its partscan exceed the sum of its parts
But ST also needs the other four But ST also needs the other four disciplines to realize its full potentialdisciplines to realize its full potential

Metanoia--A shift of MindMetanoia--A shift of Mind
The recreation of ourselves through The recreation of ourselves through learninglearning
Becoming able to do something we Becoming able to do something we never were able to donever were able to do
Re-perceiving the world and our Re-perceiving the world and our relation to itrelation to it
Extending our capacity to createExtending our capacity to create There is within each one of us a deep There is within each one of us a deep
hunger for this type of learninghunger for this type of learning

Putting the Ideas into Putting the Ideas into PracticePractice
SENGE: The greatest societal SENGE: The greatest societal problem facing us today is the problem facing us today is the increased complexity of our systemsincreased complexity of our systems
FORRESTER: Systems are FORRESTER: Systems are counterintuitive. Consequently, counterintuitive. Consequently, naïve policy makers implement naïve policy makers implement policies that have just the opposite policies that have just the opposite of their intended effectof their intended effect

Senge’s MetanoiaSenge’s Metanoia
Originally, he was interested only in Originally, he was interested only in public sector problemspublic sector problems
But then corporate leaders came to him But then corporate leaders came to him for helpfor help• These were thoughtful people, deeply aware These were thoughtful people, deeply aware
of the inadequacies of their own of the inadequacies of their own organizationsorganizations
• All shared a commitment and capacity to All shared a commitment and capacity to innovate that was lacking in the public innovate that was lacking in the public sectorsector

Who were these people???Who were these people???
William O’Brien of Hanover InsuranceWilliam O’Brien of Hanover Insurance Edward Simon from Herman MillerEdward Simon from Herman Miller Ray Stata, CEO of Analog DevicesRay Stata, CEO of Analog Devices Trammel CrowTrammel Crow Arie De Geus of Shell Oil CoArie De Geus of Shell Oil Co Leaders from Apple, Ford, Polaroid, Leaders from Apple, Ford, Polaroid, 4000 Managers who attended the 4000 Managers who attended the
Innovations Associates workshops over Innovations Associates workshops over eleven yearseleven years

““I am my Position”I am my Position”
We are trained to be loyal to our jobs—so much We are trained to be loyal to our jobs—so much so that we confuse our job with our personal so that we confuse our job with our personal identity.identity.
Most people see themselves within a system Most people see themselves within a system over which they can exercise little controlover which they can exercise little control
There is a kind of myopia in American There is a kind of myopia in American organizations that causes individual workers to organizations that causes individual workers to focus only on their small part rather than on the focus only on their small part rather than on the larger system as a wholelarger system as a whole
APICS is trying to address this problemAPICS is trying to address this problem We need to see ourselves in the context of the We need to see ourselves in the context of the
larger systemlarger system

““The Enemy is out There”The Enemy is out There”
Generally, we tend to see the problem Generally, we tend to see the problem as outside usas outside us• ““no one can catch a ball in that darn field…”no one can catch a ball in that darn field…”
““Thou shalt always find an external Thou shalt always find an external agent to blame”agent to blame”• Marketing blames manufacturing—quality is Marketing blames manufacturing—quality is
poor, due dates are missed, etc.poor, due dates are missed, etc.• Manufacturing blames EngineeringManufacturing blames Engineering• Engineering blames MarketingEngineering blames Marketing
““The Enemy is out there” The Enemy is out there” is actually…is actually…
A byproduct of “I am my position…”A byproduct of “I am my position…”• Because of the non-systemic ways of Because of the non-systemic ways of
looking at the world that it fosterslooking at the world that it fosters• When we focus only on our position, we When we focus only on our position, we
do not see how our actions extend do not see how our actions extend beyond the boundary of that positionbeyond the boundary of that position
• When those actions have When those actions have consequences that go beyond our consequences that go beyond our position, they come back to hurt usposition, they come back to hurt us

““The Enemy is out there” The Enemy is out there” manifests itself with manifests itself with statements like..statements like..
the Japanese are killing usthe Japanese are killing us The labor unions are killing usThe labor unions are killing us The government regulators are The government regulators are
killing uskilling us But this is always an incomplete But this is always an incomplete
story that fails to recognize that story that fails to recognize that “out there” and “in here” are parts “out there” and “in here” are parts of the SAME SYSTEMof the SAME SYSTEM

The Illusion of Taking The Illusion of Taking ChargeCharge
Being proactive is in vogueBeing proactive is in vogue• Just ask Steven CoveyJust ask Steven Covey
This means face up to difficult This means face up to difficult problems, stop waiting for someone else problems, stop waiting for someone else to do something, solve problems before to do something, solve problems before they grow into crises, etc.they grow into crises, etc.
We have a hooked on heroics culture—We have a hooked on heroics culture—one that always looks for leadership one that always looks for leadership from the topfrom the top

The Illusion of Taking The Illusion of Taking ChargeCharge
All too often pro-activeness is re-All too often pro-activeness is re-activeness in disguiseactiveness in disguise
True pro-activeness comes from True pro-activeness comes from seeing how we contribute to our seeing how we contribute to our own problemsown problems

The Fixation of EventsThe Fixation of Events
We are conditioned to see life as a We are conditioned to see life as a sequence of eventssequence of events
The situation unfolding in Kashmir is The situation unfolding in Kashmir is viewed as a sequence of escalating viewed as a sequence of escalating eventsevents
The situation in Israel/Palestine The situation in Israel/Palestine again is seen as a situation again is seen as a situation involving events which can be used involving events which can be used to justify the position of either sideto justify the position of either side

The Fixation of EventsThe Fixation of Events
The media reinforces the fixation on The media reinforces the fixation on eventsevents
That is what they reportThat is what they report It is part of our programmingIt is part of our programming Distracts us from seeing the longer Distracts us from seeing the longer
term patterns of change that underlie term patterns of change that underlie events and from understanding the events and from understanding the causes that underlie the patternscauses that underlie the patterns

Today, the primary threats Today, the primary threats to our survival…\to our survival…\
Stem not from events but from slow Stem not from events but from slow gradual processesgradual processes• The environmentThe environment• The erosion of public educationThe erosion of public education
•Generative thinking Generative thinking cannot be sustained if cannot be sustained if people are focused on people are focused on eventsevents

The Parable of the Boiled The Parable of the Boiled FrogFrog
What is it???What is it???

The Delusion of Learning The Delusion of Learning from Experiencefrom Experience
We learn from taking an action and We learn from taking an action and observing the consequences of that actionsobserving the consequences of that actions• What happens when we cannot observe the What happens when we cannot observe the
consequences of our action?consequences of our action?• We all have a learning horizon—a span in time We all have a learning horizon—a span in time
and space within which we assess our and space within which we assess our effectivenesseffectiveness
We learn best from experience but we We learn best from experience but we never directly experience the consequences never directly experience the consequences of many of our most important decisionsof many of our most important decisions
The Delusion of Learning The Delusion of Learning from Experiencefrom Experience
Most people have short memoriesMost people have short memories If cycles last longer than a year or two, If cycles last longer than a year or two,
they are particularly hard to see and thus they are particularly hard to see and thus learn fromlearn from
To reduce the breadth of impact To reduce the breadth of impact organizations are decomposed into organizations are decomposed into componentscomponents
But the departments create stovepipes that But the departments create stovepipes that reduce the observability of complex issues reduce the observability of complex issues that cross functional boundaries.that cross functional boundaries.

Prepared by James R. Burns
DeathsPopulation
-
+
death rate
+
Reinforcing loops vs. Balancing Reinforcing loops vs. Balancing
loopsloops
Births
birth rate
Population
+
+
+

Prepared by James R. Burns
Stock involving both reinforcing Stock involving both reinforcing and balancing loopsand balancing loops
Births
birth rate
Population
+
+
+
Deaths
death rate
+-
+

Prepared by James R. Burns
Stock-and-Flow DiagramStock-and-Flow Diagram
ratedeath (t) population Deaths(t)
ratebirth (t) population Births(t)
where
tPopulation dsDeaths(s)-Births(s))t( Population 00
tt
Population
Births
Deaths
birth rate
death rate
Mathematical representation for Population:
INTEGRAL ( ) function in the VENSIM model:
Population = INTEGRAL (Births – Deaths, Population(t0))

Prepared by James R. Burns
The Methodology once The Methodology once problem is identifiedproblem is identified
Find substanceFind substance Delineate CLDs, BOT chartsDelineate CLDs, BOT charts Submit these for outside scrutinySubmit these for outside scrutiny Delineate SFDDelineate SFD Implement simulation in VENSIMImplement simulation in VENSIM Submit for outside scrutinySubmit for outside scrutiny Utilize model for policy Utilize model for policy
experimentationexperimentation

Prepared by James R. Burns
Find substanceFind substance
Written materialWritten material• BooksBooks• ArticlesArticles• Policy and procedure manualsPolicy and procedure manuals
People’s headsPeople’s heads• Order of magnitude more hereOrder of magnitude more here• Must conduct interviews, build CLD’s, Must conduct interviews, build CLD’s,
show them to the interviewee to show them to the interviewee to capture thiscapture this

Prepared by James R. Burns
Delineate CLDs, BOTsDelineate CLDs, BOTs
CLD – Causal Loop DiagramCLD – Causal Loop Diagram BOT – Behavior-over-Time chart BOT – Behavior-over-Time chart Collect info on the problemCollect info on the problem List variables on post-it notesList variables on post-it notes Describe causality using a CLDDescribe causality using a CLD Describe behavior using a BOT Describe behavior using a BOT
diagramdiagram
Prepared by James R. Burns
Submit these for outside Submit these for outside scrutinyscrutiny
We simply must get someone We simply must get someone qualified to assess the substance qualified to assess the substance of the modelof the model

Prepared by James R. Burns
Delineate SFDDelineate SFD
SFD – Stock and Flow DiagramSFD – Stock and Flow Diagram Translate CLD into SFDTranslate CLD into SFD

Prepared by James R. Burns
What are stocks and What are stocks and flows??flows??
A way to characterize systems as stocks A way to characterize systems as stocks and flows between stocksand flows between stocks
Stocks are variables that accumulate Stocks are variables that accumulate the affects of other variablesthe affects of other variables
Rates are variables that control the Rates are variables that control the flows of material into and out of stocksflows of material into and out of stocks
Auxiliaries are variables that modify Auxiliaries are variables that modify information as it is passed from stocks information as it is passed from stocks to ratesto rates

Prepared by James R. Burns
Stock and Flow Notation--Stock and Flow Notation--QuantitiesQuantities
STOCKSTOCK
RATERATE
AuxiliaryAuxiliary
Stock
Rate
i1
i2
i3
Auxiliary
o1
o2
o3

Prepared by James R. Burns
Stock and Flow Notation--Stock and Flow Notation--QuantitiesQuantities
Input/Parameter/LookupInput/Parameter/Lookup
– Have no edges directed toward themHave no edges directed toward them OutputOutput
– Have no edges directed away from themHave no edges directed away from them
i1
i2
i3
Auxiliary
o1
o2
o3

Prepared by James R. Burns
Inputs and OutputsInputs and Outputs
InputsInputs ParametersParameters LookupsLookups
• Inputs are controllable quantitiesInputs are controllable quantities• Parameters are environmentally defined Parameters are environmentally defined
quantities over which the identified manager quantities over which the identified manager cannot exercise any controlcannot exercise any control
• Lookups are TABLES used to modify information Lookups are TABLES used to modify information as it is passed alongas it is passed along
OutputsOutputs• Have no edges directed away from themHave no edges directed away from them
Input/Parameter/Lookup
a
b
c

Prepared by James R. Burns
Stock and Flow Notation--Stock and Flow Notation--edgesedges
InformationInformation
FlowFlow
a b
x

Prepared by James R. Burns
Some rulesSome rules
There are two types of causal links in There are two types of causal links in causal modelscausal models• InformationInformation• FlowFlow
Information proceeds from stocks and Information proceeds from stocks and parameters/inputs toward rates where it parameters/inputs toward rates where it is used to control flowsis used to control flows
Flow edges proceed from rates to states Flow edges proceed from rates to states (stocks) in the causal diagram always(stocks) in the causal diagram always
Prepared by James R. Burns
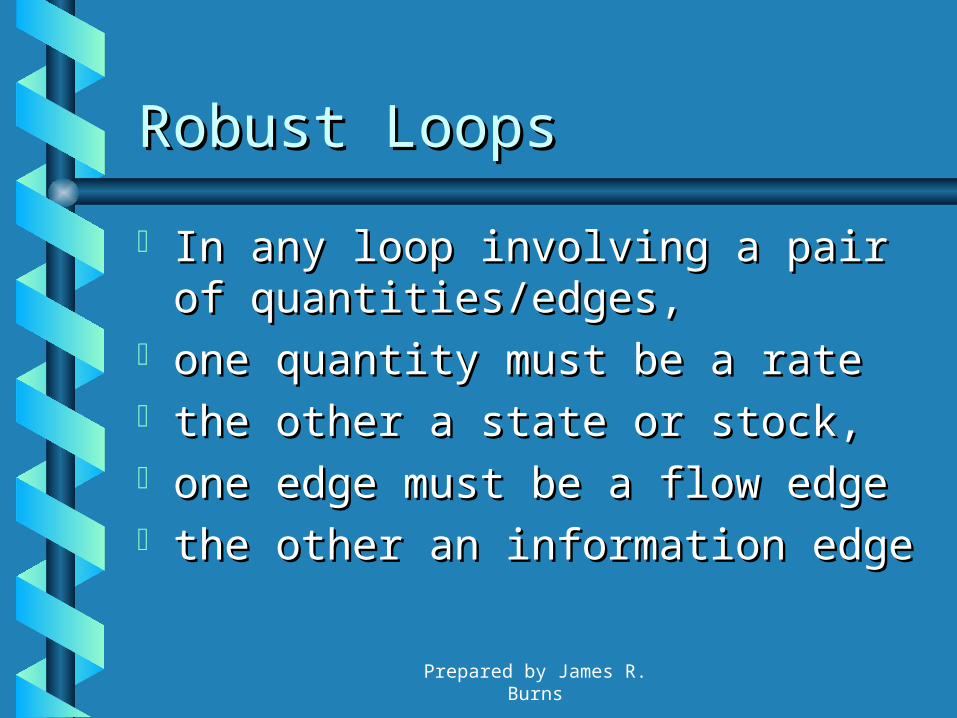
Robust LoopsRobust Loops
In any loop involving a pair of In any loop involving a pair of quantities/edges, quantities/edges,
one quantity must be a rateone quantity must be a rate the other a state or stock, the other a state or stock, one edge must be a flow edgeone edge must be a flow edge the other an information edgethe other an information edge

Prepared by James R. Burns
CONSISTENCYCONSISTENCY
All of the edges directed toward a All of the edges directed toward a quantity are of the same typequantity are of the same type
All of the edges directed away All of the edges directed away from a quantity are of the same from a quantity are of the same typetype
Prepared by James R. Burns
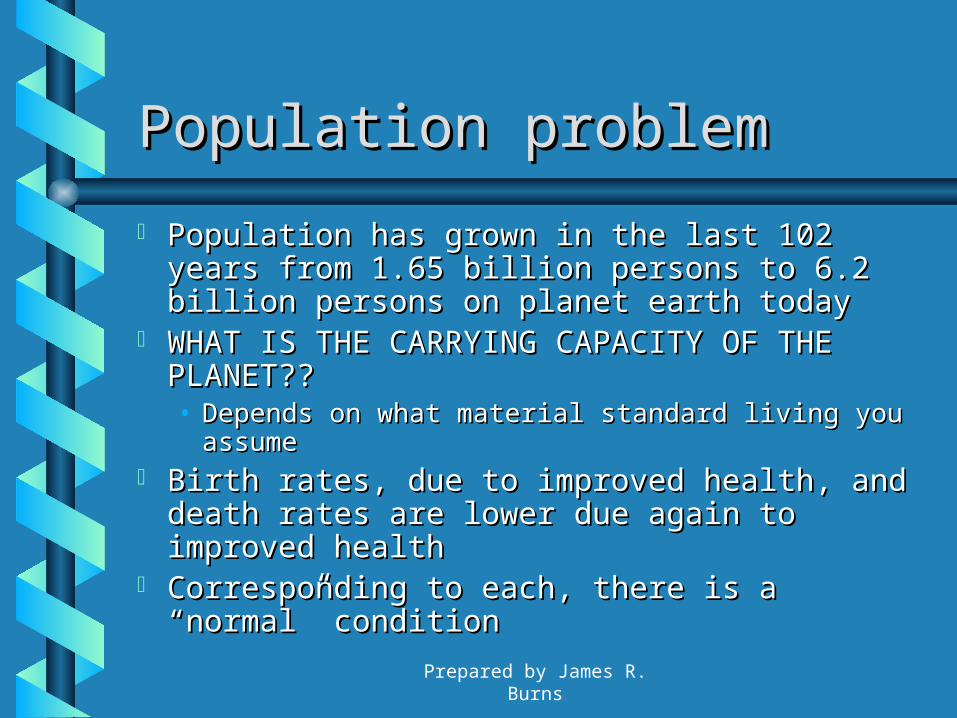
Population problemPopulation problem
Population has grown in the last 102 years Population has grown in the last 102 years from 1.65 billion persons to 6.2 billion persons from 1.65 billion persons to 6.2 billion persons on planet earth todayon planet earth today
WHAT IS THE CARRYING CAPACITY OF THE WHAT IS THE CARRYING CAPACITY OF THE PLANET??PLANET??• Depends on what material standard living you Depends on what material standard living you
assumeassume Birth rates, due to improved health, and death Birth rates, due to improved health, and death
rates are lower due again to improved healthrates are lower due again to improved health Corresponding to each, there is a “normal” Corresponding to each, there is a “normal”
conditioncondition

Prepared by James R. Burns
List VARIABLESList VARIABLES
PopulationPopulation Birth rateBirth rate Death rateDeath rate Death rate normalDeath rate normal Birth rate normalBirth rate normal

Prepared by James R. Burns
Draw Causal Loop Draw Causal Loop DiagramDiagram
birth rate norm birth rate
death rate norm death rate
Population

Prepared by James R. Burns
Converting to a STOCK Converting to a STOCK AND FLOW DiagramAND FLOW Diagram
What is a STOCK?What is a STOCK? What is a FLOW?What is a FLOW? What is a RATE?What is a RATE? What is a parameter?What is a parameter?

Prepared by James R. Burns
Convert CLD to SFDConvert CLD to SFD
Birth rate norm
Death rate norm
Population
Birth rate
Death rate

Prepared by James R. Burns
Determine equationsDetermine equations
BRN = .04BRN = .04 DRN = .028DRN = .028 BR = BRN*PBR = BRN*P DR = DRN*PDR = DRN*P P(t + dt) = p(t) + dt*(BR – DR)P(t + dt) = p(t) + dt*(BR – DR)

Prepared by James R. Burns
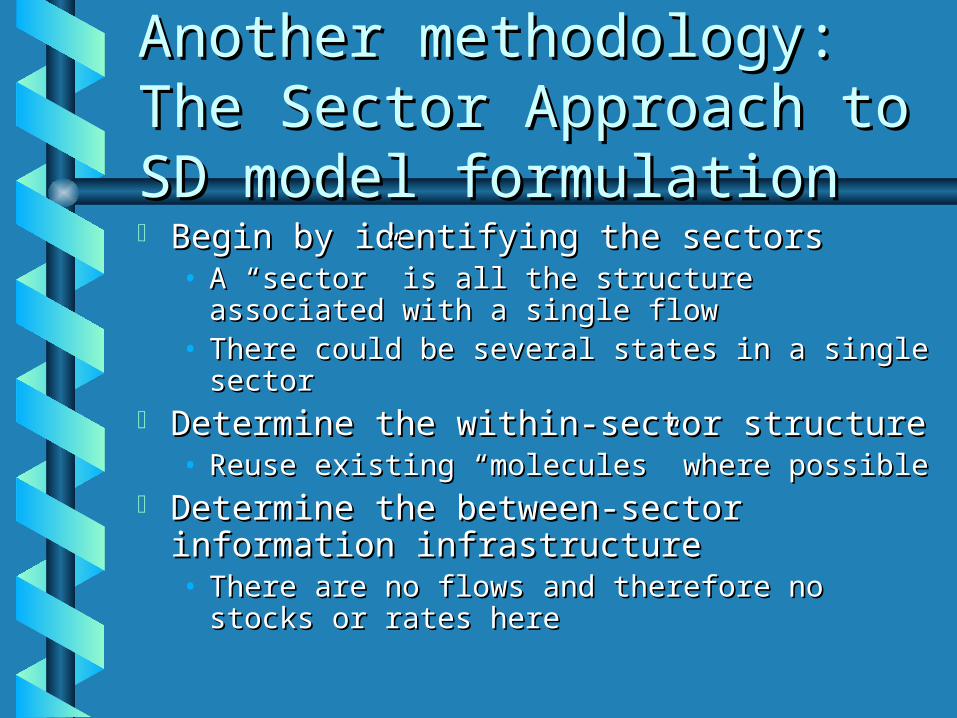
The Sector Approach to SD The Sector Approach to SD model formulation--model formulation--
Begin by identifying the sectorsBegin by identifying the sectors• A “sector” is all the structure A “sector” is all the structure
associated with a single flowassociated with a single flow• There could be several states in a There could be several states in a
single sectorsingle sector

Prepared by James R. Burns
The sector Approach, The sector Approach, ContinuedContinued
Determine the within-sector Determine the within-sector structurestructure• Reuse existing “molecules” where Reuse existing “molecules” where
possiblepossible Determine the between-sector Determine the between-sector
information infrastructureinformation infrastructure• There are no flows and therefore no There are no flows and therefore no
stocks or rates herestocks or rates here

Prepared by James R. Burns
A Single-sector A Single-sector Exponential goal-Exponential goal-seeking Modelseeking Model
Sonya Magnova is a television retailer Sonya Magnova is a television retailer who wishes to maintain a desired who wishes to maintain a desired inventory of DI television sets so that inventory of DI television sets so that she doesn’t have to sell her she doesn’t have to sell her demonstrator and show models. demonstrator and show models. Sonya’s ordering policy is quite simple--Sonya’s ordering policy is quite simple--adjust actual inventory I toward desired adjust actual inventory I toward desired inventory DI so as to force these to inventory DI so as to force these to conform as closely as possible. The conform as closely as possible. The initial inventory is Io. The time required initial inventory is Io. The time required for ordered inventory to be received is for ordered inventory to be received is AT.AT.
Prepared by James R. Burns
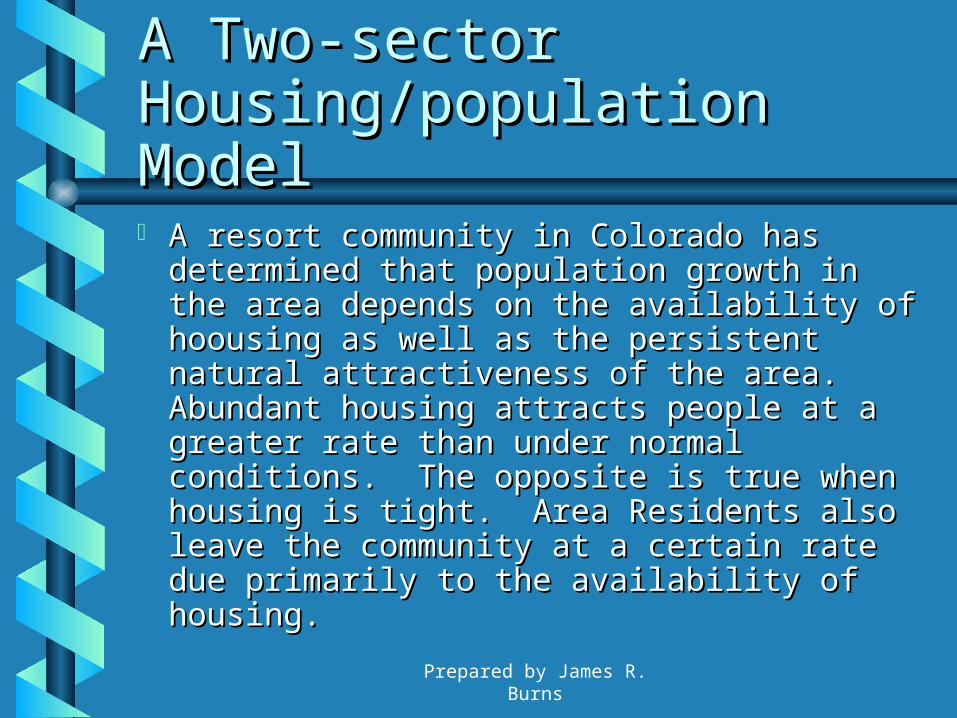
A Two-sector A Two-sector Housing/population ModelHousing/population Model
A resort community in Colorado has A resort community in Colorado has determined that population growth in the determined that population growth in the area depends on the availability of area depends on the availability of hoousing as well as the persistent natural hoousing as well as the persistent natural attractiveness of the area. Abundant attractiveness of the area. Abundant housing attracts people at a greater rate housing attracts people at a greater rate than under normal conditions. The than under normal conditions. The opposite is true when housing is tight. opposite is true when housing is tight. Area Residents also leave the community Area Residents also leave the community at a certain rate due primarily to the at a certain rate due primarily to the availability of housing.availability of housing.

Prepared by James R. Burns
Two-sector Two-sector Population/housing Model, Population/housing Model, ContinuedContinued The housing construction iindustry, on The housing construction iindustry, on
the other hand, fluctuates depending on the other hand, fluctuates depending on the land availability and housing desires. the land availability and housing desires. Abundant housing cuts back the Abundant housing cuts back the construction of houses while the opposite construction of houses while the opposite is true when the housing situation is is true when the housing situation is tight. Also, as land for residential tight. Also, as land for residential development fills up (in this mountain development fills up (in this mountain valley), the construction rate decreases valley), the construction rate decreases to the level of the demolition rate of to the level of the demolition rate of houses.houses.

Prepared by James R. Burns
What are the main sectors What are the main sectors and how do these and how do these interact?interact? PopulationPopulation HousingHousing

Prepared by James R. Burns
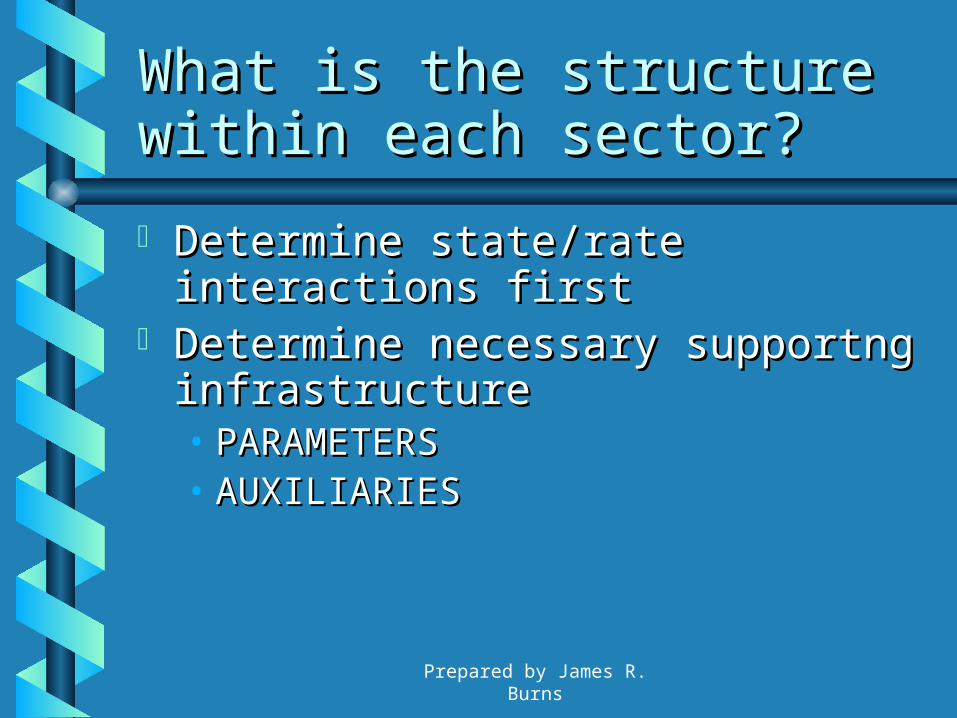
What is the structure What is the structure within each sector?within each sector?
Determine state/rate interactions Determine state/rate interactions firstfirst
Determine necessary supportng Determine necessary supportng infrastructureinfrastructure• PARAMETERSPARAMETERS• AUXILIARIESAUXILIARIES

Prepared by James R. Burns
What does the structure What does the structure within the population within the population sector look like?sector look like? RATES: in-migration, out-RATES: in-migration, out-
migration, net death ratemigration, net death rate STATES: populationSTATES: population PARAMETERS: in-migration normal, PARAMETERS: in-migration normal,
out-migration normal, net death-out-migration normal, net death-rate normalrate normal

Prepared by James R. Burns
What does the structure What does the structure within the housing sector within the housing sector look like?look like? RATES: construction rate, demolition RATES: construction rate, demolition
raterate STATES: housingSTATES: housing AUXILIARIES: Land availability multiplier, AUXILIARIES: Land availability multiplier,
land fraction occupiedland fraction occupied PARAMETERS: normal housing PARAMETERS: normal housing
construction, average lifetime of construction, average lifetime of housinghousing
PARAMETERS: land occupied by each PARAMETERS: land occupied by each unit, total residential landunit, total residential land

Prepared by James R. Burns
What is the structure What is the structure between sectors?between sectors?
There are only AUXILIARIES, There are only AUXILIARIES, PARAMETERS, INPUTS and PARAMETERS, INPUTS and OUTPUTSOUTPUTS

Prepared by James R. Burns
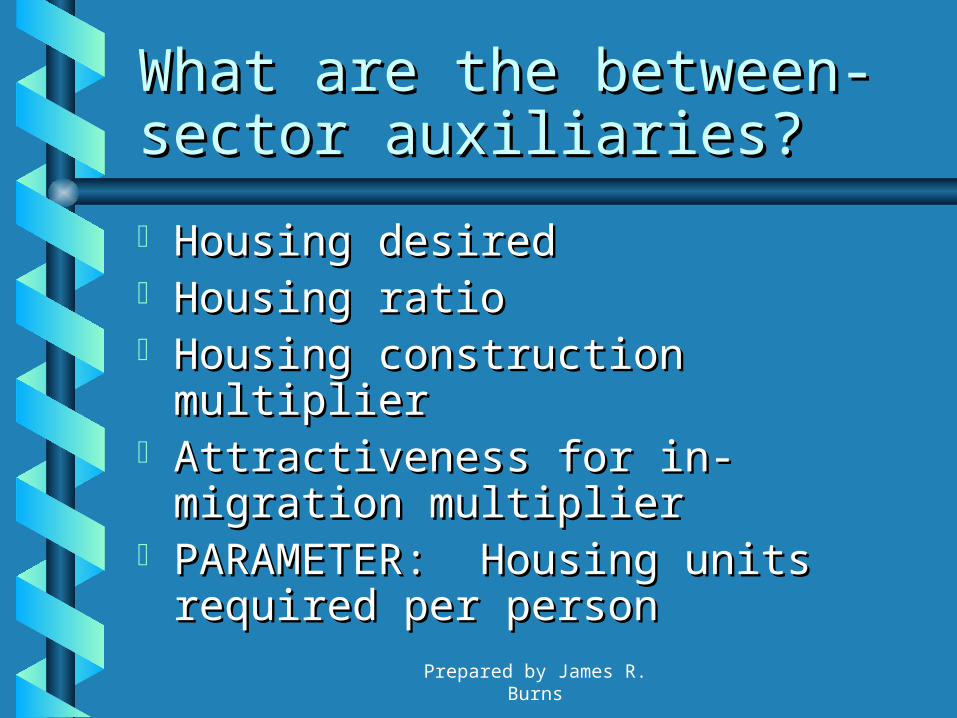
What are the between-What are the between-sector auxiliaries?sector auxiliaries?
Housing desiredHousing desired Housing ratioHousing ratio Housing construction multiplierHousing construction multiplier Attractiveness for in-migration Attractiveness for in-migration
multipliermultiplier PARAMETER: Housing units PARAMETER: Housing units
required per personrequired per person

Prepared by James R. Burns
Can you construct the Can you construct the schematic model for this schematic model for this Causal model?Causal model?
desired level
actual level
adjustment rate adjustment time

Prepared by James R. Burns
We know what that isWe know what that is
Dessired level Adjustment time
Actual level
Adjustment rate

Prepared by James R. Burns
How about this one?How about this one?
birth rate norm birth rate
death rate norm death rate
Population

Prepared by James R. Burns
We know what it isWe know what it is
Birth rate norm
Death rate norm
Population
Birth rate
Death rate

Prepared by James R. Burns
Some rulesSome rules
There are two types of causal links in There are two types of causal links in causal modelscausal models• InformationInformation• FlowFlow
Information proceeds from stocks and Information proceeds from stocks and parameters toward rates where it is parameters toward rates where it is used to control flowsused to control flows
Flow edges proceed from rates to states Flow edges proceed from rates to states (stocks) in the causal diagram always(stocks) in the causal diagram always

Prepared by James R. Burns
LoopsLoops
In any loop involving a pair of In any loop involving a pair of quantities/edges, quantities/edges,
one quantity must be a rateone quantity must be a rate the other a state or stock, the other a state or stock, one edge must be a flow edgeone edge must be a flow edge the other an information edgethe other an information edge

Prepared by James R. Burns
CONSISTENCYCONSISTENCY
All of the edges directed toward a All of the edges directed toward a quantity are of the same typequantity are of the same type
All of the edges directed away All of the edges directed away from a quantity are of the same from a quantity are of the same typetype

Prepared by James R. Burns
Rates and their edgesRates and their edges
q1
q2
q3
RATES
q4
q5
q6
Informationedges
Flow edges

Prepared by James R. Burns
Parameters and their Parameters and their edgesedges
PARAMETER
q1
q2
q3
Informationedges

Prepared by James R. Burns
Stocks and their edgesStocks and their edges
q1
q2
q3
STOCK
q4
q5
q6
Flow edges Information edges

Prepared by James R. Burns
Auxiliaries and their edgesAuxiliaries and their edges
AUXILIARY
q1
q2
q3
q4
q5
q6
Informationedges
Informationedges
Prepared by James R. Burns
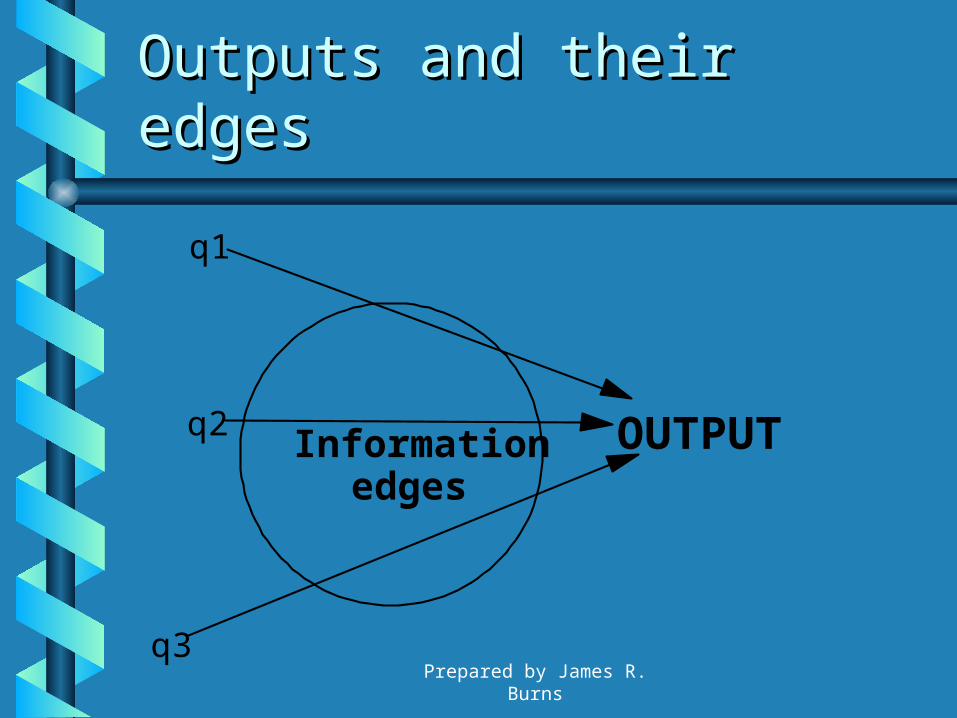
Outputs and their edgesOutputs and their edges
OUTPUT
q1
q2
q3
Informationedges

Prepared by James R. Burns
STEP 1: Identify STEP 1: Identify parameters/inputsparameters/inputs
Parameters have no edges Parameters have no edges directed toward themdirected toward them

Prepared by James R. Burns
STEP 2: Identify the edges STEP 2: Identify the edges directed from parametersdirected from parameters
These are information edges These are information edges alwaysalways

Prepared by James R. Burns
STEP 3: By consistency STEP 3: By consistency identify as many other edge identify as many other edge types as you cantypes as you can

Prepared by James R. Burns
STEP 4: Look for loops STEP 4: Look for loops involving a pair of involving a pair of quantities onlyquantities only
Use the rules identified aboveUse the rules identified above

System Dynamics System Dynamics SoftwareSoftware STELLA and STELLA and I thinkI think
• High Performance Systems, Inc.High Performance Systems, Inc.• best fit for K-12 educationbest fit for K-12 education
VensimVensim• Ventana systems, Inc.Ventana systems, Inc.• Free from downloading off their web site: Free from downloading off their web site:
www.vensim.comwww.vensim.com• Robust--including parametric data fitting and Robust--including parametric data fitting and
optimizationoptimization• best fit for higher educationbest fit for higher education
PowersimPowersim• What Arthur Andersen is usingWhat Arthur Andersen is using

What is system dynamicsWhat is system dynamics
A way to characterize systems as stocks A way to characterize systems as stocks and flows between stocksand flows between stocks
Stocks are variables that accumulate Stocks are variables that accumulate the affects of other variablesthe affects of other variables
Rates are variables the control the flows Rates are variables the control the flows of material into andout of stocksof material into andout of stocks
Auxiliaries are variables the modify Auxiliaries are variables the modify information as it is passed from stocks information as it is passed from stocks to ratesto rates

A DEMOA DEMO

Prepared by James R. Burns
Nature’s Templates: the Nature’s Templates: the ArchetypesArchetypes
Structures of which we are Structures of which we are unaware hold us prisonerunaware hold us prisoner
– The swimmer scenarioThe swimmer scenario
Certain patterns of structure occur Certain patterns of structure occur again and again: called again and again: called ARCHETYPESARCHETYPES

Prepared by James R. Burns
We are creating a We are creating a “language”“language” reinforcing feedback and balancing reinforcing feedback and balancing
feedback are like the nouns and verbsfeedback are like the nouns and verbs systems archetypes are the basic sentencessystems archetypes are the basic sentences Behavior patterns appear again in all Behavior patterns appear again in all
disciplines--biology, psychology, family disciplines--biology, psychology, family therapy, economics, political science, therapy, economics, political science, ecology and managementecology and management
Can result in the unification of knowledge Can result in the unification of knowledge across all fieldsacross all fields

Prepared by James R. Burns
Recurring behavior Recurring behavior patternspatterns
Do we know how to recognize Do we know how to recognize them?them?
Do we know how to describe them?Do we know how to describe them? Do we know how to prescribe cures Do we know how to prescribe cures
for them?for them? The ARCHETYPES describe these The ARCHETYPES describe these
recurring behavior patternsrecurring behavior patterns

Prepared by James R. Burns
The ARCHETYPES The ARCHETYPES
provide leverage points, intervention provide leverage points, intervention junctures at which substantial change junctures at which substantial change can be brought aboutcan be brought about
put the systems perspective into practiceput the systems perspective into practice About a dozen systems ARCHETYPES About a dozen systems ARCHETYPES
have been identifiedhave been identified All ARCHETYPES are made up of the All ARCHETYPES are made up of the
systems building blocks: reinforcing systems building blocks: reinforcing processes, balancing processes, delaysprocesses, balancing processes, delays

Prepared by James R. Burns
Before attacking the Before attacking the ARCHETYPES we need to ARCHETYPES we need to understand simple understand simple structuresstructures the reinforcing feedback loopthe reinforcing feedback loop the balancing feedback loopthe balancing feedback loop THE DEMOTHE DEMO Pages 520-525 in Austin/Burns--Pages 520-525 in Austin/Burns--
your handoutyour handout

Prepared by James R. Burns
ARCHETYPE 1: LIMITS TO ARCHETYPE 1: LIMITS TO GROWTHGROWTH
A reinforcing process is set in A reinforcing process is set in motion to produce a desired result. motion to produce a desired result. It creates a spiral of success but It creates a spiral of success but also creates inadvertent secondary also creates inadvertent secondary effects (manifested in a alancing effects (manifested in a alancing process) that eventually slow down process) that eventually slow down the success.the success.

Prepared by James R. Burns
Management Principle Management Principle relative to ARCHETYPE 1relative to ARCHETYPE 1
Don’t push growth or success; Don’t push growth or success; remove the factors limiting growthremove the factors limiting growth

Prepared by James R. Burns
ARCHETYPE 1: LIMITS TO ARCHETYPE 1: LIMITS TO GROWTHGROWTH
Useful in all situations where Useful in all situations where growth bumps up against limitsgrowth bumps up against limits
Firms grow for a while, then plateauFirms grow for a while, then plateau Individuals get better for a while, Individuals get better for a while,
then their personal growth slows.then their personal growth slows. Falling in love is kind of like thisFalling in love is kind of like this
– The love begins to plateau as the couple The love begins to plateau as the couple get to know each other betterget to know each other better

Prepared by James R. Burns
StructureStructure
state of stockgrowing action slowing action
BalancingReinforcing

Prepared by James R. Burns
Understanding the Understanding the StructureStructure
High-tech orgs grow rapidly High-tech orgs grow rapidly because of ability to introduce new because of ability to introduce new productsproducts
This growth plateaus as lead times This growth plateaus as lead times become too longbecome too long

Prepared by James R. Burns
How to achieve LeverageHow to achieve Leverage
Most managers react to the slowing Most managers react to the slowing growth by puching harder on the growth by puching harder on the reinforcing loopreinforcing loop
Unfortunately, the more vigorously you Unfortunately, the more vigorously you push the familiar levels, the more push the familiar levels, the more strongly the balancing proces resists, strongly the balancing proces resists, and the more futile your efforts become. and the more futile your efforts become.
Instead, concentrate on the balancing Instead, concentrate on the balancing loop--changing the limiting factorloop--changing the limiting factor
– This is akin to Goldratt’s Theory of Constraints--This is akin to Goldratt’s Theory of Constraints--remove the bottleneck, the impedimentremove the bottleneck, the impediment

Prepared by James R. Burns
Applications to Quality Applications to Quality Circles and JITCircles and JIT Quality circles work best when there is Quality circles work best when there is
even-handed emphasis on both balancing even-handed emphasis on both balancing and reinforcing loopsand reinforcing loops
JIT has had to focus on recalcitrant JIT has had to focus on recalcitrant supplierssuppliers
THERE WILL ALWAYS BE MORE LIMITING THERE WILL ALWAYS BE MORE LIMITING PROCESSESPROCESSES
– When once source of limitatiin is removed, another When once source of limitatiin is removed, another will surfacewill surface
Growth eventually WILL STOPGrowth eventually WILL STOP

Prepared by James R. Burns
Create your own LIMITS Create your own LIMITS TO GROWTH storyTO GROWTH story Identify a limits to growth pattern Identify a limits to growth pattern
in your own experiencein your own experience Diagram itDiagram it
• What is growingWhat is growing• What might be limitationsWhat might be limitations• Example--the COBA and University Example--the COBA and University
capital campaignscapital campaigns• NOW, LOOK FOR LEVERAGENOW, LOOK FOR LEVERAGE

Prepared by James R. Burns
Test your LIMITS TO Test your LIMITS TO GROWTH modelGROWTH model
Talk to others about your Talk to others about your perceptionperception
Test your ideas about leverage in Test your ideas about leverage in small real-life experimentssmall real-life experiments
Run and re-run the simulation Run and re-run the simulation modelmodel
Approach possible resistance and Approach possible resistance and seek WIN-WIN strategies with themseek WIN-WIN strategies with them

Prepared by James R. Burns
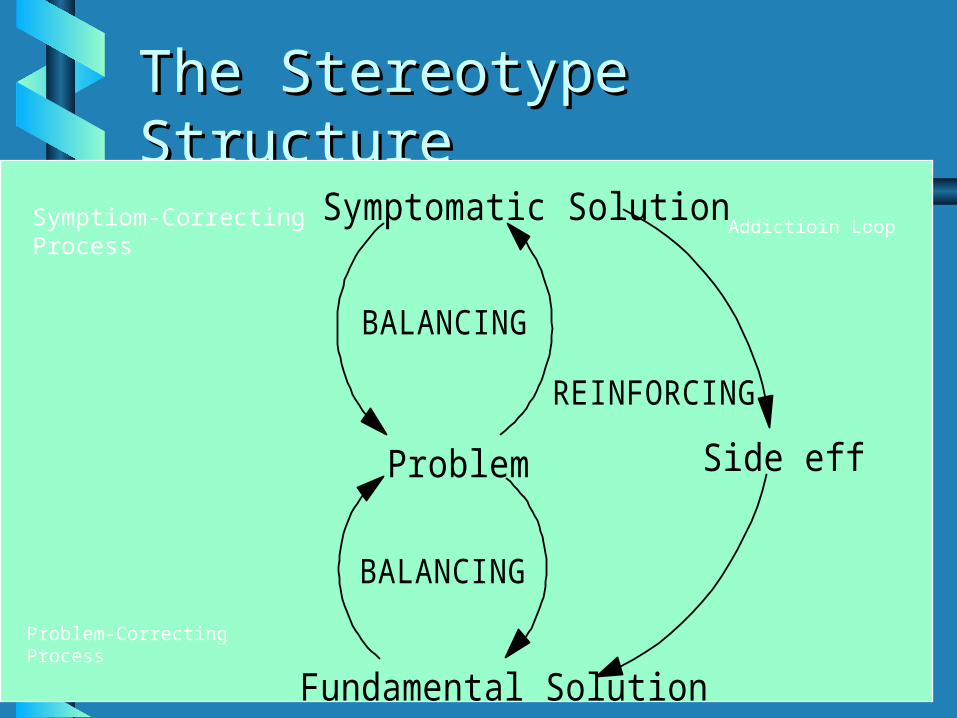
ARCHETYPE 2: shifting the ARCHETYPE 2: shifting the burdenburden An underlying problem generates symptoms An underlying problem generates symptoms
that demand attention. But the underlying that demand attention. But the underlying problem is difficult for people to address, either problem is difficult for people to address, either because it is obscure or costly to confront. So because it is obscure or costly to confront. So people “shift the burden” of their problem to people “shift the burden” of their problem to other solutions--well-intentioned, easy fixes other solutions--well-intentioned, easy fixes that seem extremely efficient. Unfortunately that seem extremely efficient. Unfortunately the easier solutions only ameliorate the the easier solutions only ameliorate the symptoms; they leave the underlying problem symptoms; they leave the underlying problem unaltered. The underlying problem grows unaltered. The underlying problem grows worse and the system loses whatever abilities worse and the system loses whatever abilities it had to solve the underlying problem.it had to solve the underlying problem.
Prepared by James R. Burns
The Stereotype StructureThe Stereotype Structure
Problem
Symptomatic Solution
Fundamental Solution
Side effect
BALANCING
BALANCING
REINFORCING
Symptiom-CorrectingProcess
Problem-Correcting Process
Addictioin Loop

Prepared by James R. Burns
Special Case: Eroding Special Case: Eroding GoalsGoals Full employment meant 4% Full employment meant 4%
unemployment in the 60%, but 6 to unemployment in the 60%, but 6 to 7% unemployment in the early 7% unemployment in the early 1980’s1980’s
Gramm-Rudman bill called for Gramm-Rudman bill called for reaching a balanced budget by 1991, reaching a balanced budget by 1991, but this was shifted to 1993 and from but this was shifted to 1993 and from 1993 to 1996 and from 1996 to 19981993 to 1996 and from 1996 to 1998
““If all else fails, lower your goals..”If all else fails, lower your goals..”
Prepared by James R. Burns
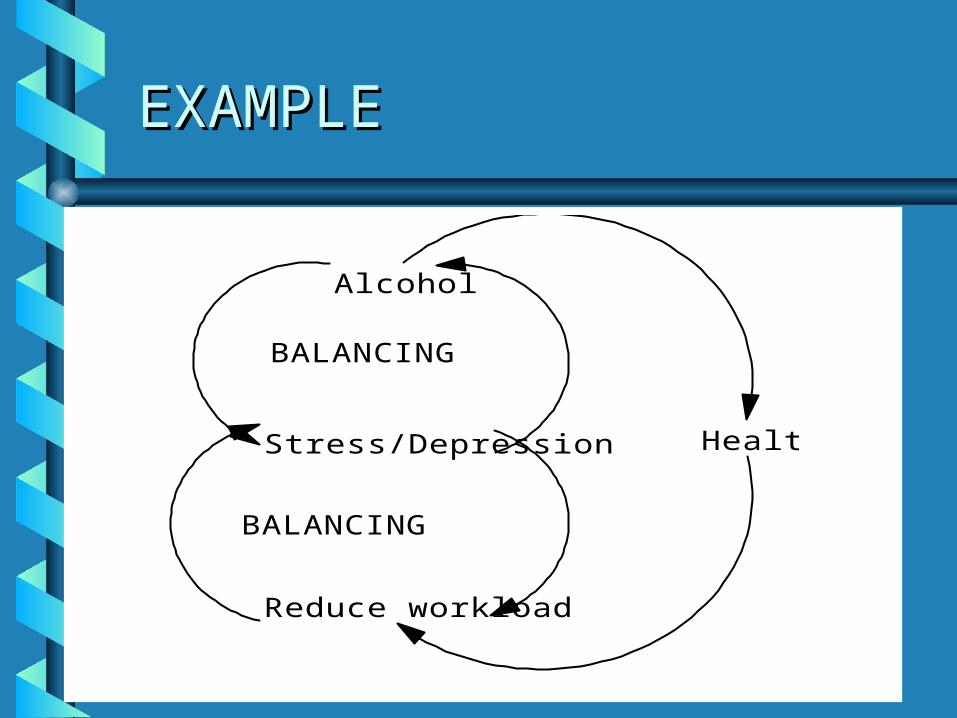
EXAMPLEEXAMPLE
Alcohol
Stress/Depression
Reduce workload
Health
BALANCING
BALANCING
Alcohol
Stress/Depression
Reduce workload
Health
BALANCING
BALANCING

Prepared by James R. Burns
Another Example Another Example
Costs of Higher Ed not funded by State
Raise tuition, add course fees, etc.
Lower enrollments
Perceived cost to the student

Prepared by James R. Burns
Still Another ExampleStill Another Example
Heroics and Overtime
Project Delayed
Efectiveness of PM practices
Reward for heroic behavior
Improvement of processes/practices
Symptom-correctingprocess
Problem-correctingProcess
Addiction Loop

Prepared by James R. Burns
““Shifting the Burden” is an Shifting the Burden” is an insidious probleminsidious problem
Is has a subtle reinforcing cycleIs has a subtle reinforcing cycle This increases dependence on the This increases dependence on the
symptomatic solutionsymptomatic solution But eventually, the system loses But eventually, the system loses
the ability to apply the the ability to apply the fundamental solutionfundamental solution
The system collapsesThe system collapses

Prepared by James R. Burns
Senge SaysSenge Says
Today’s problems are yesterday’s Today’s problems are yesterday’s solutionssolutions
We tend to look for solutions We tend to look for solutions where they are easiest to findwhere they are easiest to find

Prepared by James R. Burns
HOW TO ACHIEVE HOW TO ACHIEVE LEVERAGELEVERAGE
Must strengthen the fundamental Must strengthen the fundamental responseresponse• Requires a long-term orientation and Requires a long-term orientation and
a shared visiona shared vision Must weaken the symptomatic Must weaken the symptomatic
responseresponse• Requires a willingness to tell the truth Requires a willingness to tell the truth
about these “solutions”about these “solutions”

Prepared by James R. Burns
Create your own “Shifting Create your own “Shifting the Burden” Storythe Burden” Story Is there a problem that is getting Is there a problem that is getting
gradually worse over the long term?gradually worse over the long term? Is the overall health of the system Is the overall health of the system
gradually worsening?gradually worsening? Is there a growing feeling of helplessness?Is there a growing feeling of helplessness? Have short-term fixes been applied?Have short-term fixes been applied?
– The Casa Olay problem of using cupouns to generate The Casa Olay problem of using cupouns to generate business and then can’t get away from using the business and then can’t get away from using the coupons because their customer base is hucked on coupons because their customer base is hucked on couponscoupons

Prepared by James R. Burns
To structure your problemTo structure your problem
Identify the problemIdentify the problem Next, identify a fundamental Next, identify a fundamental
solutionsolution Then, identify one or several Then, identify one or several
symptomatic solutionssymptomatic solutions Finally, identify the possible Finally, identify the possible
negative “side effects” of the negative “side effects” of the symptomatic solutionsymptomatic solution

Prepared by James R. Burns
Review Review
We have now seen two of the basic systems We have now seen two of the basic systems archetypes. archetypes. • The Limits to Growth ArchetypeThe Limits to Growth Archetype• The Shifting the Burden ArchetypeThe Shifting the Burden Archetype
As the archetypes are mastered, they As the archetypes are mastered, they become combined into more elaborate become combined into more elaborate systemic descriptions.systemic descriptions.
The basic “sentences” become parts of The basic “sentences” become parts of paragraphsparagraphs
The simple stories become integrated into The simple stories become integrated into more involved storiesmore involved stories

Prepared by James R. Burns
Seeing Structures, not just Seeing Structures, not just TreesTrees
Helps us focus on what is Helps us focus on what is important and what is notimportant and what is not
Helps us determine what variables Helps us determine what variables to focus on and which to play less to focus on and which to play less attention toattention to

Prepared by James R. Burns
WonderTech: The Chapter WonderTech: The Chapter 7 Scenario7 Scenario
A lesson in Growth and A lesson in Growth and UnderinvestmentUnderinvestment
What Senge gets out of this is the What Senge gets out of this is the Growth and Underinvestment Growth and Underinvestment ArchetypeArchetype• A combination of variants of the A combination of variants of the
Limits to Growth Archetype and the Limits to Growth Archetype and the Shifting the Burden ArchetypeShifting the Burden Archetype

Prepared by James R. Burns
The WonderTech The WonderTech ScenarioScenario
WonderTech continues to invest in the growth side of WonderTech continues to invest in the growth side of the process. Sales grow but then plateau. the process. Sales grow but then plateau. Management puts more sales people into the field. Management puts more sales people into the field. Offers more incentives to sales force. But because of Offers more incentives to sales force. But because of long lead times, customers wane. “Yes you have a long lead times, customers wane. “Yes you have a great product, but you can’t deliver on your lead great product, but you can’t deliver on your lead time promise of eight weeks. We know; we’ve heard time promise of eight weeks. We know; we’ve heard from your other customers.” In fact, the company from your other customers.” In fact, the company relaxed its lead-time standard out to twelve to relaxed its lead-time standard out to twelve to sixteen weeks because of insufficient capacity. sixteen weeks because of insufficient capacity.

The Reinforcing LoopThe Reinforcing Loop
Number of Orders
Revenues
Size of Sales Force
REINFORCING

The Balancing Loop: The Balancing Loop: Following the LTG Following the LTG ArchetypeArchetype
Number of Orders
Revenues
Size of Sales Force
Size of Backlog
Delivery Time
Delay
Sales Difficulty

The Growth Curve: Page The Growth Curve: Page 117117

What’s happened?What’s happened?
WT’s management did not pay much WT’s management did not pay much attention to their delivery service. They attention to their delivery service. They mainly tracked sales, profits, market share mainly tracked sales, profits, market share and return on investment. WT’s managers and return on investment. WT’s managers waited until demand fell off before getting waited until demand fell off before getting concerned about delivery times. But this is concerned about delivery times. But this is too late. The slow delivery time has already too late. The slow delivery time has already begun to correct itself. The management begun to correct itself. The management was not very concerned about the relaxed was not very concerned about the relaxed delivery time standard of eight weeks.delivery time standard of eight weeks.

The WonderTech ScenarioThe WonderTech Scenario
The firm decides to build a new The firm decides to build a new manufacturing facility. But the facility manufacturing facility. But the facility comes on line at a time when sales are comes on line at a time when sales are declining and lead times are coming declining and lead times are coming back to the eight-week standard. back to the eight-week standard.
Of every 10 startup companies, 5 will Of every 10 startup companies, 5 will disappear with five years, only 4 survive disappear with five years, only 4 survive into their tenth year and only 3 into into their tenth year and only 3 into their fifteenth year.their fifteenth year.

The Shifting the Burden The Shifting the Burden ComponentComponent
Number of Orders
Size of Backlog
Delivery Time
Delay
Sales Difficulty
Production CapacityPerceived need to improve delivery time
Delivery time standard
Planned additions to capacity
Delay2

Put the whole thing Put the whole thing togethertogether

Comments on The Senge Comments on The Senge MethodologyMethodology Sees problems as conforming to a Sees problems as conforming to a
finite number of “archetypes”finite number of “archetypes” Formulates models based on Formulates models based on
combinations of the archetypescombinations of the archetypes Addresses problem-driven situationsAddresses problem-driven situations
• What about situations and systems What about situations and systems that are technology-driven, dynamics-that are technology-driven, dynamics-driven, exogenously-driven, anything driven, exogenously-driven, anything but problem-drivenbut problem-driven

More Comments on the More Comments on the Senge MethodologySenge Methodology
But does this become sufficiently But does this become sufficiently general to accommodate all general to accommodate all dynamical “scenarios and situations”?dynamical “scenarios and situations”?
It is difficult to translate his It is difficult to translate his archetypes and causal models into archetypes and causal models into running system dynamics simulationsrunning system dynamics simulations• A lot of variables (RATE VARIABLES, A lot of variables (RATE VARIABLES,
specifically) get left out in terms of specifically) get left out in terms of connectionsconnections

More Comments on the More Comments on the Senge MethodologySenge Methodology
The focus is on characterizing the The focus is on characterizing the dynamics, not on how to capture dynamics, not on how to capture that in terms of stocks, flows and that in terms of stocks, flows and information pathsinformation paths
He doesn’t label his edges with He doesn’t label his edges with “+” or “-” signs“+” or “-” signs
Another methodology: Another methodology: The Sector Approach to SD The Sector Approach to SD model formulationmodel formulation Begin by identifying the sectorsBegin by identifying the sectors
• A “sector” is all the structure associated with A “sector” is all the structure associated with a single flowa single flow
• There could be several states in a single There could be several states in a single sectorsector
Determine the within-sector structureDetermine the within-sector structure• Reuse existing “molecules” where possibleReuse existing “molecules” where possible
Determine the between-sector Determine the between-sector information infrastructureinformation infrastructure• There are no flows and therefore no stocks or There are no flows and therefore no stocks or
rates hererates here

Prepared by James R. Burns
A Single-sector A Single-sector Exponential goal-Exponential goal-seeking Modelseeking Model Sonya Magnova is a television retailer Sonya Magnova is a television retailer
who wishes to maintain a desired who wishes to maintain a desired inventory of DI television sets so that inventory of DI television sets so that she doesn’t have to sell her she doesn’t have to sell her demonstrator and show models. demonstrator and show models. Sonya’s ordering policy is quite simple--Sonya’s ordering policy is quite simple--adjust actual inventory I toward desired adjust actual inventory I toward desired inventory DI so as to force these to inventory DI so as to force these to conform as closely as possible. The conform as closely as possible. The initial inventory is Io. The time required initial inventory is Io. The time required for ordered inventory to be received is for ordered inventory to be received is AT.AT.

Prepared by James R. Burns
A Two-sector A Two-sector Housing/population ModelHousing/population Model
A resort community in Colorado has A resort community in Colorado has determined that population growth in the determined that population growth in the area depends on the availability of hoousing area depends on the availability of hoousing as well as the persistent natural as well as the persistent natural attractiveness of the area. Abundant housing attractiveness of the area. Abundant housing attracts people at a greater rate than under attracts people at a greater rate than under normal conditions. The opposite is true when normal conditions. The opposite is true when housing is tight. Area Residents also leave housing is tight. Area Residents also leave the community at a certain rate due primarily the community at a certain rate due primarily to the availability of housing.to the availability of housing.

Prepared by James R. Burns
Two-sector Two-sector Population/housing Model, Population/housing Model, ContinuedContinued The housing construction iindustry, on the The housing construction iindustry, on the
other hand, fluctuates depending on the other hand, fluctuates depending on the land availability and housing desires. land availability and housing desires. Abundant housing cuts back the Abundant housing cuts back the construction of houses while the opposite construction of houses while the opposite is true when the housing situation is tight. is true when the housing situation is tight. Also, as land for residential development Also, as land for residential development fills up (in this mountain valley), the fills up (in this mountain valley), the construction rate decreases to the level of construction rate decreases to the level of the demolition rate of houses.the demolition rate of houses.

Prepared by James R. Burns
What are the main sectors What are the main sectors and how do these and how do these interact?interact? PopulationPopulation HousingHousing
Prepared by James R. Burns
What is the structure What is the structure within each sector?within each sector?
Determine state/rate interactions Determine state/rate interactions firstfirst
Determine necessary supportng Determine necessary supportng infrastructureinfrastructure• PARAMETERSPARAMETERS• AUXILIARIESAUXILIARIES

Prepared by James R. Burns
What does the structure What does the structure within the population within the population sector look like?sector look like? RATES: in-migration, out-RATES: in-migration, out-
migration, net death ratemigration, net death rate STATES: populationSTATES: population PARAMETERS: in-migration normal, PARAMETERS: in-migration normal,
out-migration normal, net death-out-migration normal, net death-rate normalrate normal

Prepared by James R. Burns
What does the structure What does the structure within the housing sector within the housing sector look like?look like? RATES: construction rate, demolition RATES: construction rate, demolition
raterate STATES: housingSTATES: housing AUXILIARIES: Land availability multiplier, AUXILIARIES: Land availability multiplier,
land fraction occupiedland fraction occupied PARAMETERS: normal housing PARAMETERS: normal housing
construction, average lifetime of construction, average lifetime of housinghousing
PARAMETERS: land occupied by each PARAMETERS: land occupied by each unit, total residential landunit, total residential land

Prepared by James R. Burns
What is the structure What is the structure between sectors?between sectors?
There are only AUXILIARIES, There are only AUXILIARIES, PARAMETERS, INPUTS and PARAMETERS, INPUTS and OUTPUTSOUTPUTS
Prepared by James R. Burns
What are the between-What are the between-sector auxiliaries?sector auxiliaries?
Housing desiredHousing desired Housing ratioHousing ratio Housing construction multiplierHousing construction multiplier Attractiveness for in-migration Attractiveness for in-migration
multipliermultiplier PARAMETER: Housing units PARAMETER: Housing units
required per personrequired per person

Prepared by James R. Burns
dimensions 1 2 3 4 5 6 7 8 9 10 11 12 13 4 15 1617
1 AA 1 -1 1
2 AA/DD 1
3 I/DD 1
4 dimless 1 1
5 CC/AA 1
6 AA/DD -1
7 AA/(BB.DD) 1
8 AA/ZZ 1
9 BB 1
10 CC 1 -1 1
11 CC\DD 1
12 DD -1
13 CC/DD -1
14 CC/(AA.DD) 1
15 ZZ -1
16 CC/AA -1
17 CC 1 -1

Prepared by James R. Burns

Prepared by James R. Burns
Experiments with growth Experiments with growth modelsmodels
Models with only one rate and one Models with only one rate and one statestate
Average lifetime death ratesAverage lifetime death rates cohortscohorts Models in which the exiting rate is Models in which the exiting rate is
not a function of its adjacent statenot a function of its adjacent state Including effects from other variablesIncluding effects from other variables
• ratios and table functionsratios and table functions