Embed Size (px)
Citation preview
Portland State University Portland State University
PDXScholar PDXScholar
Systems Science Faculty Publications and Presentations Systems Science
7-2012
System Dynamics Modeling of Medical Use, System Dynamics Modeling of Medical Use,
Nonmedical Use and Diversion of Prescription Nonmedical Use and Diversion of Prescription
Opioid Analgesics Opioid Analgesics
Wayne Wakeland Portland State University, [email protected]
Alexandra Nielsen Portland State University
Teresa D. Schmidt Portland State University
Follow this and additional works at: https://pdxscholar.library.pdx.edu/sysc_fac
Part of the Chemical Actions and Uses Commons, and the Pharmaceutical Preparations Commons
Let us know how access to this document benefits you.
Citation Details Citation Details Wakeland, W., A. Nielsen, T. Schmidt, “System Dynamics Modeling of Medical Use, Nonmedical Use and Diversion of Prescription Opioid Analgesics,” Proc. 30th Int’l Conf. System Dynamics Society, St. Gallen, Switzerland, July 2012.
This Conference Proceeding is brought to you for free and open access. It has been accepted for inclusion in Systems Science Faculty Publications and Presentations by an authorized administrator of PDXScholar. Please contact us if we can make this document more accessible: [email protected].
System Dynamics Modeling of Medical Use, Nonmedical Use and
Diversion of Prescription Opioid Analgesics
Wayne Wakeland, PhD
Alexandra Nielsen
Teresa Schmidt
Systems Science Graduate Program
Portland State University
P.O. Box 751, Portland, OR 97207
503-725-4975 Fax: 503-725-8489
Abstract: The objective of the study was to develop a system dynamics model of the medical use
of pharmaceutical opioids to treat pain, and the associated diversion and nonmedical use of
these drugs. The model was used to test the impact of simulated interventions in this complex
system. The study relied on secondary data obtained from the literature and from other public
sources for the period 1995 to 2008. In addition, an expert panel provided recommendations
regarding model parameters and model structure. The behavior of the resulting systems level
model compared favorably with reference behavior data (R2=.95). After the base model was
tested, logic to simulate the interventions was added and the impact on overdose deaths was
evaluated over a seven-year period, 2008-2015. Principal findings were that a prescriber
education intervention reduced total overdose deaths, while reducing the number of persons
treated with opioid analgesics. A “popularity” intervention sharply reduced nonmedical
overdoses. We conclude that the system dynamics modeling approach shows promise for
evaluating potential policy interventions to ameliorate the adverse outcomes associated with the
complex system surrounding the use of opioid analgesics to treat pain.
A dramatic rise in the nonmedical use of pharmaceutical opioid pain medicine has
presented the United States with a substantial public health problem (Compton and Volkow
2006). Despite the increasing prevalence of negative outcomes, such as non-fatal and fatal
overdoses, nonmedical use of pharmaceutical opioids remains largely unabated by current
policies and regulations (Fishman et al. 2004). Resistance to policy interventions likely stems
from the complexity of the medical and nonmedical use of pharmaceutical opioids, as evidenced
by the confluence of many factors which play a role in medical treatment, diversion, and abuse
of these products in the United States.
Complex social systems are well known to be resistant to policy interventions, often
exhibiting unintended consequences or unanticipated sources of impedance (Sterman 2000).
These undesirable outcomes can result from our inability to simultaneously consider a large
number of interconnected variables, feedback mechanisms, and complex chains of causation
(Hogarth 1987). Prescription opioid use, diversion, and nonmedical use constitute a complex
system with many interconnected components, including prescribers, pharmacists, persons
obtaining opioids from prescribers for medical or nonmedical use, persons obtaining drugs from
illicit sources, and people selling drugs. Interactions among these actors result in chains of causal
relationships and feedback loops in the system. For example, prescribing behaviors affect
patients’ utilization of opioids; adverse consequences of medical and nonmedical use influence
physicians’ perceptions of the risks associated with prescribing opioids; and physicians’
perception of risk affects subsequent prescribing behaviors (Potter et al. 2001; Joranson et al.
2002).
This paper presents a system dynamics model which attempts to represent the system
described above1. The model is designed to provide a more complete understanding of how
medical use, trafficking, and nonmedical use are interrelated, and to identify points of high
leverage for policy interventions to reduce the adverse consequences associated with the
epidemic of nonmedical use. Two potential interventions are simulated, relative costs and
benefits are estimated, and possible downstream effects are highlighted. Except as noted, the
term “opioids” is used to mean pharmaceutically-manufactured opioid (morphine-like)
medicines, most of which are used to treat pain. Heroin or other illicit opioid drug substances
are not included.
Background
Between 1999 and 2006, the number of U. S. overdose deaths attributed to opioids
tripled—increasing more than fivefold among youth aged 15 to 24 (Warner, Chen, and Makuc
2009)—signaling the onset of a major public health concern. Overdose deaths where opioid
analgesics were involved have outnumbered cocaine and heroin overdoses since 2001
(Unintentional Drug Poisonings in the United States 2010), and estimates from the 2009
National Survey on Drug Use and Health (NSDUH) suggest that 5.3 million individuals (2.1% of
the US population aged 12 and older) used opioids for nonmedical purposes within the previous
month (SAMHSA 2010). Earlier data from NSDUH suggest that the rate of initiation increased
drastically from 1994 to 1999 (SAMHSA 2006), and has continued at high rates, with just over 2
million individuals reporting the initiation of nonmedical use of pain relievers in 2009
(SAMHSA 2010). The 2009 results also indicate that friends or relatives are a common source
for pain relievers used nonmedically. Recent increases in prescribing opioids stem in part from
increases in the diagnosis and recognition of the need to treat chronic noncancer pain.
1 This paper updates a paper presented at the 2011 International System Dynamics Society Conference (Schmidt et
al., 2011). The figures for two of the model sectors described herein look very similar to the diagrams in the
previous paper, but the model logic in those sectors was modified somewhat, and the third sector was modified
significantly. Additional model testing has been performed and documented, and different interventions were run
and are discussed in some detail in this paper.
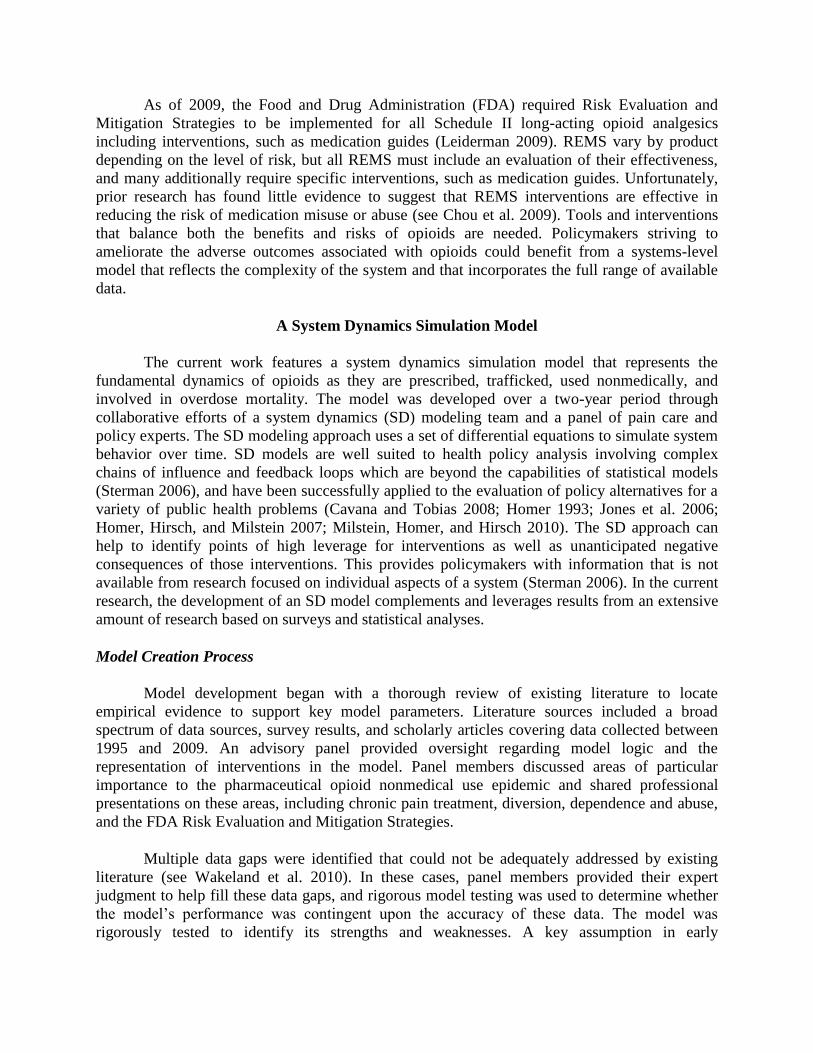
As of 2009, the Food and Drug Administration (FDA) required Risk Evaluation and
Mitigation Strategies to be implemented for all Schedule II long-acting opioid analgesics
including interventions, such as medication guides (Leiderman 2009). REMS vary by product
depending on the level of risk, but all REMS must include an evaluation of their effectiveness,
and many additionally require specific interventions, such as medication guides. Unfortunately,
prior research has found little evidence to suggest that REMS interventions are effective in
reducing the risk of medication misuse or abuse (see Chou et al. 2009). Tools and interventions
that balance both the benefits and risks of opioids are needed. Policymakers striving to
ameliorate the adverse outcomes associated with opioids could benefit from a systems-level
model that reflects the complexity of the system and that incorporates the full range of available
data.
A System Dynamics Simulation Model
The current work features a system dynamics simulation model that represents the
fundamental dynamics of opioids as they are prescribed, trafficked, used nonmedically, and
involved in overdose mortality. The model was developed over a two-year period through
collaborative efforts of a system dynamics (SD) modeling team and a panel of pain care and
policy experts. The SD modeling approach uses a set of differential equations to simulate system
behavior over time. SD models are well suited to health policy analysis involving complex
chains of influence and feedback loops which are beyond the capabilities of statistical models
(Sterman 2006), and have been successfully applied to the evaluation of policy alternatives for a
variety of public health problems (Cavana and Tobias 2008; Homer 1993; Jones et al. 2006;
Homer, Hirsch, and Milstein 2007; Milstein, Homer, and Hirsch 2010). The SD approach can
help to identify points of high leverage for interventions as well as unanticipated negative
consequences of those interventions. This provides policymakers with information that is not
available from research focused on individual aspects of a system (Sterman 2006). In the current
research, the development of an SD model complements and leverages results from an extensive
amount of research based on surveys and statistical analyses.
Model Creation Process
Model development began with a thorough review of existing literature to locate
empirical evidence to support key model parameters. Literature sources included a broad
spectrum of data sources, survey results, and scholarly articles covering data collected between
1995 and 2009. An advisory panel provided oversight regarding model logic and the
representation of interventions in the model. Panel members discussed areas of particular
importance to the pharmaceutical opioid nonmedical use epidemic and shared professional
presentations on these areas, including chronic pain treatment, diversion, dependence and abuse,
and the FDA Risk Evaluation and Mitigation Strategies.
Multiple data gaps were identified that could not be adequately addressed by existing
literature (see Wakeland et al. 2010). In these cases, panel members provided their expert
judgment to help fill these data gaps, and rigorous model testing was used to determine whether
the model’s performance was contingent upon the accuracy of these data. The model was
rigorously tested to identify its strengths and weaknesses. A key assumption in early
formulations was that the epidemic of nonmedical use was essentially driven by increases in
opioid prescribing. But model testing revealed that increases in prescribing and sharing simply
could not account for the full magnitude of the epidemic. Although sharing and other forms of
diversion are necessary to fuel the epidemic, test results indicated that the upsurge in nonmedical
use must have been primarily driven by increased popularity and demand for opioid products in
the nonmedical use sector. This insight led to substantial revision of the model, including
additional consultation with the expert panel and revisions to much of the model logic.
Dynamics of the Opioid System
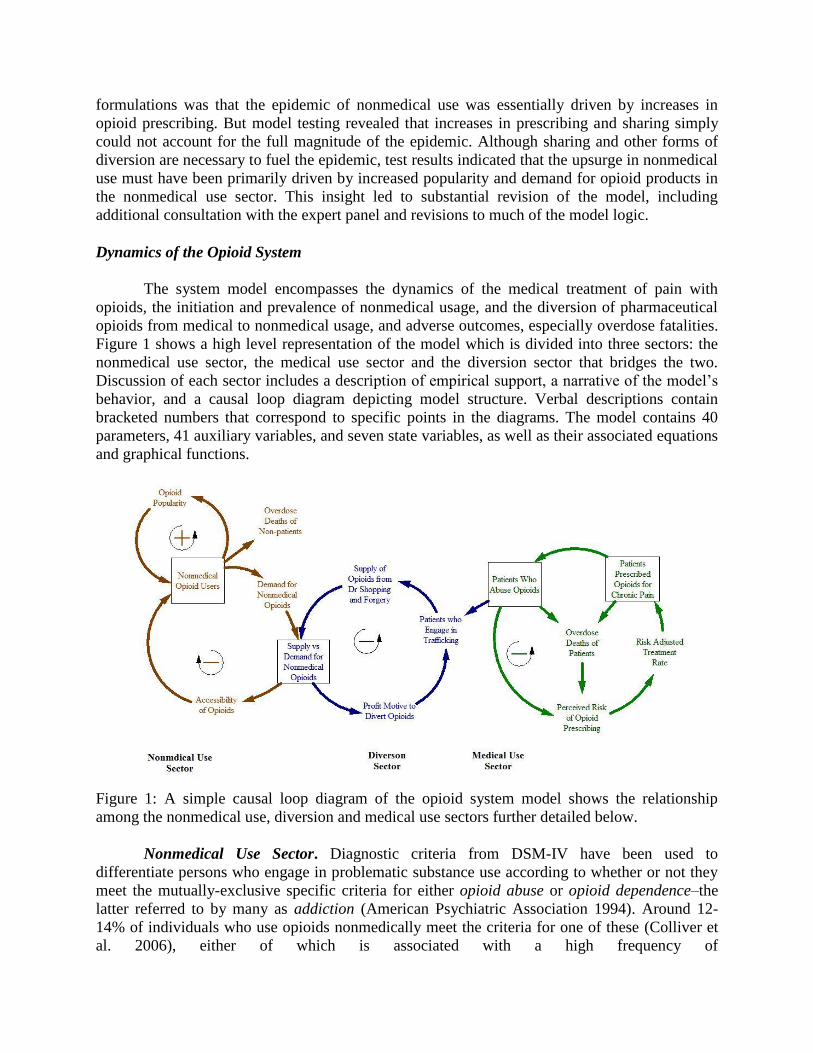
The system model encompasses the dynamics of the medical treatment of pain with
opioids, the initiation and prevalence of nonmedical usage, and the diversion of pharmaceutical
opioids from medical to nonmedical usage, and adverse outcomes, especially overdose fatalities.
Figure 1 shows a high level representation of the model which is divided into three sectors: the
nonmedical use sector, the medical use sector and the diversion sector that bridges the two.
Discussion of each sector includes a description of empirical support, a narrative of the model’s
behavior, and a causal loop diagram depicting model structure. Verbal descriptions contain
bracketed numbers that correspond to specific points in the diagrams. The model contains 40
parameters, 41 auxiliary variables, and seven state variables, as well as their associated equations
and graphical functions.
Figure 1: A simple causal loop diagram of the opioid system model shows the relationship
among the nonmedical use, diversion and medical use sectors further detailed below.
Nonmedical Use Sector. Diagnostic criteria from DSM-IV have been used to
differentiate persons who engage in problematic substance use according to whether or not they
meet the mutually-exclusive specific criteria for either opioid abuse or opioid dependence–the
latter referred to by many as addiction (American Psychiatric Association 1994). Around 12-
14% of individuals who use opioids nonmedically meet the criteria for one of these (Colliver et
al. 2006), either of which is associated with a high frequency of
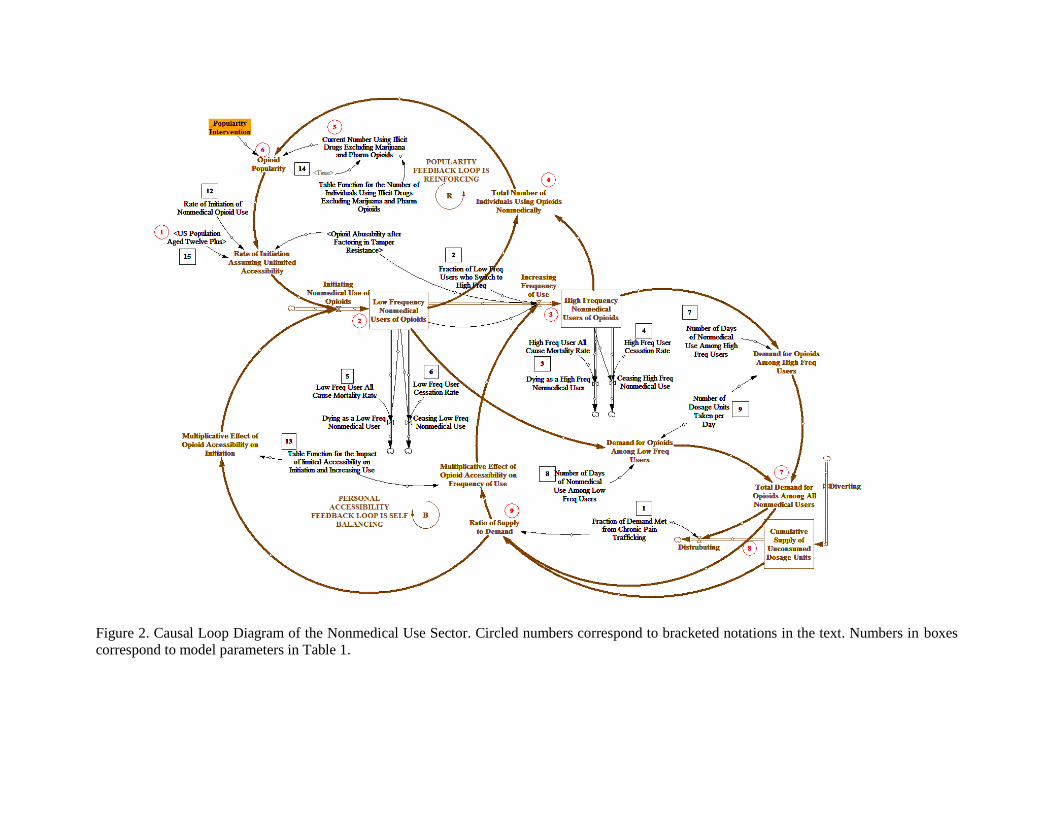
Figure 2. Causal Loop Diagram of the Nonmedical Use Sector. Circled numbers correspond to bracketed notations in the text. Numbers in boxes
correspond to model parameters in Table 1.
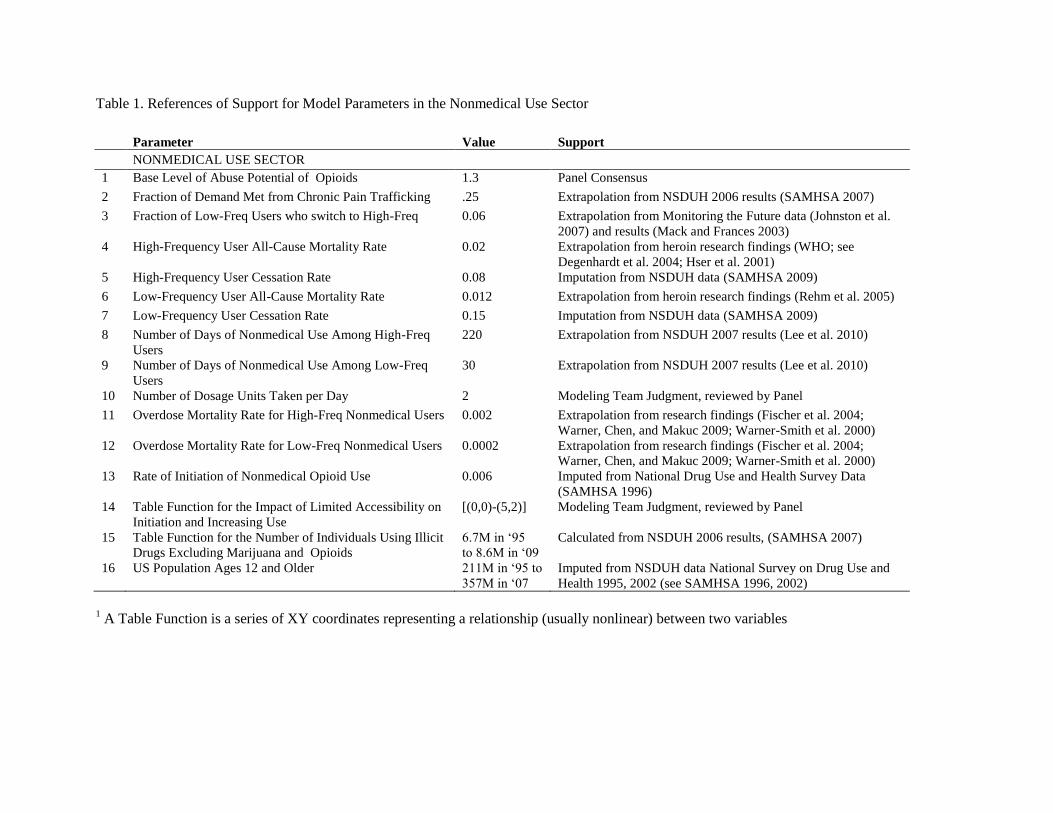
Table 1. References of Support for Model Parameters in the Nonmedical Use Sector
Parameter Value Support
NONMEDICAL USE SECTOR
1 Base Level of Abuse Potential of Opioids 1.3 Panel Consensus
2 Fraction of Demand Met from Chronic Pain Trafficking .25 Extrapolation from NSDUH 2006 results (SAMHSA 2007)
3 Fraction of Low-Freq Users who switch to High-Freq 0.06 Extrapolation from Monitoring the Future data (Johnston et al.
2007) and results (Mack and Frances 2003)
4 High-Frequency User All-Cause Mortality Rate 0.02 Extrapolation from heroin research findings (WHO; see
Degenhardt et al. 2004; Hser et al. 2001)
5 High-Frequency User Cessation Rate 0.08 Imputation from NSDUH data (SAMHSA 2009)
6 Low-Frequency User All-Cause Mortality Rate 0.012 Extrapolation from heroin research findings (Rehm et al. 2005)
7 Low-Frequency User Cessation Rate 0.15 Imputation from NSDUH data (SAMHSA 2009)
8 Number of Days of Nonmedical Use Among High-Freq
Users
220 Extrapolation from NSDUH 2007 results (Lee et al. 2010)
9 Number of Days of Nonmedical Use Among Low-Freq
Users
30 Extrapolation from NSDUH 2007 results (Lee et al. 2010)
10 Number of Dosage Units Taken per Day 2 Modeling Team Judgment, reviewed by Panel
11 Overdose Mortality Rate for High-Freq Nonmedical Users 0.002 Extrapolation from research findings (Fischer et al. 2004;
Warner, Chen, and Makuc 2009; Warner-Smith et al. 2000)
12 Overdose Mortality Rate for Low-Freq Nonmedical Users 0.0002 Extrapolation from research findings (Fischer et al. 2004;
Warner, Chen, and Makuc 2009; Warner-Smith et al. 2000)
13 Rate of Initiation of Nonmedical Opioid Use 0.006 Imputed from National Drug Use and Health Survey Data
(SAMHSA 1996)
14 Table Function for the Impact of Limited Accessibility on
Initiation and Increasing Use
[(0,0)-(5,2)] Modeling Team Judgment, reviewed by Panel
15 Table Function for the Number of Individuals Using Illicit
Drugs Excluding Marijuana and Opioids
6.7M in ‘95
to 8.6M in ‘09
Calculated from NSDUH 2006 results, (SAMHSA 2007)
16 US Population Ages 12 and Older 211M in ‘95 to
357M in ‘07
Imputed from NSDUH data National Survey on Drug Use and
Health 1995, 2002 (see SAMHSA 1996, 2002)
1 A Table Function is a series of XY coordinates representing a relationship (usually nonlinear) between two variables
Running Head: SD modeling of prescription opioid system 7
nonmedical use. Extrapolation from heroin findings indicates that higher-frequency opioid use is
associated with a significantly higher all-cause mortality rate (WHO; see Degenhardt et al. 2004;
Hser et al. 2001) and supports a distinction between two subpopulations of nonmedical users
(low- and high-frequency) in this sector of the model.
As illustrated in Figure 2 and Table 1, a percentage of the US population {1} is assumed to
initiate nonmedical use each year {2}, all of whom start out in a stock of ‘low-frequency
nonmedical users,’ and a small percentage of whom advance to a stock of ‘high-frequency
nonmedical users’ {3} during each subsequent year. The total number of individuals using
opioids nonmedically {4} is divided by the current number of individuals in the US who are
using other drugs nonmedically {5} to calculate the relative popularity of opioids for
nonmedical use {6}. As the popularity of using opioids nonmedically increases, the rate of
initiation increases, creating a positive feedback loop that ceteris paribus would result in an
exponential increase in the rate of initiation. Nonmedically used opioids are obtained through a
variety of routes, but of chief interest for the current research is the prevalence of opioid
‘trafficking’ (i.e., buying or selling) via persons who are receiving these products ostensibly for
treatment. Extrapolation of results from the 2006 NSDUH survey (SAMHSA 2007) suggests
around 25% of the nonmedical demand for opioids is met via trafficking.
In the model, demand for opioids is calculated from the number of individuals in low- and high-
frequency populations {7}. As noted above, 25% of demand is assumed to be met by trafficking
{8}, with the rest coming from sources not modeled explicitly (mostly interpersonal sharing
among friends and relatives, per SAMHSA, 2007). When the trafficking supply is ample relative
to demand, the rate of initiation {2} and the rate of advancement from low-frequency to high-
frequency use {3} are assumed to be somewhat enhanced. When the trafficking supply is
limited, however, rates of initiation and advancement are assumed to decrease dramatically. The
ratio of supply to demand {9} indicates the degree to which opioids are accessible for
nonmedical use. As the populations of nonmedical users increase beyond what trafficking can
support, accessibility becomes limited, decreasing initiation and advancement; which creates a
negative feedback loop that eventually equilibrates the otherwise exponential increase in
nonmedical use driven by the popularity feedback loop.
Medical Use Sector. Historically, increases in opioid abuse, defined as the self-
administered use of an opioid medication for a nonmedical purpose (Katz et al. 2010), and
increases in addiction, which involves uncontrollable compulsions and significant adverse
consequences (Compton, Darakjian, and Miotto 1998), have led to the implementation of
regulatory policies for opioids (Food and Drug Administration 2008). These regulatory policies
have been shown to lead many physicians to avoid prescribing opioids to patients out of fear of
overzealous regulatory scrutiny (Joranson et al. 2002). In addition, prescribers, fearful of
regulatory scrutiny of their opioid analgesic prescribing practices, may decrease the amount of
opioids they prescribe, limit quantities and refills, and shift prescribing to opioid products with a
presumably lower risk of abuse, addiction, or overdose (i.e., products in less-restrictive schedules
under the federal Controlled Substances Act; (Wolfert et al. 2010).
Long-acting opioids have been shown to have a higher rate of abuse than immediate-
release opioid analgesics when abuse rates are normalized for the number of individuals exposed
Running Head: SD modeling of prescription opioid system 8
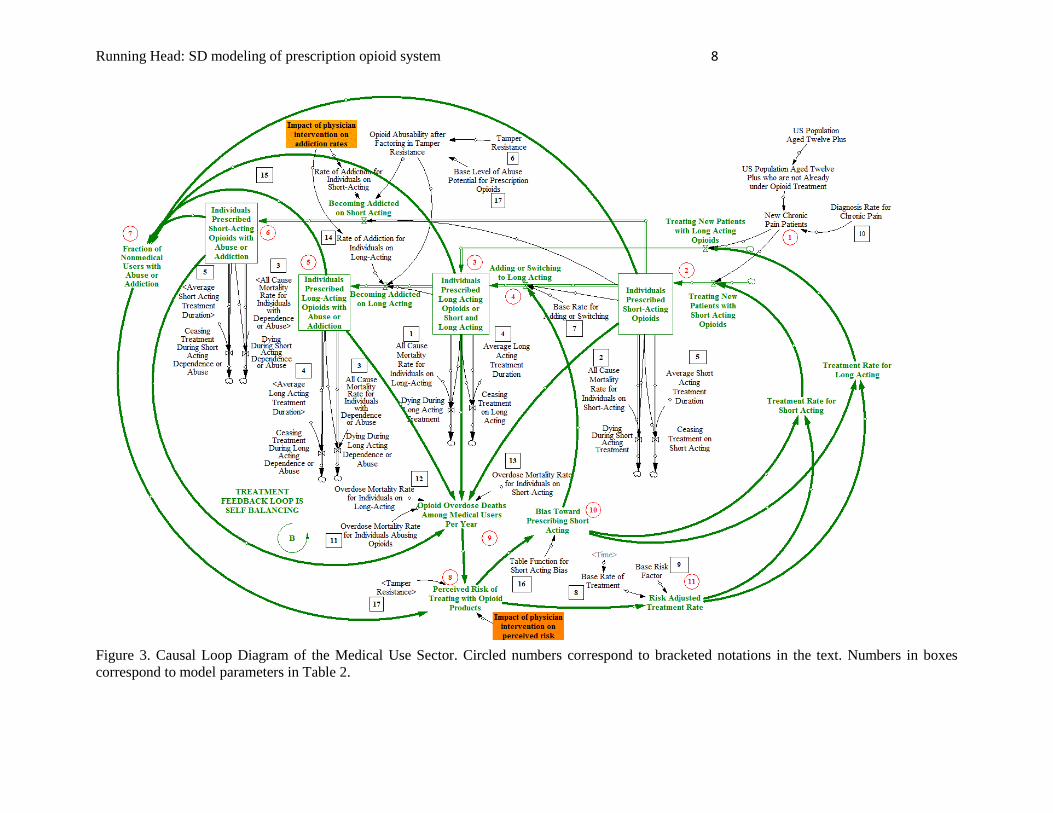
Figure 3. Causal Loop Diagram of the Medical Use Sector. Circled numbers correspond to bracketed notations in the text. Numbers in boxes
correspond to model parameters in Table 2.
Running Head: SD modeling of prescription opioid system 9
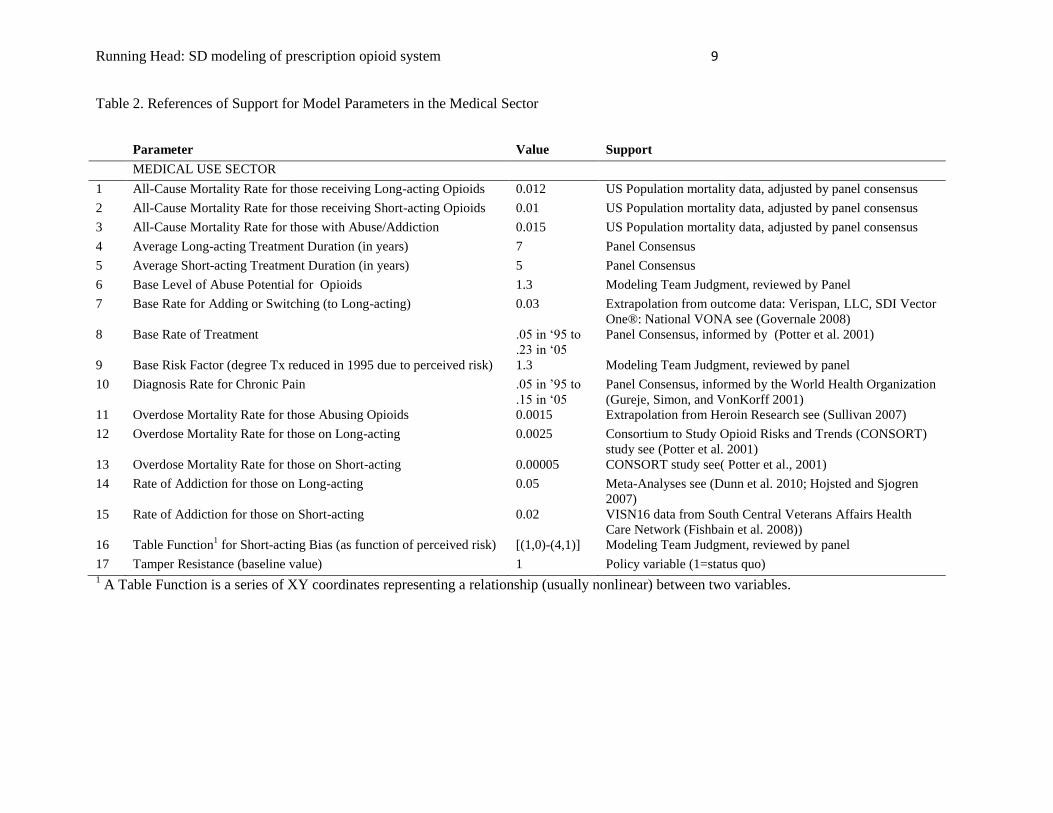
Table 2. References of Support for Model Parameters in the Medical Sector
1 A Table Function is a series of XY coordinates representing a relationship (usually nonlinear) between two variables.
Parameter Value Support
MEDICAL USE SECTOR
1 All-Cause Mortality Rate for those receiving Long-acting Opioids 0.012 US Population mortality data, adjusted by panel consensus
2 All-Cause Mortality Rate for those receiving Short-acting Opioids 0.01 US Population mortality data, adjusted by panel consensus
3 All-Cause Mortality Rate for those with Abuse/Addiction 0.015 US Population mortality data, adjusted by panel consensus
4 Average Long-acting Treatment Duration (in years) 7 Panel Consensus
5 Average Short-acting Treatment Duration (in years) 5 Panel Consensus
6 Base Level of Abuse Potential for Opioids 1.3 Modeling Team Judgment, reviewed by Panel
7 Base Rate for Adding or Switching (to Long-acting) 0.03 Extrapolation from outcome data: Verispan, LLC, SDI Vector
One®: National VONA see (Governale 2008)
8 Base Rate of Treatment .05 in ‘95 to
.23 in ‘05
Panel Consensus, informed by (Potter et al. 2001)
9 Base Risk Factor (degree Tx reduced in 1995 due to perceived risk) 1.3 Modeling Team Judgment, reviewed by panel
10 Diagnosis Rate for Chronic Pain .05 in ’95 to
.15 in ‘05
Panel Consensus, informed by the World Health Organization
(Gureje, Simon, and VonKorff 2001)
11 Overdose Mortality Rate for those Abusing Opioids 0.0015 Extrapolation from Heroin Research see (Sullivan 2007)
12 Overdose Mortality Rate for those on Long-acting 0.0025 Consortium to Study Opioid Risks and Trends (CONSORT)
study see (Potter et al. 2001)
13 Overdose Mortality Rate for those on Short-acting 0.00005 CONSORT study see( Potter et al., 2001)
14 Rate of Addiction for those on Long-acting 0.05 Meta-Analyses see (Dunn et al. 2010; Hojsted and Sjogren
2007)
15 Rate of Addiction for those on Short-acting 0.02 VISN16 data from South Central Veterans Affairs Health
Care Network (Fishbain et al. 2008))
16 Table Function1 for Short-acting Bias (as function of perceived risk) [(1,0)-(4,1)] Modeling Team Judgment, reviewed by panel
17 Tamper Resistance (baseline value) 1 Policy variable (1=status quo)
Running Head: SD modeling of prescription opioid system 10
(Cicero et al. 2007). Sensitive to information regarding relative risk, physicians have been found
to exhibit more caution in prescribing long-acting opioids (Potter et al. 2001).
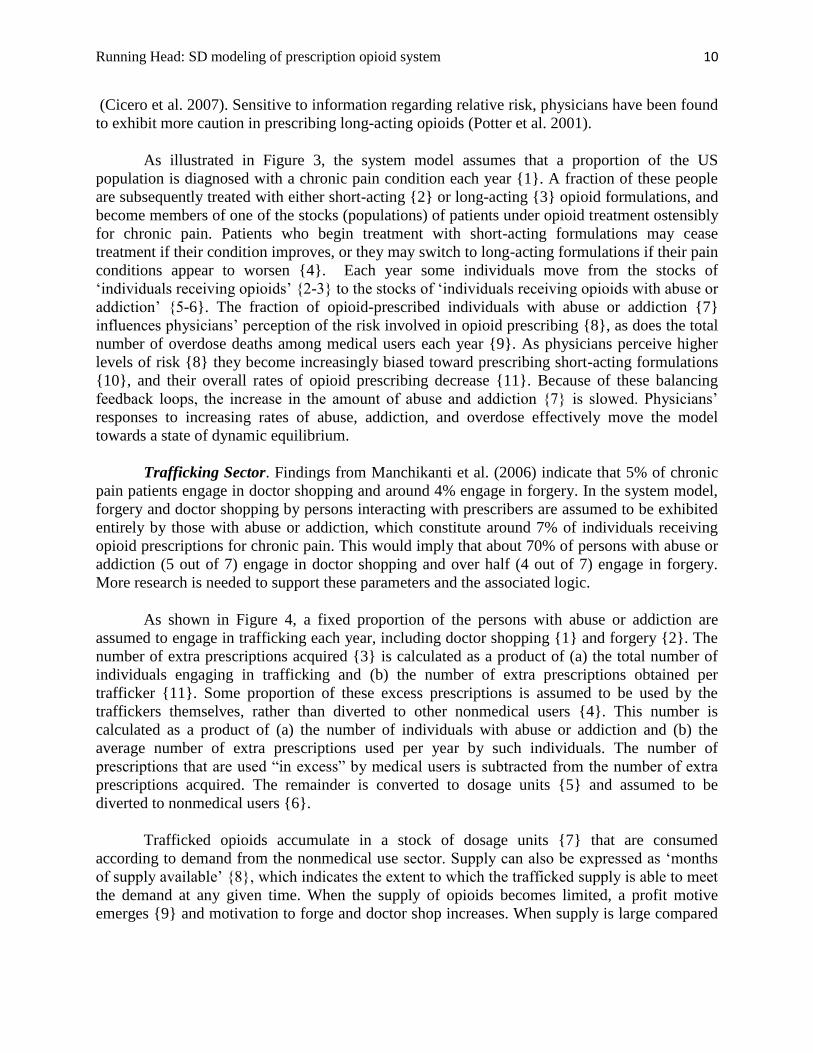
As illustrated in Figure 3, the system model assumes that a proportion of the US
population is diagnosed with a chronic pain condition each year {1}. A fraction of these people
are subsequently treated with either short-acting {2} or long-acting {3} opioid formulations, and
become members of one of the stocks (populations) of patients under opioid treatment ostensibly
for chronic pain. Patients who begin treatment with short-acting formulations may cease
treatment if their condition improves, or they may switch to long-acting formulations if their pain
conditions appear to worsen {4}. Each year some individuals move from the stocks of
‘individuals receiving opioids’ {2-3} to the stocks of ‘individuals receiving opioids with abuse or
addiction’ {5-6}. The fraction of opioid-prescribed individuals with abuse or addiction {7}
influences physicians’ perception of the risk involved in opioid prescribing {8}, as does the total
number of overdose deaths among medical users each year {9}. As physicians perceive higher
levels of risk {8} they become increasingly biased toward prescribing short-acting formulations
{10}, and their overall rates of opioid prescribing decrease {11}. Because of these balancing
feedback loops, the increase in the amount of abuse and addiction {7} is slowed. Physicians’
responses to increasing rates of abuse, addiction, and overdose effectively move the model
towards a state of dynamic equilibrium.
Trafficking Sector. Findings from Manchikanti et al. (2006) indicate that 5% of chronic
pain patients engage in doctor shopping and around 4% engage in forgery. In the system model,
forgery and doctor shopping by persons interacting with prescribers are assumed to be exhibited
entirely by those with abuse or addiction, which constitute around 7% of individuals receiving
opioid prescriptions for chronic pain. This would imply that about 70% of persons with abuse or
addiction (5 out of 7) engage in doctor shopping and over half (4 out of 7) engage in forgery.
More research is needed to support these parameters and the associated logic.
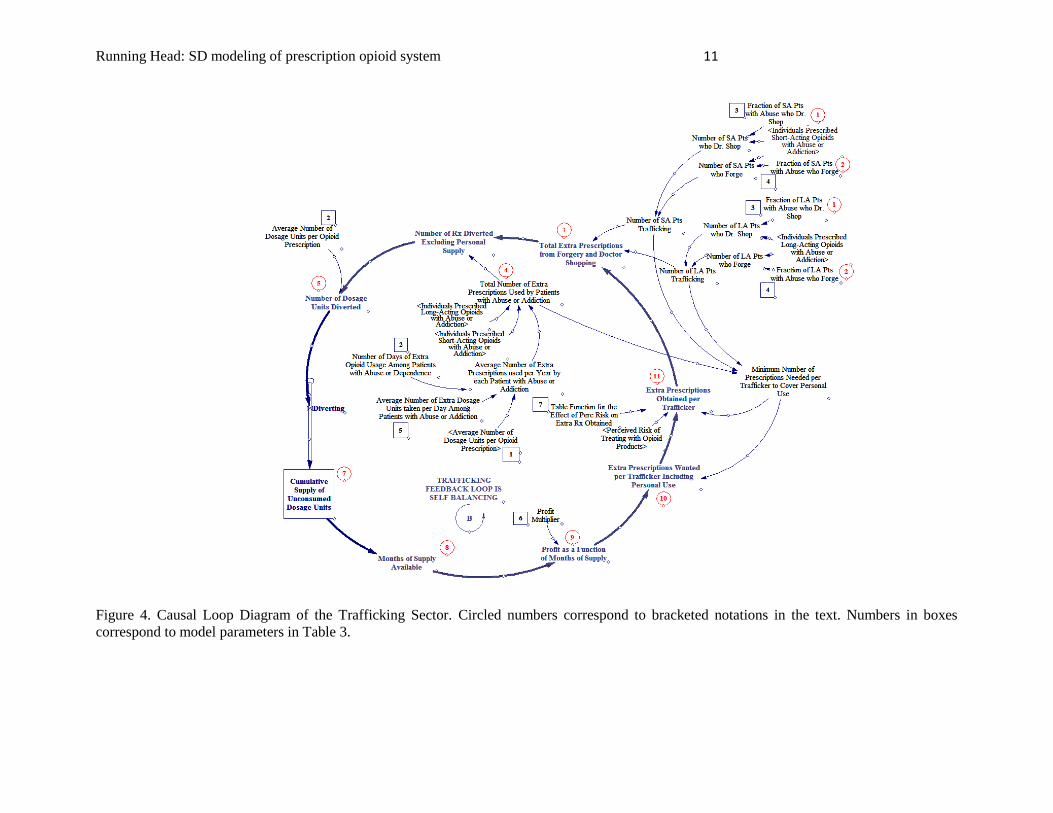
As shown in Figure 4, a fixed proportion of the persons with abuse or addiction are
assumed to engage in trafficking each year, including doctor shopping {1} and forgery {2}. The
number of extra prescriptions acquired {3} is calculated as a product of (a) the total number of
individuals engaging in trafficking and (b) the number of extra prescriptions obtained per
trafficker {11}. Some proportion of these excess prescriptions is assumed to be used by the
traffickers themselves, rather than diverted to other nonmedical users {4}. This number is
calculated as a product of (a) the number of individuals with abuse or addiction and (b) the
average number of extra prescriptions used per year by such individuals. The number of
prescriptions that are used “in excess” by medical users is subtracted from the number of extra
prescriptions acquired. The remainder is converted to dosage units {5} and assumed to be
diverted to nonmedical users {6}.
Trafficked opioids accumulate in a stock of dosage units {7} that are consumed
according to demand from the nonmedical use sector. Supply can also be expressed as ‘months
of supply available’ {8}, which indicates the extent to which the trafficked supply is able to meet
the demand at any given time. When the supply of opioids becomes limited, a profit motive
emerges {9} and motivation to forge and doctor shop increases. When supply is large compared
Running Head: SD modeling of prescription opioid system 11
Figure 4. Causal Loop Diagram of the Trafficking Sector. Circled numbers correspond to bracketed notations in the text. Numbers in boxes
correspond to model parameters in Table 3.
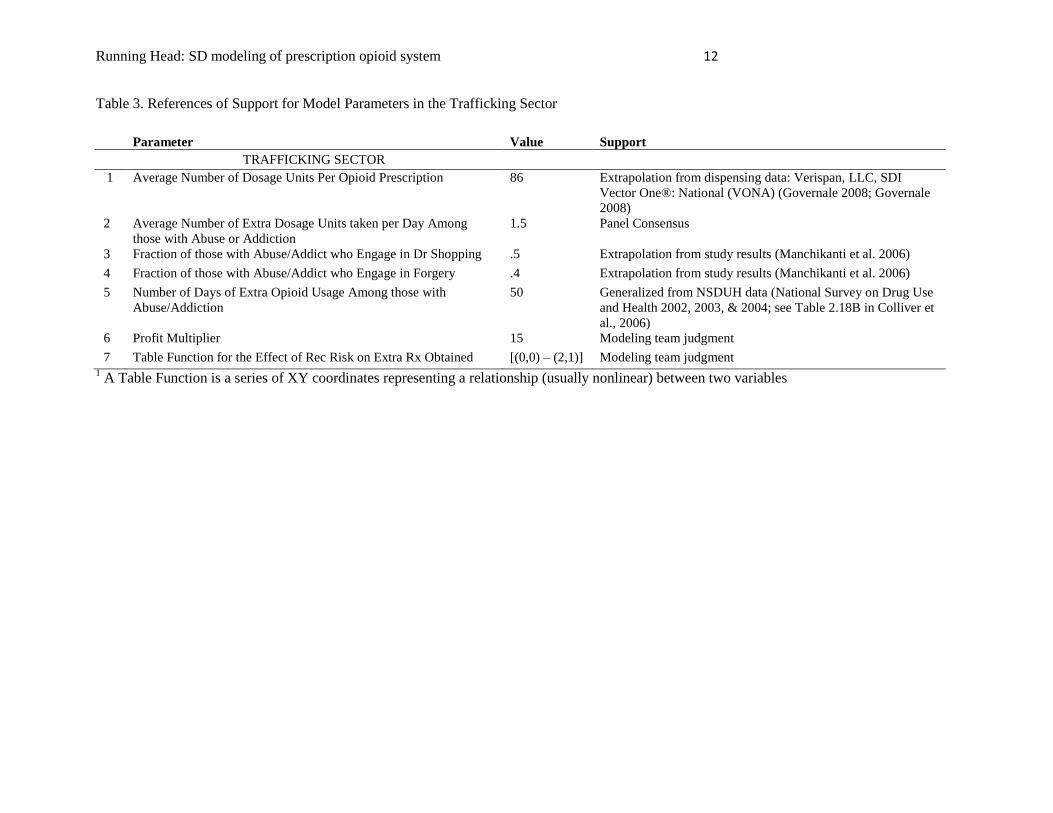
Running Head: SD modeling of prescription opioid system 12
Table 3. References of Support for Model Parameters in the Trafficking Sector
Parameter Value Support
TRAFFICKING SECTOR
1 Average Number of Dosage Units Per Opioid Prescription 86 Extrapolation from dispensing data: Verispan, LLC, SDI
Vector One®: National (VONA) (Governale 2008; Governale
2008)
2 Average Number of Extra Dosage Units taken per Day Among
those with Abuse or Addiction
1.5 Panel Consensus
3 Fraction of those with Abuse/Addict who Engage in Dr Shopping .5 Extrapolation from study results (Manchikanti et al. 2006)
4 Fraction of those with Abuse/Addict who Engage in Forgery .4 Extrapolation from study results (Manchikanti et al. 2006)
5 Number of Days of Extra Opioid Usage Among those with
Abuse/Addiction
50 Generalized from NSDUH data (National Survey on Drug Use
and Health 2002, 2003, & 2004; see Table 2.18B in Colliver et
al., 2006)
6 Profit Multiplier 15 Modeling team judgment
7 Table Function for the Effect of Rec Risk on Extra Rx Obtained [(0,0) – (2,1)] Modeling team judgment 1 A Table Function is a series of XY coordinates representing a relationship (usually nonlinear) between two variables
Running Head: SD modeling of prescription opioid system 13
to demand, motivation to commit fraud for the purpose of sale is small. As this motivation
fluctuates, the number of extra prescriptions each trafficker would like to obtain {10} also
changes. But the number of prescriptions that can be successfully trafficked is attenuated by
cautious dispensing when perceived risk is high among physicians and pharmacies {11}, which
creates a balancing feedback loop that stabilizes the amount of trafficking.
Model Testing
The model was tested in detail to determine its robustness and to gain an overall sense of
its validity. As is often the case with system dynamics models, the empirical support for some of
the parameters was limited, as indicated in Tables 1-3. System Dynamics models are generally
more credible when their behavior is not overly sensitive to changes in the parameters that have
limited empirical support. Therefore, to determine sensitivity of primary outcomes to changes in
parameter values, each parameter in turn was increased by 30% and then decreased by 30%, and
the outcome was recorded in terms of cumulative overdose deaths. Though smaller percentages
are often employed, we wanted to be sure to push the potential nonlinearities further while
remaining well within the model’s design limits. One parameter with limited empirical support
did have a substantial influence on model behavior, meaning that a 30% change in the parameter
value resulted in a greater than 30% change in the cumulative number of overdose deaths
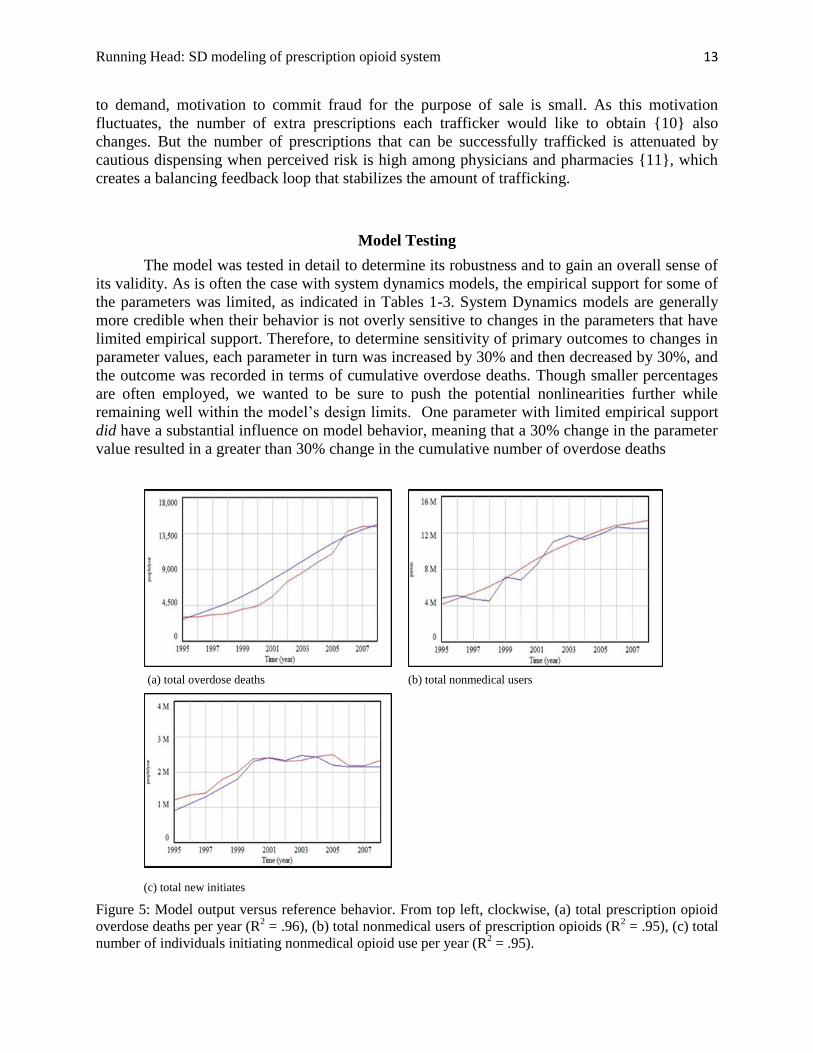
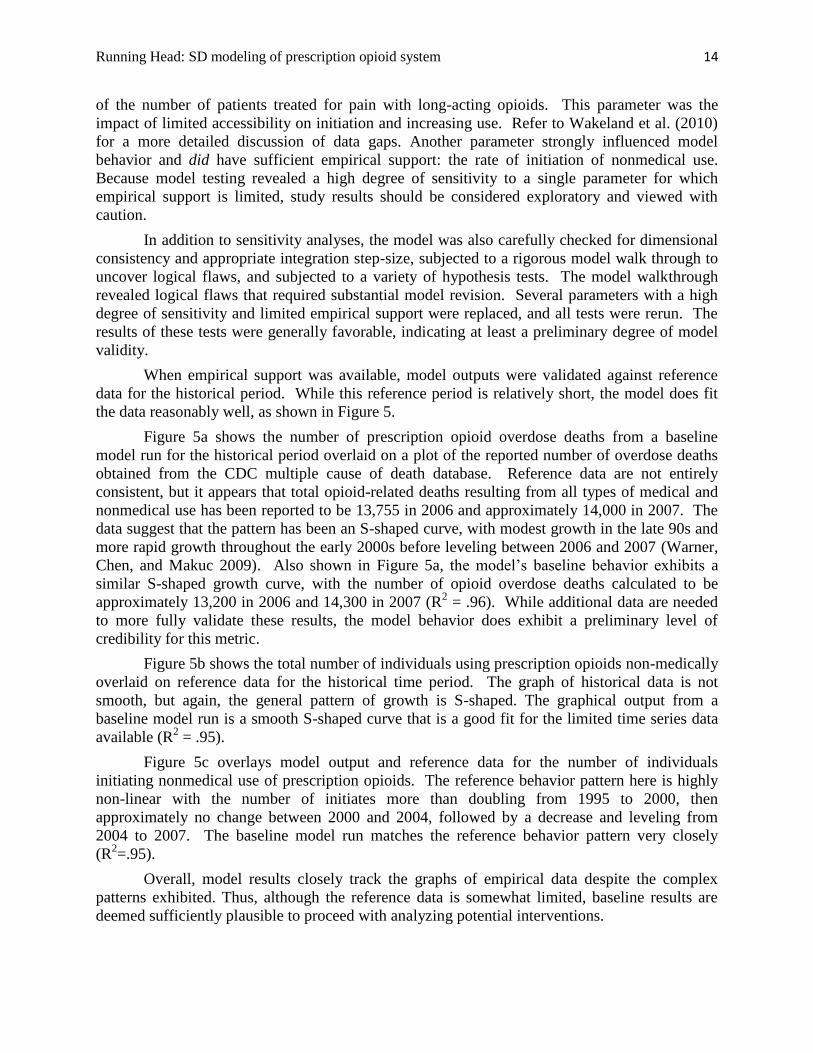
(c) total new initiates
Figure 5: Model output versus reference behavior. From top left, clockwise, (a) total prescription opioid
overdose deaths per year (R2 = .96), (b) total nonmedical users of prescription opioids (R
2 = .95), (c) total
number of individuals initiating nonmedical opioid use per year (R2 = .95).
(a) total overdose deaths (b) total nonmedical users
Running Head: SD modeling of prescription opioid system 14
of the number of patients treated for pain with long-acting opioids. This parameter was the
impact of limited accessibility on initiation and increasing use. Refer to Wakeland et al. (2010)
for a more detailed discussion of data gaps. Another parameter strongly influenced model
behavior and did have sufficient empirical support: the rate of initiation of nonmedical use.
Because model testing revealed a high degree of sensitivity to a single parameter for which
empirical support is limited, study results should be considered exploratory and viewed with
caution.
In addition to sensitivity analyses, the model was also carefully checked for dimensional
consistency and appropriate integration step-size, subjected to a rigorous model walk through to
uncover logical flaws, and subjected to a variety of hypothesis tests. The model walkthrough
revealed logical flaws that required substantial model revision. Several parameters with a high
degree of sensitivity and limited empirical support were replaced, and all tests were rerun. The
results of these tests were generally favorable, indicating at least a preliminary degree of model
validity.
When empirical support was available, model outputs were validated against reference
data for the historical period. While this reference period is relatively short, the model does fit
the data reasonably well, as shown in Figure 5.
Figure 5a shows the number of prescription opioid overdose deaths from a baseline
model run for the historical period overlaid on a plot of the reported number of overdose deaths
obtained from the CDC multiple cause of death database. Reference data are not entirely
consistent, but it appears that total opioid-related deaths resulting from all types of medical and
nonmedical use has been reported to be 13,755 in 2006 and approximately 14,000 in 2007. The
data suggest that the pattern has been an S-shaped curve, with modest growth in the late 90s and
more rapid growth throughout the early 2000s before leveling between 2006 and 2007 (Warner,
Chen, and Makuc 2009). Also shown in Figure 5a, the model’s baseline behavior exhibits a
similar S-shaped growth curve, with the number of opioid overdose deaths calculated to be
approximately 13,200 in 2006 and 14,300 in 2007 (R2 = .96). While additional data are needed
to more fully validate these results, the model behavior does exhibit a preliminary level of
credibility for this metric.
Figure 5b shows the total number of individuals using prescription opioids non-medically
overlaid on reference data for the historical time period. The graph of historical data is not
smooth, but again, the general pattern of growth is S-shaped. The graphical output from a
baseline model run is a smooth S-shaped curve that is a good fit for the limited time series data
available (R2 = .95).
Figure 5c overlays model output and reference data for the number of individuals
initiating nonmedical use of prescription opioids. The reference behavior pattern here is highly
non-linear with the number of initiates more than doubling from 1995 to 2000, then
approximately no change between 2000 and 2004, followed by a decrease and leveling from
2004 to 2007. The baseline model run matches the reference behavior pattern very closely
(R2=.95).
Overall, model results closely track the graphs of empirical data despite the complex
patterns exhibited. Thus, although the reference data is somewhat limited, baseline results are
deemed sufficiently plausible to proceed with analyzing potential interventions.
Running Head: SD modeling of prescription opioid system 15
Results
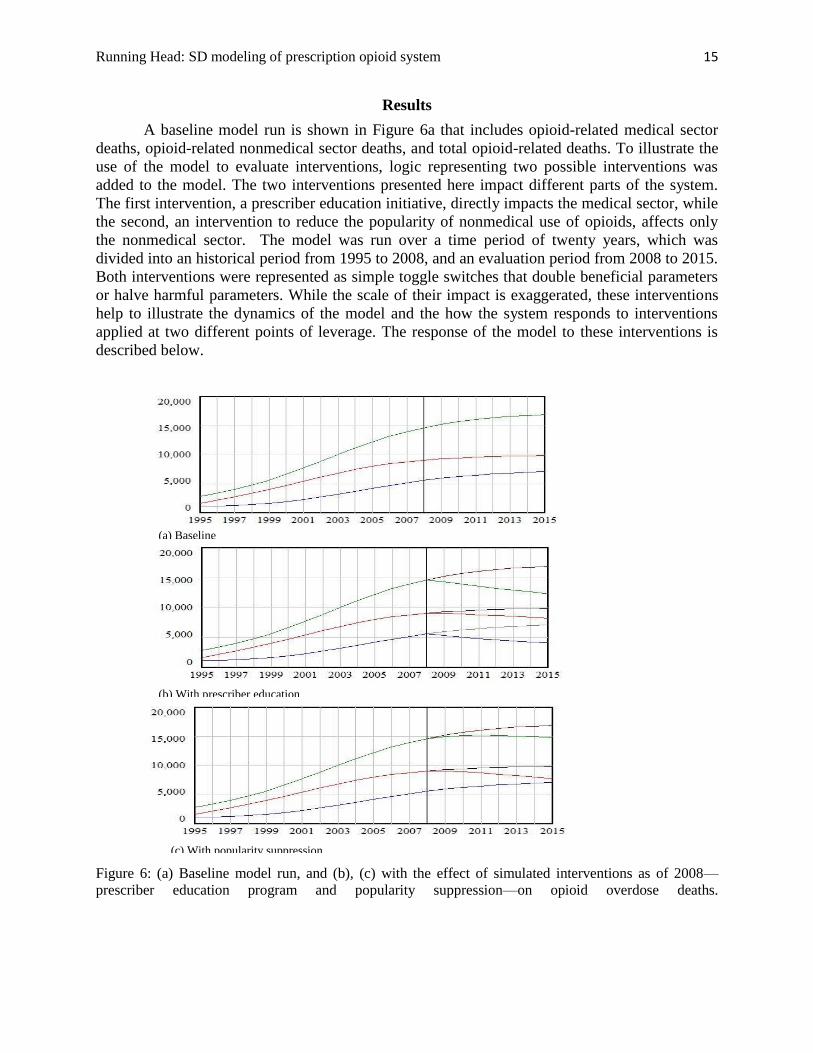
A baseline model run is shown in Figure 6a that includes opioid-related medical sector
deaths, opioid-related nonmedical sector deaths, and total opioid-related deaths. To illustrate the
use of the model to evaluate interventions, logic representing two possible interventions was
added to the model. The two interventions presented here impact different parts of the system.
The first intervention, a prescriber education initiative, directly impacts the medical sector, while
the second, an intervention to reduce the popularity of nonmedical use of opioids, affects only
the nonmedical sector. The model was run over a time period of twenty years, which was
divided into an historical period from 1995 to 2008, and an evaluation period from 2008 to 2015.
Both interventions were represented as simple toggle switches that double beneficial parameters
or halve harmful parameters. While the scale of their impact is exaggerated, these interventions
help to illustrate the dynamics of the model and the how the system responds to interventions
applied at two different points of leverage. The response of the model to these interventions is
described below.
Figure 6: (a) Baseline model run, and (b), (c) with the effect of simulated interventions as of 2008—
prescriber education program and popularity suppression—on opioid overdose deaths.
(a) Baseline
(b) With prescriber education
(c) With popularity suppression
Running Head: SD modeling of prescription opioid system 16
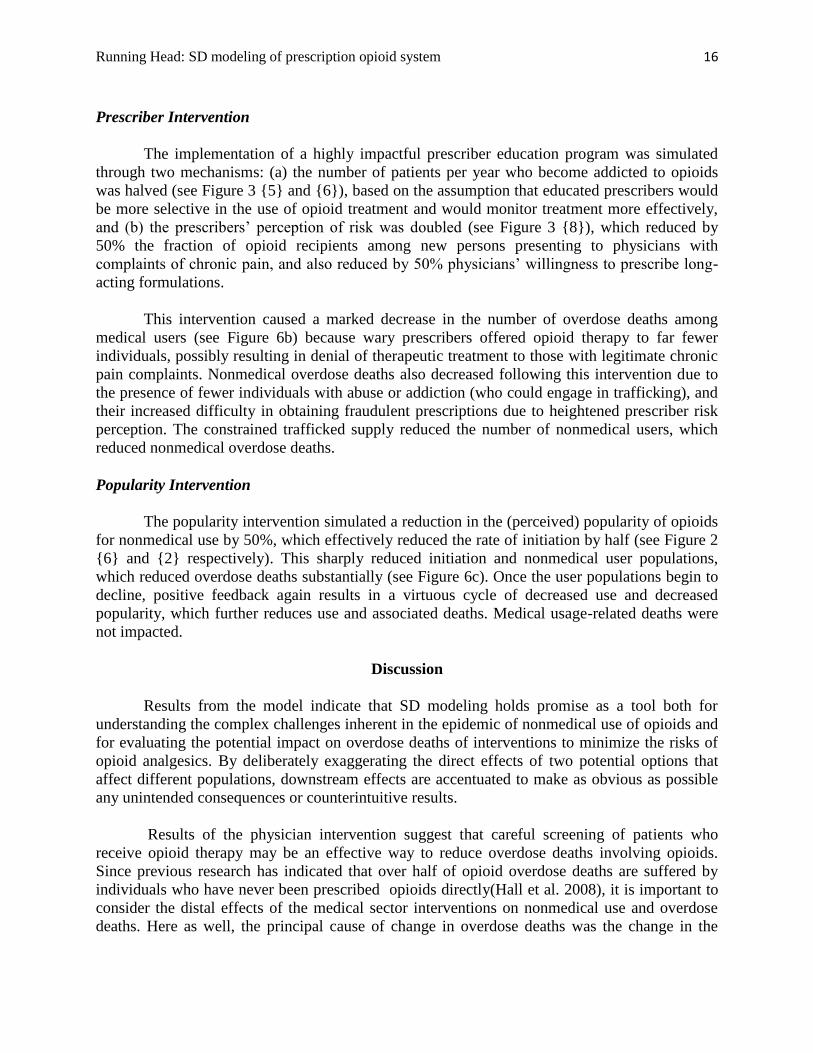
Prescriber Intervention
The implementation of a highly impactful prescriber education program was simulated
through two mechanisms: (a) the number of patients per year who become addicted to opioids
was halved (see Figure 3 {5} and {6}), based on the assumption that educated prescribers would
be more selective in the use of opioid treatment and would monitor treatment more effectively,
and (b) the prescribers’ perception of risk was doubled (see Figure 3 {8}), which reduced by
50% the fraction of opioid recipients among new persons presenting to physicians with
complaints of chronic pain, and also reduced by 50% physicians’ willingness to prescribe long-
acting formulations.
This intervention caused a marked decrease in the number of overdose deaths among
medical users (see Figure 6b) because wary prescribers offered opioid therapy to far fewer
individuals, possibly resulting in denial of therapeutic treatment to those with legitimate chronic
pain complaints. Nonmedical overdose deaths also decreased following this intervention due to
the presence of fewer individuals with abuse or addiction (who could engage in trafficking), and
their increased difficulty in obtaining fraudulent prescriptions due to heightened prescriber risk
perception. The constrained trafficked supply reduced the number of nonmedical users, which
reduced nonmedical overdose deaths.
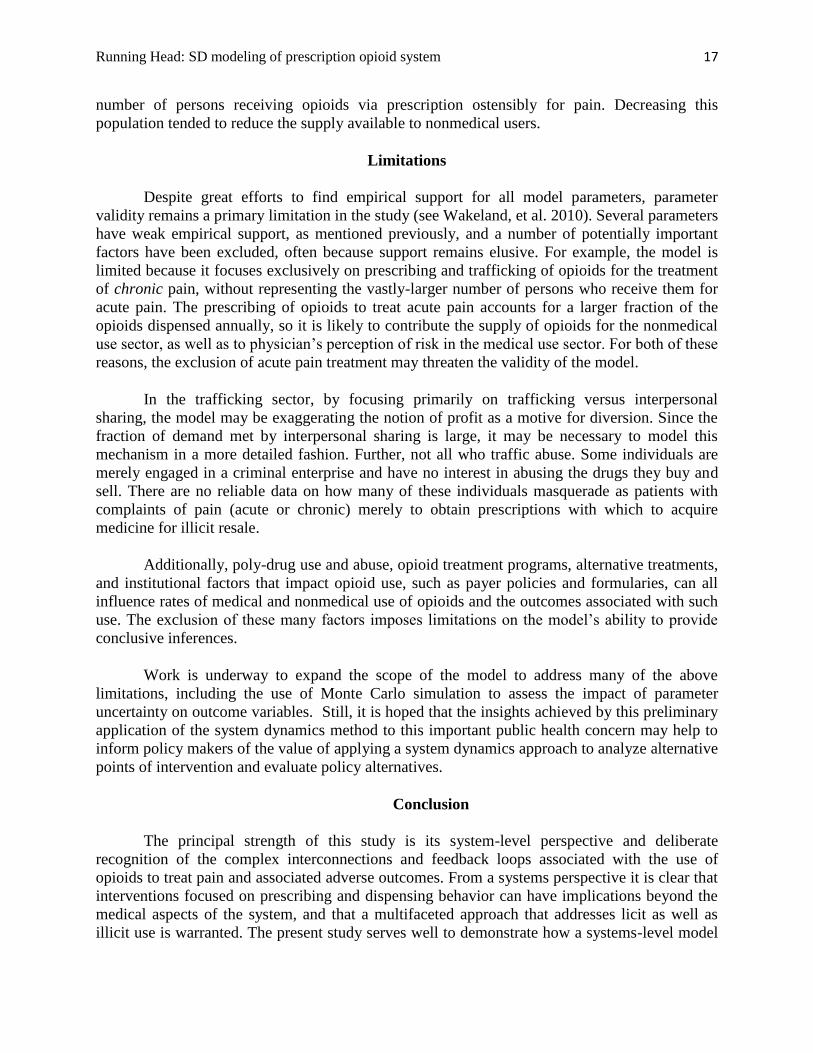
Popularity Intervention
The popularity intervention simulated a reduction in the (perceived) popularity of opioids
for nonmedical use by 50%, which effectively reduced the rate of initiation by half (see Figure 2
{6} and {2} respectively). This sharply reduced initiation and nonmedical user populations,
which reduced overdose deaths substantially (see Figure 6c). Once the user populations begin to
decline, positive feedback again results in a virtuous cycle of decreased use and decreased
popularity, which further reduces use and associated deaths. Medical usage-related deaths were
not impacted.
Discussion
Results from the model indicate that SD modeling holds promise as a tool both for
understanding the complex challenges inherent in the epidemic of nonmedical use of opioids and
for evaluating the potential impact on overdose deaths of interventions to minimize the risks of
opioid analgesics. By deliberately exaggerating the direct effects of two potential options that
affect different populations, downstream effects are accentuated to make as obvious as possible
any unintended consequences or counterintuitive results.
Results of the physician intervention suggest that careful screening of patients who
receive opioid therapy may be an effective way to reduce overdose deaths involving opioids.
Since previous research has indicated that over half of opioid overdose deaths are suffered by
individuals who have never been prescribed opioids directly(Hall et al. 2008), it is important to
consider the distal effects of the medical sector interventions on nonmedical use and overdose
deaths. Here as well, the principal cause of change in overdose deaths was the change in the
Running Head: SD modeling of prescription opioid system 17
number of persons receiving opioids via prescription ostensibly for pain. Decreasing this
population tended to reduce the supply available to nonmedical users.
Limitations
Despite great efforts to find empirical support for all model parameters, parameter
validity remains a primary limitation in the study (see Wakeland, et al. 2010). Several parameters
have weak empirical support, as mentioned previously, and a number of potentially important
factors have been excluded, often because support remains elusive. For example, the model is
limited because it focuses exclusively on prescribing and trafficking of opioids for the treatment
of chronic pain, without representing the vastly-larger number of persons who receive them for
acute pain. The prescribing of opioids to treat acute pain accounts for a larger fraction of the
opioids dispensed annually, so it is likely to contribute the supply of opioids for the nonmedical
use sector, as well as to physician’s perception of risk in the medical use sector. For both of these
reasons, the exclusion of acute pain treatment may threaten the validity of the model.
In the trafficking sector, by focusing primarily on trafficking versus interpersonal
sharing, the model may be exaggerating the notion of profit as a motive for diversion. Since the
fraction of demand met by interpersonal sharing is large, it may be necessary to model this
mechanism in a more detailed fashion. Further, not all who traffic abuse. Some individuals are
merely engaged in a criminal enterprise and have no interest in abusing the drugs they buy and
sell. There are no reliable data on how many of these individuals masquerade as patients with
complaints of pain (acute or chronic) merely to obtain prescriptions with which to acquire
medicine for illicit resale.
Additionally, poly-drug use and abuse, opioid treatment programs, alternative treatments,
and institutional factors that impact opioid use, such as payer policies and formularies, can all
influence rates of medical and nonmedical use of opioids and the outcomes associated with such
use. The exclusion of these many factors imposes limitations on the model’s ability to provide
conclusive inferences.
Work is underway to expand the scope of the model to address many of the above
limitations, including the use of Monte Carlo simulation to assess the impact of parameter
uncertainty on outcome variables. Still, it is hoped that the insights achieved by this preliminary
application of the system dynamics method to this important public health concern may help to
inform policy makers of the value of applying a system dynamics approach to analyze alternative
points of intervention and evaluate policy alternatives.
Conclusion
The principal strength of this study is its system-level perspective and deliberate
recognition of the complex interconnections and feedback loops associated with the use of
opioids to treat pain and associated adverse outcomes. From a systems perspective it is clear that
interventions focused on prescribing and dispensing behavior can have implications beyond the
medical aspects of the system, and that a multifaceted approach that addresses licit as well as
illicit use is warranted. The present study serves well to demonstrate how a systems-level model
Running Head: SD modeling of prescription opioid system 18
may help to evaluate the relative potential efficacy of interventions to reduce opioid-related
overdose deaths.
Acknowledgments
Initial funding for this project was provided by Purdue Pharma L.P., and the team
especially appreciates support from J. David Haddox, DDS, MD, D.A.B.P.M., Vice President of
Health Policy; and John Fitzgerald, PhD, LPC, CAS, Associate Director Risk Management &
Epidemiology. The team also gratefully acknowledges support from the National Institute on
Drug Abuse, grant number 1R21DA031361-01A1. The authors appreciate as well the significant
contributions from Jack Homer, Ph.D., a nationally renowned expert in the application of system
dynamics to public health policy evaluation, who critiqued the technical aspects of the SD
model; Lewis Lee, M.S., who developed the primary model logic and located much of the
needed data, and Louis Macovsky, MS, DVM, who created an initial prototype model and helped
locate data sources. The team also very much appreciates the support received from the advisory
panel for the project: Dennis McCarty, M.A., Ph.D., professor and Vice Chair in the Department
of Public Health & Preventive Medicine at Oregon Health and Science University; Lynn R.
Webster, MD, F.A.C.P.M., F.A.S.A.M., cofounder and Chief Medical Director of the Lifetree
Clinical Research and Pain Clinic; and Aaron Gilson, MS, MSSW, PhD, Director of the U.S.
Program at the Pain & Policy Center at the University of Wisconsin School of Medicine and
Public Health, as well as article reviewers for their helpful comments and suggestions.
Disclosures
Wayne Wakeland, PhD, Teresa Schmidt, MA, and Alexandra Nielsen, BS, were
compensated through a research grant to Portland State University funded by Purdue Pharma
L.P.
References
American Psychiatric Association. 1994. Diagnostic and Statistical Manual of Mental Disorders:
DSM-IV (4th edition). edited by A. P. Association. Washington, DC.
Cavana, R Y, and M Tobias. 2008. Integrative System Dynamics:Analysis of Policy Options for
Tobacco Control in New Zealand. Systems Research and Behavioral Science (25):675-
694.
Chou, R., J. C. Ballantyne, G. J. Fanciullo, P. G. Fine, and C. Miaskowski. 2009. Research gaps
on use of opioids for chronic noncancer pain: findings from a review of the evidence for
an American Pain Society and American Academy of Pain Medicine clinical practice
guideline. J Pain 10 (2):147-59.
Cicero, T. J., H. Surratt, J. A. Inciardi, and A. Munoz. 2007. Relationship between therapeutic
use and abuse of opioid analgesics in rural, suburban, and urban locations in the United
States. Pharmacoepidemiol Drug Saf 16 (8):827-40.
Running Head: SD modeling of prescription opioid system 19
Colliver, J. D., L A Kroutil, L Dai, and J C Gfoerer. 2006. Misuse of prescription drugs data
from the 2002, 2003, and 2004 National Survey on Drug Use and Health. edited by D. o.
H. a. H. Services. Rockville, Md.: Substance Abuse and Mental Health Services
Administration.
Compton, Peggy, Jack Darakjian, and Karen Miotto. 1998. Screening for Addiction in Patients
with Chronic Pain and "Problematic" Substance Use: Evaluation of a Pilot Assessment
Tool. Journal of Pain and Symptom Management 16 (6):355-363.
Compton, W. M., and N. D. Volkow. 2006. Major increases in opioid analgesic abuse in the
United States: concerns and strategies. Drug Alcohol Depend 81 (2):103-7.
Degenhardt, L., W Hall, M Warner-Smith, and M Lynskey. 2004. Illicit Drug Use. In
Comparative quantification of health risks: global and regional burden of disease
attribution to selected major risk factors, edited by M. Ezzati, Lopez, A. D., Rodgers, A.
Murray, C. J. L. Geneva: World Health Organization.
Dunn, Kate M., K. Saunders, C. M. Rutter, C. Banta-Green, J. Merrill, M. Sullivan, C. Weisner,
M. J. Silverberg, C. Campbell, Bruce M. Psaty, and Michael von Korff. 2010. Opioid
Prescriptions for Chronic Pain and Overdose. Annals of Internal Medicine 152 (2):85-
W.19.
Fischer, B., S. Brissette, S. Brochu, J. Bruneau, N. el-Guebaly, L. Noel, J. Rehm, M. Tyndall, C.
Wild, P. Mun, E. Haydon, and D. Bualiunas. 2004. Determinants of overdose incidents
among illicit opioid users in 5 Canadian cities. Canadian Medical Association Journal
171 (3):235-239.
Fishbain, D. A., B. Cole, J. Lewis, H. L. Rosomoff, and R. S. Rosomoff. 2008. What percentage
of chronic nonmalignant pain patients exposed to chronic opioid analgesic therapy
develop abuse/addiction and/or aberrant drug-related behaviors? A structured evidence-
based review. Pain Med 9 (4):444-59.
Fishman, S. M., J. S. Papazian, S. Gonzalez, P. S. Riches, and A. Gilson. 2004. Regulating
opioid prescribing through prescription monitoring programs: balancing drug diversion
and treatment of pain. Pain Med 5 (3).
Food and Drug Administration. 2008. Federal register: Identification of drugs deemed to have
REMS. Federal Register.
Governale, L. 2010. Outpatient Drug Utilization Trends for Extended Release Morphine
Products 2008 [cited June 8 2010]. Available from
http://www.fda.gov/ohrms/DOCKETS/ac/08/slides/2008-4395s2-04-FDA-Governale.ppt.
Governale, L. 2008. Outpatient Drug Utilization Trends for Oxycodone Products (power point
slides). Food and Drug Administration; Anesthetic and Life Support Drugs, and Drug
safety and Risk Management Advisory committees.
Running Head: SD modeling of prescription opioid system 20
Gureje, O, G E Simon, and M VonKorff. 2001. A Cross-National Study of the Course of
Persistent Pain in Primary Care. Pain Medicine (92):195-200.
Hall, A. J., J. E. Logan, R. L. Toblin, J. A. Kaplan, J. C. Kraner, D. Bixler, A. E. Crosby, and L.
J. Paulozzi. 2008. Patterns of abuse among unintentional pharmaceutical overdose
fatalities. Jama 300 (22):2613-20.
Hogarth, Robin M. 1987. Judgement and Choice. 2 ed. Chichester, England: John Wiley and
Sons.
Hojsted, J., and P. Sjogren. 2007. Addiction to opioids in chronic pain patients: a literature
review. Eur J Pain 11 (5):490-518.
Homer, J. B. 1993. Projecting the impact of law enforcement on cocaine prevalence: A system
dynamics approach. Journal of Drug Issues 23 (2):281-295.
Homer, J., G. Hirsch, and Bobby Milstein. 2007. Chronic illness in a complex health economy:
The perils and promises of downstream and upstream reforms. System Dynamics Review
23 (2/3):313-343.
Hser, Y. I., V. Hoffman, C. E. Grella, and M. D. Anglin. 2001. A 33-year follow-up of narcotics
addicts. Arch Gen Psychiatry 58 (5):503-8.
Johnston, L D, P M O'Malley, J G Bachman, and J E Schulenberg. 2007. Overall Illicit Drug Use
by American Teens Continues Gradual Decline in 2007. University of Michigan News
Service, www.monitoringthefuture.org.
Jones, A, J Homer, D Murphy, J Essein, B Milstein, and D Seville. 2006. Understanding
Diabetes Population Dynamics through Simulation Modeling and Experimentation.
American Journal of Public Health (96):488-494.
Joranson, D E, A M Gilson, J L Dahl, and J D Haddox. 2002. Pain Management, Controlled
Substances, and State Medical Board Policy: A Decade of Change. Journal of Pain
Sympton Management (23):138-147.
Katz, N., L. Panas, M. Kim, A. D. Audet, A. Bilansky, J. Eadie, P. Kreiner, F. C. Paillard, C.
Thomas, and G. Carrow. 2010. Usefulness of prescription monitoring programs for
surveillance--analysis of Schedule II opioid prescription data in Massachusetts, 1996-
2006. Pharmacoepidemiol Drug Saf 19 (2):115-23.
Lee, Lewis, Dennis McCarty, J David Haddox, John Fitzgerald, Wayne Wakeland, and Lynn
Webster. 2010. Non-Prescribed use of Vicodin and OxyContin among US Youth. In
College on Problems of Drug Dependence, 72nd Annual Scientific Meeting. Scottsdale,
AZ.
Running Head: SD modeling of prescription opioid system 21
Leiderman, Deborah B. 2009. Risk management of drug products and the U.S. Food and Drug
Administration: Evolution and context. Drug and Alcohol Dependence 105 (Supplement
1):S9-S13.
Mack, A. H., and R. J. Frances. 2003. Substance-related disorders. Focus 1 (2).
Manchikanti, L., K. A. Cash, K. S. Damron, R. Manchukonda, V. Pampati, and C. D. McManus.
2006. Controlled substance abuse and illicit drug use in chronic pain patients: An
evaluation of multiple variables. Pain Physician 9 (3):215-25.
Milstein, B, J Homer, and G Hirsch. 2010. Analyzing National Health Reform Strategies with a
Dynamic Simulation Model. American Journal of Public Health 100 (5):811-819.
Potter, M., S. Schafer, E. Gonzalez-Mendez, K. Gjeltema, A. Lopez, J. Wu, R. Pedrin, M. Cozen,
R. Wilson, D. Thom, and M. Croughan-Minihane. 2001. Opioids for chronic
nonmalignant pain. Attitudes and practices of primary care physicians in the
UCSF/Stanford Collaborative Research Network. University of California, San
Francisco. J Fam Pract 50 (2):145-51.
Rehm, J., U. Frick, C. Hartwig, F. Gutzwiller, P. Gschwend, and A. Uchtenhagen. 2005.
Mortality in heroin-assisted treatment in Switzerland 1994-2000. Drug Alcohol Depend
79 (2):137-43.
SAMHSA. 1996. National Household Survey on Drug Abuse Advance Report #18.
http://www.oas.samhsa.gov/nhsda/ar18ttoc.htm.
———. 2002. National Survey on Drug Use and Health, 2002. edited by U. S. D. o. H. S. Office
of Applied Studies. Ann Arbor, MI: Inter-university consortium for Policital and Social
Research
———. 2006. Overview of findings from the 2005 National Survey on Drug Use and Health.
edited by O. o. A. Studies. Rockville, MD: Office of Applied Studies.
———. 2007. Results from the 2006 National Survey on Drug Use and Health: National Survey.
http://www.oas.samhsa.gov/nsduh/2k6nsduh/2k6results.pdf
———. 2009. National Survey on Drug Use and Health 2007. edited by U. S. D. o. H. S. Office
of Applied Studies. Ann Arbor, MI: Inter-university consortium for Political and Social
Research.
———. 2010. Results from the 2009 National Survey on Drug use and Health : Volume I.
Summary of National Findings. edited by O. o. A. Studies. Rockville, MD.
Running Head: SD modeling of prescription opioid system 22
Sterman, John D. 2000. Business Dynamics: Systems Thinking and Modeling for a Complex
World. Boston: Irwin McGraw-Hill.
———. 2006. Learning from Evidence in a Complex World. American Journal of Public Health
(96):505-514.
Sullivan, M. . 2007. Epidemiology of chronic non-cancer pain and its treatment with Opioids In
Pain, Opioids and Addiction. Bethesda
Unintentional Drug Poisonings in the United States. 2010. CDC Issue Brief,
http://www.cdc.gov/HomeandRecreationalSafety/pdf/poison-issue-brief.pdf.
Wakeland, Wayne, John Fitzgerald, Aaron Gilson, David Haddox, Jack Homer, Lewis Lee,
Louis Macovsky, Dennis McCarty, Teresa Schmidt, and Lynn Webster. 2010. Key Data
Gaps for Understanding Trends in Prescription Opioid Analgesic Abuse and Diversion
among Chronic Pain Patients and Nonmedical Users. Paper read at College on Problems
of Drug Dependence, 72nd Annual Scientific Meeting, at Scottsdale, AZ.
Warner-Smith, M., M. Lynskey, S. Darke, and W. Hall. 2000. Heroin Overdose: Prevalence,
Correlates, Consequences and Interventions. Vol. 46. Sydney: National Drug and
Alcohol Research Center.
Warner, M., L. H. Chen, and D. M. Makuc. 2009. Increase in Fatal Poisonings Involving Opioid
Analgesics in the United States, 1999-2006. NCHS Data Breif (22).
Wolfert, M Z, A M Gilson, J L Dahl, and J F Cleary. 2010. Opioid Analgesics for Pain Control:
Wisconsin Physicians' Knowlede, Beliefs, Attitudes, and Prescribing Practices. Pain
Medicine 11 (3):425-434.