Embed Size (px)
Citation preview
System Dynamics Modelling Approach for Palm Oil Supply Chain under Various Policy Interventions: A Case Study in
Indonesia’s Private Company
Nathania Astria, M. Dachyar, Rahmat Nurcahyo Industrial Engineering Department Universitas Indonesia, Indonesia
[email protected]; [email protected]; [email protected]
Abstract The development of Indonesian palm oil industry in international trade does not ignore challenges such as competition with products from other exporting countries as well as trade barriers from importing countries. With the new delegated regulation by the European Commission that considers palm oil does not meet the principle of sustainability in the concept of renewable energy, Indonesian government is encouraged to increase the effectiveness of mandatory biodiesel implementation by adjusting regulation domestically. This situation affects the performance of oil private palm companies, which currently contribute ± 50% to the total land area and production of Indonesian palm oil. This research aims to modelling the supply chain system of a large private company with system dynamics approach that can be simulated under government policies intervention related to the palm oil industry and supply chain performance. System dynamics simulation is used to draw causal relationship of the supply chain and to monitor government regulations on supply chain performance. The result of this research is a conceptual model for decision making that can support the company's supply chain performance under different policies. Keywords Palm oil; Government policy; Biodiesel; Supply chain management; System dynamics 1. Introduction Palm oil is one of the agricultural commodities with the best potential to produce alternative energy sources, such as fuel for industry and transportation, power generation and home industries, oil palm is one of the most profitable crops and has a high expansion rate compared to other tropical plants (Pacheco. et al., 2017). Palm oil itself takes a role in various aspects of daily life because palm oil processed products can be in the form of food; daily needs; cosmetics and source of renewable fuel, namely biodiesel (Directorate General of Estate Crops, 2020). Since diesel and renewable oil in Indonesia have a significant role to many sectors which results in market demand for this commodity continues to increase (Hardiati et al., 2015, Rahman et al., 2017).
Most of Indonesia's palm oil are exported to several countries, such as China, India, Pakistan, Europe, etc., with its contribution to Gross Domestic Product (GDP) reaching 3.5% and has become an important foreign exchange contributor with a total export value of 21, 4 billion USD in 2018 (Alika, 2019; Kunene & Chung, 2020). Due to the increase in demand, it can directly or indirectly trigger investment in the palm oil industry which has an impact on the establishment or expansion of oil palm plantations to increase production. This phenomenon supports that this commodity is described as two inseparable sides of a coin (Joyosemito et al., 2015), where one side represents the economic development, but on the other hand it cannot be separated from environmental issues.
For the case of using palm oil as a renewable fuel, European Union has set the target for the used of renewable fuels to reduce greenhouse gas emissions. Statistically, Europe is one of the largest export destinations for Indonesia, which is dominated by the Netherlands and Italy which account for 15.2% of the total volume of Indonesia’s CPO exports (BPS, 2018).
However, behind the strategic value of palm oil in domestic and export market, the government indicates that there is a black campaign on Indonesian palm oil which links to health and environmental issues, and this issue is stated in the
Proceedings of the 11th Annual International Conference on Industrial Engineering and Operations Management Singapore, March 7-11, 2021
© IEOM Society International 1760

regulations adopted by the European Union through the Renewable Energy Directive (RED) II policy on 21 December 2018 that consider palm oil does not meet the principles of sustainability in the concept of renewable energy promoted by the European Union, this was followed up by the delegated Act issued on March 13, 2019 to immediately implement steps to gradually reduce and stop importing palm oil which is considered a raw material biofuels at high risk. This matter has a direct impact in terms of export numbers to the EU in 2019, This matter directly affects the decrease of CPO export numbers to EU countries in 2019 by 11.78% to 3.29 million tonnages which can be seen in Figure 1 below.
Figure 1. Development of Indonesian Palm Oil Exports to the European Union
Seeing these problems, government tries to replace the share of the export market to release Indonesia's dependency on the EU market by developing and utilizing biodiesel-based biomass that benefits for both the government and society through established mandatory policies and increase effectiveness of its implementation, to meet Indonesia's domestic consumption. (Dharmawan et al., 2020)
1.1 Objectives The strategic role of palm oil as an agricultural commodity in Indonesia is inseparable from government intervention or policies, where this policy aims to maintain and increase the competitiveness of the national palm oil industry and obtain greater added value. Government regulation also affect the private company as part of the palm oil producer that contributes ±50% to the entire palm oil industry (BPS,2018).
Seeing the significant contribution of private company performance, this research aim to design a conceptual model of a large private company supply chain with system dynamics approach that can be used for decision making to support the company's supply chain performance under different policies. 2. Literature Review 2.1 Palm Oil Supply Chain Chopra and Meindl (2012) defined supply chain system as chain processes which involve all stages, either directly or indirectly to fulfil customer requests. Not only supply chain includes the role of manufacturers and suppliers, but also transporters, warehouses, retailers, and customers themselves (Chopra & Peter Meindl, 2012)
In the company, supply chain has a significant role to ensure the improvement of efficiency and productivity to gain competitive strategy and satisfy customer (Dachyar & Mahendra, 2019). Management of the supply chain ensured increased performance and competitiveness, competitive advantage and customer loyalty (Dachyar & Mahendra, 2019). Most companies typically have a similar set of activities in the agricultural supply chain that produce fresh or manufactured goods from farms through the use of appropriate technologies that create added value to the finished products. Farmers, auctioneers, wholesalers, importers and exporters, retailers and specialty stores, and third-party logistics providers are typically involved in the supply chain of fresh agricultural products. Palm oil is one of an
0.0 500.0 1 000.0 1 500.0
Spain
Netherlands
Italy
1 367.9
1 286.4
1 066.5
1 168.6
1 161.1
888.9
1 078.8
914.9
751.3
Volume (MT)
Cou
ntry
Development of Palm Oil Exports to the European Union
2019
2018
2017
Proceedings of the 11th Annual International Conference on Industrial Engineering and Operations Management Singapore, March 7-11, 2021
© IEOM Society International 1761

agricultural product, processed through a set of activities. First, fresh fruit bunches in the plantation are harvested and transported to the mills to be sterilized and extracted into crude palm oil. The oil is then processed chemically in the palm oil refinery to produce palm oil derivatives product that can be distributed to the customer. (Hadiguna & Tjahjono, 2017)
Supply chain and its values are used to understand the industry for increasing its competitiveness (Kaplinsky & Morris, 2001). Development of supply chain and value chain is a method for analyzing industrial competitiveness based on process linkage and value added activities in the industry. The value chain describes all activities (in industry) as added value linkages, which are required to bring a product or service to market. The palm oil industry value chain process, focus on Crude Palm Oil (CPO) and Refined Palm Oil (RPO). There are three main producers of fresh fruit bunches to be processed into CPO: smallholders (SH), private company, and government. 2.2 Policy Scenario Analysis Based on the strategic role of the palm oil industry, the development of this industry is related to national politics (Pacheco. Et al., 2017), so intervention from the government is needed in the form of regulations in an effort to maintain and increase the contribution of palm oil to the Indonesian economy so that it can continue to grow and sustainable. Policy analyses are used to evaluate policies from a system. It allows the policy maker to compare how a system would react to different policies through simulation. (Ford & Ph, 2018)
Research related to policy analysis has been carried out using various methods of analysis. Applanaidu et al., (2015) conducted an econometric model approach for the analysis of mandatory biodiesel blending (B10) policies on the palm oil industry in Malaysia. Castiblanco et al., (2015) studied the economic impact of policies promoting the production of biodiesel in Colombia on oil palm producers' incomes, prices, production levels of crude palm oil (CPO) and biodiesel, as well as the impact on land demand for the expansion of oil palm plantations. Modeling the policy mix using an econometric model is also used to determine the effect of policy on the competitive index of Indonesian oil palm (Silitonga et al., 2016). Policy scenario analysis can also be done through a spatial logistic regression model approach (Sumarga & Hein, 2016) to determine the impact of land development in Central Kalimantan; and a stochastic approach to determine the impact of policies on reducing carbon emissions (Zhao et al., 2020). 2.3 Dynamic Modelling in Palm Oil Industry The other approach to determine the impact of policy scenarios is by system dynamics modelling. Modelling can be interpreted as an imitation of a real world model created in virtual form. When modelling a system, it is necessary to have an understanding of the real model itself, specifically in terms of the systems approach (Sterman, 2000). Through model development, we can describe and analyse how the change in policy variable affect the company characteristics system (Dachyar & Yudavedito, 2011)
Some previous research has analysed several problems in the palm oil industry using a dynamic modelling system with certain scenarios, where there are research objects that focus on the sustainability and adequacy of food and energy needs (Mayasari & Dalimi, 2017; Musango et al., 2012; Rahman et al., 2017; Wijaya et al., 2017); There are also those who apply several simulation scenarios to increase the supply chain for sustainable production of palm oil (Muzayanah et al., 2018) and their dynamics for land change (Ibragimov et al., 2019) to simulate government policies related to the biodiesel industry and its relation to the palm oil industry. (Applanaidu et al., 2015; Mayasari et al., 2019; Zabid et al., 2018). The development of a dynamic model is also carried out by Purnomo et al. (2020) to provide further understanding of the performance of the palm oil industry in Indonesia which can make it easier for stakeholders to make decisions seen from the national palm oil industry. 3. Methods System dynamics is a scientific discipline that was initiated by MIT Professor, Jay W. Forrester in 1956. System Dynamics has its roots in management science and modern control theory, then it has been gradually used as a tool for analyzing social, economic, physical, chemical, biological, ecological, historical and even literary systems.
System dynamics is the methodology used to understand how the system changes within time. This approach focuses on feedback processes that are accountable for the changes throughout the period. To identify internal causes of a problem, it investigates within a system. This creates an endogenous point of view that requires interconnected feedback loops and causality to capture behaviour within system boundaries (Meyers, 2011).
Proceedings of the 11th Annual International Conference on Industrial Engineering and Operations Management Singapore, March 7-11, 2021
© IEOM Society International 1762
The model should provide a more effective understanding of systems that have previously exhibited confusing or controversial behavior. In general, a dynamic systems model project or research that is said to be influential is research that can change the way people think about the system. The beliefs or policies currently being implemented may indeed work well, but sometimes there are differences of opinion that need to be resolved. And when this happens, the researcher must clearly know which mental models influence and what affected by it. Based on this understanding, a successful model begins with by identifying the target of the model. (Forrester, 1993)
This research follows the process in system dynamics modeling by Sterman (2000) which consists of the following steps: (i) problem formulation and selection of real-world boundaries; this stage includes the activity of selecting the theme to be studied, determining key variables, planning a time period and how far past events are considered to defined the problem; (ii) Model conceptualization; develop dynamic hypothesis formulation by establishing hypotheses based on the theory of behavior towards the problem and building a causal map through a mental model with the help of Causal Loop Diagrams (CLD) and stock flow diagrams; (iii) Model Formulation, includes the simulation model stage, by making structural specifications, decision rules, parameter estimation and consistency testing with predetermined goals and limits;(iv) Model Validation conducts a series of testing through comparison of the model used as reference, robustness testing and sensitivity testing; (v) Lastly, evaluating the designing policies based on scenarios that have been tried out from the simulation results.
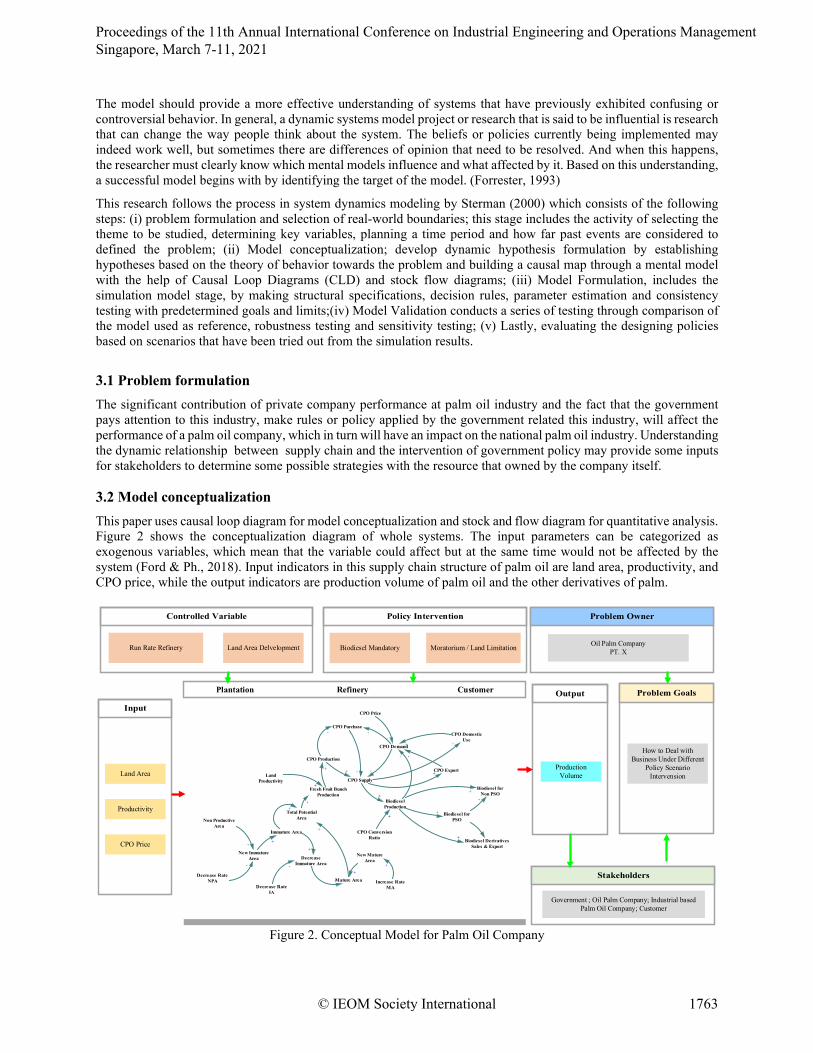
3.1 Problem formulation The significant contribution of private company performance at palm oil industry and the fact that the government pays attention to this industry, make rules or policy applied by the government related this industry, will affect the performance of a palm oil company, which in turn will have an impact on the national palm oil industry. Understanding the dynamic relationship between supply chain and the intervention of government policy may provide some inputs for stakeholders to determine some possible strategies with the resource that owned by the company itself. 3.2 Model conceptualization This paper uses causal loop diagram for model conceptualization and stock and flow diagram for quantitative analysis. Figure 2 shows the conceptualization diagram of whole systems. The input parameters can be categorized as exogenous variables, which mean that the variable could affect but at the same time would not be affected by the system (Ford & Ph., 2018). Input indicators in this supply chain structure of palm oil are land area, productivity, and CPO price, while the output indicators are production volume of palm oil and the other derivatives of palm.
Plantation Refinery Customer
Biodiesel Mandatory Moratorium / Land Limitation
Land Area
Productivity
Production Volume
Oil Palm CompanyPT. X
How to Deal with Business Under Different
Policy Scenario Intervension
Government ; Oil Palm Company; Industrial based Palm Oil Company; Customer
CPO Price
Run Rate Refinery Land Area Delvelopment
LandProductivity
Fresh Fruit BunchProduction
CPO Production
CPO Supply
CPO Demand
CPO DomesticUse
CPO Export
BiodieselProduction
CPO ConversionRatio
Biodiesel forPSO
Biodiesel forNon PSO
Biodiesel DerivativesSales & Export
+
+ +
++
+
+-
-
CPO Price
-+
-
+
+
+
Total PotentialAreaNon Productive
AreaImmature Area
Mature AreaDecrease Rate
NPA
DecreaseImmature Area
Decrease RateIA
Increase RateMA
New MatureArea
New ImmatureArea
-
++
+
-
+
++
+
+
+
+
CPO Purchase-
+
+
Figure 2. Conceptual Model for Palm Oil Company
Proceedings of the 11th Annual International Conference on Industrial Engineering and Operations Management Singapore, March 7-11, 2021
© IEOM Society International 1763

4. Results And Discussion In the process of system dynamics modeling, CLDs are translated into stock and flow diagrams using simulation tools (Powersim). The detail causal loop diagram in this research problem can be seen in Figure 3. Stock and flow diagram shows the quantitative structure, and it can help to accumulate materials as well as information. There are several variables in the S&F diagram, such as stock, flow, auxiliary, parameters and equations. Inventories are represented by stocks and flow stands for the rate of change in stocks. Some decisions and data can alter the changing rate of flows that affect stocks as a result. SFD that constructed in this research consists of four sub-models: CPO production sub-model in Figure 4, CPO supply and purchase sub-model in Figure 5, refinery production sub model in Figure 6 and fractionation production sub model that can be seen in Figure 7.
Figure 3. Causal Loop Diagram of Research Problem
Figure 4. CPO Production Sub-Model
Figure 4 shows the CPO production sub-model with 17 variables and 3 stocks. The oil palm production model start with 3 growth stages of palm oil area: nonproductive area (0-3 years), immature area (4-6 years) and mature area (> 7 years) that symbolized as stock in the model. This research assumes that there is no land area expansion base on company historical data. The land productivity begins when the areas pass the non-productive area and convert to
LandProductivity
Fresh Fruit BunchProduction
CPO Production
CPO Supply
CPO Demand
CPO DomesticUse
CPO Export
BiodieselProduction
Biodiesel forPSO
Biodiesel forNon PSO
+
+ +
+
+
-
-
KPB CPO Price
+
-
+
+
+
Total PotentialAreaNon Productive
AreaImmature Area
Mature AreaDecrease Rate
NPA
DecreaseImmature Area
Decrease RateIA
Increase RateMA
New MatureArea
New ImmatureArea
-
++
+
-
+
++
+
+
+
+
CPO Purchase-
+
+ -
FOB CPO Price
HIP BBM PriceHIP BBN Price
Currency
++
+ +
MarginDomestic Sales
Margin ExportSales
MarginBiodiesel Sales
BiodieselMandatory
LevyTax
+
+
+
+
+
--
-
CPO PurchasePrice+
-
Non Productive Areadecrease area
DECREASE RATE
Immature Areadecrease immature
area
DECREASE RATE IA
Mature Areanew mature area
INCREASE RATE MA
total potential area
ffb productionLAND PRODUCTIVITY
cpo productionOER
Proceedings of the 11th Annual International Conference on Industrial Engineering and Operations Management Singapore, March 7-11, 2021
© IEOM Society International 1764

immature area, it reaches the optimum area productivity during mature area stage and then it gradually diminishes over the old ages. The number of immature and mature regions is the total potential area. It is then multiplied by land productivity and forms the total output of FFB. By multiplying the Oil Extraction Rate (OER) by FFB production, CPO production is obtained.
Figure 5. CPO Purchase and Supply Sub-Model Figure 5 shows the CPO supply within the company supply chain with 27 variables and 4 stocks. Start with the initial budget demand, to calculate how many CPO that company has to buy from 3rd party and upstream. The total of CPO purchase and production are defined by CPO supply. The supply is use to fulfill the demand of CPO sales as a CPO itself and refine products of CPO. The demand is categorized into four types: export demand; domestic demand; branded demand; and biodiesel demand. In this research we assume that biodiesel plant only contributes to CPO demand as a raw material and there is no CPO demand in branded market. Model for the CPO refined products can be seen in Figure 6.
Figure 6. Refinery Production Sub-Model
cpo productionupstream purchase
3rd party purchase
demand rate
cpo supply
cpo for direct salescpo for refinery
% direct sales% refine products
export growthCPO Export
CPO Domesticdomestic growth
CPO Biodieselbiodiesel growth
CPO Demandcpo demand growth
% UPSTREAM3RD PARTY %
% CPO EXPORT
CPO DOMESTIC RATE
% CPO BIODIESEL
cpo for export
CPO EXP RATE% CPO DOMESTIC
cpo for domesticcpo for biodiesel
CPO BIODIESEL RATE
rbdpo productionpfad production
loss
rbdpo yield pfad yield
loss yield
rbdpo for sales% rbdpo sales
% rbdpo forfractination
rbdpo for fractination
rbdpo for brandedrbdpo for export
rbdpo for domestic% RBDPO EXPORT % RBDPO DOMESTIC
% RBDPO BRANDED
rbdpo exportrbdpo export growth
RBDPO EXPORT RATE
RBDPO Domesticrbdpo domestic
griwth
RBDPO DOMESTICRATE
RBDPO Brandedrbdpo branded
growth
RBDPO BRANDEDRATE
cpo for refinery
Proceedings of the 11th Annual International Conference on Industrial Engineering and Operations Management Singapore, March 7-11, 2021
© IEOM Society International 1765

There are two main processes of palm oil downstream company, namely refining and fractionation. Refine process is a chemical process to remove impurities from crude palm oil, outputs of this process are RBDPO (refined bleached deodorized palm oil) and the residue called PFAD (palm fatty acid distillate). RBDPO from the refine process is the raw material to produce RBDOL and RBDST through fractionation process, this process is a separation process of solid and liquid form of oil. The fractionation sub-model can be seen in Figure 7.
Figure 7. Fractionation Sub-Model
4.1 Model validation
Primary data and variables of the model in this research were obtained from company data source and observation. The initial data and parameter in the CPO production sub-model can be seen in Table 1.
Table 1. Initial Data and Parameters Model
Variable Initial Data Unit
Non Productive Area 14.206 Ha Immature Area 29.885 Ha Mature Area 94.003 Ha Land Productivity Time series Ton/Ha OER (Oil Extraction Rate) % CPO Initial Demand 6.200.093 Ton RBDPO Yield 94.63 % PFAD Yield 4.76 % Loss Yield 0.61 % RBDOL Yield 77.36 % RBDST Yield 22.64 %
Data used in variable rates as decrease rate for each area, land productivity and OER (Oil Extraction Rate) are historical data from 2010 to 2019. Model validation tests the reliability of constructed model and other previous studies using various informal and formal steps. This research uses the mean absolute percentage error (MAPE) statistical test. The accuracy is determined as a percentage and estimated for each time period as the average absolute percent error minus actual values separated by actual values., by Ai as an actual data, Si as the simulation results from the model, n as a data amount reflected the length of data collective. The MAPE formulation can be expressed as in equation (1) (Montaño Moreno et al., 2013). The interpretation of MAPE value can be seen in Table 2 (Lewis, 1982).
rbdol productionrbdst production
rbdst yieldrbdol yield
rbdol for exportrbdol for domestic
rbdol for brandedrbdst for export
rbdst for domestic
rbdst for branded% RBDOL EXPORT
% RBDOL DOMESTIC% RBDOL BRANDED
RBDOL Export
RBDOL Domestic
RBDOL Branded
rbdol export growth
rbdol domesticgrowth
rbdol branded growth
RBDOL EXPORT RATE
RBDOL DOMESTICRATE
RBDOL BRANDEDRATE
RBDST ExportRBST Domestic
RBDST Branded
rbdst export growthrbdst domestic
rbdst brandedgrowth
% RBDST EXPORT
% RBST DOMESTIC
% RBDST BRANDED
RBDST EXPORT RATE
RBDST DOMESTICRATE
RBDST BRANDEDRATe
rbdpo for fractination
Proceedings of the 11th Annual International Conference on Industrial Engineering and Operations Management Singapore, March 7-11, 2021
© IEOM Society International 1766

𝑀𝑀𝑀𝑀𝑀𝑀𝑀𝑀 = 1
𝑛𝑛∑ |𝑆𝑆𝑖𝑖− 𝐴𝐴𝑖𝑖|
𝐴𝐴𝑖𝑖𝑛𝑛𝑖𝑖=1 𝑥𝑥 100% (1)
Table 2. Interpretation of MAPE Values
MAPE Value Interpretation of Forecast/Simulation < 10% Highly accurate result
10% - 20% Good result 21% - 50% Reasonable result
> 50% Inaccurate result
By running on the CPO production sub-model, Table 3 shows the real historical data and simulation results with simulation period from 2015-2019 with the MAPE calculation.
Table 3. Simulation Result Validation Based on MAPE Sub-Model CPO Production
Year Total Potensial Area (Ha) CPO Production (Ton)
Actual Data (𝑀𝑀𝑖𝑖)
Simulation Result (𝑆𝑆𝑖𝑖)
MAPE (%)
Actual Data (𝑀𝑀𝑖𝑖)
Simulation Result (𝑆𝑆𝑖𝑖)
MAPE (%)
2015 136.000 145.380 6,90 740.000 745.500 0,74 2016 137.000 146.954 7,27 627.000 628.426 0,23 2017 136.000 147.522 8,47 626.000 635.889 1,58 2018 134.000 143.903 7,39 665.000 619.601 6,83 2019 131.000 139.956 6,84 645.000 604.390 6,30
MAPE Variable 7,37 MAPE Variable 3,13 MAPE calculation for sub model CPO supply can be seen in Table 4 to compare real historical data and simulation results with simulation period from 2015-2019.
Table 4. Simulation Result Validation Based on MAPE Sub-Model CPO Supply
Year CPO Export (Ton) CPO Domestic (Ton) CPO for Biodiesel (Ton)
Actual Data
Simulation Result MAPE Actual
Data Simulation
Result MAPE Actual Data
Simulation Result MAPE
2015 1.881.000 1.908.947 1,49 33.000 33.555 1,68 101.000 102.302 1,29 2016 1.559.000 1.572.163 0,84 33.000 32.555 1,35 139.000 141.176 1,57 2017 1.468.000 1.495.589 1,88 13.000 13.609 4,68 261.000 263.999 1,15 2018 1.427.000 1.458.201 2,19 12.000 13.115 9,29 361.000 364.319 0,92 2019 1.183.000 1.230.576 4,02 11.000 11.794 7,22 631.000 637.558 1,04
MAPE Variable 2,08 MAPE Variable 4,84 MAPE Variable 4,84 For sub model refinery production, MAPE calculation shows in Table 5 obtain by running the simulation to compare real historical data and simulation results with simulation period from 2015-2019.
Table 5. Simulation Result Validation Based on MAPE Sub-Model Refinery Production
Year CPO For Refinery (Ton) RBDPO For Sales (Ton) RBDPO For Fractionation (Ton)
Actual Data
Simulation Result MAPE Actual
Data Simulation
Result MAPE Actual Data
Simulation Result MAPE
2015 4.185.000 4.154.062 0,74 361.000 358.506 0,69 3.599.000 3.572.090 0,75 2016 4.134.000 4.105.291 0,69 1.087.000 1.079.208 0,72 2.824.000 2.805.629 0,65 2017 4.057.000 4.060.539 0,09 1.036.000 1.036.703 0,07 2.803.000 2.805.785 0,10
Proceedings of the 11th Annual International Conference on Industrial Engineering and Operations Management Singapore, March 7-11, 2021
© IEOM Society International 1767

2018 4.421.000 4.418.377 0,06 954.000 953.711 0,03 3.230.000 3.227.981 0,06 2019 4.429.000 4.441.352 0,28 1.420.000 1.423.926 0,28 2.771.000 2.778.926 0,29
MAPE Variable 0,37 MAPE Variable 0,36 MAPE Variable 0,37 By running the model, Table 6 shows the real historical data and simulation results with simulation period from 2015-2019 with the MAPE calculation for derivatives production in fractionation process.
Table 6. Simulation Result Validation Based on MAPE Sub-Model Refinery Production
Year RBDOL Production (Ton) RBDST Production (Ton)
Actual Data
Simulation Result MAPE Actual
Data Simulation
Result MAPE
2015 2.784.000 2.763.369 0,74 815.000 808.721 0,77 2016 2.185.000 2.170.435 0,67 640.000 635.194 0,75 2017 2.169.000 2.170.555 0,07 635.000 635.230 0,04 2018 2.498.000 2.496.392 0,06 731.000 730.588 0,06 2019 2.144.000 2.149.777 0,27 627.000 629.149 0,34
MAPE Variable 0,36 MAPE Variable 0,39 Table 3-6 above shows that the MAPE of simulation result for all sub models respectively. All the values are fit for category less than 10%, meaning that the simulation result is highly accurate and valid based on Table 2 (Lewis, 1982). From the model above, we can simulate the movement of demand for each sector, namely export, domestic, branded (cooking oil, margarine and shortening, etc.) and biodiesel. The following graph shows the simulation results up to 2021, where the trend of each demand can be seen respectively from Figure 7 as export demand, Figure 8 as domestic sector demand, Figure 9 for the branded demand and lastly, Figure 10 for biodiesel demand.
Proceedings of the 11th Annual International Conference on Industrial Engineering and Operations Management Singapore, March 7-11, 2021
© IEOM Society International 1768

Figure 8. Export Demand Growth Figure 9. Domestic Demand Growth
Figure 10. Branded Demand Growth Figure 11. Biodiesel Demand Growth
Figures above show the trend of each sector respectively. The growth of biodiesel demand is highly affected by biodiesel mandatory policy. The policy will affect initial demand from the model to determine how many CPO needed to be bought in order to fulfill all the company demand in each sector. However, at some point the company must know the purchase limitations from third parties. Hence, it can be inferred that the supply is limited which means, the company must wisely divide the CPO as raw material input so the production is at optimum level for every sector.
5. Conclusion Supply chain has a significant role to ensure the improvement of efficiency and productivity to gain competitive strategy and customer satisfaction for a company. A good understanding in supply chain processes, will allow the company to formulate more appropriate strategies to achieve optimum results. This study proposes a supply chain model of palm oil company to help decision makers understand the behaviour and the process in the system. For this case, it relates to policy interventions like land moratorium and biodiesel mandatory. Based on the formulated model, we simulate the total area and the demand for each sector in which could help to forecast annual game-plan and volume budgeting or to make some internal policies, such as: replanting, adjustment of refinery capacity, etc. References Applanaidu, S. D., Abidin, N. Z., Sapiri, H., & Zabid, M. F. M., Impact of various palm-based biodiesel blend
mandates on Malaysian crude palm oil stock and price: A system dynamics approach. Asian Social Science, 11(25), 190–203. https://doi.org/10.5539/ass.v11n25p190, 2015.
Statistics Indonesia 2018 Indonesian Oil Palm Statistics p.96 Indonesia : BPS, 2018 Bps. Statistik Kelapa Sawit Indonesia 2018. In Badan Pusat Statistik Indonesia (p. 96), 2018. Chopra, Sunil, and Peter Meindl. Supply Chain Management: Strategy, Planning, and Operation. Upper Saddle River,
N.J.: Prentice Hall, 2004.
Export Demand Growth
2.015 2.016 2.017 2.018 2.019 2.0204.100.000
4.200.000
4.300.000
4.400.000
4.500.000
4.600.000
tonD
eman
d fo
r Ex
port
For evaluation purposes only!
Domestic Demand Growth
2.015 2.016 2.017 2.018 2.019 2.020
700.000
800.000
900.000
1.000.000
1.100.000
1.200.000ton
Dem
and
for
Dom
esti
c
For evaluation purposes only!
Branded Demand Growth
2.015 2.016 2.017 2.018 2.019 2.020
400.000
450.000
500.000
550.000
ton
Dem
and
for B
rand
ed
For evaluation purposes only!
Biodiesel Demand Growth
2.015 2.016 2.017 2.018 2.019 2.020100.000
200.000
300.000
400.000
500.000
600.000
700.000ton
Dem
and
for
Bio
dies
el
For evaluation purposes only!
Proceedings of the 11th Annual International Conference on Industrial Engineering and Operations Management Singapore, March 7-11, 2021
© IEOM Society International 1769

Dachyar, M., & Mahendra, E. A.Design factors of supply chain management for wood industry SMEs. Industrial Engineering and Management Systems, 18(2), 182–194. https://doi.org/10.7232/iems.2019.18.2.182, 2019.
Dachyar, M., & Yudavedito.Portfolio simulation in GSM cellular telecommunication industry for company’s decision and policies making. World Academy of Science, Engineering and Technology, 81(January), 364–367. https://doi.org/10.5281/zenodo.1060580, 2011.
Dharmawan, A. H., Fauzi, A., Putri, E. I. K., Pacheco, P., Dermawan, A., & Nuva, N.,. International Journal of Sustainable Development and Planning Bioenergy Policy : The Biodiesel Sustainability Dilemma in Indonesia. 15(4), 537–546, 2020.
Ford, D. N., & Ph, D., A System Dynamics Glossary. 1–10, 2018 Hadiguna, R. A., & Tjahjono, B., A framework for managing sustainable palm oil supply chain operations: a case of
Indonesia. Production Planning and Control, 28(13), 1093–1106. https://doi.org/10.1080/09537287.2017.1335900, 2017.
Hardiati, I., Dachyar, M., & Yadrifil. Mechanism selection of subsidized diesel oil pricing policy in Indonesia using analytic network process. International Journal of Applied Engineering Research, 10(18), 38842-38844, 2015.
Hidayatno, A., Sutrisno, A., Zagloel, Y. M., & Purwanto, W. W., System Dynamics Sustainability Model of Palm-Oil Based Biodiesel Production Chain in Indonesia. International Journal of Engineering & Technology, 11(June), 1–6, 2016.
Ibragimov, A., Sidique, S. F., & Tey, Y. S., Productivity for sustainable growth in Malaysian oil palm production: A system dynamics modeling approach. Journal of Cleaner Production, 213, 1051–1062. https://doi.org/10.1016/j.jclepro.2018.12.113, 2019.
Joyosemito, I. S., Tokai, A., & Nakakubo, T., System Dynamics Model Development for Evaluation of the Moratorium Policy on New Forest and Peatland Concessions under Bilateral Cooperation in Indonesia : Palm Oil Industry Sector Case Study. 5(2014), 1–12,2015.
Kunene, N., & Chung, Y. C. Y., Sustainable Production Policy Impact on Palm Oil Firms ’ Performance : Empirical Analysis from Indonesia, 2020.
Lewis, C. D. Industrial and business forecasting methods : a practical guide to exponential smoothing and curve fitting / Colin D. Lewis Butterworth Scientific London 1982
Masjuki, H. H., Kalam, M. A., Mofijur, M., & Shahabuddin, M., Biofuel: Policy, standardization and recommendation for sustainable future energy supply. Energy Procedia, 42, 577–586. https://doi.org/10.1016/j.egypro.2013.11.059, 2013.
Mayasari, F., & Dalimi, R., Dynamic modeling of CPO supply to fulfill biodiesel demand in Indonesia. QiR 2017 - 2017 15th International Conference on Quality in Research (QiR): International Symposium on Electrical and Computer Engineering, 2017-Decem, 388–393. https://doi.org/10.1109/QIR.2017.8168517, 2017.
Mayasari, F., Dalimi, R., & Purwanto, W. W., Projection of biodiesel production in Indonesia to achieve national mandatory blending in 2025 using system dynamics modeling. International Journal of Energy Economics and Policy, 9(6), 421–429. https://doi.org/10.32479/ijeep.8319, 2019.
Mohammadi, S., Arshad, F. M., & Ibragimov, A., Future prospects and policy implications for biodiesel production in Malaysia: A system dynamics approach. Institutions and Economies, 8(4), 42–57, 2016.
Mol, A. P. J., Boundless biofuels? Between environmental sustainability and vulnerability. Sociologia Ruralis, 47(4), 297–315. https://doi.org/10.1111/j.1467-9523.2007.00446.x, 2007.
Montaño Moreno, J. J., Palmer Pol, A., Sesé Abad, A., & Cajal Blasco, B. El índice R-MAPE como medida resistente del ajuste en la previsiońn. Psicothema, 25(4), 500–506. https://doi.org/10.7334/psicothema2013.23, 2013
Musango, J. K., Brent, A. C., Amigun, B., Pretorius, L., & Müller, H., A system dynamics approach to technology sustainability assessment: The case of biodiesel developments in South Africa. Technovation, 32(11), 639–651. https://doi.org/10.1016/j.technovation.2012.06.003, 2012.
Muzayanah, F. N., Cahyadi, E. R., & Munandar, J. M., Dynamic Modelling System of Indonesia’s Crude Palm Oil Sustainable Supply Chain Management. Jurnal Manajemen Dan Agribisnis, 15(1), 33–43. https://doi.org/10.17358/jma.15.1.33, 2018.
Pacheco, P., Gnych, S.,Dermawan, A., Komarudin,H., Okarda,B., The palm oil global value chain: Implications for economic growth and social and environmental sustainability. Center for International Forestry Research (CIFOR). https://doi.org/10.17528/cifor/006405, 2017.
Purnomo, H., Okarda, B., Dermawan, A., Ilham, Q. P., Pacheco, P., Nurfatriani, F., & Suhendang, E., Reconciling oil palm economic development and environmental conservation in Indonesia: A value chain dynamic approach. Forest Policy and Economics, 111(January 2019), 102089. https://doi.org/10.1016/j.forpol.2020.102089, 2020.
Proceedings of the 11th Annual International Conference on Industrial Engineering and Operations Management Singapore, March 7-11, 2021
© IEOM Society International 1770

Rahman, T., Arkeman, Y., Setyaningsih, D., & Saparita, R., Indonesian CPO availability analysis to support food and energy security: A system dynamic approach. IOP Conference Series: Earth and Environmental Science, 65(1). https://doi.org/10.1088/1755-1315/65/1/012024, 2017.
Series, I. O. P. C., & Science, M., Sustainability assessment in crude palm oil production: A review. https://doi.org/10.1088/1757-899X/725/1/012074, 2020.
Silalahi, F. T. R., Simatupang, T. M., & Siallagan, M. P., Biodiesel produced from palm oil in Indonesia: Current status and opportunities. AIMS Energy, 8(1), 81–101. https://doi.org/10.3934/energy.2020.1.81,2020.
Speirs, J., McGlade, C., & Slade, R., Uncertainty in the availability of natural resources: Fossil fuels, critical metals and biomass. Energy Policy, 87, 654–664. https://doi.org/10.1016/j.enpol.2015.02.031, 2015.
Sterman, J., Business Dynamics: Systems Thinking and Modeling for a Complex World (with CD-ROM). In Recherche, 2000.
Wijaya, H., Arkeman, Y., & Hambali, E., Formulation of Indonesian palm oil biodiesel policy for energy security by using system dynamics model. Agricultural Engineering International: CIGR Journal, 2017, 268–282, 2017.
Zabid, M. F. M., Zainal Abidin, N., & Applanaidu, S. D., Implications of palm-based biodiesel blend mandate on the biodiesel industry growth in Malaysia: Evidence from causal loop diagram. Institutions and Economies, 10(3), 81–100, 2018.
Biographies Nathania Astria is Master Degree student in Industrial Engineering Department, Faculty of Engineering Universitas Indonesia. She holds a Bachelor of Engineering in Industrial Engineering from Universitas Tarumanagara. She is currently working at Palm Oil Company in Indonesia. M. Dachyar is a Professor, and Head of Management Information System and Decision Support (MISDS) Laboratory, Industrial Engineering Dept., Universitas Indonesia. His research on management information system, decision support system, operations management, and business process reengineering. Rahmat Nurcahyo is a Professor in Management System in the Industrial Engineering Department, Faculty of Engineering Universitas Indonesia. He graduated from Universitas Indonesia with a Bachelor of Engineering degree in Mechanical Engineering, a Master of Engineering Science degree in Industrial Management from the University of New South Wales, Australia and a Doctor of Strategic Management from Universitas Indonesia. His research interests include overall quality management, production system, lean system, management of maintenance, management systems and business management.
Proceedings of the 11th Annual International Conference on Industrial Engineering and Operations Management Singapore, March 7-11, 2021
© IEOM Society International 1771