Embed Size (px)
Citation preview

SYSTEM IMPACT STUDY
REPORT
LA450S GENERATION STUDY
Prepared for:
El Paso Electric Company
Prepared by:
TRC Engineers, LLC 1526 Cole Boulevard
Building 3, Suite 150
Lakewood, CO 80401
(303) 395-4018
June 2017

LA450S System Impact Study TRC June 2017 i
FOREWORD
This report was prepared for the project Interconnection Customer, by System Planning at El Paso
Electric Company. Any correspondence concerning this document, including technical and commercial
questions should be referred to:
David Tovar
Manager – System Planning Department
El Paso Electric Company
100 North Stanton, Loc. 751
El Paso, Texas 79901
Phone: (915) 543-4355
Fax: (915) 521-4763
or
Roberto Favela
Principal Engineer
El Paso Electric Company
100 North Stanton, Loc. 751
El Paso, Texas 79901
Phone: (915) 521-4418
Fax: (915) 521-4763

LA450S System Impact Study TRC June 2017 ii
Table of Contents
EXECUTIVE SUMMARY ........................................................................................................................................... 4
1.0 INTRODUCTION ........................................................................................................................................... 9
2.0 STUDY METHODOLOGY ......................................................................................................................... 11 2.1 ASSUMPTIONS & CRITERIA ............................................................................................................................ 11 2.2 PROCEDURE ................................................................................................................................................... 12
Development and Description of Cases ............................................................................................... 12 2.2.1
LA450S Study Generation Modeling.................................................................................................... 13 2.2.2
NRIS Project Dispatch and Analysis Description ................................................................................ 13 2.2.3
ERIS Project Dispatch and Analysis Description ................................................................................ 14 2.2.4
Contingency Lists ................................................................................................................................. 14 2.2.5
3.0 STEADY STATE POWER FLOW ANALYSIS .......................................................................................... 16 3.1 NORMAL OPERATING CONDITION POWER FLOW EVALUATION ...................................................................... 16
Pre-project N-0 Power Flow Evaluation ............................................................................................. 16 3.1.1
Post-project N-0 Power Flow Evaluation ............................................................................................ 16 3.1.2
3.2 EMERGENCY OPERATING CONDITION POWER FLOW EVALUATION ................................................................ 16 Pre-project N-1 Power Flow Evaluation ............................................................................................. 16 3.2.1
NRIS Post-project N-1 Power Flow Evaluation .................................................................................. 16 3.2.2
ERIS Post-project N-1 Power Flow Evaluation................................................................................... 17 3.2.3
3.3 NRIS NETWORK UPGRADE POWER FLOW TESTING ....................................................................................... 18 3.4 ERIS EVALUATION ........................................................................................................................................ 20 3.5 EXTREME OUTAGE PROTECTION .................................................................................................................... 21 3.6 POWER FLOW ANALYSIS CONCLUSION .......................................................................................................... 21
4.0 STEADY STATE VOLTAGE ANALYSIS ................................................................................................. 22 4.1 NORMAL OPERATING CONDITION VOLTAGE EVALUATION ............................................................................ 22 4.2 EMERGENCY OPERATING CONDITION VOLTAGE EVALUATION ...................................................................... 22 4.3 DELTA VOLTAGE EVALUATION ..................................................................................................................... 22 4.4 POWER FACTOR TEST .................................................................................................................................... 22 4.5 STEADY STATE VOLTAGE ANALYSIS CONCLUSIONS ...................................................................................... 23
5.0 SHORT CIRCUIT ANALYSIS .................................................................................................................... 24 5.1 SHORT CIRCUIT ANALYSIS MODELING .......................................................................................................... 24 5.2 SHORT CIRCUIT ANALYSIS PROCEDURE ......................................................................................................... 24 5.3 SHORT CIRCUIT ANALYSIS RESULTS AND CONCLUSION ................................................................................ 25
6.0 STABILITY ANALYSIS ............................................................................................................................. 29 6.1 DYNAMIC MODELING .................................................................................................................................... 29 6.2 STABILITY STUDY CASE DEVELOPMENT ........................................................................................................ 29 6.3 PRELIMINARY NRIS STABILITY ANALYSIS .................................................................................................... 29 6.4 FINAL NRIS STABILITY ANALYSIS RESULTS ................................................................................................. 30 6.5 FINAL ERIS STABILITY ANALYSIS RESULTS .................................................................................................. 31 6.6 LOW VOLTAGE RIDE THROUGH TEST ............................................................................................................ 31 6.7 SYSTEM INERTIA ANALYSIS ........................................................................................................................... 31 6.8 STABILITY ANALYSIS CONCLUSION ............................................................................................................... 32
7.0 COST ESTIMATES, ONE-LINES, & PROJECT SCHEDULE .................................................................. 33
8.0 DISCLAIMER .............................................................................................................................................. 41
9.0 CONCLUSIONS ........................................................................................................................................... 42

LA450S System Impact Study TRC June 2017 iii
List of Tables
Table 0-1: NRIS Project Cost Estimate ....................................................................................................... 7 Table 2-1: EPE and New Mexico Performance Criteria ............................................................................ 12 Table 2-2: Pre-Project Base Case Scenarios .............................................................................................. 13 Table 2-3: Stability Contingencies ............................................................................................................. 14 Table 3-1: LA450S Impacts to Summer Emergency Equipment Loading – NRIS ................................... 16 Table 3-2: LA450S Impacts to Winter Emergency Equipment Loading – NRIS ...................................... 17 Table 3-3: LA450S Impacts to Summer Emergency Equipment Loading – ERIS .................................... 17 Table 3-4: LA450S Impacts to Winter Emergency Equipment Loading – ERIS ...................................... 18 Table 5-1: Generator Short Circuit Modeling Data ................................................................................... 24 Table 5-2: Short Circuit Analysis Results (Area 10) ................................................................................. 25 Table 5-3: Short Circuit Analysis Results (Area 11) ................................................................................. 26 Table 6-1: Transient Stability Analysis Preliminary Results ..................................................................... 29 Table 6-2: Transient Stability Analysis Post-Network Upgrade Results ................................................... 31 Table 7-1: Cost Estimate ............................................................................................................................ 33 Table 7-2: EPE Interconnection Facilities Costs for POI Station (LA450S) ............................................. 37 Table 7-3: EPE Network Upgrade Costs for the LA450S POI Station ...................................................... 37
List of Figures
Figure 1-1: Year 2019 EPE Transmission System with LA450S POI .......................................................... 9
Figure 3-1: Year 2019 EPE Transmission System with LA450S POI and Network Upgrades .................. 20 Figure 7-1: LA450S POI Station One Line ................................................................................................ 36 Figure 7-2: Afton North Switching Station One Line (Network Upgrade) ................................................ 38 Figure 7-3: Anthony Substation One-line ................................................................................................... 39
Appendices
Appendix A LA450S Project Modeling Information Appendix B Power Flow Contingency List
Appendix C Pre-Project Stability Plots
Appendix D Preliminary Stability Plots
Appendix E Final Stability Plots
Appendix F Stability Run Summary Reports
Appendix G LA450S Project Schedule
Appendix H System Inertia Analysis Plots

LA450S System Impact Study TRC June 2017 4
LA450S Generation System Impact Study
EXECUTIVE SUMMARY
The objective of this System Impact Study (SIS) was to determine the impact of the proposed LA450S
Project (Project) on the El Paso Electric Company (EPE) transmission system. In addition, EPE
identified Public Service of New Mexico (PNM) and Tri-State Generation and Transmission (TSGT) as
Affected Systems, given the location of the proposed interconnection. The proposed LA450S Project
(Project) is comprised of 450 MW of Photovoltaic (PV) solar powered generation to be interconnected on
an existing 345 kV line running between EPE’s Luna and Afton North Substations.
The proposed Commercial Operation date for the Project is January 31, 2019.
In planning year 2019, EPE plans to complete a system reinforcement around the Afton Substation. The
planned reinforcement includes the creation of the Afton North Substation, tapping the Luna-Diablo 345
kV line at Afton, and creating a 115 kV path between Afton and Airport. For the purpose of this SIS, the
system reinforcements around Afton, including the creation of the Afton North Substation, were all
considered complete and modeled as in-service.
In this SIS, the Project was evaluated for Network Resource Interconnection Service (NRIS) and for
Energy Resource Interconnection Service (ERIS), as defined in the EPE Open Access Transmission Tariff
(OATT).
When tested for NRIS, the entire 450 MW Project output was delivered to serve EPE native load.
The NRIS study assumed that the output of the Generating Facility may displace the output of other
Network Resources on the EPE Transmission System, and then identifies the Network Upgrades that
would be required to allow the Generating Facility to be counted towards system resource needs in the
same manner as the displaced EPE resources. To be clear, the identification of Network Resources set
forth herein does not eliminate the need for studies to be performed if and when an application is
submitted to request transmission service for the delivery of the output of the Generating Facility, whether
the transmission service requested is Network Integration Transmission Service or Firm Point-to-Point
Transmission Service. After receipt of a transmission service request, the Transmission Provider may
perform studies and those studies may identify additional upgrades necessary to allow delivery service
under the OATT.
In contrast, the identification of Network Upgrades in the generator interconnection study is for the
purpose of allowing the Interconnection Customer to be eligible to have its resource designated as a
Network Resource on the EPE system. The upgrades identified in the report would be necessary for EPE
to integrate the Generating Facility into the EPE Transmission System in a manner that permits aggregate
generation to meet aggregate EPE load while satisfying reliability criteria and planning requirements, and
without impinging upon adjacent transmission systems.
When tested as an ERIS, 100 MW of Project generation was delivered to serve EPE native load. The
remaining 350 MW of Project generation was sent to Western Electric Coordinating Council (WECC)
loads in Western and Northern New Mexico (as per the LA450S Interconnection Request).
This System Impact Study Report addresses generation interconnection upgrades only, and does not
address or imply any right to receive transmission service from EPE or any other transmission provider.

LA450S System Impact Study TRC June 2017 5
The Study Areas for both the NRIS and ERIS analysis were limited to WECC Areas 11 - EPE and 10 –
PNM and TSGT.
Senior queued projects in the EPE study queue that were included in all base cases for this SIS. The 420
MW Montana Power Station (MPS) Project, the 90 MW Santa Teresa Solar (DS90S) Project, and the 200
MW Otero Solar (CA200S) Project. All three projects were added to the study models.
For both the NRIS and ERIS tests, Steady State and Stability analysis was conducted using two
benchmark cases provided by EPE. The cases were a 2019 Heavy Summer (Peak) and a 2018/2019 Light
Winter (Off Peak). A sensitivity case was also developed to determine Project impacts on dispatch
scenarios with the MPS Project being online or offline.
Afton generation was assumed online in all Peak cases and offline in the Off Peak cases. The Arroyo
Phase Shifter was set to regulate N-S Flows from in all cases (10-20 MW under Peak loads and 150-160
MW under Off Peak loads). The Eddy County HVDC was set to import 200 MW in all Peak cases and
was off-line in the Off Peak case.
Steady State Results
For NRIS, the LA450S Project must include the following set of Network Upgrades:
1. Upgrade Anthony Substation by creating a 345 kV bus and adding a
345/115 kV Transformer (400 MVA).
2. Upgrade Afton North Substation to include an additional 345 kV line
3. Build Afton North-Anthony 345 kV Line (17.4 miles)
After the addition of the proposed Network Upgrades, Power Flow Analysis Results showed there are no
remaining overloaded facilities, under applicable N-0 or N-1 conditions, caused or worsened by the
addition of the LA450S Project. Please note however that potential curtailment of LA450S under certain
N-2 conditions will be investigated further within the Facilities Study Report.
For ERIS, the LA450S Project can reach a maximum capacity of 250 MW on an as-available basis before
causing a criteria violation.
Short Circuit Results
A Short Circuit analysis was performed to determine if the addition of the LA450S generation would
cause any existing EPE or PNM and TSGT transmission system circuit breakers to exceed their
interrupting ratings.
The results of the short circuit analysis show that after the addition of the Project maximum fault currents
did not exceed breaker interrupting capability at any EPE or PNM circuit breakers.
Stability Results
The LA450S dynamic model was provided by the developer as TMEIC manufactured 2.7 MVA, 600 V
inverter which consists of the WECC required regc_a, reec_b, and repc_a models with appropriate
voltage and frequency parameters for to comply with Low Voltage Ride Through criteria.
Transient system stability was analyzed for faults relevant to the LA450S Study Areas under both Peak
and Off Peak load conditions. The analysis compared the system response to the fault simulations before
and after the LA450S generation was added at its maximum requested 450 MW capacity in both the

LA450S System Impact Study TRC June 2017 6
NRIS and ERIS evaluation. Additional testing was also completed after the addition of the Network
Upgrades in the NRIS evaluation, and with the Project at 250 MW capacity in the ERIS evaluation.
Results from the stability analysis showed that the EPE and Southwestern New Mexico transmission
system remained stable for all simulated faults. A Low Voltage Ride Through (LVRT) test was also
completed. LVRT testing showed the Project can withstand a 9 cycle fault at the POI.
Cost Estimates and Schedule
Good faith cost estimates are presented. The cost estimates are in 2017 dollars (no escalation applied)
and are based upon typical construction costs for previously performed similar construction. These costs
include all estimated applicable labor and overheads associated with the engineering, design, and
construction of these new EPE facilities. These estimates did not include the Generator Interconnection
Costs1 for any other Interconnection Customer owned equipment or associated design and engineering
except for the POI facilities.
The estimated total cost for the required upgrades is $58.94 Million for LA450S project. This breaks
down to $0.77 Million for the EPE Interconnection Costs2 at the POI, $9.00 Million for the LA450S POI
Costs, and $49.17 Million for Network Upgrade Costs3. Error! Reference source not found. details the
estimated costs. Please note that Network Upgrade costs only apply to a NRIS evaluation. However the
EPE Interconnection costs, and the LA450S POI Substation costs apply to both the NRIS and ERIS
evaluations.
Please note, associated Generator Interconnection Costs have not been estimated as part of this study.
The estimated time frame for Engineering, Procurement, and Construction for NRIS is approximately 45
months upon notice to proceed with construction from the Interconnection Customer. The estimated time
frame for Engineering, Procurement, and Construction for ERIS is approximately 39 months, and subject
to equipment availability lead-times, upon notice to proceed with construction from the Interconnection
Customer.
The time estimates presented in this study assume that there is no suspension of work directed by the
Interconnection Customer under its Interconnection Agreement.
1 Generator Interconnection Costs: cost of facilities paid for by Interconnection Customer and owned and
2 EPE Interconnection Costs: cost of facilities paid for by Interconnection Customer but owned and operated by
EPE from the Change of Ownership Point to the Point of Interconnection.
3 Network Upgrades Costs: cost of facilities from the Point of Interconnection outward, paid for by the
interconnector but owned and operated by EPE.

LA450S System Impact Study TRC June 2017 7
Table 0-1: NRIS Project Cost Estimate
Project Item
EPE
Interconnection
Cost
(in millions)
Substation
Network
Upgrade
Cost
(in millions)
Transmission
Network
Upgrade
Cost
(in millions)
Total
Cost
(in millions)
LA450S
LA450S
Interconnection
Switching Station
$0.77 $ 9.00 $ 9.77
Anthony
Substation
Upgrades*
$ 9.88 $ 9.88
North Afton
Substation
Upgrades*
$ 4.81 $ 4.81
345 kV Line
Between Afton and
Anthony*
$ 34.48 $ 34.48
Total Cost LA450S NRIS $ 58.94 M
Total Cost LA450S ERIS $ 9.77 M
*Denotes NRIS Cost Only
Conclusion
The results of the NRIS evaluation showed the need for a new, 17.4 mile long, 345 kV transmission line
between Afton and Anthony Substation. In addition to this new 345 kV line a 345/115 kV transformer,
and new 345 kV switchyard is also needed at Anthony.
The required Network Upgrades for LA450S interconnection are as follows:
1. Upgrade Anthony Substation by creating a 345 kV bus and adding a
345/115 kV Transformer.
2. Upgrade Afton North Substation to include an additional 345 kV line
3. Build Afton North-Anthony 345 kV Line (17.4miles)
These reinforcements are required if LA450S is used to serve native EPE load and offset local EPE
conventional generation. Results showed no remaining criteria violations after the addition of these
Network Upgrades.
The results of the ERIS evaluation showed that LA450S can operate on an as-available basis at a
maximum capacity of 250 MW before creating a criteria violation. (During ERIS evaluation LA450S
generation was delivered to EPE native load versus WECC loads in New Mexico/Arizona at the requested
1 to 3.5 ratio.)
The estimated cost for integrating the LA450S Project onto the EPE transmission system as an ERIS
Project is $9.77 Million. The good faith estimate for the time frame to Engineer, Procure, and Construct
the POI facilities for an ERIS Project is 39 months, (upon notice to proceed from tine Interconnection
Customer).
The estimated cost for integrating the LA450S Project onto the EPE transmission system as an NRIS
Project is $58.94 Million, including the cost for associated Network Upgrades. The good faith estimate

LA450S System Impact Study TRC June 2017 8
for the time frame to Engineer, Procure, and Construct all facilities at the POI and the associated Network
Upgrade Substations is 45 months, (upon notice to proceed from tine Interconnection Customer).

LA450S System Impact Study TRC June 2017 9
1.0 INTRODUCTION
The Federal Energy Regulatory Commission (FERC) requires that a SIS be performed for generation
facilities desiring to connect to any Transmission System. Here, the Interconnection Customer seeks to
interconnect to the EPE Transmission System and to have its generating facility studied for Network
Resource Interconnection Service (NRIS), and also for Energy Resource Interconnection Service (ERIS).
The proposed LA450S Project is comprised of 450 MW of PV solar powered generation requesting to be
interconnected on an existing 345 kV line running between the Luna and Afton North Substations. The
proposed Commercial Operation date for the Project is January 31, 2019.
In planning year 2019, EPE plans to complete a system reinforcement around the Afton Substation. The
planned reinforcement includes the creation of the Afton North Substation, tapping the Luna-Diablo 345
kV line at Afton, and creating a 115 kV path between Afton and Airport. For the purpose of this SIS, the
system reinforcements around Afton, including the creation of the Afton North Substation, were all
considered complete and modeled as in-service in all SIS cases.
Figure 1-1 shows the LA450S project included in the 2019 transmission planning map.
Figure 1-1: Year 2019 EPE Transmission System with LA450S POI
In this SIS, two separate analysis were performed to test the Project as either a Network or Energy
Resource, as defined in the EPE OATT. When tested as a Network Resource, generation from the full
Project output was delivered to serve EPE native load.

LA450S System Impact Study TRC June 2017 10
When tested as an Energy Resource, 100 MW of Project generation was delivered to serve EPE native
load. The remaining 350 MW of Project generation was sent to WECC loads in Western and Northern
New Mexico (as per the LA450S Interconnection Request).
The Study Areas for the analysis were limited to WECC Areas 11 - EPE and 10 - PNM.
The Study was performed in accordance with Western Electricity Coordinating Council (WECC), North
American Electric Reliability Corporation (NERC), and EPE standards. The EPE local reliability
standards can be found in Section 4 of EPE’s FERC Form No. 715. The steady state and stability analysis
was performed using General Electric’s (GE) Power System Load Flow (PSLF) software Version 19.

LA450S System Impact Study TRC June 2017 11
2.0 STUDY METHODOLOGY
2.1 Assumptions & Criteria
The following assumptions are consistent for all study scenarios unless otherwise noted.
This study assumed that all system expansion projects as planned by area utilities by the year
under analysis are completed, and that any system improvements required by the interconnections
senior to the LA450S Study generation are implemented.
This study did not analyze any transmission service from the interconnection point to any specific
point on the grid for the interconnections senior to the LA450S Study generation.
For NRIS, the Project generation was dispatched and delivered to serve EPE native load. To the
extent the Interconnection Customer were to seek to transmit the Project generation to a particular
delivery point on the EPE Transmission System, additional studies would have to be conducted as
part of a point-to-point transmission service request.
For ERIS, the Project generation was dispatched and delivered to EPE native load and WECC
loads at a 1 to 3.5 ratio.
Transformer tap and phase-shifting transformer angle movement, as well as static var device
switching, were allowed for the steady state pre-contingency analysis. All regulating equipment
such as transformer controls and switched shunts were fixed at pre-contingency positions when
the contingency analysis was performed. For post-contingency analysis Static var device
switching was allowed, but all other regulation equipment was locked.
All facility loadings at voltages 69 kV and greater were monitored within the El Paso and PNM
control areas. Pre-contingency and Post-contingency flows on lines and transformers were
required to remain at or below the normal rating, while post-contingency flows on lines and
transformers were required to remain at or below the emergency rating. Flows above 100% of an
element’s pre-project or post-contingency rating were considered violations. All post-project
voltage criteria violations that improve an existing pre-project violation were not considered an
adverse impact to the system.
The performance criteria utilized for qualifying violations in the study area are shown in
.

LA450S System Impact Study TRC June 2017 12
Table 2-1: EPE and New Mexico Performance Criteria
2.2 Procedure
To test the Project for NRIS, Steady State and Transient Stability Analysis was completed. A separate,
Steady State and Transient Stability Analysis was completed to test the Project for ERIS. A Short Circuit
Duty Analysis and Steady State Power Factor Test was also completed to determine the Project impacts
to the EPE system. Presented below is a description of the procedures used to complete the analyses.
Development and Description of Cases 2.2.1
Two benchmark cases 2019 Heavy Summer (Peak) and 2018/2019 Light Winter (Off Peak) were
provided by EPE to develop the Pre-project study cases. The same Pre-project study cases were used for
the Energy and Network Resource analysis.
Both study cases were developed with the senior queued projects DS90S and CA200S as being in service.
The DS90S project is proposed to be 90 MW interconnected between the proposed NW2 and Santa
Teresa 115 kV Substations. The CA200S project is proposed to be 200 MW interconnected between the
proposed Picante and Amrad 345 kV Substations. (Note: The addition of CA200S includes an associated
Network Upgrade to create a new 345 kV Substation between CA200S and Picante. After the Upgrade
the CA200S project will interconnect between Amrad and the new Corona 345 kV Substations.)
As shown in Table 2-2, the Eddy County HVDC is online in both Peak case scenarios (with and without
MPS) and Eddy County HVDC is offline in the Off Peak scenario. Afton Generation was modeled in
service for Peak cases and out of service for Off Peak cases. The Arroyo Phase Shifter was modeled to
provide 10-20 MW N-S flow under Peak load conditions and 150-160 MW N-S flow during the Off Peak
load conditions.
In total there are (3) pre-project study cases. MPS Generation was modeled offline for all Off Peak cases.
For the Peak load scenario, sensitivity cases were created with MPS switched on and off. The MPS
LA450S System Impact Study TRC June 2017 13
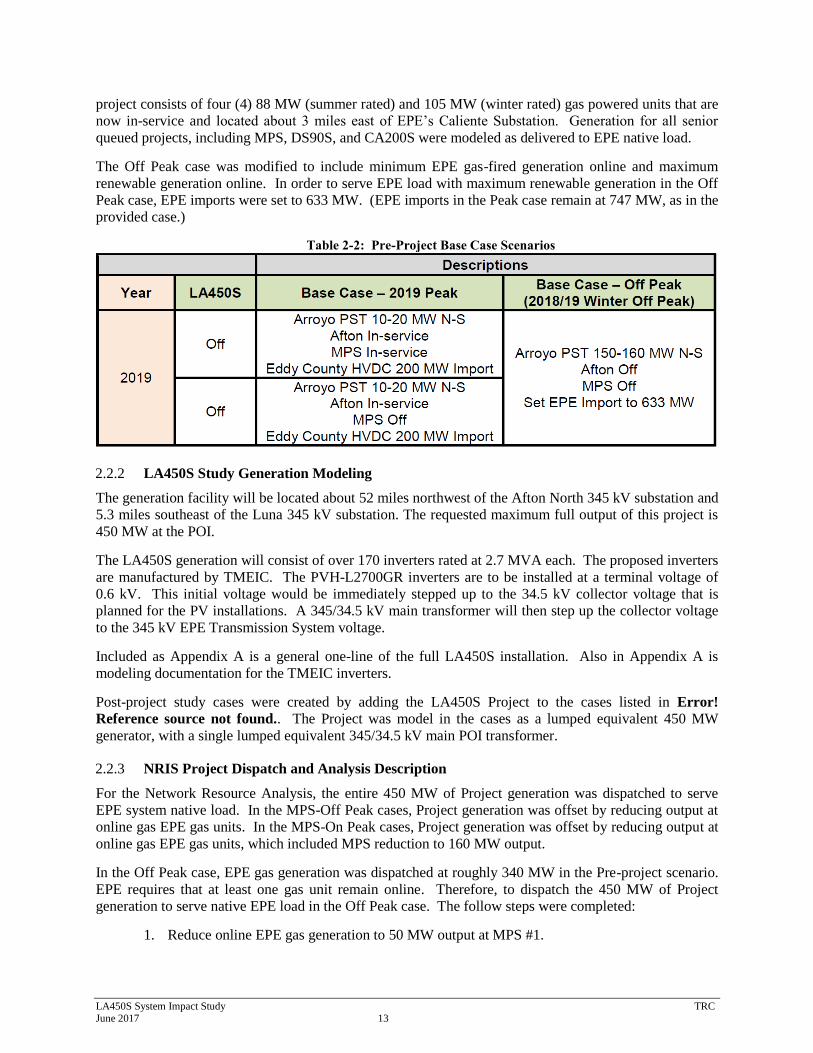
project consists of four (4) 88 MW (summer rated) and 105 MW (winter rated) gas powered units that are
now in-service and located about 3 miles east of EPE’s Caliente Substation. Generation for all senior
queued projects, including MPS, DS90S, and CA200S were modeled as delivered to EPE native load.
The Off Peak case was modified to include minimum EPE gas-fired generation online and maximum
renewable generation online. In order to serve EPE load with maximum renewable generation in the Off
Peak case, EPE imports were set to 633 MW. (EPE imports in the Peak case remain at 747 MW, as in the
provided case.)
Table 2-2: Pre-Project Base Case Scenarios
LA450S Study Generation Modeling 2.2.2
The generation facility will be located about 52 miles northwest of the Afton North 345 kV substation and
5.3 miles southeast of the Luna 345 kV substation. The requested maximum full output of this project is
450 MW at the POI.
The LA450S generation will consist of over 170 inverters rated at 2.7 MVA each. The proposed inverters
are manufactured by TMEIC. The PVH-L2700GR inverters are to be installed at a terminal voltage of
0.6 kV. This initial voltage would be immediately stepped up to the 34.5 kV collector voltage that is
planned for the PV installations. A 345/34.5 kV main transformer will then step up the collector voltage
to the 345 kV EPE Transmission System voltage.
Included as Appendix A is a general one-line of the full LA450S installation. Also in Appendix A is
modeling documentation for the TMEIC inverters.
Post-project study cases were created by adding the LA450S Project to the cases listed in Error!
Reference source not found.. The Project was model in the cases as a lumped equivalent 450 MW
generator, with a single lumped equivalent 345/34.5 kV main POI transformer.
NRIS Project Dispatch and Analysis Description 2.2.3
For the Network Resource Analysis, the entire 450 MW of Project generation was dispatched to serve
EPE system native load. In the MPS-Off Peak cases, Project generation was offset by reducing output at
online gas EPE gas units. In the MPS-On Peak cases, Project generation was offset by reducing output at
online gas EPE gas units, which included MPS reduction to 160 MW output.
In the Off Peak case, EPE gas generation was dispatched at roughly 340 MW in the Pre-project scenario.
EPE requires that at least one gas unit remain online. Therefore, to dispatch the 450 MW of Project
generation to serve native EPE load in the Off Peak case. The follow steps were completed:
1. Reduce online EPE gas generation to 50 MW output at MPS #1.

LA450S System Impact Study TRC June 2017 14
2. Keep EPE import fixed at 633 MW.
3. Uniformly increase EPE load from 1325 MW to 1495 MW.
Please note, if LA450S is pursued as a Network Resource, EPE imports may need to be reduced once
EPE load reaches a low limit of 1495 MW, under heavy renewable dispatch scenarios.
The Network Resource Analysis consisted of Steady State and Transient Stability Analysis. The set of
contingencies described in Section 2.2.5 were tested. Network Upgrade solutions were developed to
address criteria violations caused by the Project.
ERIS Project Dispatch and Analysis Description 2.2.4
For the Energy Resource Analysis, the LA450S Project was initially dispatched to serve 100 MW of EPE
system load and 350 MW of WECC loads in Western and Northern New Mexico. The set of
contingencies described in Section 2.2.5 were tested on the initial set of Energy Resource cases (Peak and
Off Peak).
During the Energy Resource Analysis, Project generation was reduced until all criteria violations were
removed. As Project generation was reduced, the dispatch was proportionately changed so that the
Project served EPE system load and WECC loads consistent with the 100 MW to 350 MW initial Energy
Resource dispatch.
Contingency Lists 2.2.5
The steady state contingency list can be found in Appendix B. The stability contingency lists is shown
below in Table 2-3. Both lists were selected based on engineering judgement to represent a good cross
section of potential contingencies that would stress the EPE and PNM systems.
Table 2-3: Stability Contingencies
Fault Type Location Duration Trip
3-Phase Afton North 345 kV 5 cycles Afton North - Newman 345 kV
3-Phase* Afton North 345 kV 5 cycles Afton North - Luna 345 kV
3-Phase** Afton North 345 kV 5 cycles Afton North - LA450S 345 kV
3-Phase Afton 345 kV 5 cycles Afton - Diablo 345 KV
3-Phase Afton 345 kV 5 cycles Loss of all Afton Gen
3-Phase* Luna 345 kV 5 cycles Luna – Afton North 345 kV
3-Phase** Luna 345 kV 5 cycles Luna – LA450S 345 kV
3-Phase Diablo 345 kV 5 cycles Afton - Diablo 345 KV
3-Phase Hidalgo 345 kV 5 cycles Luna - Hidalgo 345 KV
3-Phase LEF 345 kV 5 cycles Luna - LEF 345 KV and LEF Gen
3-Phase Luna 345 kV 5 cycles Luna - Afton North 345 KV
3-Phase Luna 345 kV 5 cycles Luna - Macho Springs 345 KV
3-Phase Luna 345 kV 5 cycles Luna - Hidalgo 345 KV
3-Phase Luna 345 kV 5 cycles Luna - LEF 345 KV and LEF Gen
3-Phase Luna 345 kV 5 cycles Luna 345/115 kV XMFR
3-Phase Luna 115 kV 5 cycles Luna 345/115 kV XMFR
3-Phase Macho Springs 345 kV 5 cycles Macho Springs - Springville 345 kV

LA450S System Impact Study TRC June 2017 15
Fault Type Location Duration Trip
3-Phase Macho Springs 345 kV 5 cycles Macho Springs - Luna 345 kV
3-Phase Newman 345 kV 5 cycles Newman – Afton North 345 kV
3-Phase Newman 345 kV 5 cycles Newman - Arroyo 345 kV
3-Phase Newman 345 kV 5 cycles Newman - Corona 345 kV
3-Phase Newman 345 kV 5 cycles Newman 345/115 kV XMFR #1
3-Phase Springville 345 kV 5 cycles Macho Springs - Springville 345 kV
3-Phase** LA450S POI 345 kV 5 cycles LA450S – Amrad 345 kV
3-Phase** LA450S POI 345 kV 5 cycles LA450S – Picante 345 KV
3-Phase** LA450S POI 345 kV 5 cycles LA450S 345/34.5 kV XFMR
3-Phase** LA450S POI 345 kV 9 cycles LVRT
N/A
No Fault** N/A N/A LA450S Generation
* Pre-project Only ** Post-project Only

LA450S System Impact Study TRC June 2017 16
3.0 STEADY STATE POWER FLOW ANALYSIS
This section provides a high-level understanding of the LA450S impact on the loading of transmission
lines and transformers in the Study Area. The analysis was performed under both normal and
contingency conditions. Peak and Off Peak base cases were evaluated for thermally overloaded facilities
under both normal (N-0) and contingency (N-1) conditions prior to the addition of the LA200S
generation.
3.1 Normal Operating Condition Power Flow Evaluation
Power flow analysis was completed under system Normal (N-0) conditions before and after the addition
of the Project using both the Peak and Off Peak cases.
Pre-project N-0 Power Flow Evaluation 3.1.1
Power flow analysis results showed no overloaded transmission facilities were present in the El Paso
Electric (EPE) and Public Service Company of New Mexico (PNM) areas under Normal (N-0) system
conditions prior to the addition of LA450S generation.
Post-project N-0 Power Flow Evaluation 3.1.2
After the addition of LA450S, power flow study results continued to show no overloaded transmission
facilities in the El Paso Electric (EPE) and Public Service Company of New Mexico (PNM) areas under
Normal system conditions in both the Network Resource and Energy Resource Analysis.
3.2 Emergency Operating Condition Power Flow Evaluation
Contingency power flow analysis was completed by testing the contingencies listed in Appendix B on the
Peak and Off Peak cases both before and after the addition of the Project.
Pre-project N-1 Power Flow Evaluation 3.2.1
Power flow analysis results showed no overloaded transmission facilities were present in the El Paso
Electric (EPE) and Public Service Company of New Mexico (PNM) areas under Emergency (N-1) system
conditions prior to the addition of LA450S generation.
NRIS Post-project N-1 Power Flow Evaluation 3.2.2
Dispatching LA450S for NRIS has potential to create overloads on the Western and Central portions of
the EPE transmission. The results presented in Table 3-1 and in Table 3-2 show the criteria violations for
the Peak and Off Peak scenarios when the Project was tested as an NRIS.
Table 3-1: LA450S Impacts to Summer Emergency Equipment Loading – NRIS
Monitored Element & Contingency Results (% of Rating)
Pre-LA450S Post- LA450S
From
Bus Name kV
To
Bus Name kV
MVA
Rate Contingency Description 2019HS
2019HS
_MPS 2019HS
2019HS
_MPS
JORNADA 115 ARROYO 115 73.9 Line NEWMAN 345.0 to
AFTON_N 345.0 Circuit 1 86% 86% 166% 163%
NEWMAN 345 NEWMAN 115 265 Line NEWMAN 345.0 to
CORONA 345 Circuit 1 50% 62% 121% 121%

LA450S System Impact Study TRC June 2017 17
Monitored Element & Contingency Results (% of Rating)
Pre-LA450S Post- LA450S
From
Bus Name kV
To
Bus Name kV
MVA
Rate Contingency Description 2019HS
2019HS
_MPS 2019HS
2019HS
_MPS
NEWMAN 345 NEWMAN 115 265 Line AFTON 345.0 to
DIABLO 345.0 Circuit 1 65% 97% 127% 139%
NEWMAN 345 AFTON_N 345 1028 Line AFTON 345.0 to
DIABLO 345.0 Circuit 1 70% 71% 107% 108%
MESA___# 115 AUSTIN_N 115 207.4 Line NEWMAN 345.0 to
AFTON_N 345.0 Circuit 1 78% 83% 125% 121%
SUNSET_N 115 DURAZNO 115 169.3 Line NEWMAN 345.0 to
AFTON_N 345.0 Circuit 1 88% 85% 130% 123%
DIABLO 115 DIABLO 345 258 Line NEWMAN 345.0 to
AFTON_N 345.0 Circuit 1 79% 80% 117% 118%
DONA_ANA 115 PICACHO 115 108 Line NEWMAN 345.0 to
AFTON_N 345.0 Circuit 1 59% 60% 116% 115%
DIABLO 115 DIABLO 345 258 Line NEWMAN 345.0 to
AFTON_N 345.0 Circuit 1 79% 79% 116% 116%
DIABLO 115 DIABLO 345 258 Line NEWMAN 345.0 to
AFTON_N 345.0 Circuit 1 78% 78% 114% 115%
LUNA 345 LUNA 115 224 Line NEWMAN 345.0 to
AFTON_N 345.0 Circuit 1 92% 92% 113% 113%
Table 3-2: LA450S Impacts to Winter Emergency Equipment Loading – NRIS
Monitored Element & Contingency Results (% of Rating)
2019LW
From
Bus Name kV
To
Bus Name kV
MVA
Rate Contingency Description
Pre-
LA450S
Post-
LA450S
NEWMAN 345 NEWMAN 115 265 Line NEWMAN 345.0 to
CORONA 345 Circuit 1 67.7% 127.9%
NEWMAN 345 NEWMAN 115 265 Line AFTON 345.0 to
DIABLO 345.0 Circuit 1 57.7% 116.2%
LUNA 345 LUNA 115 224 Line NEWMAN 345.0 to
AFTON_N 345.0 Circuit 1 87.2% 110.9%
SUNSET_N 115 DURAZNO 115 169.3 Line NEWMAN 345.0 to
AFTON_N 345.0 Circuit 1 74.2% 110.0%
DONA_ANA 115 PICACHO 115 108 Line NEWMAN 345.0 to
AFTON_N 345.0 Circuit 1 47.3% 109.0%
JORNADA 115 ARROYO 115 73.9 Line NEWMAN 345.0 to
AFTON_N 345.0 Circuit 1 56.9% 103.4%
ERIS Post-project N-1 Power Flow Evaluation 3.2.3
Dispatching the full 450 MW of LA450S for ERIS shows a different set of initial overloads. The results
presented in Table 3-3 and in
Table 3-4 show the worst monitored/contingency element pairs for the Peak and Off Peak scenarios when
the Project was tested as an ERIS.
Table 3-3: LA450S Impacts to Summer Emergency Equipment Loading – ERIS
Monitored Element & Contingency Results (% of Rating)
Pre-LA450S Post- LA450S
From
Bus Name kV
To
Bus Name kV
MVA
Rate Contingency Description 2019HS
2019HS
_MPS 2019HS
2019HS
_MPS

LA450S System Impact Study TRC June 2017 18
Monitored Element & Contingency Results (% of Rating)
Pre-LA450S Post- LA450S
From
Bus Name kV
To
Bus Name kV
MVA
Rate Contingency Description 2019HS
2019HS
_MPS 2019HS
2019HS
_MPS
CABALLOT 115 MIMBRES 115 47 Line NEWMAN 345.0 to
AFTON_N 345.0 Circuit 1 81% 81% 108% 107%
LUNA 345 LUNA 115 224 Line LUNA 345.0 to
HIDALGO 345 Circuit 1 82% 82% 108% 109%
JORNADA 115 ARROYO 115 73.9 Line NEWMAN 345.0 to
AFTON_N 345.0 Circuit 1 86% 86% 109% 103%
LUNA 345 LUNA 115 224 Line NEWMAN 345.0 to
AFTON_N 345.0 Circuit 1 92% 92% 106% 105%
Table 3-4: LA450S Impacts to Winter Emergency Equipment Loading – ERIS
Monitored Element & Contingency Results (% of Rating)
2019LW
From
Bus Name kV
To
Bus Name kV
MVA
Rate Contingency Description
Pre-
LA450S
Post-
LA450S
DONA_ANA 115 PICACHO 115 108 Line LUNA 115.0 to
MIMBRES 115 Circuit 1 90% 106%
LUNA 345 LUNA 115 224 Line LUNA 345.0 to
HIDALGO 345 Circuit 1 75% 101%
3.3 NRIS Network Upgrade Power Flow Testing
In order to address the Project impacts shown in Table 3-3 and
Table 3-4, several different Network Upgrade alternatives were considered. While weighing constraints
such as Right-of-Way issues, installation costs, construction time, and existing contract restrictions, a
single set of Network Upgrades to address LA450S Project impacts was determined. The suggested
Network Upgrades can be described as follows:
1. Build Afton North-Anthony 345 kV Line (17.4miles)
2. Upgrade Anthony Substation by creating a 345 kV bus and adding a
345/115 kV Transformer.
3. Upgrade Afton North Substation to include an additional 345 kV line
terminal
In order to ensure that the proposed Network Upgrades will not cause any new thermal criteria violations,
the Network Upgrades were added to the Study cases then tested under Normal (N-0) and Emergency (N-
1) System Conditions. During the Network Upgrade testing, the proposed Afton North - Anthony 345 kV
line was added to the steady state contingency set.
The proposed Network Upgrade solution is shown in

LA450S System Impact Study TRC June 2017 19
Figure 3-1 (below). The overloads presented in Section 3.2.2, caused by the addition of LA450S, are
removed after the addition of the Network Upgrades.

LA450S System Impact Study TRC June 2017 20
Figure 3-1: Year 2019 EPE Transmission System with LA450S POI and Network Upgrades
3.4 ERIS Evaluation
Project generation was reduced until all criteria violation were removed. As Project generation was
reduced, the dispatch was proportionately changed so that the Project served EPE system load and WECC
loads consistent with the 100 MW to 350 MW initial Energy Resource dispatch.
The results in Table 3-5 show the heaviest stressed case as LA450S is reduced to a 250 MW installation.
ERIS overloads caused by the addition of the Project (presented in Section 3.2.3) are removed.
Table 3-5: Post-LA450S Summer Emergency Equipment Loading ERIS 275 vs 250 MW
Monitored Element & Contingency Results (% of Rating)
LA450S @ 275 MW LA450S @ 250 MW
From
Bus Name kV
To
Bus Name kV
MVA
Rate Contingency Description 2019HS
2019HS
_MPS 2019HS
2019HS
_MPS
LUNA 345 LUNA 115 224 Line LUNA 345.0 to
HIDALGO 345 Circuit 1 105% 105% <100% <100%
JORNADA 115 ARROYO 115 73.9 Line NEWMAN 345.0 to
AFTON_N 345.0 Circuit 1 101% <100% <100% <100%
LUNA 345 LUNA 115 224 Line NEWMAN 345.0 to
AFTON_N 345.0 Circuit 1 101% 100% <100% <100%

LA450S System Impact Study TRC June 2017 21
3.5 Extreme Outage Protection
Solutions presented in Section above address violations caused by all credible N-1 contingency.
However, EPE and NERC criteria may require LA450S to be taken offline under some N-2 or N-1-1
conditions. More details to be provided in the Facilities Study Report.
3.6 Power Flow Analysis Conclusion
For NRIS, the LA450S Project must include the following set of Network Upgrades:
4. Upgrade Anthony Substation by creating a 345 kV bus and adding a
345/115 kV Transformer (400 MVA).
5. Upgrade Afton North Substation to include an additional 345 kV line
6. Build Afton North-Anthony 345 kV Line (17.4 miles)
After the addition of the proposed Network Upgrades, Power Flow Analysis Results showed there are no
remaining overloaded facilities, under applicable N-0 or N-1 conditions, caused or worsened by the
addition of the LA450S Project. Please note however that potential curtailment of LA450S under certain
N-2 conditions will be investigated further within the Facilities Study Report.
For ERIS, the LA450S Project can reach a maximum capacity of 250 MW on an as-available basis.

LA450S System Impact Study TRC June 2017 22
4.0 STEADY STATE VOLTAGE ANALYSIS
Bus voltages within the Study Area were evaluated under both normal and contingency conditions with
and without the LA450S PV generation in service. Please note that the Post-project results discussed
below include the addition of the proposed Network Upgrades in the NRIS evaluation. The results also
assume maximum capacity of LA450S to be 250 MW output in the ERIS evaluation.
The Performance Criteria shown in Error! Reference source not found. were considered when
analyzing bus voltages for violations
4.1 Normal Operating Condition Voltage Evaluation
As studied in both NRIS and ERIS evaluations, the steady state voltage analysis showed no voltage
violations in the El Paso Electric (EPE) and Public Service Company of New Mexico (PNM) areas under
Normal (N-0) system conditions before or after the addition of LA450S generation.
4.2 Emergency Operating Condition Voltage Evaluation
Contingency Voltage analysis was completed by testing the contingencies listed in Appendix B on the
Peak and Off Peak cases both before and after the addition of the Project and relevant Network Upgrades.
As studied in both NRIS and ERIS evaluations, the steady state voltage analysis showed no voltage
violations in the El Paso Electric (EPE) and Public Service Company of New Mexico (PNM) areas under
Emergency (N-1) system conditions before or after the addition of LA450S generation.
4.3 Delta Voltage Evaluation
Bus voltages within the Study Area were evaluated under contingency conditions to determine the change
in voltage due to applicable design contingencies both with and without the LA450S PV generation in
service. The Performance Criteria shown in Error! Reference source not found. were considered when
analyzing bus voltages for violations.
After testing all contingencies listed in Appendix B on, results showed no bus voltages exceed the 7%
Delta Voltage threshold allowed by EPE Performance Criteria.
4.4 Power Factor Test
A power factor test was conducted to show that the LA450S PV generator can maintain a 0.95 pu leading
and lagging power factor at the POI.
Results showed the Project, as designed and operated at full 450 MW output, will continue to absorb vars
past a 0.95 pu leading power factor. However, as seen in the below, the Project inverters can maintain
only a 0.973 pu lagging power factor at the POI which is far short of the 0.95 pu lagging target required
by EPE.
In order to account for reactive loss across the LA450S collector system, an additional 33 Mvar of
capacitors will need to be added at the POI station in order to maintain a 0.95 lagging power factor at the
POI bus.

LA450S System Impact Study TRC June 2017 23
Table 4-1: Power Factor Test Results
Power Factor Test Results
PF Test
Location
Power Factor
(pu)
POI
Voltage
LA450S
MW
LA450S
Mvar
POI Reactive
(Mvar)
LA450S_POI 0.940 Leading 1.010 450 -117.4 N/A
LA450S_POI 0.973 Lagging 1.039 450 148 N/A
lA450S_POI 0.951 Lagging 1.043 450 148 33.0
4.5 Steady State Voltage Analysis Conclusions
Assuming the Network Upgrades in Section 3.3 are completed to support an NRIS, and assuming an
ERIS maximum capacity of 250 MW on as-available basis, there are no voltage violations caused or
worsened by the addition of the LA450S Project.
However, in order to account for reactive loss across the LA450S collector system, an additional 33 Mvar
of capacitors will need to be added at the POI station in order to maintain a 0.95 lagging power factor at
the LA450S POI.

LA450S System Impact Study TRC June 2017 24
5.0 SHORT CIRCUIT ANALYSIS
A short circuit analysis was performed to determine if the addition of the LA450S PV generation to the
EPE transmission system would cause any of EPE’s transmission system’s existing substation circuit
breakers to exceed their interrupting capability ratings.
The results below do not include the Network Upgrades described in Section 3.3. Because the Network
Upgrades will consist solely of bus work and a transmission line, they are expected to have only marginal
impact to fault currents and subsequent breaker duty.
5.1 Short Circuit Analysis Modeling
Pre-project and Post-project cases were developed to perform this analysis. As mentioned, any planned
or proposed third party generation listed in EPE’s study queue ahead of LA450S PV generation was also
modeled in the cases. The generator and collector system impedance data used in the study is shown in
Table 5-1.
This analysis evaluated the impact of the LA450S generation by comparing the pre-project and post-
project fault current levels at selected buses.
Table 5-1: Generator Short Circuit Modeling Data
Project
Total
Output
(MW)
Interconnection Customer GSU
Unit
ID
Pmax
(MW)
Qmax
(Mvar)
Qmin
(Mvar)
Z sub-
transient
Rating
(MVA)
Voltage
(kV)
Z
Sub-transient
LA450S 450 1 450 148 -148 0.000 +j0.2 490 345/34.5/13.8 0.002 +j0.01
5.2 Short Circuit Analysis Procedure
The initial short circuit analysis was performed with all other third-party generation projects ahead of the
LA450S generation in the study queue in service and LA450S generation out of service. This identified
the “base case” fault duties of the circuit breakers. The short circuit analysis was performed again with
LA450S generation in service.
Three phase, two phase, two phase to ground, and single-phase line-to-ground faults were simulated at all
buses in the EPE and PNM system. The ASPEN One Liner and Batch Short Circuit Module were used to
perform the short circuit analysis. The short circuit fault analyses were performed with the following
settings:
Transmission line G+jB ignored.
Shunts with positive sequence impedance ignored.
Transformer line shunts ignored
The pre-fault voltage was calculated using a Flat bus voltage of 1.05 per unit.
Fault currents within the EPE System where analyzed before and after the addition of the LA450S
project. Buses that showed an increase of 100 amps or more were reported. These scenarios were then
compared against the smallest breaker interruption ratings at each substation to determine whether any
breaker was over dutied under pre-project or post-project conditions.

LA450S System Impact Study TRC June 2017 25
5.3 Short Circuit Analysis Results and Conclusion
The results of this short circuit study showed that LA450S project has no significant impact to the fault
currents on the EPE system. The study also showed that the fault currents produced by the LA450S
generation will not exceed the interrupting capability of any existing or proposed circuit breakers on the
EPE system. A complete list of the short circuit results is given in Table 5-2 and Table 5-3 below.
Table 5-2: Short Circuit Analysis Results (Area 10)
Bus Fault On
Lowest
Breaker
Rating
(kA)
Fault
Pre-
project
Current
Post-
project
Current
Delta
(Amperes) (Amperes) (Amperes)
Area 10 (PNM and TSGT)
Afton Gen1 18 3LG 75,437 75,675 238
2LG 75,551 75,709 159
Afton Steam 13.8 3LG 95,567 95,908 341
2LG 92,682 92,895 213
DEMING PLAIN 115
3LG 8,677 8,869 193
2LG 8,726 8,882 155
1LG 8,545 8,656 112
HERMANAS 115 kV 3LG 7,020 7,146 125
HIDALG_XFMR 13.8
kV
3LG 133,035 135,263 2,228
2LG 151,611 153,723 2,112
1LG 158,171 159,448 1,278
HIDALGO 115 kV 40
3LG 17,770 18,012 242
2LG 19,509 19,722 213
1LG 20,311 20,448 137
LEF-GT2 18 kV
3LG 91,092 92,083 991
2LG 88,997 89,616 619
1LG 79,399 79,661 261
LEF-ST1 18 kV
3LG 106,107 108,569 2,461
2LG 99,930 101,368 1,438
1LG 88,098 88,673 575
LUNA 115 kV 20
3LG 10,482 10,777 295
2LG 11,871 12,254 383
1LG 12,189 12,446 257
Luna Energy 345 40
3LG 13,515 15,869 2,354
2LG 13,596 16,214 2,617
1LG 13,430 15,842 2,412
MIMBRES 115 kV 40
3LG 9,134 9,348 213
2LG 9,331 9,513 182
1LG 9,299 9,432 133
XFMR LUNA 13.8 3LG 127,272 133,685 6,413

LA450S System Impact Study TRC June 2017 26
Bus Fault On
Lowest
Breaker
Rating
(kA)
Fault
Pre-
project
Current
Post-
project
Current
Delta
(Amperes) (Amperes) (Amperes)
Area 10 (PNM and TSGT)
2LG 130,269 135,930 5,661
1LG 130,295 134,189 3,894
XFRM2_HIDALG 13.8
kV 3LG 44,162 44,330 168
Table 5-3: Short Circuit Analysis Results (Area 11)
Bus Fault On
Lowest
Breaker
Rating
(kA)
Fault
Pre-
project
Current
Post-
project
Current
Delta
(Amperes) (Amperes) (Amperes)
Area 11 (EPE)
AFTON 345 kV 50
3LG 12,978 13,869 891
2LG 12,582 13,609 1,027
1LG 11,811 13,221 1,409
AFTON_N 345 kV 40
ASSUMED
3LG 12,976 13,869 893
2LG 12,571 13,611 1,040
1LG 11,793 13,227 1,434
ANTHONY 115 kV 40 3LG 14,420 14,522 102
ARROYO 115 kV 22 3LG 17,954 18,188 234
2LG 18,324 18,490 166
ARROYO 345 kV 40 3LG 7,841 7,970 128
ASC_CAPBANK 69
kV 31
3LG 25,764 25,904 140
2LG 26,801 26,902 101
ASCARATE 69 kV 40 3LG 25,848 25,989 141
2LG 26,889 26,991 102
ASCARATE 115 kV 22 3LG 21,776 21,946 170
2LG 21,382 21,490 108
AUSTIN 115 kV 20 3LG 22,193 22,368 175
2LG 21,176 21,279 103
BIGGS 115 kV 40 3LG 16,037 16,138 101
Afton North 115 kV 40
ASSUMED
3LG 9,867 10,006 140
2LG 10,176 10,347 171
1LG 10,377 10,570 194
CA200S POI 345 40
ASSUMED
3LG 9,809 10,015 206
2LG 10,028 10,182 154
CALIENTE 115 kV 40 3LG 25,079 25,293 214
2LG 26,396 26,560 164
CALIENTE 345 kV 40 3LG 9,414 9,584 170

LA450S System Impact Study TRC June 2017 27
Bus Fault On
Lowest
Breaker
Rating
(kA)
Fault
Pre-
project
Current
Post-
project
Current
Delta
(Amperes) (Amperes) (Amperes)
Area 11 (EPE)
2LG 9,554 9,676 122
COPPER 115 kV 25 3LG 19,575 19,707 132
CORONA 345 kV 40
ASSUMED
3LG 10,555 10,797 241
2LG 10,809 10,989 181
1LG 10,871 10,980 109
CROMO 115 kV 40 3LG 22,900 23,148 248
2LG 22,090 22,247 157
DIABLO 115 kV 31
3LG 26,272 26,687 415
2LG 26,291 26,626 335
1LG 25,871 26,107 236
DIABLO 345 kV 40
3LG 8,535 8,777 242
2LG 8,189 8,371 182
1LG 7,611 7,750 139
DURAZNO 115 kV 40 3LG 17,181 17,297 116
DYER 115 kV 20 3LG 19,746 19,878 131
EA1 115 kV 40
ASSUMED
3LG 21,446 21,610 164
2LG 20,853 20,955 103
FT_BLISS 115 kV 25 3LG 17,320 17,423 103
GLOBAL_RCH 115 kV 40 3LG 17,258 17,371 113
HIDALGO 345 kV 40
3LG 9,058 9,404 346
2LG 8,556 8,786 229
1LG 7,758 7,900 142
JORNADA 115 kV 40 3LG 11,314 11,416 102
LANE 115 kV 25 3LG 19,867 20,003 136
LAS_CRUC 115 kV 31 3LG 13,390 13,523 133
LUNA 345 kV 40
3LG 13,742 16,246 2,504
2LG 13,721 16,718 2,998
1LG 13,398 16,328 2,930
MACHO_SPRING 345
kV 50
3LG 8,730 9,419 689
2LG 7,976 8,413 438
1LG 5,825 6,208 383
MARLOW 115 kV 31 3LG 21,084 21,243 158
MESA 115 kV 23 3LG 20,631 20,821 190
2LG 19,373 19,484 111
Miner 115 kV 3LG 16,806 16,934 127
MONTOYA 115 kV 20 3LG 15,107 15,217 111

LA450S System Impact Study TRC June 2017 28
Bus Fault On
Lowest
Breaker
Rating
(kA)
Fault
Pre-
project
Current
Post-
project
Current
Delta
(Amperes) (Amperes) (Amperes)
Area 11 (EPE)
MONTWOOD 115 kV 40 3LG 19,083 19,191 108
MPS 115 kV 63 3LG 23,687 23,842 155
2LG 24,985 25,102 117
NEWMAN 115 kV 50
3LG 34,996 35,326 330
2LG 39,945 40,233 288
1LG 41,522 41,684 162
NEWMAN 345 kV 50
3LG 11,465 11,791 327
2LG 11,664 11,906 242
1LG 11,609 11,754 145
Otero_345 345 kV 40
ASSUMED
3LG 9,785 9,990 205
2LG 9,993 10,145 152
P_DODGE 69 kV 3LG 22,942 23,052 110
PATRIOT 115 kV 40 3LG 23,919 24,078 159
2LG 24,062 24,166 104
PENDALE 115 kV 40 3LG 17,932 18,043 111
PICANTE 115 kV 40 3LG 18,523 18,664 141
PICANTE 345 kV 40 3LG 10,040 10,245 204
2LG 10,336 10,491 154
RIO_GRAN 69 kV 40 3LG 21,709 21,839 130
2LG 24,036 24,147 111
RIO_GRAN 115 kV 40
3LG 28,119 28,501 382
2LG 28,884 29,176 292
1LG 29,201 29,368 167
RIPLEY 115 kV 40 3LG 17,797 17,950 153
SALOPEK 115 kV 22 3LG 12,053 12,153 100
SOL 115 kV 40 3LG 18,258 18,375 117
SUNSET_N 115 kV 20 3LG 19,775 19,950 175
THORN 115 kV 20 3LG 15,786 15,907 120
TROWBRIDGE 115 kV
30 3LG 21,209 21,370 161
VISTA 115 kV 25 3LG 19,841 19,982 141
WRANGLER 115 kV 40 3LG 17,207 17,308 101

LA450S System Impact Study TRC June 2017 29
6.0 STABILITY ANALYSIS
A Transient Stability analysis was performed under Peak and Off Peak load conditions to determine the
degree of impact the Project may have on the EPE system. This analysis evaluated the performance of
the system for selected faults. The purpose of this analysis is to ensure the system has adequate damping
after a fault/trip event.
The analysis compared the system response to the fault simulations before and after the LA450S
generation was added.
The simulations were conducted using the PSLF power flow and dynamic simulation software, General
Electric, Inc. PSLF load flow software package, Version 19 and the associated “DYTools” module.
Dynamic stability simulations were conducted for Peak and Off Peak load conditions with the LA450S
generation off, and on at full capacity.
6.1 Dynamic Modeling
EPE provided the dynamic file data base for this part of the study. The Interconnection Customer
provided the detailed model data sheets and/or parameter values for the LA450S inverters that were added
to the database.
6.2 Stability Study Case Development
The same base cases that were developed for the NRIS and ERIS Steady State evaluations were tested for
any stability violations. (See Section 2.2)
The Pre-Project stability plots for the Peak (MPS On & Off) and Off Peak study cases are provided in
Appendix C. In Appendix C, each study case is presented in a separate set of PDF plots that show
relevant EPE system response to the set of disturbance listed in Error! Reference source not found..
6.3 Preliminary NRIS Stability Analysis
The preliminary analysis was completed using the NRIS cases without Network Upgrades included.
Comparing the preliminary NRIS results in Appendix D1, with the pre-project results in Appendix C,
shows that, EPE system stability was not impacted by adding LA450S at its full 450 MW capacity even
without Network Upgrades included.
The response of the LA450S generator to the set of disturbance listed in Error! Reference source not
found. is also provided at the end of each file in Appendix D and Appendix E. Results show that the unit
remained stable and positively damped for all simulations tested in both NRIS and ERIS analysis.
Table 6-1: Transient Stability Analysis Preliminary Results
Fault Name in
Appendix C /
Appendix D & E
Location Duration Trip Pre-LA450S
ALL CASES
Post-LA450S
ALL CASES
Line 1 / Line 1 Afton North 345
kV 5 cycles Afton North - Newman 345 kV Stable Stable
Line 2 / NA Afton North 345
kV 5 cycles Afton North - Luna 345 kV Stable Stable
NA / Line 20 Afton North 345
kV 5 cycles Afton North - LA450S 345 kV Stable Stable
Bus 3 / Bus 2 Afton 345 kV 5 cycles Loss of all Afton Gen Stable Stable

LA450S System Impact Study TRC June 2017 30
Fault Name in
Appendix C /
Appendix D & E
Location Duration Trip Pre-LA450S
ALL CASES
Post-LA450S
ALL CASES
Line 4 / Line 3 Afton 345 kV 5 cycles Afton - Diablo 345 KV Stable Stable
Line 5 / Line 4 Diablo 345 kV 5 cycles Afton - Diablo 345 KV Stable Stable
Line 6/Line 5 Hidalgo 345 kV 5 cycles Luna - Hidalgo 345 KV Stable Stable
Line 7/Line 6 Luna 345 kV 5 cycles Luna - LEF 345 KV and LEF Gen Stable Stable
Line 8/NA Luna 345 kV 5 cycles Luna – Afton North 345 kV Stable Stable
NA/Line 19 Luna 345 kV 5 cycles Luna – LA450S 345 kV Stable Stable
Line 9/Line 7 Luna 345 kV 5 cycles Luna - Macho Springs 345 KV Stable Stable
Line 10Line 8 Luna 345 kV 5 cycles Luna - Hidalgo 345 KV Stable Stable
Line 11/ Line 9 Luna 345 kV 5 cycles Luna - LEF 345 KV and LEF Gen Stable Stable
Bus 12/Bus 10 Luna 345 kV 5 cycles Luna 345/115 kV XMFR Stable Stable
Bus 13/Bus 11 Luna 115 kV 5 cycles Luna 345/115 kV XMFR Stable Stable
Line 14/Line 12 Macho Springs
345 kV 5 cycles
Macho Springs - Springville 345
kV Stable Stable
Line 15/Line 13 Macho Springs
345 kV 5 cycles Macho Springs - Luna 345 kV Stable Stable
Bus 16/Bus 14 Newman 345
kV 5 cycles Newman 345/115 kV XMFR #1 Stable Stable
Line 17/Line 15 Newman 345
kV 5 cycles Newman – Afton North 345 kV Stable Stable
Line 18/Line 16 Newman 345
kV 5 cycles Newman - Arroyo 345 kV Stable Stable
Line 19/Line 17 Newman 345
kV 5 cycles Newman - Corona 345 kV Stable Stable
Line 20/Line 18 Springville 345
kV 5 cycles
Springville - Macho Springs 345 kV
Stable Stable
NA/Line 21 LA450S POI
345 kV 5 cycles LA450S – Luna 345 kV Stable Stable
NA/Line 22 LA450S POI
345 kV 5 cycles LA450S – Afton North 345 KV Stable Stable
NA/Bus 23 LA450S POI
345 kV 5 cycles LA450S 345/34.5 kV XFMR Stable Stable
NA/Bus 24
LA450S POI 345 kV
9 cycles LVRT
N/A Stable Stable
NA/Gen 25 N/A N/A LA450S Generation Stable Stable
6.4 Final NRIS Stability Analysis Results
In order to ensure the Network Upgrades discussed in Section 3.3 address all Project impacts and will not
create any stability concerns, additional stability simulations were completed with the Network Upgrades
included in the NRIS study cases.
The set of disturbances listed in Error! Reference source not found. where again tested with Network
Upgrades in place. Results in Appendix E1 show that LA450S continues to have no adverse impact to
EPE system stability once the Network Upgrades are included.
Outages on the proposed Network Upgrade equipment were also tested. The fault simulations described
in Error! Reference source not found. were included in the NRIS simulation set. Relevant EPE plots
for each fault can be found at the end of each file in Appendix E1.

LA450S System Impact Study TRC June 2017 31
Table 6-2: Transient Stability Analysis Post-Network Upgrade Results
Fault Name in
Appendix G2 Fault Location
Fault
Duration Trip
Post-LA450S
Network Upgrade
ALL CASES
Line 26 Afton 345 KV 5 cycles Afton – Anthony 345 kV Stable
Line 27 Anthony 345 kV 5 cycles Afton – Anthony 345 kV Stable
Bus 28 Anthony 115 kV 5 cycles Anthony 345/115 kV Stable
Bus 29 Anthony 345 kV 5 cycles Anthony 345/115 kV Stable
Network Upgrade impacts to the response of the LA450S can once again be found at the end of each file
in Appendix E. Results continue show that the unit remained stable and positively damped for all
simulations tested in both NRIS and ERIS analysis both preliminary and final.
6.5 Final ERIS Stability Analysis Results
For the ERIS evaluation, LA450S and EPE system stability were verified on the ERIS case with
maximum Project generation set to 250 MW. Results in Appendix E2 show that LA450S continues to
have no adverse impact to EPE system stability when dispatched to a maximum 250 MW ERIS capacity.
Summary output files are also available for all the simulations created for this SIS report. The summary
report files are in the separate tabs of the Excel document provided as Appendix F.
6.6 Low Voltage Ride Through Test
As shown in Error! Reference source not found., fault name “Bus 24” at LA450S POI tested LA450S
unit response to a 9 cycle Low Voltage Ride Through (LVRT) fault. During the NRIS and ERIS analysis,
this “Bus 24” fault was tested for each case scenario.
The LA450S response to the “Bus 24” LVRT disturbance can be seen in Appendix D and E. The plots
show that the LA450S unit remains online and positively damped through all tested simulations. LA450S
passes all ride through requirements.
6.7 System Inertia Analysis
A high-level system inertia test was completed to determine the impacts of displacing up to 650 MW of
EPE conventional gas generation with proposed PV installations currently in the EPE interconnection
queue.
This analysis was completed by selecting a lightly loaded, high PV penetration study case, then
simulating remote end faults on each of the (3) three 345 kV lines that source EPE. (Afton-Diablo, Afton
North-Newman, Arroyo-West Mesa).
The first case that was tested was the Off Peak (Light Winter) case developed for the NRIS evaluation,
and described in Section 2.2.2 of this report. Six (6) separate simulations were tested to ensure the loss of
an EPE 345 kV line can be withstood. This initial tests did not show a significant drop in frequency or
system collapse in any of the fault simulations.
An additional test was then completed using an off the shelf, WECC case for a 2017 Light Autumn
condition. The Light Autumn WECC case modified by adding only the relevant senior queued EPE
generation (DS90S & CA200S) as well as LA450S generation. (All loads were left as provided in the
approved WECC case.) The 740 MW of senior queued solar generation was used to offset conventional
gas generation in EPE, then the six fault simulations testing outages on the 345 kV lines were tested.

LA450S System Impact Study TRC June 2017 32
Once again, there was no significant drop in frequency or system collapse in any of the tested fault
simulations using the WECC 2017 Light Autumn case.
To further test the inertia of the system, the Luna Energy Facility (LEF) units were all taken offline in the
WECC 2017 Light Autumn case, and the six different fault simulations were tested again. (The
generation from online LEF units were picked up by turning up generation in the Palo Verde area.) Again,
there was no significant drop in frequency or system collapse in any of the tested fault simulations using
the WECC 2017 Light Autumn case with LEF offline.
The plots in Appendix H show the result of each of the six simulations as tested on the WECC 2017 case
with senior queued generation added and LEF generation offline. The plots are worst case plots of angle,
voltage, and frequency at busses in Areas 10, 11, and 14 for each of the simulated faults. The naming
convention of the fault simulations are listed below.
Appendix H Fault code and locations (all clearing in 5 cycles):
Line 1 = Fault at Newman 345 kV; Clear Newman – Afton North 345 kV
Line 2 = Fault at Afton North 345 kV; Clear Newman – Afton North 345 kV
Line 3 = Fault at Afton 345 kV; Clear Diablo – Afton 345 kV
Line 4 – Fault at Diablo 345 kV; Clear Diablo – Afton 345 kV
Line 5 – Fault at West Mesa 345 kV; Clear West Mesa to Arroyo PST 345 kV
Line 6 - Fault at Arroyo PST 345 kV; Clear West Mesa to Arroyo PST 345 kV
6.8 Stability Analysis Conclusion
Results of both the NRIS and ERIS evaluation show that the EPE system and the LA450S unit remained
stable and positively damped for all simulations tested.

LA450S System Impact Study TRC June 2017 33
7.0 COST ESTIMATES, ONE-LINES, & PROJECT SCHEDULE
Good faith cost estimates in 2017 dollars (no escalation applied) are presented below. The cost estimates
are based upon costs for previously performed similar construction. These costs include all estimated
applicable labor and overheads associated with the engineering, design, and construction of these new
EPE facilities. These estimates did not include the Generator Interconnection Costs4 for any other
Interconnection Customer owned equipment or associated design and engineering except for the POI and
Network Upgrade facilities.
The estimated total cost for the required upgrades is $58.94 Million for LA450S project. This breaks
down to $0.77 Million for the EPE Interconnection Costs5 at the POI, $9.00 Million for the LA450S POI
Costs, and $49.17 Million for Network Upgrade Costs6. Table 7-1 details the estimated costs for the
LA450S POI. Please note, associated Generator Interconnection Costs have not been estimated as part of
this study.
Table 7-1: Cost Estimate
Project Item
EPE
Interconnection
Substation
Network
Upgrade
Transmission
Network
Upgrade
Total
Cost Cost Cost Cost
(in millions) (in millions) (in millions) (in millions)
LA450S
LA450S
Interconnection
Switching Station
$0.77 $9.00 $0 $9.77
Total LA450S $ 9.77 M
The one-line seen in
4 Generator Interconnection Costs: cost of facilities paid for by Interconnection Customer and owned and
operated by the Interconnection Customer from the generator facilities to the Change of Ownership Point, which
is typically on the first dead-end at the Point of Interconnection substation.
5 EPE Interconnection Costs: cost of facilities paid for by Interconnection Customer but owned and operated by
EPE from the Change of Ownership Point to the Point of Interconnection.
6 Network Upgrades Costs: cost of facilities from the Point of Interconnection outward, paid for by the
interconnector but owned and operated by EPE.

LA450S System Impact Study TRC June 2017 34
Figure 7-1 shows the POI Substation equipment with a color coded cost responsibility breakdown. The
substation costs for LA450S are given in

LA450S System Impact Study TRC June 2017 35
Table 7-2.
Element Description Cost Est.
Millions
LA450S POI 345 kV
Substation
Build a new 345 kV three breaker in a Breaker and a Half Scheme Substation. The new
equipment required includes:
Three 345 kV 3000 A circuit breakers
Six 345 kV 2000 A disconnect switches
Two 345 kV 2000 A line disconnect switches w/ grounding
Six sets of CCVT’s and Structures
Six Lightning arresters and Structures
Three sets of Transmission Line Dead-end Assemblies for Substation Dead-end
One lot 345 kV bus, insulators, and structural supports
One lot Transmission line relaying, SCADA, communication, and testing
One lot ground grid, misc. grounding, concrete, conduit, cable trench, and fencing
Relay Setting Changes will also be needed at Chaparral and Oro Grande
$9.00
Estimated Time Frame for Engineering, Procurement, Construction, and Commissioning 29 Months
is a detailed breakdown of the POI substation construction costs.
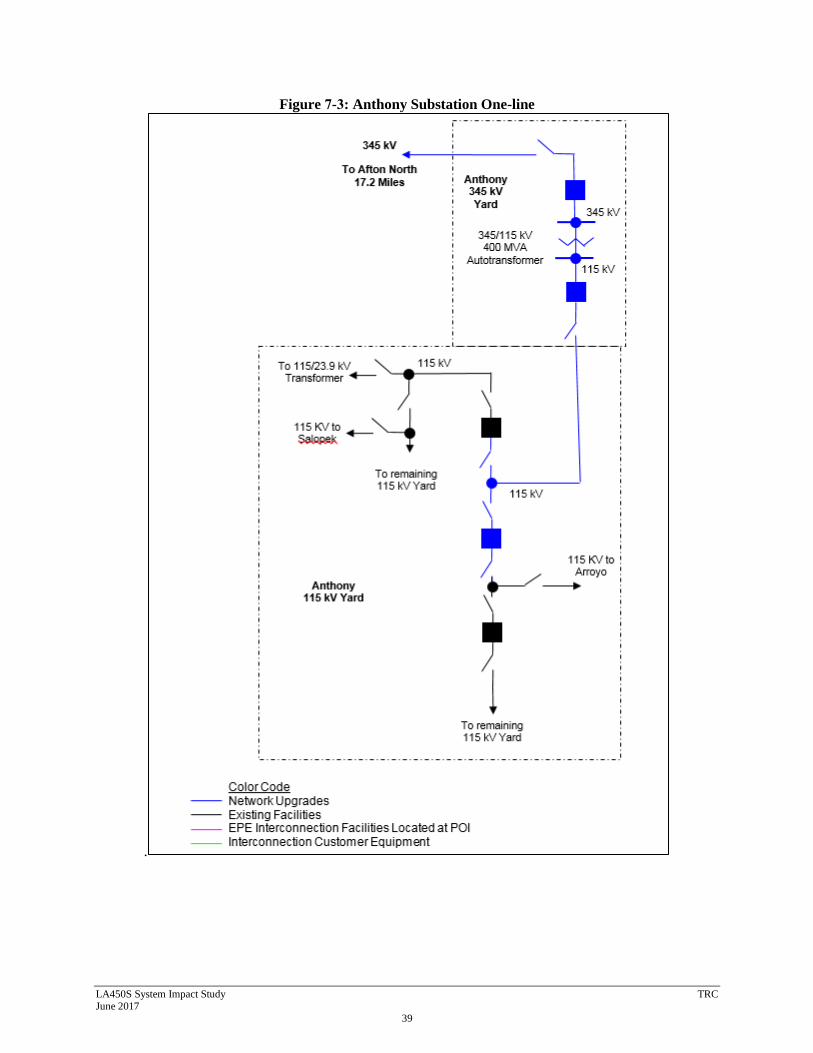
Figure 7-2 and Figure 7-3 show the Network Upgrades required at Afton North and Anthony Substations
respectively. A detailed breakdown of construction costs are in the subsequent tables.
The Project Schedule in Appendix G provides a more detailed breakdown of the estimated time for
Engineering, Procurement, Construction and Commissioning.

LA450S System Impact Study TRC June 2017 36
Figure 7-1: LA450S POI Station One Line

LA450S System Impact Study TRC June 2017 37
Table 7-2: EPE Interconnection Facilities Costs for POI Station (LA450S)
Element Description Cost Est.
Millions
LA450S EPE Interconnection Facilities located at CA200S POI
One 345 kV 2000 A disconnect switch w/ grounding
One 345 kV Deadend Structure
One set of CCVT’s and Structures
Three Lightning arresters and Structures
One Set of 345 kV 3-Phase Metering Units and structures
Relaying, communication, and testing
$0.770
Estimated Time Frame for Engineering, Procurement, Construction, and Commissioning 19 Months
Table 7-3: EPE Network Upgrade Costs for the LA450S POI Station
Element Description Cost Est.
Millions
LA450S POI 345 kV
Substation
Build a new 345 kV three breaker in a Breaker and a Half Scheme Substation. The new
equipment required includes:
Three 345 kV 3000 A circuit breakers
Six 345 kV 2000 A disconnect switches
Two 345 kV 2000 A line disconnect switches w/ grounding
Six sets of CCVT’s and Structures
Six Lightning arresters and Structures
Three sets of Transmission Line Dead-end Assemblies for Substation Dead-end
One lot 345 kV bus, insulators, and structural supports
One lot Transmission line relaying, SCADA, communication, and testing
One lot ground grid, misc. grounding, concrete, conduit, cable trench, and fencing
Relay Setting Changes will also be needed at Chaparral and Oro Grande
$9.00
Estimated Time Frame for Engineering, Procurement, Construction, and Commissioning 29 Months

LA450S System Impact Study TRC June 2017 38
Figure 7-2: Afton North Switching Station One Line (Network Upgrade)
LA450S System Impact Study TRC June 2017 39
Figure 7-3: Anthony Substation One-line
.
LA450S System Impact Study TRC June 2017 40
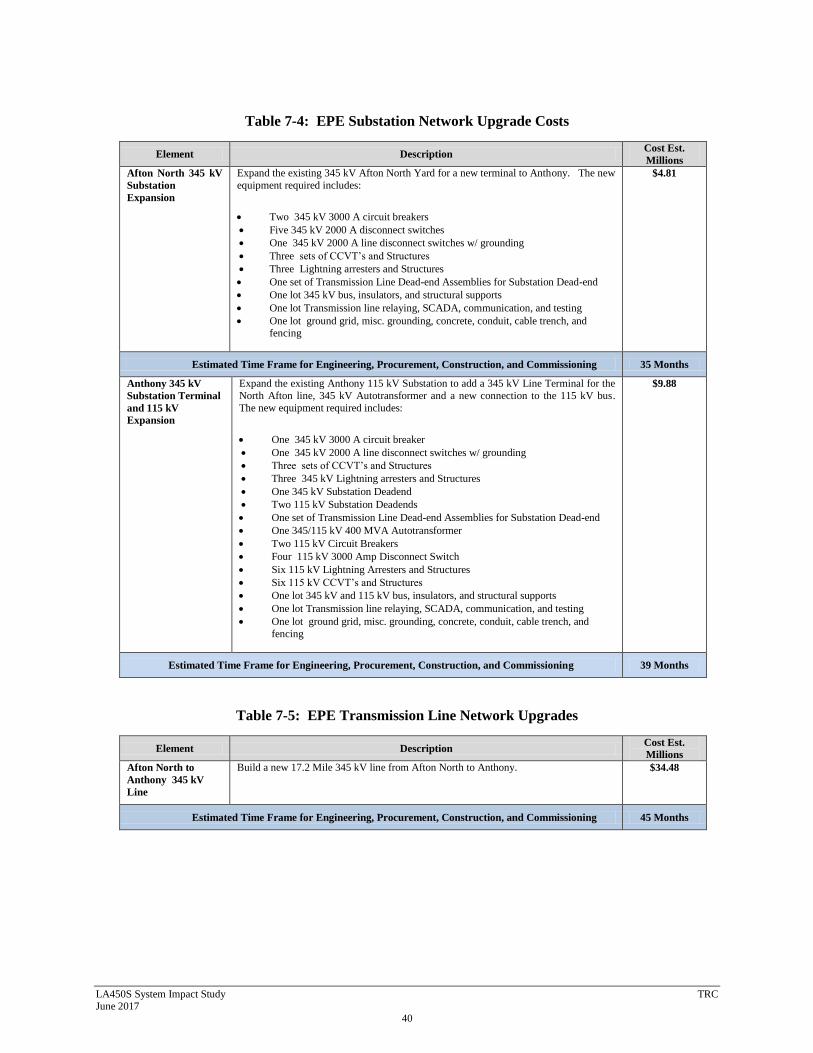
Table 7-4: EPE Substation Network Upgrade Costs
Element Description Cost Est.
Millions
Afton North 345 kV
Substation
Expansion
Expand the existing 345 kV Afton North Yard for a new terminal to Anthony. The new
equipment required includes:
Two 345 kV 3000 A circuit breakers
Five 345 kV 2000 A disconnect switches
One 345 kV 2000 A line disconnect switches w/ grounding
Three sets of CCVT’s and Structures
Three Lightning arresters and Structures
One set of Transmission Line Dead-end Assemblies for Substation Dead-end
One lot 345 kV bus, insulators, and structural supports
One lot Transmission line relaying, SCADA, communication, and testing
One lot ground grid, misc. grounding, concrete, conduit, cable trench, and fencing
$4.81
Estimated Time Frame for Engineering, Procurement, Construction, and Commissioning 35 Months
Anthony 345 kV
Substation Terminal
and 115 kV
Expansion
Expand the existing Anthony 115 kV Substation to add a 345 kV Line Terminal for the
North Afton line, 345 kV Autotransformer and a new connection to the 115 kV bus.
The new equipment required includes:
One 345 kV 3000 A circuit breaker
One 345 kV 2000 A line disconnect switches w/ grounding
Three sets of CCVT’s and Structures
Three 345 kV Lightning arresters and Structures
One 345 kV Substation Deadend
Two 115 kV Substation Deadends
One set of Transmission Line Dead-end Assemblies for Substation Dead-end
One 345/115 kV 400 MVA Autotransformer
Two 115 kV Circuit Breakers
Four 115 kV 3000 Amp Disconnect Switch
Six 115 kV Lightning Arresters and Structures
Six 115 kV CCVT’s and Structures
One lot 345 kV and 115 kV bus, insulators, and structural supports
One lot Transmission line relaying, SCADA, communication, and testing
One lot ground grid, misc. grounding, concrete, conduit, cable trench, and
fencing
$9.88
Estimated Time Frame for Engineering, Procurement, Construction, and Commissioning 39 Months
Table 7-5: EPE Transmission Line Network Upgrades
Element Description Cost Est.
Millions
Afton North to
Anthony 345 kV
Line
Build a new 17.2 Mile 345 kV line from Afton North to Anthony.
$34.48
Estimated Time Frame for Engineering, Procurement, Construction, and Commissioning 45 Months

LA450S System Impact Study TRC June 2017
41
8.0 DISCLAIMER
If any of the project data provided by Interconnection Customer and used in this study varies significantly
from the actual data of the installed generation equipment for LA450S, the results from this study will
need to be verified with the actual data at the Project Interconnection Customer's expense. Additionally,
any change in the generation in EPE’s Interconnection Queue that is senior to the LA450S may require a
re-evaluation of this Study.

LA450S System Impact Study TRC June 2017
42
9.0 CONCLUSIONS
The results of the NRIS evaluation showed the need for a new, 17.4 mile long, 345 kV transmission line
between Afton and Anthony Substation. In addition to this new 345 kV line a 345/115 kV transformer,
and new 345 kV switchyard is also needed at Anthony.
The required Network Upgrades for CA200S interconnection are as follows:
1. Upgrade Anthony Substation by creating a 345 kV bus and adding a
345/115 kV Transformer.
2. Upgrade Afton North Substation to include an additional 345 kV line
3. Build Afton North-Anthony 345 kV Line (17.4miles)
These reinforcements are required if LA450S is used to serve native EPE load and offset local EPE
conventional generation. Results showed no remaining criteria violations after the addition of these
Network Upgrades.
The results of the ERIS evaluation showed that LA450S can operate at a maximum capacity of 250 MW
on as-available basis before creating a criteria violation. (During ERIS evaluation LA450S generation
was delivered to EPE native load versus WECC loads in New Mexico/Arizona at the requested 1 to 3.5
ratio.)
The estimated cost for integrating the LA450S Project onto the EPE transmission system as an ERIS
Project is $9.77 Million. The good faith estimate for the time frame to Engineer, Procure, and Construct
the POI facilities for an ERIS Project is 39 months, (upon notice to proceed from tine Interconnection
Customer).
The estimated cost for integrating the LA450S Project onto the EPE transmission system as an NRIS
Project is $59.94 Million, including the cost for associated Network Upgrades. The good faith estimate
for the time frame to Engineer, Procure, and Construct all facilities at the POI and the associated Network
Upgrade Substations is 45 months, (upon notice to proceed from tine Interconnection Customer).

LA450S System Impact Study TRC June 2017
43
Appendix A
LA4500S Project Modeling Information
LA450S System Impact Study TRC June 2017
44
Appendix B
Power Flow Contingency List

LA450S System Impact Study TRC June 2017
45
Appendix C
Pre-Project Stability Plots

LA450S System Impact Study TRC June 2017
46
Appendix D
LA450S Preliminary Stability Plots (NRIS and ERIS)

LA450S System Impact Study TRC June 2017
47
Appendix E
LA450S Final Stability Plots (NRIS and ERIS)

LA450S System Impact Study TRC June 2017
48
Appendix F
Stability Run Summary Reports

LA450S System Impact Study TRC June 2017
49
Appendix G
Project Schedule

LA450S System Impact Study TRC June 2017
50
Appendix H
System Inertia Analysis Plots


![POTENZA DI CORTOCIRCUITO NELLE RETI ... - … · Scc [MVA] AT 500 MVA con trasformatori < 40 MVA AT 2000 MVA con trasformatori < 40 MVA AT 500 MVA con trasformatori 63 MVA Per i nodi](https://img.pdfslide.net/doc/110x75/5c0c153909d3f252498b8ed4/potenza-di-cortocircuito-nelle-reti-scc-mva-at-500-mva-con-trasformatori.jpg)

![Contingencies and provisioning[1]](https://img.pdfslide.net/doc/110x75/5457ed9faf795963388b5b66/contingencies-and-provisioning1.jpg)