Embed Size (px)
Citation preview
© OECD/IEA 2017 - 1© OECD/IEA 2017
System Integration of Renewables
Séminaire CFE31 March 2017, Paris
Cédric Philibert
Renewable Energy Division
© OECD/IEA 2016
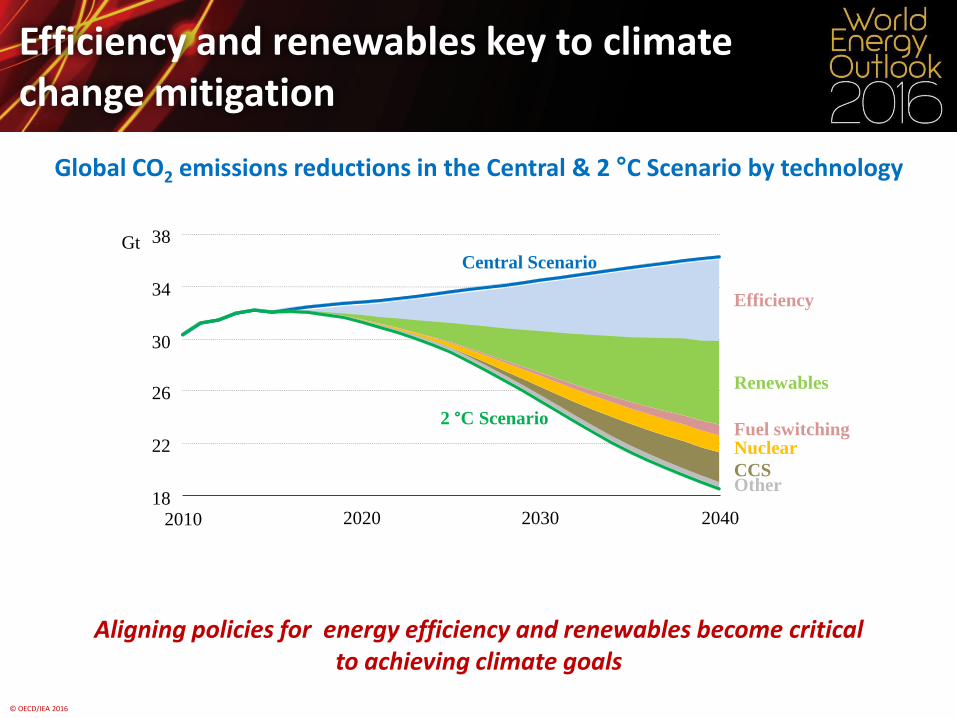
Efficiency and renewables key to climatechange mitigation
Global CO2 emissions reductions in the Central & 2 °C Scenario by technology
Aligning policies for energy efficiency and renewables become critical to achieving climate goals
Gt
18
22
26
30
34
38
2010 2020 2030 2040
Central Scenario
Efficiency
Renewables
CCS
NuclearFuel switching
Other
2 °C Scenario
© OECD/IEA 2016
1 000
2 000
3 000
4 000
TWh
1 500
3 000
4 500
6 000
TWh
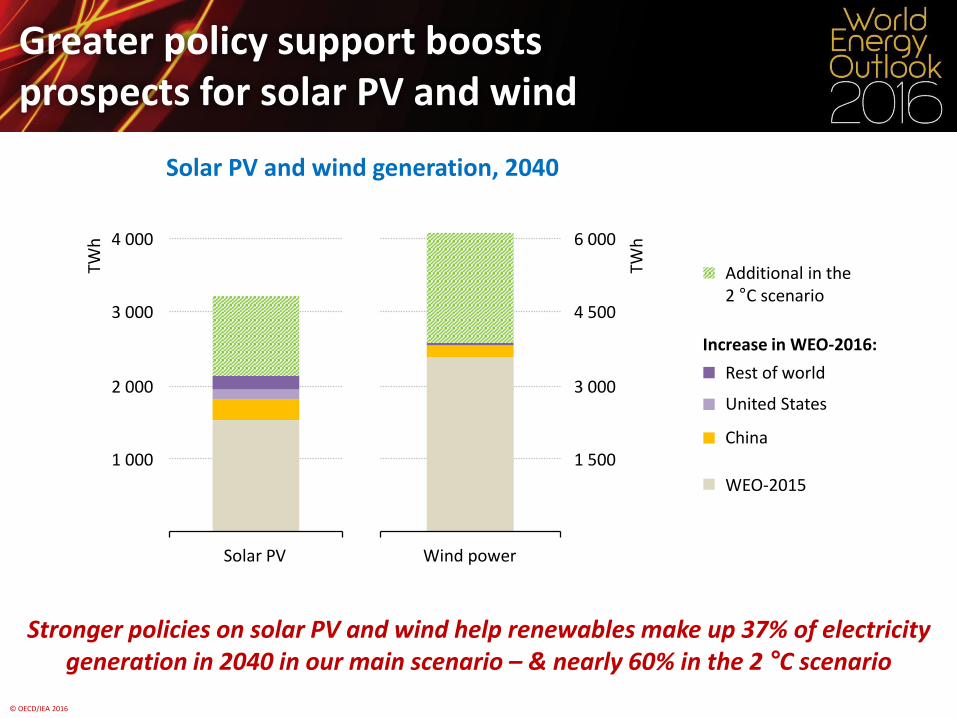
Greater policy support boostsprospects for solar PV and wind
Solar PV and wind generation, 2040
Stronger policies on solar PV and wind help renewables make up 37% of electricity generation in 2040 in our main scenario – & nearly 60% in the 2 °C scenario
Additional in the2 °C scenario
Rest of world
United States
China
WEO-2015
Increase in WEO-2016:
Solar PV Wind power
© OECD/IEA 2016
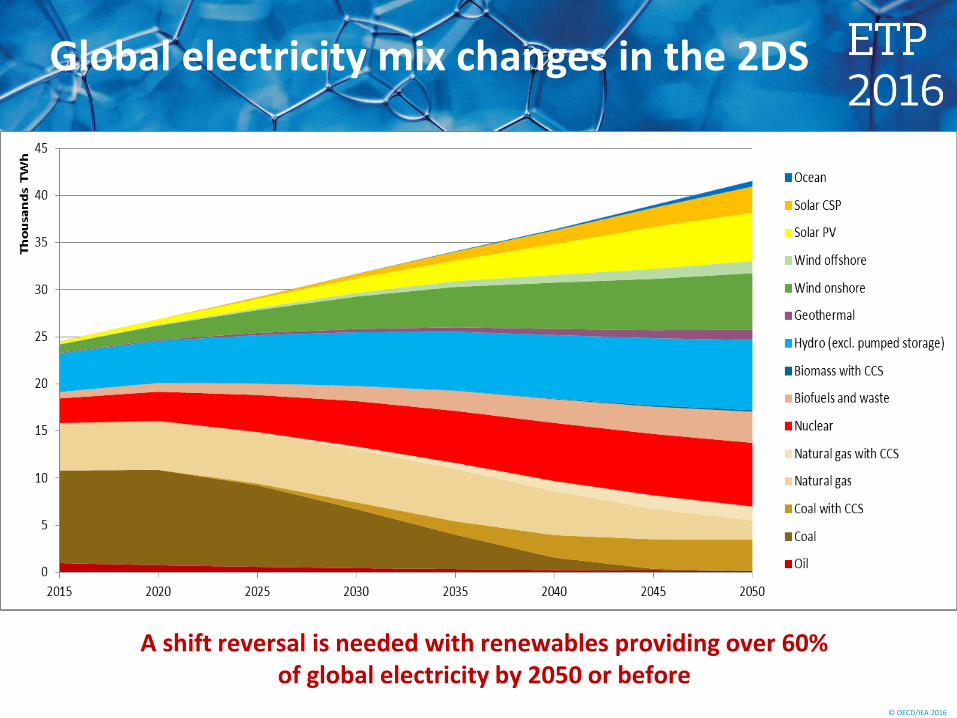
Global electricity mix changes in the 2DS
A shift reversal is needed with renewables providing over 60% of global electricity by 2050 or before
© OECD/IEA 2016
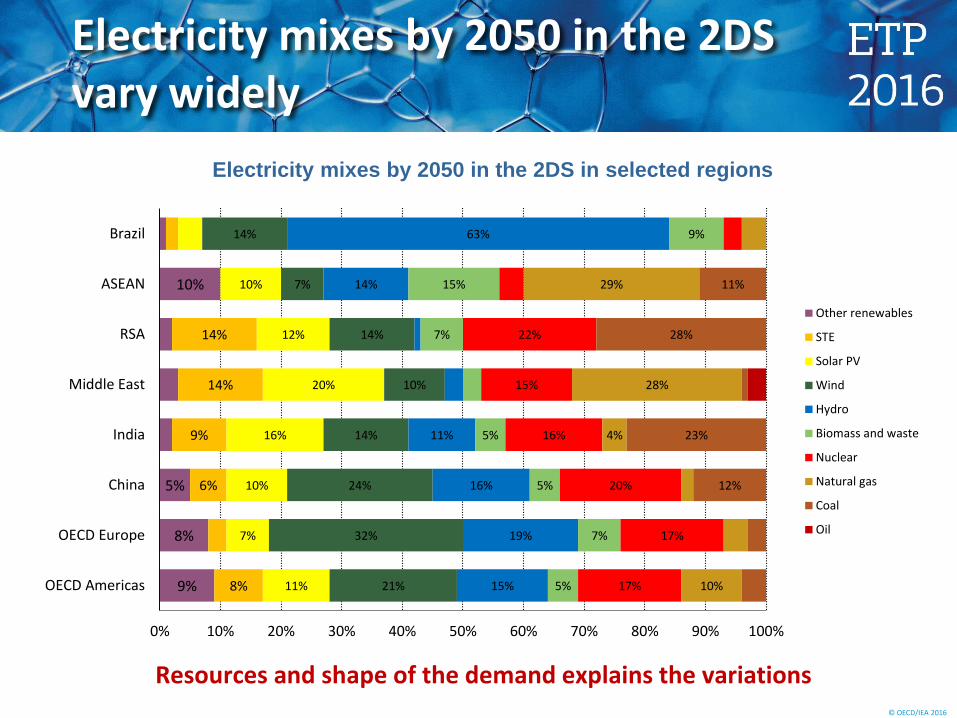
Electricity mixes by 2050 in the 2DS vary widely
Electricity mixes by 2050 in the 2DS in selected regions
9%
8%
5%
10%
8%
6%
9%
14%
14%
11%
7%
10%
16%
20%
12%
10%
21%
32%
24%
14%
10%
14%
7%
14%
15%
19%
16%
11%
14%
63%
5%
7%
5%
5%
7%
15%
9%
17%
17%
20%
16%
15%
22%
10%
4%
28%
29%
12%
23%
28%
11%
0% 10% 20% 30% 40% 50% 60% 70% 80% 90% 100%
OECD Americas
OECD Europe
China
India
Middle East
RSA
ASEAN
Brazil
Other renewables
STE
Solar PV
Wind
Hydro
Biomass and waste
Nuclear
Natural gas
Coal
Oil
Resources and shape of the demand explains the variations
© OECD/IEA 2017 - 6
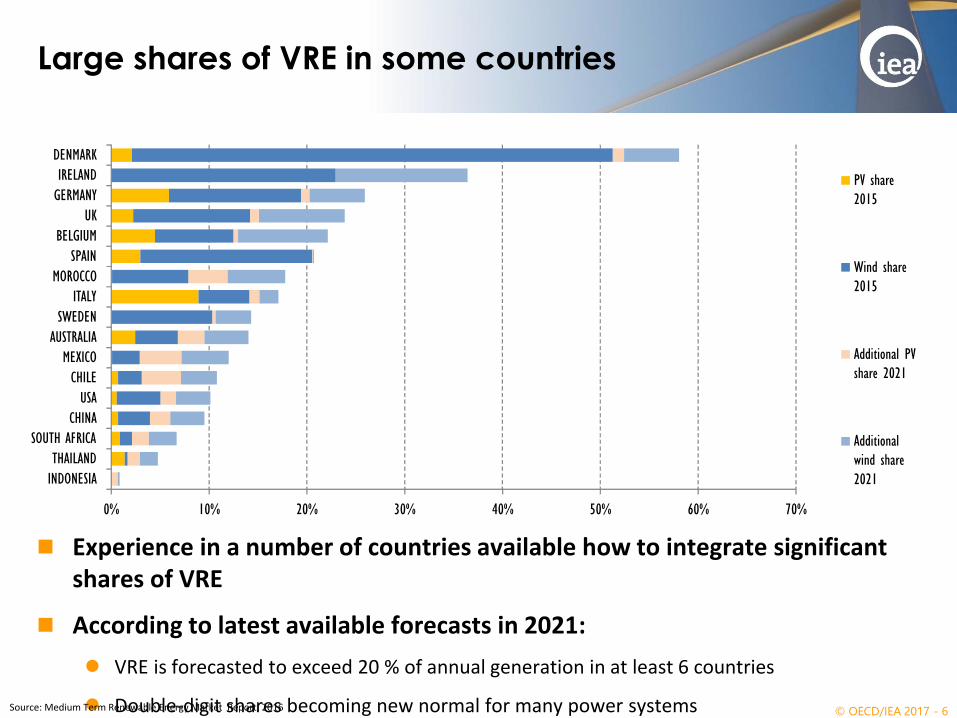
Large shares of VRE in some countries
Experience in a number of countries available how to integrate significant shares of VRE
According to latest available forecasts in 2021:
VRE is forecasted to exceed 20 % of annual generation in at least 6 countries
Double-digit shares becoming new normal for many power systemsSource: Medium Term Renewable Energy Market Report, 2016
0% 10% 20% 30% 40% 50% 60% 70%
INDONESIA
THAILAND
SOUTH AFRICA
CHINA
USA
CHILE
MEXICO
AUSTRALIA
SWEDEN
ITALY
MOROCCO
SPAIN
BELGIUM
UK
GERMANY
IRELAND
DENMARK
PV share
2015
Wind share
2015
Additional PV
share 2021
Additional
wind share
2021
© OECD/IEA 2017 - 7
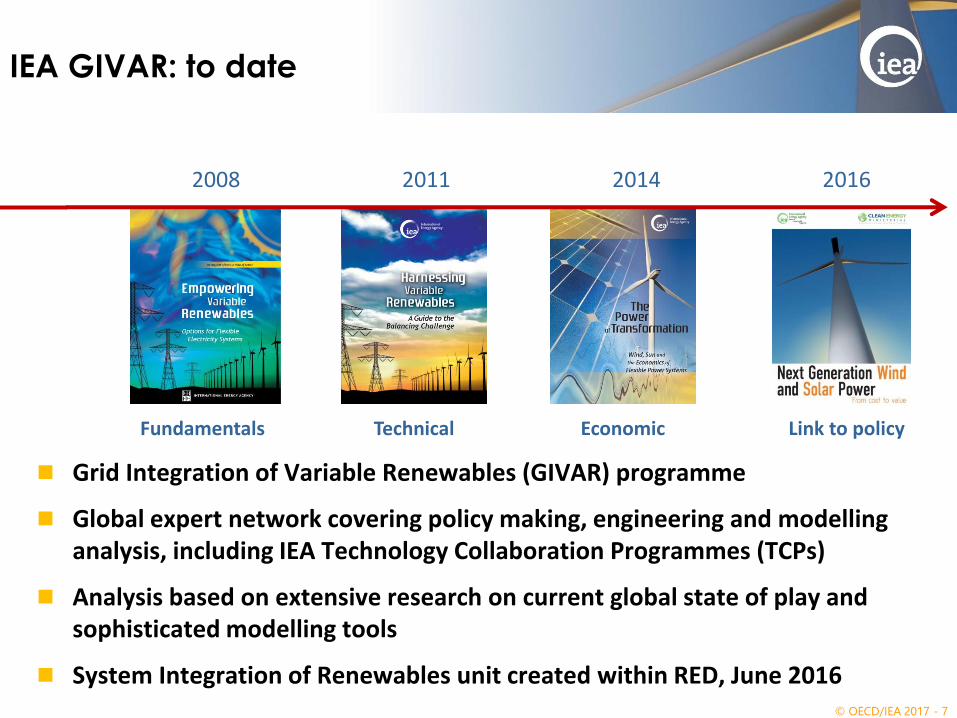
Grid Integration of Variable Renewables (GIVAR) programme
Global expert network covering policy making, engineering and modelling analysis, including IEA Technology Collaboration Programmes (TCPs)
Analysis based on extensive research on current global state of play and sophisticated modelling tools
System Integration of Renewables unit created within RED, June 2016
IEA GIVAR: to date
2008 2011 2014 2016
Fundamentals Technical Economic Link to policy
© OECD/IEA 2017 - 8
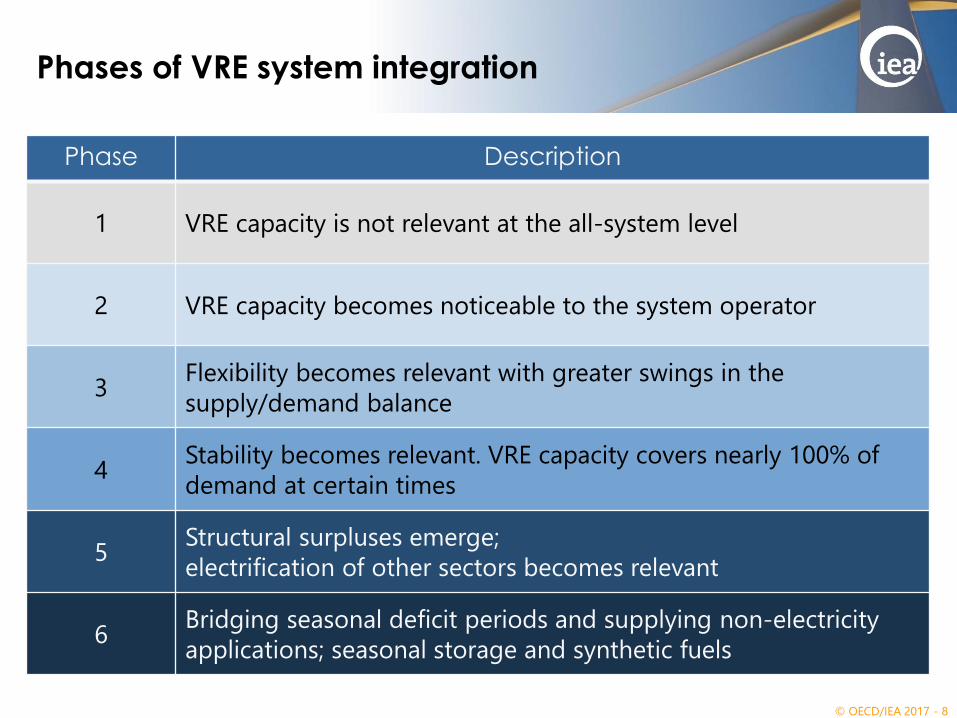
Phases of VRE system integration
Phase Description
1 VRE capacity is not relevant at the all-system level
2 VRE capacity becomes noticeable to the system operator
3Flexibility becomes relevant with greater swings in the
supply/demand balance
4Stability becomes relevant. VRE capacity covers nearly 100% of
demand at certain times
5Structural surpluses emerge;
electrification of other sectors becomes relevant
6Bridging seasonal deficit periods and supplying non-electricity
applications; seasonal storage and synthetic fuels
© OECD/IEA 2016 - 9
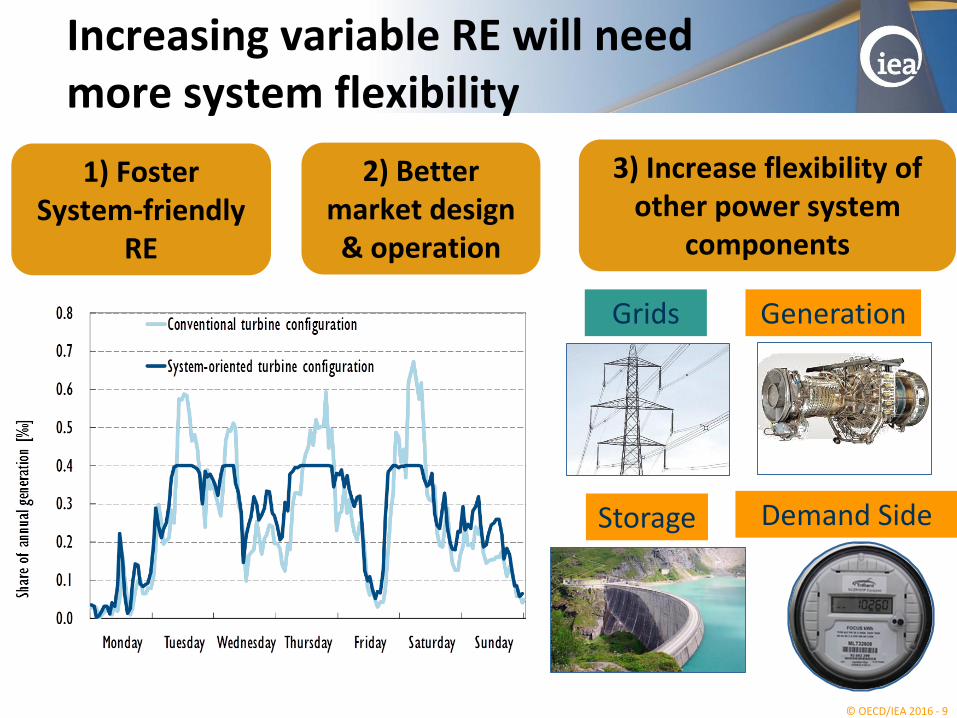
3) Increase flexibility of other power system
components
Grids Generation
Storage Demand Side
1) Foster System-friendly
RE
Increasing variable RE will need more system flexibility
2) Better market design & operation
© OECD/IEA 2017 - 10
Key point
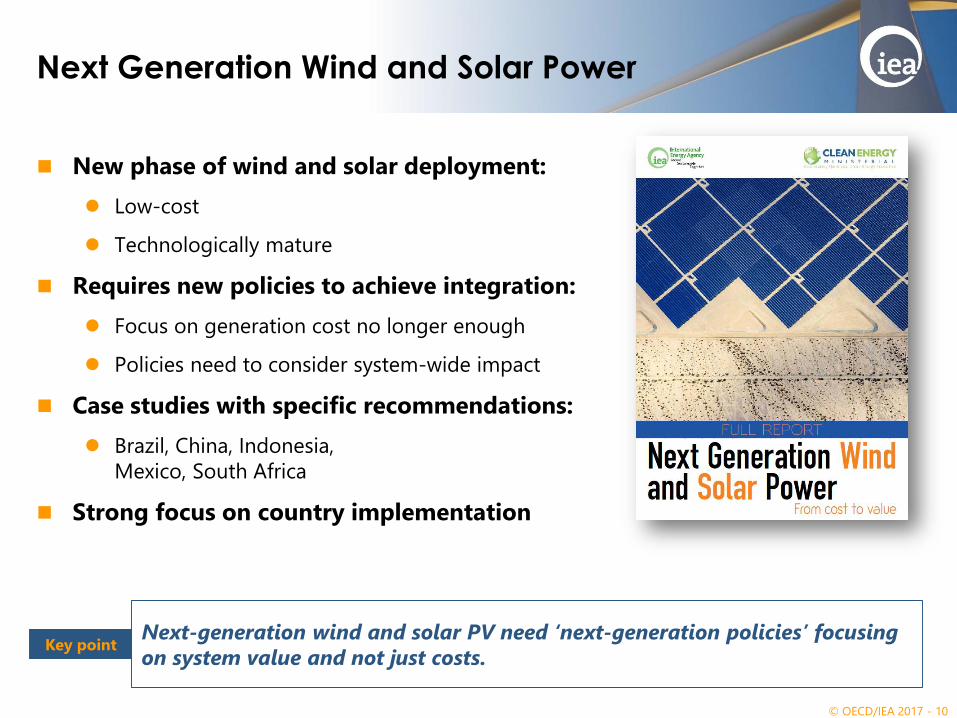
New phase of wind and solar deployment:
Low-cost
Technologically mature
Requires new policies to achieve integration:
Focus on generation cost no longer enough
Policies need to consider system-wide impact
Case studies with specific recommendations:
Brazil, China, Indonesia,
Mexico, South Africa
Strong focus on country implementation
Next-generation wind and solar PV need ‘next-generation policies’ focusing
on system value and not just costs.
Next Generation Wind and Solar Power
© OECD/IEA 2017 - 11
Key point:
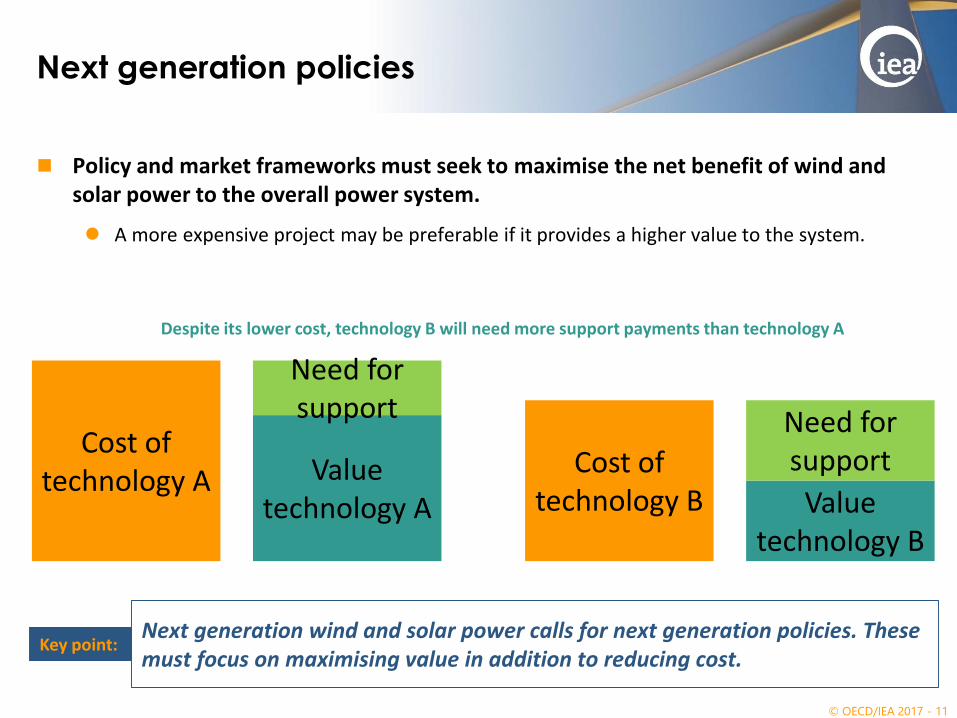
Next generation policies
Policy and market frameworks must seek to maximise the net benefit of wind and solar power to the overall power system.
A more expensive project may be preferable if it provides a higher value to the system.
Next generation wind and solar power calls for next generation policies. These must focus on maximising value in addition to reducing cost.
Despite its lower cost, technology B will need more support payments than technology A
Cost of technology A
Cost of technology B
Value technology A Value
technology B
Need for support Need for
support
© OECD/IEA 2017 - 12
Key point:
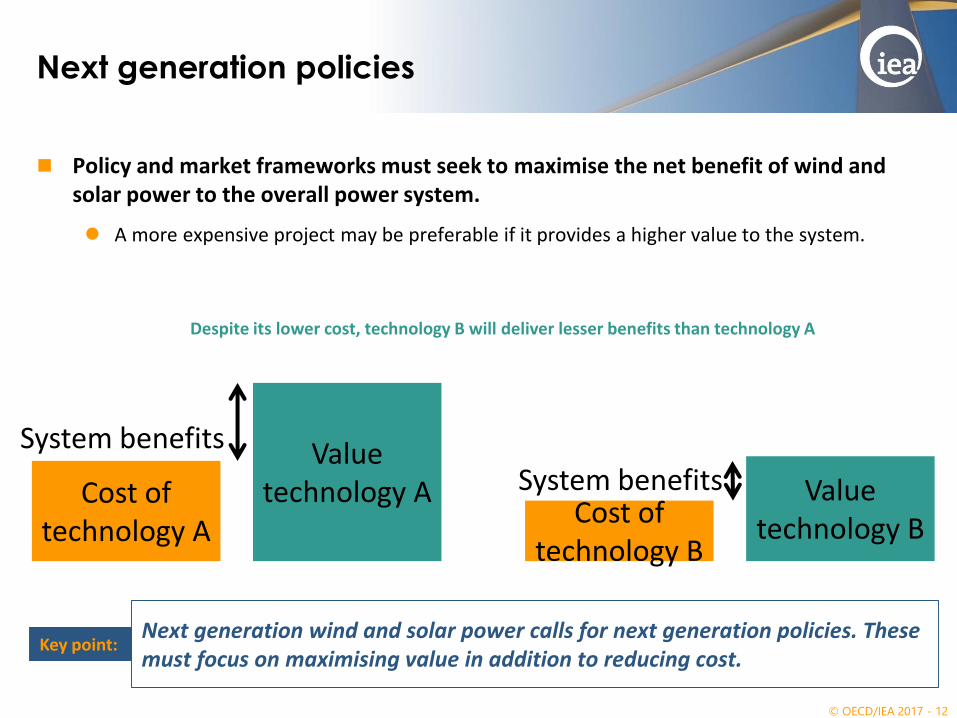
Next generation policies
Policy and market frameworks must seek to maximise the net benefit of wind and solar power to the overall power system.
A more expensive project may be preferable if it provides a higher value to the system.
Next generation wind and solar power calls for next generation policies. These must focus on maximising value in addition to reducing cost.
Despite its lower cost, technology B will deliver lesser benefits than technology A
Cost of technology A
Cost of technology B
Value technology A Value
technology B
System benefits
System benefits

© OECD/IEA 2016 - 13
Modelling study of North-West Europe: Value of onshore wind
Increased rotor size (at the same nameplate capacity) and larger towers makes output less variable
This advanced technology can increase the value of wind power for the system
Value ofclassical turbine
Economic valueUSD/MWh
Value of advanced
turbine
bulk power value ↑
networkcosts ↓
balancing costs ↓
wholesalemarkets
forecast errors grid investment
Higher towersLarger rotors
© OECD/IEA 2016 - 14
Key point:
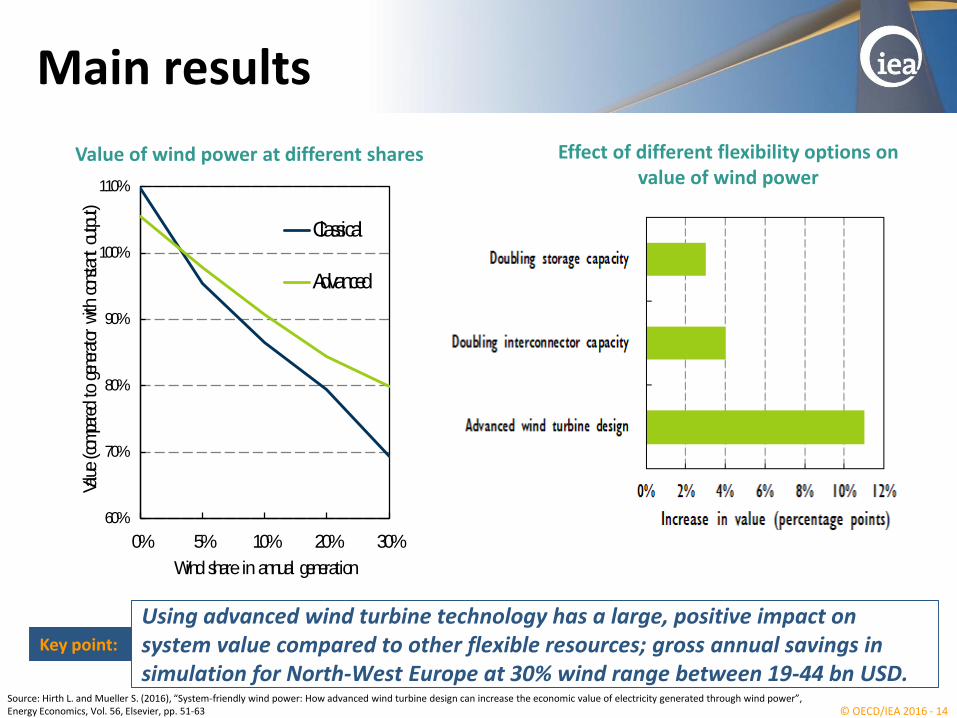
Main results
Using advanced wind turbine technology has a large, positive impact on system value compared to other flexible resources; gross annual savings in simulation for North-West Europe at 30% wind range between 19-44 bn USD.
60%
70%
80%
90%
100%
110%
0% 5% 10% 20% 30%
Value
(com
pare
d to
gen
erat
or w
ith c
onstan
t ou
tput
)
Wind share in annual generation
Classical
Advanced
Value of wind power at different shares
Source: Hirth L. and Mueller S. (2016), “System-friendly wind power: How advanced wind turbine design can increase the economic value of electricity generated through wind power”, Energy Economics, Vol. 56, Elsevier, pp. 51-63
Effect of different flexibility options on value of wind power
© OECD/IEA 2017 - 15
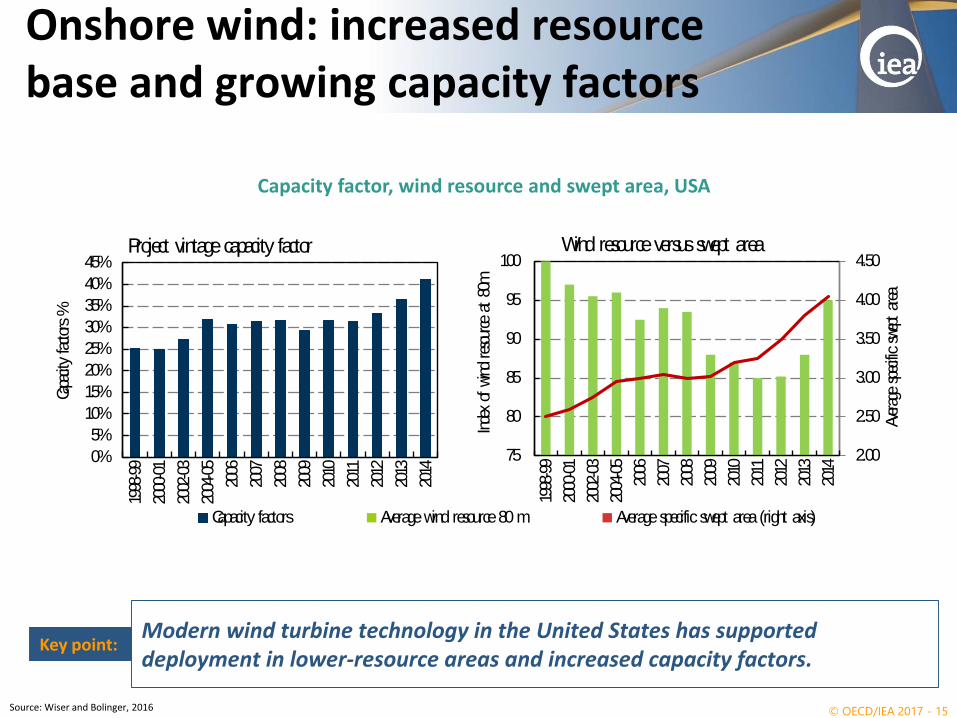
Key point:
Onshore wind: increased resource base and growing capacity factors
Modern wind turbine technology in the United States has supported deployment in lower-resource areas and increased capacity factors.
0%
5%
10%
15%
20%
25%
30%
35%
40%
45%
1998
-99
2000
-01
2002
-03
2004
-05
2006
2007
2008
2009
2010
2011
2012
2013
2014
Capa
city
factor
s %
Project vintage capacity factor
Capacity factors Average wind resource 80 m Average specific swept area (right axis)
2.00
2.50
3.00
3.50
4.00
4.50
75
80
85
90
95
100
1998
-99
2000
-01
2002
-03
2004
-05
2006
2007
2008
2009
2010
2011
2012
2013
2014
Aver
age
spec
ific
swep
t ar
ea
Inde
x of w
ind
reso
urce
at
80m
Wind resource versus swept area
Capacity factor, wind resource and swept area, USA
Source: Wiser and Bolinger, 2016

© OECD/IEA 2017 - 16
PSP: >90% of current on-grid storage
Pumped-hydro plants the reference solution
140 GW in service, 50 GW in development
PSP developed from existing hydro plants
“off-stream” or “pumped-back” schemes
Small energy volumes but large power capacities
Daily/weekly storage does not require large areas
© OECD/IEA, 2011
Source: Inage 2009. © OECD/IEA 2012
© OECD/IEA 2017 - 17
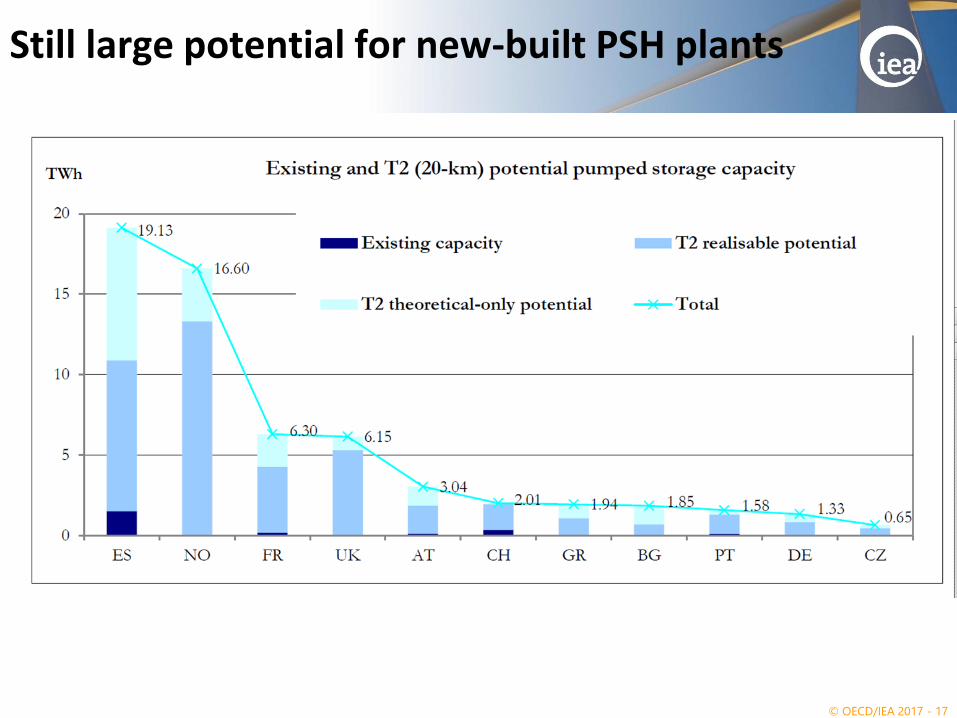
Still large potential for new-built PSH plants
© OECD/IEA 2017 - 18
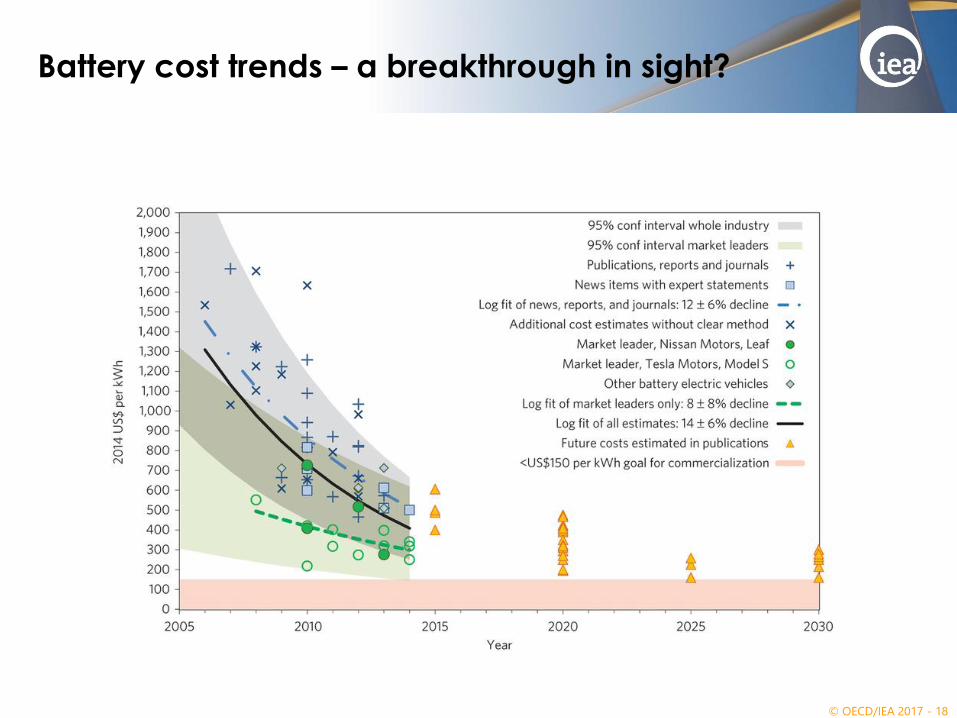
Battery cost trends – a breakthrough in sight?
© OECD/IEA 2017 - 19
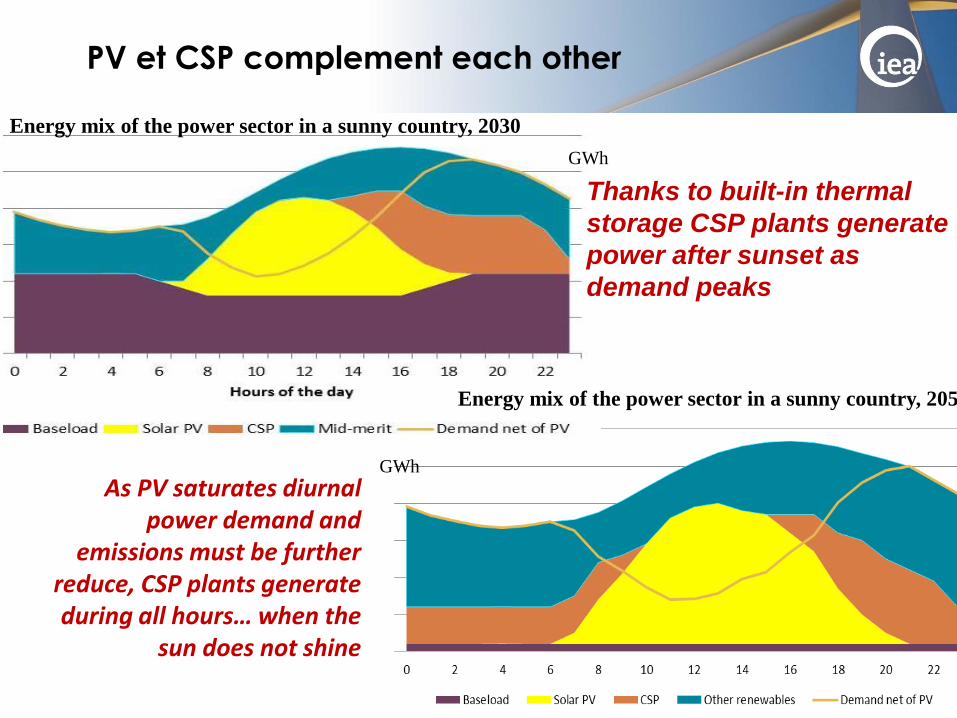
PV et CSP complement each other
©
As PV saturates diurnal power demand and
emissions must be further reduce, CSP plants generate during all hours… when the
sun does not shine
Thanks to built-in thermal
storage CSP plants generate
power after sunset as
demand peaks
Energy mix of the power sector in a sunny country, 2030
GWh
GWh
Energy mix of the power sector in a sunny country, 2050
© OECD/IEA 2017 - 20
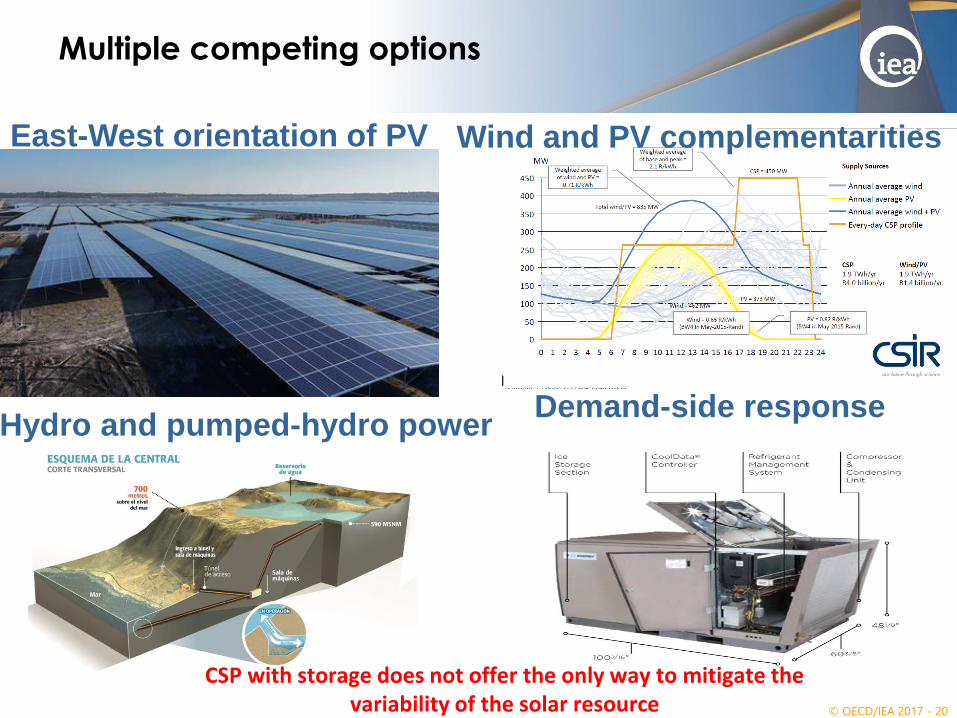
Multiple competing options
Wind and PV complementarities
Hydro and pumped-hydro powerDemand-side response
CSP with storage does not offer the only way to mitigate the variability of the solar resource
East-West orientation of PV
© OECD/IEA 2016
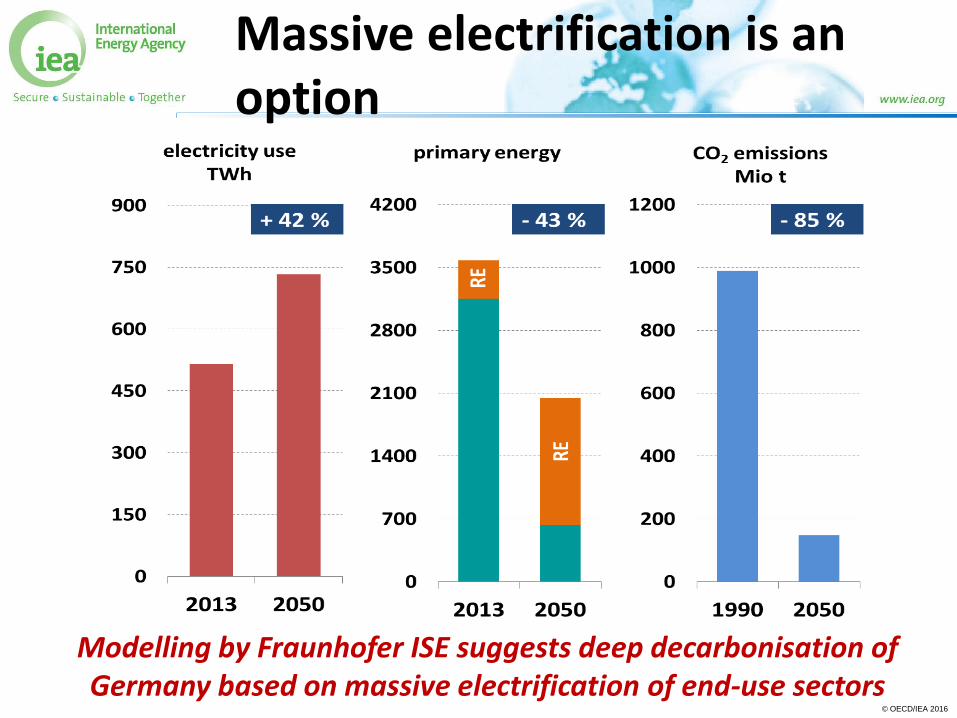
Massive electrification is an option
Modelling by Fraunhofer ISE suggests deep decarbonisation of Germany based on massive electrification of end-use sectors
© OECD/IEA 2016
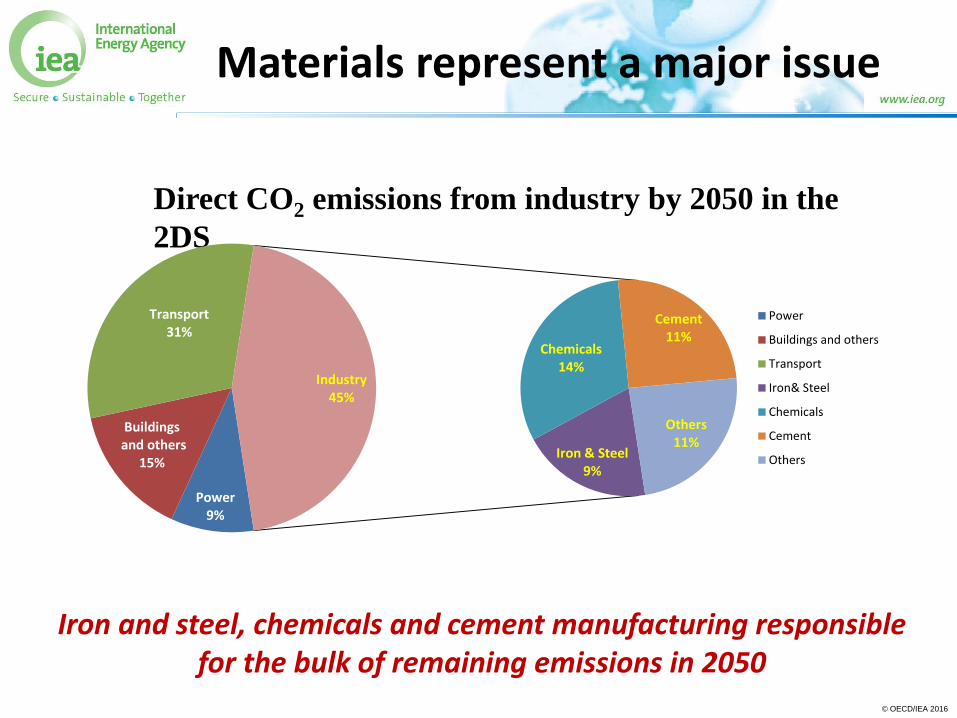
Materials represent a major issue
36%
20%
29%
30% 31%Iron and steel, chemicals and cement manufacturing responsiblefor the bulk of remaining emissions in 2050
Direct CO2 emissions from industry by 2050 in the
2DS
Power9%
Buildingsand others
15%
Transport31%
Iron & Steel9%
Chemicals14%
Cement11%
Others11%
Industry45%
Power
Buildings and others
Transport
Iron& Steel
Chemicals
Cement
Others
© OECD/IEA 2016
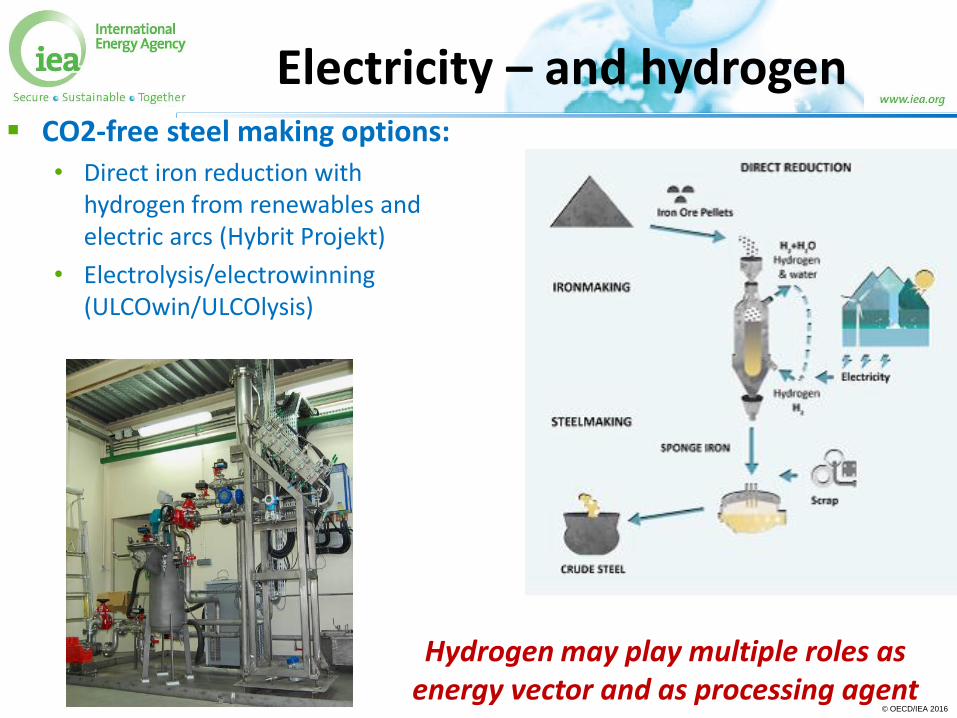
Electricity – and hydrogen CO2-free steel making options:
• Direct iron reduction withhydrogen from renewables and electric arcs (Hybrit Projekt)
• Electrolysis/electrowinning(ULCOwin/ULCOlysis)
Hydrogen may play multiple roles as energy vector and as processing agent
© OECD/IEA 2016
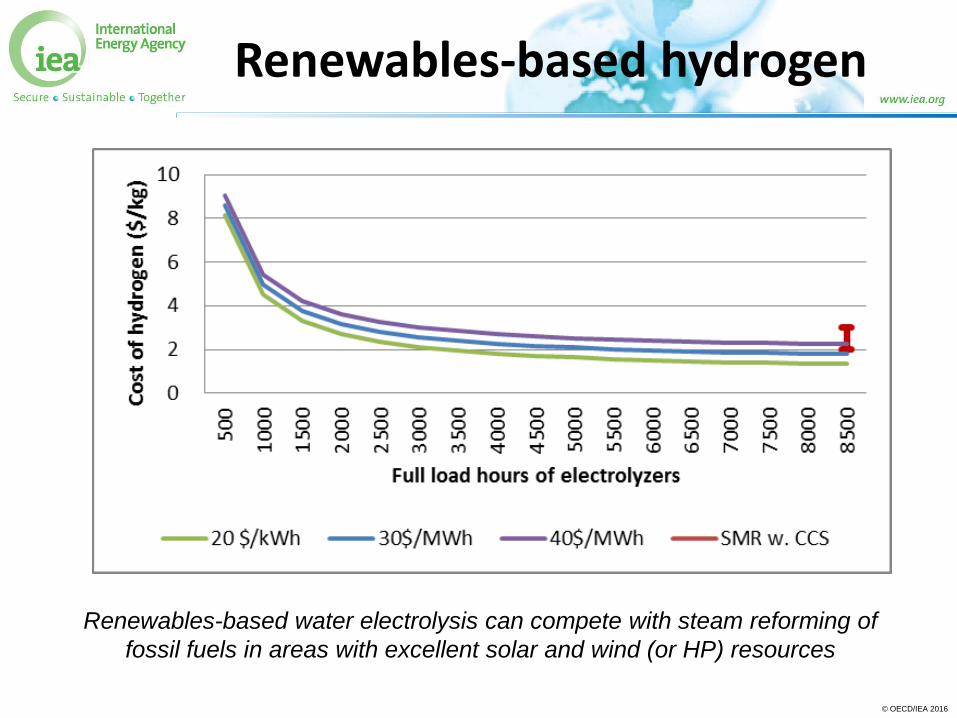
Renewables-based hydrogen
Renewables-based water electrolysis can compete with steam reforming of
fossil fuels in areas with excellent solar and wind (or HP) resources
© OECD/IEA 2016
© OECD/IEA 2016
Ammonia, the other hydrogen
60 Mt H2 is produced annually for industrialuses; half is for ammonia, input to fertilizers
Current hydrogen production is 95% from NG or coal; manufacturing 1 t H2 emits 10 t CO2!
Clean hydrogen requires CCS or renewables-based electrolysis
Clean ammonia, however, could serve as an energy carrier and store, and be directed to some end-use applications, e.g. balancingpower plants
© OECD/IEA 2016
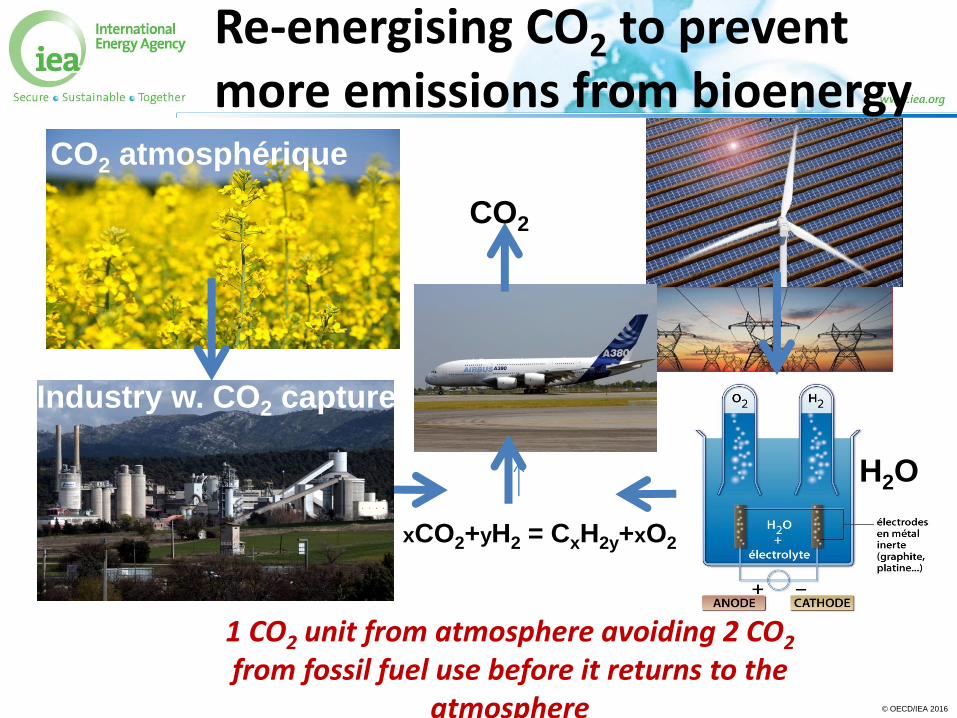
1 CO2 unit from atmosphere avoiding 2 CO2
from fossil fuel use before it returns to the atmosphere
CO2 atmosphérique
xCO2+yH2 = CxH2y+xO2
Industry w. CO2 capture
CO2
H2O
Re-energising CO2 to preventmore emissions from bioenergy