Embed Size (px)
Citation preview
DM 13379287
System Management allowable revenue and forecast capital expenditure information
1 July 2016 – 30 June 2019
February 2016
Allowable Revenue Information for 1 July 2016 to 30 June 2019
DM 13379287 Page 2
Contents
Executive Summary ............................................................................................................................ 5 System Management AR4 proposal approach ........................................................................... 5 Changes to the process for AR4 ................................................................................................. 6 Alterations to the AR4 determination........................................................................................ 7 Investment Proposal ................................................................................................................. 7 Improving systems and processes ............................................................................................. 8 Expected cost ............................................................................................................................ 9 Forecast operating expenditure ................................................................................................ 9 Forecast capital expenditure ..................................................................................................... 9 Return on investment ............................................................................................................. 10 Market Fees ............................................................................................................................ 10 Conclusion .............................................................................................................................. 10 PART A: BACKGROUND AND CONTEXT .................................................................................... 12
1 Introduction ........................................................................................................................... 13 Submission structure .............................................................................................................. 13
1.1.1 Explanatory notes ................................................................................. 13
2 Overview of System Management ......................................................................................... 14 System Management in the context of Western Power ........................................................... 14 System Management’s services and responsibilities ................................................................ 15 System Management Non Trading Participant......................................................................... 16 The Electricity Market Review – Phase I and Phase II ............................................................... 16 System Management in the context of Western Power (expected future state) ...................... 17 Amendments to the AR4 determination .................................................................................. 18
3 Submission preparation approach.......................................................................................... 19 Market Rules compliance ........................................................................................................ 19
3.1.1 Specific guidelines within the Market Rules .......................................... 19 3.1.2 How these guidelines have been addressed .......................................... 19
Engagement with Stakeholders ............................................................................................... 20
4 Performance and expenditure during the AR3 period ............................................................ 21 Key messages .......................................................................................................................... 21 Operational performance during AR3 ...................................................................................... 21
4.1.1 System frequency management ........................................................... 21 4.1.2 Dispatch performance .......................................................................... 21 4.1.3 Outage scheduling ................................................................................ 22 4.1.4 Compliance and Rule changes .............................................................. 22
SMARTS delivery performance ................................................................................................ 22 Expenditure during AR3 .......................................................................................................... 23
4.2.1 Capital investment................................................................................ 25 4.2.1.1 Consolidating the new market ..................................... 27 4.2.1.2 Improving internal systems and processes ................... 27 4.2.1.3 Supporting Market Development ................................. 28
4.2.2 Operating expenditure ......................................................................... 29 4.2.2.1 Electricity Market Review............................................. 30 4.2.2.2 Labour ......................................................................... 30 4.2.2.3 Functional costs ........................................................... 30 4.2.2.4 Legal costs ................................................................... 30 4.2.2.5 Business support costs, IT operating costs and insurance30 4.2.2.6 Operating expenditure to support capital expenditure . 30
Allowable Revenue Information for 1 July 2016 to 30 June 2019
DM 13379287 Page 3
PART B: EXPENDITURE PROPOSAL ................................................................................................... 32
5 Business drivers and investment objectives ........................................................................... 33 Key messages .......................................................................................................................... 33 System Management key drivers and benefits ........................................................................ 33
5.1.1 Enhancements to the Wholesale Electricity Market .............................. 33 5.1.2 Supporting effective and accountable system operations ..................... 34
Investment objectives ............................................................................................................. 34 Investment governance........................................................................................................... 34
6 Operating expenditure ........................................................................................................... 36 Key messages .......................................................................................................................... 36 Forecasting methods ............................................................................................................... 36
6.1.1 Efficient base year ................................................................................ 36 6.1.2 Recurrent costs .................................................................................... 37 6.1.3 Non-recurrent costs.............................................................................. 37 6.1.4 Cost adjustments (step changes) .......................................................... 37
6.1.4.1 Labour costs ................................................................ 38 6.1.4.2 IT Support .................................................................... 38
Ensuring compliance with Market Rule obligations ................................................................. 39 Error rate reduction, improved service to Market Participants and realising efficiencies ......... 39
6.1.5 Cost Escalators ..................................................................................... 39 6.1.5.1 Market price of labour ................................................. 39 6.1.5.2 Consumer Price Index (CPI) .......................................... 40
Operating expenditure forecast .............................................................................................. 40
7 Capital expenditure ................................................................................................................ 42 Key messages .......................................................................................................................... 42 Overview of the investment proposal...................................................................................... 42
7.1.1 Improving internal processes and systems ............................................ 43 7.1.1.1 Security enhancements ................................................ 43 7.1.1.2 Dispatch Training Stimulator enhancements ................ 43 7.1.1.3 Test environment enhancements ................................. 43
7.1.2 IT upgrades and asset replacement ...................................................... 44 7.1.2.1 SMARTS asset replacement .......................................... 44 7.1.2.2 System Operating Command and Control Centre User
Interface enhancement ................................................ 44 Forecasting methodology ........................................................................................................ 44
7.1.3 Determining the expected AR4 capital works ........................................ 45 7.1.4 Estimating the cost of AR4 capital works .............................................. 45
PART C: ALLOWABLE REVENUE ........................................................................................................ 46
8 Method for calculating revenue ............................................................................................. 47 Key messages .......................................................................................................................... 47 Use of ‘building block’ method ................................................................................................ 47 Revenue modelling ................................................................................................................. 48 Tax cost estimate .................................................................................................................... 48
9 Capital base ............................................................................................................................ 49 Key messages .......................................................................................................................... 49 Establishing the opening and closing capital base .................................................................... 49 Capital base value over AR4 .................................................................................................... 50
9.1.1 Depreciation over AR4 .......................................................................... 51 9.1.2 Asset disposals over AR4 ...................................................................... 51
Treatment of depreciation in establishing the opening capital base for AR5 ............................ 51
Allowable Revenue Information for 1 July 2016 to 30 June 2019
DM 13379287 Page 4
10 Return on investment ............................................................................................................ 52 Key messages .......................................................................................................................... 52 Why is a WACC appropriate for System Management ............................................................. 52
11 Allowable revenue ................................................................................................................. 53 Key messages .......................................................................................................................... 53 Allowable revenue .................................................................................................................. 53 Forecast average price path .................................................................................................... 53
12 Annual Budget Proposal ......................................................................................................... 55 Key messages .......................................................................................................................... 55 Budget proposal content ......................................................................................................... 55 Adjustments to annual allowable revenue .............................................................................. 55 Reassessment of the Allowable Revenue................................................................................. 56
Allowable Revenue Information Document Index ........................................................................... 57
List of Figures 58
List of Tables ................................................................................................................................ 59
Glossary ................................................................................................................................ 60
Appendix A. WEM Objectives ...................................................................................................... 62
Appendix B. System Management Segregation Procedure .......................................................... 63
Appendix C. System Management Business unit ......................................................................... 65
Appendix D. System Management Division (prior to restructure) ............................................... 66
Appendix E. Network planning & operations business unit (post restructure) ............................ 67
Appendix F. Portfolio Governance Framework............................................................................ 68
Allowable Revenue Information for 1 July 2016 to 30 June 2019
DM 13379287 Page 5
Executive Summary This document outlines System Management’s allowable revenue proposal for the fourth review (AR4) period, which covers 1 July 2016 to 30 June 2019. It provides the context, rationale and justification for System Management’s AR4 proposal, and should be read in conjunction with the associated allowable revenue application document,1 which provides summary financial information.
System Management is a segregated business unit within Western Power responsible for managing the operation of the South West Interconnected System (SWIS). System Management’s primary responsibilities are to:
• Operate the SWIS in a secure and reliable manner. This requires System Management to ensure that electricity demand and supply are in balance for 99.9% of the time.
• Support the operation of the Wholesale Electricity Market (WEM). System Management must comply with its obligations under the Wholesale Electricity Market Rules (Market Rules or Rules). These obligations include (but are not limited to) System Management’s demand forecasting function, generator dispatch function, and responsibilities in providing information to the Independent Market Operator (IMO)/ Australian Energy Market Operator (AEMO).
The Market Rules required System Management to submit its AR4 proposal to the Economic Regulation Authority of Western Australia (ERA) by 30 November 2015. In late November 2015 an extension of the submission date, until 29 February 2016, was granted (Market Rules clause 1.14.3).2
System Management AR4 proposal approach On 30 September 2015, the Western Australian Minister for Energy (Minister) announced the transfer of System Management and the operation of the WEM to AEMO. The transfer is intended to improve the coordination of system management functions with the commercial outcomes of the WEM. System Management’s forecast revenue requirements for the AR4 period is $45.702 million. System Management recognises that there is an increase of 15.98% in revenue compared to the AR3 determination ($39.405 million) and has carefully considered its approach to preparing the AR4 proposal given the current market environment and the proposed outcomes of the Electricity Market Review (EMR).
The key factor shaping System Management's forecast operating costs is the transfer of system operation functions to AEMO. While the transfer to AEMO will result in efficiencies and better coordination between the financial and operational aspects of the WEM, the removal of the function from Western Power will sever existing resourcing synergies and efficiencies. There will be a need for additional resourcing requirements (step changes) over current levels to ensure that there is sufficient capability and capacity for the system operator function to perform independently of Western Power, and to improve compliance with WEM Rule obligations and mitigate existing operational risks. The total operational expenditure requirement for AR4 period is $37.311 million, which has been derived by rolling over the actual 2014/15 operating expenditure and applying step changes to accommodate additional resourcing requirements.
1 System Management allowable revenue and forecast capital expenditure application DM13382091. 2 The Public Utilities Office proposed a Rule change that allowed System Management an extension of the submission date until 29 February 2016. This was approved by the Western Australian Minister for Energy on 27 November 2015.
Allowable Revenue Information for 1 July 2016 to 30 June 2019
DM 13379287 Page 6
During AR3, System Management deferred capital expenditure as a result of the reprioritisation of projects due to the EMR. For the AR4 period, System Management is proposing capital projects targeted at improving systems and processes and mitigating operational risks. This includes projects to address IT security risks, enhance the Dispatch Training Simulator (DTS) and test environment. Hardware replacement and upgrades are also proposed to replace the existing System Management Automated Real Time System (SMARTS) asset at the end of its useful life and enhance the dispatch engine user interface (System Operating Command and Control Centre User Interface (SOCCUI)). System Management’s forecast capital expenditure is $6.631 million for the AR4 period.
In addition to the transfer of System Management to AEMO, there are several other programs of work under EMR that will impact on system operations. These programs are at various stages and there is no certainty as to the level of operational and/or capital expenditure required. Any additional funding requirements will be addressed through Declared Market Projects or by seeking a reassessment of the AR4 proposal.
Changes to the process for AR4 The decision to transfer the system management functions to AEMO was a variation of the initial proposal to merge System Management with the IMO under Phase II of the EMR,3 in order to “improve the coordination of System Management (including generator dispatch) with the commercial outcomes of the Wholesale Electricity Market”.
The change in ownership structure has altered the future costs (and consequently revenue requirements) of System Management. Therefore, this AR4 proposal reflects the long term efficiencies that can be achieved whilst balancing security and cost efficiency, and delivering the intended economic outcomes.
The following working assumptions have been applied in the preparation of the AR4 proposal:
• Forecasts of recurrent expenditure reflect a ‘rollover’ position and are based on the actual expenditure from the 2014/15 financial year
• Forecast for step changes in operational expenditure include resourcing based on Full Time Equivalent (FTE) requirements for the AR4 period
• Forecasts of capital expenditure include projects required for System Management to support reliable operation of the SWIS and the WEM. In addition, capital expenditure includes IT system enhancements and asset replacement required during the AR4 period
• System Management will be transferring to AEMO during the AR4 period
• System Management operations will be managed by AEMO by the end of 2016
• All System Management IT systems will be separated from Western Power systems and will function entirely under AEMO by the end of 2018
• System Management anticipate synergies (once the transfer to AEMO has occurred), which will be realised in years 2 and 3 of the AR4 period thus reducing its operational expenditure requirements.
System Management intends to consult with the relevant stakeholders (i.e. AEMO, the Public Utilities Office (PUO) and the ERA) as to the appropriate mechanisms (including Declared Market Projects) for approval/recovery of funding required to facilitate the State Government’s reform program upon receiving greater clarity over the timeframe and nature of EMR outcomes.
3 The rationale behind the initially proposed change can be found on the Department of Finance’s website: https://www.finance.wa.gov.au/cms/Public_Utilities_Office/Electricity_Market_Review/Institutional_Arrangements.aspx
Allowable Revenue Information for 1 July 2016 to 30 June 2019
DM 13379287 Page 7
Alterations to the AR4 determination Once the ERA has made an Allowable Revenue determination, System Management’s actual expenditure is trued-up through the annual budget submission to AEMO (formally IMO).4 The annual budget proposal includes adjustments to the allowable revenue to compensate System Management for differences between actual expenditure and forecast expenditure, and actual revenue and allowable revenue. Under clause 2.22A.12 of the Market Rules, AEMO may also declare a project to be a Declared Market Project if:
a) “the project involves:
i. a major change to the functions of AEMO or System Management under these Market Rules (including the transfer of System Management to AEMO); or
ii. a major change to any of the computer software or systems that AEMO or System Management uses in the performance of any of its functions under these Market Rules; and
b) AEMO estimates that, for either AEMO or System Management the sum of:
i. the recurring expenditure associated with the change; and
ii. the capital expenditure required to implement the change,
would be greater than the sum of Allowable Revenue determined and Forecast Capital Expenditure approved by the ERA for the current Review Period by more than 10%.”
Additionally, System Management will seek reassessment of the AR4 proposal if it is likely that the revenue recovered over the AR4 period will be 15% or greater than the approved revenue or, if there is a significant unforeseen event (see Market Rules clause 2.23.8).
Investment Proposal The investment proposal for AR4 takes into consideration the uncertainty surrounding the future EMR outcomes and the transition of System Management to AEMO. Despite the market uncertainty, System Management has identified five key investment objectives over the AR4 period:
• Meeting stakeholders’ requirements for performance and value – to meet market objectives during AR4 so that the services required by Market Participants are provided at the lowest cost
• Compliance – to enable System Management and stakeholders (i.e. IMO and AEMO) to achieve compliance with the Market Rules and operating procedures
• Supporting market enhancements – to invest efficiently to support changes to the Market Rules and act as a partner in the development of the market
• Improving process efficiency – to invest efficiently to improve processes and systems that will lead to a lower cost of service for Market Participants over time
• Updating IT systems – to invest and update depreciated IT assets during the AR4 period.
During the AR4 period, System Management will continue to provide the following system operation services efficiently and in compliance with the Market Rules:
• Consolidate support for the market – by ensuring System Management has adequate resourcing to support business as usual (BAU) activities after the transfer to AEMO and enhancing SMARTS to provide greater security and reliability.
4 The transition of IMO to AEMO occurred on 1 December 2015.
Allowable Revenue Information for 1 July 2016 to 30 June 2019
DM 13379287 Page 8
• Improve specific systems and processes – through targeted initiatives aimed at improving security and governance, improving efficiencies, and reducing risks in key information systems.
• Support the development of the market and EMR outcomes – by being responsive to further enhancements planned by the EMR for the AR4 period.
• Provide efficient operational services – in compliance with the Market Rules.
The total forecast revenue required to deliver the above objectives is $45.702 million5, inclusive of $37.311 million operational expenditure and $6.631 million capital expenditure.
Improving systems and processes During the AR4 period System Management will spend $37.311 million in operating costs and invest $6.631 million of capital to enable it to maintain and improve its security and governance, improve efficiencies and reduce risks relating to key information systems. Capital investments during the AR4 period will target:
• Current systems that require significant upgrades to meet System Management accountabilities
• Systems requiring replacement due to full depreciation of assets
Operating expenditure for improving System Management systems and processes, supporting development of the market and continue providing efficient services includes the following:6
• $4.695 million – to provide support for real time and system operator functions including the implementation and operation of a Security Desk
• $0.690 million – to cover assessment of network outages that have a system security impact and to enable leave coverage for existing System Management planning engineers
• $0.281 million – for the management of IT systems, contracts and support arrangements
• $0.604 million – to provide succession planning for senior engineers at System Management
• $0.735 million – to provide coordination of training and development for System Management personnel primarily in relation to the DTS. This also includes additional operational expenditure costs associated with the technical support required for the DTS system
• $0.155 million – to provide support for System Management functions and day-to-day operations including administration, coordination and document management
• $0.180 million – to provide technical writing support for maintaining, managing and updating the Power System Operating Procedures (PSOP) for System Management’s operations and control room.
Capital expenditure for IT systems, security and asset replacement comprises of the following projects:
• $0.623 million – for SOCCUI life extension and enhancement, which will provide a more robust and adaptable system to meet market dispatch obligations in the long term
• $1.972 million – in security enhancements relating to SMARTS
• $0.851 million – in SMARTS hardware replacement as the original system was purchased and installed in 2012 as part of the Market Evolution Project (MEP). The SMARTS asset has a
5 Total revenue amount is made up of operating expenditure, depreciation costs, borrowing costs and tax payable. 6 Figures used for AR4 forecast expenditure are in nominal terms. Operational expenditure figures are based on the AR4 System Management Resourcing Business Case.
Allowable Revenue Information for 1 July 2016 to 30 June 2019
DM 13379287 Page 9
useful life of 5 years as outlined by the ERA in its AR3 determination. To mitigate risks associated with relying on critical hardware beyond its useful life, SMART requires asset replacement during the AR4 period
• $1.340 million – in DTS enhancements. This upgrade will allow System Management to provide an enhanced DTS training platform for several activities that are essential to the development of control room personnel and for maintaining security of the SWIS
• $1.845 million – in enhancements to the test environment. This project will create a fully functioning test environment that replicates the existing production environment with updates to test data in real time.
By making the above investments System Management will be able to continue BAU operations, improve IT functions, reduce operational risks and continue to operate in accordance with Market Rules. While System Management is aware of the increase in capital investments in the AR4 compared to the AR3 period, this difference is a result of the EMR reform, which saw the deferral and cancellation of planned capital expenditure during the AR3 period, and the merger with AEMO.
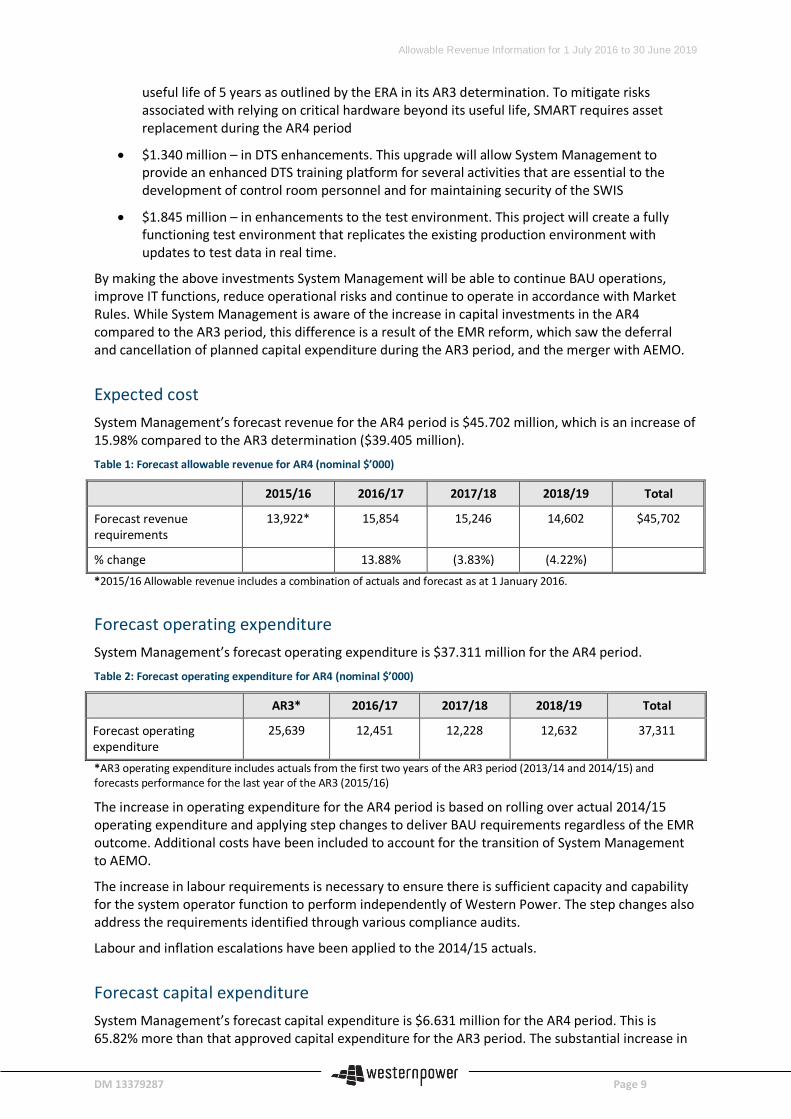
Expected cost System Management’s forecast revenue for the AR4 period is $45.702 million, which is an increase of 15.98% compared to the AR3 determination ($39.405 million).
Table 1: Forecast allowable revenue for AR4 (nominal $’000)
2015/16 2016/17 2017/18 2018/19 Total
Forecast revenue requirements
13,922* 15,854 15,246 14,602 $45,702
% change 13.88% (3.83%) (4.22%) *2015/16 Allowable revenue includes a combination of actuals and forecast as at 1 January 2016.
Forecast operating expenditure System Management’s forecast operating expenditure is $37.311 million for the AR4 period.
Table 2: Forecast operating expenditure for AR4 (nominal $’000)
AR3* 2016/17 2017/18 2018/19 Total
Forecast operating expenditure
25,639 12,451 12,228 12,632 37,311
*AR3 operating expenditure includes actuals from the first two years of the AR3 period (2013/14 and 2014/15) and forecasts performance for the last year of the AR3 (2015/16)
The increase in operating expenditure for the AR4 period is based on rolling over actual 2014/15 operating expenditure and applying step changes to deliver BAU requirements regardless of the EMR outcome. Additional costs have been included to account for the transition of System Management to AEMO.
The increase in labour requirements is necessary to ensure there is sufficient capacity and capability for the system operator function to perform independently of Western Power. The step changes also address the requirements identified through various compliance audits.
Labour and inflation escalations have been applied to the 2014/15 actuals.
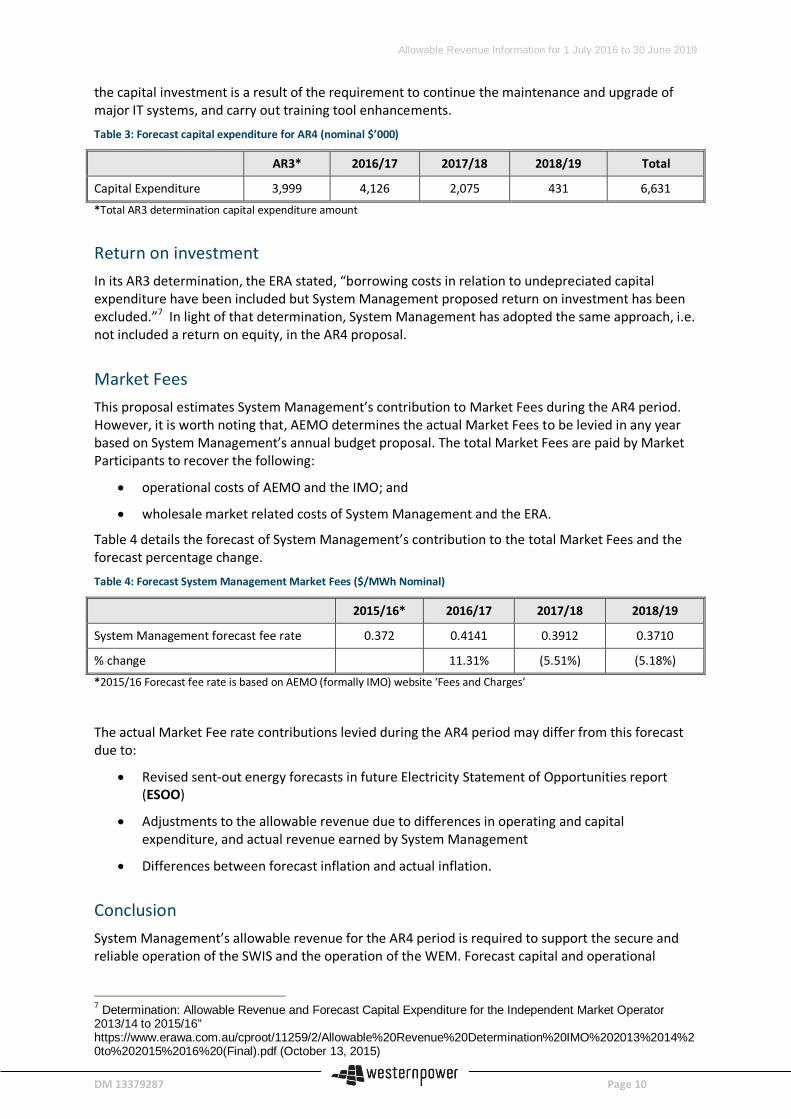
Forecast capital expenditure System Management’s forecast capital expenditure is $6.631 million for the AR4 period. This is 65.82% more than that approved capital expenditure for the AR3 period. The substantial increase in
Allowable Revenue Information for 1 July 2016 to 30 June 2019
DM 13379287 Page 10
the capital investment is a result of the requirement to continue the maintenance and upgrade of major IT systems, and carry out training tool enhancements.
Table 3: Forecast capital expenditure for AR4 (nominal $’000)
AR3* 2016/17 2017/18 2018/19 Total
Capital Expenditure 3,999 4,126 2,075 431 6,631 *Total AR3 determination capital expenditure amount
Return on investment In its AR3 determination, the ERA stated, “borrowing costs in relation to undepreciated capital expenditure have been included but System Management proposed return on investment has been excluded.”7 In light of that determination, System Management has adopted the same approach, i.e. not included a return on equity, in the AR4 proposal.
Market Fees This proposal estimates System Management’s contribution to Market Fees during the AR4 period. However, it is worth noting that, AEMO determines the actual Market Fees to be levied in any year based on System Management’s annual budget proposal. The total Market Fees are paid by Market Participants to recover the following:
• operational costs of AEMO and the IMO; and
• wholesale market related costs of System Management and the ERA.
Table 4 details the forecast of System Management’s contribution to the total Market Fees and the forecast percentage change.
Table 4: Forecast System Management Market Fees ($/MWh Nominal)
2015/16* 2016/17 2017/18 2018/19
System Management forecast fee rate 0.372 0.4141 0.3912 0.3710
% change 11.31% (5.51%) (5.18%) *2015/16 Forecast fee rate is based on AEMO (formally IMO) website ‘Fees and Charges’
The actual Market Fee rate contributions levied during the AR4 period may differ from this forecast due to:
• Revised sent-out energy forecasts in future Electricity Statement of Opportunities report (ESOO)
• Adjustments to the allowable revenue due to differences in operating and capital expenditure, and actual revenue earned by System Management
• Differences between forecast inflation and actual inflation.
Conclusion System Management’s allowable revenue for the AR4 period is required to support the secure and reliable operation of the SWIS and the operation of the WEM. Forecast capital and operational
7 Determination: Allowable Revenue and Forecast Capital Expenditure for the Independent Market Operator 2013/14 to 2015/16” https://www.erawa.com.au/cproot/11259/2/Allowable%20Revenue%20Determination%20IMO%202013%2014%20to%202015%2016%20(Final).pdf (October 13, 2015)
Allowable Revenue Information for 1 July 2016 to 30 June 2019
DM 13379287 Page 11
expenditure, following the transition of System Management to AEMO, has been included in order for System Management to continue BAU activities and meet its obligations under the WEM.
This proposal is based on rolling over AR3 operating expenditure levels and including step changes, which has resulted in increased revenue requirements for System Management. Capital expenditure requirements for the AR4 period have been included to support the secure and reliable operation of the SWIS and support the transition of System Management to AEMO.
The increase in revenue compared to the AR3 period is predominantly driven by the investment in system and market security, additional resourcing associated with the transition of System Management to AEMO and to address existing BAU operational risks, IT system’s upgrades and asset replacement. This investment approach only includes costs that would be incurred by a prudent provider of system operation services and which can be recovered in accordance with section 2.23.12 of the Market Rules.
Should there be any additional operational or capital investment required during the AR4 period (as a result of the EMR and transfer of System Management to AEMO) these will be addressed via Declared Market Projects or by reopening the allowable revenue proposal, as required.
System Management considers that this allowable revenue proposal meets the requirements of section 2.23 of the Market Rules.
Allowable Revenue Information for 1 July 2016 to 30 June 2019
DM 13379287 Page 12
PART A: BACKGROUND AND CONTEXT
Allowable Revenue Information for 1 July 2016 to 30 June 2019
DM 13379287 Page 13
1 Introduction This is System Management’s fourth allowable revenue proposal to the ERA. The fourth review period covers the three year period from 1 July 2016 to 30 June 2019. For the purposes of this document, the previous three review periods were:
• AR1 – 1 July 2007 to 30 June 2010
• AR2 – 1 July 2010 to 30 June 2013
• AR3 – 1 July 2013 to 30 June 2016
This allowable revenue information document provides context, rationale and justification for System Management’s allowable revenue proposal and should be read in conjunction with the associated allowable revenue application document.8 Collectively, these two documents comprise System Management’s allowable revenue proposal.
The Market Rules require System Management to submit its proposal to the ERA for the AR4 period by 30 November 2015. An extension of the submission date, until 29 February 2016, has been granted.9
Submission structure This document comprises of three parts:
• Part A – Background and context. This section provides:
• an overview of System Management changes and challenges for the AR4 period; and
• details of performance, delivery processes and governance during the AR3.
• Part B – Expenditure proposal. This section provides:
• details and justifications for proposed capital and operating expenditure requirements during the AR4 period; and
• the methodology and governance used to develop the investment proposal for AR4.
• Part C – Revenue. This section details:
• the proposed revenue for the AR4 period; and
• the calculation of the value of the capital base, rate of return on investment and depreciation.
The allowable revenue information also includes a range of appendices containing supporting information, where relevant.
1.1.1 Explanatory notes All monetary amounts presented in this document are expressed in nominal dollars. Some totals may not add up due to rounding.
8 System Management allowable revenue and forecast capital expenditure application, Western Power, February 2016. 9 The Public Utilities Office proposed a Rule change that allowed System Management an extension on their submission date until 29 February 2016. This was approved by the Western Australian Minister for Energy on 27 November15.
Allowable Revenue Information for 1 July 2016 to 30 June 2019
DM 13379287 Page 14
2 Overview of System Management This chapter provides contextual information to explain System Management’s business operations and the anticipated organisational changes that are likely to occur during the AR4 period. This information is provided as background to the subsequent sections of this document.
System Management in the context of Western Power A Western Power organisational restructure occurred in 2013. The restructure resulted in the segregation of the System Management function to better represent its WEM defined role:
• System Management is the division of Western Power that has the function of operating the SWIS in a secure and reliable manner.
• In the context of this allowable revenue proposal, System Management is the participant referred to in Part 9 of the Electricity Industry Act (2004) (Act) as "a system management participant".
• Part 9 of the Act established the WEM. Western Power’s obligations under Part 9 of the Act commenced with the establishment of the WEM on 21 September 2006.
• The Electricity Industry (Wholesale Electricity Market) Regulations 2004 (Regulations) Part 2, regulation 13 states that the Market Rules are to confer on an entity the function of operating the SWIS in a secure and reliable manner. The entity on which the function mentioned in subregulation (1) is referred to in the Regulations as System Management. The function referred to in subregulation (1) is a system management function for the purposes of the definition of “system management participant” in section 126(1) of the Act.
• Clause 2.2.1 of the Market Rules states that Western Power, acting through the segregated business unit known as System Management, has the function of operating the SWIS in a secure and reliable manner for the purposes of regulation 13(1) of the Regulations.
• Other functions of System Management include:
• Procurement of adequate Ancillary Services
• Assisting AEMO in the processing of applications for participation and for the registration, de-registration and transfer of facilities
• Development and maintenance of Market Procedures
• Release of information required by the Market Rules
• Monitoring Rule participants compliance with the Market Rules relating to dispatch and power system security and power system reliability
• Carrying out any other functions or responsibilities conferred, and performing any obligations imposed, on it under the Market Rules
Prior to 2013, there was a distinction between System Management as a division of Western Power and the System Management (Markets) branch, acting as a segregated entity within that division.
It is important to differentiate the past and current state of System Management:
• System Management Division pre October 2013 – contained market and generator operator, transmission and distribution network operator activities. Although the Division was called ‘System Management’ the market and generator operator activities or WEM
Allowable Revenue Information for 1 July 2016 to 30 June 2019
DM 13379287 Page 15
defined system management accountabilities were undertaken by various positions across the four branches of the Division.10
• System Management post October 2013 – only contains the market and generator operator related activities and is now fulfils a WEM defined system management role.
System Management continues to delegate some activities within its accountability to other areas of Western Power, as provided for under clause 2.2.3 of the Market Rules. There is no formal instrument of delegations between System Management and Western Power and the 2014 and 2015 Compliance Audits identified the need for a Service Level Agreement (SLA) to be implemented. Any changes to System Management functions and processes, including an SLA, will be addressed once the EMR outcomes are known and through consultation with AEMO. Under the new organisational structure there has been no significant change in resourcing levels to WEM defined system management activities. However, the distinction between market-related system management activities and network operator activities are now more clearly defined. An overview of the structural changes reflecting the pre and post 2013 structure can be found in Appendix C.
System Management’s services and responsibilities System Management provides system operation services to the WEM. It has a fundamental role to:
• operate the SWIS in a secure and reliable manner; and
• support the operation of the WEM.
System Management also works cooperatively with Market Participants to assist them with understanding and complying with their responsibilities.
System Management’s responsibilities under the Market Rules are:11
• to operate the SWIS in a secure and reliable manner;
• to procure adequate Ancillary Services where Synergy cannot meet the Ancillary Service Requirements;
• to assist the market operator in the processing of applications for participation and for the registration, de-registration and transfer of facilities;
• to develop Market Procedures, and amendments and replacements for them, where required by the Market Rules;
• to release information required to be released by the Market Rules;
• to monitor Rule Participants’ compliance with Market Rules relating to dispatch and Power System Security and Power System Reliability; and
• to carry out any other functions or responsibilities conferred, and perform any obligations imposed on it, under the Market Rules.
To meet these responsibilities, System Management is required to provide the following functions:
• recognise transient or designed network constraints in the dispatch of generating facilities;
• perform dispatch in accordance with a balancing merit order provided by the market operator;
• coordinate and schedule plant outages ensuring that sufficient capacity is available and can be delivered via the SWIS network to meet electricity demand under all but extreme circumstances;
10 The four branches were: System Operations, Planning & Market Operations, Network Operations Control and SCADA Services. 11 System Management’s obligations are detailed in section 2.2 of the Market Rules.
Allowable Revenue Information for 1 July 2016 to 30 June 2019
DM 13379287 Page 16
• coordinate and manage the process of commissioning new facilities in a manner that is equitable and does not impact unduly on consumers, or other Market Participants;
• maintain computer systems for participants to enter data necessary for its performance of the above services;
• create and maintain a list of all equipment across the SWIS which has the potential to impact on a WEM related transfer of electricity;
• procure and dispatch a range of services necessary to support stable network operations;
• support the reserve capacity mechanism by conducting tests of facilities that receive capacity payments from the market when requested by the market operator;
• monitor the compliance of Market Participants with the Rules and provide reports to the market operator;
• receive data from the market operator, and in turn, send a range of real or near real time data back to the market operator; and
• send supervisory control and data acquisition (SCADA) information to the market operator to allow for the settlement of WEM facilities that do not have revenue quality metering installations.
In addition to the above, System Management is obligated to create and maintain a range of plans setting out how it will respond to system emergencies (such as its response to under frequency events, its procedures to restart the system from a black state), and how it will manage islanding and fuel contingencies (such as those which have had a major impact on system security over the past few years).
System Management Non Trading Participant System Management has two Market Participant registrations under the Market Rules:
1. System Management
2. System Management Non Trading Participant (SMNTP)
The costs and revenue associated with the SMNTP are subject to separate approval processes from the allowable revenue determination process. They are not included within this allowable revenue proposal. However, Western Power’s regulatory financial statements include the costs and revenue for SMNTP within the System Management category, therefore it is appropriate to include a short discussion of SMNTP here.
SMNTP effectively acts as an intermediary between Simcoa and the market operator. Using low frequency initiated load rejection, Simcoa provides a spinning reserve service to the market. System Management pays Simcoa for this service and then recovers this cost directly from the market operator through the SMNTP.
The SMNTP costs are approximately $4 million per year.
The Electricity Market Review – Phase I and Phase II In March 2014 the Minister launched the EMR to examine “the structures of the electricity generation, wholesale and retail sectors within the South West Interconnected System in Western Australia and the incentives for industry participants to make efficient investments and minimise
Allowable Revenue Information for 1 July 2016 to 30 June 2019
DM 13379287 Page 17
costs”.12 The review was designed with a two phase approach; Phase I was completed in August 2014 and Phase II commenced in March 2015. The phase structures are detailed below:
• Phase I comprised an assessment of the strengths and weaknesses of the current industry structure, market institutions and regulatory arrangements, and an examination of options for reform to better achieve the EMR objectives.
• Phase II will comprise two stages; the detailed design of a set of selected reforms and implementation arrangements.13
Phase I addressed the institutional arrangements for the electricity sector by raising the concept of the System Management business transferring to the IMO. The implementation of System Management’s transfer to the IMO began in Phase II. Further changes to the operating state of System Management are likely to be affected by the transfer of the system management function and operation of the WEM from the IMO to AEMO.14
System Management in the context of Western Power (expected future state)
Changes to the process for AR4
Based on the State Government’s reform, System Management is transferring to AEMO during the AR4 period. This is a variation of the initial proposal to merge System Management with the IMO under Phase II of the EMR process in order “to improve the coordination of System Management (including generator dispatch) with the commercial outcomes of the Wholesale Electricity Market”. 15
A change in ownership structure has altered the scope of System Management plans (and consequently revenue requirements). The following working assumptions apply to the preparation of the AR4 proposal in light of the transition:
• Forecasts of recurrent operational expenditure reflect a ‘rollover’ position based on actual expenditure from the 2014/15 financial year
• Forecasts for step changes in operational expenditure include resourcing based on FTE requirements for the AR4 period
• Forecasts of capital expenditure include projects required for System Management to support reliable operation of the SWIS and the WEM. In addition, capital expenditure includes IT system enhancements and asset replacement required during the AR4 period
• System Management operations will be managed by AEMO by the end of 2016
• All System Management IT systems will be separated from Western Power systems and will function entirely under AEMO by the end of 2018
• System Management anticipate synergies, once transferred to AEMO, which will be realised in years 2 and 3 of the AR4 period reducing the operational expenditure requirements
System Management intends to consult with the relevant stakeholders (i.e. AEMO, the PUO and the ERA) as to the appropriate mechanisms (including Declared Market Projects) for approval/recovery
12 The rationale behind the initially proposed change can be found on the Department of Finance’s website: https://www.finance.wa.gov.au/cms/Public_Utilities_Office/Electricity_Market_Review/Institutional_Arrangements.aspx 13 Electricity Market Review, http://www.finance.wa.gov.au/cms/Public_Utilities_Office/Electricity_Market_Review/Electricity_Market_Review.aspx 14 Media statement can be found on the Government Media Statements website: https://www.mediastatements.wa.gov.au/Pages/Barnett/2015/09/Electricity-reform-gains-momentum.aspx 15 The rationale behind the initially proposed change can be found on the Department of Finance’s website: https://www.finance.wa.gov.au/cms/Public_Utilities_Office/Electricity_Market_Review/Institutional_Arrangements.aspx
Allowable Revenue Information for 1 July 2016 to 30 June 2019
DM 13379287 Page 18
of funding required to facilitate the State Government’s reform program upon receiving greater clarity over the time frame and nature of EMR outcomes (this is detailed in the following sections).
Amendments to the AR4 determination Once the ERA has made an Allowable Revenue determination, System Management’s actual expenditure is trued-up through the annual budget submission to AEMO (formally the IMO).16 The annual budget proposal includes adjustments to the allowable revenue to compensate System Management for differences between actual expenditure and forecast expenditure, and actual revenue and allowable revenue. The current process for amendments to the ERA Allowable Revenue determination is through Declared Market Projects. These projects may involve a major change in System Management’s function under the Market Rules or computer software/systems used to perform its functions. Under clause 2.22A.12 of the Market Rules, AEMO may declare a project to be a Declared Market Project if:
a) “the project involves:
i. a major change to the functions of AEMO or System Management under these Market Rules (including the transfer of System Management to AEMO); or
ii. a major change to any of the computer software or systems that AEMO or System Management uses in the performance of any of its functions under these Market Rules; and
b) AEMO estimates that, for either AEMO or System Management the sum of:
i. the recurring expenditure associated with the change; and
ii. the capital expenditure required to implement the change,
would be greater than the sum of Allowable Revenue determined and Forecast Capital Expenditure approved by the ERA for the current Review Period by more than 10%”.
Additionally, where revenue earned through System Operation Fees in the previous Financial Year is greater than, or less than, Systems Management’s expenditure for that Financial Year, the current years’ budget must take this into account i.e. decrease the budget revenue amount by the surplus or increase by the shortfall (see Market Rules clause 2.23.7).
System Management will seek reassessment of the AR4 proposal if it is likely that the revenue recovered over the AR4 period will be 15% or greater than the approved revenue or, if there is a significant unforeseen event (see Market Rules clause 2.23.8).
16 The transition of IMO to AEMO occurred on the 1 December 2015.
Allowable Revenue Information for 1 July 2016 to 30 June 2019
DM 13379287 Page 19
3 Submission preparation approach This chapter discusses System Management’s approach to developing this allowable revenue proposal. Key considerations included compliance with the Market Rules, stakeholder feedback and performance during the AR3 period.
Market Rules compliance This allowable revenue proposal meets the requirements of Section 2.23 of the Market Rules and aligns with the WEM objectives.17
3.1.1 Specific guidelines within the Market Rules The Market Rules provide guidelines on what should be taken into account by the ERA in determining System Management’s allowable revenue (clause 2.23.12):
a) “the Allowable Revenue must be sufficient to cover the forward looking costs of providing the services described in clause 2.23.1 and performing its functions and obligations under these Market Rules in accordance with the following principles:
i. recurring expenditure requirements and payments are recovered in the year of the expenditure;
ii. capital expenditures are to be recovered through the depreciation and amortisation of the assets acquired by the capital expenditure in a manner that is consistent with generally accepted accounting principles;
iii. costs incurred by System Management that are related to market establishment, as designated by the Minister, are to be recovered over a period determined by the Minister from Energy Market Commencement; and
iv. notwithstanding clauses 2.23.12(a)(i), 2.23.12(a)(ii) and 2.23.12(a)(iii), expenditure incurred, and depreciation and amortisation charged, in relation to any Declared Market Project are to be recovered over the period determined for that Declared Market Project.
b) the Allowable Revenue and Forecast Capital Expenditure must include only costs which would be incurred by a prudent provider of the services described in clause 2.23.1, acting efficiently, in accordance with good electricity industry practice, seeking to achieve the lowest practicably sustainable cost of delivering the services described in clause 2.23.1 in accordance with these Market Rules, while effectively promoting the Wholesale Market Objectives; and
c) where possible, the Economic Regulation Authority should benchmark the Allowable Revenue and Forecast Capital Expenditure against the costs of providing similar services in other jurisdictions.”
3.1.2 How these guidelines have been addressed • System Management is applying the building block method in the AR4 proposal consistent
with section 2.23.12(a) of the Market Rules, as detailed in Section 8.
Although the Market Rules are not as prescriptive as the Electricity Networks Access Code (2004) (ENAC) or Guidelines for Access Arrangement Information (AAI)18 in their
17 The WEM objectives are provided in Appendix A. 18 Economic Regulation Authority, Guidelines for Access Arrangement Information, 6 December 2010, available from:
Allowable Revenue Information for 1 July 2016 to 30 June 2019
DM 13379287 Page 20
requirements for the content of the relevant regulatory submissions, the principles of section 2.23.12(a) and 2.23.12(b) of the Market Rules provide an important guide for preparing forecast expenditure within an allowable revenue proposal.
All forecast expenditure and elements of the revenue building blocks used to calculate the allowable revenue have been developed with close consideration of these clauses.
Where the Market Rules do not provide specific guidance on elements of this allowable revenue proposal, such as calculation of the capital base, return on investment and depreciation, System Management has given regard firstly, to the Market Rules objectives and secondly, to the approach adopted by Western Power in its third Access Arrangement (AA3), 2012/13 to 2016/17.
• The Market objectives seek efficient, safe and reliable production and supply of electricity and related services in the SWIS, and the minimisation of the long term costs of electricity. The primary function of System Management in the Regulations19 is to operate the SWIS in a secure and reliable manner. To help achieve these objectives, System Management is seeking to reflect the real cost of its services to the WEM. Bearing in mind the ability for System Management to reapply to the ERA for additional capital expenditure if the budget proposal is likely to result in capital expenditure being at least 10% greater than the Forecast Capital Expenditure, System Management believes that this AR4 proposal represents an economically efficient approach to meeting its obligations in the Market Rules, providing its functions in the Regulations and contributing to ensuring that the Market objectives are achieved.
Engagement with Stakeholders Particular focus has been given to engaging with the IMO/AEMO and ERA to ensure System Management’s expenditure proposal will support the enhancements planned for the market and System Management transfer during the AR4 period. Other engagements included:
• Attending Market Advisory Committee (MAC) meetings where System Management liaised with participants to ensure there is a common understanding of recent changes to the market, and the support required for the business transformation.
• Meetings with ERA and IMO/AEMO to discuss EMR recommendations more broadly.
• System Management meetings with AEMO to discuss System Management’s future operating state and BAU requirements for the AR4 period.
These engagements have enabled System Management to understand its stakeholders’ needs in the context of rapid evolution of the Market Rules and processes to support the future state of System Management and AEMO.
http://www.erawa.com.au/cproot/9113/2/20101206%20D47095%20Electricity%20Networks%20Access%20Code%202004%20-%20Guidelines%20for%20AAI%20(Version%202).PDF 19 Refer to Regulation 13(1) in Part 2 of the Electricity Industry (Wholesale Electricity Market) Regulations 2004, available from: http://www.slp.wa.gov.au/pco/prod/FileStore.nsf/Documents/MRDocument:23752P/$FILE/ElecityIndusWhsaleElecityMarktRegs2004-01-g0-00.pdf?OpenElement
Allowable Revenue Information for 1 July 2016 to 30 June 2019
DM 13379287 Page 21
4 Performance and expenditure during the AR3 period This chapter sets out how System Management has performed over the first two years of the AR3 period (2013/14 and 2014/15) and forecast performance for the last year of the AR3 period (2015/16). It summarises the key customer service outcomes and the investment undertaken to achieve these outcomes.
This chapter also highlights a number of improvements that System Management has made to its forecasting and delivery arrangements.
Key messages • System Management has met its obligations to provide system operation services, including
effectively managing system frequency and all aspects of system security and reliability, as required by the Market Rules.
• The MEP, which supported the implementation of the Competitive Balancing and Load Following (CBLF) markets, required considerable changes to System Management’s operations.
• AR3 capital expenditure was $1.082 million20 compared to the total approved $3.999 million. The underinvestment was almost entirely due to the EMR, which was not foreseen in the 2013 proposal, resulting in deferral and reprioritisation of projects.
• AR3 operational expenditure was $25.639 million20 compared to the total approved $26.858 million. This excludes the additional $0.95 million and $0.50 million approved and spent respectively, through the IMO annual budget process. Operating expenditure was less than forecast predominately due to lower legal, IT and functional costs during the period.
Operational performance during AR3 Key aspects of operational performance during the AR3 period included:
• System frequency management
• Dispatch performance
• Outage scheduling
• Compliance and Rule changes
4.1.1 System frequency management System Management has a responsibility to control system frequency by ensuring that system demand and supply are in balance. The standard, which is defined in the approved Ancillary Services Report (clause 3.11.11 of the Market Rules), requires system frequency to be maintained between 49.8 and 50.2 MHz for 99.9% of the time.
During AR3 System Management has continued to meet this standard, maintaining system frequency within the required range 99.9% of the time for both 2013/14 and 2014/15, also continuing during 2015/16.
4.1.2 Dispatch performance System Management provides quarterly reports to the IMO/AEMO on the effectiveness of the market in relation to the dispatch process. The introduction of the CBLF market at the end of the AR2
20Includes actuals for 2013/14 and 2014/15 and forecast for 2015/16.
Allowable Revenue Information for 1 July 2016 to 30 June 2019
DM 13379287 Page 22
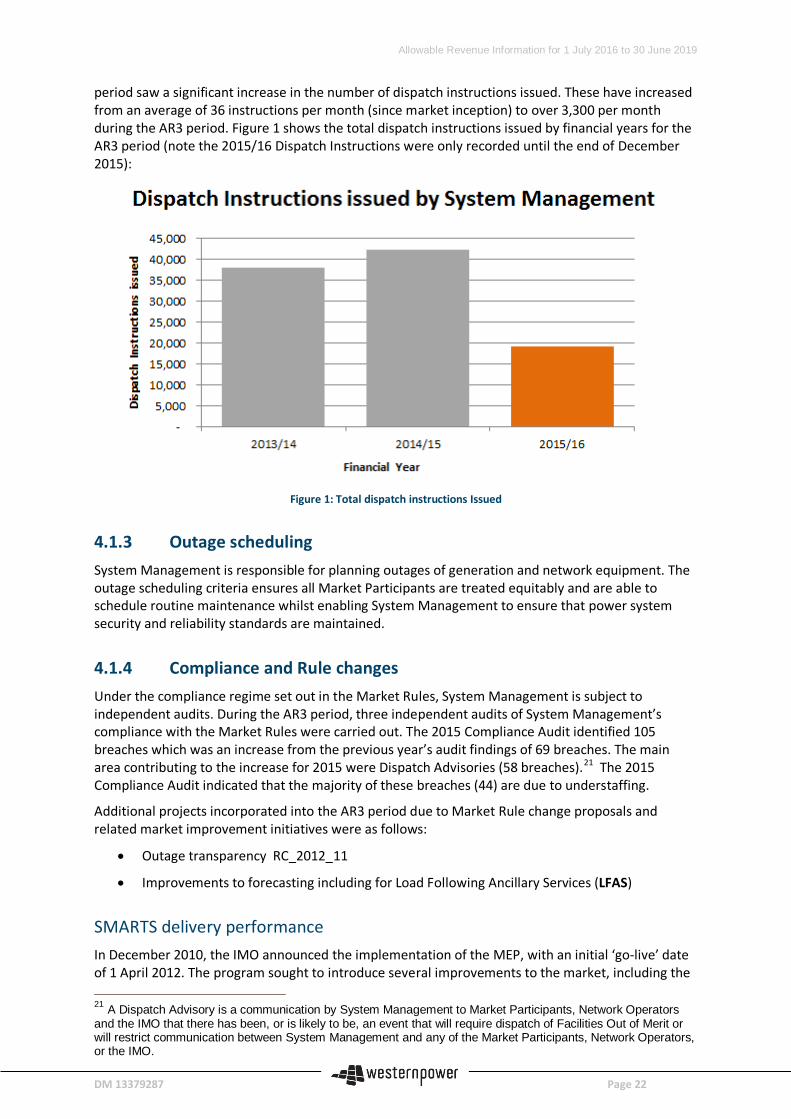
period saw a significant increase in the number of dispatch instructions issued. These have increased from an average of 36 instructions per month (since market inception) to over 3,300 per month during the AR3 period. Figure 1 shows the total dispatch instructions issued by financial years for the AR3 period (note the 2015/16 Dispatch Instructions were only recorded until the end of December 2015):
Figure 1: Total dispatch instructions Issued
4.1.3 Outage scheduling System Management is responsible for planning outages of generation and network equipment. The outage scheduling criteria ensures all Market Participants are treated equitably and are able to schedule routine maintenance whilst enabling System Management to ensure that power system security and reliability standards are maintained.
4.1.4 Compliance and Rule changes Under the compliance regime set out in the Market Rules, System Management is subject to independent audits. During the AR3 period, three independent audits of System Management’s compliance with the Market Rules were carried out. The 2015 Compliance Audit identified 105 breaches which was an increase from the previous year’s audit findings of 69 breaches. The main area contributing to the increase for 2015 were Dispatch Advisories (58 breaches).21 The 2015 Compliance Audit indicated that the majority of these breaches (44) are due to understaffing.
Additional projects incorporated into the AR3 period due to Market Rule change proposals and related market improvement initiatives were as follows:
• Outage transparency RC_2012_11
• Improvements to forecasting including for Load Following Ancillary Services (LFAS)
SMARTS delivery performance In December 2010, the IMO announced the implementation of the MEP, with an initial ‘go-live’ date of 1 April 2012. The program sought to introduce several improvements to the market, including the 21 A Dispatch Advisory is a communication by System Management to Market Participants, Network Operators and the IMO that there has been, or is likely to be, an event that will require dispatch of Facilities Out of Merit or will restrict communication between System Management and any of the Market Participants, Network Operators, or the IMO.
Allowable Revenue Information for 1 July 2016 to 30 June 2019
DM 13379287 Page 23
implementation of the CBLF markets that would allow generators to bid for dispatch in near real-time.
The introduction of the CBLF market was the most fundamental change to System Management’s operating environment since commencement of the WEM in 2006. System Management required significant upgrades to existing IT systems including developing and implementing the SMARTS program. The SMARTS program delivers the IT systems, procedures and processes required to meet System Management’s obligations and enables the market to realise the opportunities that CBLF present, while reducing manual processes.
SMARTS was designed during the AR2 period as a scalable solution to deliver only the functionality immediately required to support the CBLF market and allow full compliance with Market Rules obligations during 2013. Critically, the timing requirements for the new market meant that there was insufficient time prior to the go-live date to follow the approvals options22 under the WEM Rules to seek upfront approval of SMARTS costs from the ERA. As per section 2.23.12(a)(ii) of the Market Rules, System Management proposed an amount in the AR3 allowable revenue proposal to recover the SMARTS capital expenditure through the depreciation and amortisation of assets in a manner that was consistent with generally accepted accounting principles. 23
During the AR3 period, activities associated with SMARTS security assessment were delivered under budget and SMARTS testing was deferred due to the EMR. Some additional costs were incurred due to updates and maintenance of SMARTS during the AR3 period.
4.2 AR3 investment objectives The investment objectives set by System Management for AR3 were:
• Meeting customer requirements for performance and value – System Management invested efficiently to provide the services required by its stakeholders at the quality level demanded, while minimising the cost to Market Participants
• Compliance – System Management invested efficiently to ensure it was compliant with the Market Rules and operating procedures
• Supporting market enhancements – System Management invested efficiently to support changes to the Market Rules and act as a partner in the development of the market
• Improving process efficiency – System Management invested efficiently to improve processes and systems that would lead to a lower cost of service for Market Participants over time
Some of the investment objectives were not realised due to the deferral and reprioritisation of projects as a result of the EMR. However, the SMARTS program made significant progress towards achieving the intended objectives and outcomes. System Management has been servicing the CBLF market since 1 July 2012, enabling market-based pricing and dispatching balancing and load-following generation services.
Expenditure during AR3 Based on actual expenditure during 2013/14 and 2014/15, and forecast expenditure for 2015/16, System Management will have invested $1.082 million in capital and incurred $25.639 million in operating costs to provide system operation services during the AR3 period. To date, the AR3
22 System Management’s preference was to engage further with the ERA and IMO to gain prior approval of the MEP as a Declared Market Project and to seek redetermination of the AR2 on this basis. This would have ensured up-front recovery of the SMARTS investment by Western Power. However, this approach would have resulted in a significant delay in the introduction of the CBLF market and a deferral of the benefits sought by Market Participants. The ERA initiated a Market Rule change (RC_2011_02) which would require System Management to obtain ERA approval prior to implementing a SMARTS sized project in the future. 23 The determination of depreciation and amortisation was set at 5 years for SMARTS.
Allowable Revenue Information for 1 July 2016 to 30 June 2019
DM 13379287 Page 24
expenditure is significantly lower than provided for in the ERA’s AR3 determination. The reduction in capital expenditure is predominantly due to the reprioritisation of projects as a result of the EMR.
Allowable Revenue Information for 1 July 2016 to 30 June 2019
DM 13379287 Page 25
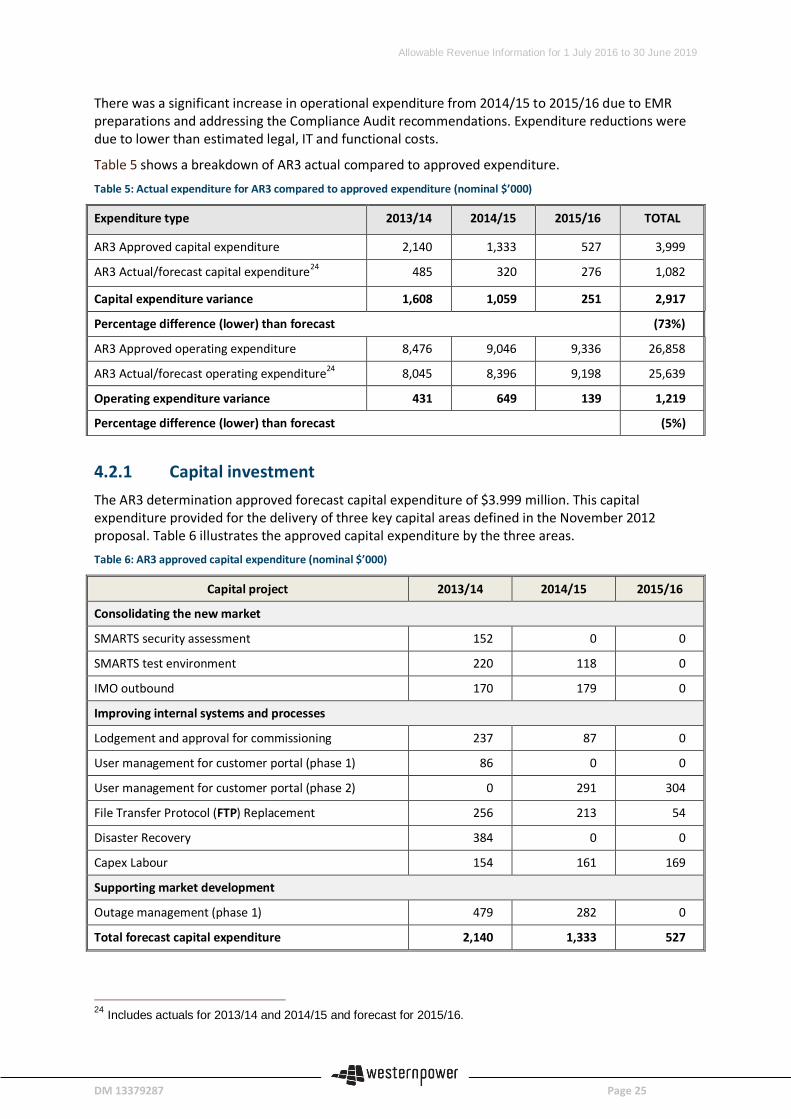
There was a significant increase in operational expenditure from 2014/15 to 2015/16 due to EMR preparations and addressing the Compliance Audit recommendations. Expenditure reductions were due to lower than estimated legal, IT and functional costs.
Table 5 shows a breakdown of AR3 actual compared to approved expenditure.
Table 5: Actual expenditure for AR3 compared to approved expenditure (nominal $’000)
Expenditure type 2013/14 2014/15 2015/16 TOTAL
AR3 Approved capital expenditure 2,140 1,333 527 3,999
AR3 Actual/forecast capital expenditure24 485 320 276 1,082
Capital expenditure variance 1,608 1,059 251 2,917
Percentage difference (lower) than forecast (73%)
AR3 Approved operating expenditure 8,476 9,046 9,336 26,858
AR3 Actual/forecast operating expenditure24 8,045 8,396 9,198 25,639
Operating expenditure variance 431 649 139 1,219
Percentage difference (lower) than forecast (5%)
4.2.1 Capital investment The AR3 determination approved forecast capital expenditure of $3.999 million. This capital expenditure provided for the delivery of three key capital areas defined in the November 2012 proposal. Table 6 illustrates the approved capital expenditure by the three areas. Table 6: AR3 approved capital expenditure (nominal $’000)
Capital project 2013/14 2014/15 2015/16
Consolidating the new market
SMARTS security assessment 152 0 0
SMARTS test environment 220 118 0
IMO outbound 170 179 0
Improving internal systems and processes
Lodgement and approval for commissioning 237 87 0
User management for customer portal (phase 1) 86 0 0
User management for customer portal (phase 2) 0 291 304
File Transfer Protocol (FTP) Replacement 256 213 54
Disaster Recovery 384 0 0
Capex Labour 154 161 169
Supporting market development
Outage management (phase 1) 479 282 0
Total forecast capital expenditure 2,140 1,333 527
24 Includes actuals for 2013/14 and 2014/15 and forecast for 2015/16.
Allowable Revenue Information for 1 July 2016 to 30 June 2019
DM 13379287 Page 26
In 2013/14 and 2014/15, System Management invested $0.805 million in capital projects compared to the forecast $3.472 million. In 2015/16, System Management expects to invest a further $0.276 million compared to the forecast of $0.527 million. Refer to Table 5 for comparison figures.
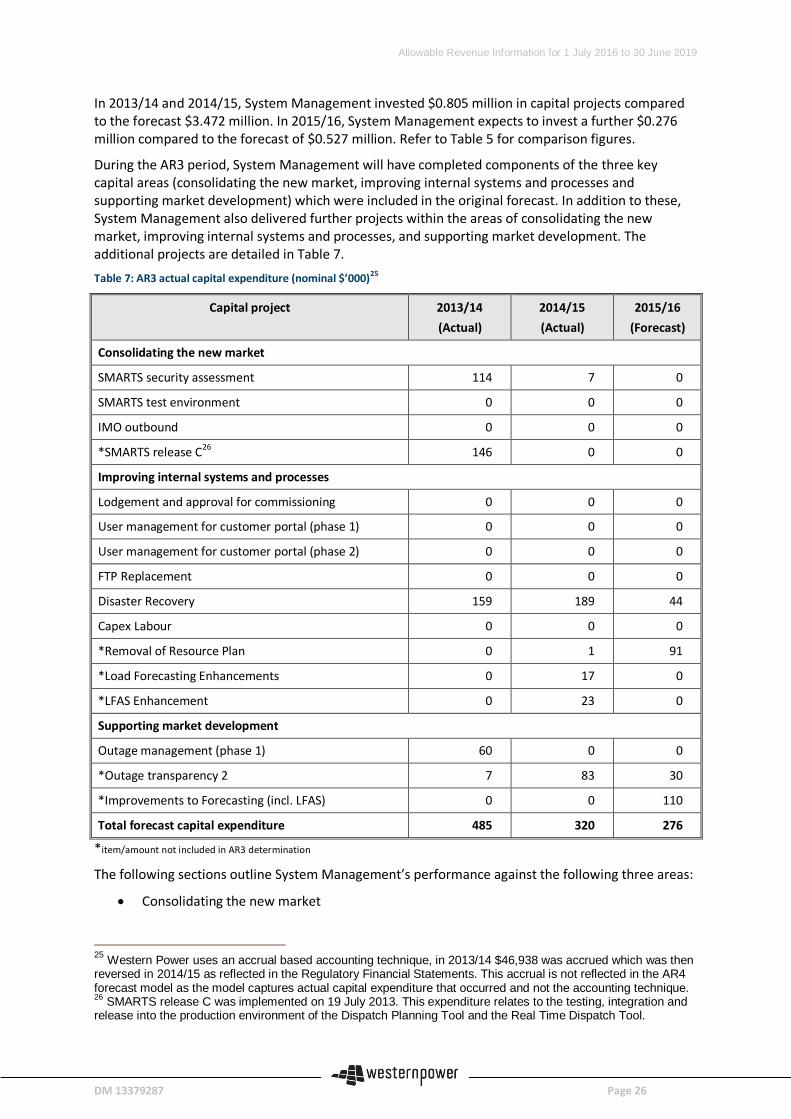
During the AR3 period, System Management will have completed components of the three key capital areas (consolidating the new market, improving internal systems and processes and supporting market development) which were included in the original forecast. In addition to these, System Management also delivered further projects within the areas of consolidating the new market, improving internal systems and processes, and supporting market development. The additional projects are detailed in Table 7.
Table 7: AR3 actual capital expenditure (nominal $’000)25
Capital project 2013/14 (Actual)
2014/15 (Actual)
2015/16 (Forecast)
Consolidating the new market
SMARTS security assessment 114 7 0
SMARTS test environment 0 0 0
IMO outbound 0 0 0
*SMARTS release C26 146 0 0
Improving internal systems and processes
Lodgement and approval for commissioning 0 0 0
User management for customer portal (phase 1) 0 0 0
User management for customer portal (phase 2) 0 0 0
FTP Replacement 0 0 0
Disaster Recovery 159 189 44
Capex Labour 0 0 0
*Removal of Resource Plan 0 1 91
*Load Forecasting Enhancements 0 17 0
*LFAS Enhancement 0 23 0
Supporting market development
Outage management (phase 1) 60 0 0
*Outage transparency 2 7 83 30
*Improvements to Forecasting (incl. LFAS) 0 0 110
Total forecast capital expenditure 485 320 276
*item/amount not included in AR3 determination
The following sections outline System Management’s performance against the following three areas:
• Consolidating the new market
25 Western Power uses an accrual based accounting technique, in 2013/14 $46,938 was accrued which was then reversed in 2014/15 as reflected in the Regulatory Financial Statements. This accrual is not reflected in the AR4 forecast model as the model captures actual capital expenditure that occurred and not the accounting technique. 26 SMARTS release C was implemented on 19 July 2013. This expenditure relates to the testing, integration and release into the production environment of the Dispatch Planning Tool and the Real Time Dispatch Tool.
Allowable Revenue Information for 1 July 2016 to 30 June 2019
DM 13379287 Page 27
• Improving internal systems and processes
• Supporting market development
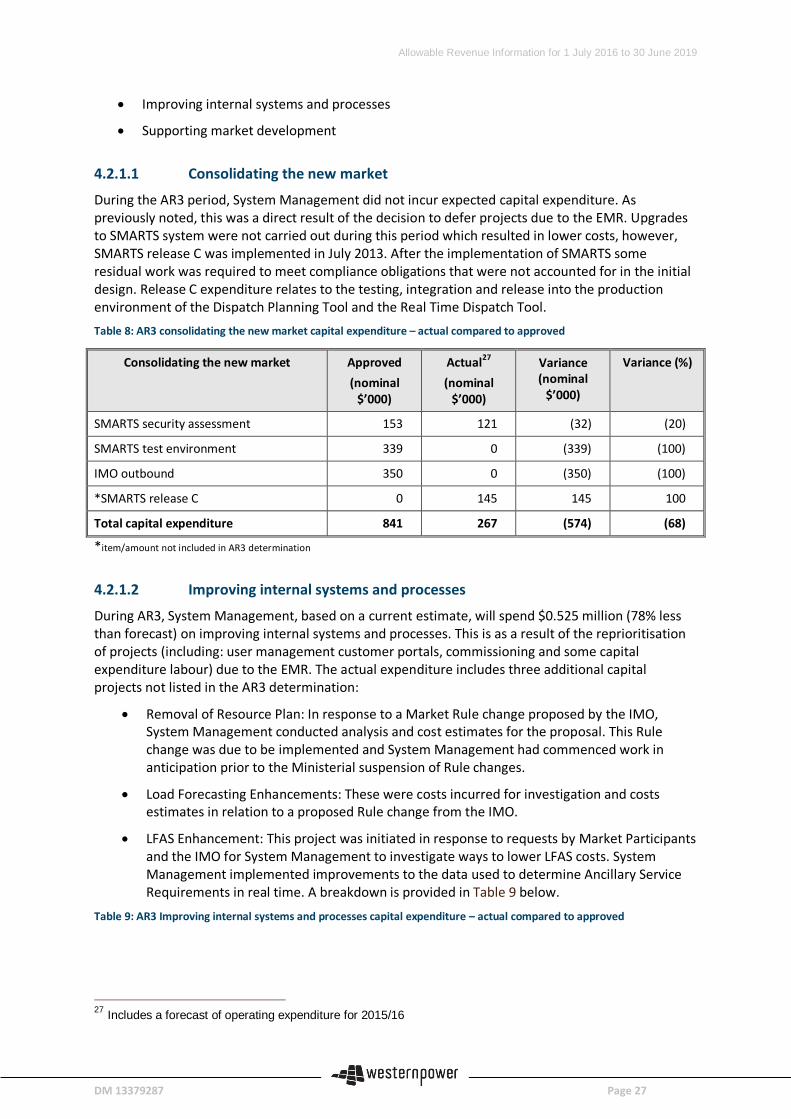
4.2.1.1 Consolidating the new market
During the AR3 period, System Management did not incur expected capital expenditure. As previously noted, this was a direct result of the decision to defer projects due to the EMR. Upgrades to SMARTS system were not carried out during this period which resulted in lower costs, however, SMARTS release C was implemented in July 2013. After the implementation of SMARTS some residual work was required to meet compliance obligations that were not accounted for in the initial design. Release C expenditure relates to the testing, integration and release into the production environment of the Dispatch Planning Tool and the Real Time Dispatch Tool. Table 8: AR3 consolidating the new market capital expenditure – actual compared to approved
*item/amount not included in AR3 determination
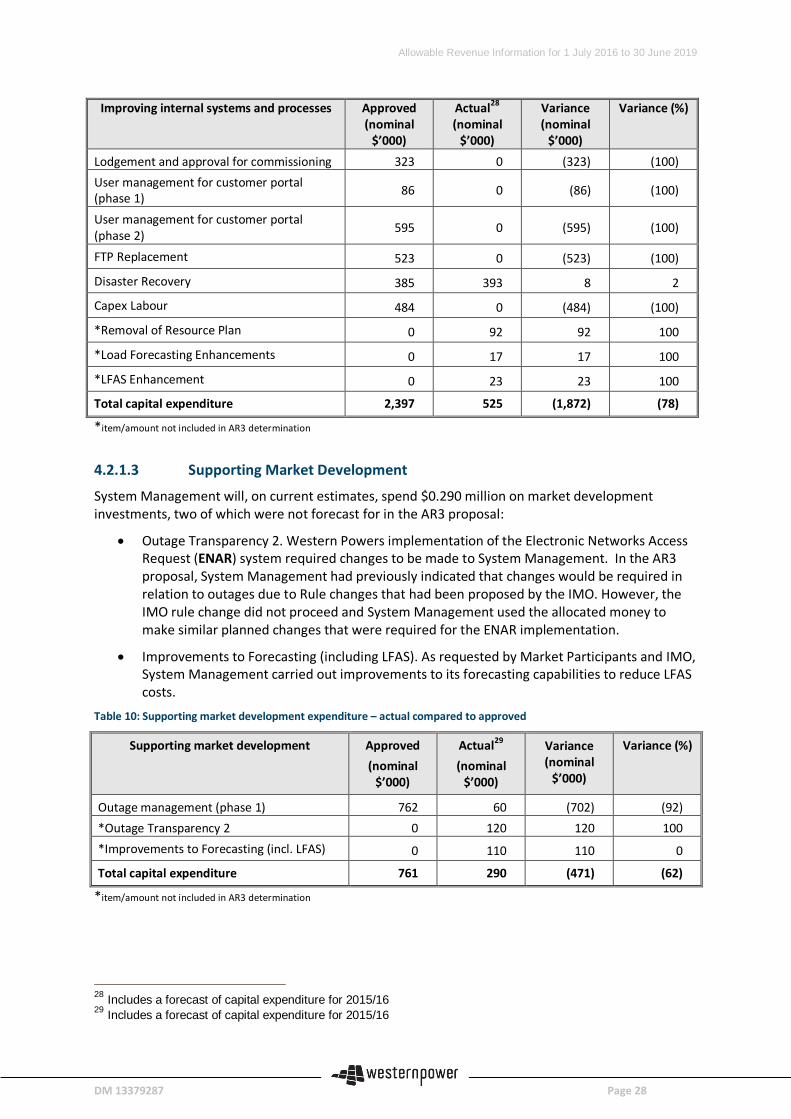
4.2.1.2 Improving internal systems and processes
During AR3, System Management, based on a current estimate, will spend $0.525 million (78% less than forecast) on improving internal systems and processes. This is as a result of the reprioritisation of projects (including: user management customer portals, commissioning and some capital expenditure labour) due to the EMR. The actual expenditure includes three additional capital projects not listed in the AR3 determination:
• Removal of Resource Plan: In response to a Market Rule change proposed by the IMO, System Management conducted analysis and cost estimates for the proposal. This Rule change was due to be implemented and System Management had commenced work in anticipation prior to the Ministerial suspension of Rule changes.
• Load Forecasting Enhancements: These were costs incurred for investigation and costs estimates in relation to a proposed Rule change from the IMO.
• LFAS Enhancement: This project was initiated in response to requests by Market Participants and the IMO for System Management to investigate ways to lower LFAS costs. System Management implemented improvements to the data used to determine Ancillary Service Requirements in real time. A breakdown is provided in Table 9 below.
Table 9: AR3 Improving internal systems and processes capital expenditure – actual compared to approved
27 Includes a forecast of operating expenditure for 2015/16
Consolidating the new market Approved (nominal
$’000)
Actual27 (nominal
$’000)
Variance (nominal
$’000)
Variance (%)
SMARTS security assessment 153 121 (32) (20)
SMARTS test environment 339 0 (339) (100)
IMO outbound 350 0 (350) (100)
*SMARTS release C 0 145 145 100
Total capital expenditure 841 267 (574) (68)
Allowable Revenue Information for 1 July 2016 to 30 June 2019
DM 13379287 Page 28
*item/amount not included in AR3 determination
4.2.1.3 Supporting Market Development
System Management will, on current estimates, spend $0.290 million on market development investments, two of which were not forecast for in the AR3 proposal:
• Outage Transparency 2. Western Powers implementation of the Electronic Networks Access Request (ENAR) system required changes to be made to System Management. In the AR3 proposal, System Management had previously indicated that changes would be required in relation to outages due to Rule changes that had been proposed by the IMO. However, the IMO rule change did not proceed and System Management used the allocated money to make similar planned changes that were required for the ENAR implementation.
• Improvements to Forecasting (including LFAS). As requested by Market Participants and IMO, System Management carried out improvements to its forecasting capabilities to reduce LFAS costs.
Table 10: Supporting market development expenditure – actual compared to approved
Supporting market development Approved (nominal
$’000)
Actual29 (nominal
$’000)
Variance (nominal
$’000)
Variance (%)
Outage management (phase 1) 762 60 (702) (92) *Outage Transparency 2 0 120 120 100 *Improvements to Forecasting (incl. LFAS) 0 110 110 0
Total capital expenditure 761 290 (471) (62)
*item/amount not included in AR3 determination
28 Includes a forecast of capital expenditure for 2015/16 29 Includes a forecast of capital expenditure for 2015/16
Improving internal systems and processes Approved (nominal
$’000)
Actual28 (nominal
$’000)
Variance (nominal
$’000)
Variance (%)
Lodgement and approval for commissioning 323 0 (323) (100) User management for customer portal (phase 1) 86 0 (86) (100)
User management for customer portal (phase 2) 595 0 (595) (100)
FTP Replacement 523 0 (523) (100)
Disaster Recovery 385 393 8 2
Capex Labour 484 0 (484) (100)
*Removal of Resource Plan 0 92 92 100
*Load Forecasting Enhancements 0 17 17 100
*LFAS Enhancement 0 23 23 100
Total capital expenditure 2,397 525 (1,872) (78)
Allowable Revenue Information for 1 July 2016 to 30 June 2019
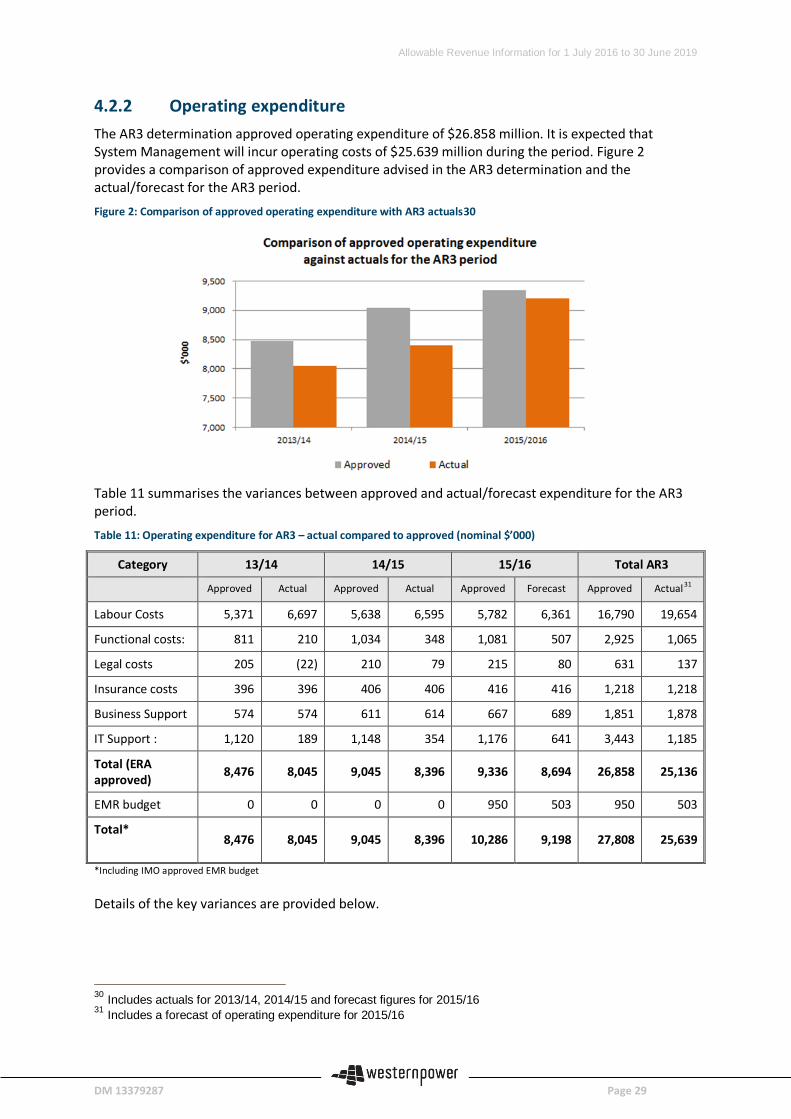
DM 13379287 Page 29
4.2.2 Operating expenditure The AR3 determination approved operating expenditure of $26.858 million. It is expected that System Management will incur operating costs of $25.639 million during the period. Figure 2 provides a comparison of approved expenditure advised in the AR3 determination and the actual/forecast for the AR3 period.
Figure 2: Comparison of approved operating expenditure with AR3 actuals30
Table 11 summarises the variances between approved and actual/forecast expenditure for the AR3 period.
Table 11: Operating expenditure for AR3 – actual compared to approved (nominal $’000)
Category 13/14 14/15 15/16 Total AR3
Approved Actual Approved Actual Approved Forecast Approved Actual31
Labour Costs 5,371 6,697 5,638 6,595 5,782 6,361 16,790 19,654
Functional costs: 811 210 1,034 348 1,081 507 2,925 1,065
Legal costs 205 (22) 210 79 215 80 631 137
Insurance costs 396 396 406 406 416 416 1,218 1,218
Business Support 574 574 611 614 667 689 1,851 1,878
IT Support : 1,120 189 1,148 354 1,176 641 3,443 1,185
Total (ERA approved) 8,476 8,045 9,045 8,396 9,336 8,694 26,858 25,136
EMR budget 0 0 0 0 950 503 950 503
Total*
8,476 8,045 9,045 8,396 10,286 9,198 27,808 25,639
*Including IMO approved EMR budget Details of the key variances are provided below.
30 Includes actuals for 2013/14, 2014/15 and forecast figures for 2015/16 31 Includes a forecast of operating expenditure for 2015/16
Allowable Revenue Information for 1 July 2016 to 30 June 2019
DM 13379287 Page 30
4.2.2.1 Electricity Market Review
System Management submitted a 2015/16 budget proposal to the IMO on 6 May 2015, as required by section 2.23.9 of the Market Rules. Within the proposal, System Management included an updated estimate for the EMR costs. An additional $0.95 million was added to the proposed operating costs associated with the EMR. These additional costs were required to back fill positions seconded to the PUO and for additional legal and consulting fees to prepare for the transition of System Management to the IMO and more recently, AEMO. As there has been considerable uncertainty around the future operating state of System Management, costs incurred to implement the transition are currently forecast as under budget.
4.2.2.2 Labour
Labour costs were more than the AR3 approval due to costs incurred during the System Management organisational restructure in 2013. Note: System Management anticipates further increases in 2015/16 as a result of the EMR outcome however these have not been included in the forecast as the effects and amount are unknown.
4.2.2.3 Functional costs
Costs for additional resources associated with system or market changes during the AR3 period were not incurred as projects were delayed or cancelled pending the results of the EMR.
4.2.2.4 Legal costs
Legal costs were below the approved budget. During the AR3 period, System Management strengthened its focus on working closely with stakeholders to provide direction to the scoping and implementation of Market Rules changes, which reduced the need for legal services. Furthermore, accrued costs for the Ringfencing Audit and legal fees did not eventuate, as System Management underwent an organisational change in 2013; refer to section 2.
4.2.2.5 Business support costs, IT operating costs and insurance
System Management utilises a number of business support services from Western Power in the area of finance, regulation and sustainability, information technology and human resources. In accordance with Western Power’s System Management Segregation Procedures (refer to Appendix B) Western Power has allocated to System Management a fee for these services, beginning in 2015/16.
During the AR3 period IT operating costs were below the approved AR3 budget. This is due to:
• SMARTS licences costs being lower than anticipated
• Reduced IT costs which included a percentage allocated towards training for DTS that was not incurred by System Management
Insurance costs were forecast correctly in the AR3 proposal therefore no material variances were present for the period.
4.2.2.6 Operating expenditure to support capital expenditure
This section provides a summary in relation to operating expenditure costs relating to the capital investment projects outlined in Section 4.2.1. These are operational costs (functional or labour costs) that are connected to specific capital expenditure projects:
• SMARTS security assessment – slight underspend due to project costs being over estimated.
Allowable Revenue Information for 1 July 2016 to 30 June 2019
DM 13379287 Page 31
• SMARTS test environment – this project did not incur any costs as no system upgrades that resulted in testing environments were required during the AR3 period.
• IMO outbound – this project did not incur any operating costs as it was deferred due to potential changes to System Management as a result of the EMR.
• SMARTS – this project incurred costs associated with SMARTS implementation during 2013/14 that had not been included in the AR3 determination. These included costs associated with maintenance and updates to the SMARTS system.
Allowable Revenue Information for 1 July 2016 to 30 June 2019
DM 13379287 Page 32
PART B: EXPENDITURE PROPOSAL
Allowable Revenue Information for 1 July 2016 to 30 June 2019
DM 13379287 Page 33
5 Business drivers and investment objectives This chapter outlines the key business drivers for System Management. It describes how these have informed System Management’s objectives for the AR4 proposal and why this is an efficient approach, which will deliver benefits for Market Participants.
Key messages • System Management functions are defined in the Market Rules and Market Procedures
• Changes to the electricity market requirements drive changes to System Management’s processes, procedures and IT systems
• The implementation of enhancements to market operation is a major driver for the business, and it is essential that System Management is well positioned to support them
• The transition of System Management to AEMO is a key driver for some business investment objectives to continue BAU activities. System Management’s transition to AEMO will result in long term efficiencies being achieved whilst balancing security and cost efficiency and delivering the intended economic outcomes
System Management key drivers and benefits As the operator of the SWIS and provider of supporting services to the WEM, System Management’s functions are defined in the current Market Rules and Market Procedures. To enable it to meet its market obligations System Management utilises its assets (market IT systems and associated business processes and procedures).
Usually, the most significant business driver for System Management comes from the changes to the Market Rules. Many of these changes require System Management to make significant amendments to its IT systems, business processes and procedures. For the AR4 proposal, additional key drivers include the EMR reform outcomes and the transfer of System Management to AEMO.
System Management’s transition to AEMO will realise a range of benefits by bringing together the market operation and system operation functions into one organisation to function as an independent system operator for the WEM. The AR4 investment proposal contains forecast costs that will enable realisation of these benefits, such as, expenditure to recruit additional controllers to man a security desk. These additional resources, within the combined organisation, will facilitate better control over optimising dispatch outcomes and commercial outcomes for the market. Importantly, expenditure is also included to ensure sufficient capacity and capability for the system operator function to perform independently of Western Power. As a result, the market will have the benefit of a truly independent system operator.
Additional business drivers include the need to ensure IT systems and processes keep pace with the increasing complexities of the market and the increased market activity, as the volume and diversity of Market Participants increases.
These drivers are detailed in the following sections.
5.1.1 Enhancements to the Wholesale Electricity Market Since inception of the WEM in 2006, around 16932 Rule changes have been implemented. These changes focused on refining existing requirements to provide clarity on stakeholders’ obligations and 32 To the end of December 2015
Allowable Revenue Information for 1 July 2016 to 30 June 2019
DM 13379287 Page 34
enable the market to operate efficiently. System Management has had to consider and, if required, implement the following for each Rule change:
• changes to processes, including the PSOPs (which define the processes required to fulfil Rule obligations);
• changes to systems; and
• monitoring of compliance, to ensure Rule changes are embedded and become BAU.
As a result of the EMR reform, System Management anticipates major structural changes, which will drive corresponding changes to operations.
5.1.2 Supporting effective and accountable system operations As the WEM has matured, System Management’s operations are required to occur closer to real time and be supported by systems which are effective and deliver efficiencies.
System Management will:
• Invest in enhancements to existing systems to improve market process efficiency and reduce compliance risk and security risk
• Incrementally develop IT system in response to specific Rules changes and, as far as possible, build on investments in SOCCUI systems
Additionally, System Management will need to replace SMARTS hardware during the AR4 period.
Specific Market Rule changes will result in costs associated with enhancing the existing, or implementing new, IT systems. Ideally, Market Participants will assess the costs of Rule changes against the benefits they will deliver.
Investment objectives System Management’s investment objectives articulate the outcomes it is seeking to achieve through its investments during the AR4 period. These are identified below and are similar to the objectives System Management adopted for the AR3 period:
• Meeting customer requirements for performance and value – to invest efficiently to enable it to provide the services required by its stakeholders at the quality level demanded, while being mindful to minimise the cost to Market Participants.
• Compliance - to invest efficiently to ensure that it is compliant with Market Rules and operating procedures.
• Supporting market enhancements - to invest efficiently to support changes to the Market Rules and act as a partner in the development of the market.
• Improving process efficiency – to invest efficiently to improve processes and systems that will lead to a lower cost of service for Market Participants over time.
• Updating IT systems – to invest and update depreciated IT systems and assets during the AR4 period.
Investment governance System Management, at the time of this proposal, has adopted the Western Power Portfolio Governance Framework (PGF) principles for all investment projects. Any changes to these processes,
Allowable Revenue Information for 1 July 2016 to 30 June 2019
DM 13379287 Page 35
which may result from the transition of System Management to AEMO, are not likely to take effect prior to the end of 2016.
The lifecycle of the capital expenditure projects follows key inputs, outputs and approvals at the end of each phase. The PGF comprises of a six phase model as shown in Appendix F. Preliminary business cases for all major capital expenditure have been progressed through the following PGF checklists:
• An initial strategic alignment assessment that reviews projects on non-financial terms (i.e. strategic alignment, business objectives, risk identification);
• A work planning review - projects that passed the initial assessment are progressed to the Initiation Phase, which addresses both financial (i.e. considering overall costs and funding) and non-financial requirements (i.e. strategic alignment, opportunity self-assessment and customer contracts, if applicable); and
• Preliminary business case, which includes an options analysis for the investment opportunity.
At the start of the AR4 period, each project will commence at Gate 2 (Scoping Phase) and as each project proceeds to Gate 3 (Planning Phase), a revised business case will be prepared for consideration by System Management and AEMO.
Allowable Revenue Information for 1 July 2016 to 30 June 2019
DM 13379287 Page 36
6 Operating expenditure This chapter sets out the operating expenditure System Management will require to provide system operation services during the AR4 period. It also describes:
• How System Management has forecast AR4 operating expenditure
• The activities and disaggregated forecasts for key cost categories
• The basis of changes in operating costs and how cost increases have been offset by efficiency measures.
The approach utilised in arriving at the forecast AR4 operating expenditure consists of rolling forward the most recent actual operating expenditure, i.e. the 2014/15 efficient base year, into future years (applying step changes) then escalating unit rates for operational expenditure categories.
Key messages • During the AR4 period, System Management forecasts that the operating expenditure will
total $37.311 million, compared to actual/forecast expenditure for the AR3 period of $25.639 million.33 The increase is primarily driven by:
• Resourcing requirements which are insufficient to meet current obligations, as noted in the Compliance Audit reports
• Business requirements to operate as an independent system operator entirely separate from Western Power
• Resourcing requirements to facilitate the transition from Western Power to AEMO
• Addressing current operational risks associated with under-staffing including succession planning, backfilling, document management, and training.
• Actual operating expenditure may deviate substantially from this forecast, depending upon the outcomes of the EMR.
Forecasting methods System Management has forecast the operating expenditure using fit-for-purpose methods for each of the three cost types:
• Recurrent costs
• Non-recurrent costs
• Cost adjustments (step changes)
The forecasting methods used reflect the differing cost drivers of each cost type over the three year forecasting period.
6.1.1 Efficient base year System Management considers that costs incurred during 2014/15 reflect an efficient recurrent cost base because:
33 Includes actuals for 2013/14, 2014/15 and forecast figures for 2015/16
Allowable Revenue Information for 1 July 2016 to 30 June 2019
DM 13379287 Page 37
• Operating activities were planned and carried out in accordance with good electricity industry practice, while seeking to achieve the lowest costs, resulting in actual expenditure being lower than the amount approved by the ERA for that year
• There were no capital investments that focussed on enhancements to the existing IT environment that required removal from the cost base. i.e. operating costs associated with implementing capital projects were not incurred in the base year.
Note: 2014/15 was the latest audited financial year in the AR3 period. Following 2014/15, System Management operations and functions will be changing significantly and will potentially affect the 2015/16 figures. Therefore, 2015/16 is not considered appropriate to use as a base year for the AR4 forecast.
6.1.2 Recurrent costs Recurrent operating expenditure is forecast using a base year roll-forward method. This method is appropriate as System Management’s BAU operating expenditure comprises mainly of costs which are typically stable once growth in the operations of System Management has been accounted for. This method is also the accepted standard used by regulated Australian distribution and transmission network businesses for forecasting recurrent operating costs under the National Electricity Rules (NER).
Recurrent network operating expenditure forecasts are based on System Management’s actual 2014/15 costs. These costs are the most up to date information available on which to determine the efficient recurrent cost base. This approach is consistent with the ERA’s considerations in the AR3 determination.
In forecasting recurrent operating expenditure, System Management has:
• used actual 2014/15 costs as the efficient base year to develop the AR4 forecasts;
• adjusted for step changes related to known future changes in practices, functions, obligations and operating environment that affect the scope for recurrent, works as identified by the transition to AEMO and review of future requirements;
• applied input cost escalation to adjust for movements in the market price of goods and services; and
• applied input cost escalation to adjust for movements in the market price of labour.
6.1.3 Non-recurrent costs System Management has taken into consideration that post transition to AEMO, there will be synergies gained such that the level of FTE positions required will be lower with the expectation that existing AEMO roles and capabilities will absorb some System Management duties. The profile over the AR4 period of the proposed resourcing strategy is outlined in Table 12.
6.1.4 Cost adjustments (step changes) System Management has adjusted for step changes related to known future changes in practices, functions, obligations and the operating environment. These are costs that were incurred in the base year (2014/15) that will not be incurred in the AR4 period (negative step changes) or costs that will be incurred in the AR4 period that were not incurred in the base year (positive step changes).
System Management has identified specific changes that will affect operating expenditure requirements in the AR4 period (relative to 2014/15). These include:
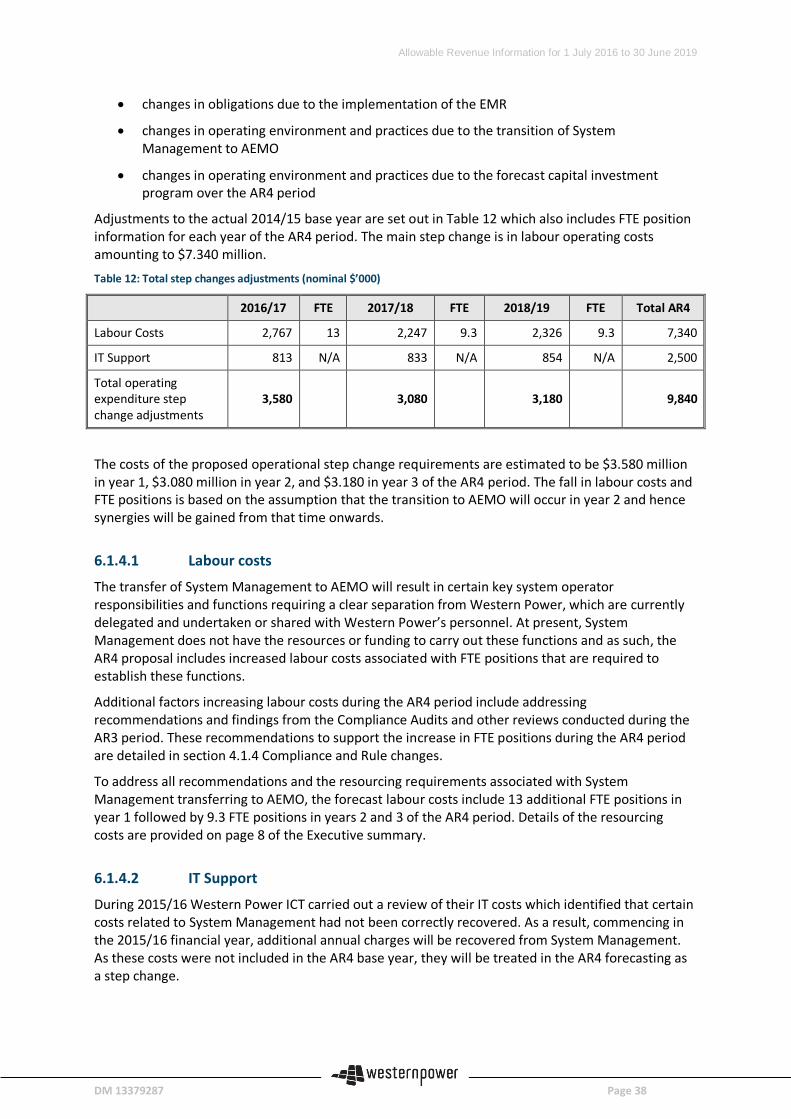
Allowable Revenue Information for 1 July 2016 to 30 June 2019
DM 13379287 Page 38
• changes in obligations due to the implementation of the EMR
• changes in operating environment and practices due to the transition of System Management to AEMO
• changes in operating environment and practices due to the forecast capital investment program over the AR4 period
Adjustments to the actual 2014/15 base year are set out in Table 12 which also includes FTE position information for each year of the AR4 period. The main step change is in labour operating costs amounting to $7.340 million.
Table 12: Total step changes adjustments (nominal $’000)
2016/17 FTE 2017/18 FTE 2018/19 FTE Total AR4
Labour Costs 2,767 13 2,247 9.3 2,326 9.3 7,340
IT Support 813 N/A 833 N/A 854 N/A 2,500
Total operating expenditure step change adjustments
3,580 3,080 3,180 9,840
The costs of the proposed operational step change requirements are estimated to be $3.580 million in year 1, $3.080 million in year 2, and $3.180 in year 3 of the AR4 period. The fall in labour costs and FTE positions is based on the assumption that the transition to AEMO will occur in year 2 and hence synergies will be gained from that time onwards.
6.1.4.1 Labour costs
The transfer of System Management to AEMO will result in certain key system operator responsibilities and functions requiring a clear separation from Western Power, which are currently delegated and undertaken or shared with Western Power’s personnel. At present, System Management does not have the resources or funding to carry out these functions and as such, the AR4 proposal includes increased labour costs associated with FTE positions that are required to establish these functions.
Additional factors increasing labour costs during the AR4 period include addressing recommendations and findings from the Compliance Audits and other reviews conducted during the AR3 period. These recommendations to support the increase in FTE positions during the AR4 period are detailed in section 4.1.4 Compliance and Rule changes.
To address all recommendations and the resourcing requirements associated with System Management transferring to AEMO, the forecast labour costs include 13 additional FTE positions in year 1 followed by 9.3 FTE positions in years 2 and 3 of the AR4 period. Details of the resourcing costs are provided on page 8 of the Executive summary.
6.1.4.2 IT Support
During 2015/16 Western Power ICT carried out a review of their IT costs which identified that certain costs related to System Management had not been correctly recovered. As a result, commencing in the 2015/16 financial year, additional annual charges will be recovered from System Management. As these costs were not included in the AR4 base year, they will be treated in the AR4 forecasting as a step change.
Allowable Revenue Information for 1 July 2016 to 30 June 2019
DM 13379287 Page 39
In summary:
• System Management will incur additional costs to enable it to support the transition to AEMO.
• System Management will continue to incur costs for the additional resourcing required to support the ongoing maintenance and enhancements of the DTS, which was implemented back in the AR2 period.
• System Management will incur costs that have previously been shared with Western Power.
• System Management will incur ICT charges previously covered by Western Power.
• It is expected some of the above FTE positions, identified under the Labour recurrent step changes, will be reduced in years 2 and 3 of the AR4 period due to synergies realised through the transition to AEMO.
Ensuring compliance with Market Rule obligations It is essential for System Management to meet its compliance obligations under the Market Rules. Compliance provides Market Participants with the confidence that they can achieve the best economic outcomes intended by the market design. Compliance audits during the AR3 period identified escalating compliance risks related to resourcing. System Management has addressed this in shaping the operational expenditure requirements for the AR4 proposal.
Error rate reduction, improved service to Market Participants and realising efficiencies Although there is uncertainty surrounding the outcome of the EMR, it is still vital for smooth operation of the WEM and confidence of Market Participants that:
• operational errors rarely occur;
• services are constantly improved for Market Participants; and
• System Management is operating efficiently.
The Compliance Audit report provided recommendations to address various aspects of System Management operations and capital requirements. System Management realises that implementing those recommendations will require reliable and fit for purpose business processes, procedures, systems and a requirement to increase staff levels in some operational areas. System Management has provided cost estimates associated with delivering these processes, procedures and systems (refer to 6.1.4).
6.1.5 Cost Escalators The Following cost escalators have been included in the AR4 proposal
6.1.5.1 Market price of labour
System Management has incorporated forecast movements in the market price of labour into expenditure forecasts. System Management’s labour’s forecasts are based on “The Government of Western Australia’s 2015-16 Budget Paper No.3” (State Budget Paper).34
Table 13 shows the escalation rates applied to the respective periods. 34Forecasts of Labour costs accessed at: http://www.ourstatebudget.wa.gov.au/Budget-Papers/
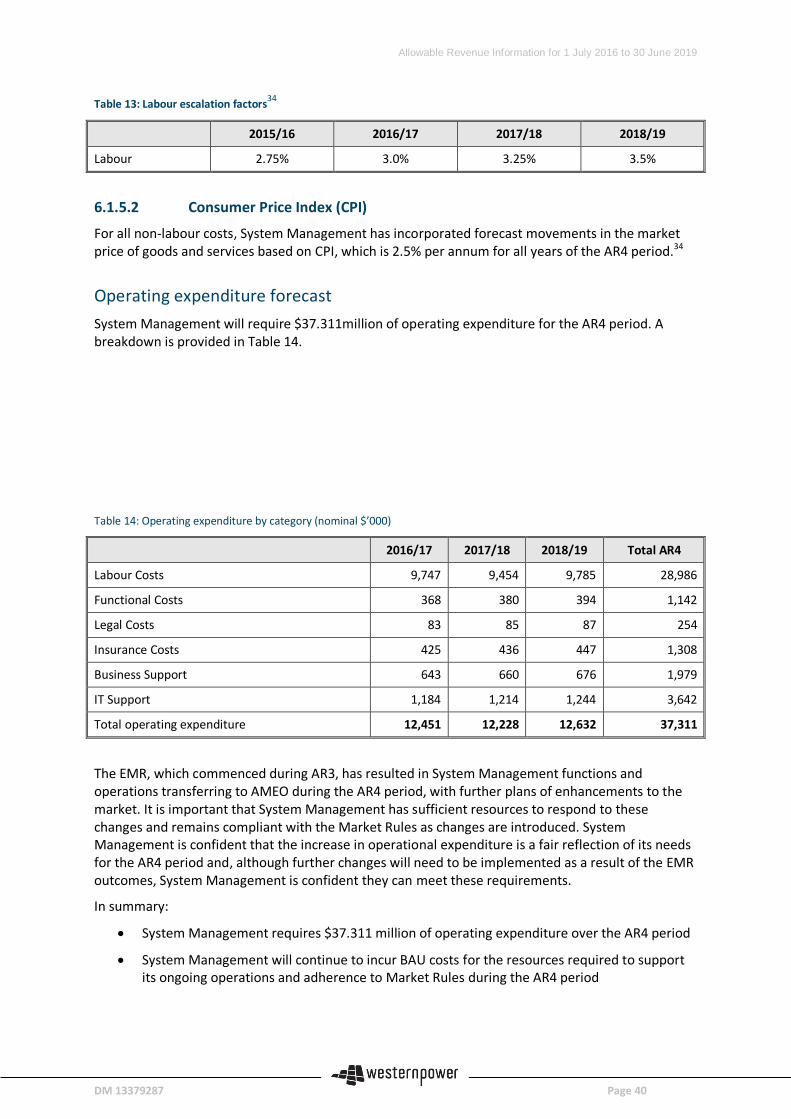
Allowable Revenue Information for 1 July 2016 to 30 June 2019
DM 13379287 Page 40
Table 13: Labour escalation factors34
2015/16 2016/17 2017/18 2018/19
Labour 2.75% 3.0% 3.25% 3.5%
6.1.5.2 Consumer Price Index (CPI)
For all non-labour costs, System Management has incorporated forecast movements in the market price of goods and services based on CPI, which is 2.5% per annum for all years of the AR4 period.34
Operating expenditure forecast System Management will require $37.311million of operating expenditure for the AR4 period. A breakdown is provided in Table 14.
Table 14: Operating expenditure by category (nominal $’000)
2016/17 2017/18 2018/19 Total AR4
Labour Costs 9,747 9,454 9,785 28,986
Functional Costs 368 380 394 1,142
Legal Costs 83 85 87 254
Insurance Costs 425 436 447 1,308
Business Support 643 660 676 1,979
IT Support 1,184 1,214 1,244 3,642
Total operating expenditure 12,451 12,228 12,632 37,311
The EMR, which commenced during AR3, has resulted in System Management functions and operations transferring to AMEO during the AR4 period, with further plans of enhancements to the market. It is important that System Management has sufficient resources to respond to these changes and remains compliant with the Market Rules as changes are introduced. System Management is confident that the increase in operational expenditure is a fair reflection of its needs for the AR4 period and, although further changes will need to be implemented as a result of the EMR outcomes, System Management is confident they can meet these requirements.
In summary:
• System Management requires $37.311 million of operating expenditure over the AR4 period
• System Management will continue to incur BAU costs for the resources required to support its ongoing operations and adherence to Market Rules during the AR4 period
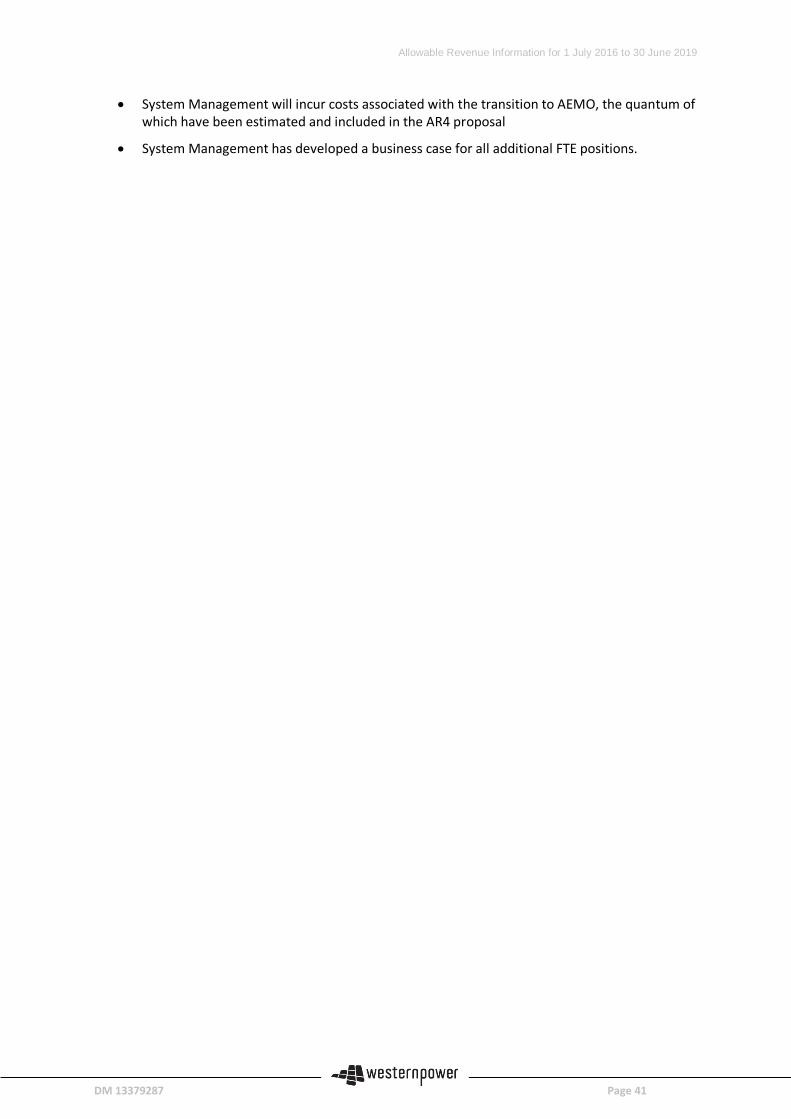
Allowable Revenue Information for 1 July 2016 to 30 June 2019
DM 13379287 Page 41
• System Management will incur costs associated with the transition to AEMO, the quantum of which have been estimated and included in the AR4 proposal
• System Management has developed a business case for all additional FTE positions.
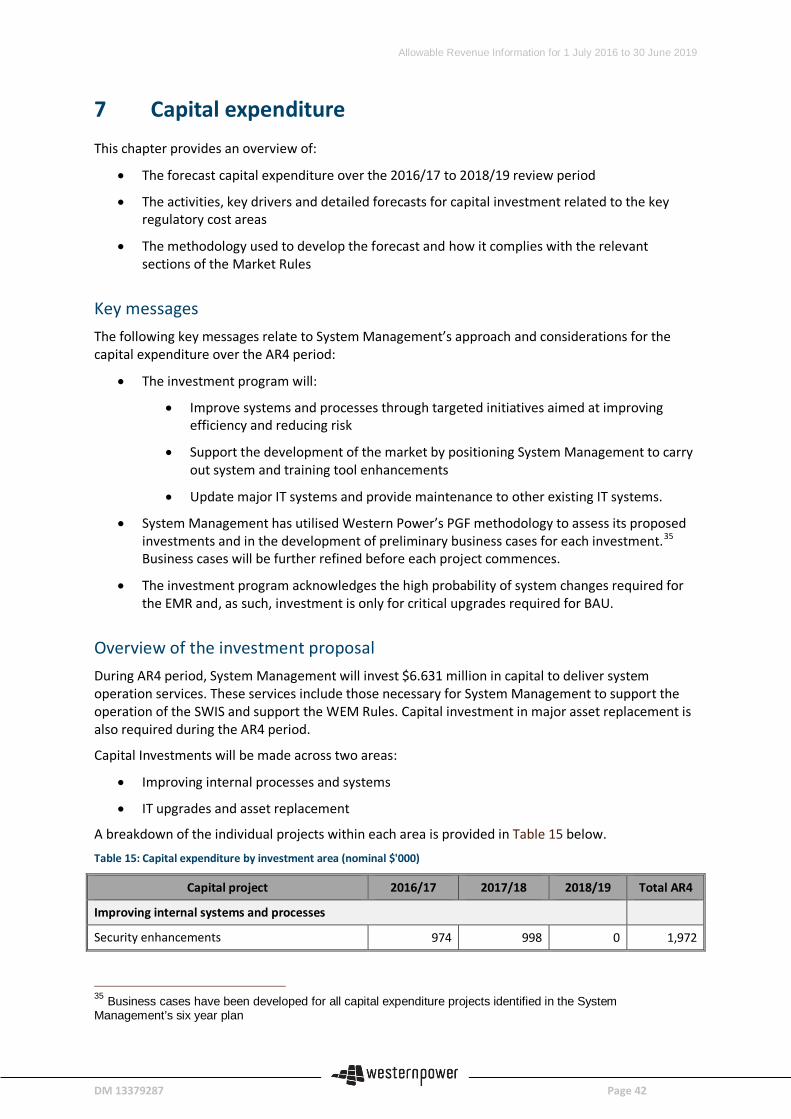
Allowable Revenue Information for 1 July 2016 to 30 June 2019
DM 13379287 Page 42
7 Capital expenditure This chapter provides an overview of:
• The forecast capital expenditure over the 2016/17 to 2018/19 review period
• The activities, key drivers and detailed forecasts for capital investment related to the key regulatory cost areas
• The methodology used to develop the forecast and how it complies with the relevant sections of the Market Rules
Key messages The following key messages relate to System Management’s approach and considerations for the capital expenditure over the AR4 period:
• The investment program will:
• Improve systems and processes through targeted initiatives aimed at improving efficiency and reducing risk
• Support the development of the market by positioning System Management to carry out system and training tool enhancements
• Update major IT systems and provide maintenance to other existing IT systems.
• System Management has utilised Western Power’s PGF methodology to assess its proposed investments and in the development of preliminary business cases for each investment.35 Business cases will be further refined before each project commences.
• The investment program acknowledges the high probability of system changes required for the EMR and, as such, investment is only for critical upgrades required for BAU.
Overview of the investment proposal During AR4 period, System Management will invest $6.631 million in capital to deliver system operation services. These services include those necessary for System Management to support the operation of the SWIS and support the WEM Rules. Capital investment in major asset replacement is also required during the AR4 period.
Capital Investments will be made across two areas:
• Improving internal processes and systems
• IT upgrades and asset replacement
A breakdown of the individual projects within each area is provided in Table 15 below.
Table 15: Capital expenditure by investment area (nominal $'000)
Capital project 2016/17 2017/18 2018/19 Total AR4
Improving internal systems and processes
Security enhancements 974 998 0 1,972
35 Business cases have been developed for all capital expenditure projects identified in the System Management’s six year plan
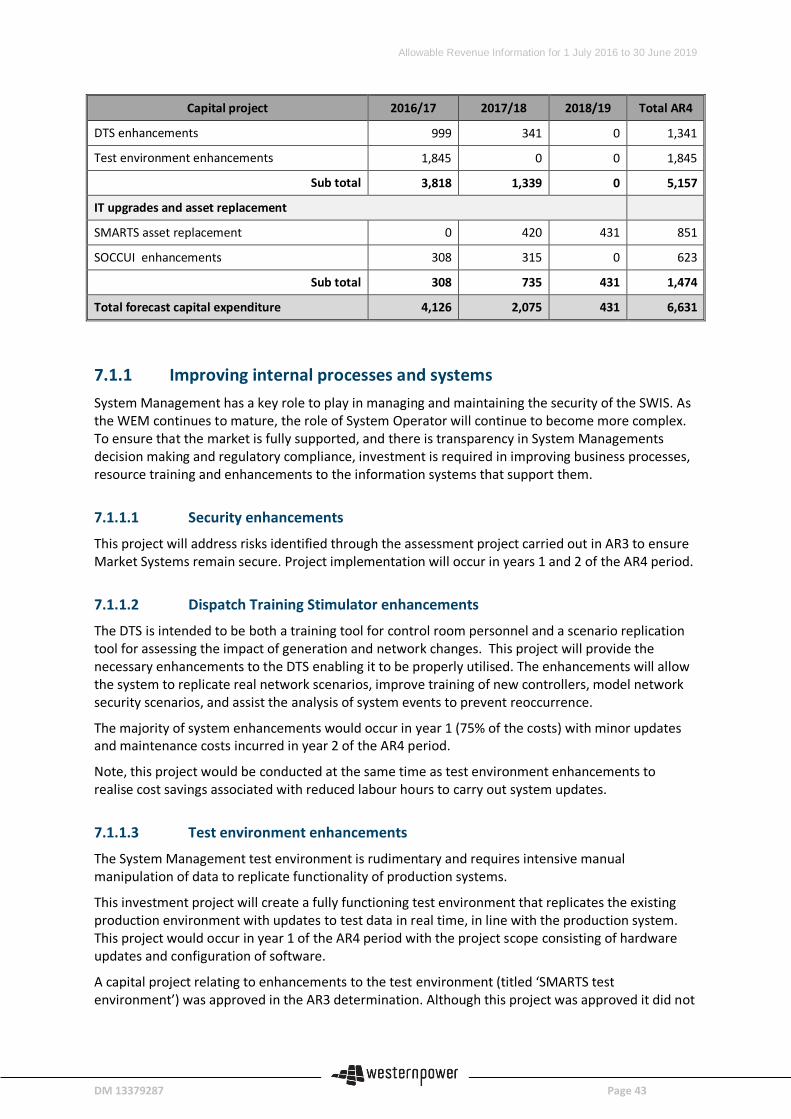
Allowable Revenue Information for 1 July 2016 to 30 June 2019
DM 13379287 Page 43
Capital project 2016/17 2017/18 2018/19 Total AR4
DTS enhancements 999 341 0 1,341
Test environment enhancements 1,845 0 0 1,845
Sub total 3,818 1,339 0 5,157
IT upgrades and asset replacement
SMARTS asset replacement 0 420 431 851
SOCCUI enhancements 308 315 0 623
Sub total 308 735 431 1,474
Total forecast capital expenditure 4,126 2,075 431 6,631
7.1.1 Improving internal processes and systems System Management has a key role to play in managing and maintaining the security of the SWIS. As the WEM continues to mature, the role of System Operator will continue to become more complex. To ensure that the market is fully supported, and there is transparency in System Managements decision making and regulatory compliance, investment is required in improving business processes, resource training and enhancements to the information systems that support them.
7.1.1.1 Security enhancements
This project will address risks identified through the assessment project carried out in AR3 to ensure Market Systems remain secure. Project implementation will occur in years 1 and 2 of the AR4 period.
7.1.1.2 Dispatch Training Stimulator enhancements
The DTS is intended to be both a training tool for control room personnel and a scenario replication tool for assessing the impact of generation and network changes. This project will provide the necessary enhancements to the DTS enabling it to be properly utilised. The enhancements will allow the system to replicate real network scenarios, improve training of new controllers, model network security scenarios, and assist the analysis of system events to prevent reoccurrence.
The majority of system enhancements would occur in year 1 (75% of the costs) with minor updates and maintenance costs incurred in year 2 of the AR4 period.
Note, this project would be conducted at the same time as test environment enhancements to realise cost savings associated with reduced labour hours to carry out system updates.
7.1.1.3 Test environment enhancements
The System Management test environment is rudimentary and requires intensive manual manipulation of data to replicate functionality of production systems.
This investment project will create a fully functioning test environment that replicates the existing production environment with updates to test data in real time, in line with the production system. This project would occur in year 1 of the AR4 period with the project scope consisting of hardware updates and configuration of software.
A capital project relating to enhancements to the test environment (titled ‘SMARTS test environment’) was approved in the AR3 determination. Although this project was approved it did not
Allowable Revenue Information for 1 July 2016 to 30 June 2019
DM 13379287 Page 44
proceed due to the reprioritisation of projects as a result of the EMR. Given the escalating risks of not having a fully functioning test environment, investment for a test environment enhancements project has been included in the AR4 proposal. The scope and requirements for this project have been reviewed since the AR3 proposal and the costs associated with it are considerably higher than the original AR3 capital expenditure project. The increase in project costs are driven by increased labour hours to meet the AR4 project requirements (which are based on current system configurations) and costs associated with the requirement to engage external providers.
7.1.2 IT upgrades and asset replacement System Management is required to update or replace IT systems in order to maintain compliance with the Market Rules. System Management has identified the following system replacements will need to occur during the AR4 period.
7.1.2.1 SMARTS asset replacement
Hardware associated with SMARTS systems was purchased and installed in 2012 and 2013 as part of the MEP. The SMARTS asset has a useful life of 5 years as determined by the ERA in its AR3 determination. To mitigate risks associated with relying on critical hardware beyond its useful life these types of assets need to be assessed and replaced every 5 years. The useful life of SMARTS hardware expires in the second year of the AR4 period (2017/18).
The SMARTS hardware replacement project includes the replacement of dedicated SMARTS hardware with a ‘like for like’ hardware for cost efficiency and ease of installation. The replacement is to be split over years 2 and 3 of the AR4 period.
7.1.2.2 System Operating Command and Control Centre User Interface enhancement
The SOCCUI is Systems Management’s interface for dispatch and system control of the SWIS. The SOCCUI tool was built as an interim measure to accommodate changes resulting from the MEP and was never intended to be a permanent solution. A more robust and adaptable tool is required to ensure System Management is able to maintain system security and reliability obligations in the long term. However, the level of investment required for a replacement tool is not considered warranted given EMR uncertainty. A more conservative approach to enhance the existing SOCCUI tool has therefore been selected with the key investment driver being to maintain System Management’s functions in order to support and operate the SWIS.
This project will be undertaken in years 1 and 2 of the AR4 period.
Forecasting methodology This section describes the methodology and approach used to forecast System Management’s capital investment requirements for the AR4 period.
A two stage process has been used:
• Determine the works required to be undertaken in the period
• Estimate the cost of the required works
The two stages are discussed in the following sections.
Allowable Revenue Information for 1 July 2016 to 30 June 2019
DM 13379287 Page 45
7.1.3 Determining the expected AR4 capital works System Management has forecast the capital projects for AR4 period using a method which involved the following:
• determining the issue or need;
• developing options to address the need;
• costing those options; and
• selecting the lowest sustainable cost option.
7.1.4 Estimating the cost of AR4 capital works System Management has developed a set of cost building blocks for estimating the cost of each project identified in the AR4 application (after selecting the lowest sustainable cost option). They are based on common elements such as IT specialists, planning engineers, software materials and fixed price contracts. The cost building blocks draw from the most relevant costs: either the historical or current contracted cost of a standard design or labour type. These provide a pool of itemised costs suitable for consolidation to form the project costs. By applying this building block approach, System Management ensures the application of consistent cost rates to the different types of projects.
This approach also ensures that the correct escalation rates are applied as necessary. For example, it ensures that fixed price contracts are not escalated, materials costs attract only inflation and the labour costs are escalated in line with the forecast movements in market prices.
Allowable Revenue Information for 1 July 2016 to 30 June 2019
DM 13379287 Page 46
PART C: ALLOWABLE REVENUE
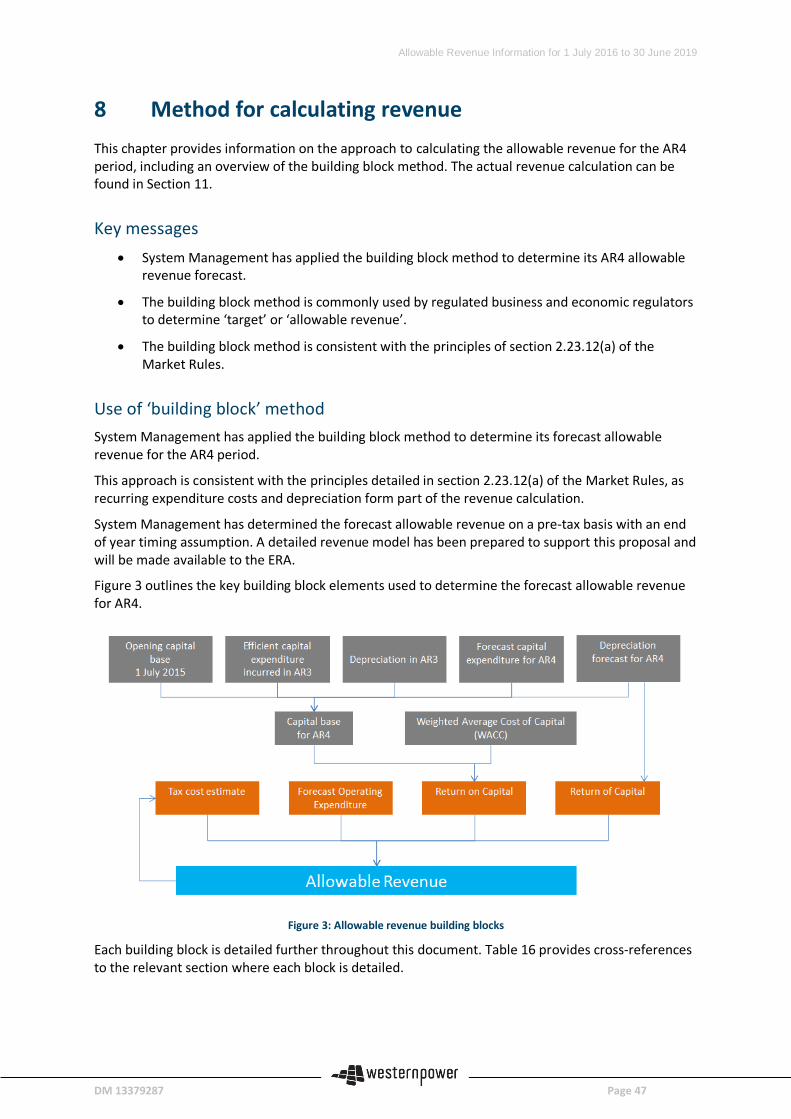
Allowable Revenue Information for 1 July 2016 to 30 June 2019
DM 13379287 Page 47
8 Method for calculating revenue This chapter provides information on the approach to calculating the allowable revenue for the AR4 period, including an overview of the building block method. The actual revenue calculation can be found in Section 11.
Key messages • System Management has applied the building block method to determine its AR4 allowable
revenue forecast.
• The building block method is commonly used by regulated business and economic regulators to determine ‘target’ or ‘allowable revenue’.
• The building block method is consistent with the principles of section 2.23.12(a) of the Market Rules.
Use of ‘building block’ method System Management has applied the building block method to determine its forecast allowable revenue for the AR4 period.
This approach is consistent with the principles detailed in section 2.23.12(a) of the Market Rules, as recurring expenditure costs and depreciation form part of the revenue calculation.
System Management has determined the forecast allowable revenue on a pre-tax basis with an end of year timing assumption. A detailed revenue model has been prepared to support this proposal and will be made available to the ERA.
Figure 3 outlines the key building block elements used to determine the forecast allowable revenue for AR4.
Figure 3: Allowable revenue building blocks
Each building block is detailed further throughout this document. Table 16 provides cross-references to the relevant section where each block is detailed.
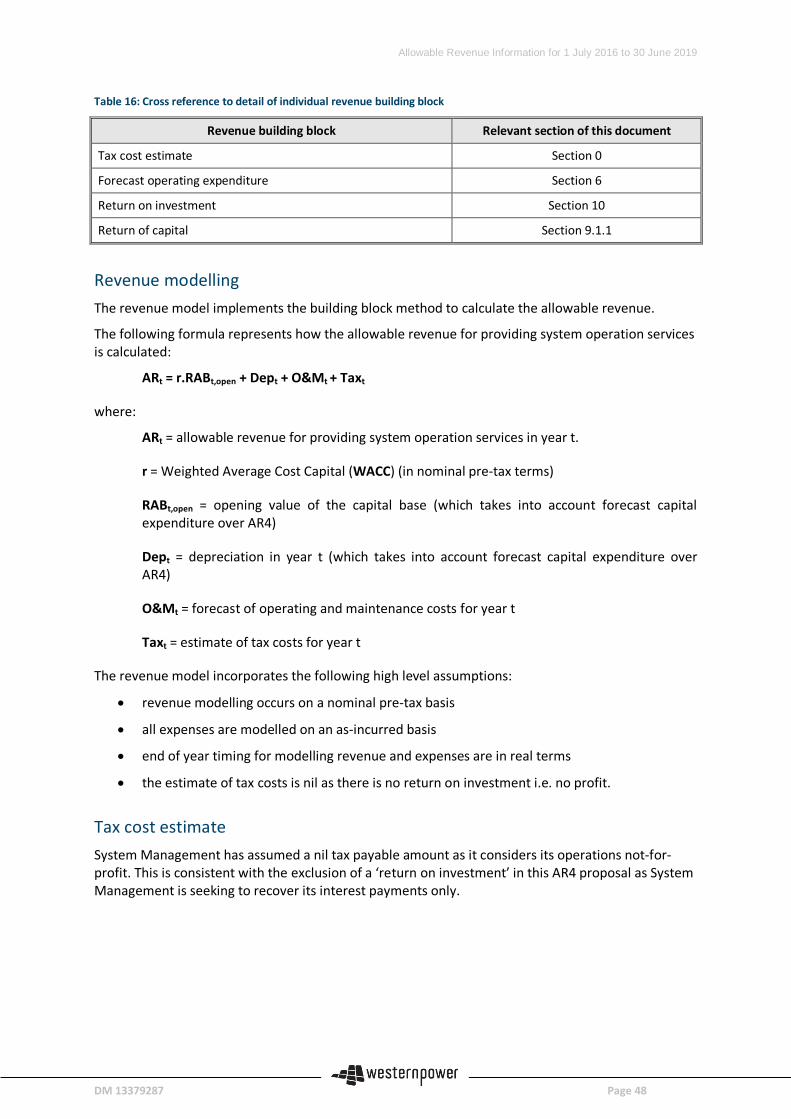
Allowable Revenue Information for 1 July 2016 to 30 June 2019
DM 13379287 Page 48
Table 16: Cross reference to detail of individual revenue building block
Revenue building block Relevant section of this document
Tax cost estimate Section 0
Forecast operating expenditure Section 6
Return on investment Section 10
Return of capital Section 9.1.1
Revenue modelling The revenue model implements the building block method to calculate the allowable revenue.
The following formula represents how the allowable revenue for providing system operation services is calculated:
ARt = r.RABt,open + Dept + O&Mt + Taxt
where:
ARt = allowable revenue for providing system operation services in year t.
r = Weighted Average Cost Capital (WACC) (in nominal pre-tax terms)
RABt,open = opening value of the capital base (which takes into account forecast capital expenditure over AR4)
Dept = depreciation in year t (which takes into account forecast capital expenditure over AR4)
O&Mt = forecast of operating and maintenance costs for year t
Taxt = estimate of tax costs for year t
The revenue model incorporates the following high level assumptions:
• revenue modelling occurs on a nominal pre-tax basis
• all expenses are modelled on an as-incurred basis
• end of year timing for modelling revenue and expenses are in real terms
• the estimate of tax costs is nil as there is no return on investment i.e. no profit.
Tax cost estimate System Management has assumed a nil tax payable amount as it considers its operations not-for-profit. This is consistent with the exclusion of a ‘return on investment’ in this AR4 proposal as System Management is seeking to recover its interest payments only.
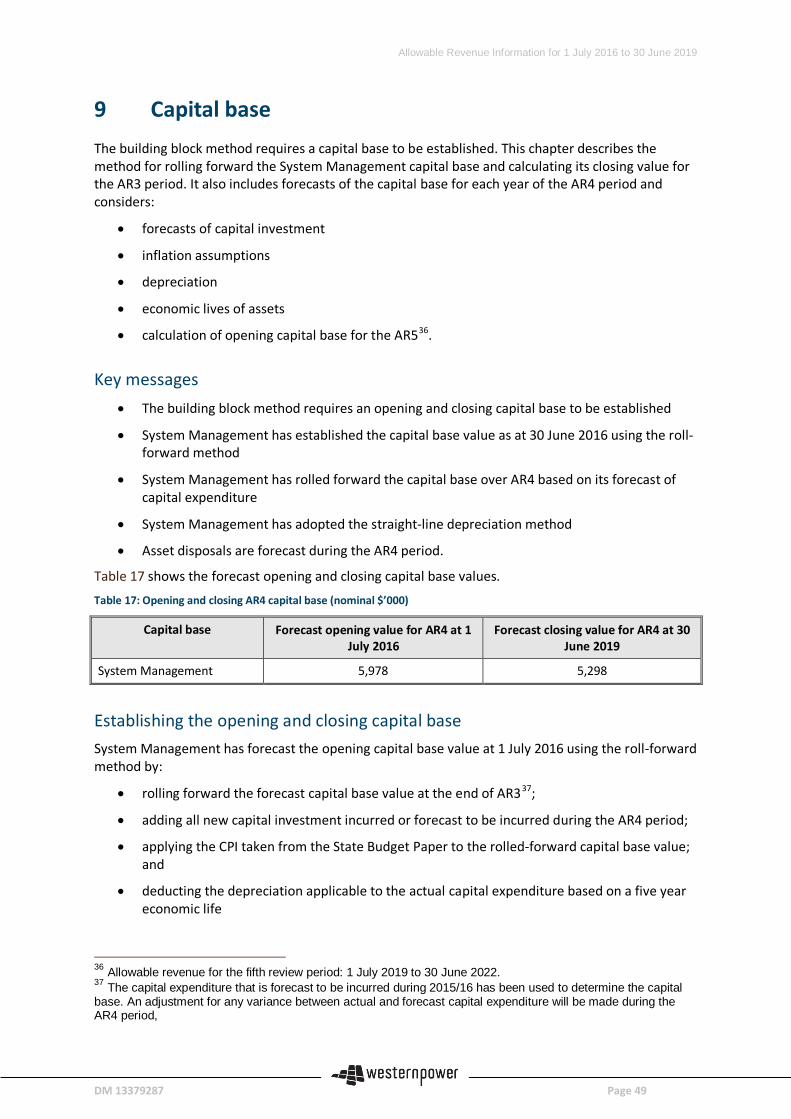
Allowable Revenue Information for 1 July 2016 to 30 June 2019
DM 13379287 Page 49
9 Capital base The building block method requires a capital base to be established. This chapter describes the method for rolling forward the System Management capital base and calculating its closing value for the AR3 period. It also includes forecasts of the capital base for each year of the AR4 period and considers:
• forecasts of capital investment
• inflation assumptions
• depreciation
• economic lives of assets
• calculation of opening capital base for the AR536.
Key messages • The building block method requires an opening and closing capital base to be established
• System Management has established the capital base value as at 30 June 2016 using the roll-forward method
• System Management has rolled forward the capital base over AR4 based on its forecast of capital expenditure
• System Management has adopted the straight-line depreciation method
• Asset disposals are forecast during the AR4 period.
Table 17 shows the forecast opening and closing capital base values.
Table 17: Opening and closing AR4 capital base (nominal $’000)
Capital base Forecast opening value for AR4 at 1 July 2016
Forecast closing value for AR4 at 30 June 2019
System Management 5,978 5,298
Establishing the opening and closing capital base System Management has forecast the opening capital base value at 1 July 2016 using the roll-forward method by:
• rolling forward the forecast capital base value at the end of AR337;
• adding all new capital investment incurred or forecast to be incurred during the AR4 period;
• applying the CPI taken from the State Budget Paper to the rolled-forward capital base value; and
• deducting the depreciation applicable to the actual capital expenditure based on a five year economic life
36 Allowable revenue for the fifth review period: 1 July 2019 to 30 June 2022. 37 The capital expenditure that is forecast to be incurred during 2015/16 has been used to determine the capital base. An adjustment for any variance between actual and forecast capital expenditure will be made during the AR4 period,
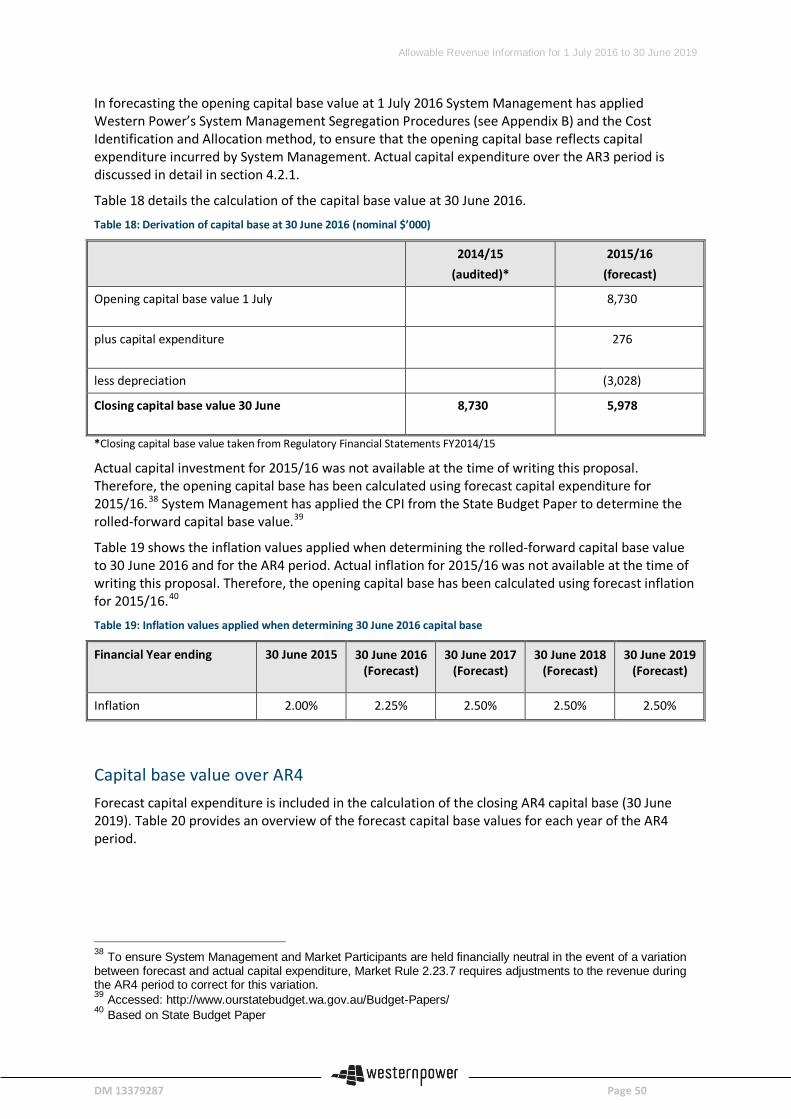
Allowable Revenue Information for 1 July 2016 to 30 June 2019
DM 13379287 Page 50
In forecasting the opening capital base value at 1 July 2016 System Management has applied Western Power’s System Management Segregation Procedures (see Appendix B) and the Cost Identification and Allocation method, to ensure that the opening capital base reflects capital expenditure incurred by System Management. Actual capital expenditure over the AR3 period is discussed in detail in section 4.2.1.
Table 18 details the calculation of the capital base value at 30 June 2016.
Table 18: Derivation of capital base at 30 June 2016 (nominal $’000)
2014/15 (audited)*
2015/16 (forecast)
Opening capital base value 1 July 8,730
plus capital expenditure 276
less depreciation (3,028)
Closing capital base value 30 June 8,730 5,978
*Closing capital base value taken from Regulatory Financial Statements FY2014/15
Actual capital investment for 2015/16 was not available at the time of writing this proposal. Therefore, the opening capital base has been calculated using forecast capital expenditure for 2015/16.38 System Management has applied the CPI from the State Budget Paper to determine the rolled-forward capital base value.39
Table 19 shows the inflation values applied when determining the rolled-forward capital base value to 30 June 2016 and for the AR4 period. Actual inflation for 2015/16 was not available at the time of writing this proposal. Therefore, the opening capital base has been calculated using forecast inflation for 2015/16.40
Table 19: Inflation values applied when determining 30 June 2016 capital base
Financial Year ending 30 June 2015 30 June 2016 (Forecast)
30 June 2017 (Forecast)
30 June 2018 (Forecast)
30 June 2019 (Forecast)
Inflation 2.00% 2.25% 2.50% 2.50% 2.50%
Capital base value over AR4 Forecast capital expenditure is included in the calculation of the closing AR4 capital base (30 June 2019). Table 20 provides an overview of the forecast capital base values for each year of the AR4 period.
38 To ensure System Management and Market Participants are held financially neutral in the event of a variation between forecast and actual capital expenditure, Market Rule 2.23.7 requires adjustments to the revenue during the AR4 period to correct for this variation. 39 Accessed: http://www.ourstatebudget.wa.gov.au/Budget-Papers/ 40 Based on State Budget Paper
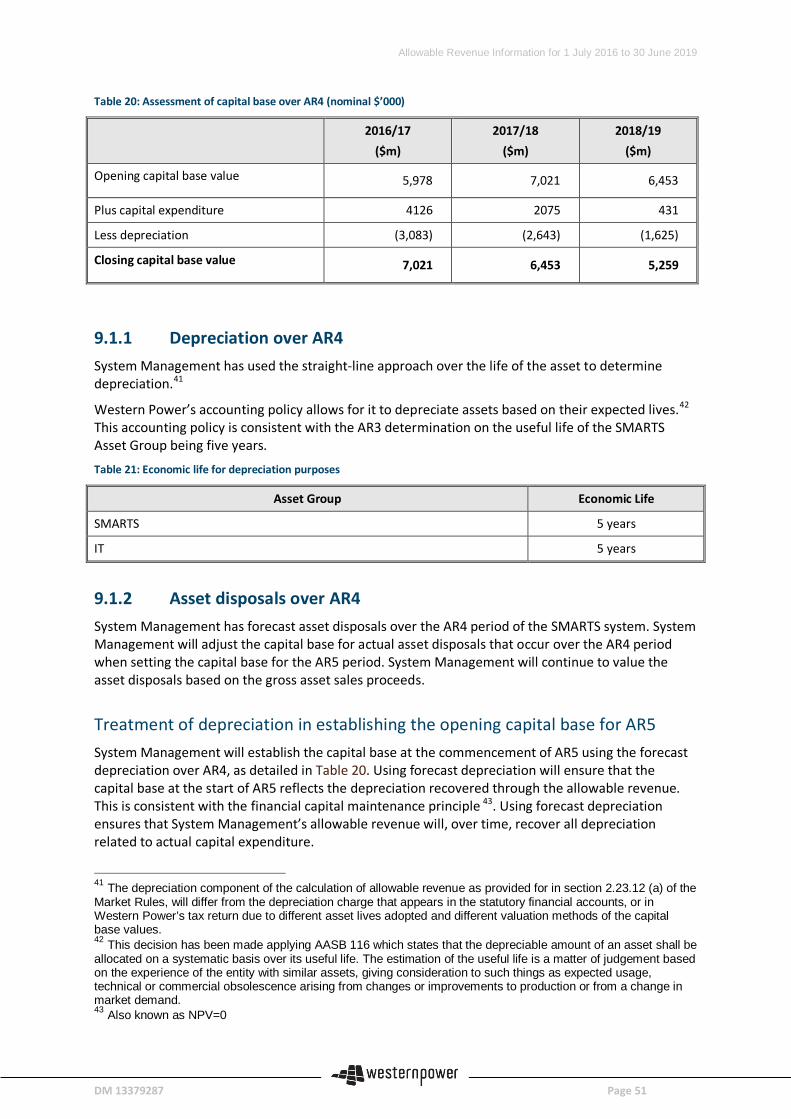
Allowable Revenue Information for 1 July 2016 to 30 June 2019
DM 13379287 Page 51
Table 20: Assessment of capital base over AR4 (nominal $’000)
2016/17 ($m)
2017/18 ($m)
2018/19 ($m)
Opening capital base value 5,978 7,021 6,453
Plus capital expenditure 4126 2075 431
Less depreciation (3,083) (2,643) (1,625)
Closing capital base value 7,021 6,453 5,259
9.1.1 Depreciation over AR4 System Management has used the straight-line approach over the life of the asset to determine depreciation.41
Western Power’s accounting policy allows for it to depreciate assets based on their expected lives.42 This accounting policy is consistent with the AR3 determination on the useful life of the SMARTS Asset Group being five years.
Table 21: Economic life for depreciation purposes
Asset Group Economic Life
SMARTS 5 years
IT 5 years
9.1.2 Asset disposals over AR4 System Management has forecast asset disposals over the AR4 period of the SMARTS system. System Management will adjust the capital base for actual asset disposals that occur over the AR4 period when setting the capital base for the AR5 period. System Management will continue to value the asset disposals based on the gross asset sales proceeds.
Treatment of depreciation in establishing the opening capital base for AR5 System Management will establish the capital base at the commencement of AR5 using the forecast depreciation over AR4, as detailed in Table 20. Using forecast depreciation will ensure that the capital base at the start of AR5 reflects the depreciation recovered through the allowable revenue. This is consistent with the financial capital maintenance principle 43. Using forecast depreciation ensures that System Management’s allowable revenue will, over time, recover all depreciation related to actual capital expenditure.
41 The depreciation component of the calculation of allowable revenue as provided for in section 2.23.12 (a) of the Market Rules, will differ from the depreciation charge that appears in the statutory financial accounts, or in Western Power’s tax return due to different asset lives adopted and different valuation methods of the capital base values. 42 This decision has been made applying AASB 116 which states that the depreciable amount of an asset shall be allocated on a systematic basis over its useful life. The estimation of the useful life is a matter of judgement based on the experience of the entity with similar assets, giving consideration to such things as expected usage, technical or commercial obsolescence arising from changes or improvements to production or from a change in market demand. 43 Also known as NPV=0
Allowable Revenue Information for 1 July 2016 to 30 June 2019
DM 13379287 Page 52
10 Return on investment The rate of return on investment is a determinant of System Management’s revenue. The rate of return is applied to the projected capital base at the beginning of each year for the purpose of determining the return. The return on investment forms part of the building block from which total revenue is calculated.
This chapter details the calculation of System Management proposed rate of return on its capital base during the AR4 period. It explains the methods and assumptions applied to calculating the Weighted Average Cost of Capital (WACC ).
Key messages • System Management has adopted the nominal pre-tax WACC as provided in the AR3
determination.
• The nominal pre-tax WACC assumes a 100% debt component
• The Cost of Debt at 5.35% is consistent with Western Power’s AA3 determination
Why is a WACC appropriate for System Management An appropriate cost of capital ensures that a regulated business recovers the opportunity cost of capital employed to provide regulated services. Earning a return on investment is generally accepted regulatory practice. However, the ERA has determined that System Management should not earn a return on investment, and should only recover its interest payments. System Management has assumed it is 100% debt funded and therefore the WACC is assumed to be equal to the Cost of Debt. This is consistent with the AR3 determination.
The Cost of Debt is consistent with Western Power’s AA3 of 5.35%. Once System Management transfers to AEMO (both operations and system functions by the end of 2018) System Management will use AEMO’s Cost of Debt.
Note: AEMO’s Cost of Debt has not been factored into the allowable revenue forecast model i.e. a WACC of 5.35% has been applied to each year of the AR4 period.
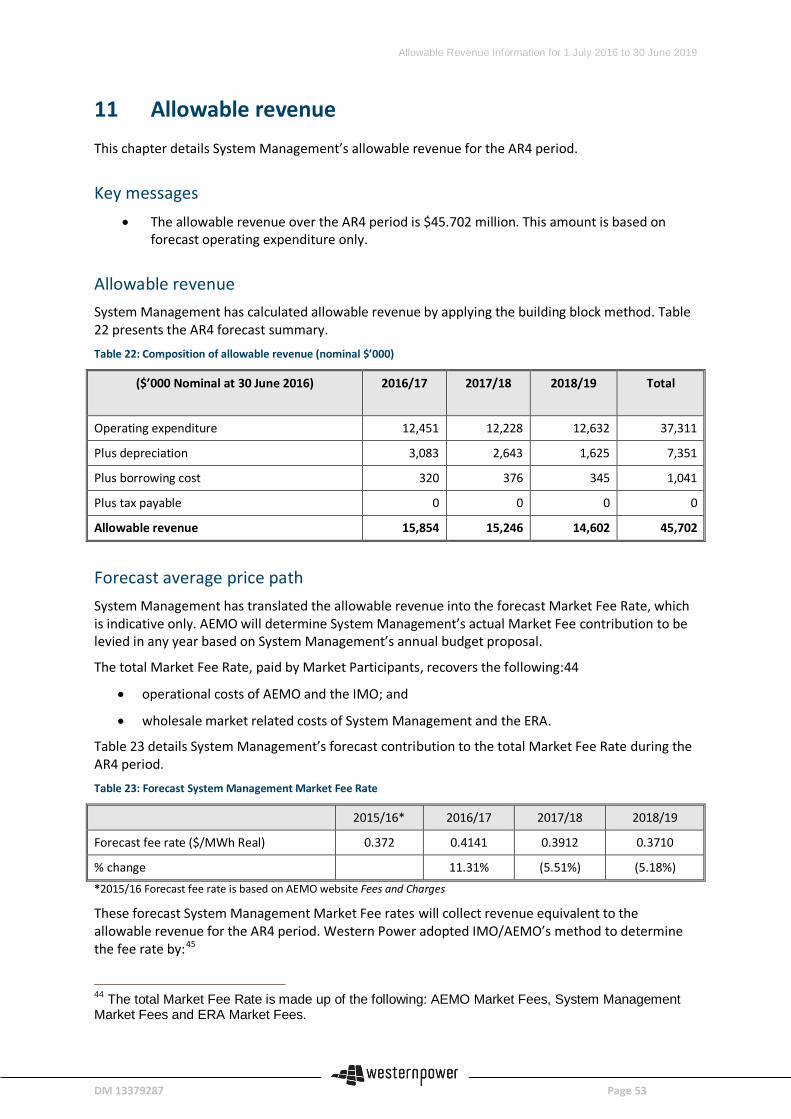
Allowable Revenue Information for 1 July 2016 to 30 June 2019
DM 13379287 Page 53
11 Allowable revenue This chapter details System Management’s allowable revenue for the AR4 period.
Key messages • The allowable revenue over the AR4 period is $45.702 million. This amount is based on
forecast operating expenditure only.
Allowable revenue System Management has calculated allowable revenue by applying the building block method. Table 22 presents the AR4 forecast summary.
Table 22: Composition of allowable revenue (nominal $’000)
($’000 Nominal at 30 June 2016) 2016/17
2017/18
2018/19
Total
Operating expenditure 12,451 12,228 12,632 37,311
Plus depreciation 3,083 2,643 1,625 7,351
Plus borrowing cost 320 376 345 1,041
Plus tax payable 0 0 0 0
Allowable revenue 15,854 15,246 14,602 45,702
Forecast average price path System Management has translated the allowable revenue into the forecast Market Fee Rate, which is indicative only. AEMO will determine System Management’s actual Market Fee contribution to be levied in any year based on System Management’s annual budget proposal.
The total Market Fee Rate, paid by Market Participants, recovers the following:44
• operational costs of AEMO and the IMO; and
• wholesale market related costs of System Management and the ERA.
Table 23 details System Management’s forecast contribution to the total Market Fee Rate during the AR4 period.
Table 23: Forecast System Management Market Fee Rate
2015/16* 2016/17 2017/18 2018/19
Forecast fee rate ($/MWh Real) 0.372 0.4141 0.3912 0.3710
% change 11.31% (5.51%) (5.18%) *2015/16 Forecast fee rate is based on AEMO website Fees and Charges
These forecast System Management Market Fee rates will collect revenue equivalent to the allowable revenue for the AR4 period. Western Power adopted IMO/AEMO’s method to determine the fee rate by:45
44 The total Market Fee Rate is made up of the following: AEMO Market Fees, System Management Market Fees and ERA Market Fees.
Allowable Revenue Information for 1 July 2016 to 30 June 2019
DM 13379287 Page 54
• applying the sent-out energy forecasts in the IMO’s June 2015 ESOO report;
• adopting the calculation of an average (generation) loss factor of 1.0068089 (average for the 2013/14 Reserve Capacity Year) to loss-adjust the ESOO sent-out figure to the Muja reference node; and
• doubling the resultant loss adjusted energy forecast as the fees apply equally across Market Generators and Market Customers.
45 Further information on the IMO/AEMO’s approach to calculating the fee rate is detailed on the IMO website: http://wa.aemo.com.au/home/electricity/market-participants/settlement-information/fees-and-charges
Allowable Revenue Information for 1 July 2016 to 30 June 2019
DM 13379287 Page 55
12 Annual Budget Proposal This chapter details Western Power’s approach to the annual budget proposal throughout the AR4 period.
Key messages • The annual budget proposal includes adjustments to the allowable revenue to compensate
System Management for differences between actual expenditure and forecast expenditure, and actual revenue and allowable revenue.
• System Management will seek reassessment of the allowable revenue if it is likely that the revenue recovered over the AR4 period will be at least 15% greater than the AR4 allowable revenue, or if there is a significant unforeseen event (clause 2.23.8).
Budget proposal content By 30 April each year, System Management must submit a budget proposal to AEMO, as required by section 2.23.5 of the Market Rules.
The content of the budget proposal must include:
• The calculation of the allowable revenue for system operation services for the next financial year using the formulas explained in Section 0 below
• Information supporting how System Management derived the elements of the calculation of allowable revenue for system operation services
• The most up to date forecast of the capital expenditure for system operation services for the next financial year.
Adjustments to annual allowable revenue System Management’s budget proposal will determine the revenue for the next financial year by making adjustments due to differences between actual and forecast expenditure, and actual revenue and allowable revenue.
System Management determines the revenue for the next financial year through the application of the following formula:
AARt = ARt + Kt + Ct + Ot
The purpose of the adjustments is to keep System Management financially neutral for differences between actuals and forecasts. In summary:
• ARt is the allowable revenue determined from the building block method as set out in Section 8 above
• Kt is the adjustment due to differences in the revenue provided for in previous budget proposals and the actual revenue earned by System Management, including allowances for the time value of money
• Ct is the adjustment due to differences in the actual capital expenditure and the capital expenditure forecasts in this allowable revenue application, including allowances for the time value of money
Allowable Revenue Information for 1 July 2016 to 30 June 2019
DM 13379287 Page 56
• Ot is the adjustment due to differences in the actual operating expenditure and the operating expenditure forecasts in this allowable revenue application, including allowances for the time value of money
Reassessment of the Allowable Revenue System Management will apply to the ERA to re-assess the allowable revenue if it becomes likely that the anticipated actual revenue recovered over AR4 will be at least 15% greater than the sum of the allowable revenues set out in Section 0. This is a requirement of section 2.23.8 of the Market Rules. The allowable revenue application46 sets out the detailed formula that applies if this threshold has been exceeded.
46 System Management forecast allowable revenue and capital expenditure application; 1 July 2016 – 30 June 2019
Allowable Revenue Information for 1 July 2016 to 30 June 2019
DM 13379287 Page 57
Allowable Revenue Information Document Index The following documents are referenced in this allowable revenue information document.
Document Title
Reference / Comment
Competitive Balancing and Load Following Rule change
Refer to URL http://imowa.com.au/RC_2011_10
Economic Regulation Authority Refer to URL https://www.erawa.com.au/electricity
Electricity Industry (Wholesale Electricity Market) Regulations 2004
http://www.slp.wa.gov.au/pco/prod/FileStore.nsf/Documents/MRDocument:23752P/$FILE/ElecityIndusWhsaleElecityMarktRegs2004-01-g0-00.pdf?OpenElement
Electricity Market Review Refer to URL https://www.finance.wa.gov.au/cms/Public_Utilities_Office/Electricity_Market_Review/Electricity_Market_Review.aspx
Electricity Networks Access Code 2004 Guidelines for Access Arrangement Information
Refer to URL http://www.erawa.com.au/cproot/9113/2/20101206%20D47095%20Electricity%20Networks%20Access%20Code%202004%20-%20Guidelines%20for%20AAI%20(Version%202).PDF
IMO Final Report: Compliance of System Management with the Market Rules and Market Procedures
Refer to URL http://www.imowa.com.au/docs/default-source/compliance-and-audit/audit-3-2014.pdf?sfvrsn=0
Portfolio Governance Framework (PGF) Refer to document DM 12055731
System Management allowable revenue and forecast capital expenditure application, February 2016
Refer to document DM 13382091
The Government of Western Australia 2015-16 Budget Paper No.3
Refer to URL http://static.ourstatebudget.wa.gov.au/15-16/2015-16-wa-state-budget_bp3.pdf?
Western Power – System Management Segregation Procedure
Refer to document DM 13001899
Allowable Revenue Information for 1 July 2016 to 30 June 2019
DM 13379287 Page 58
List of Figures Figure 1: Total dispatch instructions Issued ....................................................................................... 22 Figure 2: Comparison of approved operating expenditure with AR3 actuals ...................................... 29 Figure 3: Allowable revenue building blocks ...................................................................................... 47 Figure 4: System Management Division (prior to restructure) ........................................................... 66 Figure 5: Network Planning & Operations (post restructure) ............................................................. 67
Allowable Revenue Information for 1 July 2016 to 30 June 2019
DM 13379287 Page 59
List of Tables Table 1: Forecast allowable revenue for AR4 (nominal $’000) .............................................................9 Table 2: Forecast operating expenditure for AR4 (nominal $’000) .......................................................9 Table 3: Forecast capital expenditure for AR4 (nominal $’000) .......................................................... 10 Table 4: Forecast System Management Market Fees ($/MWh Nominal) ........................................... 10 Table 5: Actual expenditure for AR3 compared to approved expenditure (nominal $’000) ................ 25 Table 6: AR3 approved capital expenditure (nominal $’000).............................................................. 25 Table 7: AR3 actual capital expenditure (nominal $’000) ................................................................... 26 Table 8: AR3 consolidating the new market capital expenditure – actual compared to approved ...... 27 Table 9: AR3 Improving internal systems and processes capital expenditure – actual compared to approved .......................................................................................................................................... 27 Table 10: Supporting market development expenditure – actual compared to approved .................. 28 Table 11: Operating expenditure for AR3 – actual compared to approved (nominal $’000) ............... 29 Table 12: Total step changes adjustments (nominal $’000) ............................................................... 38 Table 13: Labour escalation factors ................................................................................................... 40 Table 14: Operating expenditure by category (nominal $’000) .......................................................... 40 Table 15: Capital expenditure by investment area (nominal $'000) ................................................... 42 Table 16: Cross reference to detail of individual revenue building block ............................................ 48 Table 17: Opening and closing AR4 capital base (nominal $’000) ....................................................... 49 Table 18: Derivation of capital base at 30 June 2016 (nominal $’000) ................................................ 50 Table 19: Inflation values applied when determining 30 June 2016 capital base ................................ 50 Table 20: Assessment of capital base over AR4 (nominal $’000) ........................................................ 51 Table 21: Economic life for depreciation purposes ............................................................................ 51 Table 22: Composition of allowable revenue (nominal $’000) ........................................................... 53 Table 23: Forecast System Management Market Fee rate ................................................................. 53 Table 24: PGF sub-portfolios, segments and approver/endorser accountability matrix ................ Error! Bookmark not defined.
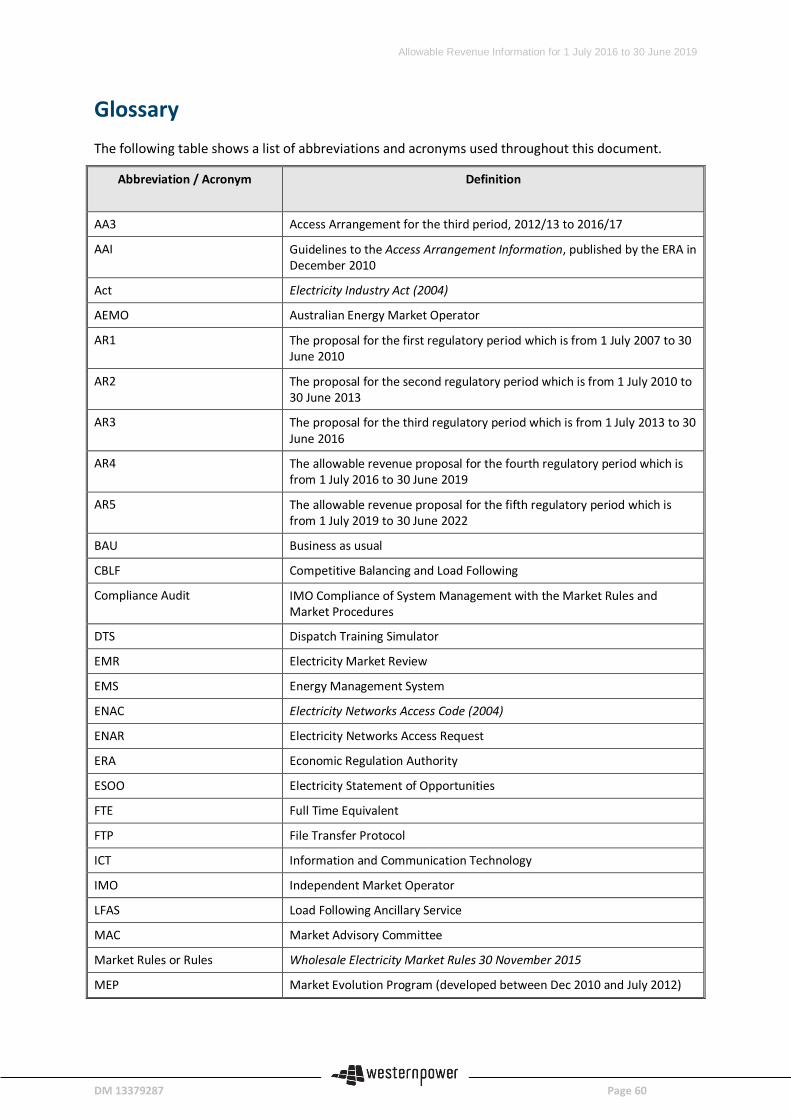
Allowable Revenue Information for 1 July 2016 to 30 June 2019
DM 13379287 Page 60
Glossary The following table shows a list of abbreviations and acronyms used throughout this document.
Abbreviation / Acronym
Definition
AA3 Access Arrangement for the third period, 2012/13 to 2016/17
AAI Guidelines to the Access Arrangement Information, published by the ERA in December 2010
Act Electricity Industry Act (2004)
AEMO Australian Energy Market Operator
AR1 The proposal for the first regulatory period which is from 1 July 2007 to 30 June 2010
AR2 The proposal for the second regulatory period which is from 1 July 2010 to 30 June 2013
AR3 The proposal for the third regulatory period which is from 1 July 2013 to 30 June 2016
AR4 The allowable revenue proposal for the fourth regulatory period which is from 1 July 2016 to 30 June 2019
AR5 The allowable revenue proposal for the fifth regulatory period which is from 1 July 2019 to 30 June 2022
BAU Business as usual
CBLF Competitive Balancing and Load Following
Compliance Audit IMO Compliance of System Management with the Market Rules and Market Procedures
DTS Dispatch Training Simulator
EMR Electricity Market Review
EMS Energy Management System
ENAC Electricity Networks Access Code (2004)
ENAR Electricity Networks Access Request
ERA Economic Regulation Authority
ESOO Electricity Statement of Opportunities
FTE Full Time Equivalent
FTP File Transfer Protocol
ICT Information and Communication Technology
IMO Independent Market Operator
LFAS Load Following Ancillary Service
MAC Market Advisory Committee
Market Rules or Rules Wholesale Electricity Market Rules 30 November 2015
MEP Market Evolution Program (developed between Dec 2010 and July 2012)
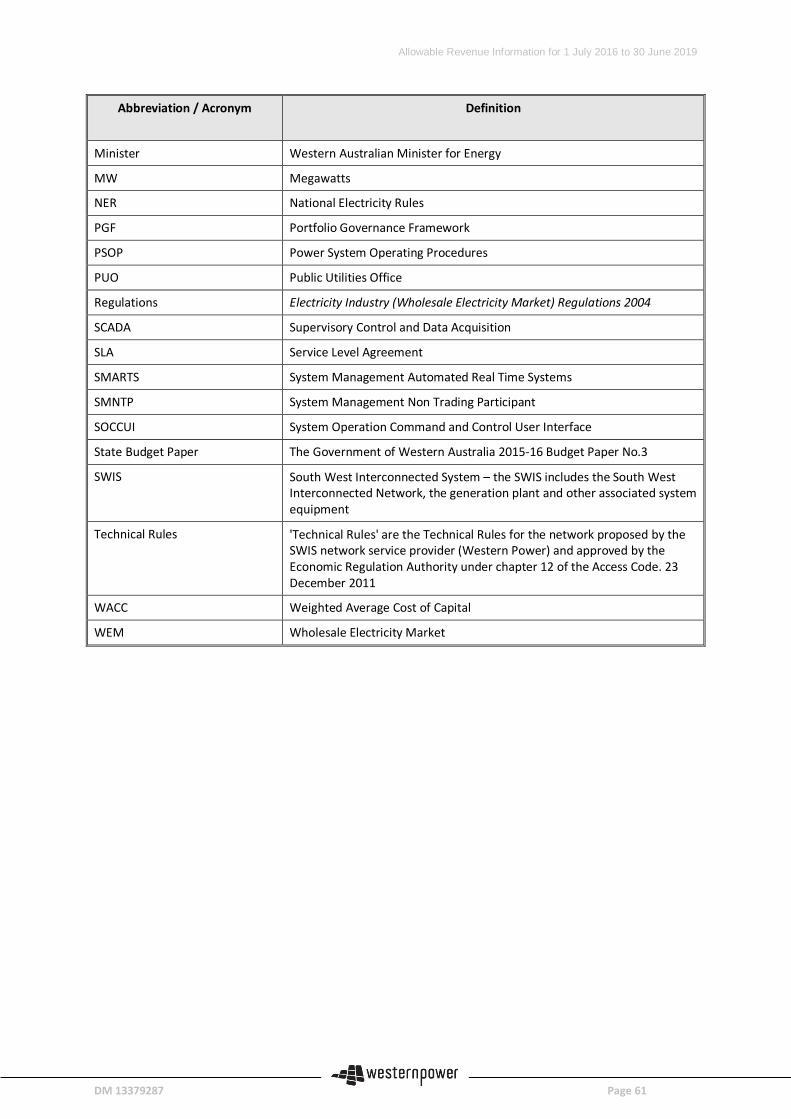
Allowable Revenue Information for 1 July 2016 to 30 June 2019
DM 13379287 Page 61
Abbreviation / Acronym
Definition
Minister Western Australian Minister for Energy
MW Megawatts
NER National Electricity Rules
PGF Portfolio Governance Framework
PSOP Power System Operating Procedures
PUO Public Utilities Office
Regulations Electricity Industry (Wholesale Electricity Market) Regulations 2004
SCADA Supervisory Control and Data Acquisition
SLA Service Level Agreement
SMARTS System Management Automated Real Time Systems
SMNTP System Management Non Trading Participant
SOCCUI System Operation Command and Control User Interface
State Budget Paper The Government of Western Australia 2015-16 Budget Paper No.3
SWIS South West Interconnected System – the SWIS includes the South West Interconnected Network, the generation plant and other associated system equipment
Technical Rules 'Technical Rules' are the Technical Rules for the network proposed by the SWIS network service provider (Western Power) and approved by the Economic Regulation Authority under chapter 12 of the Access Code. 23 December 2011
WACC Weighted Average Cost of Capital
WEM Wholesale Electricity Market
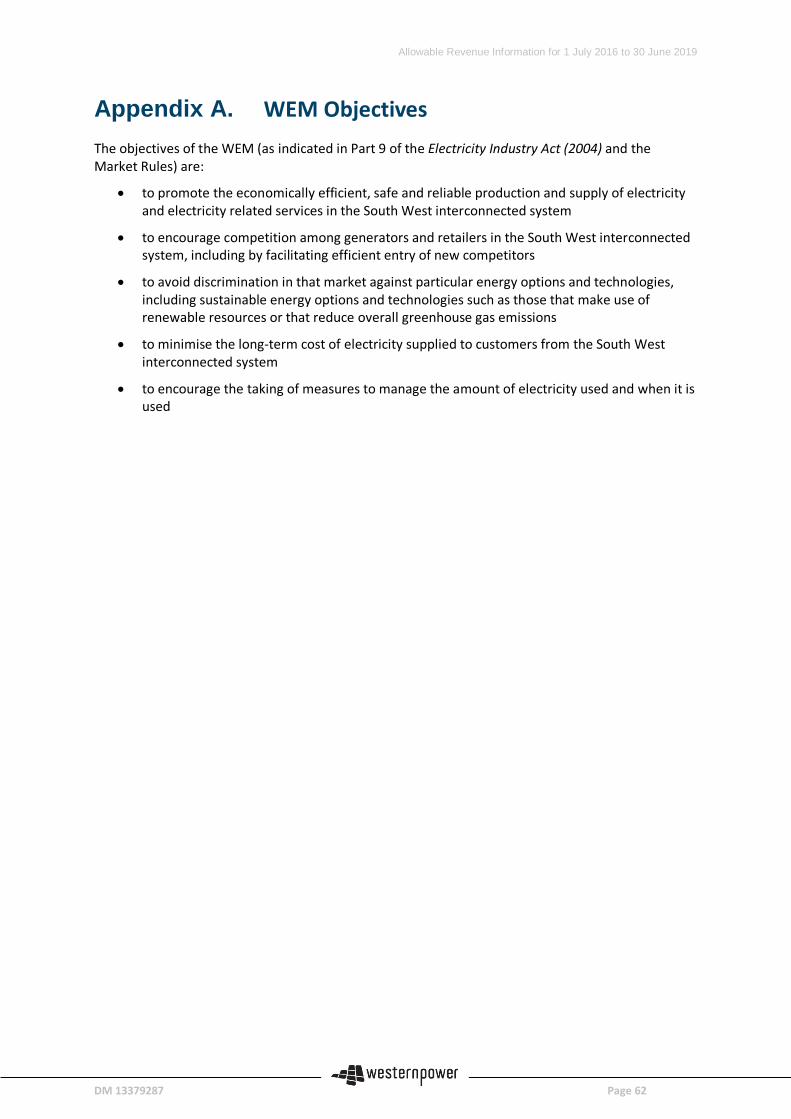
Allowable Revenue Information for 1 July 2016 to 30 June 2019
DM 13379287 Page 62
Appendix A. WEM Objectives The objectives of the WEM (as indicated in Part 9 of the Electricity Industry Act (2004) and the Market Rules) are:
• to promote the economically efficient, safe and reliable production and supply of electricity and electricity related services in the South West interconnected system
• to encourage competition among generators and retailers in the South West interconnected system, including by facilitating efficient entry of new competitors
• to avoid discrimination in that market against particular energy options and technologies, including sustainable energy options and technologies such as those that make use of renewable resources or that reduce overall greenhouse gas emissions
• to minimise the long-term cost of electricity supplied to customers from the South West interconnected system
• to encourage the taking of measures to manage the amount of electricity used and when it is used
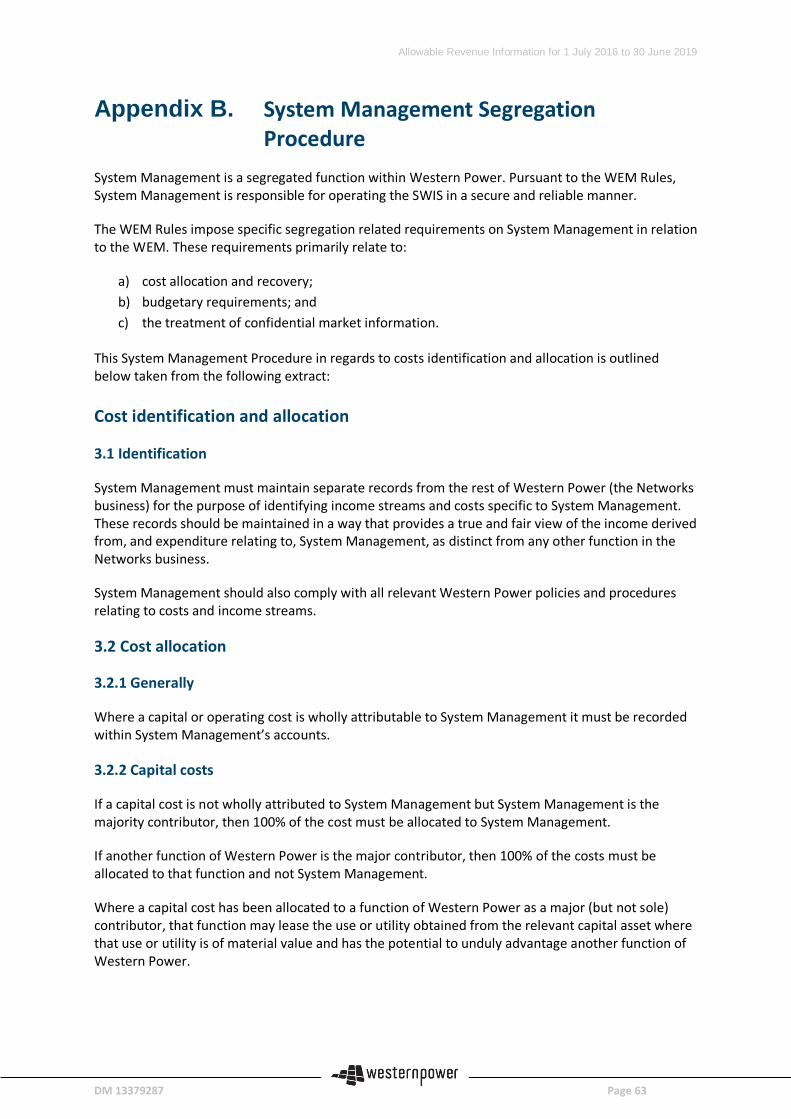
Allowable Revenue Information for 1 July 2016 to 30 June 2019
DM 13379287 Page 63
Appendix B. System Management Segregation Procedure
System Management is a segregated function within Western Power. Pursuant to the WEM Rules, System Management is responsible for operating the SWIS in a secure and reliable manner.
The WEM Rules impose specific segregation related requirements on System Management in relation to the WEM. These requirements primarily relate to:
a) cost allocation and recovery; b) budgetary requirements; and c) the treatment of confidential market information.
This System Management Procedure in regards to costs identification and allocation is outlined below taken from the following extract: Cost identification and allocation
3.1 Identification
System Management must maintain separate records from the rest of Western Power (the Networks business) for the purpose of identifying income streams and costs specific to System Management. These records should be maintained in a way that provides a true and fair view of the income derived from, and expenditure relating to, System Management, as distinct from any other function in the Networks business.
System Management should also comply with all relevant Western Power policies and procedures relating to costs and income streams.
3.2 Cost allocation
3.2.1 Generally
Where a capital or operating cost is wholly attributable to System Management it must be recorded within System Management’s accounts.
3.2.2 Capital costs
If a capital cost is not wholly attributed to System Management but System Management is the majority contributor, then 100% of the cost must be allocated to System Management.
If another function of Western Power is the major contributor, then 100% of the costs must be allocated to that function and not System Management.
Where a capital cost has been allocated to a function of Western Power as a major (but not sole) contributor, that function may lease the use or utility obtained from the relevant capital asset where that use or utility is of material value and has the potential to unduly advantage another function of Western Power.
Allowable Revenue Information for 1 July 2016 to 30 June 2019
DM 13379287 Page 64
3.2.3 Operating costs
An operating cost of material nature1 must be attributed to System Management either by direct allocation or indirect allocation. 47
Costs of a material nature that cannot be directly attributed to System Management must be allocated indirectly (see chapter 3.4).
Where there is any doubt as to the allocation of a cost either directly or indirectly, the Finance, Treasury and Risk function with Western Power must be consulted for advice.
3.3 Direct cost allocation
A direct cost is one that can be linked to a specific piece of work and, therefore, can be directly booked to a works program work order.
Direct costs may include, for example:
a) labour costs within System Management where:
i. an employee works solely for System Management; or
ii. an employee works for both System Management and a function of the Networks business, where the time allocation between the functions is determined in accordance with chapter 3.4 of these procedures; and
b) where goods and services are invoiced directly to, and wholly consumed by, System Management.
Direct costs must be directly allocated to System Management within the accounts ledger.
3.4 Indirect cost allocation
Indirect costs are costs that cannot be linked to a specific piece of work and therefore cannot be directly booked to a works program work order.
Western Power must allocate System Management indirect costs in accordance with the CRAM.
Any indirect cost that is allocated to System Management must be allocated in a manner that:
a) is fair and reasonable;
b) ensures the substance of the underlying transactions and events is reported; and
c) can be certified by an auditor.
47 The materiality of a cost is determined by applying a test of 2% of the total allowable revenue in the prevailing allowable revenue determination. Operating costs that are below this threshold will not be allocated. 2% was determined on the basis that it provides a reasonable threshold (around $100,000) that balances accuracy with administrative burden and will increase as expenditure increases in nominal terms over time.

Allowable Revenue Information for 1 July 2016 to 30 June 2019
DM 13379287 Page 65
Appendix C. System Management Business unit Main variances between the old System Management Division and the new Network Planning & Operations Business Unit: SCADA maintenance and development personnel moved to ICT, and transmission switching moved to Field Operations. The diagrams below demonstrate variances between the previous and current structure.
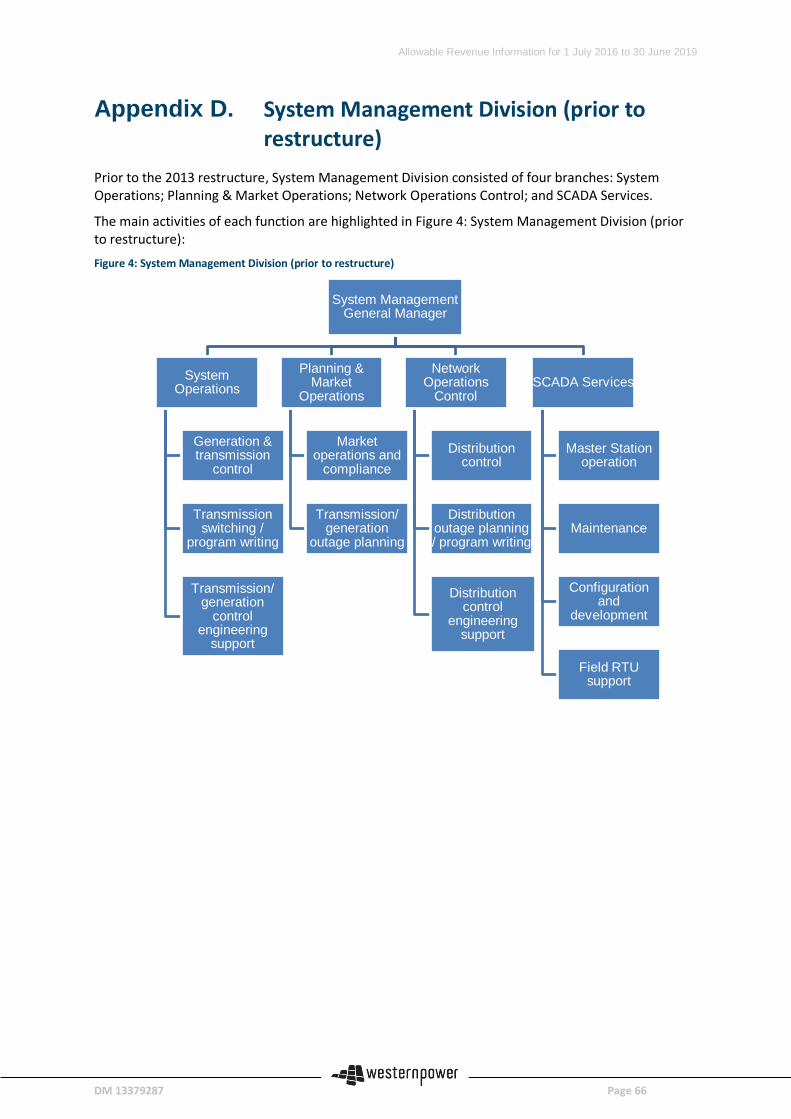
Allowable Revenue Information for 1 July 2016 to 30 June 2019
DM 13379287 Page 66
Appendix D. System Management Division (prior to restructure)
Prior to the 2013 restructure, System Management Division consisted of four branches: System Operations; Planning & Market Operations; Network Operations Control; and SCADA Services.
The main activities of each function are highlighted in Figure 4: System Management Division (prior to restructure):
Figure 4: System Management Division (prior to restructure)
System Management General Manager
System Operations
Generation & transmission
control
Transmission switching /
program writing
Transmission/ generation
control engineering
support
Planning & Market
Operations
Market operations and
compliance
Transmission/ generation
outage planning
Network Operations
Control
Distribution control
Distribution outage planning / program writing
Distribution control
engineering support
SCADA Services
Master Station operation
Maintenance
Configuration and
development
Field RTU support
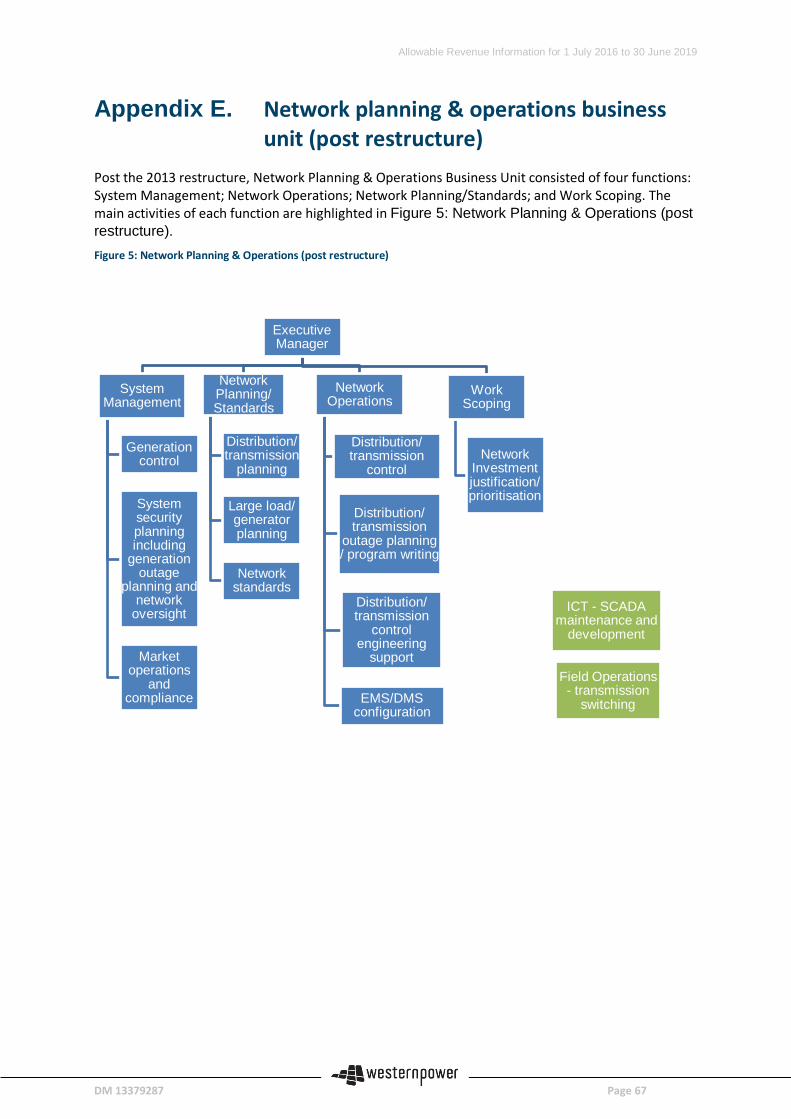
Allowable Revenue Information for 1 July 2016 to 30 June 2019
DM 13379287 Page 67
Appendix E. Network planning & operations business unit (post restructure)
Post the 2013 restructure, Network Planning & Operations Business Unit consisted of four functions: System Management; Network Operations; Network Planning/Standards; and Work Scoping. The main activities of each function are highlighted in Figure 5: Network Planning & Operations (post restructure). Figure 5: Network Planning & Operations (post restructure)
Executive Manager
System Management
Generation control
System security planning including
generation outage
planning and network
oversight
Market operations
and compliance
Network Planning/ Standards
Distribution/ transmission
planning
Large load/ generator planning
Network standards
Network Operations
Distribution/ transmission
control
Distribution/ transmission
outage planning / program writing
Distribution/ transmission
control engineering
support
EMS/DMS configuration
Work Scoping
Network Investment justification/ prioritisation
ICT - SCADA maintenance and
development
Field Operations - transmission
switching
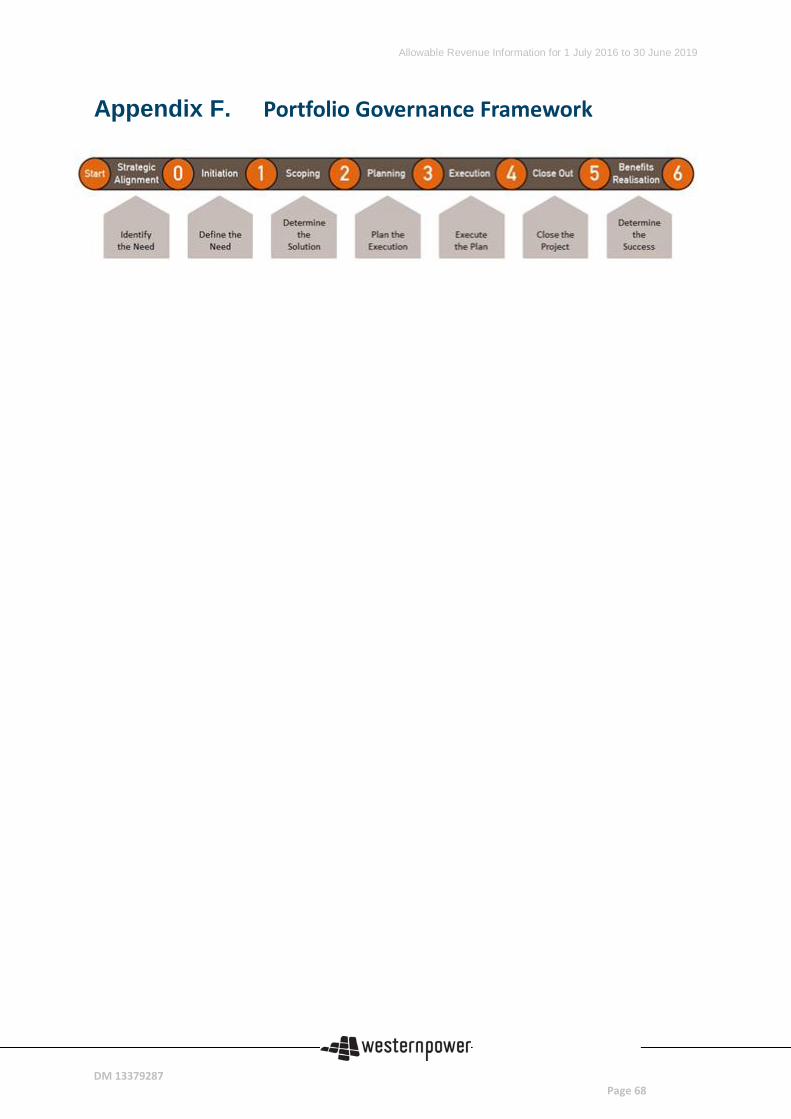
Allowable Revenue Information for 1 July 2016 to 30 June 2019
DM 13379287 Page 68
Appendix F. Portfolio Governance Framework