Embed Size (px)
Citation preview
Journal of Occupational Health Psychology1999, Vol. 4, No. 3,233-244
Copyright 1999 by the Educational Publishing Foundation1076-8998/99/S3.00
System Memory in Violent Incidents:Evidence From Patterns of Reoccurrence
Diane Beale, David Clarke, Tom Cox, Phil Leather, and Claire LawrenceUniversity of Nottingham
For 20% of a sample of 1,078 violent incidents reported in British bars and pubs, another incidentwas reported at the same premises within 6 months. Log-survival analysis revealed nonrandomsequences that demonstrate a system memory effect separate from any biases involving particularvenues. The rate of reoccurrence was not constant during the 6 months following incidents but wassignificantly higher for Weeks \-$, approximated to the mean value for Weeks 5-12, and declinedfor Weeks 13-26. Reoccurrence was particularly likely in the first 3-4 days after an incident. Riskof reoccurrence was further increased for incidents that involved either threats or the exit andreturn of the assailants within that original incident. Results support the view that "violence breedsviolence" and demonstrate the need for increased staff vigilance for up to 12 weeks following aviolent incident, and particularly during the first few days and weeks.
The received wisdom concerning violence em-braces many beliefs that have not been testedscientifically on hard data, and the growing concernfor the serious problem of work-related violence(Flannery, 1996; VandenBos & Bulatao, 1996) hasnot always been matched by an adequate body ofresearch. Recently, however, there have been encour-aging developments in experimental and socialpsychology (see, e.g., Leather, Beale, Lawrence, &Dickson, 1997; Leather & Lawrence, 1995) and inepidemiology through the collection of large bodiesof data (see Kraus & McArthur, 1996; Nigro &Waugh, 1996). It is now becoming more feasible tocarry out systems identification studies to discover the
Diane Beale, David Clarke, Tom Cox, Phil Leather, andClaire Lawrence, Centre for Organizational Health andDevelopment (COHD), School of Psychology, University ofNottingham, Nottingham, United Kingdom.
(Note. COHD is now incorporated in the Institute ofWork, Health and Organisations, University of NottinghamBusiness School.)
• Claire Lawrence is now at Centre for the Study of PublicOrder, University of Leicester, Leicester, United Kingdom.
This study forms part of a program of ongoing researchinto work-related violence, undertaken by the COHD at theUniversity of Nottingham. The COHD is a World HealthOrganization Collaborating Centre in Occupational Health.The research into violence at bars and licensed premises isfacilitated by a grant from Allied Domecq Retailing, thefood and drinks retailing arm of Allied Domecq PLC; wewish to thank Allied Domecq personnel for their continuingsupport.
Correspondence concerning this article should be ad-dressed to Diane Beale, Institute of Work, Health andOrganisations, University of Nottingham Business School,Nottingham NG7 2RD, United Kingdom. Electronic mailmay be sent to [email protected].
characteristics of the processes underlying violentincidents. As each feature is revealed, the set ofpossible processes becomes smaller, until finally thereal mechanism can be specified in detail. The detailsof the process then guide the search for suitablecountermeasures. This challenging of received wis-dom is important for safeguarding the physical andpsychological health of workers and is in the spirit ofthe United States' national strategy, proposed by theNational Institute of Occupational Safety and Health,for the prevention of work-related psychologicaldisorders (Sauter, Murphy, & Hurrell, 1990), asdiscussed by Beale, Cox, Clarke, Lawrence, andLeather (1998).
The feature that this article seeks to question iswhether the "mechanism" of pub violence exhibitssystem memory, that is, whether the past influenceswhat happens next or whether each day is a "wholenew ball game." There is some anecdotal evidencethat "violence breeds violence," but few studies haveadequately described the occurrence of events in timeor established a pattern of reoccurrence. The studydescribed here addressed this problem by usinglog-survival techniques to analyze the time intervalsbetween reported incidents at the same venues todetermine whether the reoccurrence of incidentsoccurs in ways that are not random. If suchnonrandom incidence is found, then it should bepossible to identify those times when the risk ofreoccurrence is highest. Note that this is a separatematter from the occurrence of relatively moreviolence in some times and places than in others. Injust the same way, a dice may show more or less sixesthan chance variation could explain, but quiteseparately (and much more remarkably) could also
233
234 BEALE, CLARKE, COX, LEATHER, AND LAWRENCE
show its sixes bunched together in time. It would thenbe showing a system memory, with or without theseparate feature of bias. The two issues should not beconfused. Previous studies of violence have oftenclaimed to show memory when in fact they have onlyshown bias.
The possibility of a system memory effect forviolent incidents is suggested by social interactionisttheory, which makes the point that violence oftenoriginates in simple grievances and disputes thatescalate over time into something more (Felson &Tedeschi, 1993; Tedeschi & Felson, 1993). Thepotential for violence, in other words, is a fact withinthe system of social relationships. The public house orbar, which is the setting for the incidents in thepresent study, is an environment in which the originor escalation of disputes is particularly likely.
There is much evidence of an anecdotal nature tosuggest that violent incidents at a particular venueoccur in clusters. For example, managers of pubs andbars in the London area of the United Kingdomsurveyed by Hillas, Cox, and Higgins (1988) stated:"Violent outbursts tend to be grouped together, oneoften leading to another, thus I may have 3 incidentsin a week, then none for a month" (p. 9) and"Incidents tend to come and go in cycles. It's possibleto go six months with no incident and then have threein one week" (p. 9). Such perceptions, however, arenot necessarily evidence of memory because suchgroupings would occur as a result of randomfluctuation and bias alone. It is necessary to testwhether such groupings occur significantly moreoften than expected when bias has been taken intoaccount.
These pub managers also appeared to be aware thatthey were more likely than normal to experienceanother such incident in the near future (Hillas et al.,1988, p. 17): "Yes, people are afraid it may happenagain" and "Nobody likes drinking in a rough pubwhere a fight can start any minute." Furthermore,they thought that trade was affected by such incidents,with 45% of managers claiming that their takingsdropped. "Bad reputation, 'good' customers leave,creating a 'void', violence attracts violent people" (p.17). For the majority of these, this effect only lastedfor one or two nights, but in some cases the effectlasted longer.
Although there is a body of anecdotal evidenceconcerning the reoccurrence of incidents at particularvenues, few hard data have been collected. The mostclosely related body of evidence regarding thereoccurrence of violent incidents concerns the victims
of assault, who have been shown to be at increasedrisk of suffering another attack.
Such evidence comes, for example, from theNational Institute of Education's Safe School StudyReport to the Congress (U.S. Department of Health,Education, and Welfare, National Institute of Educa-tion, 1978). The report, based on a survey of 4,000schools in the United States, found that althoughteachers in general were not in much danger of beingattacked or robbed at school, the risk of furthervictimization faced by teachers who had beenvictimized once increased dramatically. Teachers ingeneral had a 1 in 125 chance of being robbed in the2-month survey period; those who had also beenattacked had a 1 in 8 chance of being robbed. Femaleteachers who had been attacked faced a chance ofbeing raped that increased from less than 1 in 1,000 toalmost 1 in 10. It is likely that these results reflectedthe fact that some teachers who were personallyvulnerable, or who worked in very violent schools,were attacked repeatedly, therefore having a greaterrisk of being attacked at any time. The results give noinformation about increased risk for teachers regard-ing the timing of previous incidents, and so cannot beused to infer that one attack increases the likelihoodof a second. Again, what has been shown is probablybias, not necessarily memory.
The 7992 British Crime Survey (Mayhew, AyeMaung, & Mirrlees-Black, 1993) revealed that, inapproximately 1 year, 32% of victims of assaults inand around work and 39% of victims of pub fightswere victimized more than once. However, once againthere is no information about the timings of the repeatvictimizations in relation to previous victimizations.
Brown, Bute, and Ford (1986) reported that, in apostal survey of U.K. social workers, 29% reportedbeing the victim of at least one assault over thepreceding 3 years. Of these, 61% had been assaultedmore than once, which suggests that victims of oneassault were more likely to be the victim of a furtherassault. Breakwell and Rowett (1989) found a similareffect in that, of the 25% of social workers whoreported being assaulted at least once in the previous5 years, 40% had been assaulted more than once.Again there is no information on the times betweenthe assaults.
Violence in B?ars and Licensed Premises
Violence in licensed premises poses a significantthreat to the health and safety of staff, customers, andthe general public as is demonstrated by a variety of
SYSTEM MEMORY IN VIOLENT INCIDENTS 235
national statistics. In the United States, the rate ofworkplace homicide for bartenders is over three times"the national average for workers in general (Jenkins,1996). In New Zealand, Chalmers, Fanslow, andLangley (1995) reported that 10% of hospitaladmissions because of injuries from assault as well as9% of homicides occurred on licensed premises. The7992 British Crime Survey (Mayhew et al., 1993)revealed that 16% of incidents of violence occurred inpubs and clubs, and the 7996 British Crime Survey(Mirlees-Black, Mayhew, & Percy, 1996) indicatedthat one third of assaults by strangers and one fifth ofassaults by acquaintances occurred in or aroundlicensed premises. Also in the United Kingdom,Shepherd, Scully, Shapland, Irish, and Leslie (1988)reported that 39% of injuries from assault presentingat an inner-city hospital for treatment occurred in oraround licensed premises.
Such statistics provide an impetus for researchersof many disciplines to learn as much as possible aboutthe characteristics of violence in bars and pubs inorder to reduce the problem. In particular, it isimportant for pub and bar managers, their staff, andtheir employing organizations to have available asmuch information as possible to help them managethe problem effectively (see Beale et al., 1998;Leather, Cox, & Farnsworth, 1990). The present studyshould help to prepare staff who have suffered oneincident for the likely timing and nature of a furtherincident.
Beale et al. (1998) demonstrated that over a quarter(28%) of violent incidents reported to have occurredin British pubs and bars involved some follow-up orcontinued action after the assailants had exited thepremises. The present article examines evidence of anincreased likelihood of further violence for the weeksfollowing the initial incident, either from the originalaggressors or from other sources. It reports a study ofreported violent incidents that were followed by afurther such incident within 26 weeks (6 months). The
.primary objective was to identify the tell-talesignature in the timing of further incidents thatindicates that a memory effect is at work. A secondaryobjective was to identify any features of initialincidents that increased the likelihood of reoccur-rence and any common features of the subsequentincidents.
The sampling period of 26 weeks was choseninitially as an informed guess, which turned out to becorrect. The techniques we used were initiallydevised for analyzing life span data, and all thatmatters in choosing the sampling period is that it islong enough to capture most of the time intervals in
question. A study of human mortality could follow acohort of individuals for 100 years or 1,000 years—itwould make no difference. The pattern, and thepeople, would have died away in the first 100 years,and further observation would be fruitless. In asimilar way, we assumed in this study that any repeatincidents that occurred in pubs would happen within 6months, after which any further events would showrandom temporal spacing (that is to say, constantprobability with respect to the interval since the lastevent).
Method
The Violent Incidents
The violent incidents were taken from the Keeping PubsPeaceful Incident Report System that operates within AlliedDomecq Retailing (ADR), the major international food anddrinks retailer. ADR has around 13,800 retail outletsworldwide, at least 5,500 in the United States. Its 4,000 pubsand bars in the United Kingdom are spread throughoutEngland, Wales, and Scotland and include a wide variety interms of size, location, and clientele. Around 2,440 of thesehouses are run by managers employed by ADR rather thanself-employed tenants. The reporting system is an integralpart of ADR's ongoing procedure for monitoring problemsin its retail outlets. It was established in 1989 to fulfil one ofthe recommendations of a violence audit, which showed thatthe majority of pubs experienced little physical violence, butthat for a small number there was a significant problem(Hillas et al., 1988). The working definition of violence usedfor the reporting system includes nonphysical as well asphysical violence: Any behavior deliberately intended todamage staff or customers (or pub/brewery property) eitherphysically or psychologically (through abuse or threat).
When a violent incident is reported in one of ADR'smanaged houses, a security manager visits the pub toinvestigate and interview the pub manager and otheremployees involved. These people then assist the securitymanager in completing the Keeping Pubs Peaceful IncidentReport Form (KPP IRF) that is sent to the Incident ReportCentre at the University of Nottingham. Analysis of theincident reports, involving over 230 variables extracted fromthe KPP IRFs, provides information that is fed back tooccupational health practitioners, health and safety officers,trainers, security personnel, and higher management.
There is no perfect way of gathering information aboutlarge numbers of violent incidents, as has been discussed byBeale et al. (1998), who also considered the merits andlimitations of reporting systems. This article describes asmall part of the ongoing study of the Keeping PubsPeaceful Incident Reporting System designed to extend theusefulness of reporting systems in ways that have notpreviously been explored. Other analyses have examined thenature of the incidents in more detail than can be given inthis article (see, e.g., (Beale, 1999; Beale et al., 1998;Lawrence, Beale, Leather, & Dickson, 1999).
In looking at the timing of incidents, the present studyrequired data from a reporting system that was both wellestablished and stable, and from January 1992 to June 1995,this system did remain stable in terms of the numbers, types,
236 BEALE, CLARKE, COX, LEATHER, AND LAWRENCE
and geographical location of incidents reported. Organiza-tional restructuring of ADR toward the end of 1995 caused ashort period of disruption to the system and so prevented thestudy being extended.
All incidents that were reported to have occurred duringthe 3-year period from January 1992 to December 1994were used as initial incidents in this study. Any incident thatoccurred at the same premises within 26 weeks of an initialincident was used as a subsequent incident. Subsequentincidents, therefore, could occur from January 1992 to June1995. To be considered as a subsequent incident rather thanas follow-up action that was part of the initial incident, thesecond incident had to have been reported in a separatereport form (see Beale et al., 1998). Subsequent incidentswere included whether or not they were reported to bedirectly related to the initial incident.
The terms initial and subsequent refer simply to the orderof any pair of incidents occurring consecutively at the samepremises. Thus, for example, if there are three incidents atthe same premises within the study period, the secondincident may be the subsequent incident in one pair and theinitial incident of the next pair. This is appropriate for timeinterval analysis, which does not require the first event of thesequence under study to be special or different in any way.The technique is routinely used for ongoing series of eventssuch as feeding and fasting in animals, and the series can bepicked up at any point. In no way does the validity of thetechnique depend on measuring from the first ever feed. Inlog-survival analysis, an initial event is simply the first ofany pair of successive events from which the time interval ismeasured to the next or subsequent event. That event maythen be used in turn as the initial event of the next timeinterval, and so on.
The 26-week (6-month) time limit for reoccurrence waschosen for two reasons: (a) It provided an optimum numberof initial-subsequent incident pairs within the 3.5-yearperiod of stability for the reporting system, and (b) it was asufficiently long time period to display the expected patternsof reoccurrence. This was an initial parameter estimate toguide the search for a temporal signature. Our resultsconfirmed that the 26-week estimate was appropriate.
Analysis
The two main objectives of the analysis were (a) toexamine the timing of reoccurrences and (b) to explore thenature of initial and subsequent incidents.
Timing of subsequent incidents. This analysis wascarried out using a log-survival technique, which wasoriginally devised to analyze ecological data, particularlylife span data (Clarke & Grassland, 1985; Hutchinson,1978), and is well established in medical epidemiology (Lee& Go, 1997; Marubini & Valsecchi, 1995) and engineering(Kalbfleisch & Prentice, 1980). The technique is applicableto any set of data in which two well-defined events followeach other with a measurable time interval between. Theseevents may be different, such as death following birth or aparticular operation, or they may be similar, for example, theuse of a particular letter or word in language.
If the probability of the second event occurring is constantirrespective of the time since the first event (i.e., reoccur-rence occurs at random), the plot of the percentage of
survivors against time shows an exponential decline, so aplot of the log of the percentage of survivors against time is astraight line with negative gradient. This can be referred toas the "memoryless property of the exponential distribu-tion" (Kalbfleisch & Prentice, 1980, p. 22); in other words,the timing of the second event is unaffected by what hasoccurred previously.
For each week up to 26 weeks, following each initialincident that occurred between January 1992 and December1994, the log of the percentage that had not yet beenfollowed by a subsequent incident was calculated. In thiscase, Iog10 was used, although the technique can utilize anybase for the log. The log percentages were then plottedagainst the number of weeks. If the pattern of reoccurrencehad been random over the 26 weeks, the resulting graphwould be a straight line. Any section of the graph showing asteeper negative gradient indicates an increased likelihoodof the subsequent incidents occurring in that time period.
For each week after the initial incident, a weekly hazardrate for reoccurrence was estimated by dividing the numberof initial incidents surviving to the beginning of that weekwithout reoccurrence by the number of subsequent incidentsoccurring during that week.
When interesting results were obtained from the 26-weekanalysis, a similar analysis was carried out for the 15 daysfollowing each initial incident to obtain a more detailedpicture for that period. Daily hazard rates for reoccurrencewere also calculated for this period.
Nature of initial and subsequent incidents. The secondset of analyses aimed to explore the effect of any systemmemory found in the time interval analysis in terms of thenature of the initial and subsequent incidents in a pair. Toexplore the nature of initial incidents that made a subsequentincident more likely, we compared the characteristics ofincidents that were followed by another incident within 26weeks (initial [followed]) with those that were not (initial[not followed]). To explore how the nature of incidents thatfollowed other incidents might be affected, we compared thecharacteristics of incidents that followed another incidentwithin 26 weeks (subsequent) with those that did not followanother incident within that time (not subsequent). To ensureaccurate discrimination between subsequent and nonsubse-quent incidents within the study period, we also had to takeaccount of incidents that occurred during the 6 months priorto the main study period, that is, July to December 1991.
The characteristics of incidents were described in terms of15 dichotomous variables that indicated the presence (1) orabsence (0) of a particular feature in the report of anincident. These variables were chosen from over 230available from the system as representing general features ofincidents in terms of what happened rather than characteris-tics of particular venues or individuals involved. Alsoincluded was a seriousness score assigned by the reportinglicensee with a range of 0 (trivial) to 10 (the most seriousyou could ever imagine). It has to be acknowledged that thisis a crude measure, but it is rarely practical to includesophisticated measures in operational reporting systems.These variables are described in Table 1. The time betweenincidents at the same premises was represented by twovariables: days to subsequent incident and days since initialincident. £
Two main analytical techniques were used: survivalanalysis and correlation procedures. Survival analysis wasused to examine the whole sample of initial incidents and the
SYSTEM MEMORY IN VIOLENT INCIDENTS 237
Table 1Variables Used in Correlational and Survival Analyses
Variable Description Scoring
Descriptive variablePlanned
Repercussion
InterventionThreatFightAttack on staffAttack on customersAttack on propertyAttack during ejectionAfter fightAfter attack
ReturnStaff injuryCustomer injuryDamage to propertySeriousness
Timing variableDays to subsequent incident
Days since initial incident
Incident considered to be planned criminal activity(e.g., armed robbery)
Incident stated by reporting licensee to be linked to aprevious problem at the premises (not necessarilya previously reported incident)
Staff intervened in the developing situationIncident included threatsIncident included a fight or scuffleIncident included a physical attack on staffIncident included a physical attack on customersIncident included a physical attack on propertyAssailants made an attack while being ejectedFighting continued outside the premises after ejectionAssailants attacked the outside of premises while
leavingAssailants or their associates returned to premises laterAt least one member of staff injuredAt least one customer injuredProperty damagedAssessment of seriousness of incident made by
reporting licensee
0 (absent); 1 (present)
0 (absent); 1 (present)
0 (absent);0 (absent);0 (absent);0 (absent);0 (absent);0 (absent);0 (absent);0 (absent);0 (absent);
1 (present)1 (present)I (present)1 (present)1 (present)1 (present)1 (present)1 (present)1 (present)
0 (absent); 1 (present)0 (absent); 1 (present)0 (absent); 1 (present)0 (absent); 1 (present)0 (trivial) to 10 (the most serious
you could ever imagine)
No. of days from initial incident to subsequent incident 1 to 183; 999 (more than 183days)a
No. of days since initial incident (for subsequent inci- 1 to 183; 999 (more than 183dent) days)a
a The value 999 was used simply to eliminate cases from the analyses. It did not, therefore, affect the means or distribution ofthe variables.
rates over time at which they were followed by subsequentincidents. This analysis compared sets of incidents accord-ing to control variables and so identified any characteristicsof incidents that displayed significantly different reoccur-rence patterns over the 26-week period. The statisticalpackage SPSS, which was used for the analysis, uses (a) theactuarial method described by Berkson and Gage (1950) tocompute the survival functions and (b) the Wilcoxon(Gehan) statistic (see Cox & Oakes, 1984; Kalbfleisch &Prentice, 1980) to determine whether groups differ signifi-cantly in terms of survival.
The phi similarity coefficient (range = 0-1) was chosen•for the majority of correlation analyses, which involved twodichotomous variables. Pearson product-moment correla-tion was used for those analyses that involved variableswhose distribution approximated sufficiently to normal:seriousness (N = 746,kurtosis = —.680, skewness = —.105)and days to subsequent incident/days since initial incident(N= 220, kurtosis = -.886, skewness = .594). The vari-ables that were examined are given in Table 1. It is importantto note that the repercussion variable relates to whether theincident report stated that the incident was directly linked toa previous problem event at the premises. This previousevent might be a reported incident or might be an event thatwas not reported, perhaps because it was not, of itself,sufficiently serious.
Results
Timing of Reoccurrences
There were 1,082 reported incidents occurringbetween January 1992 and December 1994 in the2,440 managed houses, giving a mean weekly rate of
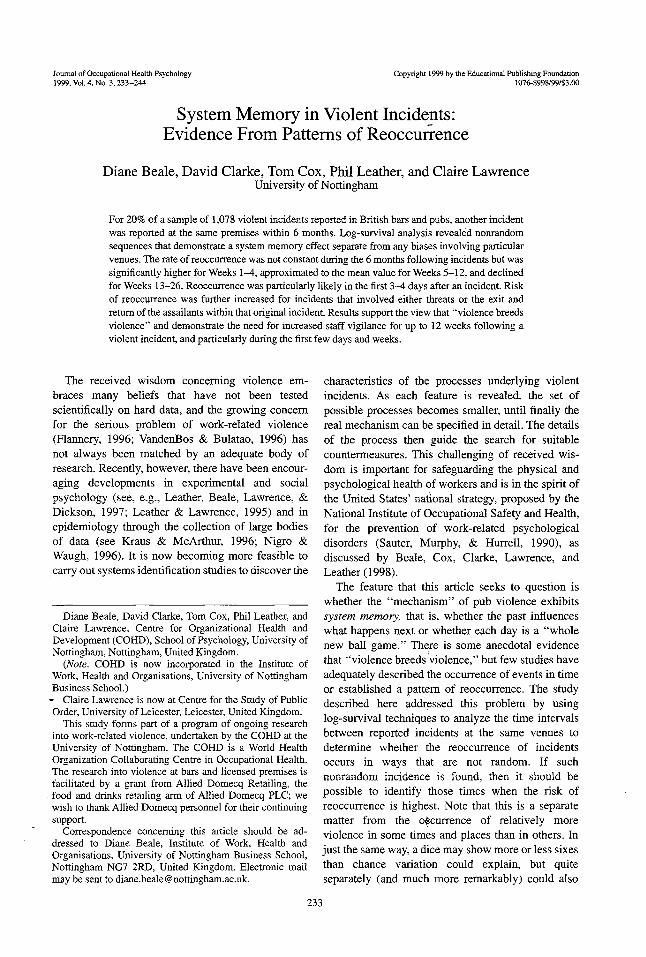
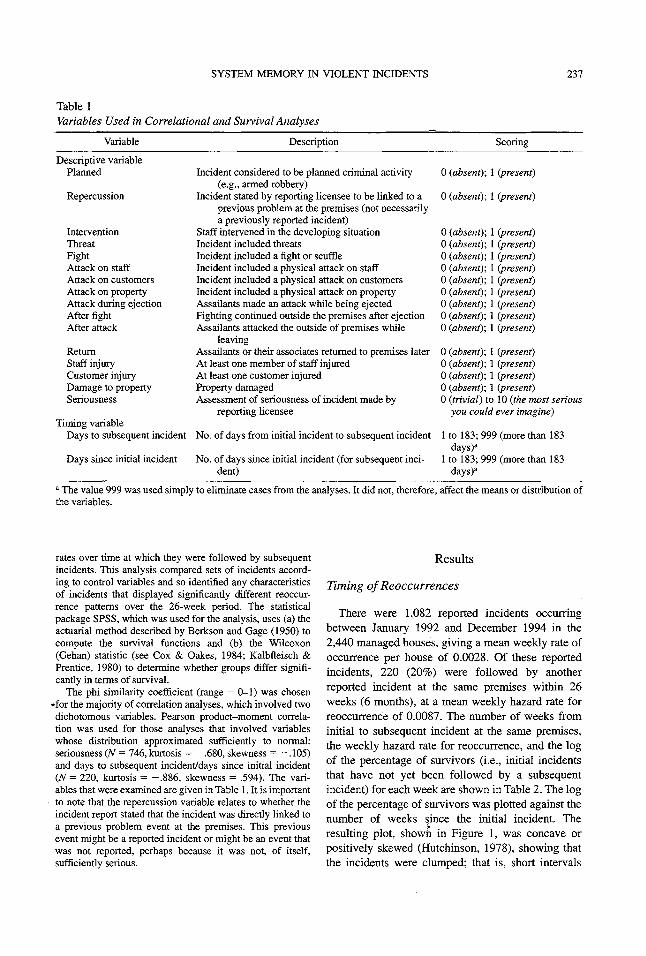
occurrence per house of 0.0028. Of these reportedincidents, 220 (20%) were followed by anotherreported incident at the same premises within 26weeks (6 months), at a mean weekly hazard rate forreoccurrence of 0.0087. The number of weeks frominitial to subsequent incident at the same premises,the weekly hazard rate for reoccurrence, and the logof the percentage of survivors (i.e., initial incidentsthat have not yet been followed by a subsequentincident) for each week are shown in Table 2. The logof the percentage of survivors was plotted against thenumber of weeks since the initial incident. Thewresulting plot, shown in Figure 1, was concave orpositively skewed (Hutchinson, 1978), showing thatthe incidents were clumped; that is, short intervals
238 BEALE, CLARKE, COX, LEATHER, AND LAWRENCE
Table 2Times Between Initial and Subsequent Violent Incidents at the Same PremisesThat Occurred Up to 26 Weeks Apart
No. weeks sinceinitial incident
0123456789
1011121314151617181920212223242526Total
No. cases subsequentincident has occurred
38"181213111095
107
10936
1054057685424
221
No. cases subsequentincident has not yet occurred
10821044102610141001990980971966956949939930927921911906902902897890884876871867865861
Weekly hazard ratefor reoccurence"
.0351***
.0172f (**)
.0117 (*)
.0128 (*)
.0110
.0101
.0092
.0051
.0104
.0073
.0105
.0096
.0032
.0065
.0109
.0055
.0044
.0000
.0055
.0078
.0067
.0090
.0057
.0046
.0023
.0046
Log%survival
2.00001.98451.97691.97181.96621.96141.95701.95301.95071.94621.94301.93841.93421.93291.93001.92531.92291.92101.92101.91861.91511.91221.90831.90581.90381.90281.9008
a M = .0087, SD = .0065. b This figure does not include renewed violence that occurred as "follow-up action" to the initialincident and was reported on the same report form.tp^ . l . *p < .05. **p^.0l. ***/?£ .001, one-tailed test. Asterisks in parentheses indicate that the hazard rate issignificantly different from those for larger intervals only.
were more common than in the random case (Clarke& Grassland, 1985). The graph showed a steepernegative gradient than that of the straight linecorresponding to random reoccurrence for around thefirst 4 weeks, then had a similar gradient for Weeks5-12, then generally a less negative gradient forWeeks 13-26.
The weekly hazard rate for reoccurrence for the 1stweek was significantly higher (p ^ .001) than for theother weeks and that for the 2nd week approachedsignificance (/>£.!). When compared just with theweeks that followed, the rate for the 2nd week wassignificantly higher (p < .01), as were the rates forthe 3rd week and 4th weeks (p s .05). It can be seenthat the weekly hazard rate for Week 1 (0.0351) wasaround 6 times as great as the mean weekly hazardrate for Weeks 13-26 (0.0055) and around 12 times asgreat as the overall mean weekly rate of occurrenceper house (0.0028). It appears then that the risk of a
reported incident occurring shows around a 12-foldincrease for the 1st week following another reportedincident at the same premises. If this week is survivedwithout incident, this risk is halved for the 2nd weekand further reduces for subsequent weeks survived.
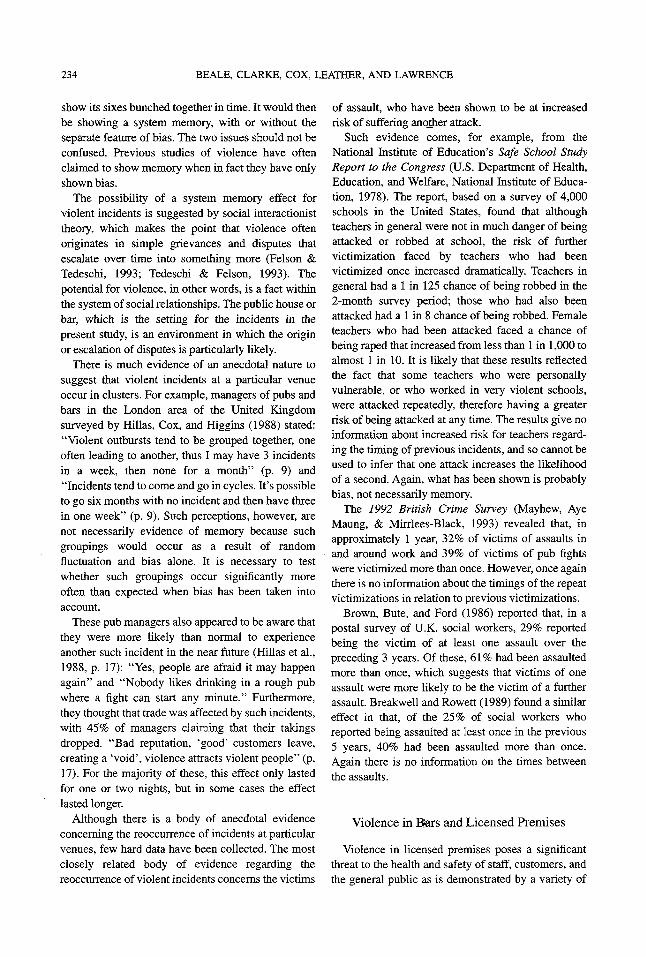
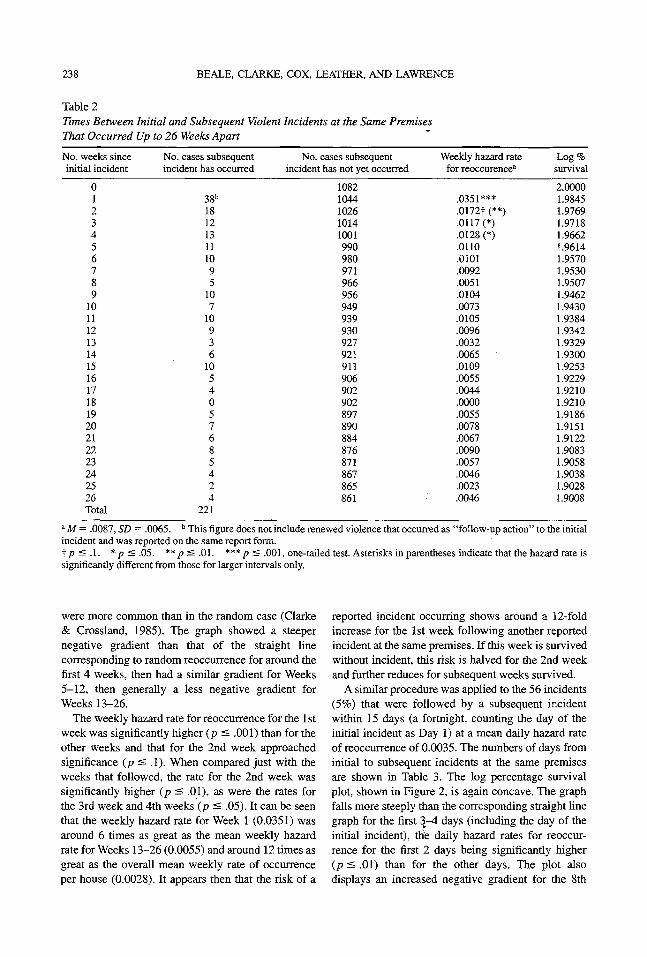
A similar procedure was applied to the 56 incidents(5%) that were followed by a subsequent incidentwithin 15 days (a fortnight, counting the day of theinitial incident as Day 1) at a mean daily hazard rateof reoccurrence of 0.0035. The numbers of days frominitial to subsequent incidents at the same premisesare shown in Table 3. The log percentage survivalplot, shown in Figure 2, is again concave. The graphfalls more steeply than the corresponding straight linegraph for the first |-4 days (including the day of theinitial incident), the daily hazard rates for reoccur-rence for the first 2 days being significantly higher(p :£ .01) than for the other days. The plot alsodisplays an increased negative gradient for the 8th
SYSTEM MEMORY IN VIOLENT INCIDENTS 239
0 2 4 6 8 10 12 14 16 18 20 22 24 26
Number of weeks from initial incident
Figure 1. The log percentage survival without reoccurrence for initial incidents over a periodof 26 weeks.
day (i.e., the same day of the following week). Theincreased daily hazard rate for reoccurrence for the8th day becomes significant (p £ .05) when com-pared with the days still to come. However, the
numbers of incidents occurring per day, by this stage,are very small and the conclusions must be tentative.
Together, these plots provide strong evidence of anincreased risk of a subsequent violent incident being
Table 3Times Between Initial and Subsequent Violent Incidents at the Same PremisesThat Occurred Up to 15 Days Apart
No. days sinceinitial incident
No. cases subsequentincident has occurred
No. cases subsequentincident has not yet occurred
Daily hazard ratefor reoccurrence" survival
0123456789101112131415Total
8"9454215223133456
1,0821,0741,0651,0611,0561,0521,0501,0491,0441,0421,0401,0371,0361,0331,0301,026
.0074*
.0084**
.0038
.0047
.0038
.0019
.0010
.0048 (*)
.0019
.0019
.0029
.0010
.0029
.0029
.0039
2.00001.99681.99311.99151.98941.98781.98701.98651.98451.98361.98281.98161.98111.97991.97861.9769
a M — .0035, SD = .0021. b This figure does not include renewed violence that occurred as "follow-up action" to the initialincident and was reported on the same report form.* p £ .05. ** p < .01, one-tailed test. Asterisk in parentheses indicates that the hazard rate is significantly different fromthose for larger intervals only.
240 BEALE, CLARKE, COX, LEATHER, AND LAWRENCE
0 1 2 3 4 5 6 7 8 9 10 11 12 13 14 15
Number of days from initial incident
Figure 2. The log percentage survival without reoccurrence for initial incidents over a periodof 15 days.
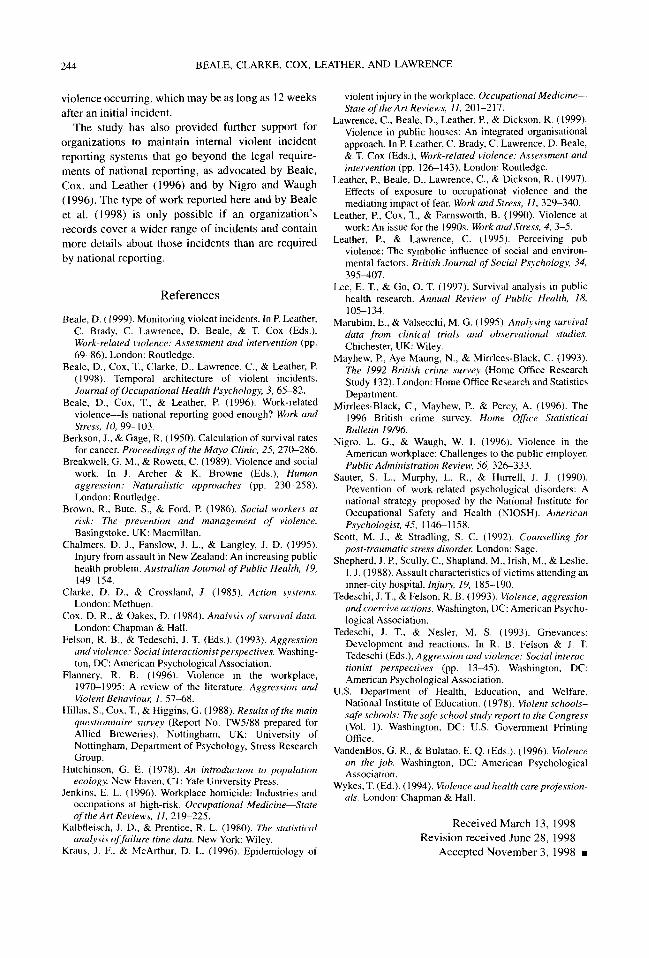
reported up to around 12 weeks following an initialincident. The risk of reoccurrence is higher in the first2-4 weeks and particularly high during the first 3-4days and again 1 week after the initial incident.
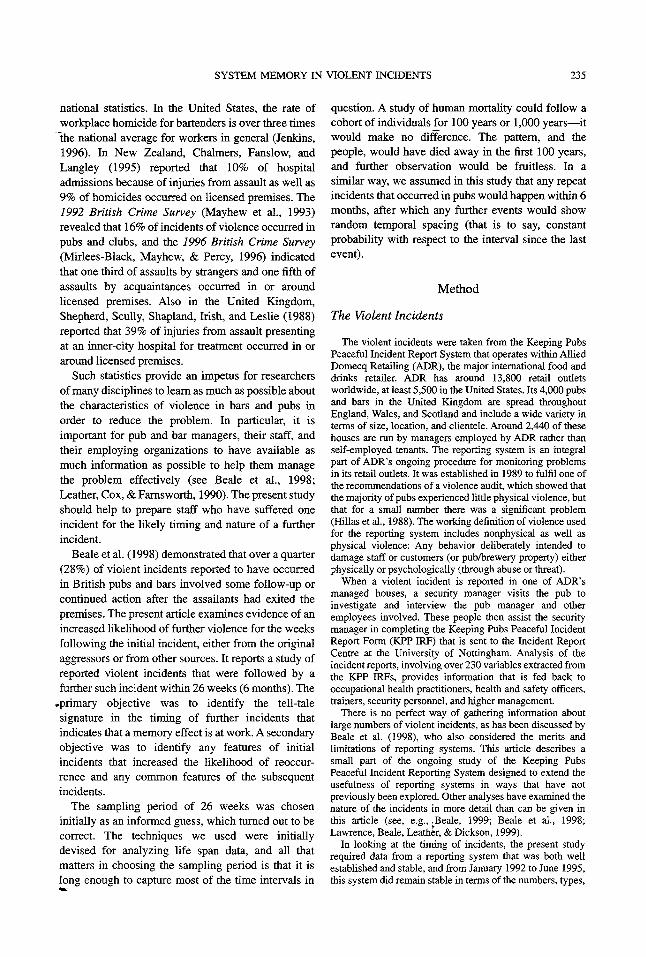
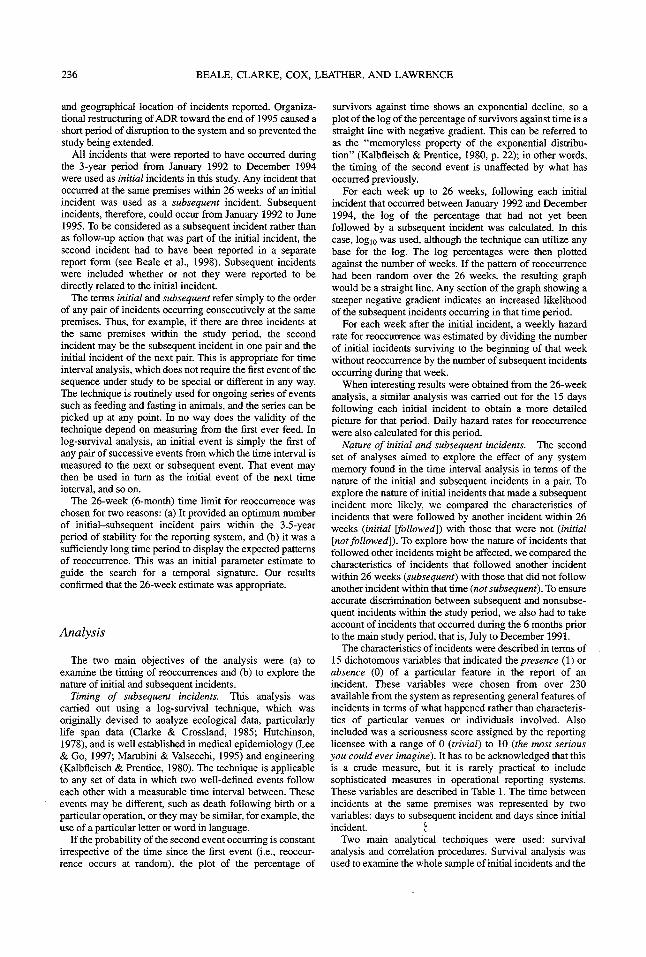
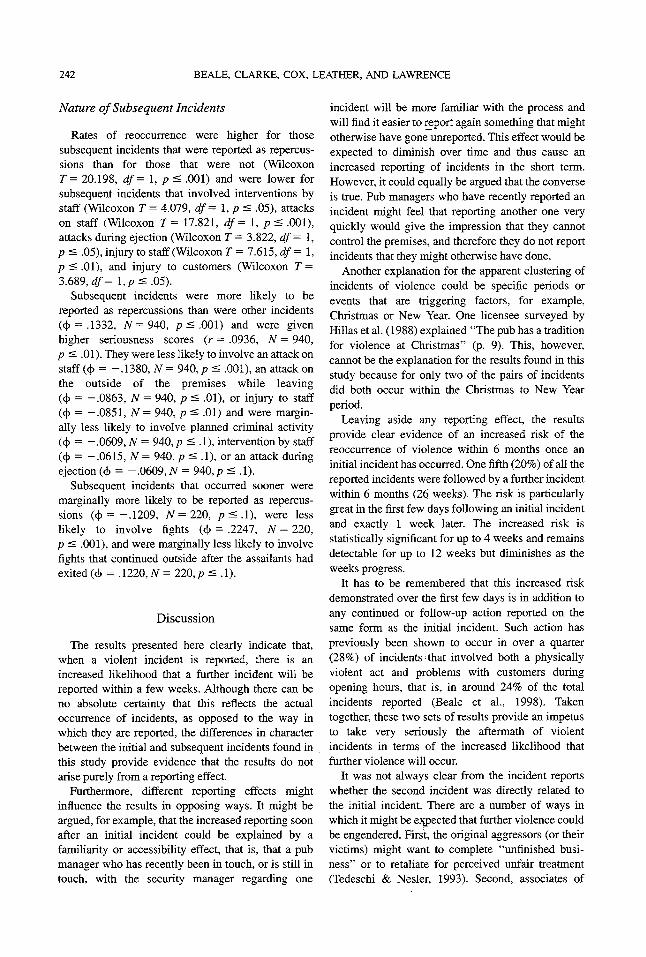
These results cannot be accounted for by thepossible inclusion of a small number of premises thatreported a very high frequency of reoccurrencethroughout the study period. The average timesbetween reported incidents for those houses thatexperienced two or more incidents is given in Table 4.It can be seen that only 8 premises displayed anaverage time between incidents within the 26-weekreoccurrence time considered, and that none fellwithin a 15-day reoccurrence time. Furthermore,
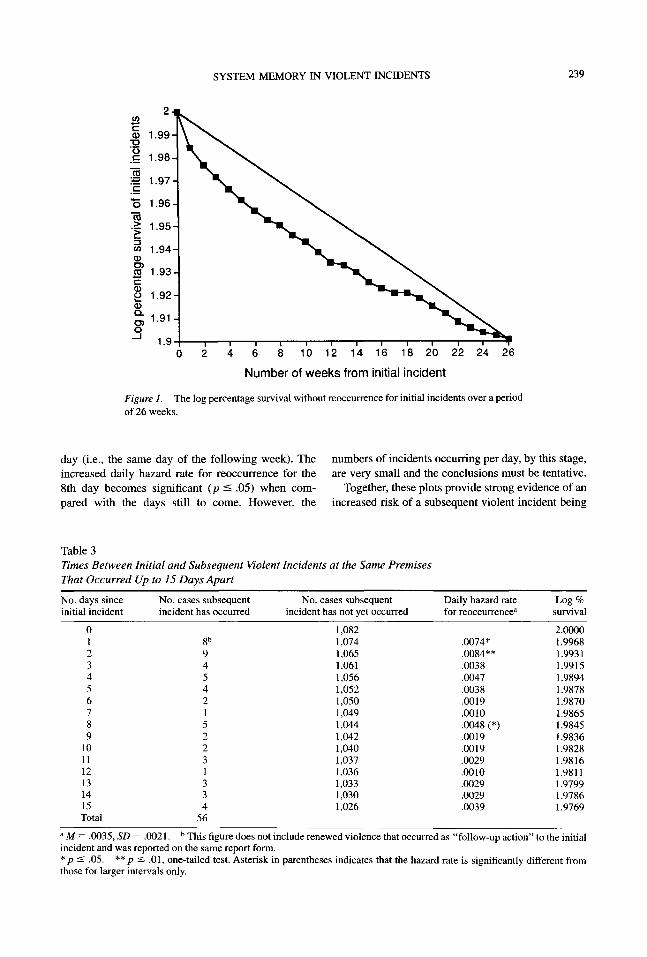
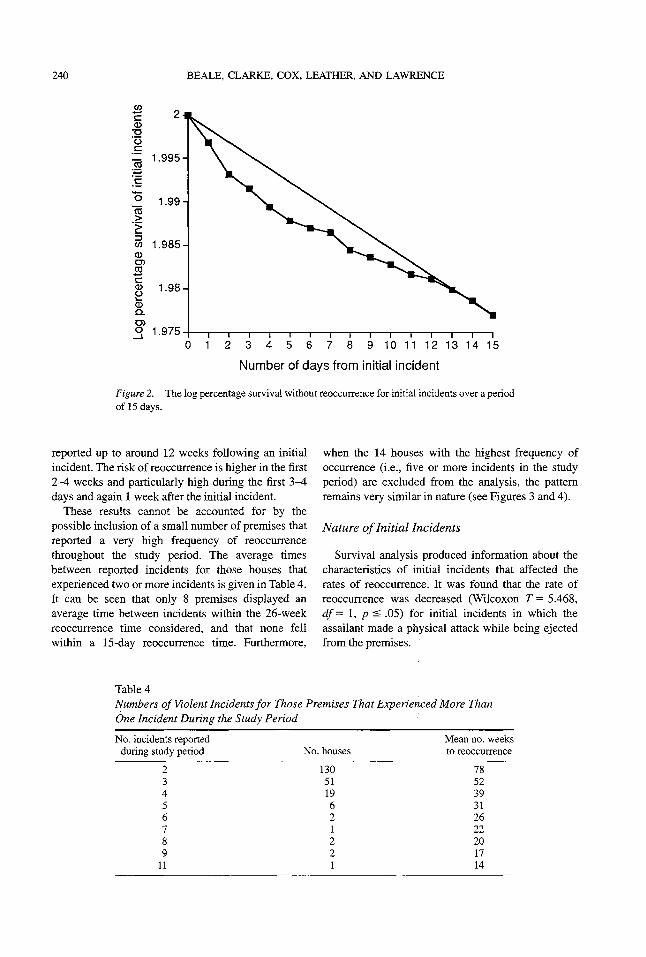
when the 14 houses with the highest frequency ofoccurrence (i.e., five or more incidents in the studyperiod) are excluded from the analysis, the patternremains very similar in nature (see Figures 3 and 4).
Nature of Initial Incidents
Survival analysis produced information about thecharacteristics of initial incidents that affected therates of reoccurrence. It was found that the rate ofreoccurrence was decreased (Wilcoxon T = 5.468,df= I , p £ .05) for initial incidents in which theassailant made a physical attack while being ejectedfrom the premises.
Table 4Numbers of Violent Incidents for Those Premises That Experienced More ThanOne Incident During the Study Period
No. incidents reportedduring study period
11
No. houses
1305119621221
Mean no. weeksto reoccurrence
785239312622201714
SYSTEM MEMORY IN VIOLENT INCIDENTS 241
2 4 6 8 10 12 14 16 18 20 22 24 26
Number of weeks from initial incident
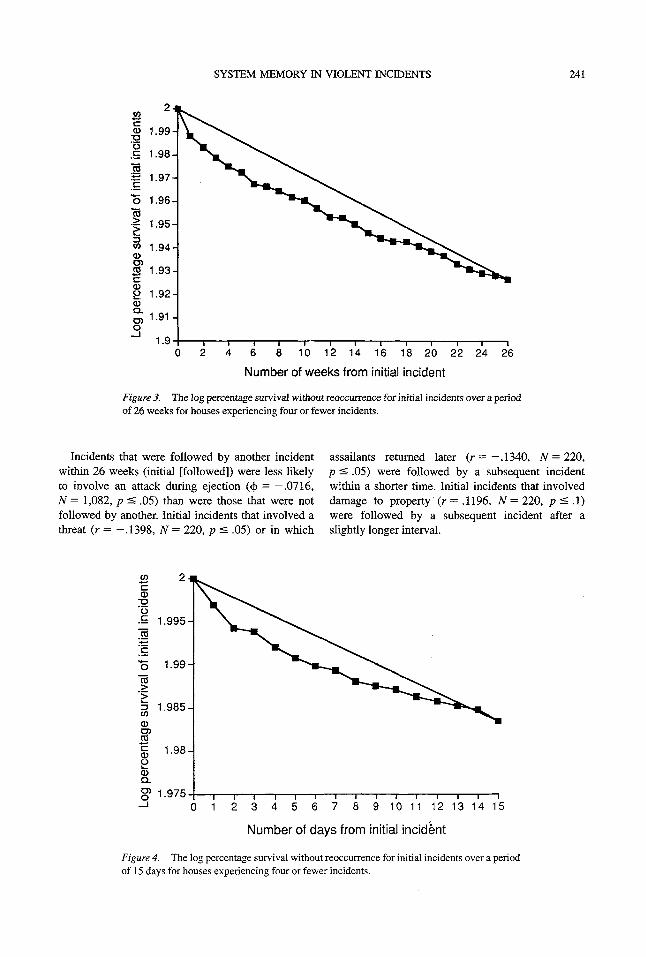
Figure 3. The log percentage survival without reoccurrence for initial incidents over a periodof 26 weeks for houses experiencing four or fewer incidents.
Incidents that were followed by another incidentwithin 26 weeks (initial [followed]) were less likelyto involve an attack during ejection (<j> = —.0716,N = 1,082, p s .05) than were those that were notfollowed by another. Initial incidents that involved athreat (r = -.1398, N = 220, p < .05) or in which
assailants returned later (r=-.1340, N = 220,p £ .05) were followed by a subsequent incidentwithin a shorter time. Initial incidents that involveddamage to property (r = .1196, N = 220, p < .1)were followed by a subsequent incident after aslightly longer interval.
g5 1.9750 1 3 4 5 6 7 8 9 10 11 12 13 14 15
Number of days from initial incident
Figure 4. The log percentage survival without reoccurrence for initial incidents over a periodof 15 days for houses experiencing four or fewer incidents.
242 BEALE, CLARKE, COX, LEATHER, AND LAWRENCE
Nature of Subsequent Incidents
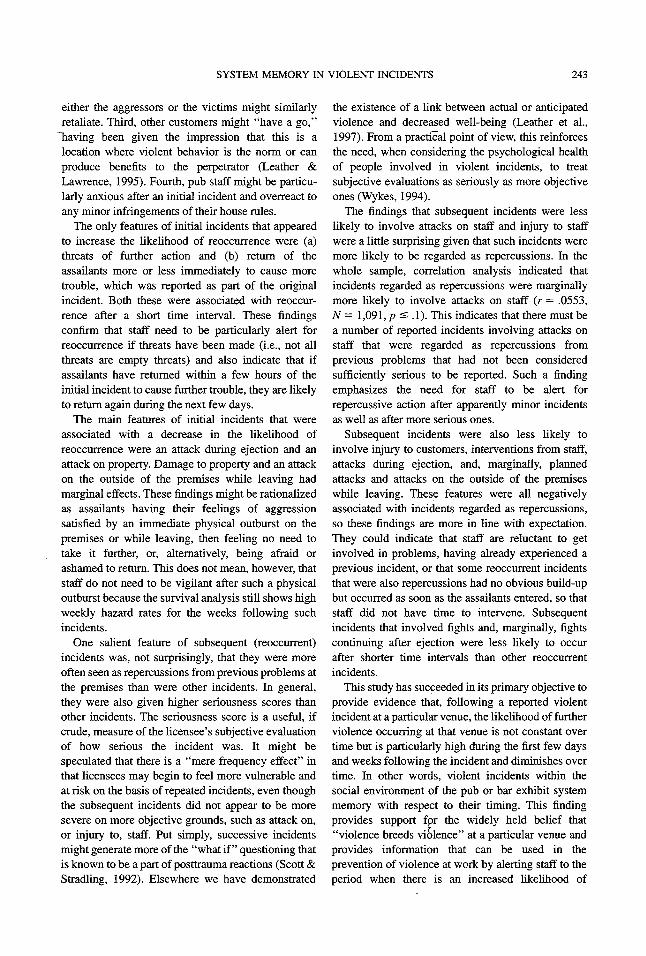
Rates of reoccurrence were higher for thosesubsequent incidents that were reported as repercus-sions than for those that were not (WilcoxonT= 20.198, df=l,p^ .001) and were lower forsubsequent incidents that involved interventions bystaff (Wilcoxon T = 4.079, df= 1, p ^ .05), attackson staff (Wilcoxon T= 17.821, df= I , p < .001),attacks during ejection (Wilcoxon T = 3.822, df=l,p < .05), injury to staff (Wilcoxon T = 7.615, df= 1,p < .01), and injury to customers (Wilcoxon T =3.689, df= !,/><.05).
Subsequent incidents were more likely to bereported as repercussions than were other incidents(4> = .1332, N = 940, p :£ .001) and were givenhigher seriousness scores (r = .0936, N = 940,p s .01). They were less likely to involve an attack onstaff (<|> = -.1380, ./V = 940, p < .001), an attack onthe outside of the premises while leaving(<!> = -.0863, N = 940, p s= .01), or injury to staff(<(> = -.0851, N = 940, p :£ .01) and were margin-ally less likely to involve planned criminal activity(4> = -.0609, N = 940, p :£ .1), intervention by staff(<|> = -.0615, N = 940, p < .1), or an attack duringejection (4> = -.0609, N = 940, p < .1).
Subsequent incidents that occurred sooner weremarginally more likely to be reported as repercus-sions (4) =-.1209, ./V =220, p^.l) , were lesslikely to involve fights (<J> = .2247, N = 220,p ̂ .001), and were marginally less likely to involvefights that continued outside after the assailants hadexited (4> = .1220, N = 220,p < .1).
Discussion
The results presented here clearly indicate that,when a violent incident is reported, there is anincreased likelihood that a further incident will bereported within a few weeks. Although there can beno absolute certainty that this reflects the actualoccurrence of incidents, as opposed to the way inwhich they are reported, the differences in characterbetween the initial and subsequent incidents found inthis study provide evidence that the results do notarise purely from a reporting effect.
Furthermore, different reporting effects mightinfluence the results in opposing ways. It might beargued, for example, that the increased reporting soonafter an initial incident could be explained by afamiliarity or accessibility effect, that is, that a pubmanager who has recently been in touch, or is still intouch, with the security manager regarding one
incident will be more familiar with the process andwill find it easier to report again something that mightotherwise have gone unreported. This effect would beexpected to diminish over time and thus cause anincreased reporting of incidents in the short term.However, it could equally be argued that the converseis true. Pub managers who have recently reported anincident might feel that reporting another one veryquickly would give the impression that they cannotcontrol the premises, and therefore they do not reportincidents that they might otherwise have done.
Another explanation for the apparent clustering ofincidents of violence could be specific periods orevents that are triggering factors, for example,Christmas or New Year. One licensee surveyed byHillas et al. (1988) explained "The pub has a traditionfor violence at Christmas" (p. 9). This, however,cannot be the explanation for the results found in thisstudy because for only two of the pairs of incidentsdid both occur within the Christmas to New Yearperiod.
Leaving aside any reporting effect, the resultsprovide clear evidence of an increased risk of thereoccurrence of violence within 6 months once aninitial incident has occurred. One fifth (20%) of all thereported incidents were followed by a further incidentwithin 6 months (26 weeks). The risk is particularlygreat in the first few days following an initial incidentand exactly 1 week later. The increased risk isstatistically significant for up to 4 weeks and remainsdetectable for up to 12 weeks but diminishes as theweeks progress.
It has to be remembered that this increased riskdemonstrated over the first few days is in addition toany continued or follow-up action reported on thesame form as the initial incident. Such action haspreviously been shown to occur in over a quarter(28%) of incidents that involved both a physicallyviolent act and problems with customers duringopening hours, that is, in around 24% of the totalincidents reported (Beale et al., 1998). Takentogether, these two sets of results provide an impetusto take very seriously the aftermath of violentincidents in terms of the increased likelihood thatfurther violence will occur.
It was not always clear from the incident reportswhether the second incident was directly related tothe initial incident. There are a number of ways inwhich it might be expected that further violence couldbe engendered. First, the original aggressors (or theirvictims) might want to complete "unfinished busi-ness" or to retaliate for perceived unfair treatment(Tedeschi & Nesler, 1993). Second, associates of
SYSTEM MEMORY IN VIOLENT INCIDENTS 243
either the aggressors or the victims might similarlyretaliate. Third, other customers might "have a go,"
Tiaving been given the impression that this is alocation where violent behavior is the norm or canproduce benefits to the perpetrator (Leather &Lawrence, 1995). Fourth, pub staff might be particu-larly anxious after an initial incident and overreact toany minor infringements of their house rules.
The only features of initial incidents that appearedto increase the likelihood of reoccurrence were (a)threats of further action and (b) return of theassailants more or less immediately to cause moretrouble, which was reported as part of the originalincident. Both these were associated with reoccur-rence after a short time interval. These findingsconfirm that staff need to be particularly alert forreoccurrence if threats have been made (i.e., not allthreats are empty threats) and also indicate that ifassailants have returned within a few hours of theinitial incident to cause further trouble, they are likelyto return again during the next few days.
The main features of initial incidents that wereassociated with a decrease in the likelihood ofreoccurrence were an attack during ejection and anattack on property. Damage to property and an attackon the outside of the premises while leaving hadmarginal effects. These findings might be rationalizedas assailants having their feelings of aggressionsatisfied by an immediate physical outburst on thepremises or while leaving, then feeling no need totake it further, or, alternatively, being afraid orashamed to return. This does not mean, however, thatstaff do not need to be vigilant after such a physicaloutburst because the survival analysis still shows highweekly hazard rates for the weeks following suchincidents.
One salient feature of subsequent (reoccurrent)incidents was, not surprisingly, that they were moreoften seen as repercussions from previous problems atthe premises than were other incidents. In general,they were also given higher seriousness scores thanother incidents. The seriousness score is a useful, ifcrude, measure of the licensee's subjective evaluationof how serious the incident was. It might bespeculated that there is a "mere frequency effect" inthat licensees may begin to feel more vulnerable andat risk on the basis of repeated incidents, even thoughthe subsequent incidents did not appear to be moresevere on more objective grounds, such as attack on,or injury to, staff. Put simply, successive incidentsmight generate more of the "what if" questioning thatis known to be a part of posttrauma reactions (Scott &Stradling, 1992). Elsewhere we have demonstrated
the existence of a link between actual or anticipatedviolence and decreased well-being (Leather et al.,1997). From a practical point of view, this reinforcesthe need, when considering the psychological healthof people involved in violent incidents, to treatsubjective evaluations as seriously as more objectiveones (Wykes, 1994).
The findings that subsequent incidents were lesslikely to involve attacks on staff and injury to staffwere a little surprising given that such incidents weremore likely to be regarded as repercussions. In thewhole sample, correlation analysis indicated thatincidents regarded as repercussions were marginallymore likely to involve attacks on staff (r = .0553,N = 1,091, p s .1). This indicates that there must bea number of reported incidents involving attacks onstaff that were regarded as repercussions fromprevious problems that had not been consideredsufficiently serious to be reported. Such a findingemphasizes the need for staff to be alert forrepercussive action after apparently minor incidentsas well as after more serious ones.
Subsequent incidents were also less likely toinvolve injury to customers, interventions from staff,attacks during ejection, and, marginally, plannedattacks and attacks on the outside of the premiseswhile leaving. These features were all negativelyassociated with incidents regarded as repercussions,so these findings are more in line with expectation.They could indicate that staff are reluctant to getinvolved in problems, having already experienced aprevious incident, or that some reoccurrent incidentsthat were also repercussions had no obvious build-upbut occurred as soon as the assailants entered, so thatstaff did not have time to intervene. Subsequentincidents that involved fights and, marginally, fightscontinuing after ejection were less likely to occurafter shorter time intervals than other reoccurrentincidents.
This study has succeeded in its primary objective toprovide evidence that, following a reported violentincident at a particular venue, the likelihood of furtherviolence occurring at that venue is not constant overtime but is particularly high during the first few daysand weeks following the incident and diminishes overtime. In other words, violent incidents within thesocial environment of the pub or bar exhibit systemmemory with respect to their timing. This findingprovides support fpr the widely held belief that"violence breeds violence" at a particular venue andprovides information that can be used in theprevention of violence at work by alerting staff to theperiod when there is an increased likelihood of
244 BEALE, CLARKE, COX, LEATHER, AND LAWRENCE
violence occurring, which may be as long as 12 weeksafter an initial incident.
The study has also provided further support fororganizations to maintain internal violent incidentreporting systems that go beyond the legal require-ments of national reporting, as advocated by Beale,Cox, and Leather (1996) and by Nigro and Waugh(1996). The type of work reported here and by Bealeet al. (1998) is only possible if an organization'srecords cover a wider range of incidents and containmore details about those incidents than are requiredby national reporting.
References
Beale, D. (1999). Monitoring violent incidents. In P. Leather,C. Brady, C. Lawrence, D. Beale, & T. Cox (Eds.),Work-related violence: Assessment and intervention (pp.69-86). London: Routledge.
Beale, D., Cox, T., Clarke, D., Lawrence, C., & Leather, P.(1998). Temporal architecture of violent incidents.Journal of Occupational Health Psychology, 3, 65-82.
Beale, D., Cox, T., & Leather, P. (1996). Work-relatedviolence—Is national reporting good enough? Work andStress, 10, 99-103.
Berkson, J., & Gage, R. (1950). Calculation of survival ratesfor cancer. Proceedings of the Mayo Clinic, 25, 270-286.
Breakwell, G. M, & Rowett, C. (1989). Violence and socialwork. In J. Archer & K. Browne (Eds.), Humanaggression: Naturalistic approaches (pp. 230-258).London: Routledge.
Brown, R., Bute, S., & Ford, P. (1986). Social workers atrisk: The prevention and management of violence.Basingstoke, UK: Macmillan.
Chalmers, D. J., Fanslow, J. L., & Langley, J. D. (1995).Injury from assault in New Zealand: An increasing publichealth problem. Australian Journal of Public Health, 19,149-154.
Clarke, D. D., & Grassland, J. (1985). Action systems.London: Methuen.
Cox, D. R., & Oakes, D. (1984). Analysis of survival data.London: Chapman & Hall.
Felson, R. B., & Tedeschi, J. T. (Eds.). (1993). Aggressionand violence: Social interactionistperspectives. Washing-ton, DC: American Psychological Association.
Flannery, R. B. (1996). Violence in the workplace,1970-1995: A review of the literature. Aggression andViolent Behaviour, 1, 57-68.
Hillas, S., Cox, T, & Higgins, G. (1988). Results of the mainquestionnaire survey (Report No. TW5/88 prepared forAllied Breweries). Nottingham, UK: University ofNottingham, Department of Psychology, Stress ResearchGroup.
Hutchinson, G. E. (1978). An introduction to populationecology. New Haven, CT: Yale University Press.
Jenkins, E. L. (1996). Workplace homicide: Industries andoccupations at high-risk. Occupational Medicine—Stateof the Art Reviews, 11, 219-225.
Kalbfleisch, J. D., & Prentice, R. L. (1980). The statisticalanalysis of failure time data. New York: Wiley.
Kraus, J. P., & McArthur, D. L. (1996). Epidemiology of
violent injury in the workplace. Occupational Medicine—State of the Art Reviews, 11, 201-217.
Lawrence, C., Beale, D., Leather, P., & Dickson, R. (1999).Violence in public houses: An integrated organisationalapproach. In P. Leather, C. Brady, C. Lawrence, D. Beale,& T. Cox (Eds.), Work-related violence: Assessment andintervention (pp. 126-143). London: Routledge.
Leather, P., Beale, D., Lawrence, C., & Dickson, R. (1997).Effects of exposure to occupational violence and themediating impact of fear. Work and Stress, 11, 329-340.
Leather, P., Cox, T., & Farnsworth, B. (1990). Violence atwork: An issue for the 1990s. Work and Stress, 4, 3-5.
Leather, P., & Lawrence, C. (1995). Perceiving pubviolence: The symbolic influence of social and environ-mental factors. British Journal of Social Psychology, 34,395^107.
Lee, E. T, & Go, O. T. (1997). Survival analysis in publichealth research. Annual Review of Public Health, 18,105-134.
Marubini, E., & Valsecchi, M. G. (1995). Analysing survivaldata from clinical trials and observational studies.Chichester, UK: Wiley.
Mayhew, P., Aye Maung, N., & Mirrlees-Black, C. (1993).The 1992 British crime survey (Home Office ResearchStudy 132). London: Home Office Research and StatisticsDepartment.
Mirrlees-Black, C., Mayhew, P., & Percy, A. (1996). The1996 British crime survey. Home Office StatisticalBulletin 19/96.
Nigro, L. G., & Waugh, W. I. (1996). Violence in theAmerican workplace: Challenges to the public employer.Public Administration Review, 56, 326-333.
Sauter, S. L., Murphy, L. R., & Hurrell, J. J. (1990).Prevention of work-related psychological disorders: Anational strategy proposed by the National Institute forOccupational Safety and Health (NIOSH). AmericanPsychologist, 45, 1146-1158.
Scott, M. J., & Stradling, S. C. (1992). Counselling forpost-traumatic stress disorder. London: Sage.
Shepherd, J. P., Scully, C., Shapland, M., Irish, M., & Leslie,I. J. (1988). Assault characteristics of victims attending aninner-city hospital. Injury, 19, 185-190.
Tedeschi, J. T, & Felson, R. B. (1993). Violence, aggressionand coercive actions. Washington, DC: American Psycho-logical Association.
Tedeschi, J. T, & Nesler, M. S. (1993). Grievances:Development and reactions. In R. B. Felson & J. T.Tedeschi (Eds.), Aggression and violence: Social interac-tionist perspectives (pp. 13^5). Washington, DC:American Psychological Association.
U.S. Department of Health, Education, and Welfare,National Institute of Education. (1978). Violent schools-safe schools: The safe school study report to the Congress(Vol. 1). Washington, DC: U.S. Government PrintingOffice.
VandenBos, G. R., & Bulatao, E. Q. (Eds.). (1996). Violenceon the job. Washington, DC: American PsychologicalAssociation.
Wykes, T. (Ed.). (1994). Violence and health care profession-als. London: Chapman & Hall.
Received March 13, 1998Revision received June 28, 1998
Accepted November 3, 1998 •