Embed Size (px)
Citation preview

Masters’ Degree in Informatics Engineering
Dissertation
System of Automatic Recommendation andPrioritization of Tasks
Jose Pedro Santana Saraiva
Advisor :
Alexandre Pinto
June 2014


UNIVERSIDADE DE COIMBRA
Abstract
Faculdade de Ciencias e Tecnologia
Departamento de Engenharia Informatica
Master’s Degree Thesis
System of Automatic Recommendation and Prioritization of Tasks
by Jose Pedro Santana Saraiva
Most people have many different tasks, goals, projects, interests and responsibilities
in life, and in the fast paced world we live in today, all of these grow in number and
diversity all the time. This rising in complexity and quantity of matters to handle makes
it progressively harder to make intuitive choices about which task to execute next. We
developed a prototype application for helping the user in managing and prioritizing
his tasks, guaranteeing an alignment with his goals and deadlines. Our application
follows a variation over the Getting Things Done (GTD) methodology but also includes
benefits from other complementary approaches, such as goal cascading and dynamic
prioritization.
Keywords: GTD, Prioritization of Tasks, Recommendation of Tasks, Hierarchization
of Objectives, Personal Productivity


—————————————————————————————-
Acknowledgements
Firstly, I would like to acknowledge my immense gratitude to my advisor Prof. Alexandre
Pinto for all the guidance and knowledge provided, for the patience and availability
shown since the start of this thesis and for his motivational words provided in hard
times.
I also would like to acknowledge the Cognitive and Media Systems Group for providing
me shelter and allowing me to use their resources.
Last but not least, I am truly grateful for the support that my beloved family has
given throughout my studies, especially my parents and grandparents for their relentless
support, belief and comprehension, and my gratitude to all my friends who played an
essential role during this period of my life.
iv

Contents
Abstract ii
Acknowledgements iv
Contents vi
List of Figures ix
List of Tables xi
1 Introduction 1
1.1 Context . . . . . . . . . . . . . . . . . . . . . . . . . . . . . . . . . . . . . 1
1.2 Problem Identification . . . . . . . . . . . . . . . . . . . . . . . . . . . . . 2
1.3 Motivation . . . . . . . . . . . . . . . . . . . . . . . . . . . . . . . . . . . 3
1.3.1 Target Users . . . . . . . . . . . . . . . . . . . . . . . . . . . . . . 3
1.3.2 Innovative Characteristics of the work . . . . . . . . . . . . . . . . 4
1.3.3 Challenges to overcome . . . . . . . . . . . . . . . . . . . . . . . . 4
1.4 Document Structure . . . . . . . . . . . . . . . . . . . . . . . . . . . . . . 5
2 Background and Proposed Approach 6
2.1 The Getting Things Done Methodology . . . . . . . . . . . . . . . . . . . 6
2.1.1 The GTD Workflow . . . . . . . . . . . . . . . . . . . . . . . . . . 8
2.1.1.1 Horizontal Processing . . . . . . . . . . . . . . . . . . . . 8
2.1.1.2 Vertical Processing . . . . . . . . . . . . . . . . . . . . . . 11
2.2 Our approach . . . . . . . . . . . . . . . . . . . . . . . . . . . . . . . . . . 12
2.2.1 Horizontal Processing . . . . . . . . . . . . . . . . . . . . . . . . . 13
2.2.2 Vertical Processing . . . . . . . . . . . . . . . . . . . . . . . . . . . 14
2.3 Alternatives to the GTD . . . . . . . . . . . . . . . . . . . . . . . . . . . . 15
2.3.1 The One Minute To-Do List . . . . . . . . . . . . . . . . . . . . . . 15
2.3.2 Pomodoro Technique . . . . . . . . . . . . . . . . . . . . . . . . . . 16
3 State of the Art and Related Work 18
3.1 State of the Art Applications . . . . . . . . . . . . . . . . . . . . . . . . . 18
3.2 Comparative Vectors . . . . . . . . . . . . . . . . . . . . . . . . . . . . . . 27
3.2.1 Non Functional Vectors . . . . . . . . . . . . . . . . . . . . . . . . 27
3.2.2 Information Vectors . . . . . . . . . . . . . . . . . . . . . . . . . . 27
3.2.3 Organizational Vectors . . . . . . . . . . . . . . . . . . . . . . . . . 28
vi

Contents vii
3.3 Critical Evaluation of the Applications . . . . . . . . . . . . . . . . . . . . 29
3.3.1 Non Functional Vectors . . . . . . . . . . . . . . . . . . . . . . . . 33
3.3.2 Information Vectors . . . . . . . . . . . . . . . . . . . . . . . . . . 34
3.3.3 Organizational Vectors . . . . . . . . . . . . . . . . . . . . . . . . . 35
3.4 Related Work . . . . . . . . . . . . . . . . . . . . . . . . . . . . . . . . . . 36
3.4.1 Scheduling Algorithms . . . . . . . . . . . . . . . . . . . . . . . . . 36
3.4.2 Goal Decomposition . . . . . . . . . . . . . . . . . . . . . . . . . . 39
3.4.2.1 Goals Breakdown Structure . . . . . . . . . . . . . . . . . 39
3.4.2.2 Goal Modeling in Requirements Engineering . . . . . . . 40
4 Requirements Analysis 41
4.1 Functional and Non-Functional Requirements . . . . . . . . . . . . . . . . 41
4.1.1 Functional Requirements . . . . . . . . . . . . . . . . . . . . . . . 42
4.1.2 Non-Functional Requirements . . . . . . . . . . . . . . . . . . . . . 46
4.2 Use Cases Diagram . . . . . . . . . . . . . . . . . . . . . . . . . . . . . . . 48
4.2.1 Tasks Sequence Diagram . . . . . . . . . . . . . . . . . . . . . . . . 49
4.2.2 Recommendation Sequence Diagram . . . . . . . . . . . . . . . . . 50
5 Architecture 51
5.1 First Level Architecture . . . . . . . . . . . . . . . . . . . . . . . . . . . . 51
5.2 Second Level Architecture . . . . . . . . . . . . . . . . . . . . . . . . . . . 52
5.2.1 Model . . . . . . . . . . . . . . . . . . . . . . . . . . . . . . . . . . 52
5.2.2 Controllers . . . . . . . . . . . . . . . . . . . . . . . . . . . . . . . 54
5.2.3 View . . . . . . . . . . . . . . . . . . . . . . . . . . . . . . . . . . . 57
5.3 Technologies . . . . . . . . . . . . . . . . . . . . . . . . . . . . . . . . . . . 57
5.3.1 Programming Language . . . . . . . . . . . . . . . . . . . . . . . . 57
5.3.2 Persistent Data Storage Solution . . . . . . . . . . . . . . . . . . . 58
5.3.3 Software Platform . . . . . . . . . . . . . . . . . . . . . . . . . . . 59
6 Recommendation Process 61
6.1 Reducing the task list . . . . . . . . . . . . . . . . . . . . . . . . . . . . . 61
6.2 Prioritization Algorithm . . . . . . . . . . . . . . . . . . . . . . . . . . . . 62
6.2.1 Importance . . . . . . . . . . . . . . . . . . . . . . . . . . . . . . . 63
6.2.2 Urgency . . . . . . . . . . . . . . . . . . . . . . . . . . . . . . . . . 66
6.2.3 Age . . . . . . . . . . . . . . . . . . . . . . . . . . . . . . . . . . . 69
6.2.4 Speed . . . . . . . . . . . . . . . . . . . . . . . . . . . . . . . . . . 70
6.2.5 Presentation of the Tasks . . . . . . . . . . . . . . . . . . . . . . . 71
7 Developing,Testing and Validation 72
7.1 Development and Testing . . . . . . . . . . . . . . . . . . . . . . . . . . . 72
7.2 Validation . . . . . . . . . . . . . . . . . . . . . . . . . . . . . . . . . . . . 72
7.2.1 Functional Requirements . . . . . . . . . . . . . . . . . . . . . . . 72
7.2.2 Recommendation Algorithm . . . . . . . . . . . . . . . . . . . . . . 73
7.2.3 Filters . . . . . . . . . . . . . . . . . . . . . . . . . . . . . . . . . . 76
8 Conclusions and Future Work 79
8.1 Conclusions . . . . . . . . . . . . . . . . . . . . . . . . . . . . . . . . . . . 79
8.2 Future Work . . . . . . . . . . . . . . . . . . . . . . . . . . . . . . . . . . 79

Contents viii
A Work Plan 80
A.1 Work Plan for the First Semester . . . . . . . . . . . . . . . . . . . . . . . 80
A.2 Work Plan for the Second Semester . . . . . . . . . . . . . . . . . . . . . . 82
Bibliography 84

List of Figures
2.1 GTD Workflow Map . . . . . . . . . . . . . . . . . . . . . . . . . . . . . . 7
2.2 Collect . . . . . . . . . . . . . . . . . . . . . . . . . . . . . . . . . . . . . . 8
2.3 Process . . . . . . . . . . . . . . . . . . . . . . . . . . . . . . . . . . . . . 9
2.4 Organize . . . . . . . . . . . . . . . . . . . . . . . . . . . . . . . . . . . . . 10
2.5 Do . . . . . . . . . . . . . . . . . . . . . . . . . . . . . . . . . . . . . . . . 11
2.6 Horizons of Focus . . . . . . . . . . . . . . . . . . . . . . . . . . . . . . . . 12
2.7 Areas of Focus . . . . . . . . . . . . . . . . . . . . . . . . . . . . . . . . . 14
3.1 OmniFocus Screenshot . . . . . . . . . . . . . . . . . . . . . . . . . . . . . 19
3.2 Things 2 Screenshot . . . . . . . . . . . . . . . . . . . . . . . . . . . . . . 20
3.3 Inbox Classic Screenshot . . . . . . . . . . . . . . . . . . . . . . . . . . . . 20
3.4 IQTell Screenshot . . . . . . . . . . . . . . . . . . . . . . . . . . . . . . . . 21
3.5 Life Balance Screenshot . . . . . . . . . . . . . . . . . . . . . . . . . . . . 22
3.6 Producteev Screenshot . . . . . . . . . . . . . . . . . . . . . . . . . . . . . 22
3.7 ThinkingRock Screenshot . . . . . . . . . . . . . . . . . . . . . . . . . . . 23
3.8 Toodledo Screenshot . . . . . . . . . . . . . . . . . . . . . . . . . . . . . . 23
3.9 ToDoist Screenshot . . . . . . . . . . . . . . . . . . . . . . . . . . . . . . . 24
3.10 NirvanaHQ Screenshot . . . . . . . . . . . . . . . . . . . . . . . . . . . . . 25
3.11 Asana Screenshot . . . . . . . . . . . . . . . . . . . . . . . . . . . . . . . . 25
3.12 RememberTheMilk Screenshot . . . . . . . . . . . . . . . . . . . . . . . . 26
3.13 Wunderlist Screenshot . . . . . . . . . . . . . . . . . . . . . . . . . . . . . 26
4.1 Use cases Diagram . . . . . . . . . . . . . . . . . . . . . . . . . . . . . . . 48
4.2 Tasks Sequence Diagram . . . . . . . . . . . . . . . . . . . . . . . . . . . . 49
4.3 Recommendation Sequence Diagram . . . . . . . . . . . . . . . . . . . . . 50
5.1 Abstract Arquitecture . . . . . . . . . . . . . . . . . . . . . . . . . . . . . 51
5.2 Classes Diagram . . . . . . . . . . . . . . . . . . . . . . . . . . . . . . . . 52
5.3 Entity-Relationship Diagram . . . . . . . . . . . . . . . . . . . . . . . . . 54
5.4 Components Diagram . . . . . . . . . . . . . . . . . . . . . . . . . . . . . 55
6.1 Example 1 Tree of objectives . . . . . . . . . . . . . . . . . . . . . . . . . 64
6.2 Example 2 Tree of objectives . . . . . . . . . . . . . . . . . . . . . . . . . 65
6.3 Importance Variation . . . . . . . . . . . . . . . . . . . . . . . . . . . . . . 66
6.4 Calculation of the latest start . . . . . . . . . . . . . . . . . . . . . . . . . 67
6.5 Urgency Variation . . . . . . . . . . . . . . . . . . . . . . . . . . . . . . . 68
6.6 Age Variation . . . . . . . . . . . . . . . . . . . . . . . . . . . . . . . . . . 70
6.7 Speed Variation . . . . . . . . . . . . . . . . . . . . . . . . . . . . . . . . . 71
6.8 Prioritized list of tasks . . . . . . . . . . . . . . . . . . . . . . . . . . . . . 71
ix

List of Figures x
7.1 Functional Requirements Completion Ratios . . . . . . . . . . . . . . . . . 73
A.1 Distribution of the Work in the First Semester . . . . . . . . . . . . . . . 80
A.2 Distribution of the Work in the Second Semester . . . . . . . . . . . . . . 82

List of Tables
3.1 Analysis of the Applications . . . . . . . . . . . . . . . . . . . . . . . . . . 30
3.2 Analysis of the Applications . . . . . . . . . . . . . . . . . . . . . . . . . . 31
3.3 Analysis of the Applications . . . . . . . . . . . . . . . . . . . . . . . . . . 32
4.1 Ideas Requirements . . . . . . . . . . . . . . . . . . . . . . . . . . . . . . . 42
4.2 S/M Requirements . . . . . . . . . . . . . . . . . . . . . . . . . . . . . . . 42
4.3 Tasks Requirements . . . . . . . . . . . . . . . . . . . . . . . . . . . . . . 43
4.4 Events Requirements . . . . . . . . . . . . . . . . . . . . . . . . . . . . . . 43
4.5 Projects Requirements . . . . . . . . . . . . . . . . . . . . . . . . . . . . . 43
4.6 Goals Requirements . . . . . . . . . . . . . . . . . . . . . . . . . . . . . . 43
4.7 Vision Objectives Requirements . . . . . . . . . . . . . . . . . . . . . . . . 44
4.8 Life Objectives Requirements . . . . . . . . . . . . . . . . . . . . . . . . . 44
4.9 Areas of Focus Requirements . . . . . . . . . . . . . . . . . . . . . . . . . 44
4.10 Recommendation Requirements . . . . . . . . . . . . . . . . . . . . . . . . 44
4.11 Review Requirements . . . . . . . . . . . . . . . . . . . . . . . . . . . . . 45
4.12 Integration with Web Services Requirements . . . . . . . . . . . . . . . . . 45
4.13 Context Requirements . . . . . . . . . . . . . . . . . . . . . . . . . . . . . 45
4.14 Usability Requirements . . . . . . . . . . . . . . . . . . . . . . . . . . . . 46
4.15 Reliability Requirements . . . . . . . . . . . . . . . . . . . . . . . . . . . . 47
4.16 Supportability Requirements . . . . . . . . . . . . . . . . . . . . . . . . . 47
4.17 Security Requirements . . . . . . . . . . . . . . . . . . . . . . . . . . . . . 47
4.18 Implementation Requirements . . . . . . . . . . . . . . . . . . . . . . . . . 47
xi
Chapter 1
Introduction
This project was developed in the Department of Informatics Engineering (DEI) of
the Faculty of Sciences and Technologies of the University of Coimbra within the the
engineering masters program. It counted with the support of the Center for Informatics
and Systems (CISUC), more specifically the Cognitive and Media Systems (CMS) which
has provided the indispensable workplace to develop the thesis.
1.1 Context
Most people have many different tasks, goals, projects, interests and responsibilities
in life, and in the fast paced world we live in today, all of these grow in number and
diversity all the time. This rising in complexity and quantity of matters to handle makes
it progressively harder to make intuitive choices about which task to execute next.
The possibility of having calendars shared online, where new commitments may be sched-
uled by others, makes this decision problem even harder as it may force a redistribution
of the time necessary for the execution of the tasks and their respective reprioritization
in function of the available time, which renders even more complex and volatile the pre-
vious decisions. The “Getting Things Done” [1] (GTD) methodology for managing time
and tasks, invented by David Allen, has been used by many people to solve these issues
and helping them improve their productivity [2, 3]. Inspired by the effectiveness and
practical results of the GTD, many software applications of productivity and personal
information management that use this methodology were developed, assisting the users
throughout the five steps of the GTD method: the Capturing, Processing, Organizing,
Reviewing and Doing of the tasks.
1

Chapter 1. Introduction 2
Our main goal in this project is to develop a new software tool supporting the GTD
method with a new combination of additional features not yet found in any available
tool. The solution is implemented for laptops and desktop computers
The portability of the notebooks allows the user to access the information of the program
everywhere: at his home, workplace or in a traveling situation. However, is it needed to
take in account that not all programs run in all machines so the necessity of portability
in the application to run in many different platforms is a priority. In order to have an
application that would permit that portability we could have followed options: develop
a web based application or a stand alone application with versions for different operation
systems. We opted for the stand alone because it is crucial that the application allows the
user to aces his productivity systems in the biggest number of scenarios and a web based
application would need always aces to the Internet, which would exclude for example
traveling situations. However in the future we intend to develop a web based version
of the system developed during this thesis to enable the user to acces his productivity
information in other devices beyond his personal computer.
1.2 Problem Identification
None of the GTD applications that exist so far in the market is able to make an effective
dynamic reprioritization of the tasks taking in account the value and relative importance
of them to the user and adjusted to the changes in his schedule. In addition to this,
these applications do not explore all the Horizons of Focus in GTD (the stack of levels
of increasingly longer-term and wider-scope goals), being focused in the two lower ones
giving only importance to Tasks (or Actions) and Projects. Without the levels above,
that represent higher objectives associated with future goals, it is not possible to make
a good prioritization of the tasks to be done next based, ultimately, on the life goals of
the user.
There are other applications that auxiliate the user in the prioritization of their tasks,
nonetheless they do not follow the GTD protocols, that is worldwide recognized as the
most effective personal productivity methodology.
On the other hand, the GTD methodology proposes only a very ad hoc prioritization
scheme. Actually the lack of a specific prioritization method is one of the most common
criticisms to the GTD among the ”GTDers” community.
Chapter 1. Introduction 3
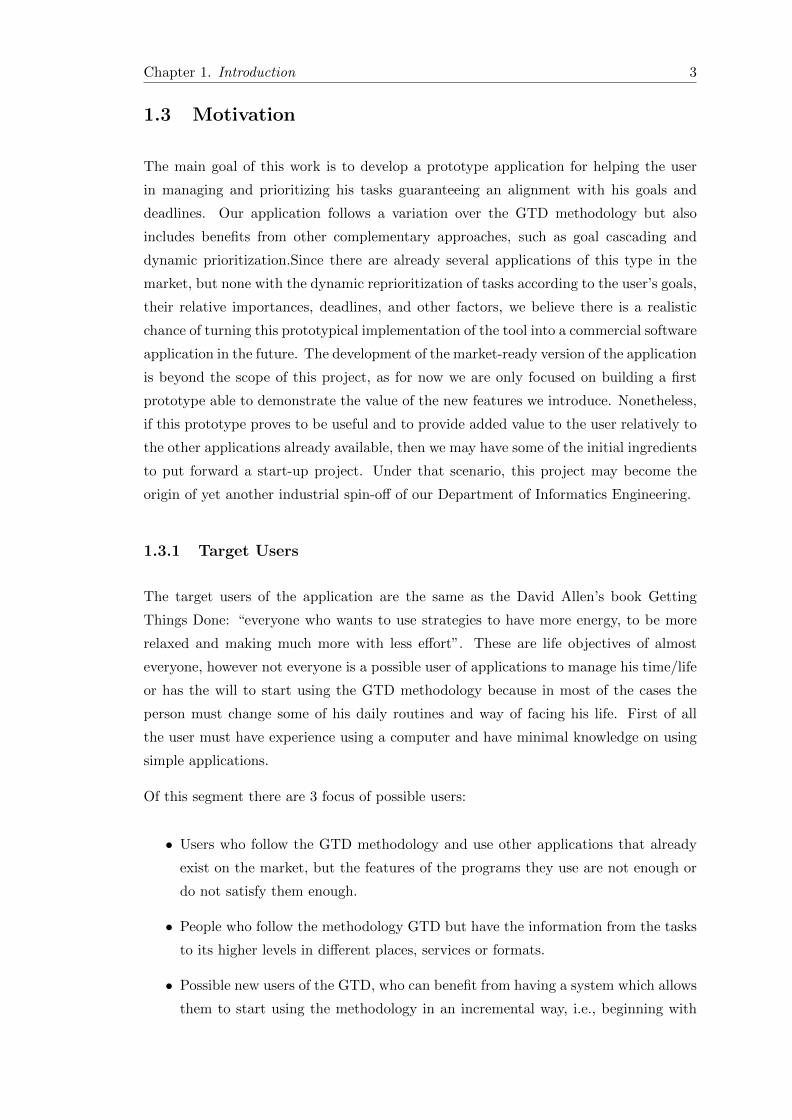
1.3 Motivation
The main goal of this work is to develop a prototype application for helping the user
in managing and prioritizing his tasks guaranteeing an alignment with his goals and
deadlines. Our application follows a variation over the GTD methodology but also
includes benefits from other complementary approaches, such as goal cascading and
dynamic prioritization.Since there are already several applications of this type in the
market, but none with the dynamic reprioritization of tasks according to the user’s goals,
their relative importances, deadlines, and other factors, we believe there is a realistic
chance of turning this prototypical implementation of the tool into a commercial software
application in the future. The development of the market-ready version of the application
is beyond the scope of this project, as for now we are only focused on building a first
prototype able to demonstrate the value of the new features we introduce. Nonetheless,
if this prototype proves to be useful and to provide added value to the user relatively to
the other applications already available, then we may have some of the initial ingredients
to put forward a start-up project. Under that scenario, this project may become the
origin of yet another industrial spin-off of our Department of Informatics Engineering.
1.3.1 Target Users
The target users of the application are the same as the David Allen’s book Getting
Things Done: “everyone who wants to use strategies to have more energy, to be more
relaxed and making much more with less effort”. These are life objectives of almost
everyone, however not everyone is a possible user of applications to manage his time/life
or has the will to start using the GTD methodology because in most of the cases the
person must change some of his daily routines and way of facing his life. First of all
the user must have experience using a computer and have minimal knowledge on using
simple applications.
Of this segment there are 3 focus of possible users:
• Users who follow the GTD methodology and use other applications that already
exist on the market, but the features of the programs they use are not enough or
do not satisfy them enough.
• People who follow the methodology GTD but have the information from the tasks
to its higher levels in different places, services or formats.
• Possible new users of the GTD, who can benefit from having a system which allows
them to start using the methodology in an incremental way, i.e., beginning with

Chapter 1. Introduction 4
the lowest levels and, over time, adapting to it and covering all the levels of the
GTD.
1.3.2 Innovative Characteristics of the work
The first innovative characteristic of the thesis is the reformulation of the GTD method-
ology proposed by Prof. Alexandre Pinto. Although the GTD methodology has been
widely used throughout the world, we believe these changes will help the productivity
of the user.
The second innovative characteristic of this work is a software application which will
have the feature of letting the user create a tree of objectives. The user must then
assign a relative importance to each objective in the tree. This way, the meaning of
the tree is that sibling objectives in a given depth level contribute to the achievement
of their parent goal in the tree. With this hierarchy and with the value of importance
given by the user to each objective we will be able to calculate the importance of lower
objectives in the reach of the ones in higher levels.
Knowing the impact of current objectives in future goals and using other more usual
criteria we will be able to build a recommendation system that will make a prioritization
that has never been before. With this we will improve the productivity of the user
because he will spend less time in the process of deciding which tasks will he perform next
and we will improve the possibility of letting him make the best choices for accomplishing
his goals.
Finally we will provide the possibility of synchronizing the information existent in other
services with the application to give him the possibility to access it in other devices.
1.3.3 Challenges to overcome
First of all, none of the programs that exist in the market make a good mapping of
the 4th (3-5 year Visions) and 5th levels (Life-long Goals and Purpose), because of
the ambiguity of making a computational representation of the future goals and life
objectives of an individual. In addition to this it is necessary to preview the impact of
the tasks (lower level) in the reaching of the goals.
As important as this, the selection of criteria that will define the priority of the tasks
depending of the context where the user is and the other conditions to realize them will
be very important in the process of scheduling.

Chapter 1. Introduction 5
In terms of usability, making a graphical user interface allowing the user to easily and
effectively benefit from the application without losing its full features is also one of the
important trade-offs of the project. Making an application with the capacity to work
offline, to be integrated with other services and with the capacity of syncing in the cloud
and be robust to resist to eventual problems related to internet failures is also a priority.
1.4 Document Structure
In this section we present the structure of the document.
In Chapter 2 we explain the GTD methodology focusing on the Workflow Map. In this
chapter we also present the alteration of this methodology proposed that we used for de-
veloping the prototype of the application and other methodologies which are alternatives
to the GTD.
In Chapter 3 we present the State-of-the-Art of GTD-following applications. It is divided
in 4 sections. In the first one we make a brief description of each application studied, in
the second one we describe the comparative vectors used to compare the applications, in
the third one we make a critical analysis of them and in the last section we summarize the
algorithms that were studied to inspire the creation of our recommendation algorithm
and other goal decomposition techniques.
In Chapter 4 are present the gathering of functional and non functional requirements
needed for development of the application, the uses cases diagram and the sequence
diagrams designed.
In Chapter 5 we present the architecture of the application which is divided into three
sections: First Level Architecture, where we present a simple view of the architecture,
Second Level Architecture, where we present the different layers of the architecture and
a detailed description of each one and Technologies, where we present the reasons for
the choice of the technologies used.
In Chapter 6 we present the mechanisms implemented in order to provide to the appli-
cation the feature that suggests to the user what tasks he should perform next.
In Chapter 7 we present the procedures followed by us to verify if the application meets
the Functional Requirements presented in the first semester and if the mechanisms de-
veloped to aid the user choosing the tasks to perform are valid.
In Chapter 8 we present the Conclusions and Future Work of the application developed.

Chapter 2
Background and Proposed
Approach
2.1 The Getting Things Done Methodology
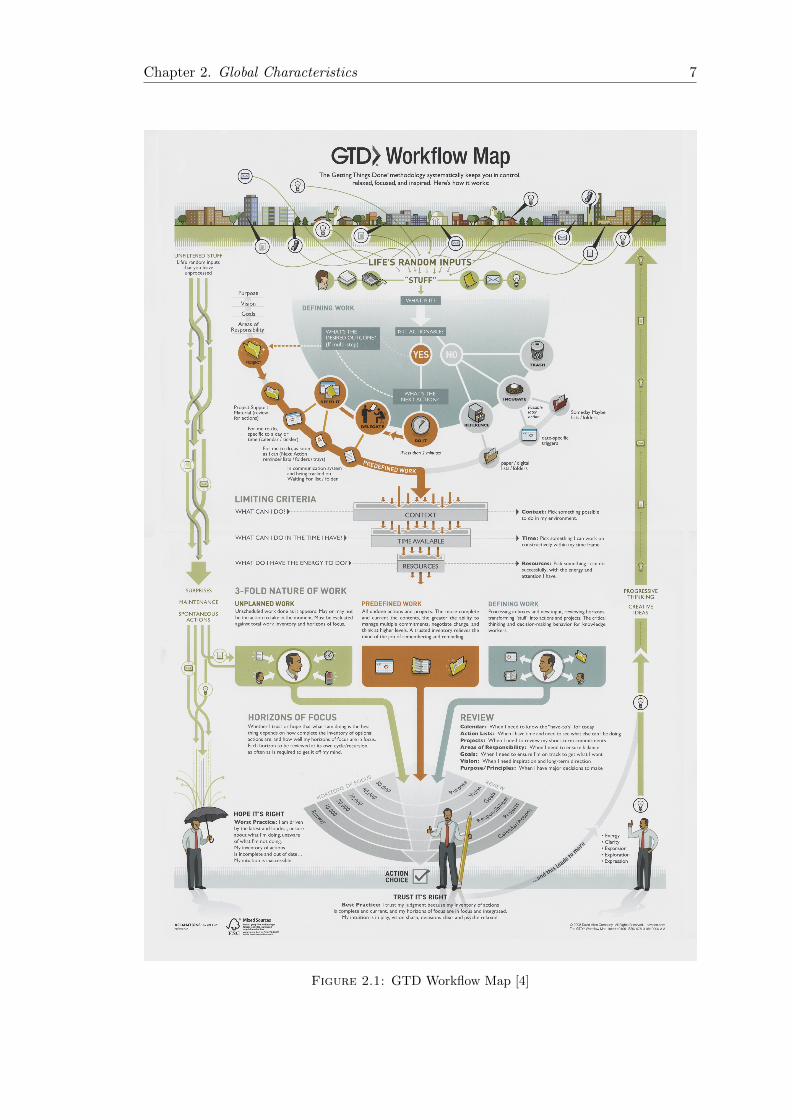
This thesis is based on the GTD methodology and focuses particularly in the Workflow
Map, which is David Allen’s way of getting control and perspective over all tasks at
hand.
6
Chapter 2. Global Characteristics 7
Figure 2.1: GTD Workflow Map [4]

Chapter 2. Global Characteristics 8
2.1.1 The GTD Workflow
The Workflow is divided in two parts: the horizontal processing which involves the col-
lect of ideas, transforming them into possible actions and choosing what actions to do
next (control) and the vertical processing where there is a decomposition of personal ob-
jectives in several levels, each one associated to certain abstraction scope (perspective).
2.1.1.1 Horizontal Processing
The horizontal axis is composed of five stages: Collect, Process, Organize, Review and
Do.
Collect
The first stage in the Workflow Horizontal processing of the GTD methodology is gath-
ering any life random inputs and putting them in a trusted system. These inputs consist
in everything in a person’s that requires some action or consideration from his part. In
his book, David Allen defends the practice of capturing every life’s random input with
the objective of having everything out of the person’s head. This way, all the “gotta
remember” thoughts which would be taking valuable brain space, fracturing a person’s
focus, adding stress and robbing use of mental capacity, are not present in the person’s
head giving the opportunity for using it for a more creative and productive use. All of
this captured input can be collected into a physical inbox with sheets of paper, or in a
electronic document in a word processor, or any equivalent format.
Figure 2.2: Collect
Process
After the life’s input have been saved in the system in the Collect process, the information
of them must be processed, which leads to the next step in the GTD Workflow Map:

Chapter 2. Global Characteristics 9
Process. In this step all the items that were stored in the Collect are analyzed and their
meaning defined.
Outcomes and next actions are determined for actionable items and non actionable items
are identified as trash or as something potentially actionable in the future or reference
material. However if the item is actionable and takes less than two minutes to be
performed it should be done immediately. In this process the unclear stuff present in
the inbox is processed into defined work.
Figure 2.3: Process
Organize
In this step of the GTD Workflow is defined where and how will be stored actions and
support material that has been processed. There are four main lists where the processed
items are stored:
• Projects List: Goals that need more than one action to be completed
• Waiting List: Outcomes that are to be achieved by other people and that are
relevant to our goals
• Next Actions: Actions that should be done as soon as possible

Chapter 2. Global Characteristics 10
• Calendar/Agenda: Actions that have to be done on a specific date and/or
time
Other information that should be added to the items in this process is the context where
the action can be performed. This includes its location, tool or people needed to perform
it. This information can be used to filter out actions that are unavailable in the user’s
current context when deciding what to do next.
Figure 2.4: Organize
Review
The review process of tasks, projects and other goals is a critical factor in the GTD
methodology. In David Allen’s words, it is the “glue that keeps it all together”. It is
necessary to ensure that the system is kept “up to date” and if any of the someday/-
maybe tasks should be executed. However each horizon level should be reviewed in
different time intervals, e.g., Runway (actions) once a day, 10k-Projects once a week,
20k- Areas of Focus once a month, 30k-Goals every 3 months, 40k-Vision goals once
a year, and 50k-Life Goals every four years. Also for the next phase of the horizontal
workflow, the Do process, there is the need of having all the information up to date in
order to let the person choose what actions should be done next.
Do
In this phase the person chooses which tasks should be performed using the information.
Having the list of next task the user must apply some criteria to choose what will be his

Chapter 2. Global Characteristics 11
actions. The first criterion is the context, which , as was previously said, consists in the
environment where each task can be performed. In this filter only the actions that can
be performed in the actual environment are picked.
After this selection, the next step is to see the time available at the moment and the
tasks that exceed that time frame are discarded. The last criterion is the resources where
the person compares the necessary energy to perform a task with the energy he wants
to spend, so all the tasks that exceed the limit imposed by him are discarded. After the
end of this process the user should have a “filtered” list of the actions that he can do at
a determined moment. This provides a great facility for the GTD user because having
to decide between a wider range of tasks than the one received in the end of this process
takes much more time and energy.
Figure 2.5: Do
2.1.1.2 Vertical Processing
In his book “Getting Things Done: The art of Stress-Free Productivity”, David Allen
defends that managing the flow of work can be approached from many horizons as there
are many different levels of defining what “work really is”. Whereas there may be some
lower levels in control, there are often incomplete and unclear issues at higher levels
that needed to be addressed, to get it all under control. So there is the necessity of to
categorize “work” in different levels of focus. David Allen uses the take off of a plane as
a metaphor for representing the different levels of focus:
• Runway (Actions): huge volume of actions and information needed to do and
organize. This includes emails, call, memos, stuff to be read or processed. . .
• 10 000 feet level (Projects): Inventory of the projects, in other words, all the
commitments that take more than one action to complete. Every group of tasks
that contribute to a certain objective belong to the same project. For example if
a project is to “have a dinner with friends” some tasks have to be completed: talk
with John and Mary to set the date, choose the restaurant, make the reservation
and drive the car to the place.
Chapter 2. Global Characteristics 12
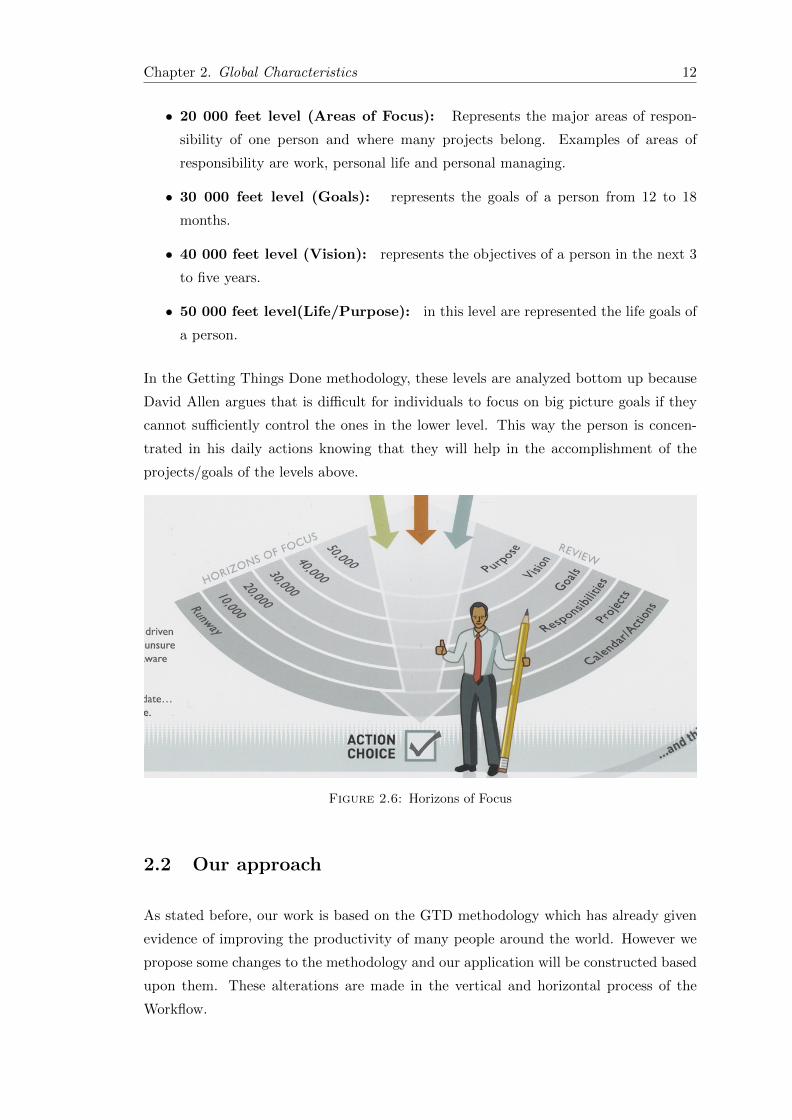
• 20 000 feet level (Areas of Focus): Represents the major areas of respon-
sibility of one person and where many projects belong. Examples of areas of
responsibility are work, personal life and personal managing.
• 30 000 feet level (Goals): represents the goals of a person from 12 to 18
months.
• 40 000 feet level (Vision): represents the objectives of a person in the next 3
to five years.
• 50 000 feet level(Life/Purpose): in this level are represented the life goals of
a person.
In the Getting Things Done methodology, these levels are analyzed bottom up because
David Allen argues that is difficult for individuals to focus on big picture goals if they
cannot sufficiently control the ones in the lower level. This way the person is concen-
trated in his daily actions knowing that they will help in the accomplishment of the
projects/goals of the levels above.
Figure 2.6: Horizons of Focus
2.2 Our approach
As stated before, our work is based on the GTD methodology which has already given
evidence of improving the productivity of many people around the world. However we
propose some changes to the methodology and our application will be constructed based
upon them. These alterations are made in the vertical and horizontal process of the
Workflow.

Chapter 2. Global Characteristics 13
2.2.1 Horizontal Processing
In the GTD the Review stage comes before the Do because it is in that step that the
user refreshes his own memory of which goals, projects and tasks have higher priority.
This intuitive information is then used in the Do phase.
In our perspective of the horizontal view of the workflow the Do stage swaps position
with the Review. In this proposed new setting, the Do stage includes a prioritization
phase, which can be automated, whereas the subsequent Review stage is concerned only
with keeping the information in the system up to date.
Since we are implementing a software application that supports this new version of the
GTD method, it will be the application’s job to automatically calculate the priorities of
each task and project, leaving the user ready for the Doing, and performing the Review-
ing a posteriori. The application calculates the priorities using relative importances,
deadlines, and other relevant information, and then recommends a task execution order
based on those priorities.
This way we replace the process of reviewing as something heavy and that takes a lot
of time for something more simple that can be divided into smaller amounts of time.
Moreover, these times of reviewing oblige the user to reflect about his long term goals.
Other refinement that we added is in the process of selecting from the list on next
actions, the ones that may be performed. Nowadays the context of the actions is not as
important as it was in the time that David Allen wrote the book where he explains the
GTD methodology (2002). Now the technology allows a person to do most of his tasks
like responding to emails, business conversations or writing reports almost anywhere
thanks to the existence of devices like smart phones and laptops and wireless internet.
So in the task recommendation feature of our application we will use four attributes that
we think are the most important in the decision criteria instead of the 3 selection criteria
of the GTD method: 1)Urgency: time left until the due date of the task; 2)Importance:
importance of the task to accomplish the goals of the user; 3)Speed: duration of the task;
and 4)Age: time elapsed since an action of the same project has last been performed.
this approach is based on the Eisenhower Matrix, where is calculated the priority of an
action using its urgency and importance [5]. We developed a mechanism that gives more
importance to the attributes that are more significant to the user in the choice of what
task to perform next.

Chapter 2. Global Characteristics 14
2.2.2 Vertical Processing
In the vertical perspective of the GTD workflow, David Allen defends that there are
6 horizons of focus. All of them except the third level (counting from the bottom up)
consist in a number of goals that need to be completed, in other words, everything in
these levels consist in something that needs to be done or achieved. As said before, an
Area of Focus is an area in life and work that a person is responsible for, and thus is
a grouping of goals, not a goal itself. Due to this change of perspective, in our version
of the methodology, which our application uses, the third level (20 000 feet - Areas of
Focus) is removed. Instead, the goals in each remaining level — task, project and goal
(from the 30 000 level upwards) — are assigned to a level-specific Area of Focus. Each
level is thus comprised of several Areas of Focus, each containing several goals.
Figure 2.7: Areas of Focus
With our application the user inserts his/hers goals in the correspondent horizon level,
and specific Area of Focus. We allow the user to specify the relative importance of each
goal, and the relationship between objectives of different levels in a parent-goal/child-
goal fashion, and use this information to calculate the importance of each in the reach
of others that are in a “higher” level. To accomplish this, the representation of the
horizons of focus and the relations of the “entities” with the others in the levels above
will be represented by a tree structure where a leaf node represents an action or task,
which are connected to their respective parent projects. Climbing up the tree, each level
corresponds to a higher horizon of the GTD methodology. Every Life goal is connected
to the same node which is the root of the tree. The user can create goals for any
horizon level. After the creation he must choose for which one of the nodes in the
level above will the new task/project/goal be connected (the nodes in the life goal level
will automatically be connected to the root) in order to ensure cohesion of the horizons.

Chapter 2. Global Characteristics 15
This decomposition of objectives into sub objectives is aligned with the Cascading Goals
however we adapted them for our specific context [6].
2.3 Alternatives to the GTD
2.3.1 The One Minute To-Do List
The One Minute To Do [7] is a methodology for Time and Task Management developed
by Michael Lineberger. In this methodology, Michael Lineberg defends that actions/-
goals, named items, should be divided into three lists: Critical Now, Opportunity Now
and Over the Horizon. In the Critical Now List, should be put the items which have as
due date the current day. In the Opportunity Now List, should be put the items that do
not have as due time the current day but, if the user is able to empty his Critical Now
List, the user can perform them. In the Over the Horizon List should be put the items
that have a due date longer than ten days from current day. This process allows the
user to empty his mind of information that do not contribute for the creative process,
which is common to the GTD in the process of Collect and organize the items in lists
based on the item’s urgency, which facilitates the choice of the next tasks to perform.
The review process is also present in this methodology, where Mark Linenberger defends
that the Critical Now List should be reviewed every hour, the Opportunity Now List
once a day and Over The Horizon List approximately every week.
This approach is much more simple that the one of the GTD and can be useful for
people who have to manage a small amount of information and the time spent to keep
it up to date can be smaller than in the David Aleen’s methodology. However, in our
perspective, if the amount of information that the user need to handle is too big, this
system may not have the same benefits of the GTD. First of all, dividing the items in
only three lists can be a bad solution because when the amount of information grows
longer will be the lists and the process of review each one will take more time and be
more tiring for the user. In addition to this, there is not a specification what item is like
in GTD that can be a task, goal, project, idea... The specification of item in GTD allows
the user to differentiate the information in the system, which helps him in what to do
with the information. Another advantage of the GTD is allowing the user to associate
projects and tasks in the achieving of longer term goals, which is not possible in The
One Minute To-Do List because the items are arranged only by urgency and not the
benefits for the user.

Chapter 2. Global Characteristics 16
2.3.2 Pomodoro Technique
The Pomodoro Technique is a time management method developed by Francesco Cirillo.
The analysis was based in the book Pomodoro Technique Illustrated [8] written by
Staffan Noteberg. In this technique the user divides his productivity information in
three lists: To Do Today List, Activity Inventory List and Records List. In the To Do
Today List the user should put the tasks he expects to perform in the current day, in
the Activity Inventory List he should insert the upcoming activities he should perform
in the near future and in the Records List the metrics used to compare his productivty.
In order to keep this lists up to date, this methodology is divided in five stages:
• Planning: in the begin of each day the user should choose the tasks he will
perform by selecting them from the Activity Inventory List and puting them in
the To Do Today List.
• Tracking: In this phase the user performs the tasks of the To Do today List.
Francesco Cirillo defends that the user should wind up a timer for 25 minutes and
start the first time. In these 25 minutes he should only focus on the task and when
the time has passed he should record the number of time he got interrupted. He
defends also a 3-4 minutes pause between the task to the user regain focus. After
the time for pause is passed the user should wind up the timer and if the tasks is
not complete he should continue it otherwise he should choose the next one in the
list.
• Recording: At the end of the day the user should merge all the distractions
recorded in the same place.
• Processing: After the information is gathered in the recording step, it should be
processed in order to evaluate the impact of the distractions in the daily work of
the user.
• Visualizing: In this step the user should compare the information processed of
the current day to the one in the Records List, and update it in order to check for
improvements in his productivity.
This approach is much simpler that the GTD and can be a good choice for users who
only want to include in his productivity system more ”actionable stuff” and want to keep
records of their productivity. We also think that the 25 minute rule in the Tracking phase
can be a complement for the Do phase for people who can have some problems om focus-
ing when performing their tasks. However this approach is too simple comparing with
the GTD. First of all, there is no definition of what work is in the Pomodoro technique

Chapter 2. Global Characteristics 17
as it is specified in the Vertical Perspective of the GTD. Secondly, all the information of
future tasks is stored in one list (Activity Inventory) with no differentiation, being the
process of Planning much more tiring and taking a longer period of time than in the
GTD where the tasks are divided in projects and have the context specified. And the
non existence of work hierarchy makes impossible to represent the impact of the tasks
in the achieving of longer term goals.

Chapter 3
State of the Art and Related
Work
In this chapter, we review some of the existent commercial software tool that provide
the user a digital platform for the use of the GTD methodology and we will make a
review of scheduling algorithms that were studied in order to inspire the creation of our
recommendation algorithm.
The choice of the studied applications was made taking into account some of the func-
tions that we intend to develop, such as: platform where can be run, integration with
other systems, support to work offline, mapping of the GTD higher levels and prece-
dences/parallelism between actions. There are other applications in the market however
we decided to focus in the most used.
The choice of the studied algorithms was made taking in account their characteristics
that could be applied to our recommendation in order to calculate the priority of each
task.
3.1 State of the Art Applications
This section provides a brief description of several existing tools on the market that
provide the user a digital interface for the use of the GTD methodology.
OmniFocus
OmniFocus [9] is an application for Mac OS X , iPad and iPhone with a very simple
GUI developed by the Omni Group [10]. It focuses on the top down level of the GTD
18

Chapter 3. State of the Art and Related Work 19
methodology and allows the user to create tasks, adding them to projects and give them
contexts where they can be performed. The main feature of this tool is the Focus that
allows the user to see in every tasks with a certain context or from the same project.
Other important tool of the OmniFocus is the possibility of associating files with the
tasks and the grouping of projects within possibly nested folders. The Omni Focus has
also the feature of presenting the list of the non complete tasks ordered by by earlier
due date.
Figure 3.1: OmniFocus Screenshot [11]
Things 2
Things [12] is a complete task manager for the use of the GTD methodology developed
by Cultured Code [13]. It includes the process of collecting ideas, processing them into
tasks, someday actions or projects. This tools also provides the user the creation of
Areas of Focus which can be associated to tasks. The existence of contexts in tasks is
also present and is it possible to filter the tasks by context or project. It contains also
a very simple recommendation system where the only weight taking into account is the
urgency of each task: a list of tasks is presented ordered by earlier due date and its
remaining time to the end date is focused.

Chapter 3. State of the Art and Related Work 20
Figure 3.2: Things 2 Screenshot [14]
Inbox Classic
Inbox Classic [15] is a GTD platform developed by Midnight Inbox [16] for Mac Os X,
IPhone and IPad. It follows the flow of the GTD and includes the several steps of the
methodology: Collect, Process, Organize and Review. This application also supports
the addition of Reference Material, the archival of tasks and a system of trashing and the
deleted actions are saved in a tools similar to the Recycle Bin or Trash of the operating
systems (is in the deleted list but is kept in the system).
Figure 3.3: Inbox Classic Screenshot [17]
IQTell
IQTell [18] is a tool for the use of the GTD focused in having all the information for
performing the daily tasks in the same place. It is a web based application and is also

Chapter 3. State of the Art and Related Work 21
available for Android and iOS. Its stronger points are the syncing of information with
calendar services, Email Provider Systems and with the Evernote [19] 1. This tool does
not follow The GTD Work Flow and follows a more common traditional method of the
task managers: the Collect and Process do not exist so the first process is the creation
of the tasks/processes.
Figure 3.4: IQTell Screenshot [20]
Life Balance
Life Balance [21] is a time management software developed by Lamagraphics [22]. This
application does not have a defined structure of the GTD horizon levels and gives the
user the possibility to create a dynamic tree structure of goals of its own. The tasks
created can be inserted into projects and values of time and importance can be given to
them. It has a very simple recommendation system of the next tasks to be performed
that can be shown in the screen letting the user choosing one of three parameters: a
defined project, due date and importance.
1Evernote is an easy-to-use, free application that helps the users remember everything across all ofthe devices they use. Evernote lets the client take notes, capture photos, create to-do lists, record voicereminders and makes these notes completely searchable, whether the location of the user.

Chapter 3. State of the Art and Related Work 22
Figure 3.5: Life Balance Screenshot [23]
Producteev
Producteev[24] is a team oriented task manager developed by Jive [24]. Like in IQTell,
in Producteev the steps of Collect and Process do not exist, being the first one of the
workflow the creation of tasks/projects. The main focus of this application is the feature
of sharing projects and tasks with other users of the service, having a very simple and
effective solution for the Waiting For tasks (actions that have been delegated to others
and the person is waiting for them to be finished).
Figure 3.6: Producteev Screenshot [25]
ThinkingRock
ThinkingRock [26] is a GTD software platform developed by Avente Pty [27]. This
tool follows the GTD workflow in its entire scale being all the steps presented in the

Chapter 3. State of the Art and Related Work 23
application, having an interactive diagram similar with the workflow to user to navigate
between the different steps of the methodology. Thinking Rock does not have integration
with other services and all the information is stored in a local database.
Figure 3.7: ThinkingRock Screenshot [28]
Toodledo
Toodledo [29] is a tool developed to improve the productivity of the users by . It allows
the integration with a great number of other services and it is highly customizable.
Another important feature of Toodledo is the sorting of the next actions to be performed
that can be sorted by due date or importance.
Figure 3.8: Toodledo Screenshot [30]
ToDoist
ToDoist [31] is a productivity manager developed by Doist[32] available in many plat-
forms. Provides integration with a great number of other services and has the a feature

Chapter 3. State of the Art and Related Work 24
call “Karma” which is a visual tracking system that monitors the user’s task manage-
ment activities and let him visualize his productivity. In terms of the GTD workflow is
only limited to Tasks and Projects being and Areas of Focus and the three higher levels
are not present.
Figure 3.9: ToDoist Screenshot [33]
NirvanaHQ
NirvanaHQ [34] is a software for managing personal tasks following the GTD methodol-
ogy. Follows a simple methodology being only present the two more down levels of the
GTD Horizon Levels. Includes the Collect process to the user store his ideas of possible
tasks or projects. These tasks can be inserted in projects, be added to the Waiting list,
scheduled or marked as Someday/Maybe.

Chapter 3. State of the Art and Related Work 25
Figure 3.10: NirvanaHQ Screenshot [35]
Asana
Asana[36] is a team oriented task manager developed by the company with the same
name. It allows the creation of tasks and projects that can be shared with the rest of
a team and allows the delegation of them to a certain individual. It provides also a
system where the user can store his personal tasks and projects and a sub menu with
the information of the next tasks to be performed.
Figure 3.11: Asana Screenshot [37]
RememberTheMilk
Remember the Milk [38] is a tool for managing personal productivity following the GTD
methodology. Includes several of the processes of the GTD Workflow, Collect, Process

Chapter 3. State of the Art and Related Work 26
and Organize and a list of the tasks that should be performed taking in account their
due date. Provides also a integration with other systems and has a resume of the time
that the next tasks that have to be performed take and the number of them which have
passed theirs overdue date.
Figure 3.12: RememberTheMilk Screenshot[39]
Wunderlist
Wunderlist [40] is a simplified task manager with the objective to provide a tool “free of
unnecessary features”. Following this paradigm it only allows the creation of tasks and
projects where they can be inserted, being the GTD WorkFlow not followed. It provides
also the display of all the tasks with the due date of the current day, current day or that
were flagged by the user.
Figure 3.13: Wunderlist Screenshot [41]

Chapter 3. State of the Art and Related Work 27
3.2 Comparative Vectors
In this section we present the different vectors of comparison that we used to compare
the GTD applications.
3.2.1 Non Functional Vectors
Platforms This vector includes the different platforms where the application can be ac-
cessed. It is very important because this feature allows the user to access his productivity
information in different devices.
Price In this vector we analyze if the application is free, paid or if the user has to pay
to access certain features.
Integration In this vector we analyze if the application has the feature of importing/-
exporting information from external web services and which kind of information is able
to exchange.
Support to work Offline This binary vector refers if the application allows the user
to use it if there is no Internet connection. Availability is an important requirement for
a GTD application because the user must have access to his information in the biggest
number of possible scenarios.
3.2.2 Information Vectors
Contexts per Action The number of contexts per action is an important vector of
comparison of the applications studied: in his book David Allen defends that a task
should have one context which corresponds to a location, or a tool or a person needed
to perform it. However, in our perspective, tasks should have more than one context
because they may need more than one type of context to be performed.
Precedences/Parallelism between Tasks In this vector is analyzed if the applica-
tions allows the user to define if an action should be performed only after the conclusion
of another (existence of precedences) or if within the application’s logic all actions can
be performed at the same time (parallelism). This existence of precedences between task
is fundamental because eliminates from a list of possible action the ones who cannot be
performed because previous tasks need have not been completed.
Begin Date In this vector we analyzed if the applications allows the user to add a begin
date to tasks/projects. This information can be very useful because if an action is only

Chapter 3. State of the Art and Related Work 28
possible to be performed after a certain date, the system should allow the user to add
this information to the task, helping him in the decision of the next actions to perform.
Duration In this vector we verify if the application allows the user to insert the time
that takes a task to be performed in the system. This information is important in the
decision of the next tasks to be performed because the user can have a limited available
time.
Subtasks In this vector we analyze if the application allows the creation of a list of
subtasks per task. In the GTD Methodology David Allen defend that tasks that are not
”complete enough” to be a project can be divided into smaller tasks (subtasks) which
help the user to divide his actions into smaller ones.
Tags In this vector is verified if the application supports the adding of keywords to
tasks or projects. The usage of tags can grant benefits to the users because it allows the
association of tasks/projects with the same keyword and facilitates the search operations.
Level of importance In this vector we verify if the applications allow the user to add
a value of importance to a task or project. This parameter can be important in the
decision of the next tasks to perform because the value of the output of the action can
be an important criteria for the choice.
3.2.3 Organizational Vectors
Areas of Focus In this vector is analyzed if the application allows the creation of
Areas of Focus, where the projects can be associated to in order to divide them for area
of responsibility. The Areas of Focus is a fundamental level of the Horizons of Focus
because help the user separating his projects he has to perform daily into areas he should
keep his eye on.
Mapping of the GTD Higher Levels In this vector we analyze if the applications
map the 3 higher levels of the GTD methodology: Goals, Vision and Life Objectives. The
mapping of the higher levels is a very important feature because in the GTD method-
ology is analyzed the impact of projects and tasks in the achievement of longer terms
objectives.
Tree of Objectives In this vector we analyze if the application has the feature of
providing a tree structure where the user can see his productivity information stored in
the system, organized by level of the Horizon of Focus Hierarchy. This feature allows the
user to see all his goals from higher level and visualize the impact of tasks and projects
for the reach of future goals.

Chapter 3. State of the Art and Related Work 29
3.3 Critical Evaluation of the Applications
In this section we present the results of the analysis of the applications studied. We
used the vectors of comparison explained in the previous section to compare them and
presented the results in a table structure. After the results were collected we made an
evaluation of them and analyze what features could also be used in our prototype and
show that no software available has some characteristics we pretend to create.

Chapter 3. State of the Art and Related Work 30
Nam
eP
latf
orm
sP
rice
Inte
grat
ion
Su
pp
ort
tow
ork
offlin
eC
onte
xts
per
Ac-
tion
Om
niF
ocu
sM
acO
SX
,iP
hon
e,IP
ad79,9
9,
19,9
9,
39,9
9iC
al
Yes
1
Th
ings
Mac
OS
X,
iPh
one,
IPad
49,9
9,
9,9
919,9
9N
oY
esM
any
Inb
oxC
lass
icM
acO
sX
,iO
SF
ree
Em
ail
,C
ale
nd
ars
,S
afa
rib
ookm
ark
sY
es1
IQT
ell
Web
,A
nd
roid
iOS
Fre
eE
,C
ale
nd
ars
,C
onta
cts
and
Task
sY
es1
Lif
eBal
ance
Mac
Os
X,
Win
-d
ows,
iOS
39,9
5,
39,9
5,
4,9
9iC
al
Yes
1
Pro
du
ctee
vW
eb,
Mac
OS
X,
iPh
one,
An
dro
idF
ree
No
Yes
No
Th
inkin
gRock
Win
dow
s/L
inu
x/
Mac
Os
X/
An
-d
roid
/iO
S
Fre
e(v
2)
,19,9
9(v
3)
Em
ail
Yes
1
Tood
led
oiO
s,A
nd
roid
,B
lack
Ber
ry,
Web
Fre
e,14,9
9,
29,9
9,
89,9
9(y
)G
oogle
Cale
nd
ar,
Gm
ail
,T
wit
ter,
iCal,
RS
Sre
ad
ers
an
dF
iref
ox
Ap
ps
1
ToD
oist
Web
,A
nd
roid
,iO
sW
ind
ows,
Mac
Os
Fre
e,29/y
,C
ale
nd
ars
Yes
Tags
Nir
van
aHQ
Web
,A
nd
roid
(bet
a),
iOS
Fre
e,5/m
onth
,39/y
No
No
Many
Asa
na
OS
X,
And
oid
,iO
s,W
ebA
nd
roid
Bla
ck-
Ber
ryiP
ad
iPh
on
eiP
od
Web
Em
ail
,iC
al,
Cale
nd
ar,
oth
erca
l-en
dars
Yes
No
Rem
emb
erT
he
Mil
kiO
s,A
nd
roid
,W
un
-d
erkit
Win
dow
s,O
SX
,W
eb
Fre
e,25/m
onth
Em
ail
Yes
1
Wu
nd
erli
stiO
S,
An
dro
id,
Win
-d
ows,
OS
X,
Web
Fre
e5d
ol/
month
No
Yes
Yes
Table3.1:
An
aly
sis
of
the
Ap
pli
cati
on
s

Chapter 3. State of the Art and Related Work 31
Nam
eP
rece
den
ces/
Par
alle
lism
Beg
inD
ura
tion
Su
bta
skss
Tags
Om
niF
ocu
sP
rece
den
ces
Dat
eY
esY
esN
o
Th
ings
Par
alle
lism
No
Yes
No
Yes
Inb
oxC
lass
icP
aral
leli
smD
ate
Yes
Yes
No
IQT
ell
Par
alle
lism
No
No
No
Yes
Lif
eBal
ance
Par
alle
lism
Dat
ean
dti
me
Yes
No
No
Pro
du
ctee
vP
aral
leli
smN
oN
oY
esY
es
Th
inkin
gRock
Par
alle
lism
Dat
ean
dT
ime
Yes
Yes
Yes
Tood
led
oP
aral
leli
smD
ate
and
Tim
eN
oY
esY
es
ToD
oist
Par
alle
lism
No
No
No
Yes
Nir
van
aHQ
Par
alle
lism
Dat
eY
esN
oY
es
Asa
na
Par
alle
lism
No
No
Yes
Yes
Rem
emb
erT
he
Mil
kP
aral
leli
smD
ate
and
Tim
eY
esN
oA
ctio
ns
Wu
nd
erlist
Par
alle
lism
No
No
Yes
Yes
Table3.2:
An
aly
sis
of
the
Ap
pli
cati
on
s

Chapter 3. State of the Art and Related Work 32
Nam
eL
evel
sof
Imp
or-
tan
ceA
reas
ofF
ocu
sM
app
ing
Hig
her
Lev
els
Tre
eof
Ob
jec-
tive
s
Om
niF
ocu
sF
lag
No
No
No
Th
ings
Act
ion
san
dP
roje
cts
Yes
No
No
Inb
oxC
lass
icN
oY
esN
oN
o
IQT
ell
Act
ion
sN
oN
oN
o
Lif
eBal
ance
Act
ion
san
dP
roje
cts
No
No
No
Pro
du
ctee
vA
ctio
ns
No
No
No
Th
inkin
gRock
Act
ion
san
dP
roje
cts
Yes
Act
ion
s,P
roje
cts
and
Goa
ls
No
Tood
led
oA
ctio
ns
and
Pro
ject
sN
oY
esN
o
ToD
oist
Act
ion
san
dP
roje
cts
No
No
No
Nir
van
aHQ
No
No
No
No
Asa
na
No
No
No
No
Rem
emb
erT
he
Mil
kA
ctio
ns
No
No
No
Wu
nder
list
No
No
No
No
Table3.3:
An
aly
sis
of
the
Ap
pli
cati
on
s
Chapter 3. State of the Art and Related Work 33
3.3.1 Non Functional Vectors
Platforms
All the applications studied provide the user to access the system in different platforms
that include mobile devices, browsers and standalone applications. We can conclude of
this that the information of our system should not only be accessed in the computer itself
but also in mobile environments. This way the better solution would be to develop an
application with a version for computer and mobile devices. However, we did not have
the time and the human resources needed to develop different versions of the application.
So, for now, we developed a stand alone application for Windows, Linux and Mac OS
X and wi will analyze the accepting of the users. If the application has the expected
success, we intend to launch in on the market and develop the mobile versions of it.
Price
From the applications studied, only Inbox Classic and IQTell (Which is in a beta phase)
are completely free. All the others are paid or the free version implies that the user has
not access to all of it features, which include different platforms environments. In our
project we developed a prototype that should be free, however, in the case we continue
his development in the future, selling it has a payed application should not be put aside.
Integration
Most of the applications support integration with other systems. As we can see in the
table, the most external services used are services of Email, Calendar and Contacts.
In our interpretation, the developing of a system who would synchronize with Email
providers would take too much time, so it was discarded. In the other hand, the inte-
gration of the application with a calendar service was implemented. The chosen service
was Google Calendar due to his popularity and features [42]. However, like the most
applications have versions for mobile devices, few of them synchronize information with
notes/tasks managers. Since we developed a standalone application that allows the user
to check his task list in mobile environments without needing to develop a version for
them, we opted for Evernote to store and present this information to the user due to
this service having a great number of users and recognized quality [43].

Chapter 3. State of the Art and Related Work 34
Support to Work Offline
Almost every application allows the user to reach when there is no Internet connection.
Following these examples our application has the mechanisms that provide this feature.
3.3.2 Information Vectors
Contexts per Action
Most of the applications support adding contexts to the actions. However only Things,
ToDoist, NirvanaHQ and Wunderlist support associating more than one context per task.
In these applications we can find two different approaches: in Things and NirvanaHQ
the input fields are explicit as contexts and in ToDoist is possible to add the conditions
where the task can be performed using tags. In our opinion, giving a specific input for
the Contexts is a better approach because, besides the fact of being more intuitive to
the user, it incentives him to insert this information when he creates a task, which is a
good practice defended by David Allen.
Precedences / Parallelism
In all the applications analyzed only the OmniFocus allowed the adding of precedences
between tasks. However, the only purpose of this information in OmniFocus, is aiding
the user in the choice of the next actions to perform by telling him that a certain task
can only be performed if another has been completed. In our solution, we go beyond,
using this information to present in the recommendation system the only the actions
that can be performed at that moment.
Begin
A majority of the applications allow the user to add a begin date to tasks. This informa-
tion can be very important when the user decides the next actions to perform because
he can put aside the ones that cannot be performed in that time. Like in LifeBalance,
Toodledo and RemeberTheMilk, we opted for giving the user the possibility of adding a
date and time for task or project because is added a more specific time when the action
can be performed which will give better results in the recommendation algorithm: if we
constrained only to the date the system could recommend tasks that could be performed
in the certain day however at the wrong time.

Chapter 3. State of the Art and Related Work 35
Duration
Almost every application studied allows the user to add an estimated time duration
to a task. This is important because, in many situations, the user has a determined
amount of time to perform tasks and the duration is a critical attribute for his choice.
In addition to this, we did the same because is fundamental for the recommendation
algorithm that the actions have a duration because is one of the arguments analyzed by
it.
Tags
In most of the application studied, the system allows the user to add keywords to the
tasks/projects. Like it was said before, this can help in the association of tasks/projects
and facilitates the search operations. However, in our perspective, the usage of tags
can result in a bad interpretation of the methodology of the GTD because it allows the
user to make his own structure of goals which can deteriorate the results of David Allen
studied for years. Our redefinition of the GTD has the objective of providing a better
productivity for the user of the application, so if we allowed the user to add tags to a
task or projects, they would only be used in searching operations.
Levels of Importance
Most of the application studied allow the user to associate a value of importance to a task
or project. In our perspective like in Thinks, LifeBalance, ThinkingRock, Toodledo and
ToDoist we add a number that represents the importance of performing a task/project
to achieve longer term objectives. However, in our perspective, this value should be
associated not only to lower level objectives but to every objective in higher levels as
well.
3.3.3 Organizational Vectors
Areas of Focus Of the applications studied only Things, InboxClassic and Think-
ingRock have a clear entity ”Area of Focus” where projects can be associated to. In
the rest of them, the projects can be only grouped by context or using tags to group
them. In our redefinition, we propose to add Areas of Focus in the objectives from the
second (projects) level, inclusive, upwards. These can then be subdivided in sub-areas
of interests in the level below. This is one of the innovative contributions in our work.

Chapter 3. State of the Art and Related Work 36
Mapping the Higher Levels Of the applications studied, only in ThinkingRock is
mapped the top three levels of the GTD and presents statistics of the sub-objectives
completed. This can be very useful to provide the current state of the individual in
the path for reaching his long term objectives. Following our redefinition of the GTD
methodology mapping the higher levels of the vertical flow will be fundamental for our
application in order to preview the importance of each task/project for reaching longer
term goals and for their decomposition in sub-objectives.
Tree of Objectives
None of the applications studied provide a graphical view of the entire vertical processing
work flow. In our perspective, this feature can be very important for motivating the user
to be more productive and review in which areas of focus he spends more time.
3.4 Related Work
In this section we present work already developed that served as inspiration for our
project. In the first sub section we will present several algorithms that were used to
inspire our recommendation algorithm and in the second one we will present some goal
decompositions techniques used in different areas.
3.4.1 Scheduling Algorithms
In this section we summarize the algorithms studied and considered relevant for solving
the problem of the time scheduling. For each one, we present a brief resume of the
techniques used by the algorithm, focusing on the characteristics that can be applied on
our project.
Completely Fair Schedule (CFS) [44]
In contrast to the majority of the scheduler algorithms, the CFS uses a red black tree
implementation instead of a queue system to store the next tasks to be executed, ranked
by spent processor time. The least used amount of time of the task, the lefter in the
red and black tree is stored. The process in the leftest node is picked and executed and,
if is not completed, its used amount of time is updated and goes to the correspondent

Chapter 3. State of the Art and Related Work 37
node. The algorithm is using a self balancing binary tree so the nodes are rearranged
and in the next iteration it is chosen the new leftest node is chosen and the process is
repeated.
The red black and tree structure could be used to store the tasks to be select for rec-
ommendation. However the weights to choose the priority of the nodes cannot be the
amount of time but is necessary to attend other factors like importance, due date, free
time in the agenda among others.
Critical Path Method (CPM) [45]
This algorithm is used for scheduling a set of project activities. The project includes a list
of activities required to complete it, the duration of each one, the dependencies between
the activities and logical endpoints (milestones and derivables). With this information
a graph is constructed. After that, the algorithm calculates the longest path of planned
path to logical endpoints and the earliest and the latest that each activity can start and
finish without making the project longer. This process determines which activities are
critical (longest path) or can be delayed. The critical path it is possible to determine
the shortest time to complete the project and any delay in this path will impact the
completion date.
The use of this algorithm was fundamental for the project because to prioritize the tasks
it is necessary to take in account the precedences between them and suggest to the user
which one of them should be done next ,or can be delayed, to complete it in the least
amount of time.
Highest response ratio next [46]
This algorithm is similar to Shortest Job Next [47], however the priority of each job is
calculated according to its estimated runtime and the time spended in waiting list. The
priority of each task is given by the function:
Priority =waiting time + estimated runtime
estimated runtime= 1 +
waiting time
estimated runtime
The task with the highest priority is chosen to be performed. In the project the waiting
can be used to remind the user of the existence of the project /task if a certain amount
of time passed without him completing any task, or the task itself.

Chapter 3. State of the Art and Related Work 38
Including the Age factor (materialized in the waiting time variable) in the calculation
of the priority we avoid the possibility of having actions or projects left in the system
for too long periods without any progress.
Least slack time scheduling [48]
The earliest deadline first scheduling was studied, however it was discarded because in
an application whose objective is to recommend the next tasks to perform it is needed
to take in account the time left until the task due date . In this algorithm it is needed
to take in account not only the due date of the tasks but also the durations of each
one. This algorithm selects the tasks according to their slack time (temporal difference
between the deadline, the ready time and the run time).
The value of the slack time in the project is used to calculate the urgency of the task.
Modified due-date scheduling [49]
This algorithm attempts first to complete tasks early on time and second complete tasks
tasks as soon as possible: Given a list of tasks, with a range of due dates (dj), and a
range of times it takes to complete the tasks (pj), then at any moment (t) it should be
picked the task that has the smallest modified due date. mddj = max( dj, t+pj ).
This process could be used to select activities which due date has already passed.
Multilevel Feedback Queue [50]
In this algorithm there are several queues each one representing a level. When a process
enters the system is assigned a level according to its priority/importance. One process
is only executed when the ones in the levels above have already been removed.
The tasks recommended to the user could be presented ordered by levels maybe using a
color to differentiate them.

Chapter 3. State of the Art and Related Work 39
3.4.2 Goal Decomposition
In this section we will present other goal decomposition techniques used in different
areas that inspired our adaptation of the Vertical Flow of the GTD Methodology.
3.4.2.1 Goals Breakdown Structure
The Goals Breakdown Structure (GBS)[51] is a hierarchal structure that connects high
level objectives to more detailed goals. The GBS was developed for product development
however it has been adapted to be applied to product development and the organization
as a whole. This pyramid of layers of goals is divided into four levels and we will present
them from from top-down perspective:
• Project Goal or Mission Statement: This layer represents the final goal of
the organization. The aim of all the layers above is to achieve the propose of this
level. Is the only layer where the rule Nothing Missing is violated because there
no goal above to be satisfied.
• Business Objectives: This layer is composed by the several business goals of
the company, which are often connected to the organization’s strategic plan, that
contribute to achieve it’s final objective.
• Project Requirements: List of the project and/or product characteristics re-
quired to achieve the business objectives. Are part of this level all the features,
functions and characteristics that a process must include in order to achieve the
objectives of the business.
• Project Specifications: In this level are included all the requirements that
should be satisfied in order to achieve the success of the project. are included
in this layers beyond the product specifications the components and subcompo-
nents stipulation.
For the decomposition of the GBS to be effective every goal of each layer must obey to
two rules:
• Nothing Missing: Each layer must contain all the goals needed to ensure the
project achieves the higher level objective above, to ensure the success of the
organization.

Chapter 3. State of the Art and Related Work 40
• Nothing Extra: No layer should contain goals not needed to achieve the layer
above, to prevent extra scopes that may spend extra time and money to the
organization.
3.4.2.2 Goal Modeling in Requirements Engineering
Goal Modeling is an element of Requirements Engineering that follows the principle
defining Goals in the process design, which are objectives that the system must achieve
through cooperation of actors in the software environment and in the environment [52].
This approach is used in several models such as i-star [53] and UML in the Use Case
Diagram [54], and has the advantage of clarifying goals, allows larger goals to be specified
into more specific ones that are smaller and more realizable and deals with conflicts
because meeting with one goal can interfere with meeting other goals.
In the paper ”The mysteries of goal decomposition” [55] the authors present experiments
that prove that using goal decomposition of high level goals into leaf level tasks that
can be performed by agents can have better results than follow a more direct process.
They refer the experiment of [56] where a group of students were divided into two
separated groups and to one of the groups was presented a problem as a single non
decomposed question and to the other a decomposed set of questions. The group with
the decomposed set of questions produced more accurate answers than the other. Other
experience they refer is the one performed by Lyness and Cornellius[57] in which the
students were asked to judge an hypothetical college professor using decomposed or non
decomposed methods. It was found that the subjects using the weighted decomposed
method offered more reliable results. Although in this experiments the presence of pre-
existing decomposition is assumed, the results prove that decomposition appears to help
correct problem solving and support the utility of Goals Decomposition in requirements
engineering.

Chapter 4
Requirements Analysis
4.1 Functional and Non-Functional Requirements
The analysis of the requirements was based on the methodology described in the book
“Software Engineering” by Ian Sommerville [58] and the classification of the requirements
was made using the FURPS+ Method [59]. Each requirement was assigned a priority
level according to the MosCoW method [60].
As follows we present a list of the considered requirements, divided into two categories:
• Functional Requirements: “Statements of services the system should provide,
how the system should react to particular inputs, and how the system should
behave in particular situations. In some cases, the functional requirements may
also explicitly state what the system should not do.” [58]
• Non-functional Requirements: “These are constraints on the services or
functions offered by the system. They include timing constraints, constraints on
the development process, and constraints imposed by standards. Non-functional
requirements often apply to the system as a whole, rather than individual system
features or services.” [58]
In sections 4.1.1 and 4.1.2 below we list the requirements we have identified, pre-
senting them in a table format with requirement id, description and priority cate-
gory. We used the MoSCOW to assign a priority to each requirement.
Now we will present the criteria of the MosCoW Method used to classify the priority of
the requirements of the project:
41

Chapter 3. Requirements Analysis 42
M - MUST: Describes a requirement that must be satisfied in the final solution for
the solution to be considered a success.
S - SHOULD: Represents a high-priority item that should be included in the solution
if it is possible. This is often a critical requirement but one which can be satisfied in
other ways if strictly necessary.
C - COULD: Describes a requirement which is considered desirable but not necessary.
This will be included if time and resources permit.
W - WOULD: Represents a requirement that stakeholders have agreed will not be
implemented in a given release, but may be considered for the future. (note: occasionally
the word ”Would” is substituted for ”Won’t” to give a clearer understanding of this
choice)
4.1.1 Functional Requirements
I-1 Ideas Category
I-1.1 The application allows the creation of ideas by the user M
I-1.2 The user must give a name to an idea M
I-1.3 The user can add a description to an idea S
I-1.4 The application stores all ideas in the Inbox List M
I-1.5 The user can edit the name and the description of an idea M
I-1.6 An idea can be converted to a Someday/Maybe item, or to a Task,or to a Project, or to a Goal, or to a Vision, or to a Life Goal, orto trash it
M
Table 4.1: Ideas Requirements
SM-2 Someday/Maybe items Priority
SM-2.1 The application allows the creation of S/M items by the user M
SM-2.2 The user must give a name to a S/M item M
SM-2.3 The user can give a description to a S/M S
SM-2.4 The application stores a S/M item in the Someday/Maybe List M
SM-2.5 The user can edit every attribute of a S/M item M
SM-2.6 The user can convert a Someday/Maybe item to a Task, or to aProject, or to a Goal, or to a Vision, or to a Life Goal, or to Trashit
M
Table 4.2: S/M Requirements

Chapter 3. Requirements Analysis 43
T-3 Tasks Priority
T-3.1 The user can mark a task as done M
T-3.2 The user can add tags to a task C
T-3.3 The user can divide a task into subtasks C
T-3.4 The user can make a task repetitive C
T-3.5 The user must associate a task to a project M
T-3.6 The user can add delegated person to a task S
T-3.7 The user can add precedences between tasks M
T-3.8 The user can edit every attribute of a task M
Table 4.3: Tasks Requirements
E-4 Events Priority
E-4.1 The Application allows the creation of new events by the user M
E-4.2 An event must have a name M
E-4.3 The user can add a begin date, a due date, a location and adescription to an event
M
E-4.4 The user can edit every attribute of an event M
Table 4.4: Events Requirements
P-5 Project Priority
P-5.1 The user can create a new Project M
P-5.2 The user must give a name to a project M
P-5.3 A project can have a list of tasks associated M
P-5.4 A project can have a value of importance associated given by theuser
M
P-5.5 The user can associate a project with only one Goal M
P-5.6 A project can belong to one area of focus M
P-5.7 A project has information about the last time one of its tasks hasbeen executed and it cannot be changed by the user because itused for calculating the age of the project
M
P-5.8 A project can have a due date. S
P-5.9 The user can make a project repetitive S
Table 4.5: Projects Requirements
G-6 Goals Priority
G-6.1 The user can create new goals M
G-6.2 A Goal can have a list of projects associated M
G-6.3 A Goal can have a value of importance associated given by theuser
M
G-6.4 The user can associate a goal with only one Vision goal M
G-6.5 A Goal can belong to one area of focus M
G-6.6 A Goal can have a due date S
Table 4.6: Goals Requirements

Chapter 3. Requirements Analysis 44
V-7 Vision Objectives Priority
V-7.1 The user can create new Vision Objective M
V-7.2 A vision objective can have a list of Goals M
V-7.3 A Vision objective can have a value of importance associated givenby the user
M
V-7.4 A Vision objective can be associated with only one Life Goal as-sociated
M
V-7.5 A Vision Objective can belong to one area of focus M
V-7.6 A Vision Objective can have a due date S
Table 4.7: Vision Objectives Requirements
L-8 Life Objectives Priority
L-8.1 The user can create new Life Objective M
L-8.2 A Life Objective can have a list of Vision Objectives associated M
L-8.3 A Life Objectives can have a value of importance associated givenby the user
M
L-8.4 A Vision Objective can belong to one area of focus M
L-8.5 A Vision Objective can have a due date S
Table 4.8: Life Objectives Requirements
AF-9 Areas of Focus Priority
AF-9.1 An Area of Focus must have a name M
AF-9.2 An Area of Focus must be associated to a horizon level (projectsor objectives)
M
AF-9.3 An area of focus can be associated with several projects/goals inthe same horizon level
M
AF-9.4 An area of focus can be associated with only one area of Focus inthe horizon level above
S
Table 4.9: Areas of Focus Requirements
R-10 Recommendation Process Priority
R-10.1 The number of tasks recommended by the system can be definedby the user
C
R-10.2 The recommendation only presents tasks with no active prece-dences
M
R-10.3 The priority of each task is given by the recommendation algo-rithm
M
R-10.4 The recommendation algorithm uses the values of the importance,speed, urgency and age to calculate the priority of each task
M
R-10.5 The user can add a specific location, tool or person needed, or amaximum energy value, or duration, or area of focus to filter theresults of the recommendation
M
R-11.6 The system must save the choice of the action to perform by theuser
C
Table 4.10: Recommendation Requirements

Chapter 3. Requirements Analysis 45
RV-11 Review Priority
RV-11.1 The user can review all the ideas in the Inbox List M
RV-11.2 The user can review all the ideas in the S/M List M
RV-11.3 The user can review all the Projects and their associated Tasks M
RV-11.4 The user can review all the Objectives (Goals and Objectivesabove)
M
RV-11.5 The Review Processes of each corresponding horizon level arestored as projects in the system and are native of the applica-tion
S
RV-11.6 The review of every horizon level is shown to the client in therecommendation tasks in its corresponding time frame (Projectsonce a wee, Goals very three months, Vision Objectives every yearand Life Objectives every four years.)
C
Table 4.11: Review Requirements
WS-12 Integration with web services Priority
WS-12.1 The user can add a Google Account to the application M
WS-12.2 The application allows importing events from a Google Calendaraccount
M
WS-12.3 The user can add a Evernote account to the application M
WS-12.4 The application allows importing tasks from an Evernote account C
WS-12.5 The application allows importing events from a iCal account C
WS-12.6 The applications allows editing tasks imported C
WS-12.7 The application exports new events for Google Calendar S
WS-12.8 The application exports new events for iCal C
WS-12.9 The application exports new tasks for Evernote M
WS-12.10 When an event is edited in the application the correspondent eventin Google Calendar is updated
S
WS-12.11 When an event is edited in the application the correspondent eventin iCal is updated
S
WS-12.12 When a task is edited in the application the correspondent notein Evernote is updated
M
WS-12.13 The application imports contacts from Google Contacts S
Table 4.12: Integration with Web Services Requirements
C-14 Contexts Priority
C-13.1 The user can add locations to the system that can be associatedto tasks
M
C-13.2 The user can add people to the system that can be associated totasks
M
C-13.3 The user can add tools to the system that can be associated totasks
M
Table 4.13: Context Requirements
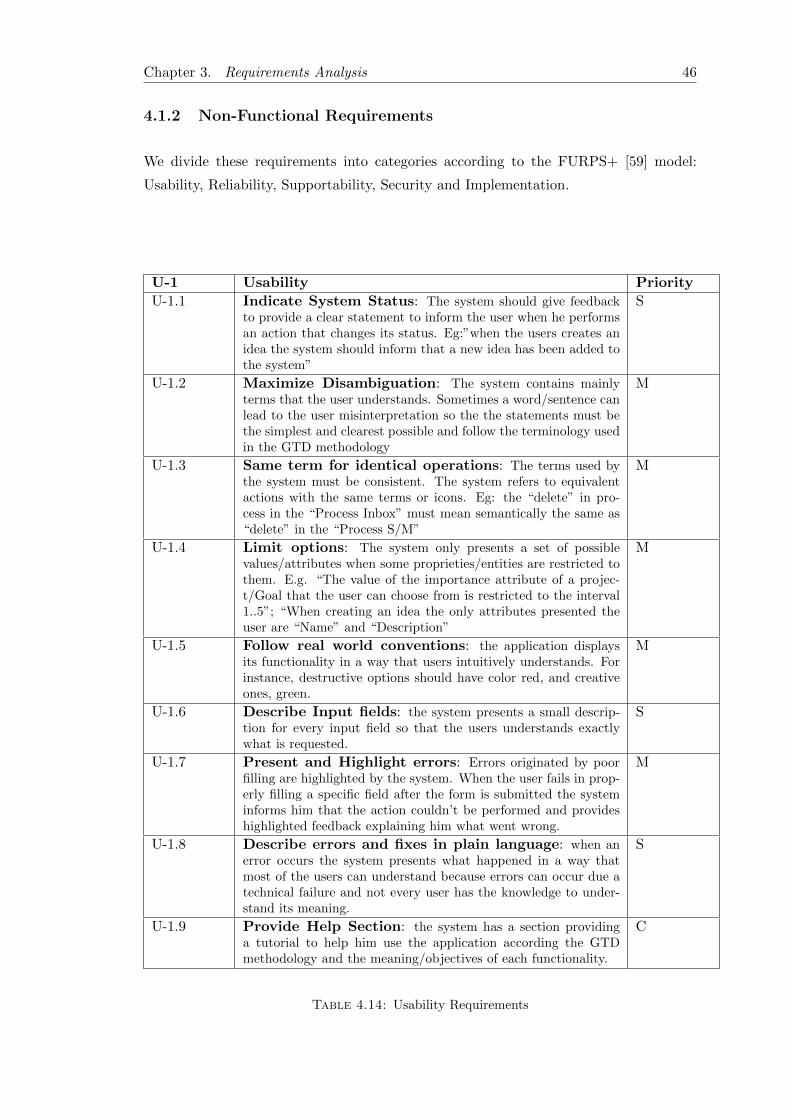
Chapter 3. Requirements Analysis 46
4.1.2 Non-Functional Requirements
We divide these requirements into categories according to the FURPS+ [59] model:
Usability, Reliability, Supportability, Security and Implementation.
U-1 Usability Priority
U-1.1 Indicate System Status: The system should give feedbackto provide a clear statement to inform the user when he performsan action that changes its status. Eg:”when the users creates anidea the system should inform that a new idea has been added tothe system”
S
U-1.2 Maximize Disambiguation: The system contains mainlyterms that the user understands. Sometimes a word/sentence canlead to the user misinterpretation so the the statements must bethe simplest and clearest possible and follow the terminology usedin the GTD methodology
M
U-1.3 Same term for identical operations: The terms used bythe system must be consistent. The system refers to equivalentactions with the same terms or icons. Eg: the “delete” in pro-cess in the “Process Inbox” must mean semantically the same as“delete” in the “Process S/M”
M
U-1.4 Limit options: The system only presents a set of possiblevalues/attributes when some proprieties/entities are restricted tothem. E.g. “The value of the importance attribute of a projec-t/Goal that the user can choose from is restricted to the interval1..5”; “When creating an idea the only attributes presented theuser are “Name” and “Description”
M
U-1.5 Follow real world conventions: the application displaysits functionality in a way that users intuitively understands. Forinstance, destructive options should have color red, and creativeones, green.
M
U-1.6 Describe Input fields: the system presents a small descrip-tion for every input field so that the users understands exactlywhat is requested.
S
U-1.7 Present and Highlight errors: Errors originated by poorfilling are highlighted by the system. When the user fails in prop-erly filling a specific field after the form is submitted the systeminforms him that the action couldn’t be performed and provideshighlighted feedback explaining him what went wrong.
M
U-1.8 Describe errors and fixes in plain language: when anerror occurs the system presents what happened in a way thatmost of the users can understand because errors can occur due atechnical failure and not every user has the knowledge to under-stand its meaning.
S
U-1.9 Provide Help Section: the system has a section providinga tutorial to help him use the application according the GTDmethodology and the meaning/objectives of each functionality.
C
Table 4.14: Usability Requirements
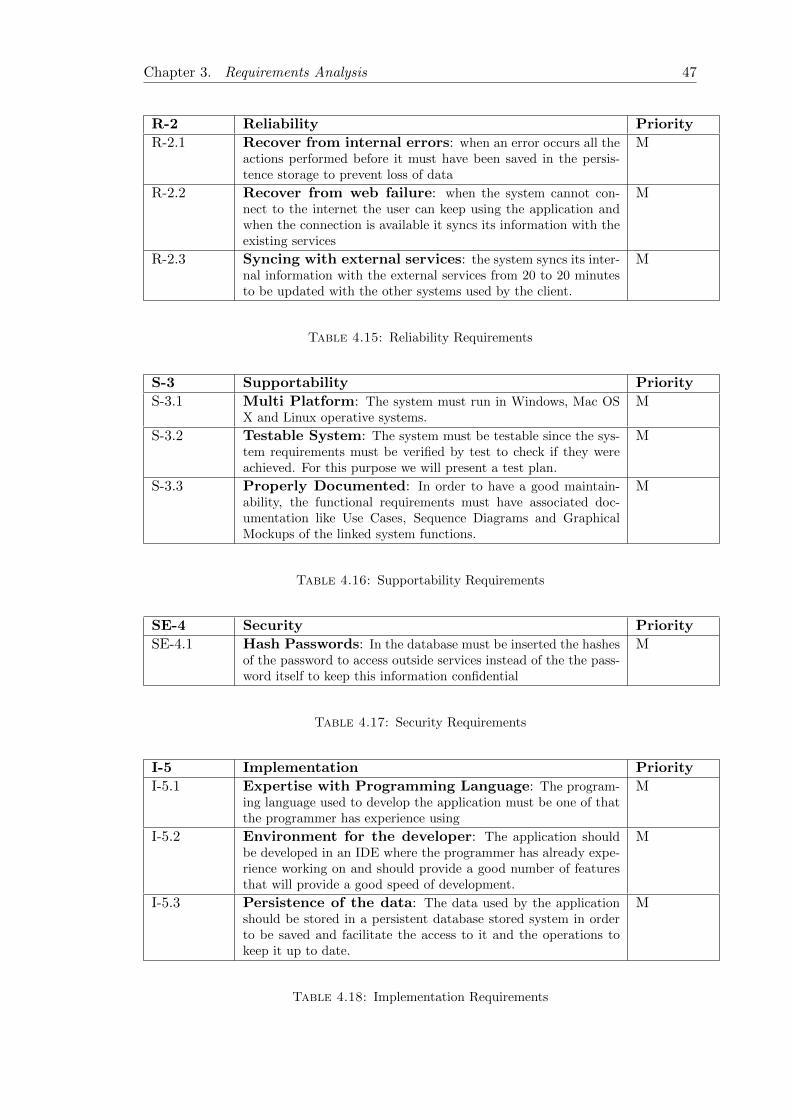
Chapter 3. Requirements Analysis 47
R-2 Reliability Priority
R-2.1 Recover from internal errors: when an error occurs all theactions performed before it must have been saved in the persis-tence storage to prevent loss of data
M
R-2.2 Recover from web failure: when the system cannot con-nect to the internet the user can keep using the application andwhen the connection is available it syncs its information with theexisting services
M
R-2.3 Syncing with external services: the system syncs its inter-nal information with the external services from 20 to 20 minutesto be updated with the other systems used by the client.
M
Table 4.15: Reliability Requirements
S-3 Supportability Priority
S-3.1 Multi Platform: The system must run in Windows, Mac OSX and Linux operative systems.
M
S-3.2 Testable System: The system must be testable since the sys-tem requirements must be verified by test to check if they wereachieved. For this purpose we will present a test plan.
M
S-3.3 Properly Documented: In order to have a good maintain-ability, the functional requirements must have associated doc-umentation like Use Cases, Sequence Diagrams and GraphicalMockups of the linked system functions.
M
Table 4.16: Supportability Requirements
SE-4 Security Priority
SE-4.1 Hash Passwords: In the database must be inserted the hashesof the password to access outside services instead of the the pass-word itself to keep this information confidential
M
Table 4.17: Security Requirements
I-5 Implementation Priority
I-5.1 Expertise with Programming Language: The program-ing language used to develop the application must be one of thatthe programmer has experience using
M
I-5.2 Environment for the developer: The application shouldbe developed in an IDE where the programmer has already expe-rience working on and should provide a good number of featuresthat will provide a good speed of development.
M
I-5.3 Persistence of the data: The data used by the applicationshould be stored in a persistent database stored system in orderto be saved and facilitate the access to it and the operations tokeep it up to date.
M
Table 4.18: Implementation Requirements

Chapter 3. Requirements Analysis 48
4.2 Use Cases Diagram
In this section we present the Use Cases Diagram we designed. The objective of this
diagram is to demonstrate the scenarios in which our application interacts with (people,
organizations, or external systems), the goals that helps the user achieve and the scope
of the system. To make the relation of each action with the Functional requirements,
we inserted in the diagram the ID of the corresponding requirement. [61]
Figure 4.1: Use cases Diagram

Chapter 3. Requirements Analysis 49
4.2.1 Tasks Sequence Diagram
In this diagram is represented the sequence of actions when the user adds a task in
the Evernote Application and in the system. First he adds a tasks in the Evernote
Application. Asynchronously, our system checks for updates in the Evernote notes to
keep the information up to date. It verifies a new task has been added to the system, and
it is inserted in the database. After that the user inserts a new task in our application,
so the system will add it to our database and inform the Evenote Servers of it, which
will update its information.
Figure 4.2: Tasks Sequence Diagram

Chapter 3. Requirements Analysis 50
4.2.2 Recommendation Sequence Diagram
In this diagram we present the sequence of actions when the user wants to see his recom-
mended tasks list. The recommendation system decides which tasks will be presented to
the user and then they are displayed. If the user decided to filter the tasks recommended
with a specific characteristics he would enter them in to the application and after that
the recommendation system would only present tasks with that attribute.
Figure 4.3: Recommendation Sequence Diagram

Chapter 5
Architecture
This chapter is subdivided in 3 sections. In the sec first one we present a simple view of
the architecture. In the second section we present the different layers of the architecture
and a detailed description of each one. In the last section we present the technologies
used to develop the application and the reasons for their choice.
5.1 First Level Architecture
For a better understanding of the system we first explain how it operates in an abstract
way. The application interacts with three external entities, besides the user: the DBMS,
Google Servers, and Evernote Servers.
Figure 5.1: Abstract Arquitecture
Primarily, the user accesses the system by browsing the application installed in his
computer, where his requests are processed and transformed into operations to be pro-
cessed by the system. In this process, the information of the operations is saved in the
database and the information of the user in the google and evernote servers is updated.
When these operations are complete the system returns a response with the information
requested by the user.
51

Chapter 5. Architecture 52
5.2 Second Level Architecture
In this section we describe the components needed to develop the system derived from
the requirements analysis process whose results we presented in the previous chapter.
The design of the second level architecture was based in the Model View Controller
(MVC) software pattern. We opted for the Active MVC instead of the more traditional
(Passive) because, due to the decision of having more than one controller in the system.
5.2.1 Model
The Model layer is responsible for representing the information in the system. We follow
an object oriented paradigm to save the data of the system as classes and their respective
attributes and methods. The structure of the classes and database are represented and
described in this section.
Figure 5.2: Classes Diagram
Fig. 5.2 represents the different classes that model the objects in the system and the
relationships between them. In the description of this diagram we will focus in the
classes that are the most important for the project.
Chapter 5. Architecture 53
• Task: an object of the class task has as an id that indicates the index of the
column in the respective table of the Data Base, a name, the correspondent project,
an importance for the achievement of that project, a level of energy, its duration
and the boolean ”done” that indicates if the task is completed or not. The task can
also be associated to three different contexts: location, tool and person needed.
The object can also have a start date (a specific date from when the task can be
performed given by the user) and a due date (date limit to perform the task given
by the user). The doubles imp, speed, urgency and age and the date LastStart are
values calculated by the recommendation algorithm and represent, respectively, the
importance of the task in the tree of objectives, the speed value, the urgency value,
the age value and the last date when the task can start without compromising the
due date of the project.
• Project: an object of the class Project has as an id that indicates the index
of the column in the respective table of the Data Base, a name, a due date,
an importance to the achievement of a specific goal and the imp value, which
represents the importance of the project in the tree of objectives and the boolean
completed which indicates if the project is completed or not. All of these attributes
are inherited from the Objective class. The attribute ”last” indicates the last
time a task of the project as been marked as completed, the ”af” attribute the
correspondent Area of Focus object and the goal the correspondent Goal object.
The project object has also a list of tasks.
• Goal, Vision and Life: an object of these classes has an id that indicates the
index of the column in the respective table of the Data Base, a name, a due date,
an importance to the achievement of the correspondent higher objective, the imp
value, which represents the importance of the objective in the tree of objectives and
the boolean completed which indicates if the objective is completed or not. All of
these attributes are inherited from the Objective class. The attribute af indicates
the Area of Focus associated with the objective and the attributes Vision and Life
the upper objective for the Goal and Vision class. Each one of them has also a list
of lower objectives associated to it: projects, goals, visions for the Goal, Vision
and Life objects respectively.
• Area of Focus: an object of the class Area of Focus has an id that indicates the
index of the column in the respective table of the Data Base, and a name. This
class has four different subclasses (AFLife, AFVision, AFGoal and AFProject)
which have an additional attribute which is the list of associated objectives of the
correspondent level.

Chapter 5. Architecture 54
• Event: an object of the class Event has as attribute an id that indicates the
index of the column in the respective table of the Data Base, a name given by the
user, two dates, the begin and end date of the event and must also be associated
with a Calendar. A calendar represents a list of events that have a certain common
context given by the user and it is used for the synchronizing of the information
with the Google Calendar Service. An event can also be associated with a location.
Figure 5.3: Entity-Relationship Diagram
This diagram represents the tables where the objects are stored in the database.
5.2.2 Controllers
This layer is responsible for the interpretation of the mouse and keyboard inputs from
the user, informing the model and/or the view to change as appropriate. There is more
than one controller and they are represented in the component diagram below.

Chapter 5. Architecture 55
Figure 5.4: Components Diagram
• ObjectsHandler.java this component is responsible for keeping the model in
memory up to date. It receives the alterations made by the Interface Controller.java,
Evernote.java and Google.java needed to perform at the model, updates the in-
formation in memory and informs the DBHandler.java of the updates needed to
perform in the database.
• FXMLDocumentController.java: receives the inputs from the user in the view
layer and informs the ObjectsHandler.java of the alterations needed to perform.
• Google.java: This component is responsible for keeping the events of the model
and the information of the Google Calendar of the user synchronized. Every 20
minutes 1, this component will compare the information of the events in memory,
to check for updates made by the user in his Google calendar Service, refresh the
information of the system and adds to the Google Calendar Service new events
created by the user in the application.
For the authentication and authorization needed for the application to access the
information of the user in the Google servers it was necessary to use the OAuth2.0.
The authorization flow of the OAuth 2.0 in the Google Service is divided in these
steps:
1. Using the Client ID and the Client Secret, which are tokens that identify the
application in the Google Service, it is generated a Request Token in a form of an
URL that the user can use to grant the application to access his information on
the Google Calendar Service.
1In this version of the application, the interval of time between the comparing data operation of thiscomponent and Evernote.java is hard-coded. However, in a future version of the application, it will bepossible for the user to parametrize this value.

Chapter 5. Architecture 56
2. Copying the URL given in step 1, to the browser the user logs in in his Google
Account and authorizes the application to access his Google Calendar information
and an Authorization Token is generated in the screen. This token must be inserted
manually by the user in the application.
4. The application exchanges the Authorization Token for an Access Token.
5. The system has now access to the information of the user in the Google Calendar
Service. However this authorization token has a limited time of life, 60 minutes,
so the application can exchange it for a Refresh Token necessary for generating
new Access Tokens.
6. The application saves the Refresh Token in the computer to have future access
to the Service. As a security of precaution, it is saved in a file using a 128 bits
DES encryption.
7. Every time the applications communicates with the Google Calendar Service it
exchanges the Refresh Token for a new Access Token, being the process transparent
to the user. To do so, the application makes a request to the API to get the new
Access token, using the Client ID and Client Secret to identify the application
and the Refresh Token that proves the the application has access to the user’s
information in the Google Service. As response, the Google Server send the new
Access token.
If the user does not want anymore that the application accesses his personal in-
formation in the Google Calendar Service, he can do so by logging in his Google
Account and revoke the grant of access authorized before.
• Evernote.java:This component is responsible for checking if the information in
the Evernote account of the user and the one in the application are up to date.
Every 20 minutes, this component will check if any task has been marked as
completed or if a new idea has been added to the Inbox note and inform the
ObjectsHandler.java of the alterations.
For the authentication and authorization needed for the application to access the
information of the user in the Evernote servers it was necessary to use the OAuth
1.0. The authorization flow of the OAUth 1.0 in the Evernote Service is divided
in these steps:
1. The system displays the link where the user can get the Access Token needed
for the application to access his information in the Evernote Service.
2. Copying the URL given in step 1 to the browser, the user logs in in his Evernote
Account and the Access Token for the system to access his Notes is displayed on
the screen.

Chapter 5. Architecture 57
3. The user inserts his Access Token in the application. Now the application has
permission to access his notes. This token is saved in a file using a 128 bits DES
encryption.
If the user does not want anymore that the application has access to his Evernote
Account Service, he needs to revoke the Access Token in the Evernote website.
• DBHandler.java: This component is responsible to intermediate the communi-
cations between the ObjectsHandler.java and the database. When is it necessary to
update the persistent information of the system, the ObjectHandler.java commu-
nicates what operations are needed to be done to the database and this component
is responsible for performing them.
5.2.3 View
The view manages the display of information with which the user will interact. In
the diagram the component responsible for this layer is the interface, that is designed
following the prototypes of the GUI designed in the first semester. The interface is built
using the .FXML file developed.
5.3 Technologies
In this section we present the several technologies chosen to develop our application and
the reasons for their choice. It is divided in three subsections: Programming Language,
Persistent Data Store and Framework to Develop the GUI.
5.3.1 Programming Language
Regarding programming languages, the options we considered as viable included Java,
Python and C++. In this section we present the motives for choosing Java as the
programing language to develop the project. This decision was based on the centered
outcomes and technical characteristics of the language. The criteria were based in the
Chris Britton article ”Choosing a Programming Language”[62].
Performance of Compiled Code
Performance of the compiled code is the amount of useful work accomplished by a
computer system, compared to the time and resources used. It is an important factor
for the technology chosen because we want to provide a system with a short response

Chapter 5. Architecture 58
time, high throughput and low utilization of computer resources. Java can provide
us this characteristics by adopting a scheme by which the interpreter can run at full
speed without needing to check the run time environment, has an automatic garbage
collector that ensures that memory is available when is necessary, which result in a good
performance [63].
Portability
Portability is crucial for the application because we want to ensure that it may run in
different operation services. Java has a high portability due to the Java Virtual Machine
which allows the applications developed in the language to be architectural neutral [63].
Supported Platforms Environments
Java has already facilities that provide support for the program to communicate with
other entities like the database management system and the external services. For
connecting to the database there is the sqlite-jdbc which is a library that provides the
program to connect to a sqlite database and perform queries to handle the information
in it. In order to use the API of Evernote [19] is available the Evernote SDK [19] for
Java. For exchanging information with Google calendar API using Java, one of the
options available is the Java Client Library [64].
Speed of Development A factor with a considerable impact on the projects progress
is the developer’s productivity with the chosen programming language. Java is the
programming language that I have the more experience using so there was not the
necessity of sparing time to learn a new programming language. The object oriented
paradigm is also a benefit because provides a clear modular structure for programs which
makes it good for defining abstract data types, makes it easy to maintain and modify
existing code as new objects can be created with small differences to existing ones and
the heritage feature allows the reuse of code. There are some integrated development
environments that provide comprehensive facilities to JAVA programmers. We will focus
on Netbeans [65] which will be the chosen one. In addition to support Java, Netbeans
provides a syntax highlighting, code completion, refactoring support and full-featured
debugger. Other great advantage of this IDE is the full integration with the JavaFX,
which allows the creation of a Graphical Interface, improving the speed of making the
connection of the front end with the back end of the application.
5.3.2 Persistent Data Storage Solution
For the persistent data store we chose SQLite [66] which is a software library that im-
plements a self-contained, server-less, zero-configuration, transactional SQL database

Chapter 5. Architecture 59
engine. In contrast to other database management systems, SQLite is not a separate
process that is accessed from the client application, but an integral part of it. Database
managements system who required a server like PostGreSQL and MYSQL were dis-
carded because they would be prejudicial for the portability of the application.
The reason of this choice was based in several criteria:
Portability: Portability is the capacity is the usability of the same software in different
environment. We want to ensure that the application can be used in different operation
systems, so this will be an important criteria for the choice of the database system.
SQlite is a simple application file which is portable across all operating systems, 32-bits
and 64-bits architectures. Additionally, it does not need a database server running in
background which eliminates the necessity for the user to install a DataBase Management
System to run the application. This tools has also bindings for a large number of
programming languages[67].
Querying Language: Query languages are computer languages used to make queries
into databases and information systems. The content of SQLite database can be ac-
cessed and updated by its own Query language [68] that supports a large number of
operations, reducing the complexity of the application code and provide consistency to
the information.
Scalability: Scalabity can be defined as ”the ability of a system to accommodate an
increasing number of elements or objects, to process growing volumes of work gracefully,
and/or to besusceptible to enlargement” [69]. We need to ensure that the system is
scalable in order to keep data consistency and performance as long as the volume of
information processed and stored grows. We will assume that the database management
system will handle in the maximum 10000 hit per day which include new entrances in
the system, update and delete information and other operation to keep the it up to date.
SQLite has been demonstrated to be able to handle more than 100000 hits per day [67],
so it is able to handle the scalability requirements of the system.
Cost: In the case of the application being to the market, we need to ensure that has the
least costs associated possible, so there is the necessity for opting for a free data base
management system: SQLite is in the public domain and does not require a license [70],
so its use will not have additional cost for us.
5.3.3 Software Platform
For the development of the graphical user interface of the prototype we analyzed Java
FX, Java Swing and SWD. We opted for the JavaFX 2, which is a software platform

Chapter 5. Architecture 60
developed by Oracle to ”develop rich, user-friendly client interfaces, and its tooling and
binding features have helped close the gap between design and code and reduced time
to market”.
Appearance
Java FX 2 contains over 50 already built UI controls necessary for the building of the
interface. In addition to this it also provides the customization of these components
using CSS. It is also possible to add effects to these components in order to improve the
usability of the application.
Speed of Development The JavaFX 2 provides an easy and fast development of the
applications. It provides a Scene Builder which enables the developer to quickly design
dragging a UI component from a library of UI components and dropping it into a content
view area. The FXML2 code for the UI layout created in the tool is automatically
generated in the background.
Portability Java FX applications can be deployed to be run in Windows, Mac OS X
and Linux operation systems as Self-Contained Applications[71]. This has the advantage
of providing to the users an application that resemble native applications for the target
platform with an installer format that is familiar to them and there is no necessity for
them to install the Java Runtime.
2FXML, a scriptable, XML-based markup language for defining user interfaces

Chapter 6
Recommendation Process
In this chapter we present the mechanism implemented in order to provide to the appli-
cation the feature that suggests to the user what tasks he should perform next. First of
all, the list of tasks that will be presented to the user is reduced to the only ones that
the user can perform at that moment. After that, the application calculates the priority
of each task in that reduced list using the prioritization algorithm developed. Having
the priority calculated for each task, the application presents them to the user ordered
by it.
6.1 Reducing the task list
In order to present to the user only the tasks he can perform at that moment, the system
withdraws from the list the ones which are completed, or that have a precedence that
is not yet completed or that have have a Start date posterior to the date at the current
time. In addition to this, the user can add parameters, in the Do screen that provide
more information of his current situation, called filters, which help the system to filter
out even more the list of tasks presented. Now we present the filters we added to the
application:
• Location: a specific location
• Tool: a specific instrument
• Person: a specific person
• Duration: a maximum estimated duration value needed to perform it
• Energy: a maximum estimated energy value to perform it
61

Chapter 6. Recommendation Process 62
• Area of Focus: a specific Area of Interest/Responsibility of the user
The tasks that do not satisfy these filters are not shown in the Do list, which is next
processed by the prioritization algorithm and later ordered.
6.2 Prioritization Algorithm
The prioritization algorithm we developed is based upon several known techniques in
the literature of time management, and scheduling problems. The priority of a task is
a function of a range of parameters, namely: importance, urgency, age, and speed.With
the Importance and Urgency we can use the Eisenhower Matrix approach to calculate
a first approximation of the priority of the task. Also, drawing inspiration from some
scheduling algorithms previously reviewed, we consider too the Age of the Project the
Task is associated with, as well as the Task’s Speed (a function of its Duration) as a
combination of these can help in fine-tuning the final priority of the Task.
To calculate the priority of the different tasks the system follows the formula:
Priority = α× (I × U) + (1 − alpha) × (A× S)
0 <= α <= 1
• I: Importance of the task in the tree of objectives
• U: Urgency of the task
• A: Age of the Project of the task
• S: Speed of the task
The system uses as value Alpha 0.9. This way we give more relevance to the value which
is given by The Eisenhower Method, an approach largely used in personal productivity
that has already shown good result. The Eisenhower Method uses the multiplication of
the values urgency and importance to determinate the priority of a task. However, in
our perspective, there was the need to provide additional information for the recommen-
dation process in the case of prioritizing tasks with similar values of importance given
by the Eisenhower Matrix. To accomplish this, the system includes in the prioritization
formula the values of Age and Speed, who are less relevant than the Importance and

Chapter 6. Recommendation Process 63
Urgency of a task. The final Priority value for a Task is always a real value between 0
and 1.
6.2.1 Importance
The Importance of a Task is a function of the Importances of the progressively higher-
level objectives it contributes to. Namely, it is proportional to the product of the ”local”
Importances of each such objective, where each such ”local” importance is given by the
user and specifies how much that particular objective contributes to achieve its one-
level-above parent objective. ”Local” importances are integer values between 1 (residual
importance) to 5 (critical importance).
To calculate the importance of a task we came to the formula:
I =Ti
5l
0 <= I <= 1
• Ti: importance of the task in the tree of objectives
• l: number of levels of the three of objectives used
To calculate the importance of the task in the tree of objectives we multiply the im-
portance of the task for the completion of its respective project by the product of the
objectives above and divide it by five elevated to the number of levels used, which is the
maximum value that an importance of a task can have.
However we needed to handle cases where the user did not have a complete hierarchy
of objectives (objectives that would contribute to the achivement of a higher one), so
it was necessary to handle this possible lack. To accomplish this, if a objective is not
connected to a higher one the application creates a virtual one which has as value of
importance the average of the other objectives of the same level. In the case the user
does not yet use all the levels of the GTD vertical workflow, the applications connects
directly the highest level he is using to the root of the tree.
To give the reader a better understanding of how the application calculates we provide
below two examples. In both examples, for each objective the value between ”()” is the
value of importance given by the user and between ”[]” the importance of the objective
in the tree of objectives, which is calculated by the system multiplying the value given

Chapter 6. Recommendation Process 64
by the user for the product of the objectives above.
Figure 6.1: Example 1 Tree of objectives
In the first example we present a tree of objectives where all the horizon levels are filled.
The goal ”G4” is not connected to any Vision objective, so the system calculates its
importance by associating it to a virtual Vision Objective with importance 14. The
value of importance of tasks T1, T2, T3 and T4 are, respectively, 288, 288, 96 and 1400.
Dividing each one of it by the the maximum value of importance (5 elevated to 5) the
system obtains the value of importance used by the prioritization algorithm, which are
presented in the table below.
Task T1 T2 T3 T4
Importance 0,09 0,09 0,03 0,448

Chapter 6. Recommendation Process 65
Figure 6.2: Example 2 Tree of objectives
In the second example we provide a tree where are only present objectives of the three
lowest levels of the GTD horizons of focus, Goals, Projects and Tasks, so the system
assumes the Goals are connected to the root of the hierarchy tree. The project ”P4” is
not associated to any Goal, so the system creates a virtual goal whose importance is the
average of the values of the other ones (2,5). The value of importance of tasks T1, T2,
T3 and T4 are, respectively, 24, 24, 6 and 50. Since this hierarchical tree of objectives
has depth 3, the maximum value of importance is 5 to the power of 3. For that reason,
in order to calculate the final importance of each task, we divide their values (24, 24, 6,
and 50) by 5 to the power of 3. The results are shown in the table below:
Task T1 T2 T3 T4
Importance 0,192 0,192 0,048 0,400
Taking the original importance value of a task (the product of ”local” importance values,
each varying between 1 and 5) we just normalize it to the interval [0..1] to obtain the
final priority value of the task, via a simple linear transformation.
In the graphic below we present the values that the factor Importance can take in a
complete hierarchy tree of objectives in the system (all levels of the vertical workflow in
the system contain at least an objective). In the horizontal axis is the importance of the
task in the tree of objectives and in the vertical axis the value of the factor Importance
in the prioritization algorithm.

Chapter 6. Recommendation Process 66
Figure 6.3: Importance Variation
6.2.2 Urgency
The Urgency of a task is a function of the time still available for the user between ”now”
and the latest possible start for the task. As this gap closes down by the passage of
time, the urgency of the task should rise exponentially to the maximum value of 1. To
calculate the urgency of a task we came to the formula:
U = e−t
15×7
0 <= U <= 1
• t: number of hours until the latest start of the task
The calculation of the value Urgency is divided in two parts. In the first one the system
calculates the Latest Start of the task, which is the last date where a task can start
without delaying the project due date. After that, the system estimates the number of
hours that the user has available until the latest start, taking in account the average
hours a person has per day to perform task and the duration of the events in the system.
To calculate the latest start of a task we implemented a variation of the Critical Path
Method, which was studied in the first semester and is described in the State of the Art
and Related work chapter. The due date of a task can be a value given by the user
or the earlier Latest Start of the tasks that have the current task as precedence or, if
the current does not have any task that depends of it, the due date of the project. Its
latest start will be the subtraction of the its estimated duration to the value of the due
date. To implement this, we developed a recursive algorithm, similar to a topological

Chapter 6. Recommendation Process 67
sorting, that starts calculating the latest start of the tasks that do not have any other
who depend of their completion to be performed. After this it calulates the latest start
of the tasks which have as precedents the ones identified in the first step, and so on, for
all tasks in the project. Below we present an example:
Figure 6.4: Calculation of the latest start
• The task T1 has a duration of 5 hours and does not have any task that depend of
it to be performed, so its due date is the due date of the project. The latest start
of T1 is 29/06/2014 at 7 pm.
• The task T4 has a duration of 2 hours and does not have any task that depend of
it to be performed, so its due date is the due date of the project. The latest start
of T4 is 29/06/2014 at 10 pm.
• The task T5 has a duration of 1 hour and does not have any task that depend of
it to be performed, but has as due date the date 28/06/2014). The latest start of
T5 is 28/06/2014 at 4 pm.
• The task T2 has a duration of 3 hours and T4 and T5 depend of it to be performed.
Comparing T4 and T5, T5 has a earlist Latest Start than T4, so the due date of
T2 is the lastest start of T5 (28/06/2014 at 4 pm). The latest start of T2 is
28/06/2014 at 1 pm.
• The task T7 has a duration of 1 hour and does not have any task that depend of
it to be performed, so its due date is the due date of the project. The latest start
of T1 is 29/06/2014 at 11 pm.
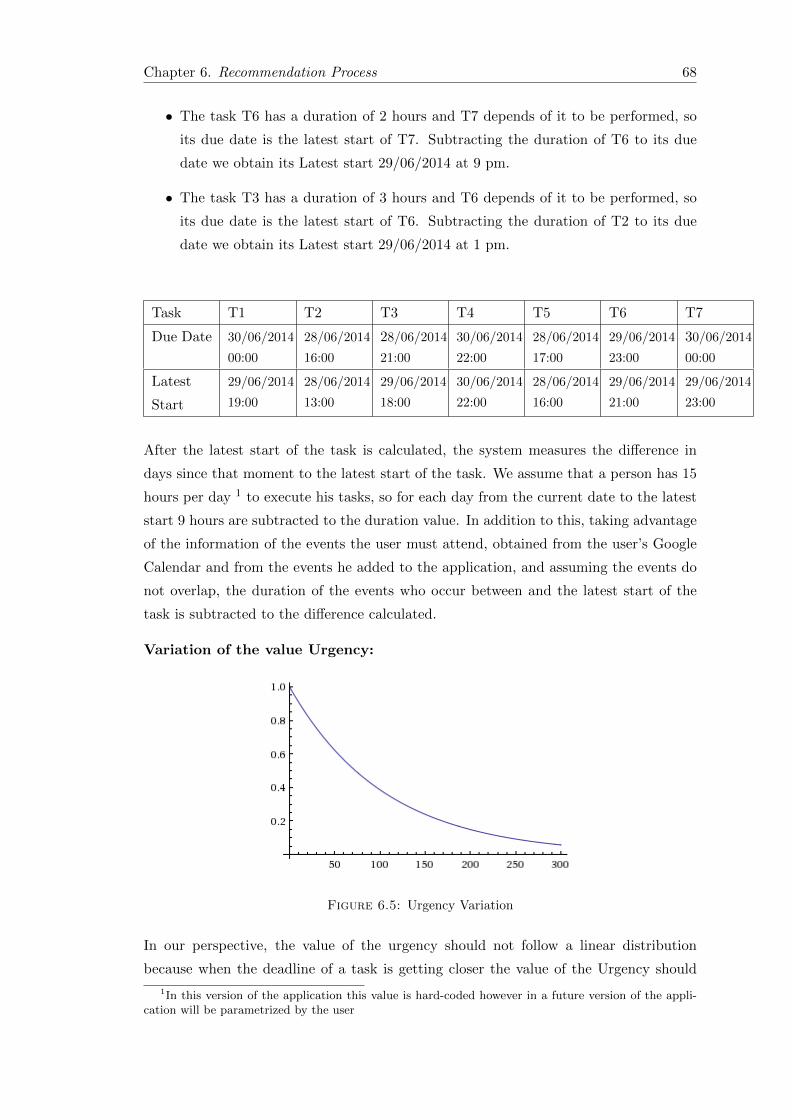
Chapter 6. Recommendation Process 68
• The task T6 has a duration of 2 hours and T7 depends of it to be performed, so
its due date is the latest start of T7. Subtracting the duration of T6 to its due
date we obtain its Latest start 29/06/2014 at 9 pm.
• The task T3 has a duration of 3 hours and T6 depends of it to be performed, so
its due date is the latest start of T6. Subtracting the duration of T2 to its due
date we obtain its Latest start 29/06/2014 at 1 pm.
Task T1 T2 T3 T4 T5 T6 T7
Due Date 30/06/2014
00:00
28/06/2014
16:00
28/06/2014
21:00
30/06/2014
22:00
28/06/2014
17:00
29/06/2014
23:00
30/06/2014
00:00
Latest
Start
29/06/2014
19:00
28/06/2014
13:00
29/06/2014
18:00
30/06/2014
22:00
28/06/2014
16:00
29/06/2014
21:00
29/06/2014
23:00
After the latest start of the task is calculated, the system measures the difference in
days since that moment to the latest start of the task. We assume that a person has 15
hours per day 1 to execute his tasks, so for each day from the current date to the latest
start 9 hours are subtracted to the duration value. In addition to this, taking advantage
of the information of the events the user must attend, obtained from the user’s Google
Calendar and from the events he added to the application, and assuming the events do
not overlap, the duration of the events who occur between and the latest start of the
task is subtracted to the difference calculated.
Variation of the value Urgency:
Figure 6.5: Urgency Variation
In our perspective, the value of the urgency should not follow a linear distribution
because when the deadline of a task is getting closer the value of the Urgency should
1In this version of the application this value is hard-coded however in a future version of the appli-cation will be parametrized by the user
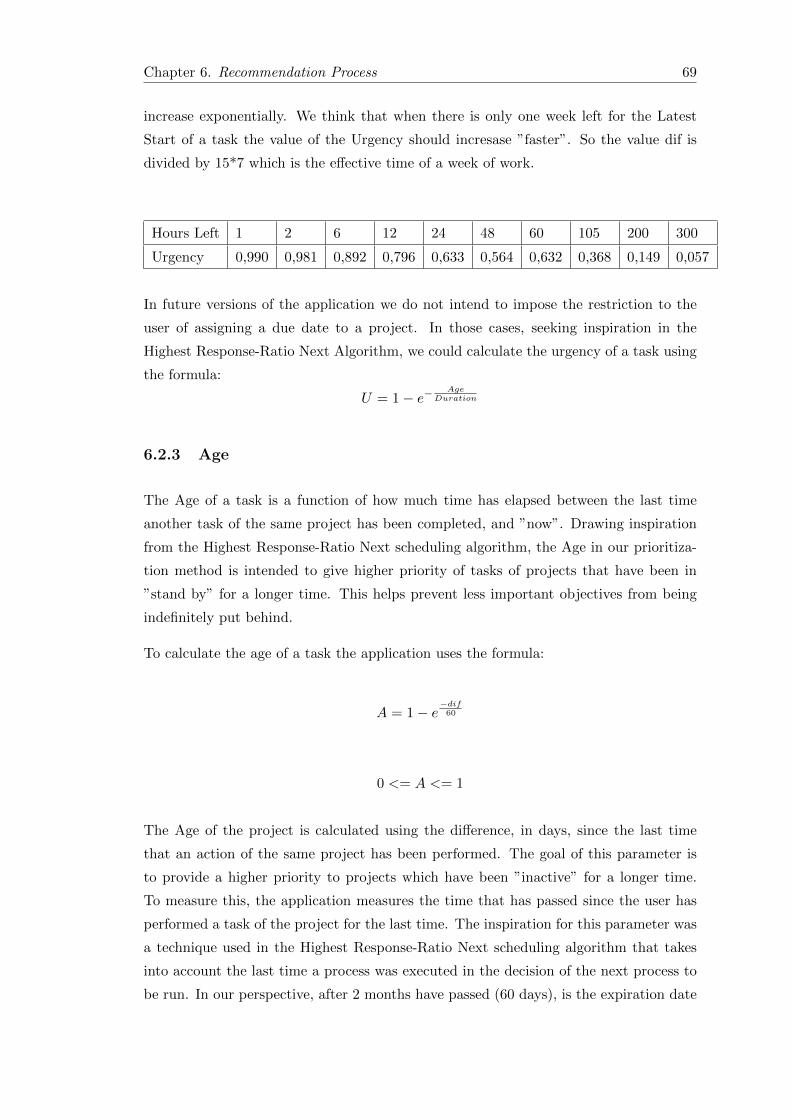
Chapter 6. Recommendation Process 69
increase exponentially. We think that when there is only one week left for the Latest
Start of a task the value of the Urgency should incresase ”faster”. So the value dif is
divided by 15*7 which is the effective time of a week of work.
Hours Left 1 2 6 12 24 48 60 105 200 300
Urgency 0,990 0,981 0,892 0,796 0,633 0,564 0,632 0,368 0,149 0,057
In future versions of the application we do not intend to impose the restriction to the
user of assigning a due date to a project. In those cases, seeking inspiration in the
Highest Response-Ratio Next Algorithm, we could calculate the urgency of a task using
the formula:
U = 1 − e−Age
Duration
6.2.3 Age
The Age of a task is a function of how much time has elapsed between the last time
another task of the same project has been completed, and ”now”. Drawing inspiration
from the Highest Response-Ratio Next scheduling algorithm, the Age in our prioritiza-
tion method is intended to give higher priority of tasks of projects that have been in
”stand by” for a longer time. This helps prevent less important objectives from being
indefinitely put behind.
To calculate the age of a task the application uses the formula:
A = 1 − e−dif60
0 <= A <= 1
The Age of the project is calculated using the difference, in days, since the last time
that an action of the same project has been performed. The goal of this parameter is
to provide a higher priority to projects which have been ”inactive” for a longer time.
To measure this, the application measures the time that has passed since the user has
performed a task of the project for the last time. The inspiration for this parameter was
a technique used in the Highest Response-Ratio Next scheduling algorithm that takes
into account the last time a process was executed in the decision of the next process to
be run. In our perspective, after 2 months have passed (60 days), is the expiration date

Chapter 6. Recommendation Process 70
to a project start being forgotten by the user. So we use this value as reference for the
value of the Age factor start growing at a higher speed.
Variation of the value Age:
Figure 6.6: Age Variation
Days 0 1 7 15 30 90 120 365
Age 0 0,016 0,110 0,221 0,393 0,776 0,864 0,997
6.2.4 Speed
In this parameter the system will try to give more priority to the tasks that have a
shorter duration. The duration will be processed in minutes. The reason for us adding
this parameter for the recommendation algorithm is that David Allen defends that the
user spend less energy performing shorter actions than longer ones, which raises his
productivity. For calculating the Speed value we used as reference the value 25 which is
the duration defended by Francisco Cirillo to be the the time a person can focus while
performing a task, in the Pomodoro Technique.
To calculate the speed of a task the application uses the formula:
S = e−duration
25
0 <= S <= 1
Variation of the value Speed:

Chapter 6. Recommendation Process 71
Figure 6.7: Speed Variation
Duration 5 15 30 45 60 120
Speed 0,818 0,548 0,301 0,166 0,090 0,008
6.2.5 Presentation of the Tasks
After calculating the priority of the tasks the system displays only the ones that the
user can perform at the moment.
We present below a screenshot of a prioritized list tasks displayed to the user according
to his priorities. It’s up to him to decide which task he is going to perform. In addition
to this, he can also restrain even more that list using the filters of the application.
Figure 6.8: Prioritized list of tasks

Chapter 7
Developing,Testing and
Validation
In this chapter we present the procedures followed by us to verify if the application
meets the Functional Requirements presented in the first semester and if the mechanisms
developed to aid the user choosing the tasks to perform are valid.
7.1 Development and Testing
The development of the several functionalities was made following the Gant designed
in the first semester. The first phase of testing of each ”module” was made along the
developing process of it. After development and test of individual modules, integration
tests were carried out and the system iteratively validated with the supervisor of the
project. The cycle comprised of testing and validation, error detection and improvements
suggestion, and corrections and implementation of improvements. Several iterations
took place along this cycle until the application reached a stable state with rich enough
features for this prototype application.
7.2 Validation
7.2.1 Functional Requirements
We now analyze the completion of the requirements proposed in the first semester. To
provide an overview we inserted the results of the completion of the requirements in a
72

Chapter 7. Testing and Validation 73
table. Each row represents one table of the section 4.1 and is filled with the total number
of requirements of each category, how many were completed and their percentage.
Figure 7.1: Functional Requirements Completion Ratios
We can conclude that all the 58 of the ”Must” requirements have been completed. This
indicates that all the crucial requirements were satisfied. In addition to this, more than
fifty per cent of the ”Should” requirements and 3 out of 10 of the classified as ”Could”
were also completed. We can conclude that the commitment made in the first semester
was completed.
7.2.2 Recommendation Algorithm
In order to validate the algorithm of prioritization of tasks and the usefulness of the
methods for filtering them, 14 people have used the application and responded to a
questionnaire. Because most of them did not know the GTD Methodology they were
given a short introduction to GTD. To each one of them was provided a computer with
the latest version of the application, the questionnaire and the user manual. In addition
to this, the users had a field where they could leave some observations. Each one of
them spent at least half an hour putting in the system their inputs which consisted of
at least of 20 tasks, 5 projects and 3 higher level objectives. To be possible to measure
the answers to the questionnaire we put them in a scale from 1 to 5 where:
• 1. I completely Disagree
• 2. I disagree
• 3. I do not Agree nor Disagree
• 4. I Agree
• 5. I completely agree
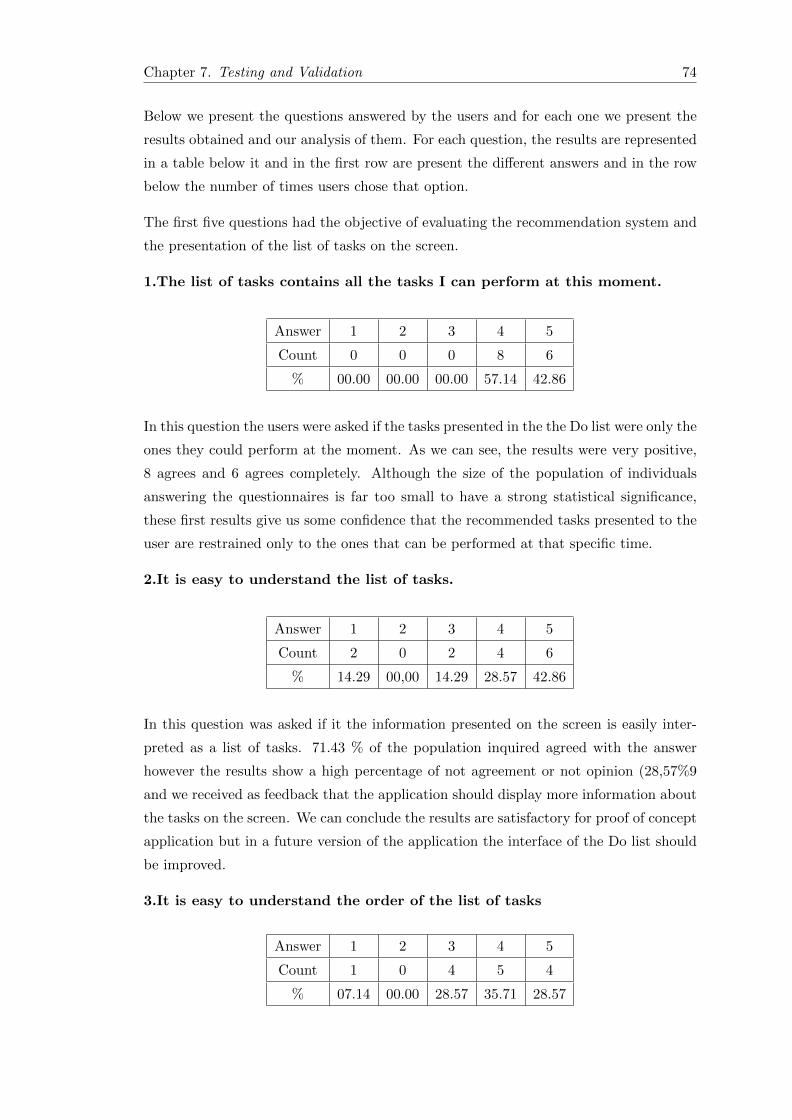
Chapter 7. Testing and Validation 74
Below we present the questions answered by the users and for each one we present the
results obtained and our analysis of them. For each question, the results are represented
in a table below it and in the first row are present the different answers and in the row
below the number of times users chose that option.
The first five questions had the objective of evaluating the recommendation system and
the presentation of the list of tasks on the screen.
1.The list of tasks contains all the tasks I can perform at this moment.
Answer 1 2 3 4 5
Count 0 0 0 8 6
% 00.00 00.00 00.00 57.14 42.86
In this question the users were asked if the tasks presented in the the Do list were only the
ones they could perform at the moment. As we can see, the results were very positive,
8 agrees and 6 agrees completely. Although the size of the population of individuals
answering the questionnaires is far too small to have a strong statistical significance,
these first results give us some confidence that the recommended tasks presented to the
user are restrained only to the ones that can be performed at that specific time.
2.It is easy to understand the list of tasks.
Answer 1 2 3 4 5
Count 2 0 2 4 6
% 14.29 00,00 14.29 28.57 42.86
In this question was asked if it the information presented on the screen is easily inter-
preted as a list of tasks. 71.43 % of the population inquired agreed with the answer
however the results show a high percentage of not agreement or not opinion (28,57%9
and we received as feedback that the application should display more information about
the tasks on the screen. We can conclude the results are satisfactory for proof of concept
application but in a future version of the application the interface of the Do list should
be improved.
3.It is easy to understand the order of the list of tasks
Answer 1 2 3 4 5
Count 1 0 4 5 4
% 07.14 00.00 28.57 35.71 28.57

Chapter 7. Testing and Validation 75
In this question was asked if the understood the tasks were presented in a specific order.
64.29 % agreed with the question, however 28,57 didnot agree or disagree. We can
conclude of the results that, despite most of the people inquired understood the list of
tasks, in a future version of the application there should be present on the screen some
kind of information alerting the user the tasks presented are ordered by priority.
4.The list is ordered according to my priorities (the one with the biggest
priority in the begin)
Answer 1 2 3 4 5
Count 0 0 2 3 9
% 00.00 00.00 14.29 21.43 64.29
In this question was asked if the tasks presented were ordered by their priority. 85,72
% of the users Agreed or Agreed Completely, so we can conclude the results of the
prioritization algorithm are valid. Although the size of the population of individuals
answering the questionnaires is far too small to have a strong statistical significance,
these first results give us some confidence that the values of the priority calculated are
right.
5.In the list of tasks some tasks are disordered according to my priorities
Answer 1 2 3 4 5
Count 7 5 2 0 0
% 50.00 35.71 14.29 00.00 00.00
In this question was asked the same than in question 4, however was inquired on the
negative to verify the attention of the users while answering this questionnaire. If the
results were not the opposite no results could be taken from the questionnaire because
the answers were not sequent. 85,72 % did not agreed or did not agreed completely with
this question and 14,29 % did not agree nor disagree which are the opposite percentages
of question 4, so we can assume the usersd answered sincerely tot he questionnaire.
Although having a small population inquired we can take some conclusions of the first
results. The results of the restrain of tasks and ordering by priority are very positive
and show that we are on the right path to take this method to another level. However,
the interface of the Do screen should be improvised to provide a better experience and
easier understood of the application by the future users.

Chapter 7. Testing and Validation 76
7.2.3 Filters
The following questions had the objective of analyzing the usefulness of the filter mech-
anism of tasks available in the platform.
6.The filter by ”location” helps me in the decision of choosing the next task
to perform
Answer 1 2 3 4 5
Count 1 0 5 4 4
% 07.14 00,00 35.71 28.57 28.57
In this question was asked to the users if the filter by location required to the perform
the task was useful in the choice of the next task to perform.
7.The filter by ”tool” helps me in the decision of choosing the next task to
perform
Answer 1 2 3 4 5
Count 0 0 5 3 6
% 00.00 00.00 35.71 21.43 42.86
In this question was asked to the users if the filter by tool required to perform the task
was useful in the choice of the next task to perform.
8.The filter by ”person” helps me in the decision of choosing the next task
to perform
Answer 1 2 3 4 5
Count 0 1 4 2 7
% 00.00 07.14 28.57 14.29 50.00
In this question was asked to the users if the filter by person required to perform the
task was useful in the choice of the next task to perform.
These 3 filters had in general a good reception by the the users, 57,14%, 57,14% and
64,29% respectively have agreed or completely agreed with the questions. However we
have received some feedback of the users that answered 3, 2 or 1 in these questions and
in the two below that they do not feel the need to associate contexts with tasks. Since
the majority of the population studied have agreed with the usefulness of this filters, we
decided to keep them for future development of the application.

Chapter 7. Testing and Validation 77
9.The filter by ”energy” helps me in the decision of choosing the next task
to perform
Answer 1 2 3 4 5
Count 1 2 1 5 5
% 07.14 14.29 00.07 35.71 35.71
In this question was asked if the filter by energy necessary to perform a tasks was useful
in the choice of the next task to perform. 71.42% of the population studied agreed with
the question asked so we can conclude that this filter brings value to the application and
can help the user in the decision of the next task to perform.
10.The filter by ”duration” helps me in the decision of choosing the next
task to perform
Answer 1 2 3 4 5
Count 1 0 0 6 7
% 07.14 00.00 00.00 42.86 50.00
In this question was asked if the the filter by ”duration” was useful for the useful when
he had to decide the next task to perform next. Having a grade of acceptance of 92.86%,
we can conclude this filter is the most relevant for the user when needs to filter the tasks
presented, comparing to the other values of the inquiry and the factor of speed in a task
should have more relevance in further developments of the algorithm.
11.The filter by ”Area of Focus” helps me in the decision of choosing the
next task to perform
Answer 1 2 3 4 5
Count 0 0 2 7 5
% 00.00 00.00 14.29 50.00 35.71
In this question was asked is if the filtering the tasks presented by an area of inter-
est/responsibility could be useful for deciding the next task to perform. We had a
good feedback overall having 85,71% of the population answered that agreed with the
usefulness of this filter, so we can conclude it brings value to the application.
12.The filter of the application are enough to help me in the decision of the
next task to perform
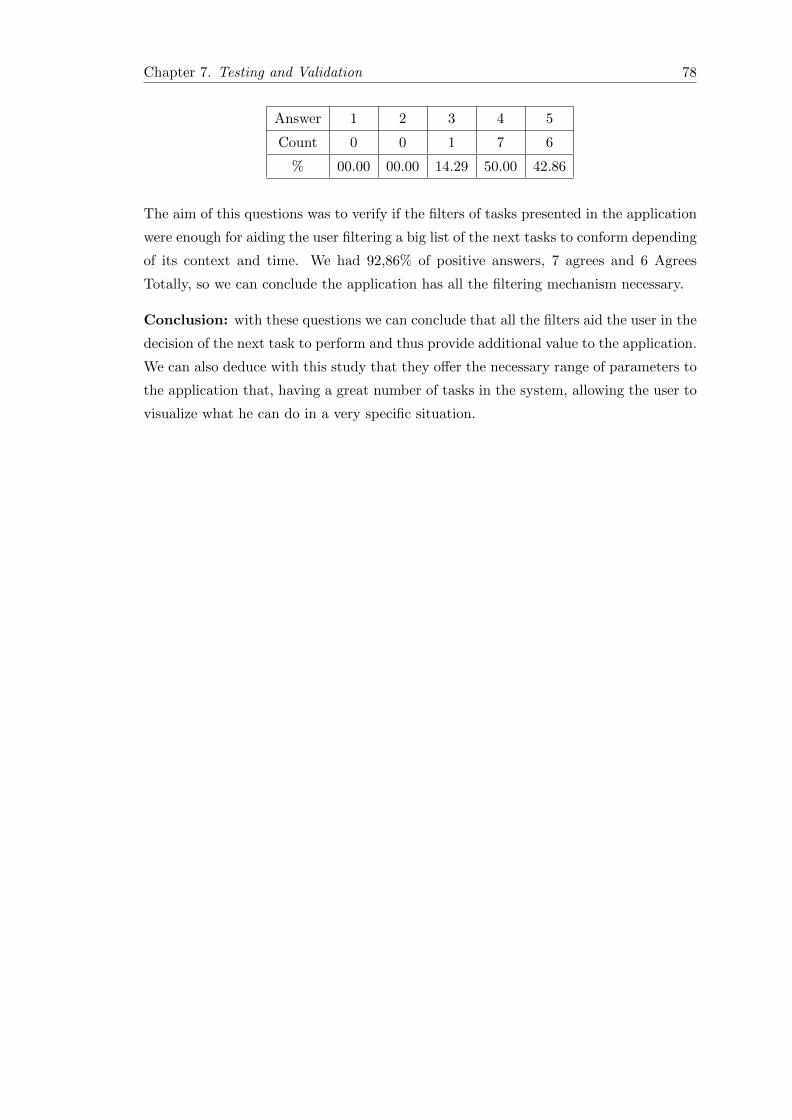
Chapter 7. Testing and Validation 78
Answer 1 2 3 4 5
Count 0 0 1 7 6
% 00.00 00.00 14.29 50.00 42.86
The aim of this questions was to verify if the filters of tasks presented in the application
were enough for aiding the user filtering a big list of the next tasks to conform depending
of its context and time. We had 92,86% of positive answers, 7 agrees and 6 Agrees
Totally, so we can conclude the application has all the filtering mechanism necessary.
Conclusion: with these questions we can conclude that all the filters aid the user in the
decision of the next task to perform and thus provide additional value to the application.
We can also deduce with this study that they offer the necessary range of parameters to
the application that, having a great number of tasks in the system, allowing the user to
visualize what he can do in a very specific situation.

Chapter 8
Conclusions and Future Work
8.1 Conclusions
We have successfully developed the first prototype of a GTD-based application that
automatically prioritizes the user’s tasks according to his importances, deadlines, and
commitments in his online calendar. The application securely integrates with Google
Calendar for event synchronization, and more accurate calculus of urgencies; and it
also securely integrates with Evernote to allow the user to capture his thoughts and
ideas anywhere. This is a first prototype and there is room many improvements, namely
regarding usability and the user interface, before a commercial version of the application
can be deployed. Still, the combination of features of this application is unique, especially
the prioritization mechanism which is indeed innovative as no other similar application
provides a comparable functionality.
8.2 Future Work
We think the application developed could be useful to a great number of people to help
them improve their productivity and is our intention to continue its development. We
would like to improve its usability for proving a better UI for people who are not familiar-
ized with the GTD Methodlogy and perhaps web-based, and a develop a mobile version
of the application. In terms of the missing requirements (Should and could), we intend
to developed them in order to provide additional useful features tot the application.
79

Appendix A
Work Plan
In this section we present the distribution of the work during the first and the second
semester.
A.1 Work Plan for the First Semester
In this section we present the distribution of the work in the first semester.
Figure A.1: Distribution of the Work in the First Semester
• Read the GTD Book: In the first two weeks of the semester I read the ”Getting
Things Done”[1] book, where David Allen explains his productivity methodology
that has been followed in the design of the application.
• Analyze of the GTD Applications: In this task I have analyzed a list of the
most used applications that use the GTD methodology as inspiration in order to
understand what new features that our application could give to the users.
80

Work Plan Work Plan 81
• Study of the Activity Selection Problem: In this tasks I studied the pro-
graming problem activity selection problem with the objective of understand the
different solutions already found to solve it and how to adapt them into our rec-
ommendation problem.
• Analysis of Scheduling Algorithms: I analyzed the different scheduling algo-
rithms in order to understand different approaches for solving scheduling problems
and which of their characteristics could be applied to our projects.
• Requirements Analysis: In this tasks, I analyzed and documented the list of
physical and functional requirements needed to ensure the developing of the project
goal.
• Design of the GUI Prototypes: In this task, I designed the prototypes that
represent the future Interface with the user will interact with, based on the re-
quirements analysis.
• Design of the Sequence Diagrams This task was needed in order to repre-
sent the temporal difference between the functions represented in the Use Cases
Diagram.
• Design of The Components Diagram: The objective of this task was to
represent the different components that system will need to have or communicate
in order to perform its functions.
• Design of the Recommendation System: In this task I used the information
collected in the study of the activity selection problem and the analysis of the
scheduling algorithm in order to come to a first prototype of the final algorithm
that will be used in the application to recommend tasks to the user.
• Study of the Technologies: In this tasks I analyzed the different technologies
that can be used in order to develop our application.
• Write of the Report Since the start of this task all the information collected in
other tasks was documented in order to be present in the intermediate report.

Work Plan Work Plan 82
A.2 Work Plan for the Second Semester
Figure A.2: Distribution of the Work in the Second Semester
• Integration of the Alterations: Analysis of the alterations to the work devel-
oped in the first semester suggested by the jury and implementation of them.
• Design of the Architecture: Design of the final version of the architecture of
the system. Will be designed a Class Diagram, Entity-Relationship Diagram and
a more detailed Component Diagram with the objective of defining the details of
the implementation. In this tasks will also be made a Risk analysis of the project.
• Defining testing methodlogy: Defining the tests and validations necessary to
Validate the implementation.
• Design of the Final version of the Recommendation Algorithm Design of
the final version of the algorithm that will developed in the implementation phase.
• Implementation of the Interface: Implementation of the proposed Interface
of the application based in the prototypes designed.
• Validation of the Interface: Validate the interface implemented.
• Implementation of the Support: Implementation of the functions to provide
the application features proposed for creating Contexts and Areas of Focus.
• Validation of the Support: Validate the implementation of the Support func-
tions.
• Implementation of the Collect and Process : Implementation of the func-
tions to provide the application features proposed for the Collect and Process
processes.

Work Plan Work Plan 83
• Validation of the Collect and Process: Validate the implementation of the
Collect and Process functions.
• Implementation of the Review : Implementation of the functions to provide
the application features proposed for the Review process.
• Validation of the Review: Validate the implementation of the Review functions.
• Implementation of the Recommendation : Implementation of the functions
to provide the application features proposed for the Recommendation of Tasks
System.
• Validation of the Review: Validate the implementation of the prioritization
functions.
• Implementation of the Synch with Evernote: Implementation of the Module
that keeps the information of the application and the Evernote up to date .
• Validation of the Evernote: Validate the implementation of the Evenote Synch
Module.
• Implementation of the Synch with google: Implementation of the component
that keeps the information of the application and the Google Calendar up to date
.
• Validation of the Google: Validate the implementation of the Google Synch
component.
• Correct failures: Correct Possible failures that appear in the system in validate
system testing
• Validation of the System: Validate the integration of the diferent comnponent
of the system.
• Deployment: deploy the application in Linux, Windows and Mac OS X environ-
ment.
• Validation of the Deployment: Validate the deployment using the deployment
tests elaborated.

Bibliography
[1] David Allen. Getting Things Done: The Art of Stress-Free Productivity. Penguin
Group, 2001.
[2] The Guardian. Meet the man who can bring order to your universe. September
2005.
[3] Jeremy Caplan. The oracle of organization. Time Magazine, March 2007.
[4] Gtd workflow map, 1 2014. URL http://radicallycandid.com/files/2012/08/
GTD_flow.jpg.
[5] The eisenhower decision matrix: How to distinguish between urgent and impor-
tant tasks and make real progress in your life, 10 2013. URL http://www.
artofmanliness.com/2013/10/23/eisenhower-decision-matrix/.
[6] Goal setting: A fresh perspective, June 2012. URL http://www.oracle.com/us/
media1/goal-setting-fresh-perspective-ee-1679275.pdf.
[7] Michael Lineberg. The One Minute To DO List. New Academy Publishers, 2014.
[8] Staffan Noteberg. Pomodoro Technique Illustrated. The Pragmatic Bookshelf, 2009.
[9] Omnifocus webpage, 6 2014. URL http://www.omnigroup.com/omnifocus/.
[10] Omnigroup website, 6 2014. URL http://www.omnigroup.com/.
[11] Omnifocus screenshot, 6 2014. URL http://radicallycandid.com/files/2012/
08/GTD_flow.jpg.
[12] Omnifocus webpage, 6 2014. URL http://www.omnigroup.com/omnifocus/.
[13] Culture code website, 1 2014. URL http://culturedcode.com/.
[14] Things 2 screenshot, 6 2014. URL http://a4.mzstatic.com/us/r30/Purple/v4/
e0/46/90/e04690e0-3309-b600-dcda-fb574737dea1/screen800x500.jpeg.
84

Bibliography 85
[15] Inbox classic download webpage, 6 2014. URL https://itunes.apple.com/pt/
app/inbox-classic/id528008223?mt=12.
[16] Midnight beep website, 6 2014. URL http://www.midnightbeep.com/.
[17] Inbox classic screenshot, 6 2014. URL http://a2.mzstatic.com/us/r30/Purple/
v4/9a/0a/b6/9a0ab6a6-fc4e-5088-bc50-4fc098b67a4b/screen800x500.jpeg.
[18] Iqtell website, 6 2014. URL http://iqtell.com/.
[19] Evernote website, 1 2014. URL https://evernote.com/.
[20] Iqtell screenshot, 6 2014. URL http://iqtell.com/wp-content/uploads/2013/
11/web_image3.png.
[21] Life balance webpage, 1 2014. URL http://www.llamagraphics.com/products/
life-balance/.
[22] Lamagraphics website, 6 2014. URL http://www.llamagraphics.com/.
[23] Life balance screenshot, 6 2014. URL http://a5.mzstatic.com/us/r30/Purple/
v4/13/6a/18/136a18b4-cc7f-f088-ff29-a8410aa946b6/screen320x480.jpeg.
[24] Jive software website, 6 2014. URL http://www.jivesoftware.com/.
[25] Producteev screenshot, 6 2014. URL https://encrypted-tbn2.
gstatic.com/images?q=tbn:ANd9GcSgtwpATSKJ486G4O3bp5kQmMG_
e7KkeFDFzhhC2CcNqm7zw4lm.
[26] Jive website, 6 2014. URL http://www.jivesoftware.com/.
[27] Avente webpage, 1 2014. URL http://www.trgtd.com.au/index.php/
aboutusmenu.
[28] Thikingrock screenshot, 6 2014. URL http://antoniosanchez.files.
wordpress.com/2007/08/ejemplo_thinkingrock.png.
[29] Toodledo website, 6 2014. URL http://www.toodledo.com/.
[30] Toodledo screenshot, 6 2014. URL http://www.chriscanfield.net/Offsite/
BlogImages/ToodledoRework.png.
[31] Todoist Website. To, 1 2014. URL https://en.todoist.com/.
[32] Doist website, 6 2014. URL http://doist.io/.
[33] Todoist screenshot, 6 2014. URL http://cdn1.tnwcdn.com/wp-content/blogs.
dir/1/files/2013/03/Todoist-520x535.png.

Bibliography 86
[34] Nirvana website, 6 2014. URL https://www.nirvanahq.com/.
[35] Nirvana screenshot, 6 2014. URL http://larrinski.files.wordpress.com/
2010/09/nirvana_screenshot.png.
[36] Asana website, 1 2014. URL https://asana.com/.
[37] Asana screenshot, 6 2014. URL http://allthingsd.com/files/2011/11/
asana-project.png.
[38] Remember the milk website, 6 2014. URL http://www.rememberthemilk.com/.
[39] Rememberthemilk screenshot, 6 2014. URL http://www.maclife.com/files/
u129772/RTM_full.jpg.
[40] Wunderlist website, 6 2014. URL https://www.wunderlist.com/en/.
[41] Wunderlist screenshot, 6 2014. URL http://3.bp.blogspot.com/-cMFPkwQS4jU/
UKtf7D9YWHI/AAAAAAAAALk/m6V8A1BRDzE/s640/wunderlist.png.
[42] Adam Pash. Five best calendar applications. Technical report, lifehacker,
http://lifehacker.com/5048189/five-best-calendar-applications, 11 2008.
[43] Alan Henry. Five best note taking applications. Technical report, lifehacker,
http://lifehacker.com/5837191/five-best-note-taking-applications, 11 2011.
[44] Completely fair scheduler, 1 2014. URL http://www.ibm.com/developerworks/
linux/library/l-completely-fair-scheduler/.
[45] Samuel L. Baker. Critical path method (cpm). Technical report, University of
South Carolina, 2004.
[46] William Stallings. Operating systems: internals and design principles. Prentice-Hal,
2001.
[47] A Silberschatz. Operating Systems Concepts. 7. Wiley, 2005.
[48] Dongjin Choi Myunggwon Hwang and Pankoo Kim. Least slack time rate first:
an efficient scheduling algorithm for pervasive computing environment. Journal of
Universal Computer Science, 17:912–925, 2011.
[49] Peter Bruker. Scheduling algorithms. pages I–XII, 1–367, January 2004.
[50] L. Keinrock and R. Muntz. Processor sharing queueing models of mixed scheduling
disciplines for time shared systems. Journal of the ACM, 18:464–482, July 1972.
[51] A Guide to the Project Management Body of Knowledge. Project Management
Institute, 4th edition edition, 2009.

Bibliography 87
[52] Lin Liu and Eric Yu. Designing information systems in social context: A goal and
scenario modelling approach. Inf. Syst, 29(2):187–203, April 2004.
[53] Eric S. Yu. Social modeling and i*. Faculty of Information, University of Toronto,
Canada.
[54] Alistair Cockburn. Writting Effective Use Cases. Addison-Wesley, 2001.
[55] Jorge Aranda Scott Munro, Sotiries Liaskos. The mysteries of goal decomposition.
CEUR Workshop Proceedings, 766:49–54, 2011.
[56] W. B. Denniston J. S. Armstrong and M.M. Gordon. The use of the decompostion
principle in making judgments. Organizational Behaviour and Human Performance,
14:257–263, 1975.
[57] K. S. Lyness and Cornelius E-T. A comparison of holistic and decomposed judge-
ment strategies in performance rating simulation. Organization Behaviour and Hu-
man performance, pages 21–38, 1982.
[58] Ian Sommerville. Software Engineering. Addison-Wesley, 9 edition, March 2013.
[59] Capturing architectural requirements, 111 2005. URL http://www.ibm.com/
developerworks/rational/library/4706.html#N100A7.
[60] IIBA International Institute of Business Analysis. A Guide to the Business Analysis
Body of Knowledge R© (BABOK R© Guide). 2009.
[61] Uml use case diagrams: Guidelines, 2013. URL http://msdn.microsoft.com/
en-us/library/dd409432.aspx.
[62] Chris Britton. Choosing a programming language, 1 2008. URL http://msdn.
microsoft.com/en-us/library/cc168615.aspx.
[63] The java language environment, 1 2014. URL http://www.oracle.com/
technetwork/java/intro-141325.html.
[64] Google calendar api, 6 2014. URL https://developers.google.com/
google-apps/calendar/.
[65] Netbeans website, 6 2014. URL https://netbeans.org/.
[66] Sqlite website, 1 2014. URL http://www.sqlite.org/.
[67] When to use sqlite. URL http://sqlite.org/cvstrac/wiki?p=
WhenToUseSqlite.
[68] Sql as understood by sqlite, 6 2014. URL https://www.sqlite.org/lang.html.

Bibliography 88
[69] Andre B. Bondi. Characteristics of scalability and their impact on performance.
Proceedings of the second international workshop on Software and performance,
pages 195–203, 2000.
[70] Sqlite copyright, 1 2014. URL http://www.sqlite.org/copyright.html.
[71] Self-contained application packaging, 6 2014. URL http://docs.oracle.com/
javafx/2/deployment/self-contained-packaging.htm#BCGIBBCI.