Embed Size (px)
Citation preview
Intel® System Studio 2014 Complete Development Solution for Intelligent/Embedded Systems Finding 3 common embedded programming errors using Intel® Inspector 2014 for Systems
Copyright© 2013, Intel Corporation. All rights reserved. *Other brands and names are the property of their respective owners.
What you will learn from this slide deck
• Intel® Inspector for Systems technical training for
System & Application code running Linux*
• Please see subsequent slide decks for in-depth technical training on other components
2
Copyright© 2013, Intel Corporation. All rights reserved. *Other brands and names are the property of their respective owners.
Intel® Inspector 2014 for Systems
3
Easier Migration From Other Tools • Import suppression lists from Purify* and Valgrind* on Linux*
Fewer False Errors and Easier Suppression Management • Precise suppressions specify single or multiple stack locations • User editable suppression files (or use the GUI)
Leak Reports No Waiting! • Set a baseline for incremental analysis with GUI or API • Report incremental leaks and heap growth since the baseline • No waiting until the end of the analysis run
Copyright© 2013, Intel Corporation. All rights reserved. *Other brands and names are the property of their respective owners.
Agenda
Intel® Inspector 2014 for Systems
• Finding three common embedded programming errors using Intel® Inspector 2013 for Systems.
– 1. Dynamic Memory Errors
– 2. Dynamic Threading Errors
– 3. Static Analysis Errors
Copyright© 2013, Intel Corporation. All rights reserved. *Other brands and names are the property of their respective owners.
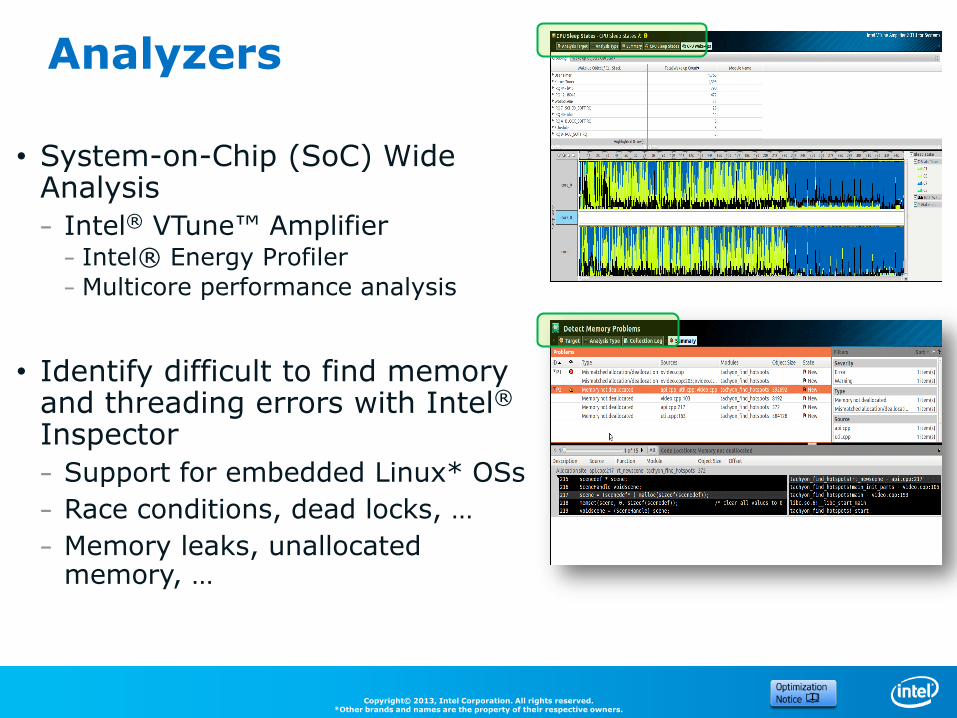
Analyzers • System-on-Chip (SoC) Wide Analysis
– Intel® VTune™ Amplifier – Intel® Energy Profiler
– Multicore performance analysis
• Identify difficult to find memory and threading errors with Intel® Inspector
– Support for embedded Linux* OSs
– Race conditions, dead locks, …
– Memory leaks, unallocated memory, …
Copyright© 2013, Intel Corporation. All rights reserved. *Other brands and names are the property of their respective owners.
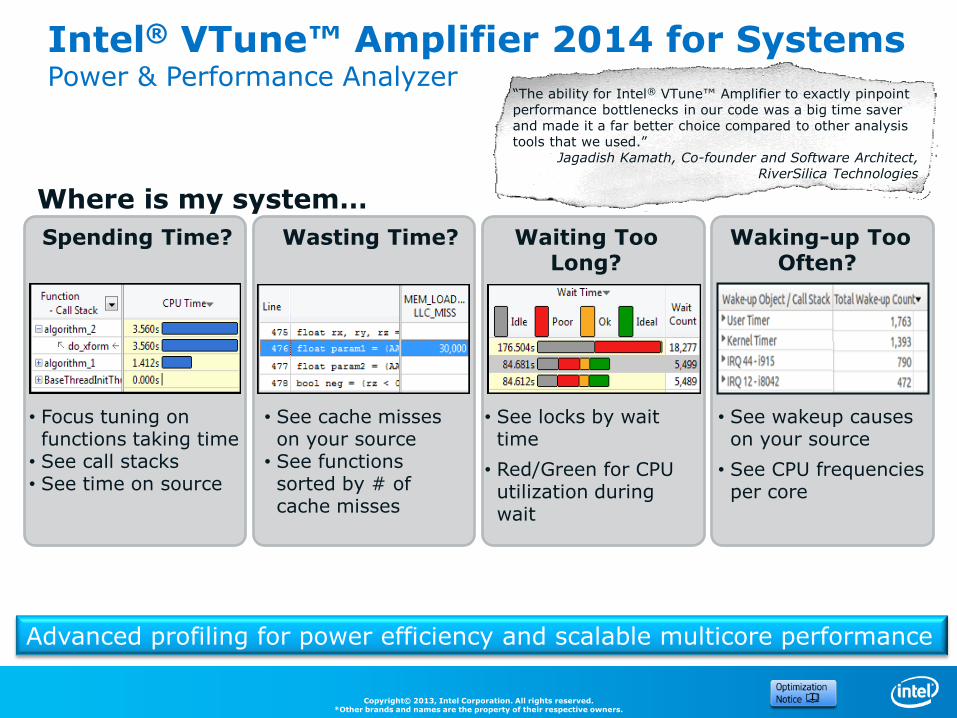
Where is my system…
Spending Time? Wasting Time? Waiting Too Long?
Waking-up Too Often?
• Focus tuning on functions taking time
• See call stacks • See time on source
• See cache misses on your source
• See functions sorted by # of cache misses
• See locks by wait time
• Red/Green for CPU utilization during wait
• See wakeup causes on your source
• See CPU frequencies per core
Intel® VTune™ Amplifier 2014 for Systems Power & Performance Analyzer
Advanced profiling for power efficiency and scalable multicore performance
“The ability for Intel® VTune™ Amplifier to exactly pinpoint performance bottlenecks in our code was a big time saver and made it a far better choice compared to other analysis tools that we used.”
Jagadish Kamath, Co-founder and Software Architect, RiverSilica Technologies
Copyright© 2013, Intel Corporation. All rights reserved. *Other brands and names are the property of their respective owners.
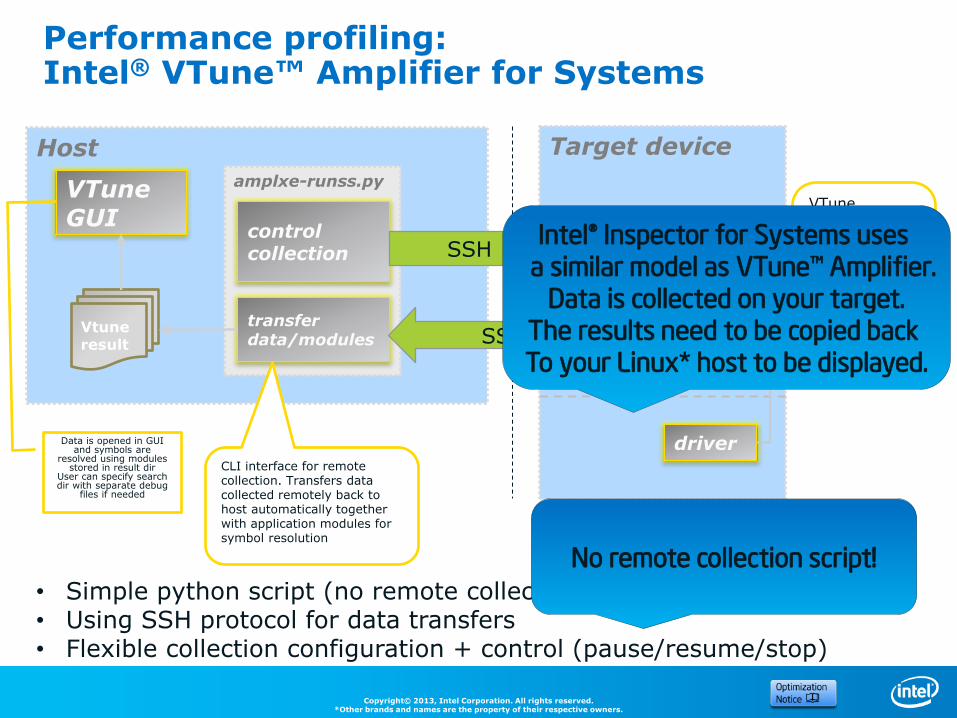
Target device
amplxe-runss
Host
VTune GUI
Vtune result
VTune collector binary runs on target and stores result on target (local storage like card or NFS mounted)
Data is opened in GUI and symbols are
resolved using modules stored in result dir
User can specify search dir with separate debug
files if needed
amplxe-runss.py
control collection
transfer data/modules
Vtune result
driver
SSH
SSH
CLI interface for remote collection. Transfers data collected remotely back to host automatically together with application modules for symbol resolution
Performance profiling: Intel® VTune™ Amplifier for Systems
• Simple python script (no remote collection in GUI) • Using SSH protocol for data transfers • Flexible collection configuration + control (pause/resume/stop)
Intel® Inspector for Systems uses
a similar model as VTune™ Amplifier. Data is collected on your target.
The results need to be copied back
To your Linux* host to be displayed.
No remote collection script!
Copyright© 2013, Intel Corporation. All rights reserved. *Other brands and names are the property of their respective owners.
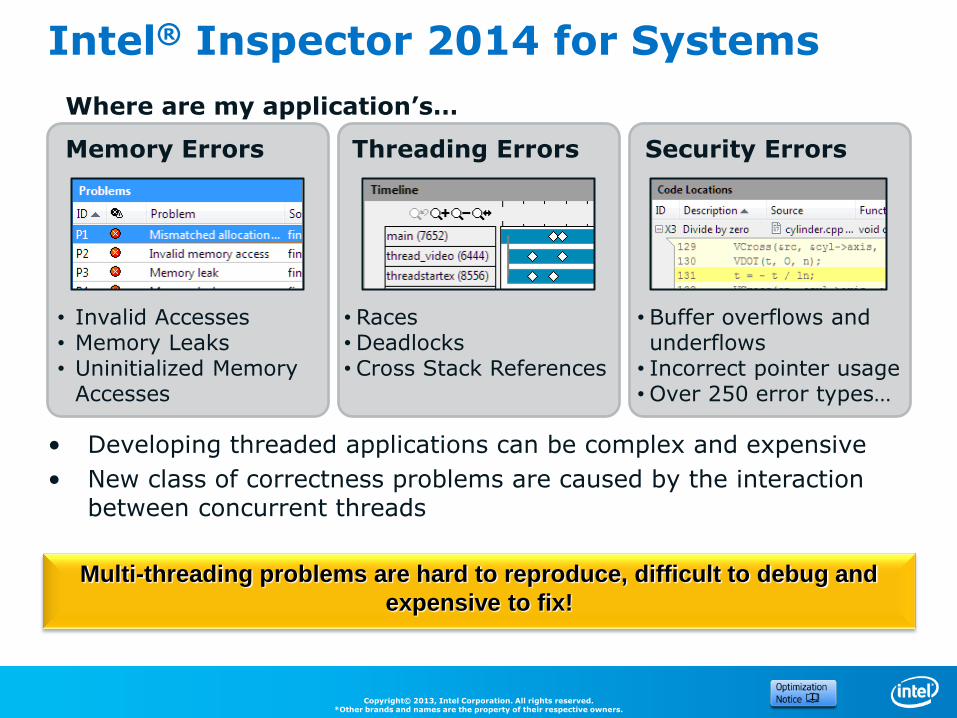
Where are my application’s…
Memory Errors Threading Errors Security Errors
• Invalid Accesses • Memory Leaks • Uninitialized Memory
Accesses
• Races • Deadlocks • Cross Stack References
• Buffer overflows and underflows
• Incorrect pointer usage • Over 250 error types…
Intel® Inspector 2014 for Systems
• Developing threaded applications can be complex and expensive
• New class of correctness problems are caused by the interaction between concurrent threads
Multi-threading problems are hard to reproduce, difficult to debug and
expensive to fix!
Copyright© 2013, Intel Corporation. All rights reserved. *Other brands and names are the property of their respective owners.
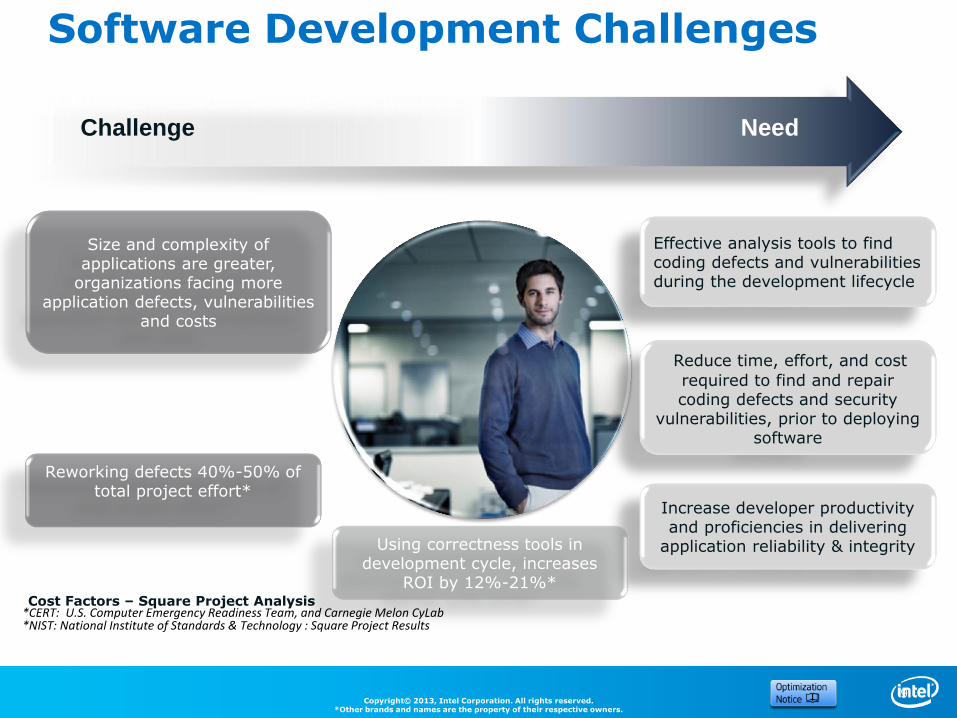
Software Development Challenges
9
Size and complexity of applications are greater,
organizations facing more application defects, vulnerabilities
and costs
Challenge Need
Reworking defects 40%-50% of total project effort*
Cost Factors – Square Project Analysis *CERT: U.S. Computer Emergency Readiness Team, and Carnegie Melon CyLab *NIST: National Institute of Standards & Technology : Square Project Results
Effective analysis tools to find coding defects and vulnerabilities during the development lifecycle
Reduce time, effort, and cost
required to find and repair coding defects and security
vulnerabilities, prior to deploying software
Increase developer productivity and proficiencies in delivering
application reliability & integrity Using correctness tools in development cycle, increases
ROI by 12%-21%*
Copyright© 2013, Intel Corporation. All rights reserved. *Other brands and names are the property of their respective owners.
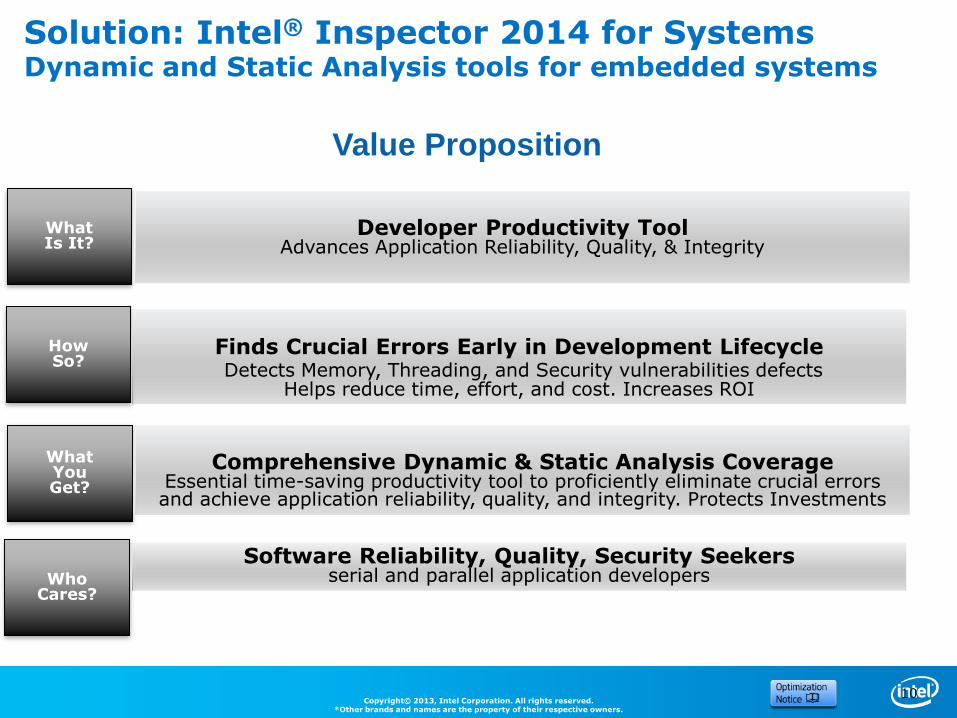
Solution: Intel® Inspector 2014 for Systems Dynamic and Static Analysis tools for embedded systems
10
What Is It?
How So?
What You Get?
Who Cares?
Developer Productivity Tool
Advances Application Reliability, Quality, & Integrity
Finds Crucial Errors Early in Development Lifecycle Detects Memory, Threading, and Security vulnerabilities defects
Helps reduce time, effort, and cost. Increases ROI
Comprehensive Dynamic & Static Analysis Coverage
Essential time-saving productivity tool to proficiently eliminate crucial errors and achieve application reliability, quality, and integrity. Protects Investments
Software Reliability, Quality, Security Seekers serial and parallel application developers
Value Proposition
Copyright© 2013, Intel Corporation. All rights reserved. *Other brands and names are the property of their respective owners.
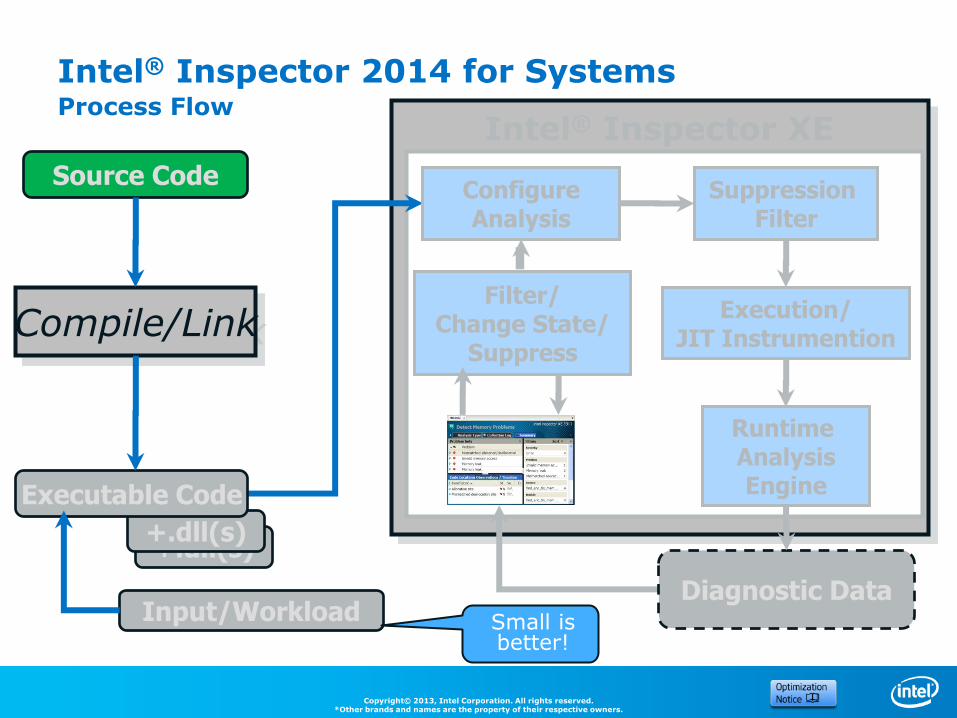
+.dll(s)
Intel® Inspector XE
Intel® Inspector 2014 for Systems Process Flow
Execution/ JIT Instrumention
Runtime Analysis Engine
Diagnostic Data
Source Code
+.dll(s)
Executable Code
Compile/Link
Configure Analysis
Suppression Filter
Filter/ Change State/
Suppress
Input/Workload Small is better!
Copyright© 2013, Intel Corporation. All rights reserved. *Other brands and names are the property of their respective owners.
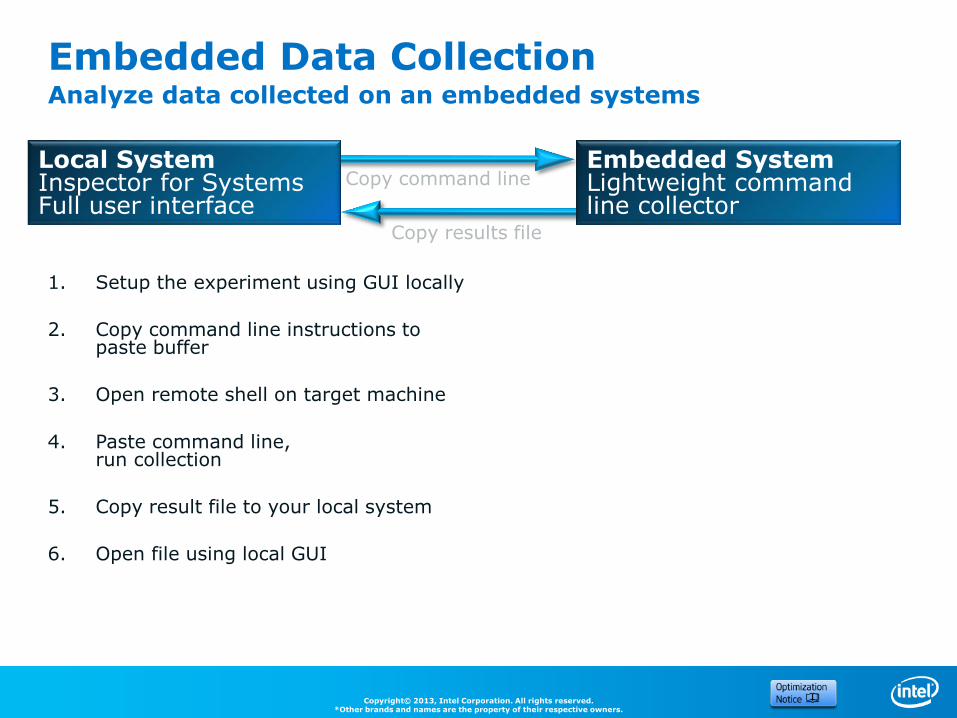
Embedded Data Collection Analyze data collected on an embedded systems
1. Setup the experiment using GUI locally
2. Copy command line instructions to paste buffer
3. Open remote shell on target machine
4. Paste command line, run collection
5. Copy result file to your local system
6. Open file using local GUI
Local System Inspector for Systems Full user interface
Embedded System Lightweight command line collector
Copy command line
Copy results file
Copyright© 2013, Intel Corporation. All rights reserved. *Other brands and names are the property of their respective owners.
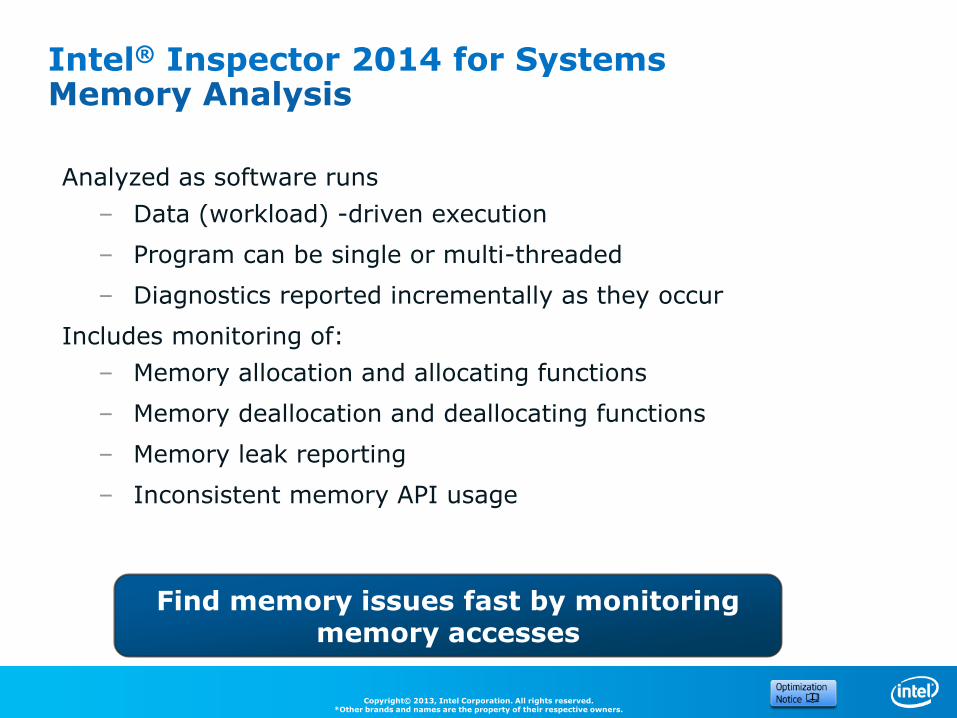
Intel® Inspector 2014 for Systems Memory Analysis
Analyzed as software runs
– Data (workload) -driven execution
– Program can be single or multi-threaded
– Diagnostics reported incrementally as they occur
Includes monitoring of:
– Memory allocation and allocating functions
– Memory deallocation and deallocating functions
– Memory leak reporting
– Inconsistent memory API usage
Find memory issues fast by monitoring
memory accesses
Copyright© 2013, Intel Corporation. All rights reserved. *Other brands and names are the property of their respective owners.
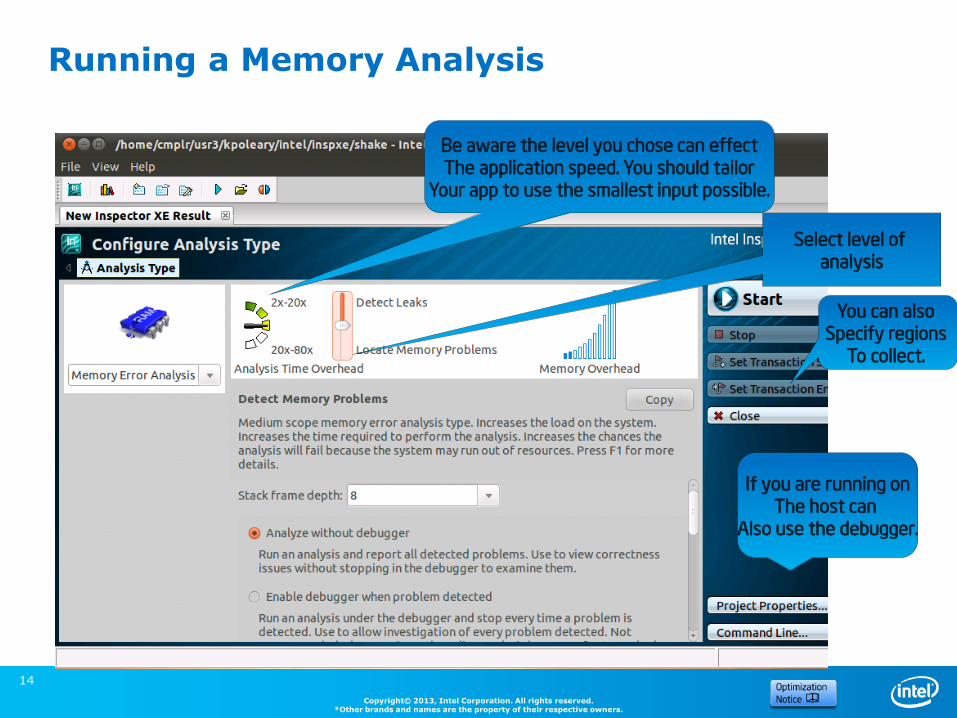
Running a Memory Analysis
14
Select level of analysis
You can also Specify regions
To collect.
If you are running on The host can
Also use the debugger.
Be aware the level you chose can effect The application speed. You should tailor
Your app to use the smallest input possible.
Copyright© 2013, Intel Corporation. All rights reserved. *Other brands and names are the property of their respective owners.
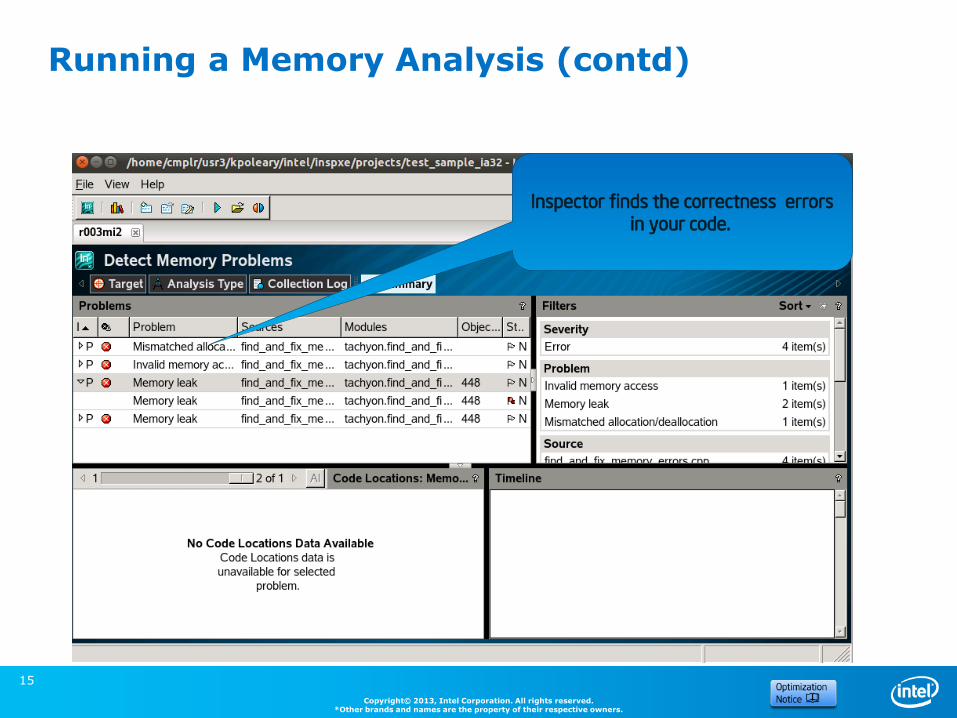
Running a Memory Analysis (contd)
15
Inspector finds the correctness errors in your code.
Copyright© 2013, Intel Corporation. All rights reserved. *Other brands and names are the property of their respective owners.
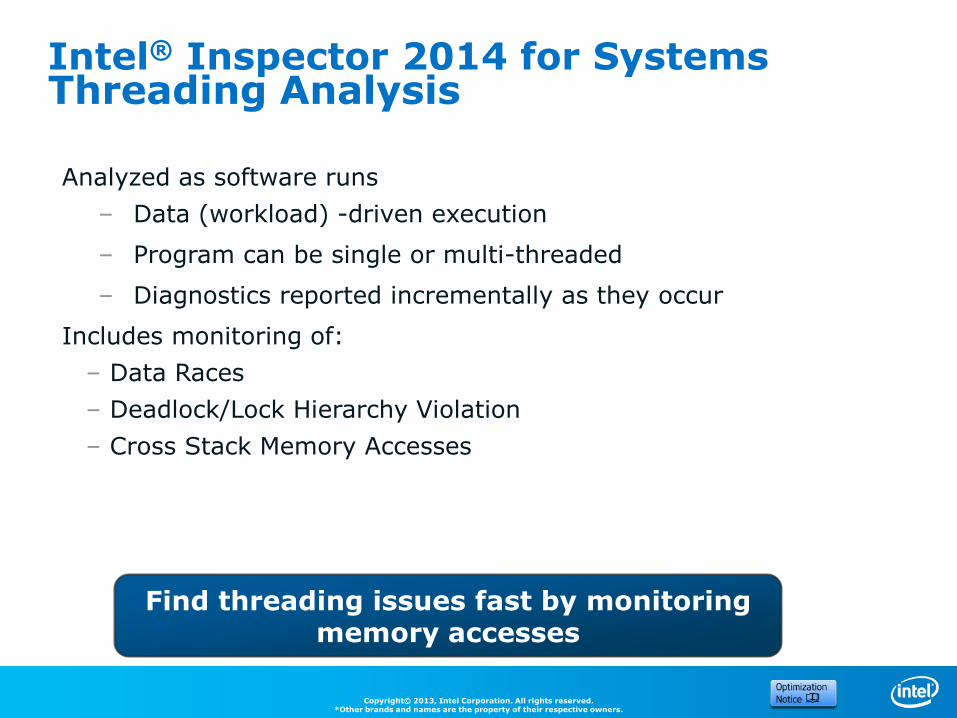
Intel® Inspector 2014 for Systems Threading Analysis
Analyzed as software runs
– Data (workload) -driven execution
– Program can be single or multi-threaded
– Diagnostics reported incrementally as they occur
Includes monitoring of:
– Data Races
– Deadlock/Lock Hierarchy Violation
– Cross Stack Memory Accesses
Find threading issues fast by monitoring memory accesses
Copyright© 2013, Intel Corporation. All rights reserved. *Other brands and names are the property of their respective owners.
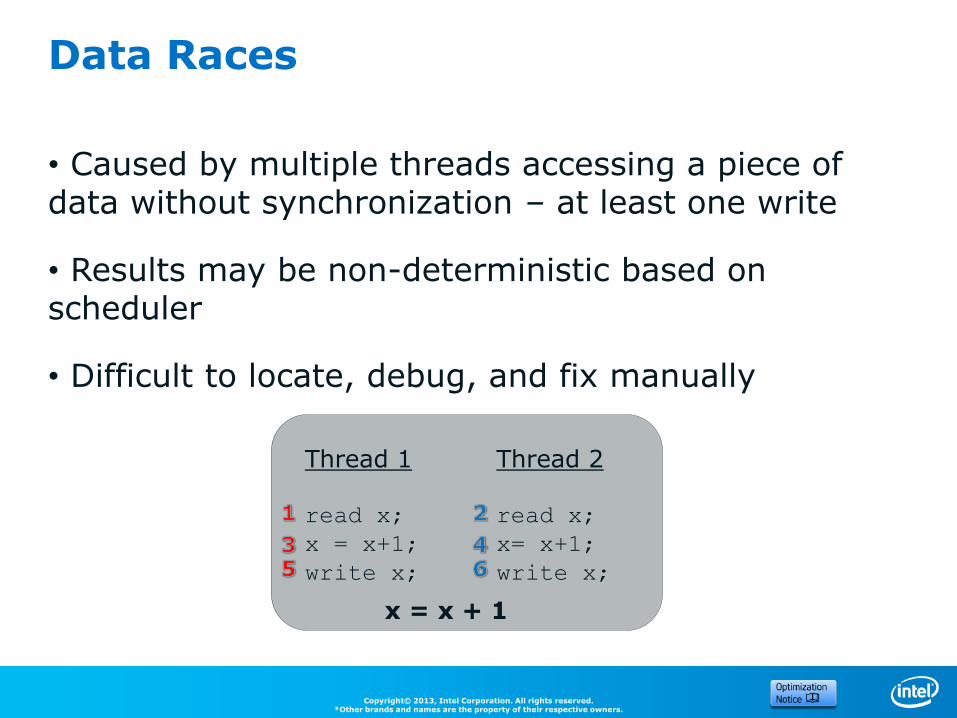
Data Races
• Caused by multiple threads accessing a piece of data without synchronization – at least one write
• Results may be non-deterministic based on scheduler
• Difficult to locate, debug, and fix manually
Thread 1 Thread 2
read x; read x;
x = x+1; x= x+1;
write x; write x;
x = x + 1
Copyright© 2013, Intel Corporation. All rights reserved. *Other brands and names are the property of their respective owners.
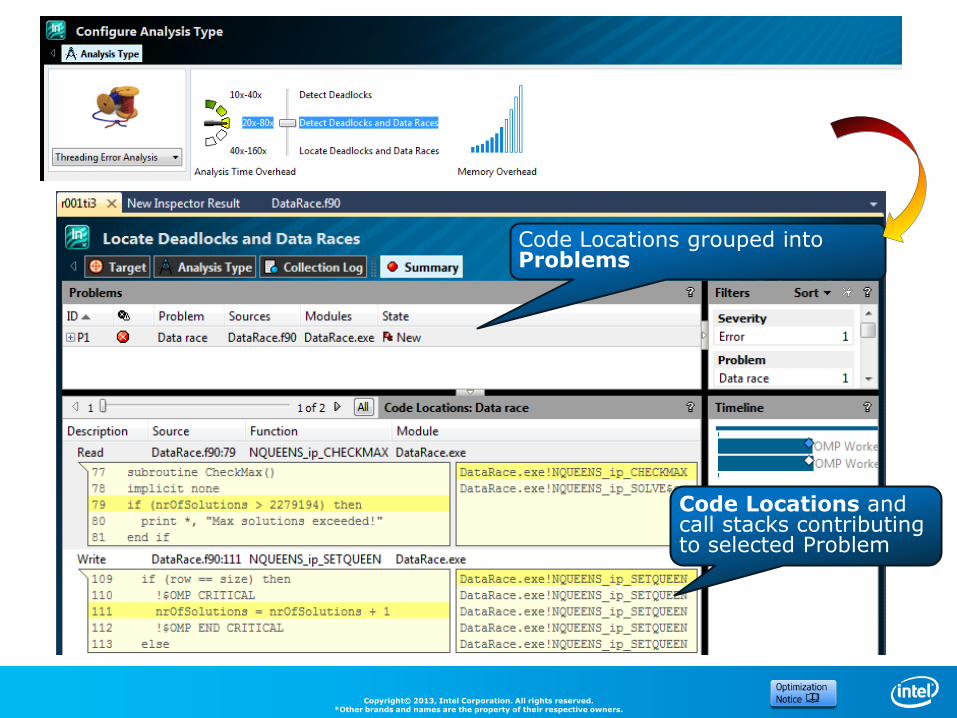
Code Locations grouped into Problems
Code Locations and call stacks contributing to selected Problem
Copyright© 2013, Intel Corporation. All rights reserved. *Other brands and names are the property of their respective owners.
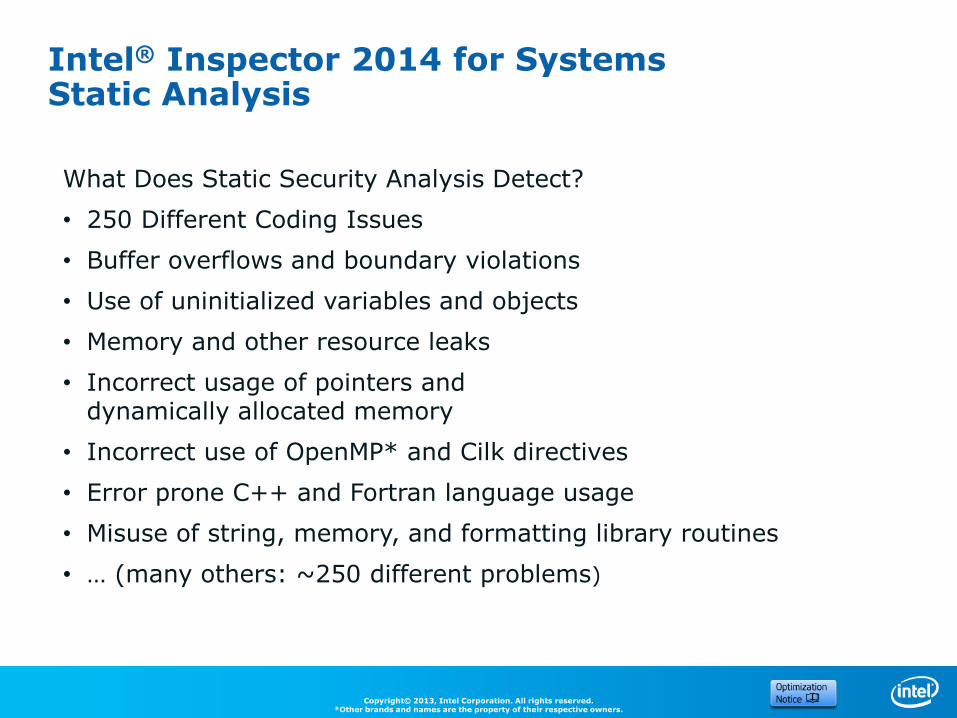
Intel® Inspector 2014 for Systems Static Analysis
What Does Static Security Analysis Detect?
• 250 Different Coding Issues
• Buffer overflows and boundary violations
• Use of uninitialized variables and objects
• Memory and other resource leaks
• Incorrect usage of pointers and dynamically allocated memory
• Incorrect use of OpenMP* and Cilk directives
• Error prone C++ and Fortran language usage
• Misuse of string, memory, and formatting library routines
• … (many others: ~250 different problems)
Copyright© 2013, Intel Corporation. All rights reserved. *Other brands and names are the property of their respective owners.
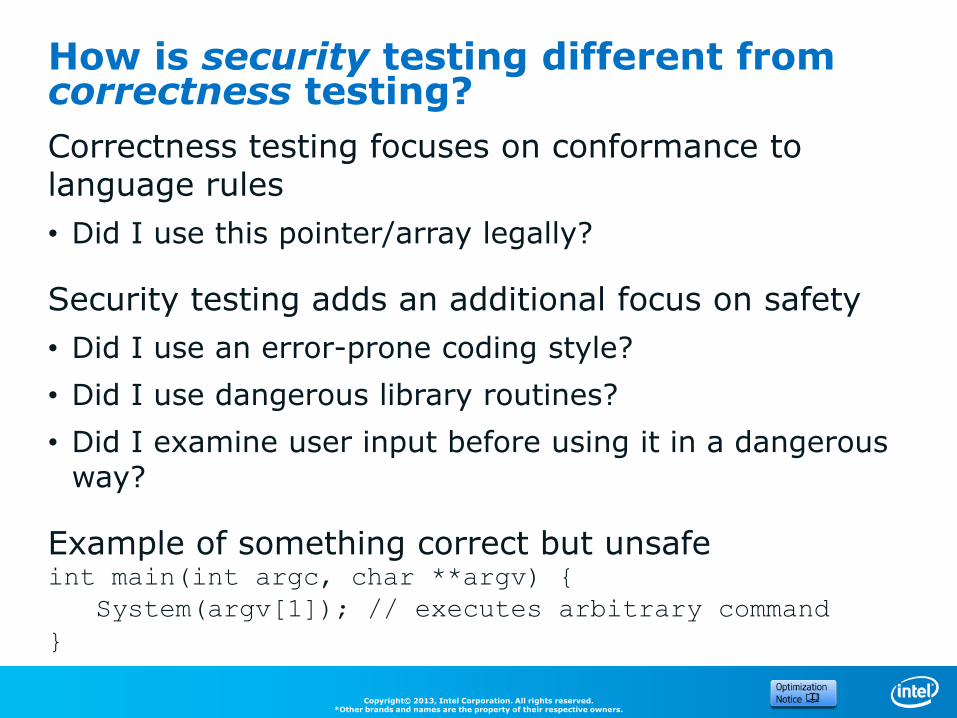
How is security testing different from correctness testing?
Correctness testing focuses on conformance to language rules
• Did I use this pointer/array legally?
Security testing adds an additional focus on safety
• Did I use an error-prone coding style?
• Did I use dangerous library routines?
• Did I examine user input before using it in a dangerous way?
Example of something correct but unsafe int main(int argc, char **argv) {
System(argv[1]); // executes arbitrary command
}
Copyright© 2013, Intel Corporation. All rights reserved. *Other brands and names are the property of their respective owners.
Using Intel® Inspector 2014 for Systems as a regression tester.
One powerful feature of Inspector 2013 is the availability of a fully featured command-line mode.
For example an Inspector memory checking level 2 analysis:
inspxe-cl –collect mi2 application
This command line mode is very useful for implementing regression testing via scripts!
You can write scripts that compare a current run to a baseline run. If the errors are different then the regression test would fail!
21
Copyright© 2013, Intel Corporation. All rights reserved. *Other brands and names are the property of their respective owners.
HOW TO collect data on Yocto Project*
• Building the Yocto Project* images
• Setting up your system with Intel® Inspector 2014 for Systems
• Running a collection
22
Copyright© 2013, Intel Corporation. All rights reserved. *Other brands and names are the property of their respective owners.
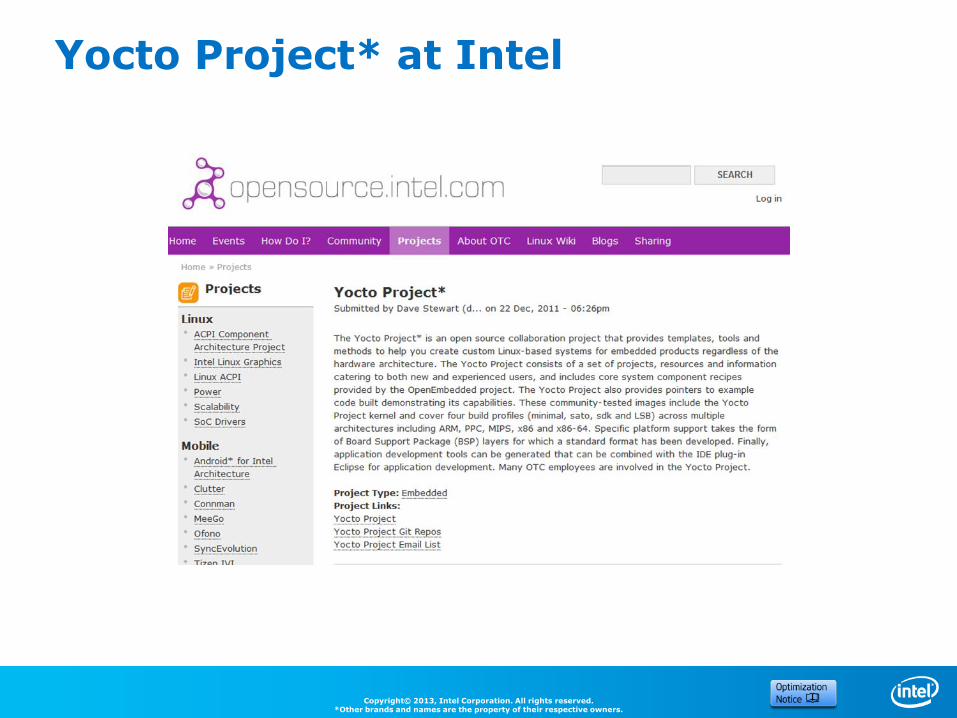
Yocto Project* at Intel
Copyright© 2013, Intel Corporation. All rights reserved. *Other brands and names are the property of their respective owners.
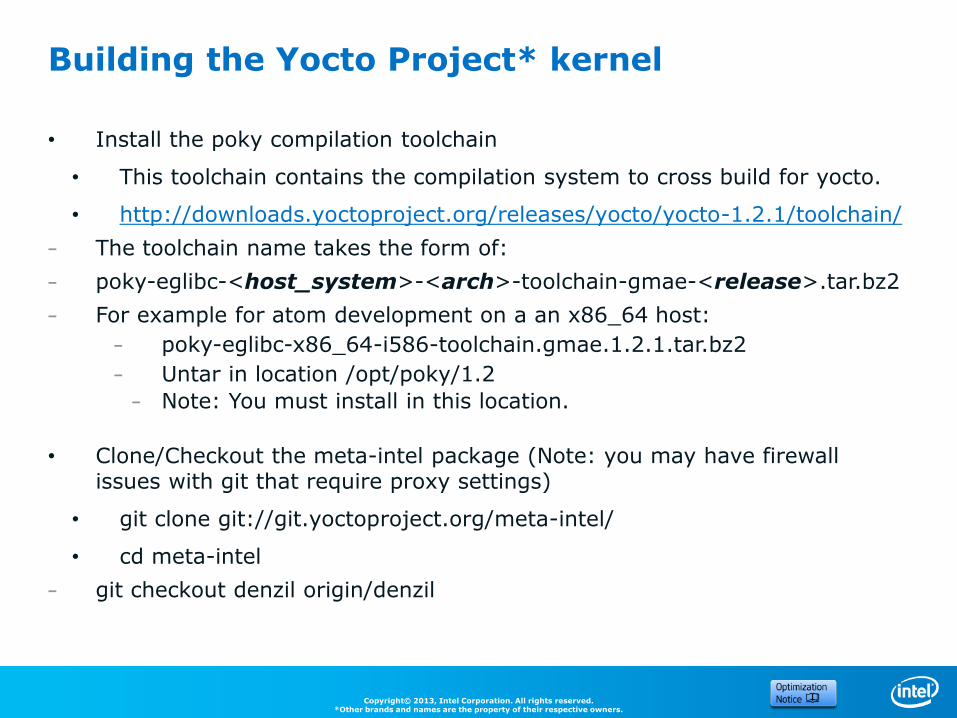
Building the Yocto Project* kernel
• Install the poky compilation toolchain
• This toolchain contains the compilation system to cross build for yocto.
• http://downloads.yoctoproject.org/releases/yocto/yocto-1.2.1/toolchain/
– The toolchain name takes the form of:
– poky-eglibc-<host_system>-<arch>-toolchain-gmae-<release>.tar.bz2
– For example for atom development on a an x86_64 host:
– poky-eglibc-x86_64-i586-toolchain.gmae.1.2.1.tar.bz2
– Untar in location /opt/poky/1.2
– Note: You must install in this location.
• Clone/Checkout the meta-intel package (Note: you may have firewall issues with git that require proxy settings)
• git clone git://git.yoctoproject.org/meta-intel/
• cd meta-intel
– git checkout denzil origin/denzil
Copyright© 2013, Intel Corporation. All rights reserved. *Other brands and names are the property of their respective owners.
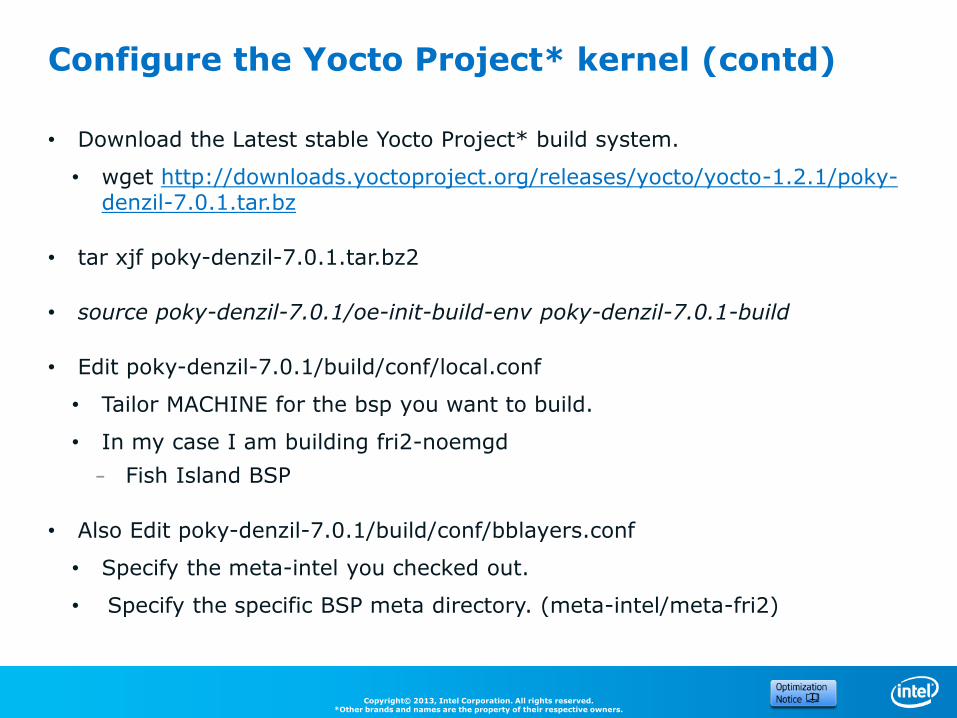
Configure the Yocto Project* kernel (contd)
• Download the Latest stable Yocto Project* build system.
• wget http://downloads.yoctoproject.org/releases/yocto/yocto-1.2.1/poky-denzil-7.0.1.tar.bz
• tar xjf poky-denzil-7.0.1.tar.bz2
• source poky-denzil-7.0.1/oe-init-build-env poky-denzil-7.0.1-build
• Edit poky-denzil-7.0.1/build/conf/local.conf
• Tailor MACHINE for the bsp you want to build.
• In my case I am building fri2-noemgd
– Fish Island BSP
• Also Edit poky-denzil-7.0.1/build/conf/bblayers.conf
• Specify the meta-intel you checked out.
• Specify the specific BSP meta directory. (meta-intel/meta-fri2)
Copyright© 2013, Intel Corporation. All rights reserved. *Other brands and names are the property of their respective owners.
Build the Yocto Project* kernel
• bitbake core-image-sato
• This will produce a full build. (capable of running sep)
• A smaller kernel can be built using:
• bitbake core-image-minimal
No device drivers are required to run an Inspector 2013 for Systems collection.
Copyright© 2013, Intel Corporation. All rights reserved. *Other brands and names are the property of their respective owners.
Setting up your embedded system to run Intel® Inspector 2014 for Systems
You need to manually copy the Inspector release to your embedded target.
From your host:
scp –r /opt/intel/system_studio.0.*.*/inspector_for_systems target_ip:/home/root
Login to your embedded target
ssh root@target_ip
source /home/root/inspector_for_systems/inspxe-vars.sh
27
Copyright© 2013, Intel Corporation. All rights reserved. *Other brands and names are the property of their respective owners.
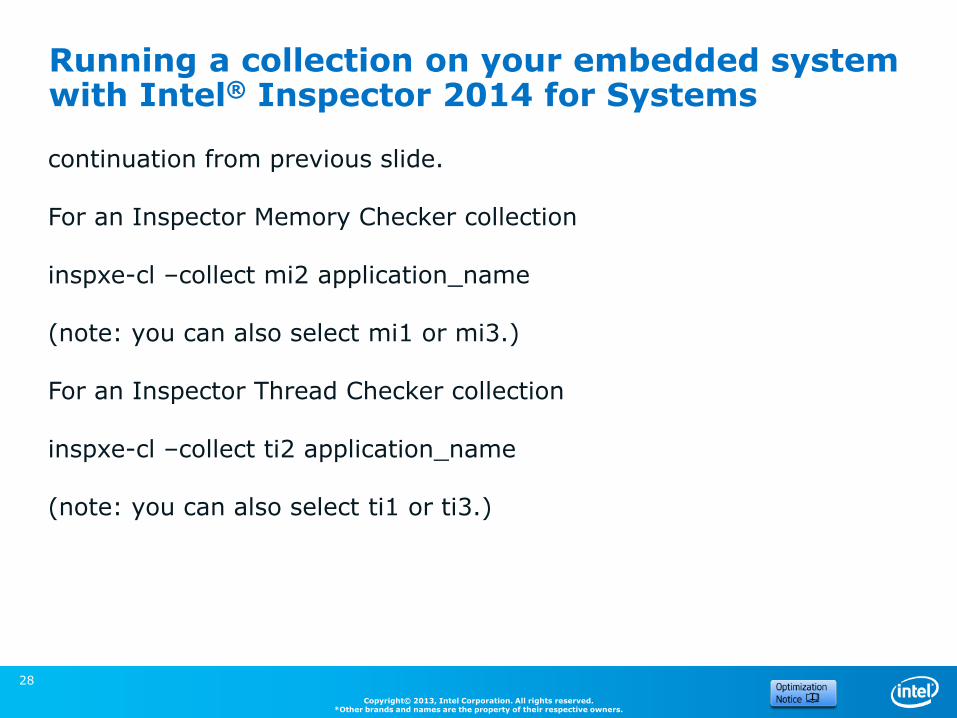
Running a collection on your embedded system with Intel® Inspector 2014 for Systems
continuation from previous slide.
For an Inspector Memory Checker collection
inspxe-cl –collect mi2 application_name
(note: you can also select mi1 or mi3.)
For an Inspector Thread Checker collection
inspxe-cl –collect ti2 application_name
(note: you can also select ti1 or ti3.)
28
Copyright© 2013, Intel Corporation. All rights reserved. *Other brands and names are the property of their respective owners.
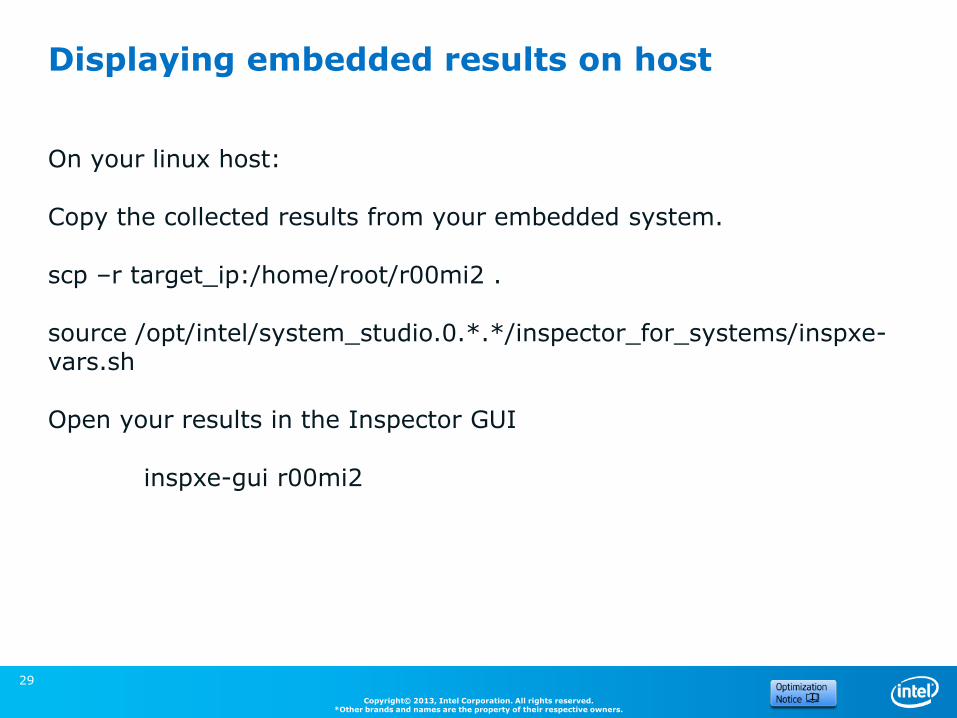
Displaying embedded results on host
On your linux host:
Copy the collected results from your embedded system.
scp –r target_ip:/home/root/r00mi2 .
source /opt/intel/system_studio.0.*.*/inspector_for_systems/inspxe-vars.sh
Open your results in the Inspector GUI
inspxe-gui r00mi2
29
Copyright© 2013, Intel Corporation. All rights reserved. *Other brands and names are the property of their respective owners.
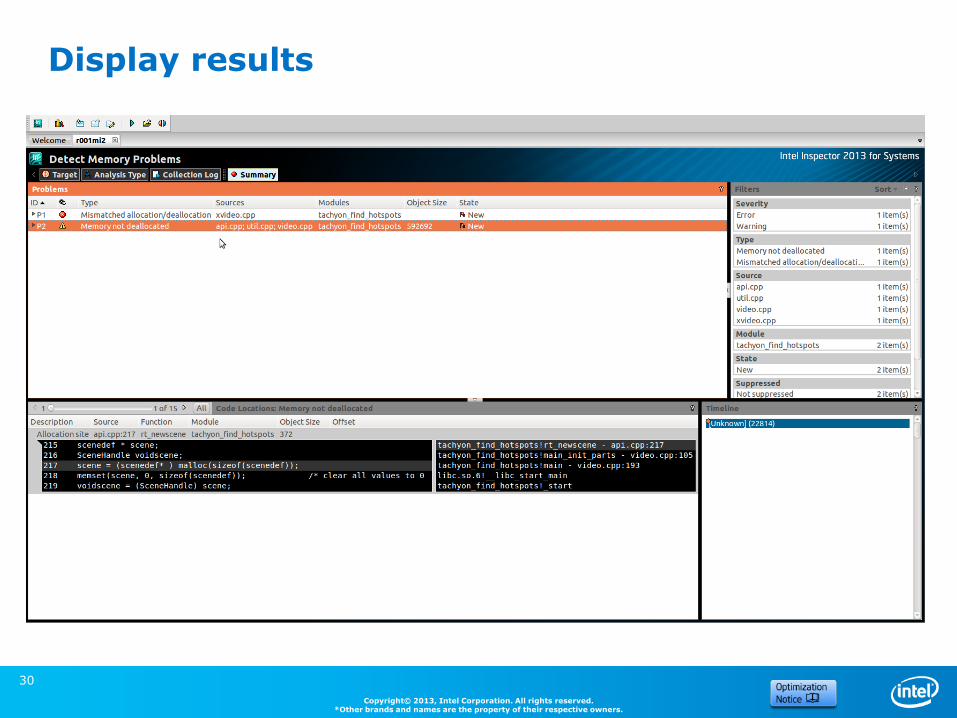
Display results
30
Copyright© 2013, Intel Corporation. All rights reserved. *Other brands and names are the property of their respective owners.
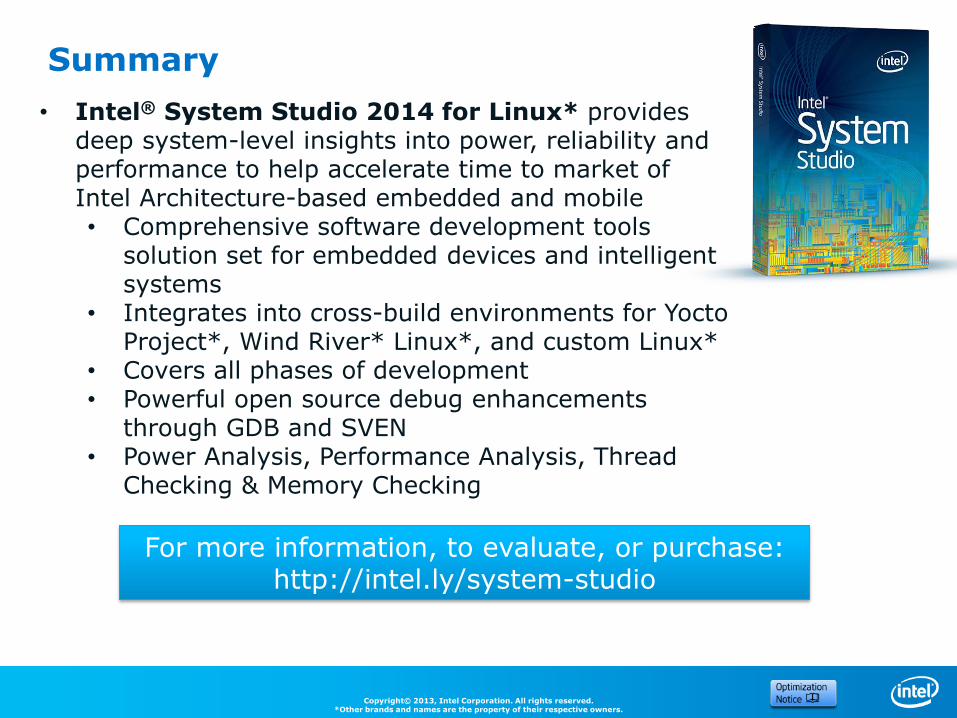
Summary
• Intel® System Studio 2014 for Linux* provides deep system-level insights into power, reliability and performance to help accelerate time to market of Intel Architecture-based embedded and mobile • Comprehensive software development tools
solution set for embedded devices and intelligent systems
• Integrates into cross-build environments for Yocto Project*, Wind River* Linux*, and custom Linux*
• Covers all phases of development • Powerful open source debug enhancements
through GDB and SVEN • Power Analysis, Performance Analysis, Thread
Checking & Memory Checking
For more information, to evaluate, or purchase: http://intel.ly/system-studio
Copyright© 2013, Intel Corporation. All rights reserved. *Other brands and names are the property of their respective owners.
INFORMATION IN THIS DOCUMENT IS PROVIDED “AS IS”. NO LICENSE, EXPRESS OR IMPLIED, BY ESTOPPEL OR OTHERWISE, TO ANY INTELLECTUAL PROPERTY RIGHTS IS GRANTED BY THIS DOCUMENT. INTEL ASSUMES NO LIABILITY WHATSOEVER AND INTEL DISCLAIMS ANY EXPRESS OR IMPLIED WARRANTY, RELATING TO THIS INFORMATION INCLUDING LIABILITY OR WARRANTIES RELATING TO FITNESS FOR A PARTICULAR PURPOSE, MERCHANTABILITY, OR INFRINGEMENT OF ANY PATENT, COPYRIGHT OR OTHER INTELLECTUAL PROPERTY RIGHT. Software and workloads used in performance tests may have been optimized for performance only on Intel microprocessors. Performance tests, such as SYSmark and MobileMark, are measured using specific computer systems, components, software, operations and functions. Any change to any of those factors may cause the results to vary. You should consult other information and performance tests to assist you in fully evaluating your contemplated purchases, including the performance of that product when combined with other products. Copyright © , Intel Corporation. All rights reserved. Intel, the Intel logo, Atom, Core, Xeon, Cilk and VTune are trademarks of Intel Corporation in the U.S. and other countries.
Optimization Notice
Intel’s compilers may or may not optimize to the same degree for non-Intel microprocessors for optimizations that are not unique to Intel microprocessors. These optimizations include SSE2, SSE3, and SSSE3 instruction sets and other optimizations. Intel does not guarantee the availability, functionality, or effectiveness of any optimization on microprocessors not manufactured by Intel. Microprocessor-dependent optimizations in this product are intended for use with Intel microprocessors. Certain optimizations not specific to Intel microarchitecture are reserved for Intel microprocessors. Please refer to the applicable product User and Reference Guides for more information regarding the specific instruction sets covered by this notice.
Notice revision #20110804
Legal Disclaimer & Optimization Notice
Copyright© 2012, Intel Corporation. All rights reserved. *Other brands and names are the property of their respective owners.
32